1. Introduction
Recently there has been considerable interest in redox flow batteries (RFBs) for the storage of electrical energy, particularly in conjunction with renewable energy sources. A key advantage of RFBs is given by the capability of an independent scaling of power output and energy storage capacity. The system could be designed flexibly and storage capacity can simply be increased by electrolyte tank volume, which reduces the incremental cost for additional storage capacity compared to other types of batteries [
1].
A multitude of chemistries such as vanadium/bromine, zinc/bromine, all-vanadium, bromine/polysulfide etc. has been proposed within the last two decades [
2]. The most widely used chemistry in a commercial system, the all-vanadium redox flow battery, is based on the four oxidation states of vanadium (V
2+, V
3+, V
4+, and V
5+) [
3]. Since species from the same element are used in both half-cells, the capacity loss caused by crossover can conveniently be restored by simple rebalancing of the electrolyte.
Numerous studies of vanadium redox flow batteries (VRFBs) have been dedicated to electrode modification [
4,
5,
6,
7,
8], higher stability of electrolyte [
9,
10,
11,
12], membrane [
13,
14] and cell architecture [
15,
16,
17] to improve the overall cell performance. Usually, ex-situ characterization is validated with overall cell performance. This black box approach, however, is unable to provide any deeper understanding of the local changes within the cell. By contrast, localized real-time measurements using segmented cells might shed more light on the different mechanisms limiting the cell performance. Resistance, current and voltage can be monitored independently in each segment. This approach has been extensively used in PEM fuel cells [
18,
19,
20,
21] to measure the current distribution. The most frequently used techniques can be classified into three types: resistor network, Hall effect sensors and printed circuit board (PCB) types. These techniques require the segmentation of either a current collector (CC), bipolar plate (BP) or both. In the resistor network approach, the shunt resistor is connected in series with each segment and the current density is obtained from the voltage drop across the respective shunt resistor [
22]. The PCB technique employs thin, flat circuit board CCs that are placed between the flow field and the end plate. This cell architecture ensures a low contact resistance between PCB and the current collector. The Hall effect sensor technique involves the connection of one Hall sensor to each segment. The magnetic flux density passing through each sensor governs the voltage of the sensor, which is proportional to the current [
23].
There are only few studies dedicated to the application of segmented cells in RFBs [
24,
25,
26]. Hsieh et al. [
24] investigated two different cell designs (A and B) of the segmented flow cell with an active area of 100 cm
2. The cell was divided into 25 segments and a shunt resistor was used to measure the local current or voltage of each segment. In the first design (A), only the current collector was segmented without the segmentation of graphite plate (5 mm thick), whereas in their second design (B), connecting cables were directly embedded into the segmented graphite collector (10 mm thick). For type (A), non-uniform compression and contact resistance variation between the segments produced noticeable effects on the distribution of the current. Similarly, due to higher contact resistance and use of bipolar plate, the application of design (B) resulted in low discharge capacity, voltage efficiency and poor distribution. Clement et al. [
25] implemented a printed circuit board technique and segmented a 9 cm
2 cell into 36 segments. The cell used bipolar plates with serpentine flow field and multiple layer of thin electrodes. Their finding suggests that the current distribution reflects the electrolyte concentration gradient across the active cell area. Their study, however, was performed using thin carbon paper electrodes and a different cell architecture than in conventional flow batteries.
One of the important differences between the fuel cell type cells and a conventional VRFB is the direction of convection of the reactants. In the fuel cell type designs, forced convection in through-plane direction dominates, whereas in conventional VRFBs convective transport preferably takes place in the in-plane direction. To our knowledge, segmented cell studies using the conventional design of VRFBs (flat plate and porous carbon felt electrode) have only been reported by Hsieh et al. [
24] and by our group [
26,
27].
In our previous work [
26,
27], we proposed the use of local mapping of open circuit voltage (OCV) and state-of-charge (SOC) to investigate the flow pattern. The use of OCV contours instead of voltage contours under load allowed for a precise prediction of the flow streamlines through the porous electrode. Moreover, different levels of segmentation of subcomponents (porous electrodes and bipolar plates/current collectors) have been investigated [
26]. Our result showed that the degree of spatial resolution increases with the number of components being segmented. In this study, we extended our approach to study the flow distribution within VRFB cells using differently modified electrodes, flow rates, current densities and variable flow directions. A rationale based on the differences between experimental and theoretical changes in SOC during a single pass is presented.
2. Materials and Methods
The bipolar plate on the negative half-cell was divided into the sixteen segments. The arrangement of sixteen segments with electrolyte flow direction is shown in
Figure 1. The total active area of the cell was 100 cm
2.
The further detail on the design of the segmented cell and test setup is explained in our earlier work [
27]. The electrolyte volume was 200 mL in each tank with 0.8 M V
+3.5 in total 4 M sulfate. The low concentration of vanadium of 0.8 M was chosen deliberately in order to operate in the mass transport dominant regime that was already at relatively high stoichiometry. The compression of the electrode was maintained at 25% (equivalent to 75% of the original thickness) and a uniform compression during the assembly was ensured using torque wrench.
A battery tester (NEWARE, China, 5 V, 3 A) with integrated load and power supply, consisting of 16 terminals, was used for charging and discharging of each segment. The BTS software allowed the controlling of all sixteen segments en masse as well as independently. The negative side was segmented and each segment was connected to a separate channel of the battery tester. The positive terminals of the tester were shunted together and connected to a non-segmented positive terminal of the cell. The electrolyte was initially charged to 50% SOC. Thereafter, segments were discharged for a minute, followed by termination at open circuit voltage (OCV). The OCV hold was carried out until all segments were equilibrated. The OCV values, 5 s after the termination of discharge, were plotted into contour diagrams to study the flow distribution. The cell was again charged back to 50% SOC (i.e., OCV = 1.41 V) before any subsequent tests. The corresponding SOC for each OCV value was calculated using the following relationships (Equations (1)–(5)). Applying the Nernst equation for the overall cell reaction, we obtain for the reversible cell potential (open circuit potential, EOCV)
where, E
0 represents the standard cell potential, R is the universal gas constant (R = 8.314 J mol
−1 K
−1), T represents the temperature in Kelvin, F is the Faraday constant (F = 9.648 × 10⁴ C mol
−1) and a is the chemical activity for the relevant species.
Given the relationships between SOC and the stoichiometry of the cell reactions
For the sulfuric acid concentrations of several moles per liter, which are typical of flow battery electrolytes, the proton concentration due to dissociation can be approximated by the sulfuric acid concentration
. Considering the formation of a stoichiometric quantity of protons (n = 2) during charge (Equation (2)) we obtain
Combining Equations (1)–(4) yields a general expression for the open circuit voltage of the VRFB cell (E
OCV) at a given temperature T
with
and
being the concentrations of vanadium and sulfuric acid in the VRFB electrolyte and E
0 the standard electrochemical potential of the cell reaction. This relationship has been verified by potentiometric titrations of electrolyte samples.
3. Results and Discussions
Figure 2a shows an OCV profile of sixteen segments against time after the termination of discharge at the current density of 80 mA cm
−2. A wide separation of OCV is obtained due to the segmentation, which equilibrates eventually. The equilibration time was a function of the flow rate and current density.
Earlier work [
25] was performed using very high current densities of 100 mA cm
−2 to 450 mA cm
−2 (i.e., very low stoichiometry) to operate the cell in mass transport limiting conditions and to obtain a distinct separation of voltage and current between inlet and outlet. In a conventional design of flow cells employing a thick porous electrode, the voltage contour is often distorted by a lateral flow of current. Hence, it is difficult to capture any clear pattern even at very high current densities. By investigating OCV contours immediately after termination of discharge (shown in
Figure 2b), a clear voltage separation between inlet and outlet is obtained even at a low current density of 80 mA cm
−2 and high flow rate of 42 mL min
−1. This signifies that voltage separation can be observed even at high stoichiometry. We attribute this to the absence of current flow in OCV. The corresponding SOC was calculated from the OCV (indicated in the contour diagram). The OCV data at 5 s after the termination of discharge provided the best resolution in avoiding noise from the battery tester (temporal resolution of the tester was 1 s). The stoichiometry, comparing the reactants supplied and the reactants required theoretically, was calculated from Faraday’s law:
where Q
app is the applied flow rate, Q
st is the stoichiometric flow rate at specific current density, I is the total current, SOC is the state of charge (0.5),
is the total concentration of the vanadium ions, n is the number of electrons involved in the redox reaction (here n = 1) and F is Faraday’s constant (96,485 As mol
−1).
In order to investigate the utilization of the electrolyte during discharge at high current density, the ΔSOC obtained experimentally (ΔSOC
exp) was compared with the theoretically expected change in SOC (ΔSOC
th) during a single pass of the electrolyte. ΔSOC
th corresponds to for full conversion during a single pass and is calculated using Faraday’s law:
ΔSOC
exp was determined by taking the difference between the electrolyte SOC at inlet to the cell (i.e., SOC of the electrolyte in the tank) and at the outlet segments (i.e., SOC at outlet segments—13, 14, 15 and 16). As shown in
Table 1 the difference ΔSOC
th and ΔSOC
exp reflects different situations with respect to the conversion efficiency.
3.1. Effect of Electrode Modification
The porous electrodes used in VRFB are generally subjected to thermal or chemical pretreatment to improve the kinetics and wettability. We compared as-received, thermally modified (600 °C for 5 h in air) and chemically treated electrodes (immersion for 8 h in mixed acid H
2SO
4:HNO
3 ratio 3:1) electrodes to observe the difference in flow distribution and electrode utilization. The OCV contours and corresponding SOC are depicted in
Figure 3.
A nearly flat band-type distribution of the OCV along the cross-section of the electrode is observed for the modified electrodes (
Figure 3b,c). The distribution of the OCV/SOC contour, however, is random for the pristine electrode, as shown in
Figure 3a. This is expected as wetting of the pristine electrode is poor and non-uniform and, hence, results in poor kinetics. The modified electrodes exhibit increased performance in comparison to pristine electrodes [
2,
3,
4,
28]. Their better wettability produces a uniform electrolyte distribution. Ideally, flat band-type voltage distribution along the cross-section is expected for a highly homogeneous flow distribution. The small variations in voltage along the cross-section might be caused by minor variations in electrode compression in the large active cell area, non-uniform activation of the electrode and non-uniformity in felt thickness. Nevertheless, the variation along the cross-section is negligible and it can be concluded that the flow distribution improved substantially with the activation of the felt. Monitoring the OCV at the inlet segments in each contour (
Figure 3), it can be observed that the OCV reached its minimum (of 1.306 V) after terminating the discharge in the case of pristine electrode. This again reflects the higher Ohmic drop for the cell assembled with the pristine electrode.
Table 2 compares the ΔSOC
th and ΔSOC
exp.
The minimal deviation between ΔSOC
exp and ΔSOC
th observed for the modified electrode indicates that the electrolyte conversion in a single pass occurs at nearly optimum rate. This is obviously due to improved wettability, better kinetics and the larger active surface area. For pristine electrodes, retarded flow possibly occurred at different locations due to the hydrophobic nature of electrode, which results in higher overpotential. Comparing these results with the three cases described in
Table 1, the behavior of pristine electrode matches with case (ii) (i.e., ΔSOC
exp >> ΔSOC
th), indicating poor utilization of electrolyte. By contrast, pre-treated electrodes showed a type (i) pattern (highest electrolyte utilization).
3.2. Effect of Flow Rate
Limitations of mass transport are mainly dependent on flow rate and current density. Herein, ΔSOC
exp and ΔSOC
th are compared for different flow rates while keeping the current density constant at 80 mA cm
−2.
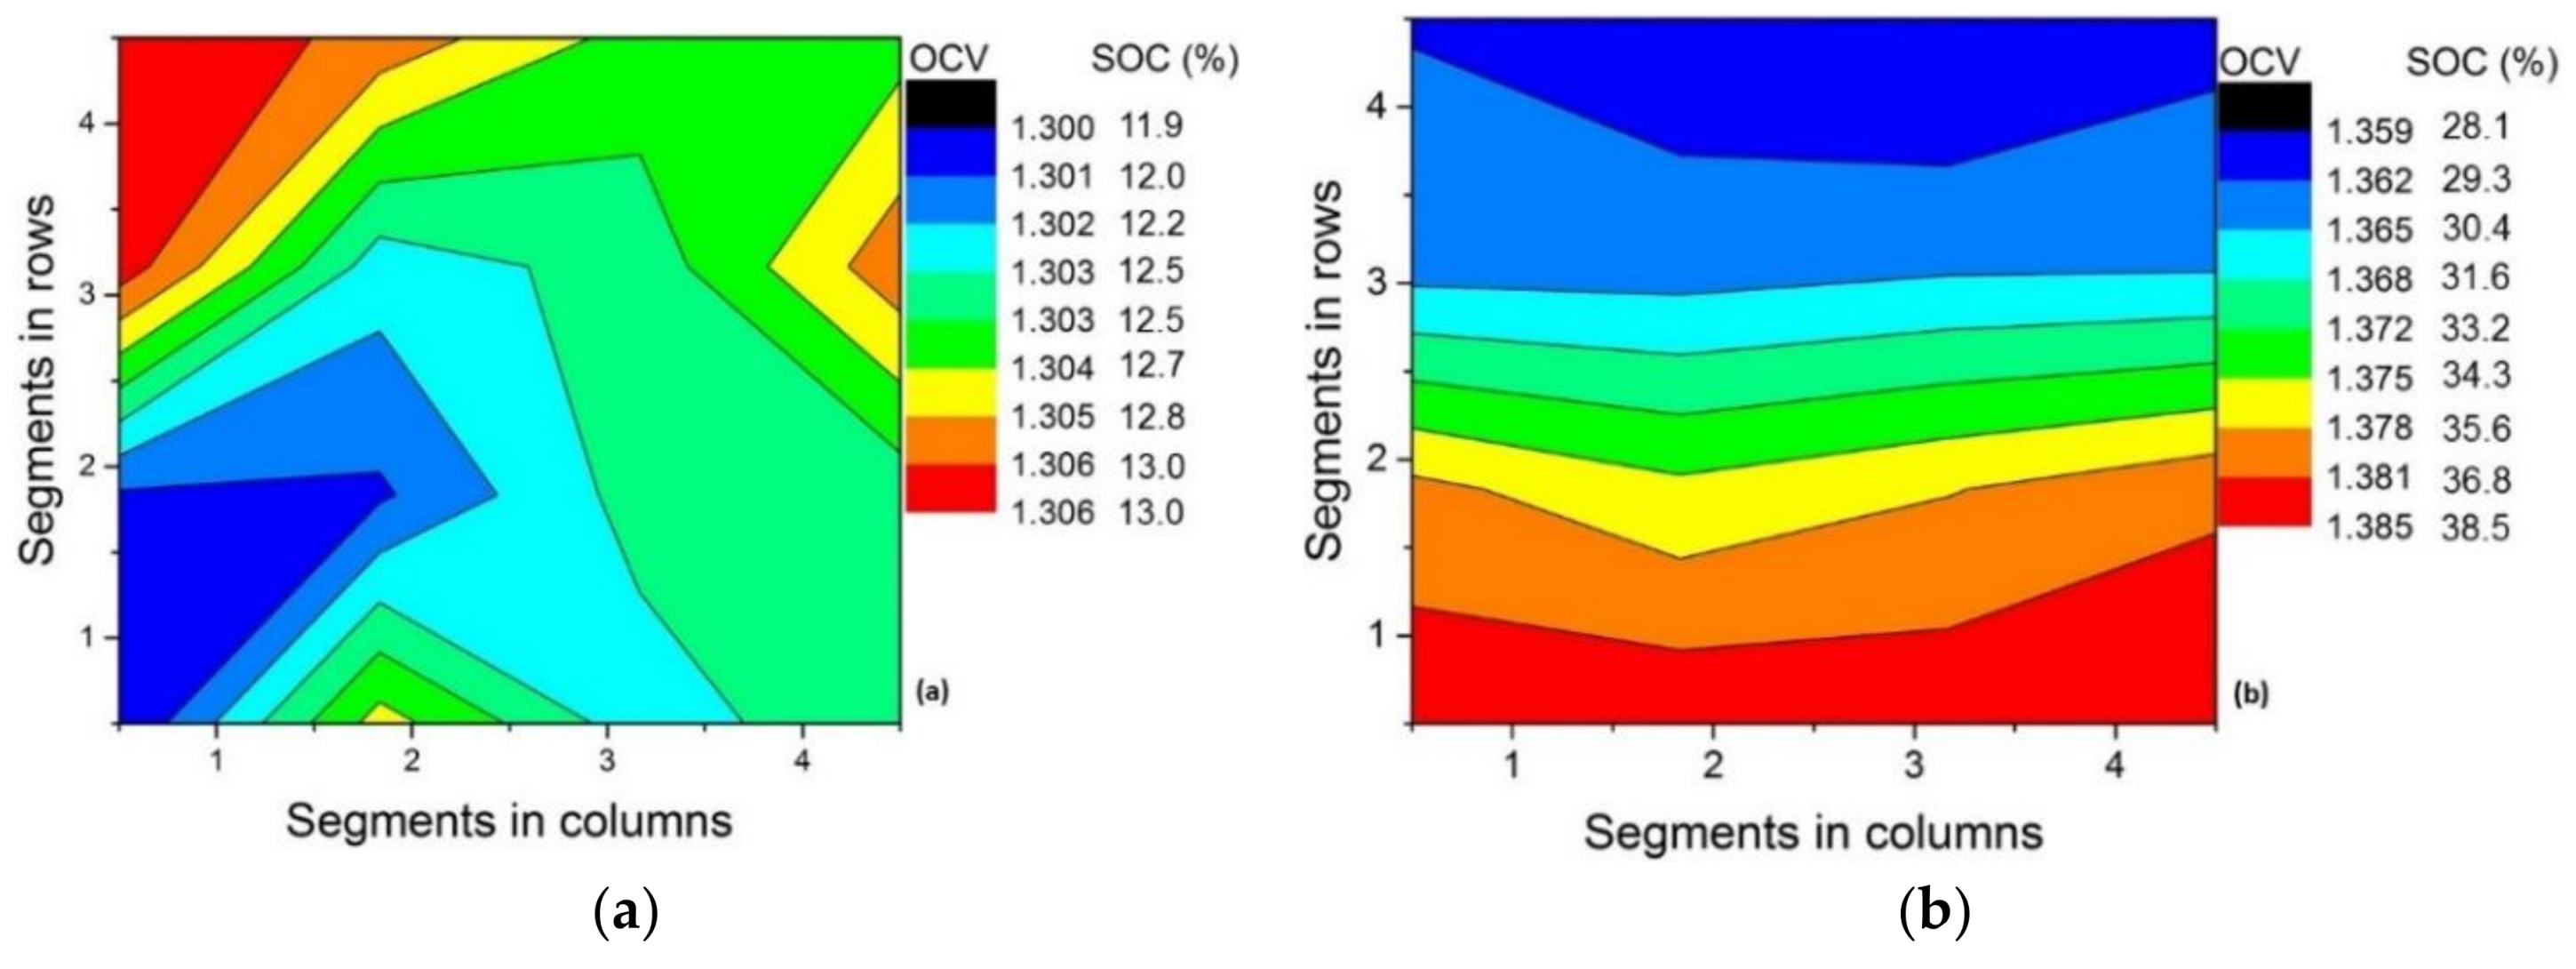
Figure 4 shows the OCV contours at 5 s after the termination of discharge at 80 mA cm
−2. Three flow rates, 16 mL
−1 min
−1 (λ = 1.3), 32 mL min
−1 (λ = 2.6) and 42 mL min
−1 (λ = 3.4) were used. The electrodes were activated thermally in air at 600 °C for 5 h.
The OCV value at the inlet was the minimum for the flow rate 16 mL min
−1 (1.359 V) as compared to higher flow rates (1.379 V @ 32 mL min
−1 and 1.386 V @ 42 mL min
−1) because the supply of charged species was low and thus even the inlet segments suffered from mass transport polarization. The discrepancy in OCV/SOC between the inlet segments and outlet segments increased with a decreasing flow rate, whereas the flow distribution along the cross-section of the electrode remained unaffected. A different picture was observed in terms of utilization.
Table 3 shows the deviation between ΔSOC
exp and ΔSOC
th. At a low flow rate of 16 mL min
−1, the ΔSOC
exp is significantly smaller than the ΔSOC
th. This follows the case (iii) in
Table 1, indicating that there was an insufficient amount of charged species to sustain the applied current.
This is obvious since the stoichiometry was only 1.3, where mass transport is expected to be dominant. The increase in flow rate resulted in a close agreement between the theoretical and experimental ΔSOC, which suggest that the stoichiometry of 2.6 (and above) was sufficient for the size of the cell under study. Excellent utilization was obtained at a flow rate of 32 and 42 mL min−1.
3.3. Effect of Variation in Current Density
Next, we varied the stoichiometry by applying different current densities while keeping the flow rate constant at 16 mL min
−1. The cell was discharged at three current densities of 150 mA cm
−2 (λ = 0.7), 120 mA cm
−2 (λ = 0.85) and 80 mA cm
−2 (λ = 1.3), and respective OCV contours were examined, as shown in
Figure 5. Again, a thermally activated electrode (600 °C for 5 h in air) was used for these tests. The three contour diagrams reveal that there is no major change in flow uniformity when operating at different current densities. A similar observation was also made when the stoichiometry was varied by varying the flow rates (
Section 3.2).
Comparing the OCV values at the inlet in the three contour diagrams in
Figure 5, it is observed that a higher OCV appears at the inlet at high stoichiometry (i.e., at low current density). At a current density of 150 mA cm
−2 (
Figure 5a), the cell suffered from high Ohmic and mass transport losses.
During discharge at 150 and 120 mA cm
−2, the stoichiometry was virtually less than 1. In other words, the charged species in the upstream segments were completely depleted, and therefore the set current could no longer be sustained within these areas. In such a situation, the current drawn from the upstream segments in row 2, 3 and 4 suddenly dropped from the set current before the end of the discharge period (1 min). This is the reason that the ΔSOC
th is nearly twice the ΔSOC
exp (
Table 4).
At 80 mA cm
−2, the ΔSOC
th is still higher than ΔSOC
exp (
Table 4), which signifies that only insufficient quantities of charged species were available for continuous discharge at the set current. These three contours reflect case (iii) given in
Table 1.
3.4. Upward vs. Downward Flow
Figure 6a,b compares the OCV/SOC distribution for normal and reverse flow, respectively. Clearly, the OCV bands appear to be almost completely inverted for both settings. This supports our claim that OCV or SOC contour closely mirrors the flow distribution across the electrode.
As seen from the SOC contours for normal and reverse flow, the conversion efficiency is almost identical. This means that the flow direction does not have a perceptible influence on the electrode utilization. However, in real application, upward flow is preferred to avoid any gas being trapped inside the voids during long charging and discharging cycles.

 ,
, 


