Article

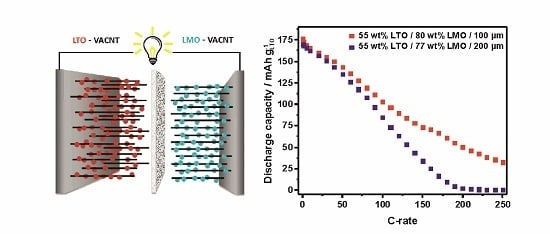
Nanostructured Networks for Energy Storage: Vertically Aligned Carbon Nanotubes (VACNT) as Current Collectors for High-Power Li4Ti5O12(LTO)//LiMn2O4(LMO) Lithium-Ion Batteries

1
Inorganic Chemistry Department, Dresden University of Technology, Bergstrasse 66, 01069 Dresden, Germany
2
Fraunhofer Institute for Material and Beam Technology (IWS), Winterbergstraße 28, 01277 Dresden, Germany
*
Author to whom correspondence should be addressed.
Batteries 2017, 3(4), 37; https://doi.org/10.3390/batteries3040037
Submission received: 24 October 2017 / Revised: 7 November 2017 / Accepted: 9 November 2017 / Published: 15 November 2017

Abstract

:
As a concept for electrode architecture in high power lithium ion batteries, self-supported nanoarrays enable ultra-high power densities as a result of their open pore geometry, which results in short and direct Li+-ion and electron pathways. Vertically aligned carbon nanotubes (VACNT) on metallic current collectors with low interface resistance are used as current collectors for the chemical solution infiltration of electroactive oxides to produce vertically aligned carbon nanotubes decorated with in situ grown LiMn2O4 (LMO) and Li4Ti5O12 (LTO) nanoparticles. The production processes steps (catalyst coating, VACNT chemical vapor deposition (CVD), infiltration, and thermal transformation) are all scalable, continuous, and suitable for niche market production to achieve high oxide loadings up to 70 wt %. Due to their unique transport structure, as-prepared nanoarrays achieve remarkably high power densities up to 2.58 kW kg−1, which is based on the total electrode mass at 80 C for LiMn2O4//Li4Ti5O12 full cells. The tailoring of LTO and LMO nanoparticle size (~20–100 nm) and VACNT length (array height: 60–200 µm) gives insights into the rate-limiting steps at high current for these kinds of nanoarray electrodes at very high C-rates of up to 200 C. The results reveal the critical structural parameters for achieving high power densities in VACNT nanoarray full cells.

Graphical Abstract

1. Introduction

The development of lithium ion batteries (LIB) that enable fast charging combined with high safety and a long cycle life is crucial for their applications in the fields of mobile electronic devices and hybrid electric vehicles [1,2]. However, today’s conventional LIBs still suffer from rather slow charging/discharging performance using conventional electrode materials such as, for instance, graphite as a typical anode material [3]. Therefore, in recent years, huge efforts were made to increase the rate capabilities of LIB by introducing new electroactive material classes e.g., spinel-structured materials such as Li4Ti5O12 (LTO) and LiMn2O4 (LMO) in a wide range of accessible nanostructures such as nanoparticles [4,5,6], nanotubes [7,8,9], nanowires [10,11], nanosheets [12,13,14], mesoporous materials [15,16,17] and many more. Although increasing rate capabilities were successfully achieved, it is well known that the electrochemical properties of the electrode materials do not play the only key role, the electrode and current collector interface architecture [18,19] are key as well. State of the art LIB electrodes are produced by mixing electrochemical active powders with polymer binders and conductive agents such as carbon black [20,21], carbon nanotubes [22,23], or graphene [24,25]. The resulting slurries are coated onto Cu/Al current collectors as a ~100 µm thick film. Electrodes produced in this way usually suffer from large internal electrical resistances resulting from the grain boundaries between electroactive material, conductive agent, and binder. Moreover, long ion diffusion pathways, limited electron transport through a percolating network of the electron-conducting additive, and a high contact resistance between the current collector and the electrode composite introduce additional undesirable interfaces, and thus increase charge transfer resistances. Recently, the concept of self-supported nanoarray electrodes came up as a new approach for high rate capability LIBs [26,27,28,29,30,31,32,33,34,35,36]. Binder-free nanoarray electrodes are directly grown on the current collector, which creates several benefits for the electron and Li+-ion transport within the electrode. The close electrical contact created between the electrode material and the current collector reduces charge transfer resistances. Moreover, the vertical alignment induces direct pathways for electron transport, which heavily reduce the amount of phase boundaries, and therefore allows very fast electron transport. In addition, such arrays exhibit a large specific surface area and an open pore geometry, making the electroactive material easily and directly accessible for Li+-ions, and ensuring fast Li+-ion diffusion, as well as high active material utilization. Nevertheless, most reported metal oxide nanoarrays, such as for LTO and LMO, do not consider the integration into electron conductive host architectures, and thus have insufficient electrical conductivity to achieve high power densities. Furthermore, complex syntheses are often needed, which are not scalable and can only either be used for the preparation of the anode or the cathode material. Thus, to the best of our knowledge, no full cell 1D nanoarray LIB has been reported so far.
As illustrated in Figure 1, we have reported an alternative approach in an earlier publication the preparation of vertically aligned carbon nanotubes (VACNT) on metal foil decorated with in-situ grown LTO nanoparticles via spray deposition of precursor solutions [37]. It was shown that our approach offered the above-mentioned benefits of nanoarray electrodes, as well as highly conductive carbon nanotubes (CNT) and short Li+-ion electron pathways inside LTO nanoparticles, resulting in particularly high charging/discharging rates. However, essential questions concerning the rate-limiting steps at high currents, and the potential of full cells completely based on 1D nanoarrays, remained unanswered. Therefore, we hereby report on the preparation of in situ grown LMO nanoparticles on VACNT, making it possible to prepare both anode and cathode materials as 1D nanorrays with the same carbon host material. We are thereby able to show the high versatility of our approach regarding the deposited electroactive materials. Even of higher importance is the possibility of studying the concept of VACNT-based high power electrodes for the first time in full cells.

2. Experimental Section

All chemicals and materials were of analytical grade, and used directly without any further purification.

2.1. VACNT Synthesis

VACNT on nickel foil (Alfa Aesar (Haverhill, MA, USA), 50 µm thick, >99%) were synthesized by chemical vapor deposition (CVD), as described in detail in earlier publications [38,39]. A 50 µm-thick nickel foil (Alfa Aesar, >99%) was coated via dip coating, first with a 50 nm-thick buffer layer of Al2O3, and then with a 40 nm-thick layer of an iron–cobalt catalyst (40 mol % Fe, 60 mol % Co). The CVD process resulted in VACNT on the upper side of the substrate with a length of approximately 60, 100, 150, and 200 µm, and a VACNT load of ~0.6, 1.0, 1.5, and 2.0 mg cm−2, respectively.

2.2. Synthesis of the LTO Precursor

In a typical approach, lithium nitrate (66.5 mmol, Alfa Aesar, 99%) was dissolved in a mixture of ethanol (54 mL, Carl Roth (Karlsruhe, Germany), ≥99.8%) and hydrochloric acid (4.2 mL 36 wt % in H2O, Alfa Aesar). Subsequently, titanium butoxide (47.5 mmol, Sigma Aldrich (St. Louis, MO, USA), 97%) was added, and the mixture was stirred, resulting in a slightly yellow, clear solution.

2.3. Synthesis of the LMO Precursor

In a typical approach, lithium nitrate (20.45 mmol, Alfa Aesar, 99%) was dissolved in a mixture of methanol (22 mL, Carl Roth, ≥99.5%) and isopropanol (22 mL, Carl Roth, ≥99%). Subsequently, manganese acetate tetrahydrate (32.64 mmol, Carl Roth, ≥99%) was added, and the mixture was stirred, resulting in a light brownish, clear solution.

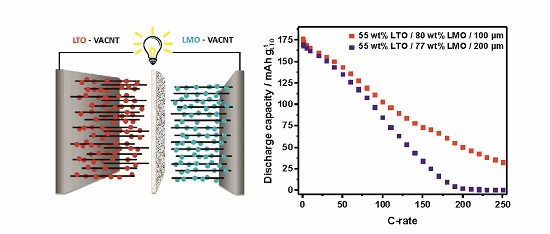
2.4. Preparation of the LTO-/LMO-VACNT Composite

The VACNT electrodes were infiltrated with the LTO/LMO precursor by room temperature spray deposition (flow rate: 2.5 mL min−1) without any pretreatment of the VACNT. The active material load was thereby adjusted via the quantity of spray cycles, with approximately 1.0 mg cm−2 per cycle. The samples infiltrated with LTO precursor were subsequently placed in an argon-purged quartz glass tube furnace (diameter = 42 mm) and heated with 40 K min−1 to 800 °C in argon. The samples were kept at 800 °C for 2 h while an argon flux of 1 L min−1 was applied. After cooling to 150 °C in argon, the samples were removed from the furnace. The samples infiltrated with LMO precursor were placed in a muffle furnace and heated with 10 K min−1 to 225 °C in air for 2 h to 12 h. The samples were removed from the furnace without any cooling. The as-synthesized composites were transferred for electrochemical testing from the nickel substrate onto a 15 µm-thick primer coated aluminum foil (MTI Corporation (Richmond, CA, USA), 99.3%, 3.68 mg cm−2) by the use of a hot press (LaboPress P 200 T manufactured by Vogt Maschinenbau GmbH, Germany). The hot press molding was performed at 80 °C for 10 min, and then cooled to room temperature [40,41].

2.5. Material Characterization

X-ray diffraction (XRD) analysis was recorded on a X'Pert Pro (PANalytical, Almelo, The Netherlands) with Cu-Kα-Radiation. The morphologies of the samples were investigated using field emission scanning electron microscopy (SEM, SU8020 by Hitachi High-Technologies (Krefeld, Germany)). High resolution transmission electron microscopy (HRTEM) analyses were performed using a JEM-2100 by JEOL (Freising, Germany). Thermogravimetric analysis was recorded on a STA 409 by Netzsch (Selb, Germany) with a heating rate of 1 K min−1.

2.6. Electrochemical Characterization

For electrochemical studies, coin cells were assembled without any binders or additional conductive agents as half-cells, and as LTO//LMO full cells in a glovebox filled with argon (MBraun; O2 < 0.1 ppm; H2O < 0.1 ppm). In half-cells, the LTO– or LMO–VACNT composite electrodes served as the cathode, and a 250 µm-thick lithium chip (PI-KEM; 99%; d = 15.6 mm) served as the anode. The electrodes were separated by a 25 µm-thick polypropylene foil (Celgard 2500). LTO–VACNT half-cells were soaked with 40 µL LP 30 (LP 30 SelectiLyteTM, 1.0 M LiPF6 in EC/DMC = 50/50 (v/v); Merck) as electrolyte, whereas LMO–VACNT half-cells, as well as the full cells, were soaked with 40 µL 1.0 M LiPF6 in EC/DEC = 30/70 (v/v) (3/7) (BASF). Additionally, a stainless steel spacer (1000 µm thick) was used to ensure a good electrical contact of the cell components. Cyclic voltammetry (CV) was carried out with an IVIUM-N-STAT multi-channel analyzer (Ivium Technologies, Eindhoven, Netherlands) using a potential range of 3.0–4.5 V and a sweep rate of 0.1 mV s−1. Galvanostatic charge/discharge tests were carried out at different charge/discharge rates (1 C up to 250 C, each rate five cycles) using a BaSyTec Cell Test System (BaSyTec GmbH, Asselfingen, Germany). The specific capacities are calculated based on the total LTO or LMO mass. Power and energy densities are calculated based on the total electrode mass, including half the mass of primer-coated aluminum current collectors per electrode. For reasons of clarity, the specific capacities, as well as the areal power and energy densities, are shown as average values from five cycles at a constant C-rate.

3. Results and Discussion

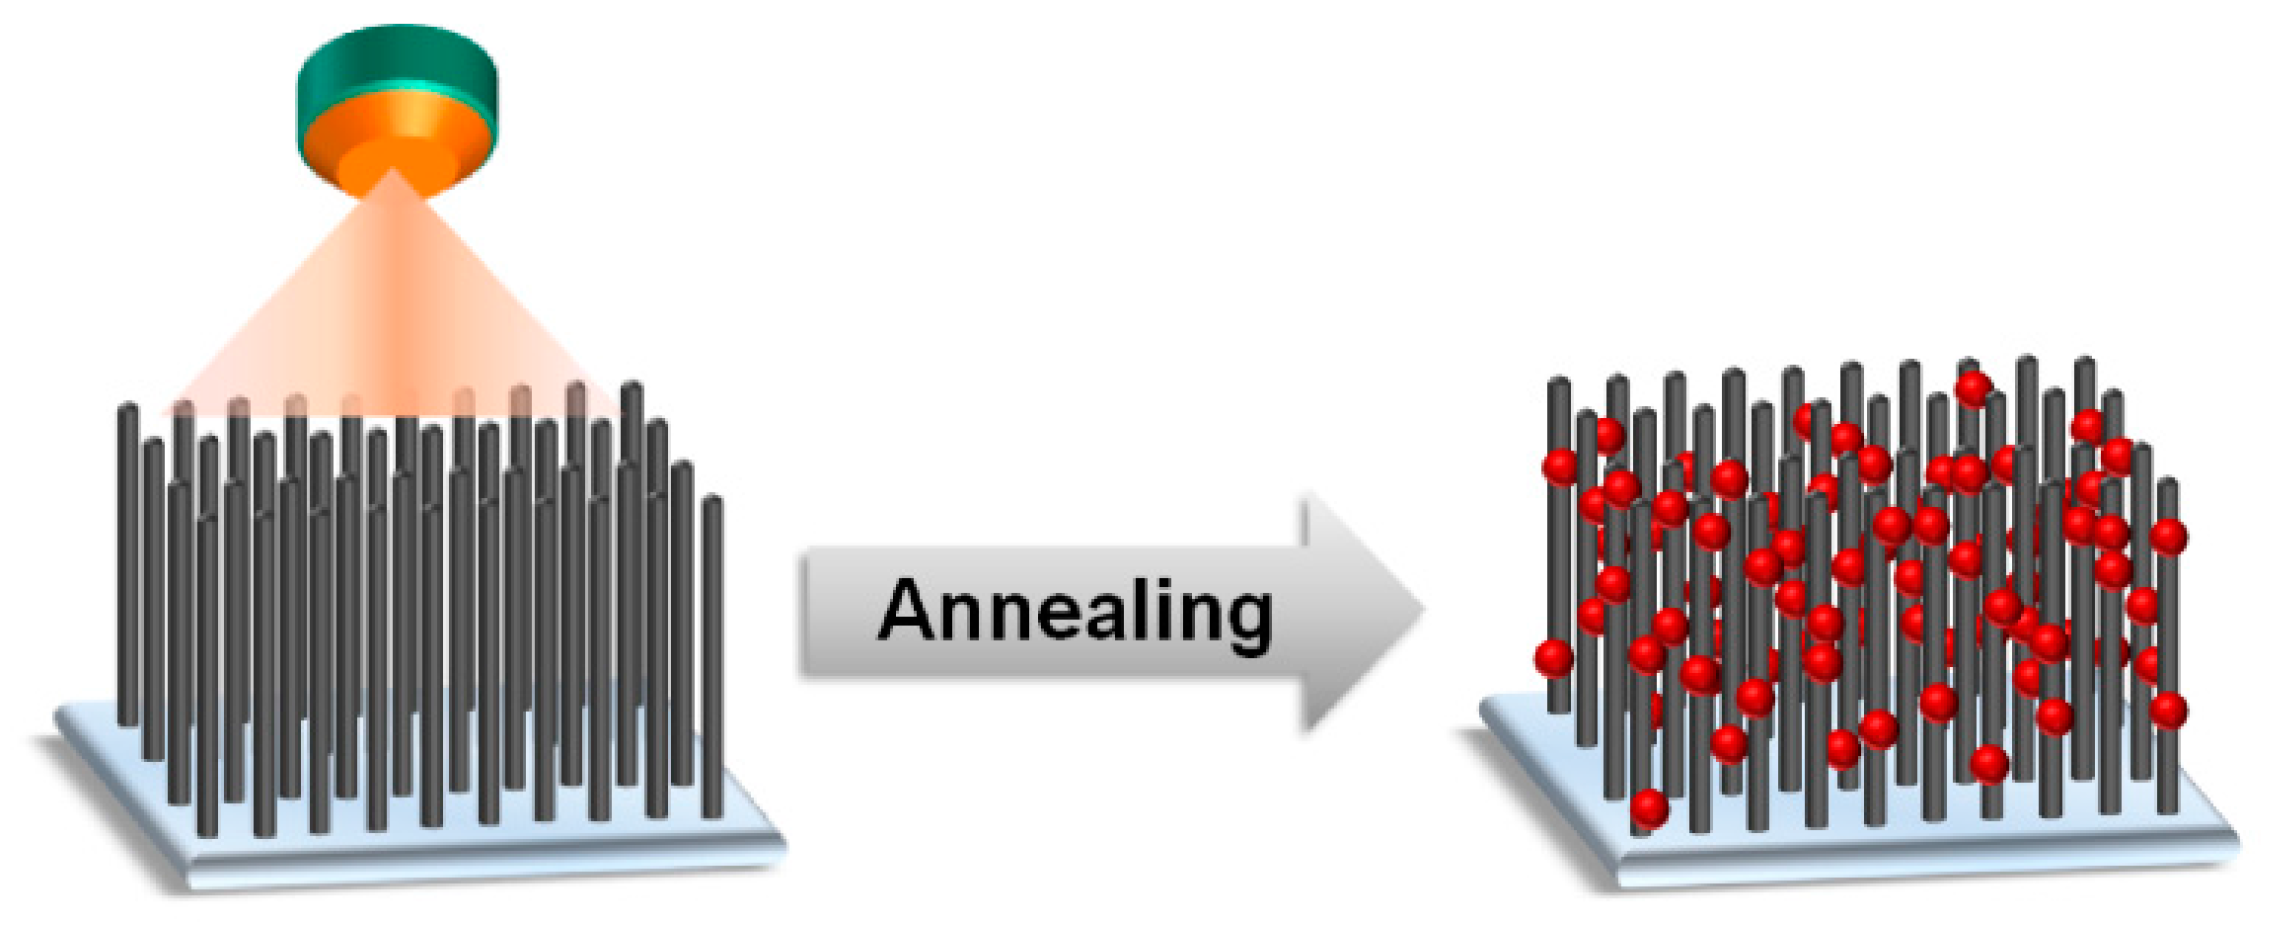
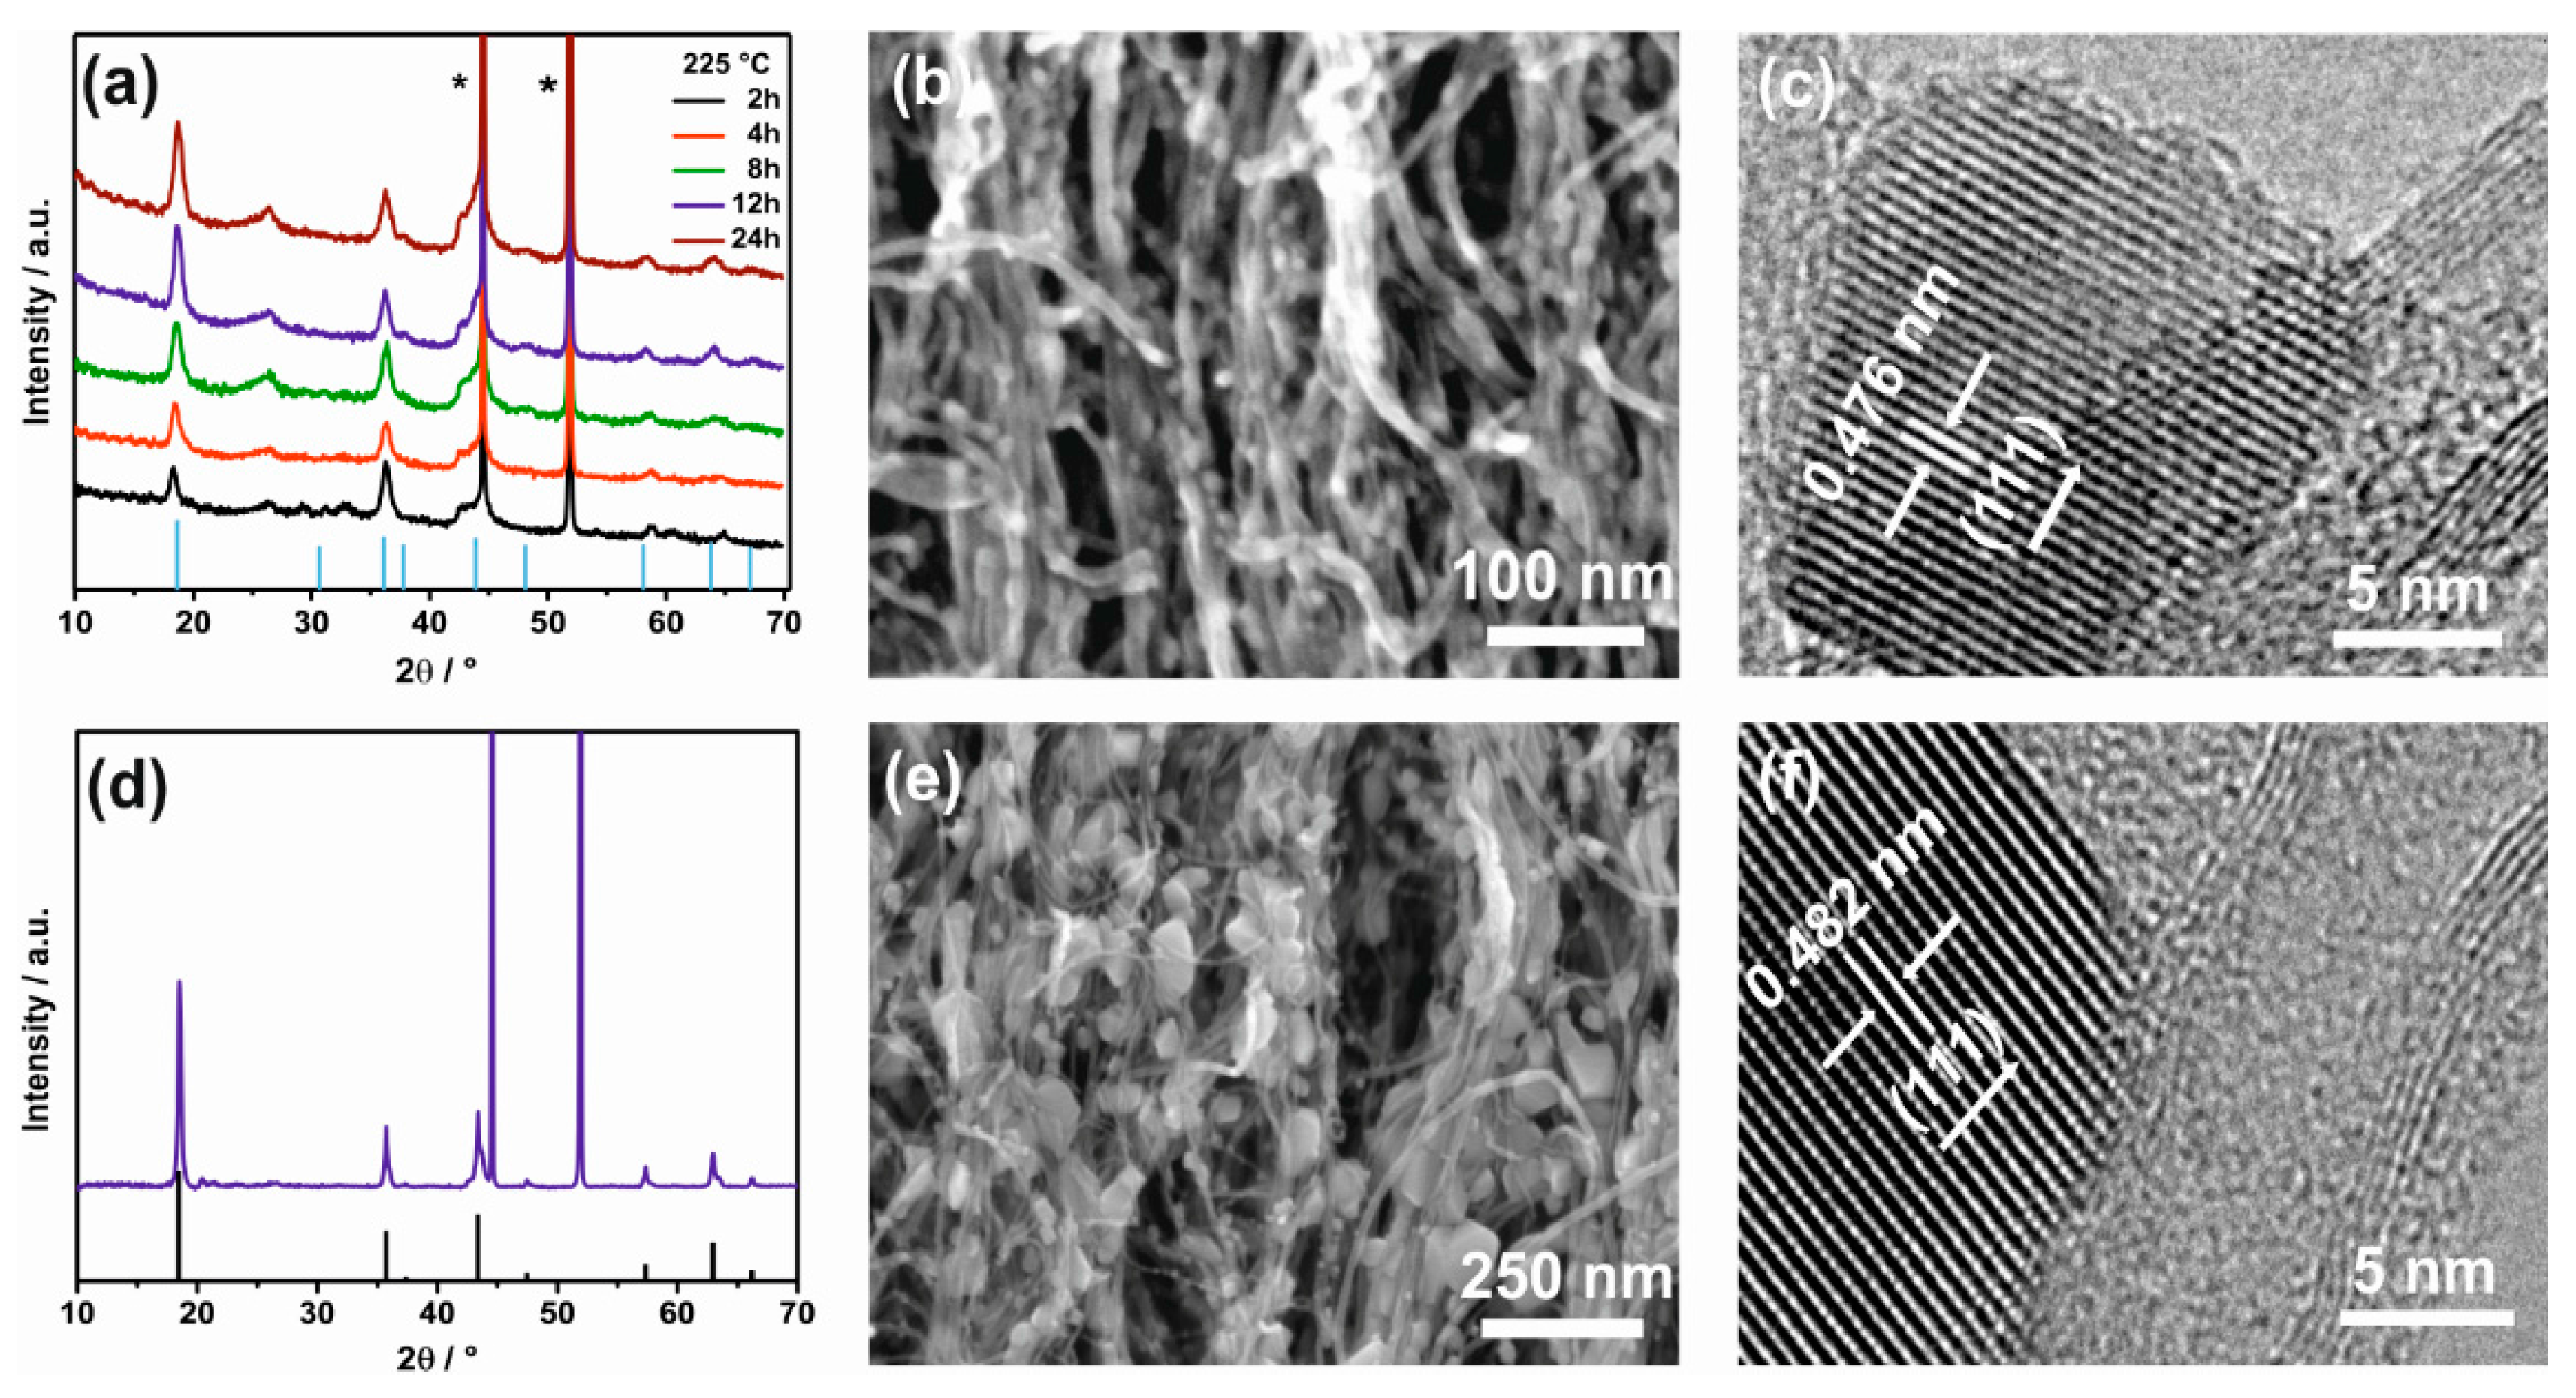
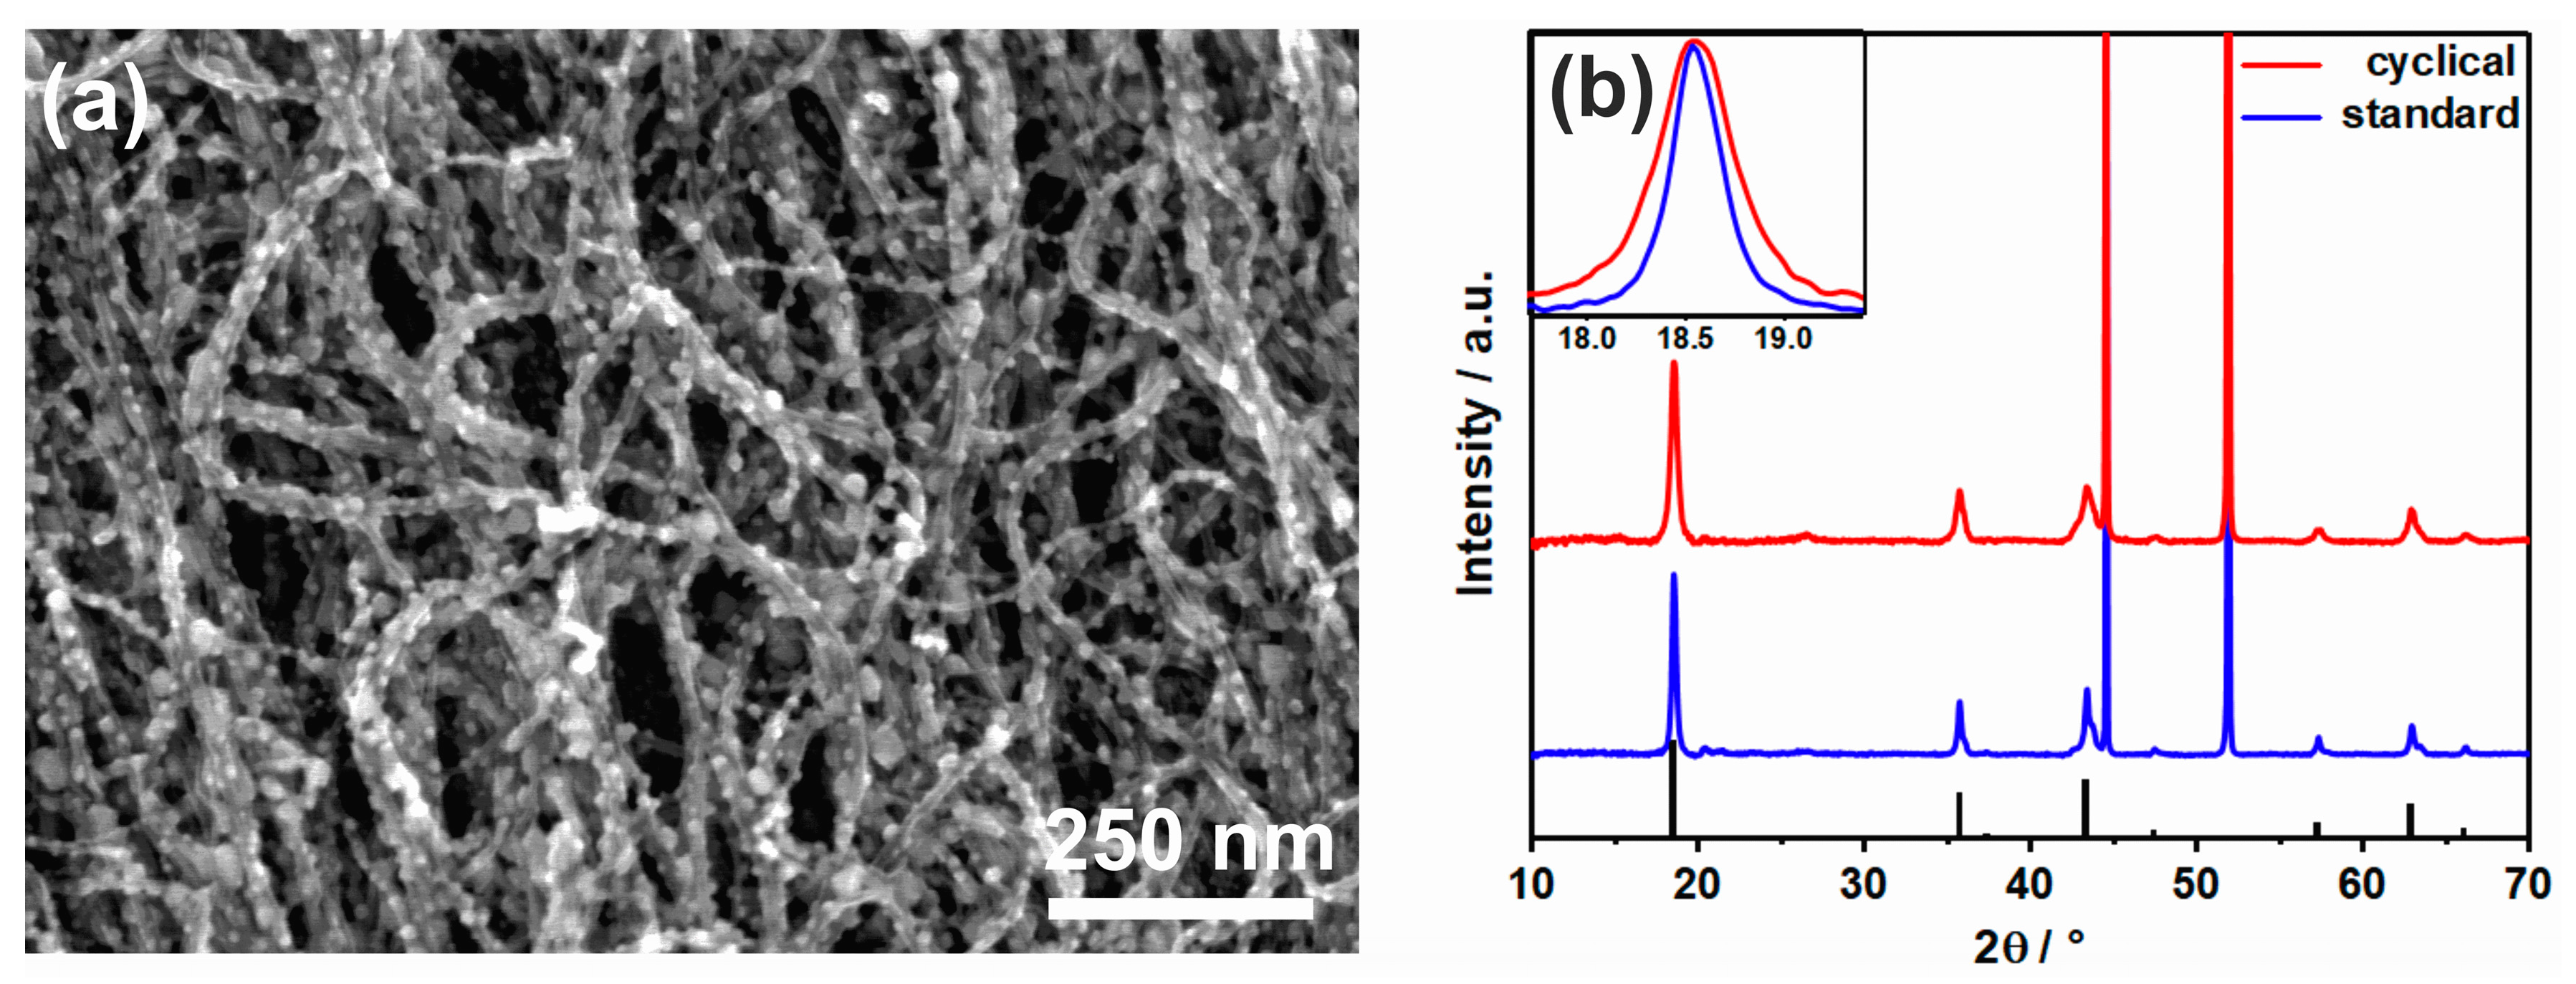
3.1. Structure Characterization of LTO– and LMO–VACNT Nanoarrays

As illustrated in Figure 2, self-supported LTO– and LMO–VACNT nanoarrays were produced directly on VACNT–nickel substrates using a scalable liquid spray deposition technique, followed by an annealing step. Based on the open pore system of the VACNT, the infiltration step via low-viscosity precursor solutions is thereby enhanced by capillary forces. In this way, the entire surface of the CNT is homogeneously coated with precursor, subsequently resulting in highly distributed metal oxide particles. The in situ synthesis of LMO on VACNT requires the oxidation of manganese (II) acetate to LMO. Thus, the synthesis is performed in air, which potentially facilitates CNT oxidation, and in consequence leads to decreased electron conductivity. In order to avoid CNT oxidation, the oxidation temperature of the CNTs, in combination with the LMO precursor, was examined by TGA measurements. While pristine CNT start to oxidize at about 400 °C, in direct contact with the LMO precursor, the oxidation temperature of the CNT is significantly decreased to about 250 °C, which can be attributed to the catalytic effect of the manganese compound on the decomposition of carbon materials (cf. Figure S1) [42]. Therefore, the annealing temperature used for LMO–VACNT synthesis needs to be below 250 °C. Nevertheless, well-crystallized LMO particles are essential for high rate capabilities, which make it necessary to study the length of the annealing time. In Figure 3a, the XRD patterns of LMO–VACNT nanoarrays at increasing annealing times from 2 to 24 h are shown. The diffraction peaks of the 2 h sample are assigned to spinel-structured LMO, with some additional peaks at 2θ = 28.9°, 2θ = 31.0°, and 2θ = 32.4°, which are assigned to Mn3O4 with about 5–10 wt %. Furthermore, the peak at 18.4° is slightly shifted to smaller angles due to the Mn3O4 impurity. The broad reflection peak at 2θ = 26.6° is assigned to graphitic CNT layers, and the strong peaks at 2θ = 44.5° and 2θ = 51.8° result from the nickel substrate foil. With increasing annealing time, the Mn3O4 impurity disappears and thus phase pure, crystalline LMO–VACNT nanoarrays can be prepared at temperatures as low as 225 °C. With regard to the full width at half maximum of the (111) reflection peak, the samples show no significant differences at increasing annealing times. Based on the Scherrer equation, this indicates very similar crystallite sizes of about 11–13 nm throughout all of the samples. In combination with the increasing reflection peak intensity, this suggests an increasing amount of crystalline LMO particles by longer annealing times without any influence on the particle size. This is most likely due to the incomplete LMO synthesis shown by Mn3O4 impurities at shorter annealing times. The morphology of the 24 h LMO–VACNT sample was further examined using SEM. In Figure 3b, it can be seen that LMO nanoparticles with sizes up to 15 nm are directly deposited on the CNT surface, and thus exhibit a strong adhesion. As shown in Figure S2, the macroscopic structure of the VACNT nanoarray, with its open porosity, was conserved during LMO synthesis. For further analysis, the LMO–CNT interface was investigated in Figure 3c by high resolution TEM. The image reveals that the crystal lattice of the LMO particle has an interplanar spacing of 0.476 nm. This is consistent with the (111) lattice plane of the spinel structure, which indicates a well-crystallized LMO phase. Moreover, it can be clearly seen that the crystalline phases are in direct contact with the outer CNT layer. As a consequence, this should allow very fast electron transport between LMO and CNT, which is a crucial point for high rate performance. The X-ray diffraction (XRD) pattern of a 70 wt % LTO–VACNT nanoarray is shown in Figure 3d. The diffraction peaks can be assigned to phase pure, crystalline spinel-structured LTO. The morphology of the LTO–VACNT nanoarray was investigated by SEM, and is shown in Figure 3e. LTO nanoparticles with sizes up to about 100 nm were directly grown on the CNT. In an analogous manner, as for the LMO–CNT interface, the LTO–CNT interface was examined in Figure 3f by high resolution transmission electron microscopy (HRTEM). It is revealed that the LTO nanoparticle has a d-spacing of 0.482 nm, which corresponds to the (111) lattice plane of LTO, and that the crystalline LTO phase is likewise in direct contact with the outer CNT layer. More detailed studies regarding the morphology of as-prepared LTO–VACNT nanoarrays, and their electrochemical characterization, were published earlier [37].

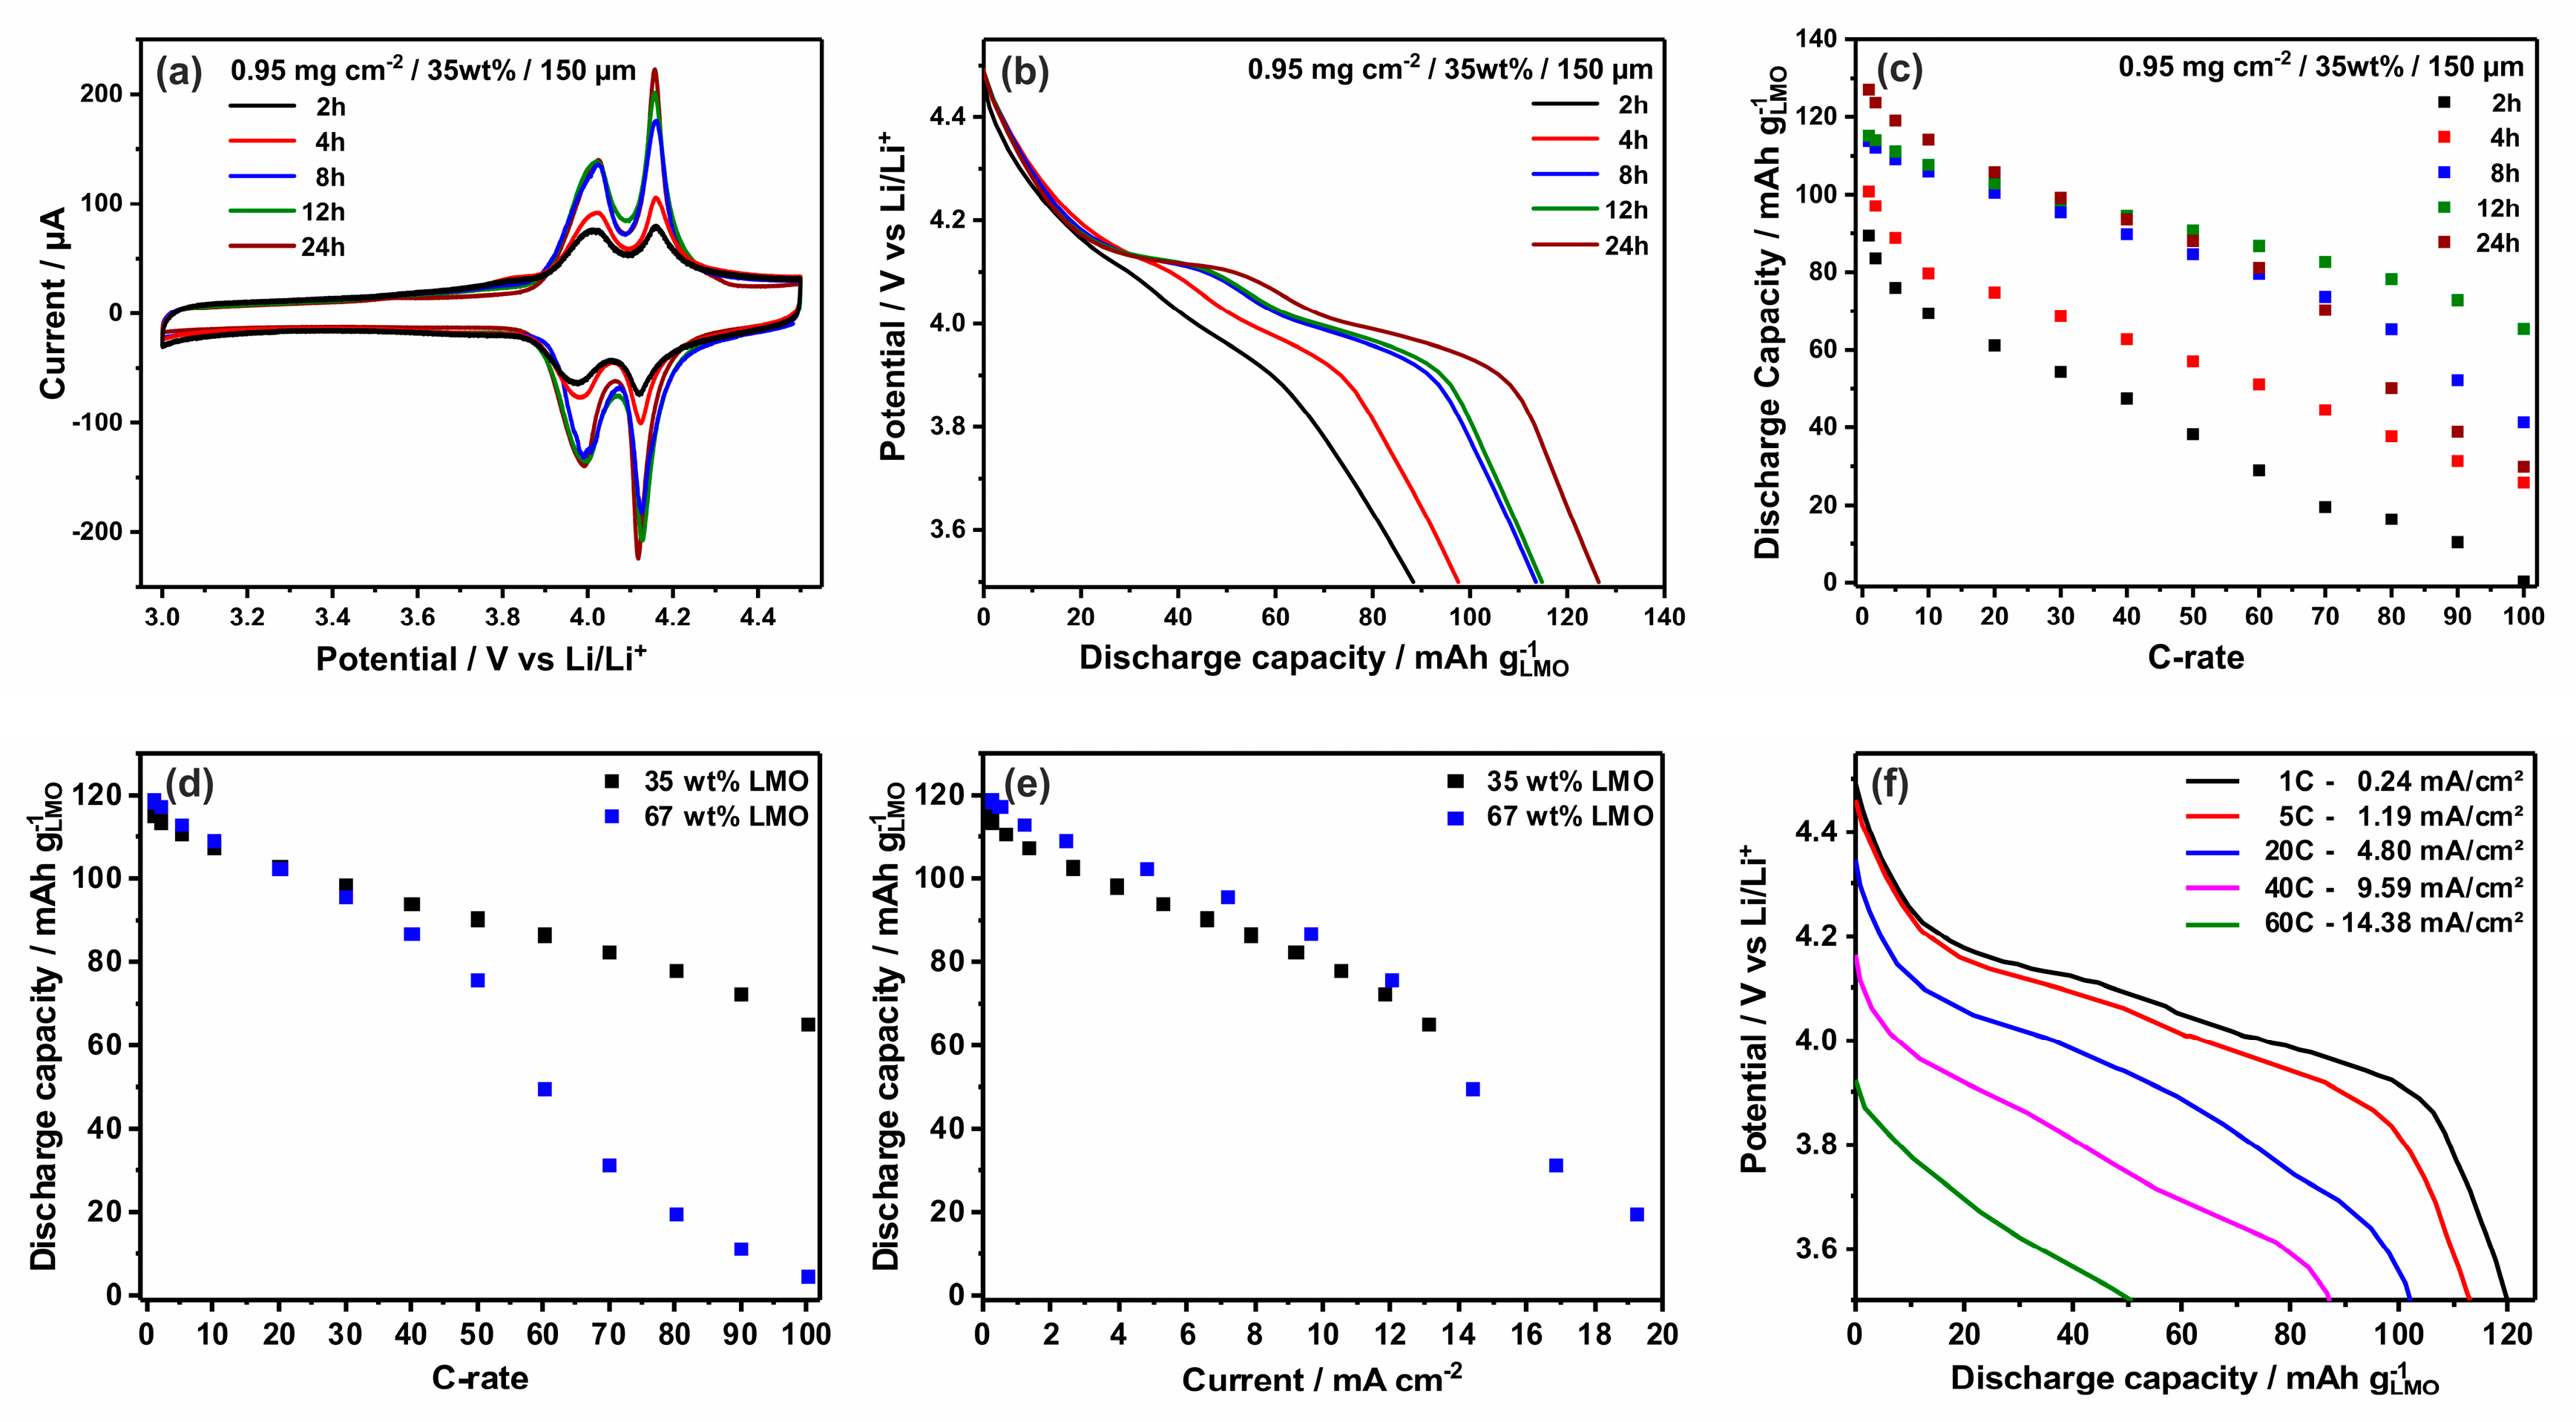
3.2. Electrochemical Characterization of LMO-VACNT Nanoarrays

The Li+-ion storage performance of LMO–VACNT nanoarrays prepared at different annealing times was studied in coin cells by cyclic voltammetry. As shown in Figure 4a, all of the samples exhibit two well-defined pairs of reversible redox peaks between 3.9–4.2 V. The first redox pair at about 4.03/3.99 V corresponds to the (de)intercalation of Li+-ions into half of the tetrahedral sites with Li–Li interaction, and the second redox pair at about 4.16/4.12 V is assigned to the other half of tetrahedral sites without Li–Li interaction [43,44]. The redox peaks are well separated, and their shapes are very similar throughout the annealing time series, indicating well-crystallized LMO particles. However, current peak heights are significantly increased with longer annealing times as LMO synthesis and particle formation progresses. The potential difference between the cathodic and anodic peak of a redox pair can be used as an indicator for the polarization of the cell. The cells show a very small polarization of 0.04 V, and thereby small cell resistance and fast kinetics can be assumed. For further electrochemical studies, the cells were charged/discharged at 1 C (1 C = 148 mA g−1). The resulting voltage profiles in Figure 4b clearly show an increase of discharge capacity with increasing annealing times. With a discharge capacity up to 126 mAh g−1, the 24 h sample matches the practically achievable capacity of LMO. In consequence, it can be assumed that the LMO synthesis is fully completed at this point. The profiles also exhibit two specifiable voltage plateaus at about 4.12 V and 3.98 V, which are assigned to the lithiation of λ-MnO2 to Li0.5Mn2O4, and then in the second plateau to LiMn2O4 [45,46]. In order to achieve the full performance of LMO–VACNT nanoarrays, galvanostatic charging/discharging up to 100 C was studied. As shown in Figure 4c, the specific discharge capacities at rates up to 20 C increase with increased annealing time from 2 h to 24 h, as LMO synthesis progresses and more LMO particles are available for (de)lithiation. However, the picture changes at high C-rates. The discharge capacity of the 24 h sample drops to 30 mAh g−1 at 100 C, whereas the 12 h sample still exhibits a high capacity of 65 mAh g−1, even though LMO synthesis is not fully completed. This effect can be most likely explained due to a slow progressing oxidation of the CNT surface, which leads to a reduced electric conductivity. A reduction of the electric conductivity especially affects the cell performance at high C-rates, as overpotentials are vastly increasing, and eventually, lower capacities are achieved. In consequence, the better conservation of the CNT conductivity at 12 h overcompensates the benefits of a fully completed LMO synthesis at 24 h annealing. For further studies of LMO–VACNT nanoarrays, the annealing time was determined at 12 h. With regard to practical use, electrodes with higher LMO to CNT ratios are reasonable because of their expected higher power and energy density. For the preparation of high LMO to CNT ratios, an additional annealing step in argon prior to the annealing step in air was used. In this way, a better particle formation on the CNT surface was achieved, as shown in Figure S3. The size of the LMO nanoparticles in as-prepared LMO nanoarrays increases to 25 nm. The performance of a LMO–VACNT nanoarray with higher LMO weight ratio was studied by galvanostatic charging/discharging up to 100 C. In Figure 4d, the performance of a 67 wt % (2.4 mg cm−2 LMO) and a 35 wt % (0.8 mg cm−2 LMO) LMO–VACNT nanoarray are shown in comparison. At 1 C, both nanoarrays exhibit discharge capacities of about 120 mAh g−1, indicating a high LMO utilization. Up to rates of 50 C, the nanoarrays show a very similar small and almost linear capacity decrease. In this way, the capacity of the 35 wt % nanoarray continuously drops to 65 mAh g−1 at 100 C. In contrast, the 67 wt % nanoarray shows an abrupt capacity drop at 60 C, and a significantly decreasing capacity at even higher rates. Regarding this result, it has to be mentioned that with a higher LMO load, the areal current density is likewise increased at a constant C-rate. Eventually, a higher areal current density results in an increased cell resistance and a lower rate capability. For a more reasonable comparison of the electrode performance, the results are plotted against the areal current density instead of C-rate. Figure 4e shows that the discharge capacities of both LMO ratios are basically the same when being referred to current density, and thus, both electrodes exhibit highly similar performances. Nevertheless, the 67 wt % nanoarray still shows a capacity drop starting at 14 mA cm−2. The reason for this capacity drop can be found in the voltage profile in Figure 4f. As the current density increases, the LMO discharge plateaus are shifted to lower potentials. As a result, the capacity of LMO is significantly decreased when parts of the discharge plateaus are shifted below the tested potential limit of 3.5 V. Altogether, LMO–VACNT nanoarrays with a high LMO areal load of 2.4 mg cm−2 exhibit excellent LMO utilization and high rate capability.

3.3. Structure Property Relationship in LTO-VACNT Nanoarrays

One of the most important factors influencing the rate capability of LIB is considered to be the length of the Li+-ion diffusion pathway. It is determined both by the particle size of the electrochemical active materials and the thickness and pore geometry of the electrode. For nanoarray-based electrodes, it is expected that the open pore geometry enables very direct and unhindered Li+-ion diffusion pathways within the electrode. Furthermore, the Li+-ion diffusion coefficient is several orders of magnitude higher in the electrolyte (~10−6 cm2 s−1 for LP30) [47,48] than in LTO (~10−12–10−14 cm2 s−1) [49,50,51] or LMO (~10−12–10−14 cm2 s−1) [52,53]. However, Li+-ion diffusion lengths are several orders of magnitude longer in the electrolyte (up to 175 µm) than in the particles (10–50 nm), which eventually leads to similar time scales for both diffusion processes. Taking this into consideration, we investigated both diffusion processes starting with the influence of particle size reduction for 70 wt % LTO–VACNT nanoarrays, as LTO particle size is easily adjustable by using a cyclic synthesis method. Due to the in situ synthesis method, LTO particle size is tuned by the amount of infiltrated LTO precursor per CNT surface. At a constant CNT height, high precursor amounts result in larger LTO particles than low precursor amounts. Consequently, by reducing the amount of infiltrated precursor, and therefore repeating the infiltration and annealing cycle several times, the LTO particle size is adjustable. The SEM image of a 70 wt % LTO–VACNT nanoarray synthesized via cyclic method in three cycles is shown in Figure 5a. It can be clearly seen that LTO nanoparticles with particle sizes in the range of 20–30 nm are deposited on the CNT surface. This is a significant reduction of particles size compared with the 100 nm particles synthesized via standard method in Figure 3e. Furthermore, the repeated precursor infiltration and deposition onto already formed LTO particles in the second and third cycle still lead to well separated LTO particles. The XRD pattern of the as-prepared (cyclic method) LTO–VACNT nanoarray in Figure 5b shows phase pure LTO without any side phases. With regard to the full width at half maximum of the reflection peaks, a clear broadening can be observed. Based on the Scherrer equation for the (111) reflection peak, this indicates decreased crystallite sizes of 19 nm, compared with 29 nm for the standard method. To study the influence of particle size reduction on rate capability, 75 wt % (2.95 mg cm−2) LTO nanoarrays with a height of 100 µm were charged/discharged up to 200 C in galvanostatic mode. In Figure 6a, it can be seen that particle size reduction significantly affects both the utilization and rate capability of LTO. At 1 C, a huge increase in discharge capacity is observed from 128 mAh g−1 to 180 mAh g−1 for small particles, indicating a significantly improved LTO utilization. The achieved capacity is even higher than expected from the theoretical value of 175 mAh g−1, which is due to the additional capacity provided by double-layer capacity [54,55]. As C-rates are increased up to 50 C, the discharge capacities for both nanoarrays decrease by a very similar amount of capacity, to 65 mAh g−1 and 105 mAh g−1, respectively. However, at even higher C-rates, the discharge capacities for the small particle nanoarray starts to drop rapidly to 54 mAh g−1 at 100 C, which is in the same range as large particles with 48 mAh g−1 at that C-rate. For the highest C-rates up to 200 C, both nanoarrays exhibit basically the same discharge capacities, regardless of the LTO particle size. This result is quite unexpected, because especially at high C-rates, the shorter Li+-ion pathways, as well as the lower surface area specific current density, should be highly beneficial for smaller particles in terms of rate capability. A closer look regarding this issue is given by the voltage profiles in Figure 6b. At a low current density of 0.96 mA cm−2, both nanoarrays exhibit a flat voltage plateau around 1.53 V, which can be assigned to the Li+-insertion of LTO. The potential almost matches the theoretical plateau of 1.55 V, indicating very low electrical resistances in the electrode [56,57]. At a higher current density of 24.1 mA cm−2, the beneficial effect of particle size reduction on the electrical resistance can be clearly seen. For bigger particles, the potential of the plateau is lowered to 1.33 V, whereas the smaller particles show a much higher discharge potential, starting at 1.44 V. This is due to a smaller surface current density for smaller particles, resulting in lower electrical resistances. At a current density to 48.2 mA cm−2, there is basically no difference in both voltage profiles. This leads to the conclusion that particle size is an important structural characteristic of nanoarrays. However, for the highest current densities, the rate capability seems to be limited by another factor. Based on the relatively large height of studied VACNT nanoarrays, this factor could be the Li+-ion diffusion in the electrolyte. To study the influence of electrolyte diffusion on rate capability, cells were charged/discharged in galvanostatic mode at various temperatures, since the Li+-ion diffusion coefficient is highly temperature-dependent. Therefore, LTO nanoarrays were prepared via cyclic method with 65 wt % (2.77 mg cm−2) LTO and a larger height of 150 µm to further increase the Li+-ion pathway, and thus clarify the influence of Li+-ion diffusion in the electrolyte. In Figure 6c, the results at temperatures between −15 °C to 50 °C are shown. The critical C-rate characterizing the discharge capacity drop can be taken as a measure for rate capability. For 0 °C, 25 °C, and 50 °C, the critical C-rate is 10 C, 30 C, and 90 C, respectively. Thus, it can be clearly seen that elevating the temperature of the cells results in an immensely improved rate capability. As a consequence, this result strongly indicates that Li+-ion diffusion in the electrolyte, and therefore the height of the nanoarray, could be limiting factors at the highest C-rates. However, elevating the temperature also increases the Li+-ion diffusion coefficient of LTO. To further clarify the limiting influence of the height, LTO–nanoarrays with a thickness of 60 µm, 100 µm, and 150 µm, and constant 70–74 wt % LTO (1.69 mg cm−2/2.75 mg cm−2/3.59 mg cm−2 LTO) were prepared, and charged/discharged up to 200 C in galvanostatic mode. The results of the rate test are shown in Figure 6d. At lower C-rates up to 20 C, all three nanoarrays exhibit relatively similar discharge capacities with 94, 101, and 99 mAh g−1 for 150, 100, and 60 µm, respectively. However, discharge capacities already start to heavily drop at 20 C for the 150 µm sample. A similar capacity drop occurs for the 100 µm sample only at a higher rate of 40 C. The 60 µm nanoarray shows no heavy capacity drop at all, but continuously loses capacity, and thus exhibits by far the best rate capability. This clearly demonstrates the limitation of the C-rate with increasing nanoarray height. The reason for this limitation can be found in the uneven distribution of current density in the nanoarray, which is due to limited Li+-ion diffusivity within the nanoarray [58,59]. On discharging, the current density is shifted from the separator/electrode boundary towards the current collector. Thus, the total applied current density is at first only affecting the LTO particles at the top of the nanoarray. Moreover, current densities are increasing with the height of the nanoarrays, as total mass of LTO is likewise increased. This causes much higher electric resistances at the affected LTO particles, and therefore lower LTO utilizations when increasing the height of the nanoarrays. This limitation can also be seen in Figure 6e by plotting the absolute capacity against the current density. Up to a current density of around 10 mA cm−2, all three samples show a very similar capacity trend. However, the capacities start to heavily drop at a critical current density of 12.6 mA cm−2 and 19.2 mA cm−2 for the 150 µm and 100 µm nanoarrays, respectively. It is noticeable that the 100 µm and 150 µm samples exhibit basically the same absolute capacity at current densities exceeding approximately 20 mA cm−2. At current densities of 34 mA cm−2 and higher, all three nanoarrays exhibit very similar capacities. This clearly demonstrates that due to the limitation of Li+-ion diffusion, only a certain amount of charge carriers can be transported within the nanoarray at a specific current density, which is independent of the nanoarray height. The influence of this limitation on the power density referring to the full electrode mass is shown in Figure 6f. The obtained peak power densities are immensely increasing from 1.3 kW kg−1 to 1.8 kW kg−1 to 2.3 kW kg−1 as nanoarray heights are decreased from 150 µm to 100 µm to 60 µm. Regarding high power densities, these results make it very clear that characteristic dimensions matter not only for the active oxide materials, but also for the height of the nanoarrays, despite their open pore geometry.

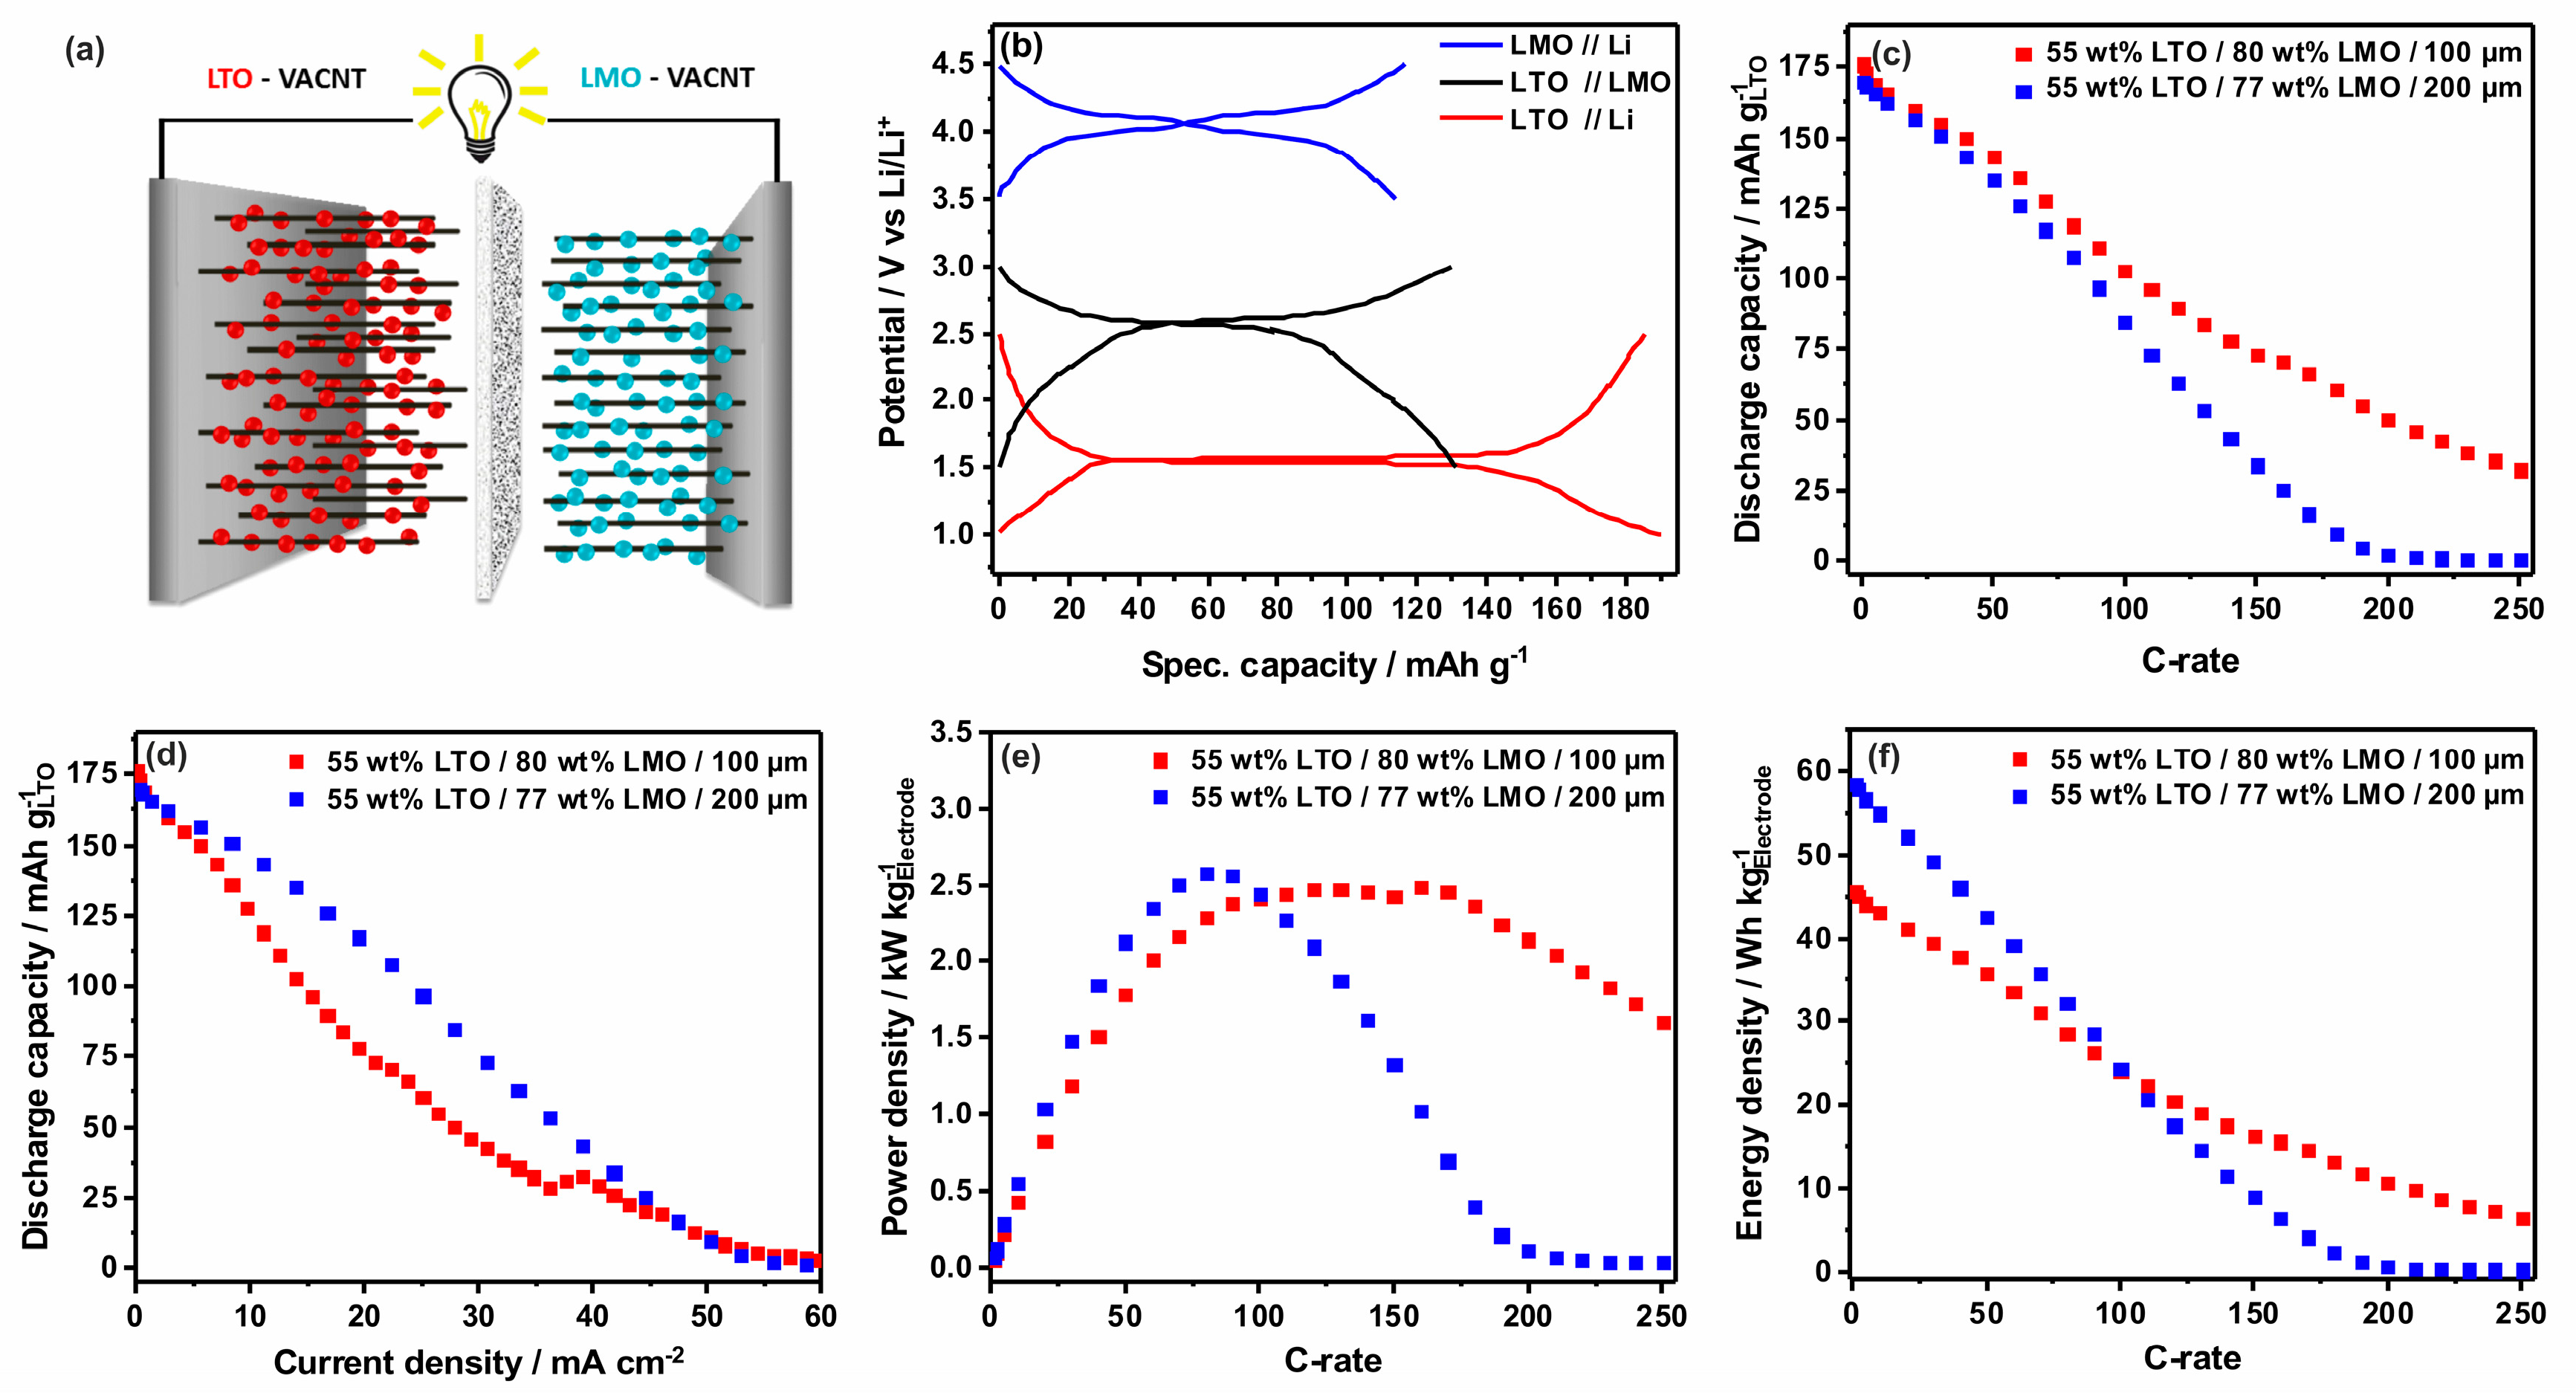
3.4. Electrochemical Characterization of LTO//LMO-VACNT Full Cells

As shown in the results so far, VACNT-based nanotubes are capable of delivering high power densities in half-cells against lithium. However, lithium electrodes possess solid electrolyte interfaces (SEI), as well as planar electrode/electrolyte interfaces, which can have negative effects on the rate capability at high current densities. To explore the potential of VACNT-based nanoarrays regarding high power applications without the effects of lithium electrodes, LTO–VACNT nanoarrays on aluminum foil were used as the anode, and LMO–VACNT nanoarrays on aluminum foil were used as the cathode in a full cell setup, as shown in Figure 7a. In such VACNT-based full cells, SEI formation and the electroactive surface current density are heavily decreased, whereas the pathway between the electrodes is increased. The LTO to LMO nominal capacity ratio was adjusted to be equal. For a constant CNT height of 100 µm, this results in 55 wt % LTO–VACNT electrodes and 68 wt % LMO electrodes. Figure 7b shows the voltage profiles of LTO and LMO half-cells against lithium, as well as the corresponding LTO//LMO full cell at 1 C. As expected from the voltage plateaus of the half-cells, the LTO//LMO full cell exhibits an operating voltage of about 2.55 V. The specific capacity obtained for the LTO//LMO cell referring to LTO is 130 mAh g−1. This is way below the specific capacity of LTO//Li, because the LMO utilization is at about 80% of its theoretical capacity. The specific capacity of LTO with 190 mAh g−1 is even higher than expected from the theoretical value of 175 mAh g−1, which is due to the additional capacity provided by double-layer capacity. In order to increase the cells’ performance, an adjustment of LTO to LMO ratio is needed. Thus, the LTO:LMO nominal capacity ratio is increased to 1:1.6, which results in 80 wt % LMO–VACNT nanoarrays. Additionally, the influence of the heights of the nanoarrays on the power and energy density of the full cell with consistent LTO:CNT and LMO:CNT ratios are also studied. The full potential regarding the rate capability of balanced full cells based on 100 µm- and 200 µm-high nanoarrays is shown in Figure 7c. Due to the improved balancing of the LTO to LMO ratio, discharge capacities of 176 mAh g−1 and 170 mAh g−1 for 100 µm and 200 µm nanoarrays are obtained at 1 C, which is in accordance with a high LTO utilization. The 100 µm-nanoarrays exhibit excellent discharge capacities of 143 mAh g−1, 103 mAh g−1, 72 mAh g−1, and 50 mAh g−1 at 50 C, 100 C, 150 C, and 200 C, respectively. This result clearly proves the high rate capability of VACNT-based nanoarrays, and points out the potential of the concept. However, the rate capability for 200 µm-nanoarrays is decreased as discharge capacities of 135 mAh g−1, 84 mAh g−1, 34 mAh g−1, and 3 mAh g−1 are obtained at 50 C, 100 C, 150 C, and 200 C, respectively. Especially at rates higher than 80 C, the discharge capacities show a much faster decline compared with the 100 µm nanoarrays. In Figure 7d, the results are plotted against the areal current density. For current densities up to 4 mA cm−2, both nanoarrays exhibit about the same discharge capacities. At higher current densities up to 40 mA cm−2, the 200 µm-nanoarrays show even higher discharge capacities. However, the increase in discharge capacity at a specific current density, as well as the capacity at rates above 80C, is not as high as it would be expected without the earlier shown Li+-ion diffusion limitations within the nanoarray. In Figure 7e, the resulting power densities of both nanoarray heights are shown in comparison. For 100 µm-nanoarrays, a broad peak power density of 2.48 kW kg−1, referring to the full electrode mass, is obtained between 120–170 C. Although the areal load of active material is doubled for 200 µm-nanoarrays, the lower capacities at rates above 80 C only lead to a slight increase in peak power density to 2.58 kW kg−1 at 80 C. With regard to the energy density shown in Figure 7f at the C-rate of the peak power density, the 100 µm-nanoarrays reach between 20.5 Wh kg−1 to 14.5 Wh kg−1, whereas the 200 µm-nanoarrays reach a much higher energy density of 32.5 Wh kg−1, again referring to the full electrode mass. Altogether, it can be stated that the nanoarray concept based on the highly versatile VACNT system is capable of achieving excellent C-rates corresponding to high power densities. However, increasing the height of the nanoarrays has proven to be not beneficial regarding power densities, but beneficial for increasing the energy density. For practical applications of the full cells, the long-term cycling stability is an important factor, which was investigated following the rate tests by galvanostatic cycling at 10 C (cf. Figure S4). Considering the high current densities during the rate tests, both full cells show high capacity retention, as the specific capacities achieved in the first cycles of the stability test are only 8% lower than in the rate test at 10 C. Over the course of the following 200 cycles, the capacities continuously drop to 132 mAh g−1/11% and 116 mAh g−1/24% for the 200 µm- and 100 µm-electrodes, respectively. Altogether, it can be stated that LTO–VACNT//LMO–VACNT full cells exhibit a solid long-term cycling stability.

4. Conclusions

In this work, we were able to report the preparation of LMO–VACNT and LTO–VACNT nanoarrays as model examples for the high versatility of VACNT-based nanoarrays for high power LIB. Furthermore, we were able to apply the nanoarrays directly as electrodes in LIB without any additional conductive agent or binder. Due to their unique structure enabling short Li+-ion and electron pathways within the electrode, as well as a high conductivity, we obtained remarkably high rate capabilities both in half-cell setup and in LMO//LTO full cell setup. Moreover, the importance of LTO nanoparticle size was demonstrated, showing significantly improved rate capability for C-rates up to 100 C for 20–30-nm particles compared with 100-nm particles. However, at even higher C-rates, it was shown that the obtained specific capacities are not limited by the LTO particle size anymore. Instead, at such high C-rates, the rate capability, power, and energy density are heavily affected by the nanoarray height. Despite the open pore geometry of nanoarrays, it turned out that increasing the nanoarray height is not beneficial in order to further improve the power density of nanoarray-based LIBs. Nevertheless, the concept of VACNT-based nanoarrays proved to be a promising approach for future high power LIBs with a noteworthy peak power density of 2.58 kW kg−1, based on a total electrode mass at 80 C for LMO//LTO.

Supplementary Materials

The following are available online at https://www.mdpi.com/2313-0105/3/4/37/s1, Figure S1: Thermogravimetric analysis in air of LMO-Precursor, VACNT and VACNT coated with LMO-Precursor at a rate of 1 K min−1, Figure S2: SEM images of a LMO-VACNT nanoarray transferred onto a primered aluminium substrate in top view (left) and side view (right), Figure S3: 67 wt % LMO-nanoarray synthesized via pretreatment at 350 °C in argon and subsequent annealing at 225 °C / 12 h in air, Figure S4: Long term cycling stability of LTO-VACNT//LMO-VACNT full cells at 10 C.

Acknowledgments

The research leading to these results has received funding from the European Union Seventh Framework Program (FP7/2007-2013) under grant agreement n° [309530].

Author Contributions

Fabian Pawlitzek designed and performed the experiments and analyzed the results. The manuscript was written by all four authors.

Conflicts of Interest

The authors declare no conflict of interest.

References

  1. Armand, M.; Tarascon, J.M. Building better batteries. Nature 2008, 451, 652–657. [Google Scholar] [CrossRef] [PubMed]
  2. Van Noorden, R. The rechargeable revolution: A better battery. Nature 2014, 507, 26–28. [Google Scholar] [CrossRef] [PubMed]
  3. Lee, S.; Cho, J. Critical Requirements for Rapid Charging of Rechargeable Al- and Li-Ion Batteries. Angew. Chem. Int. Ed. Engl. 2015, 54, 9452–9455. [Google Scholar] [CrossRef] [PubMed]
  4. Tsuji, T.; Tatsuyama, Y.; Tsuji, M.; Ishida, K.; Okada, S.; Yamaki, J. Preparation of LiMn2O4 nanoparticles for Li ion secondary batteries by laser ablation in water. Mater. Lett. 2007, 61, 2062–2065. [Google Scholar] [CrossRef]
  5. Mohammadi, M.R.; Fray, D.J. Low temperature nanostructured lithium titanates. J. Sol-Gel Sci. Technol. 2010, 55, 19–35. [Google Scholar] [CrossRef]
  6. Kavan, L.; Grätzel, M. Facile Synthesis of Nanocrystalline Li4Ti5O12 (Spinel) Exhibiting Fast Li Insertion. Electrochem. Solid State Lett. 2002, 5, A39. [Google Scholar] [CrossRef]
  7. Li, J.; Tang, Z.; Zhang, Z. Controllable formation and electrochemical properties of one-dimensional nanostructured spinel Li4Ti5O12. Electrochem. Commun. 2005, 7, 894–899. [Google Scholar] [CrossRef]
  8. Lee, S.C.; Lee, S.M.; Lee, J.W.; Lee, J.B.; Lee, S.M.; Han, S.S.; Lee, H.C.; Kim, H.J. Spinel Li4Ti5O12 Nanotubes for Energy Storage Materials. J. Phys. Chem. C 2009, 113, 18420–18423. [Google Scholar] [CrossRef]
  9. Ding, Y.L.; Xie, J.; Cao, G.S.; Zhu, T.J.; Yu, H.M.; Zhao, X.B. Single-Crystalline LiMn2O4 Nanotubes Synthesized Via Template-Engaged Reaction as Cathodes for High-Power Lithium Ion Batteries. Adv. Funct. Mater. 2011, 21, 348–355. [Google Scholar] [CrossRef]
  10. Wang, X.; Liu, B.; Hou, X.; Wang, Q.; Li, W.; Chen, D.; Shen, G. Ultralong-life and high-rate web-like Li4Ti5O12 anode for high-performance flexible lithium-ion batteries. J. Nano Res. 2014, 7, 1073–1082. [Google Scholar] [CrossRef]
  11. Hosono, E.; Kudo, T.; Honma, I.; Matsuda, H.; Zhou, H. Synthesis of single crystalline spinel LiMn2O4 nanowires for a lithium ion battery with high power density. Nano Lett. 2009, 9, 1045–1051. [Google Scholar] [CrossRef] [PubMed]
  12. Sun, W.; Cao, F.; Liu, Y.; Zhao, X.; Liu, X.; Yuan, J. Nanoporous LiMn2O4 nanosheets with exposed {111} facets as cathodes for highly reversible lithium-ion batteries. J. Mater. Chem. 2012, 22, 20952. [Google Scholar] [CrossRef]
  13. Liu, J.; Wei, X.; Liu, X.W. Two-dimensional wavelike spinel lithium titanate for fast lithium storage. Sci. Rep. 2015, 5, 9782. [Google Scholar] [CrossRef] [PubMed]
  14. Li, N.; Mei, T.; Zhu, Y.; Wang, L.; Liang, J.; Zhang, X.; Qian, Y.; Tang, K. Hydrothermal synthesis of layered Li1.81H0.19Ti2O5·xH2O nanosheets and their transformation to single-crystalline Li4Ti5O12 nanosheets as the anode materials for Li-ion batteries. CrystEngComm 2012, 14, 6435. [Google Scholar] [CrossRef]
  15. Sorensen, E.M.; Barry, S.J.; Jung, H.-K.; Rondinelli, J.M.; Vaughey, J.T.; Poeppelmeier, K.R. Three-Dimensionally Ordered Macroporous Li4Ti5O12. Chem. Mater. 2006, 18, 482–489. [Google Scholar] [CrossRef]
  16. Luo, J.Y.; Wang, Y.G.; Xiong, H.M.; Xia, Y.Y. Ordered Mesoporous Spinel LiMn2O4 by a Soft-Chemical Process as a Cathode Material for Lithium-Ion Batteries. Chem. Mater. 2007, 19, 4791–4795. [Google Scholar] [CrossRef]
  17. Lai, C.; Wu, Z.; Zhu, Y.; Wu, Q.; Li, L.; Wang, C. Ball-milling assisted solid-state reaction synthesis of mesoporous Li4Ti5O12 for lithium-ion batteries anode. J. Power Sources 2013, 226, 71–74. [Google Scholar] [CrossRef]
  18. Tang, Y.; Zhang, Y.; Li, W.; Ma, B.; Chen, X. Rational material design for ultrafast rechargeable lithium-ion batteries. Chem. Soc. Rev. 2015, 44, 5926–5940. [Google Scholar] [CrossRef] [PubMed]
  19. Arthur, T.S.; Bates, D.J.; Cirigliano, N.; Johnson, D.C.; Malati, P.; Mosby, J.M.; Perre, E.; Rawls, M.T.; Prieto, A.L.; Dunn, B. Three-dimensional electrodes and battery architectures. MRS Bull. 2011, 36, 523–531. [Google Scholar] [CrossRef]
  20. Wang, Y.; Rong, H.; Li, B.; Xing, L.; Li, X.; Li, W. Microemulsion-assisted synthesis of ultrafine Li4Ti5O12/C nanocomposite with oleic acid as carbon precursor and particle size controller. J. Power Sources 2014, 246, 213–218. [Google Scholar] [CrossRef]
  21. Patey, T.J.; Büchel, R.; Ng, S.H.; Krumeich, F.; Pratsinis, S.E.; Novák, P. Flame co-synthesis of LiMn2O4 and carbon nanocomposites for high power batteries. J. Power Sources 2009, 189, 149–154. [Google Scholar] [CrossRef]
  22. Xia, H.; Ragavendran, K.R.; Xie, J.; Lu, L. Ultrafine LiMn2O4/carbon nanotube nanocomposite with excellent rate capability and cycling stability for lithium-ion batteries. J. Power Sources 2012, 212, 28–34. [Google Scholar] [CrossRef]
  23. Li, X.; Qu, M.; Yu, Z. Preparation and electrochemical performance of Li4Ti5O12/graphitized carbon nanotubes composite. Solid State Ion. 2010, 181, 635–639. [Google Scholar] [CrossRef]
  24. Shi, Y.; Wen, L.; Li, F.; Cheng, H.-M. Nanosized Li4Ti5O12/graphene hybrid materials with low polarization for high rate lithium ion batteries. J. Power Sources 2011, 196, 8610–8617. [Google Scholar] [CrossRef]
  25. Han, S.Y.; Kim, I.Y.; Jo, K.Y.; Hwang, S.-J. Solvothermal-Assisted Hybridization between Reduced Graphene Oxide and Lithium Metal Oxides. J. Phys. Chem. C 2012, 116, 7269–7279. [Google Scholar] [CrossRef]
  26. Zhao, H.; Zhou, M.; Wen, L.; Lei, Y. Template-directed construction of nanostructure arrays for highly-efficient energy storage and conversion. Nano Energy 2015, 13, 790–813. [Google Scholar] [CrossRef]
  27. Zhang, F.; Qi, L. Recent Progress in Self-Supported Metal Oxide Nanoarray Electrodes for Advanced Lithium-Ion Batteries. Adv. Sci. 2016, 3, 1600049. [Google Scholar] [CrossRef] [PubMed]
  28. Xia, H.; Xia, Q.; Lin, B.; Zhu, J.; Seo, J.K.; Meng, Y.S. Self-standing porous LiMn2O4 nanowall arrays as promising cathodes for advanced 3D microbatteries and flexible lithium-ion batteries. Nano Energy 2016, 22, 475–482. [Google Scholar] [CrossRef]
  29. Tang, X.; Lin, B.; Ge, Y.; Ge, Y.; Lu, C.; Savilov, S.V.; Aldoshin, S.M.; Xia, H. LiMn2O4 nanorod arrays. Mater. Res. Bull. 2015, 69, 2–6. [Google Scholar] [CrossRef]
  30. Liu, J.; Song, K.; van Aken, P.A.; Maier, J.; Yu, Y. Self-supported Li4Ti5O12-C nanotube arrays as high-rate and long-life anode materials for flexible Li-ion batteries. Nano Lett. 2014, 14, 2597–2603. [Google Scholar] [CrossRef] [PubMed]
  31. Jiang, J.; Li, Y.; Liu, J.; Huang, X.; Yuan, C.; Lou, X.W.D. Recent advances in metal oxide-based electrode architecture design for electrochemical energy storage. Adv. Mater. 2012, 24, 5166–5180. [Google Scholar] [CrossRef] [PubMed]
  32. Jiang, J.; Li, Y.; Liu, J.; Huang, X. Building one-dimensional oxide nanostructure arrays on conductive metal substrates for lithium-ion battery anodes. Nanoscale 2011, 3, 45–58. [Google Scholar] [CrossRef] [PubMed]
  33. Ellis, B.L.; Knauth, P.; Djenizian, T. Three-dimensional self-supported metal oxides for advanced energy storage. Adv. Mater. 2014, 26, 3368–3397. [Google Scholar] [CrossRef] [PubMed]
  34. Cong, L.; Xie, H.; Li, J. Hierarchical Structures Based on Two-Dimensional Nanomaterials for Rechargeable Lithium Batteries. Adv. Energy Mater. 2017, 7, 1601906. [Google Scholar] [CrossRef]
  35. Chen, S.; Xin, Y.; Zhou, Y.; Ma, Y.; Zhou, H.; Qi, L. Self-supported Li4Ti5O12 nanosheet arrays for lithium ion batteries with excellent rate capability and ultralong cycle life. Energy Environ. Sci. 2014, 7, 1924. [Google Scholar] [CrossRef]
  36. Cha, G.; Lee, H.J.; Choi, J. Preparation of binder-free thin film Li4Ti5O12 anode with an adjustable thickness through anodic TiO2 nanotubes. Curr. Appl. Phys. 2013, 13, 1788–1795. [Google Scholar] [CrossRef]
  37. Pawlitzek, F.; Pampel, J.; Schmuck, M.; Althues, H.; Schumm, B.; Kaskel, S. High-power lithium ion batteries based on preorganized necklace type Li4Ti5O12/VACNT nano-composites. J. Power Sources 2016, 325, 1–6. [Google Scholar] [CrossRef]
  38. Dörfler, S.; Felhösi, I.; Kék, I.; Marek, T.; Althues, H.; Kaskel, S.; Nyikos, L. Tailoring structural and electrochemical properties of vertical aligned carbon nanotubes on metal foil using scalable wet-chemical catalyst deposition. J. Power Sources 2012, 208, 426–433. [Google Scholar] [CrossRef]
  39. Dörfler, S.; Meier, A.; Thieme, S.; Németh, P.; Althues, H.; Kaskel, S. Wet-chemical catalyst deposition for scalable synthesis of vertical aligned carbon nanotubes on metal substrates. Chem. Phys. Lett. 2011, 511, 288–293. [Google Scholar] [CrossRef]
  40. Piwko, M.; Althues, H.; Schumm, B.; Kaskel, S. Confocal Microscopy for Process Monitoring and Wide-Area Height Determination of Vertically-Aligned Carbon Nanotube Forests. Coatings 2015, 5, 477–487. [Google Scholar] [CrossRef]
  41. Brückner, J.; Thieme, S.; Grossmann, H.T.; Dörfler, S.; Althues, H.; Kaskel, S. Lithium–sulfur batteries. J. Power Sources 2014, 268, 82–87. [Google Scholar] [CrossRef]
  42. Baldi, M.; Finocchio, E.; Milella, F.; Busca, G. Catalytic combustion of C3 hydrocarbons and oxygenates over Mn3O4. Appl. Catal. B 1998, 16, 43–51. [Google Scholar] [CrossRef]
  43. Lin, B.; Yin, Q.; Hu, H.; Lu, F.; Xia, H. LiMn2O4 nanoparticles anchored on graphene nanosheets as high-performance cathode material for lithium-ion batteries. J. Solid State Chem. 2014, 209, 23–28. [Google Scholar] [CrossRef]
  44. Thackeray, M.M.; David, W.; Bruce, P.G.; Goodenough, J.B. Lithium insertion into manganese spinels. Mater. Res. Bull. 1983, 18, 461–472. [Google Scholar] [CrossRef]
  45. Tang, S.B.; Lai, M.O.; Lu, L. Electrochemical studies of low-temperature processed nano-crystalline LiMn2O4 thin film cathode at 55 °C. J. Power Sources 2007, 164, 372–378. [Google Scholar] [CrossRef]
  46. Striebel, K.A. Electrochemical Behavior of LiMn2O4 and LiCoO2 Thin Films Produced with Pulsed Laser Deposition. J. Electrochem. Soc. 1996, 143, 1821. [Google Scholar] [CrossRef]
  47. Djian, D.; Alloin, F.; Martinet, S.; Lignier, H. Macroporous poly(vinylidene fluoride) membrane as a separator for lithium-ion batteries with high charge rate capacity. J. Power Sources 2009, 187, 575–580. [Google Scholar] [CrossRef]
  48. Capiglia, C.; Saito, Y.; Kageyama, H.; Mustarelli, P.; Iwamoto, T.; Tabuchi, T.; Tukamoto, H. 7Li and 19F diffusion coefficients and thermal properties of non-aqueous electrolyte solutions for rechargeable lithium batteries. J. Power Sources 1999, 81–82, 859–862. [Google Scholar] [CrossRef]
  49. Rho, Y.H.; Kanamura, K. Li+ ion diffusion in Li4Ti5O12 thin film electrode prepared by PVP sol–gel method. J. Solid State Chem. 2004, 177, 2094–2100. [Google Scholar] [CrossRef]
  50. Kavan, L.; Procházka, J.; Spitler, T.M.; Kalbáč, M.; Zukalová, M.; Drezen, T.; Grätzel, M. Li Insertion into Li4Ti5O12 (Spinel). J. Electrochem. Soc. 2003, 150, A1000. [Google Scholar] [CrossRef]
  51. Bach, S.; Pereira-Ramos, J.; Baffier, N. Electrochemical properties of sol–gel Li4/3Ti5/3O4. J. Power Sources 1999, 81–82, 273–276. [Google Scholar] [CrossRef]
  52. Takai, S.; Yoshioka, K.; Iikura, H.; Matsubayashi, M.; Yao, T.; Esaka, T. Tracer diffusion coefficients of lithium ion in LiMn2O4 measured by neutron radiography. Solid State Ion. 2014, 256, 93–96. [Google Scholar] [CrossRef]
  53. Dickens, P.; Reynolds, G. Transport and equilibrium properties of some oxide insertion compounds. Solid State Ion. 1981, 5, 331–334. [Google Scholar] [CrossRef]
  54. Masarapu, C.; Subramanian, V.; Zhu, H.; Wei, B. Long-Cycle Electrochemical Behavior of Multiwall Carbon Nanotubes Synthesized on Stainless Steel in Li Ion Batteries. Adv. Funct. Mater. 2009, 19, 1008–1014. [Google Scholar] [CrossRef]
  55. Welna, D.T.; Qu, L.; Taylor, B.E.; Dai, L.; Durstock, M.F. Vertically aligned carbon nanotube electrodes for lithium-ion batteries. J. Power Sources 2011, 196, 1455–1460. [Google Scholar] [CrossRef]
  56. Yang, L.Y.; Li, H.Z.; Liu, J.; Tang, S.S.; Lu, Y.K.; Li, S.T.; Min, J.; Yan, N.; Lei, M. Li4Ti5O12 nanosheets as high-rate and long-life anode materials for sodium-ion batteries. J. Mater. Chem. A 2015, 3, 24446–24452. [Google Scholar] [CrossRef]
  57. Ohzuku, T. Zero-Strain Insertion Material of Li[Li[sub 1/3]Ti[sub 5/3]]O[sub 4] for Rechargeable Lithium Cells. J. Electrochem. Soc. 1995, 142, 1431. [Google Scholar] [CrossRef]
  58. Gallagher, K.G.; Trask, S.E.; Bauer, C.; Woehrle, T.; Lux, S.F.; Tschech, M.; Lamp, P.; Polzin, B.J.; Ha, S.; Long, B.; et al. Optimizing Areal Capacities through Understanding the Limitations of Lithium-Ion Electrodes. J. Electrochem. Soc. 2015, 163, A138–A149. [Google Scholar] [CrossRef]
  59. Johns, P.A.; Roberts, M.R.; Wakizaka, Y.; Sanders, J.H.; Owen, J.R. How the electrolyte limits fast discharge in nanostructured batteries and supercapacitors. Electrochem. Commun. 2009, 11, 2089–2092. [Google Scholar] [CrossRef]
Figure 1. Schematic concept of vertically aligned carbon nanotubes (VACNT)-based Li4Ti5O12 (LTO) and LiMn2O4 (LMO) nanoarrays.
Batteries 03 00037 g001
Figure 2. Schematic synthesis of LTO– and LMO–VACNT nanoarrays using spray deposition and a subsequent drying and annealing step.
Batteries 03 00037 g002
Figure 3. (a) XRD pattern of 35 wt % LMO–VACNT nanoarray samples with increasing annealing times ranging from 2–24 h. The light blue bars indicate the LMO reference (ICDD No. 35-0782), reflection peaks marked with (*) refer to nickel. (b) SEM image of LMO–VACNT nanoarray. (c) High resolution transmission electron microscopy (HRTEM) image of a highly crystalline LMO particle deposited on the carbon nanotube (CNT) surface. (d) XRD pattern of a 70 wt % LTO–VACNT nanoarray. The black bars indicate the LTO-reference (ICDD No. 26-1198). (e) SEM image of a LTO–VACNT nanoarray. (f) HRTEM image of a highly crystalline LTO particle directly grown on the CNT surface.
Batteries 03 00037 g003
Figure 4. Electrochemical characterization of LMO–VACNT nanoarrays prepared at 2 h, 4 h, 8 h, 12 h, and 24 h/225 °C. (a) Cyclic voltammograms at a sweep rate of 0.1 mV s−1. (b) Voltage profiles at 1 C. (c) Discharge capacities at galvanostatic rate test up to 100 C. (d) Rate performance test of a 35 wt % and a 67 wt % LMO nanoarray. (e) Rate performances plotted against the applied areal current density. (f) Voltage profile of a 67 wt % LMO nanoarray at increasing C-rates.
Batteries 03 00037 g004
Figure 5. (a) SEM image of 70 wt % LTO–VACNT nanoarray synthesized via cyclic infiltration and annealing method; (b) XRD pattern of cyclic LTO–VACNT nanoarray in comparison with the standard method. The inlet shows a magnification of the (111) reflection peaks.
Batteries 03 00037 g005
Figure 6. (a) Galvanostatic rate test up to 200 C of 70 wt % LTO–VACNT half-cells synthesized via cyclic and standard method. (b) Voltage profiles of cyclic (solid line) and standard (dashed line) synthesis method LTO–VACNT half-cells. (c) Galvanostatic rate test of cyclic method LTO–VACNT half cells at different temperatures. (d) Galvanostatic rate test of 80 wt % LTO–VACNT half-cells with varying VACNT heights. (e) Capacity of LTO–VACNT half-cells at increasing areal current density. (f) Power density of LTO–VACNT electrodes at increasing areal current density.
Batteries 03 00037 g006
Figure 7. Electrochemical characterization of LTO–VACNT//LMO–VACNT full cells. (a) Schematics of as-fabricated VACNT-based lithium ion batteries (LIB). (b) Voltage profiles of LMO and LTO half-cells and corresponding LTO/LMO full cell at 1C. (c) Galvanostatic rate test of 100 µm and 200 µm VACNT-based LTO/LMO full cells up to 250C. (d) Capacity of full cells plotted against the applied areal current density. (e) Power density of full cell nanoarrays at discharging. (f) Energy density of full cell nanoarrays at discharging.
Batteries 03 00037 g007

