3.1. Alloy Properties
Structural, hydrogen storage and electrochemical properties (tested in a flooded half-cell configuration) of the five superlattice HAAs (Fe1 to Fe5) were previously introduced in Part 1 [
10] and their capacities (both gaseous phase and electrochemical), HRD, saturated magnetic susceptibility (
MS) and surface double-layer capacitance (
C) results are shown in
Table 1. Partial substitution of Ni with Fe in Mm-based superlattice HAAs has been shown to increase the abundance of the Ce
2Ni
7 (hexagonal) phase, which is favorable in terms of electrochemical performances [
13,
14,
15] and decreases the relatively unfavorable NdNi
3 phase. However, the total volume of surface metallic Ni clusters, which reflects the surface catalytic capability [
16], decreases with increasing Fe-content (shown in
Table 1,
MS decreases dramatically from 1016 memu g
−1 for Fe1 to 341 memu g
−1 for Fe5). Consequently, the discharge capacity does not increase and HRD deteriorates with increasing Fe-content in the alloy (shown in
Table 1, HRD decreases from 93% for Fe1 to 87% for Fe5 in the half-cell tests). Alloy surface treatment may be a feasible way to overcome this issue [
17].
3.2. Cell Capacities at Room Temperature and Low Temperature
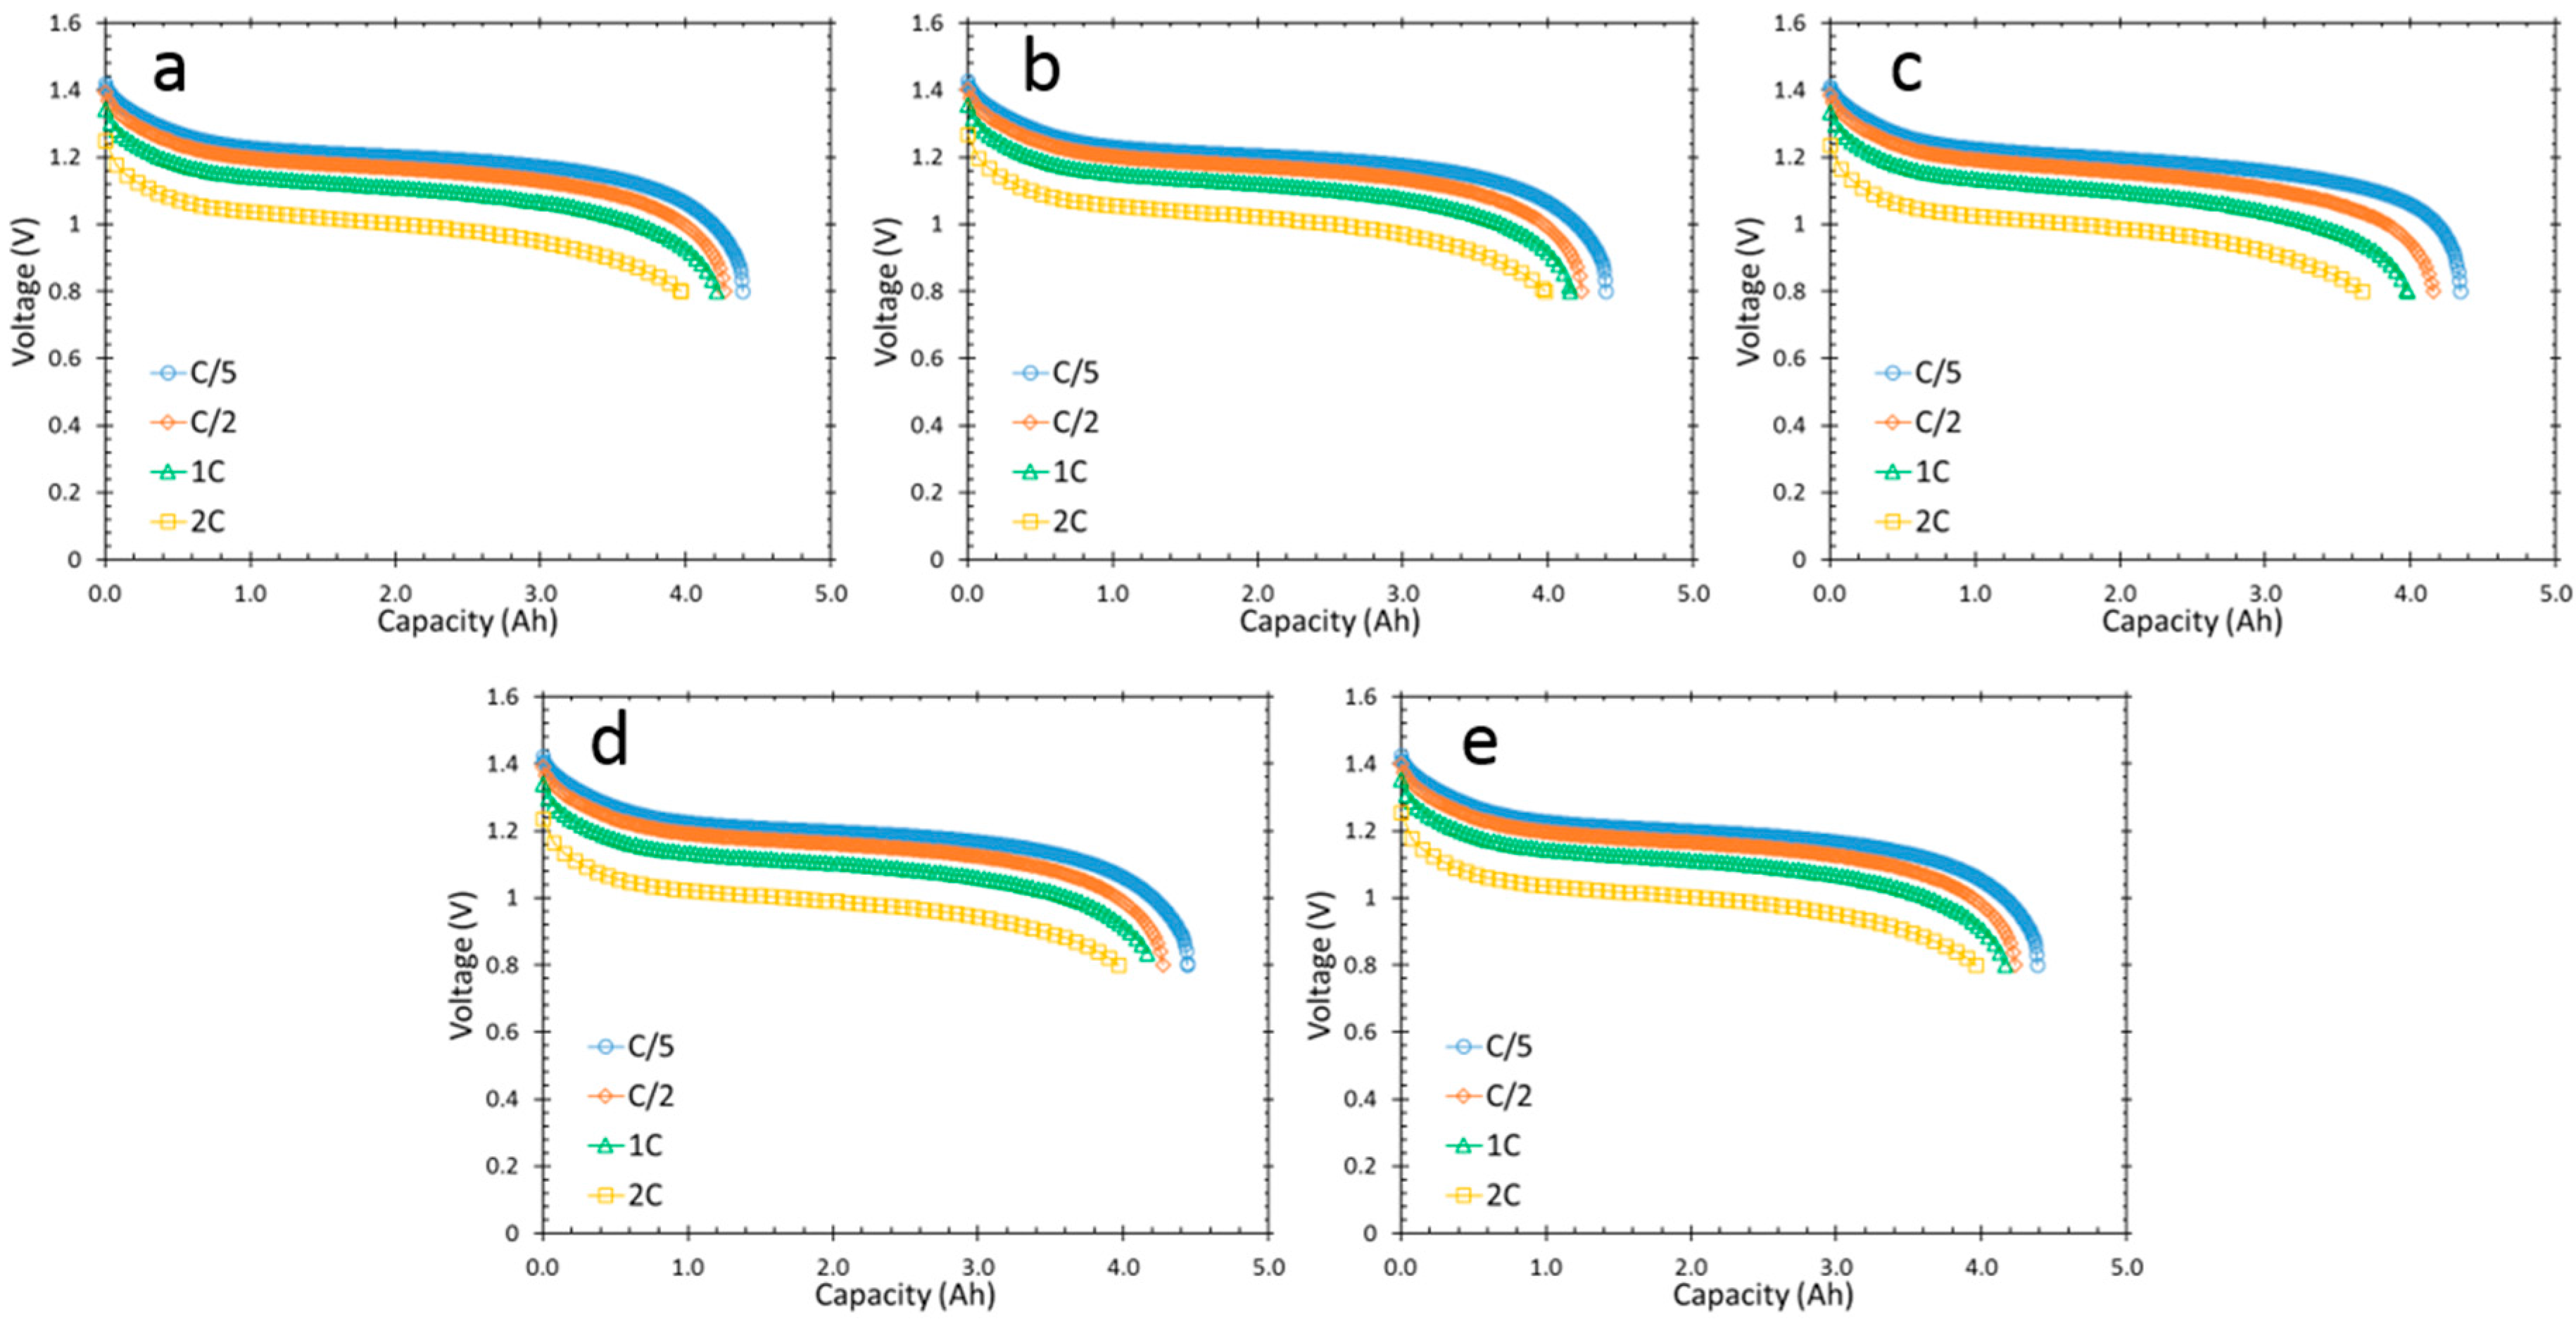
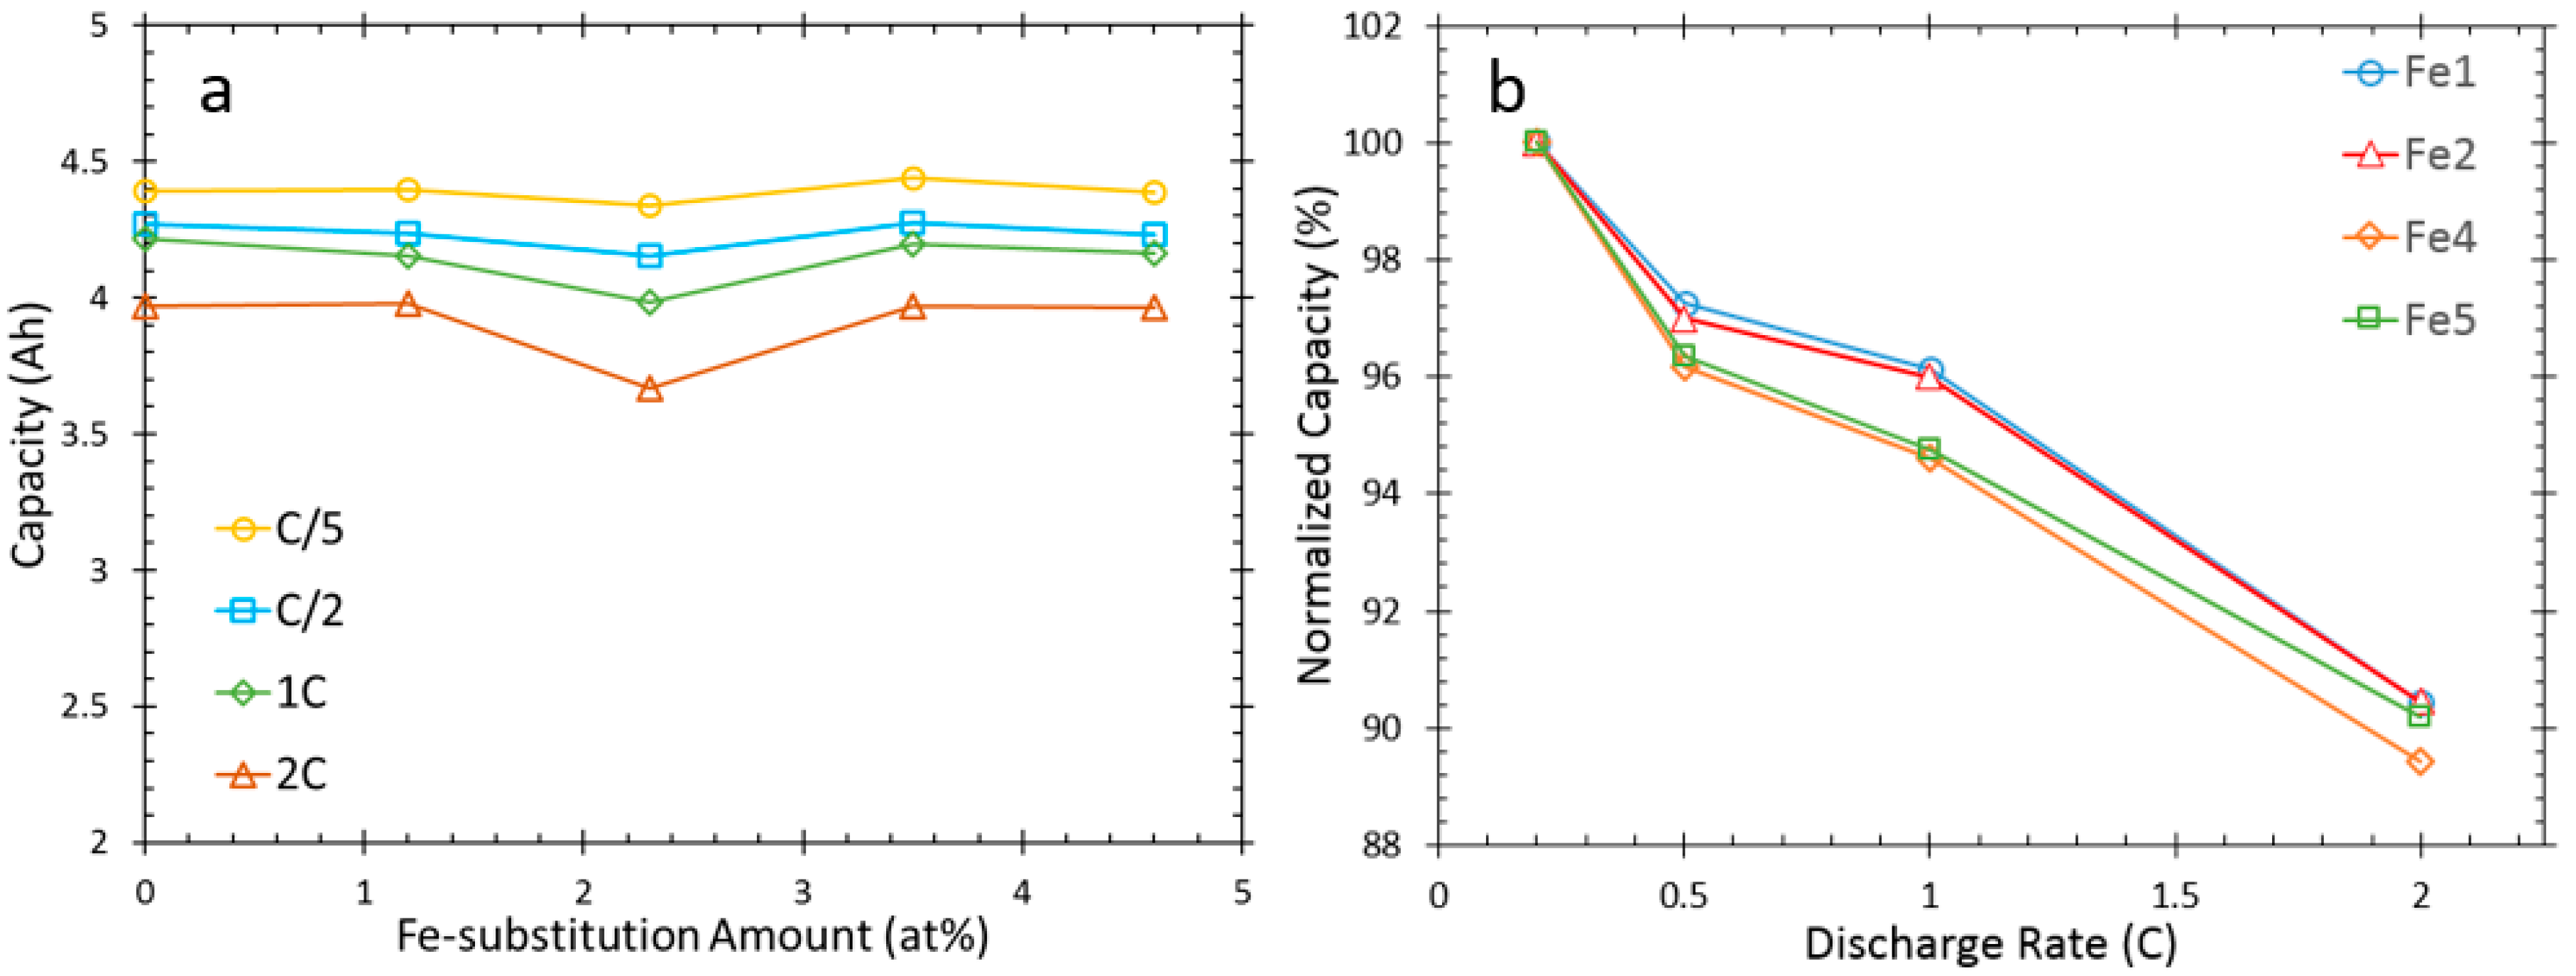
Full-cell test results for Fe1 to Fe5 measured at four different rates (C/5, C/2, 1C and 2C) and RT are shown in
Figure 1 and
Figure 2a shows the cell capacities as a function of the Fe-content of the alloy. At lower rates the five cells exhibit similar capacities; at a discharge rate of C/5, the capacities vary between 4.34 and 4.44 Ah; at a discharge rate of C/2, the capacities decrease to 4.16 to 4.27 Ah. Further increases in discharge rate result in lower capacities and all the samples demonstrate similar capacities at the same rate, except for Fe3 which has the lowest capacities among all alloys. As seen in
Table 1,
MS decreases with increasing Fe-content. Consequently, the surface catalytic capability weakens and high-rate performance deteriorates. The low capacities obtained for Fe3, especially at higher rates (1C and 2C), are due to decreased
MS. Although further increases in the Fe-content of the alloy leads to an even smaller
MS, the double-layer capacitance
C increases dramatically, indicating the existence of a much larger surface area for the higher Fe-content samples. The large surface area may compensate the loss of surface Ni clusters and lead to comparable capacities obtained at high Fe-content (Fe4 and Fe5).
It is difficult to establish a correlation between the cell capacity and Fe-content in the alloy from the RT capacity tests. Thus, the normalized capacities are compared in
Figure 2b with the focus on the Fe-free (Fe1), low-Fe (Fe2) and high Fe-content alloys (Fe4 and Fe5). The capacities at various rates are normalized for each sample by the capacity at C/5. At higher rates above C/5, Fe1 and Fe2 demonstrate better rate capability than Fe4 and Fe5.
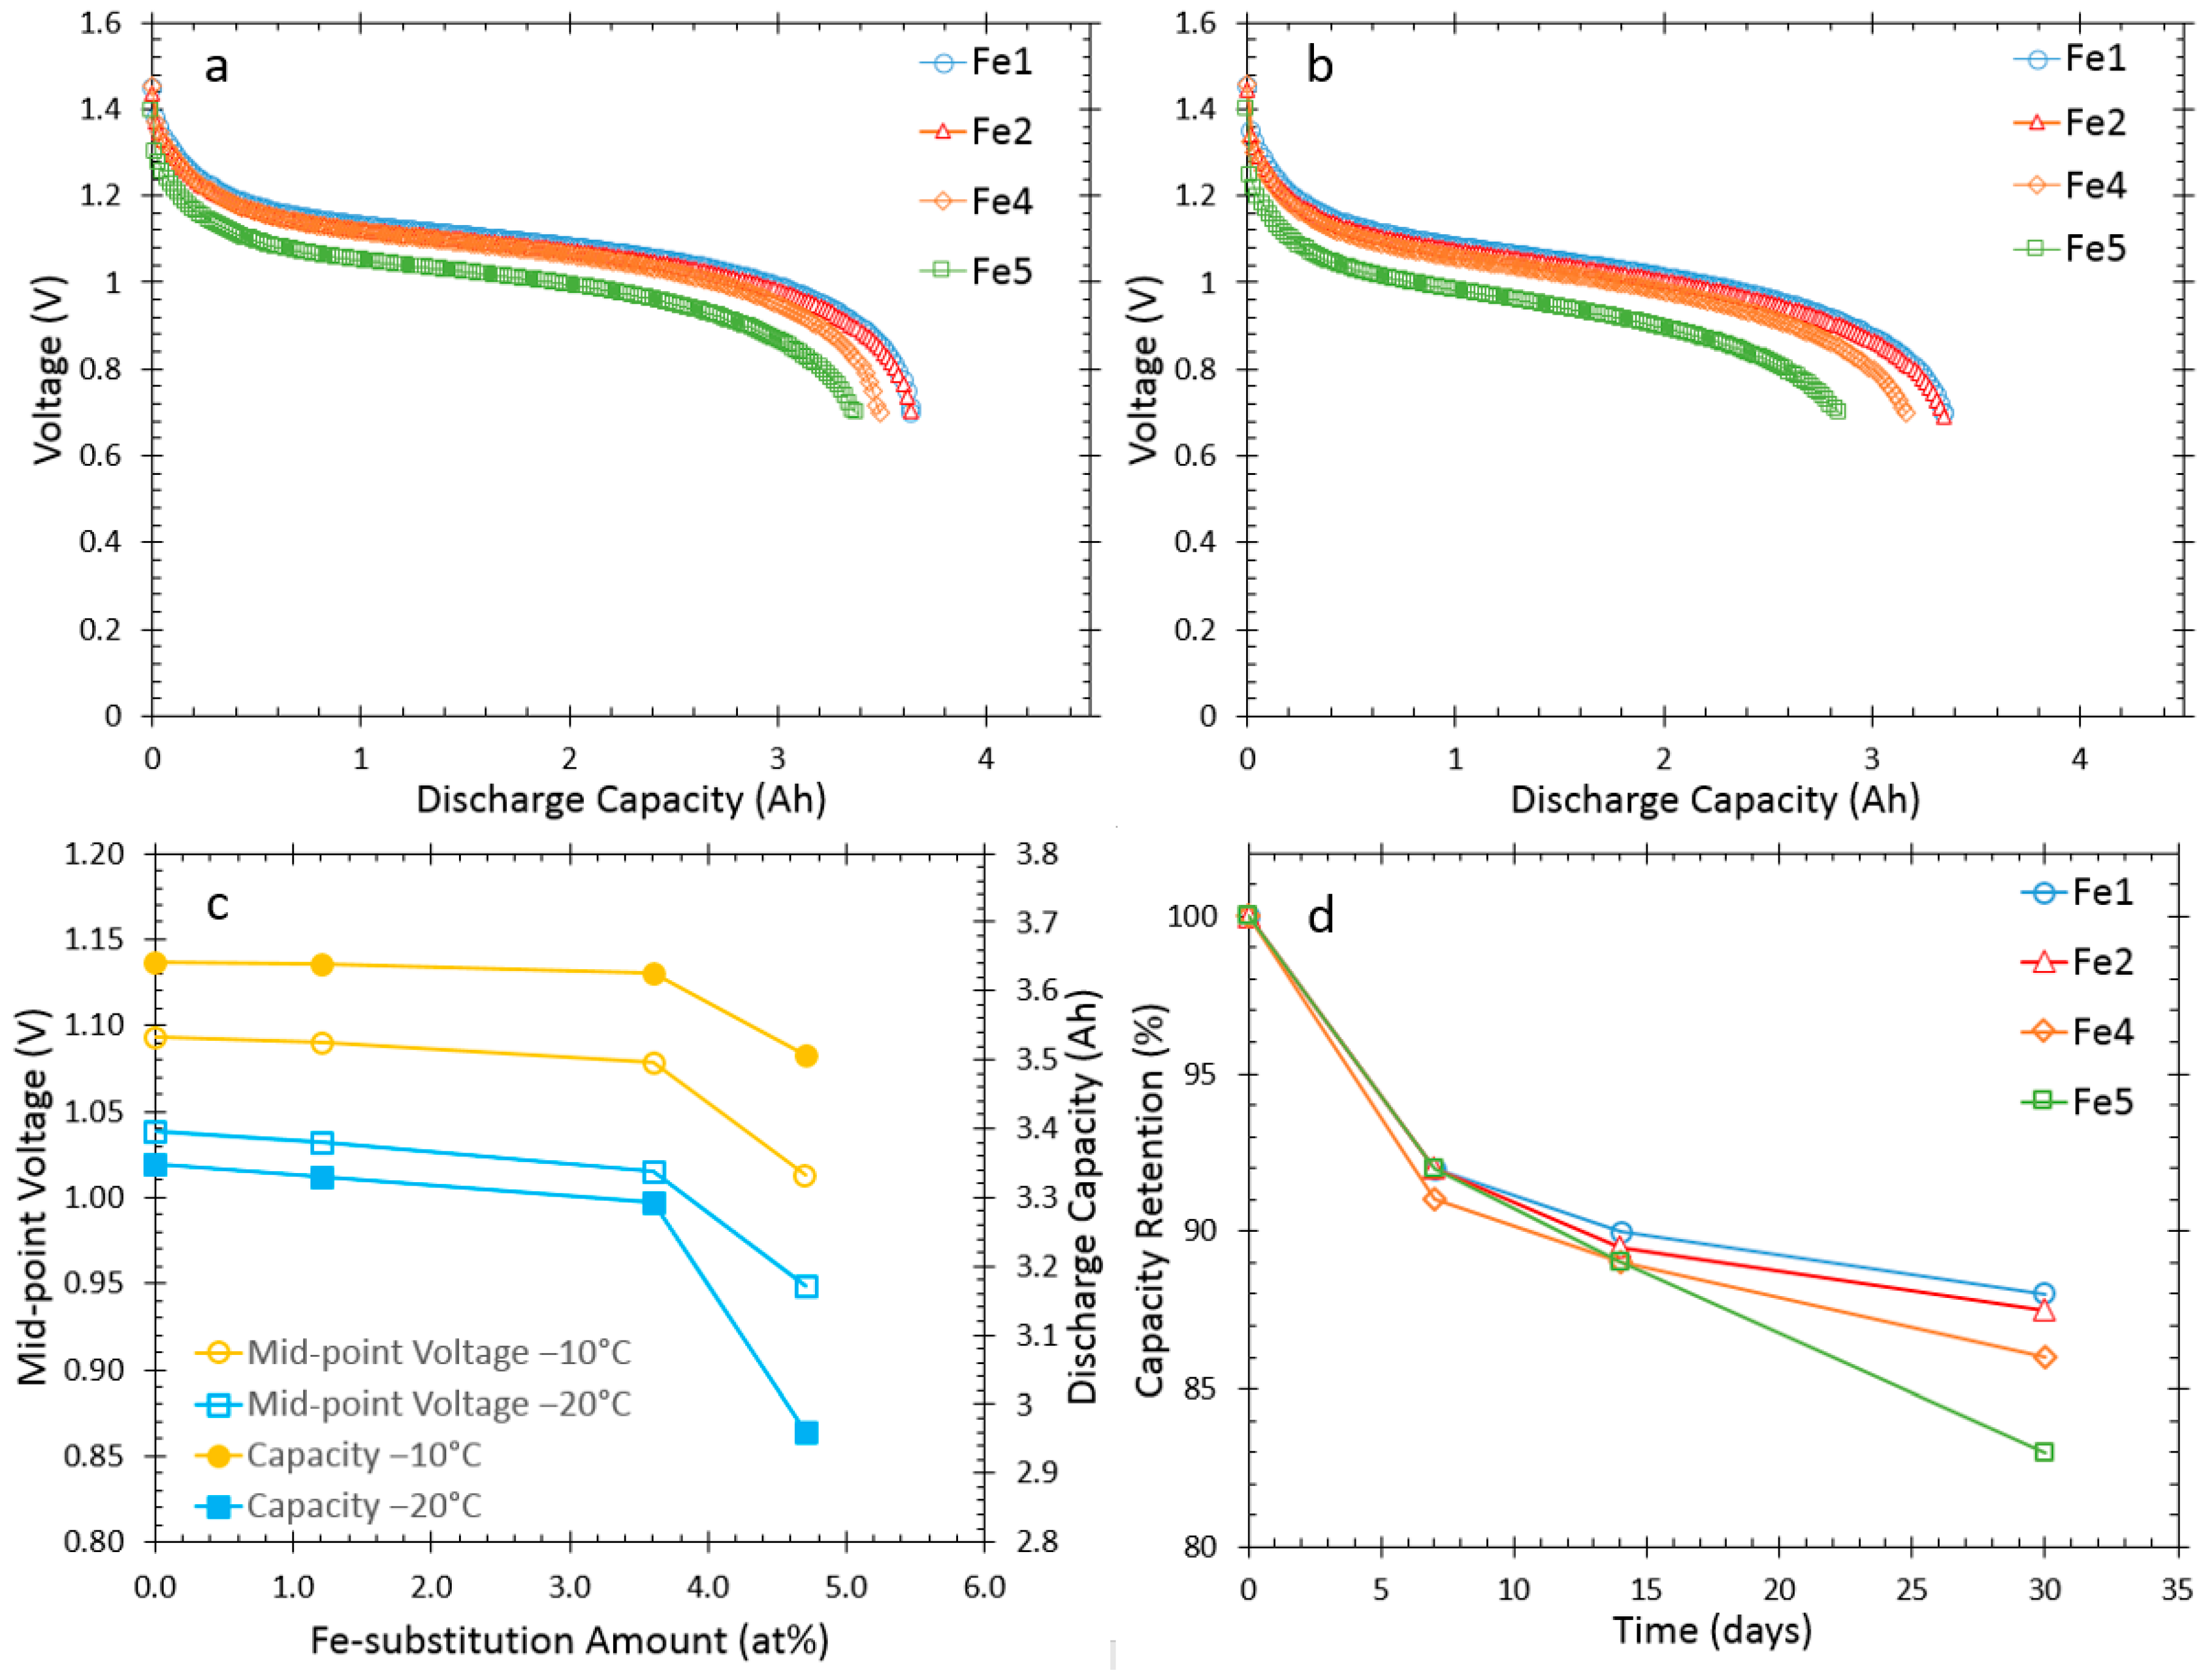
To further study the effect of the Fe-substitution on rate capability, the cells were tested at low temperatures (LT), specifically −10 °C and −20 °C. Discharge voltage curves for Fe1, Fe2, Fe4 and Fe5 at −10 °C and −20 °C are shown in
Figure 3a and b, respectively, and the details of discharge capacity and mid-point voltage are listed in
Table 2. A discharge rate of C/2 was used for the LT charge/discharge tests. Discharge capacities and mid-point voltages at −10 °C and −20 °C for Fe1, Fe2, Fe4 and Fe5 are summarized in
Figure 3c. The discharge capacity and mid-point voltage exhibit similar trends, mainly a slight decrease as Fe-content increases to 3.6% (Fe4) followed by a sharp decrease as Fe-content increases to 4.7% (Fe5). Fe5 shows inferior LT electrochemical performance when compared to the Fe-free cell (Fe1), with a 12% lower discharge capacity and a 9% lower mid-point voltage at −20 °C. Higher Fe-content leads to a lower discharge capacity and a lower mid-point discharge voltage, which is consistent with the general trends in AC impedance and magnetic susceptibility measurements reported in Part 1 [
10], where
RC (the product of charge-transfer resistance and double-layer capacitance, reflecting the surface catalytic capability) increases and
Ms decreases with increasing Fe-content in the alloy. In previous studies, Fe rendered positive and negative influences on the LT performance of AB
2 [
18] and AB
5 [
19] HAAs, respectively. The impact of the addition of Fe on the LT performance of A
2B
7 HAA is closer to that of AB
5 HAA.
Charge retention tests for Fe1, Fe2, Fe4 and Fe5 were performed at RT at the end of days 7, 14 and 30, and the results are shown in
Figure 3d. The charge/discharge rate used for the tests was C/5 and the capacities have been normalized by the original capacity. Cells Fe4 and Fe5, with higher Fe-content, exhibited lower capacity retention than Fe1 and Fe2 after 14 days. At the end of 30 days, capacity retention followed the trend of Fe1 (88%) > Fe2 (87%) > Fe4 (86%) > Fe5 (83%). Capacity retention properties of the Mn- or Co-substituted superlattice HAAs were studied previously. The capacity loss observed in the Mn-substituted HAAs was attributed to micro-shortages between the positive and negative electrodes caused by oxides of Mn and Zn [
20]. For the Co-substituted HAAs, the high corrosion rate of Co in the alkaline electrolyte resulted in capacity loss [
21]. The alloys in this study were designed based on a Co-containing superlattice HAA, and Fe1 has the same composition as C3 in [
21]. The lower charge retention for cells with high Fe-content HAAs indicates that, other than the corrosion of Co, there are other factors causing further reduction in capacity after storage. More severe oxidation in the Fe containing alloys may have a role in capacity loss as well, which was observed by SEM/EDS and will be presented in the failure analysis section. Fe improved the charge retention properties of AB
2 [
18] HAAs and deteriorated those of AB
5 [
19] HAAs. Similar to LT performance, the effects of Fe for A
2B
7 HAA are similar to those for AB
5 HAA with regard to charge retention performance.
3.3. Cycle Life and Peak Power
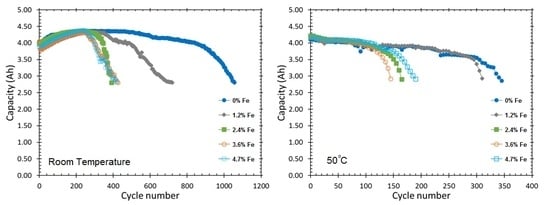
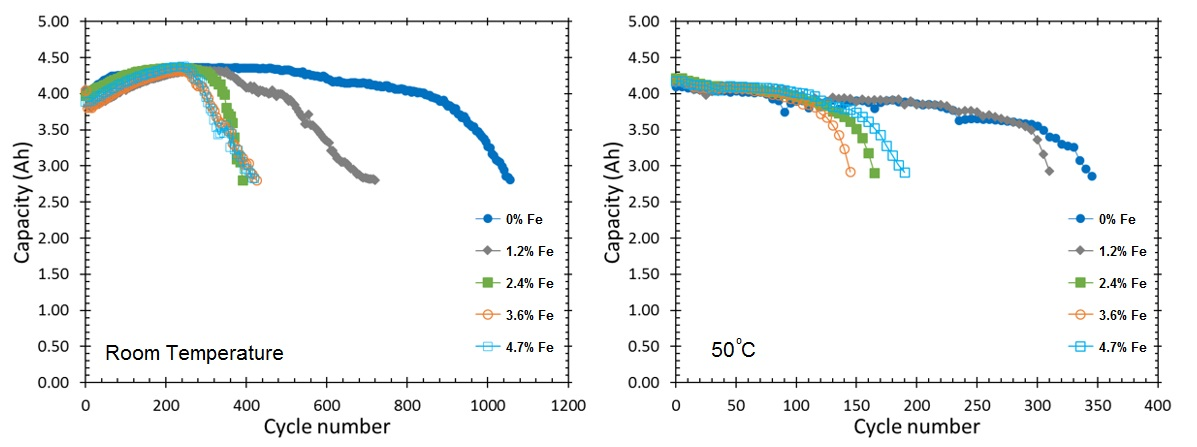
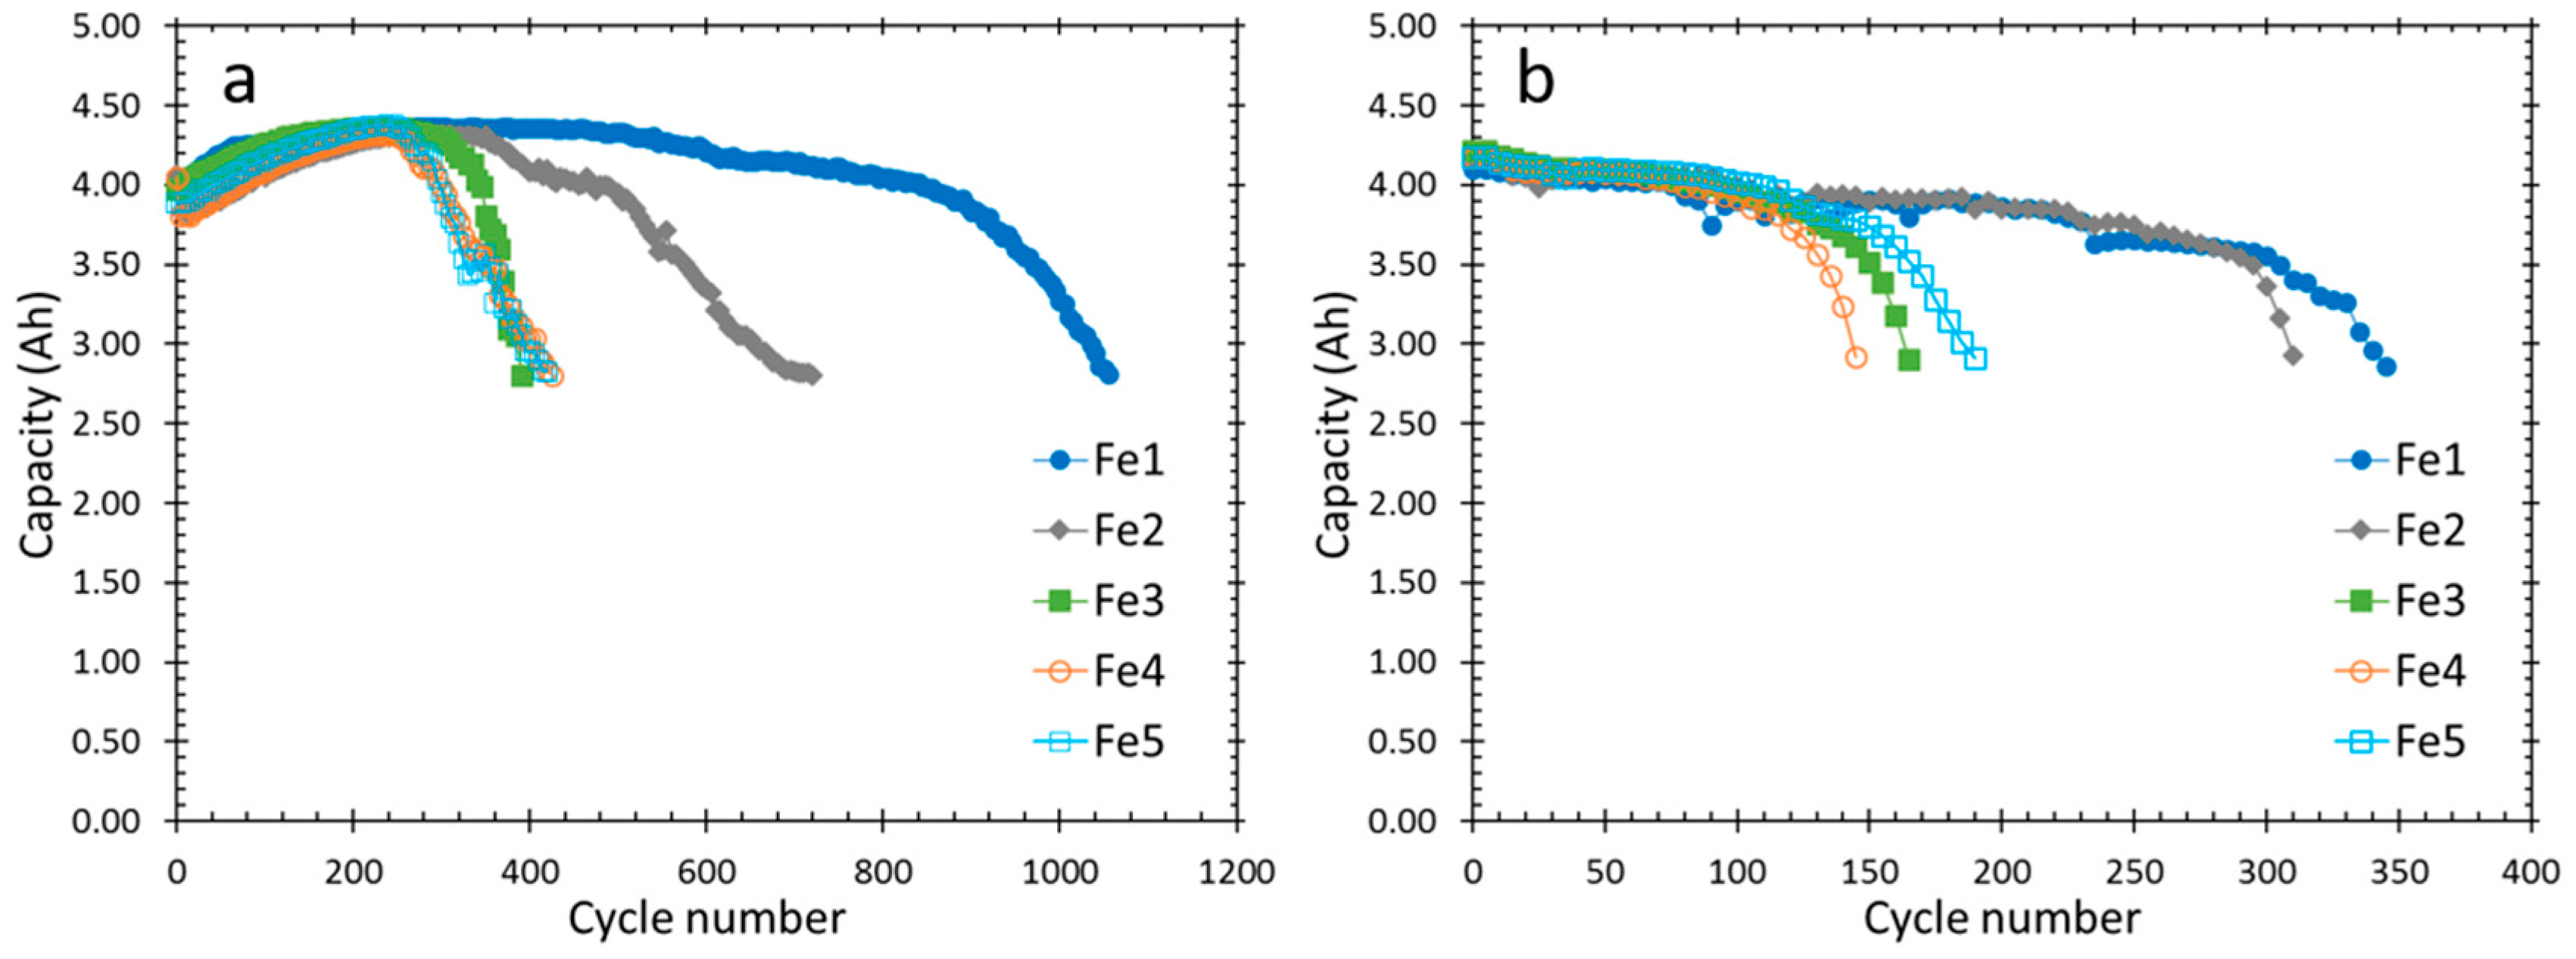
Cycle life performances of cells Fe1 to Fe5 were measured at RT and 50 °C. Results are shown in
Figure 4 and summarized in
Table 3. The charge processes were terminated when the cells reached 105% state-of-charge (calculated based on the initial discharge capacity) and the discharge process was finished at a cutoff voltage of 0.9 V. A rate of C/2 was used for both the charge and discharge processes. At RT, the Fe-free cell (Fe1) showed the highest cycle life—1055 cycles. Cycle life decreases dramatically with increasing Fe-content. Fe2 contained 1.2 at% Fe and demonstrated a cycle life of 720. When the Fe-content increased to 2.4 at% (Fe3) and above (Fe4 and Fe5), cycle life dropped to approximately 400 cycles. At 50 °C, the cycle life performances of all cells were greatly reduced, but exhibited a similar trend increasing Fe-content in the alloy. Fe1 showed a cycle life of 345, while cells with high Fe-content HAAs (Fe3, Fe4 and Fe5) demonstrated cycle numbers of less than 200. The accelerated capacity degradation at a temperature above 50 °C is common for HAA and can be attributed to higher degrees of oxidation, leaching and poisoning of the positive electrode [
22,
23]. The rapid deterioration in cycle life caused by increasing Fe-content in A
2B
7 HAAs was seen previously in AB
5 HAAs [
19].
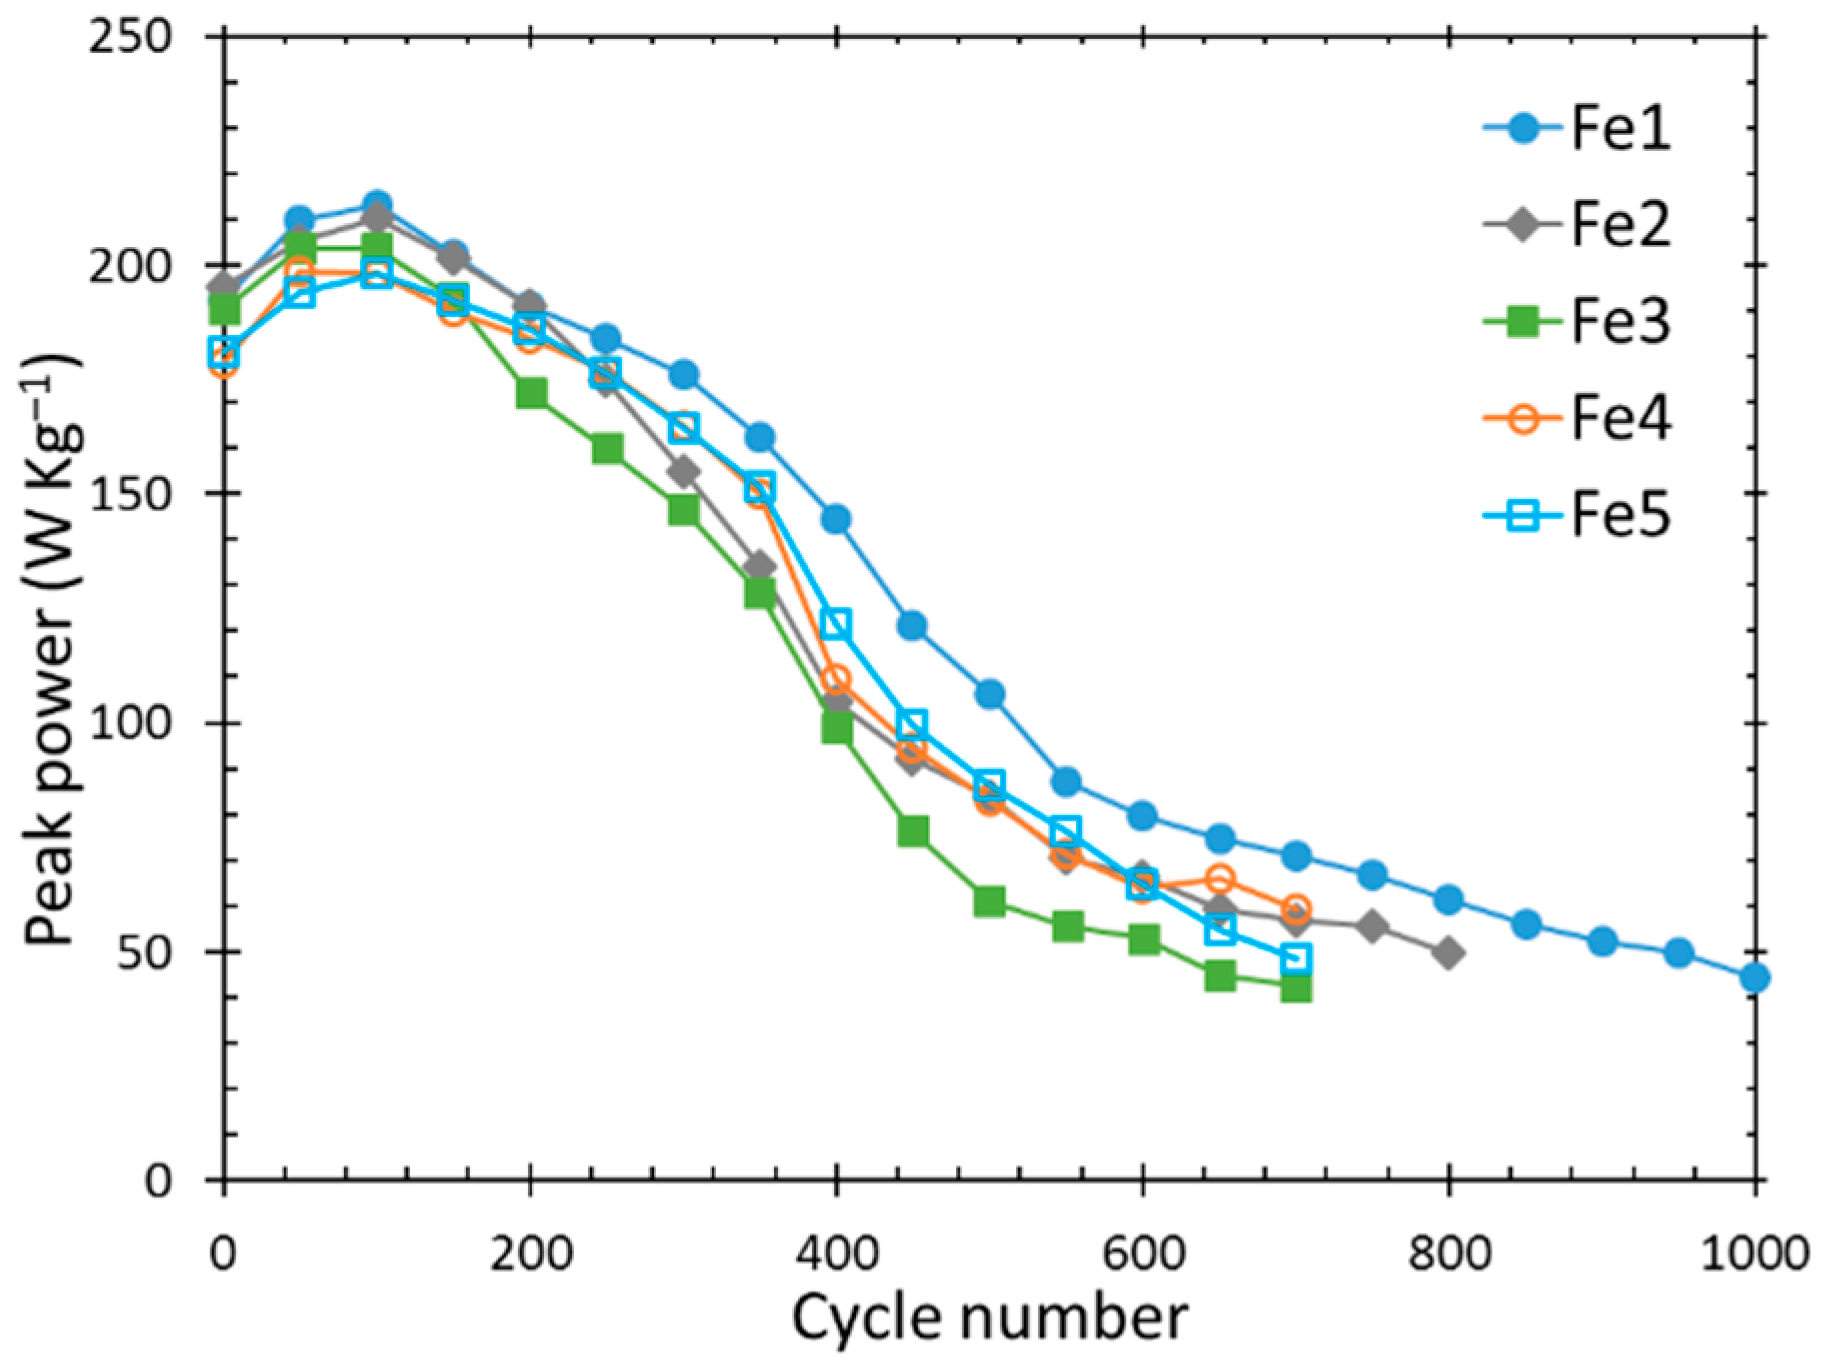
The peak power of cells Fe1 to Fe5 was measured every 50 cycles at 50% DOD and RT. The results are shown in
Figure 5 and the initial peak power data is listed in
Table 3. Details of the testing method can be found in our previous studies on Mn- and Co-substitutions in A
2B
7 [
6,
8]. During early cycling, cells with high Fe-content HAAs (Fe4 and Fe5) show lower peak power values than those with the Fe-free (Fe1) and low Fe-content HAAs (Fe2 and Fe3). After 200 cycles, there was a clear trend as the peak power first decreases and then increases as Fe-content increases, with Fe3 showing the lowest peak power. Fe1 demonstrates the best power stability among all the tested cells, which was consistent with its superior cycle stability (
Figure 4). The trend of peak power change with the Fe-content was consistent with the findings regarding RT rate capability (
Figure 2a), since the peak power also depends on surface catalytic capability and the surface area of the HAA. Fe3 has a much lower amount of catalytic Ni clusters compared to Fe1 and a much smaller surface area than Fe4 and Fe5, which results in its low peak power.
3.4. Failure Analysis
After cycle life tests, the cells were taken apart and their failure modes were studied by SEM, EDS and ICP. SEM backscattered electron images (BEIs) of the positive electrodes from cells Fe1 to Fe5 cycled at RT are shown in
Figure 6. EDS was performed to measure the average chemical composition across a clean region without Ni foam, at 1000× magnification. The chemical compositions of the cycled positive electrodes were measured by EDS and are listed in
Table 4.
The most noticeable composition changes in the positive electrodes include the decrease in Al content and increase of Co content as the Fe-content in the alloy increases. The original positive electrode is Al free and the only Al source in the cell is the negative electrode. It has been reported that Al can leach from Co substituted superlattice HAAs and higher Co contents result in a higher degree of Al leaching [
8]. However, Al is essential to superlattice HAA due to the ability to stabilize the structure against amorphization [
24]. The alloys in this study contain 4.7 to 4.8 at% Co, which contributes to a high Al content (3.2 at%) in the cycled positive electrode of the cell with the Fe-free alloy (Fe1). As the Fe-content of the alloy in the negative electrode increases, the Al content in the heavily cycled positive electrode decreases to 2.1 at% for Fe5. Meanwhile, the Co content in the positive electrode increases from 18.0% to 20.2%. Therefore, Fe-substitution inhibits the leaching of Al from the superlattice HAA, but promotes the leaching of Co from the same place. Since the evolution of the Al and Co leaching are inversely correlated with the Fe-content, they eliminate the possibility of linking higher Al content to higher cycle number in cells with low Fe-content HAAs. Moreover, it is well known that the addition of Al in the positive electrode promotes the formation of
α-Ni(OH)
2, which has a higher specific capacity than the initial
β-Ni(OH)
2 [
25]. However, the volume expansion caused by the
β to
α phase change leads to the swelling of the positive electrode [
26]. Upon cycling, the developed stress may cause cracking and pulverization, which will eventually terminate cell activity. This is the reason
α-Ni(OH)
2 inhibitors, such as Zn or Cd, are added to ensure a long cycle life [
27,
28,
29,
30]. Since Fe-substitution can inhibit leaching of Al from the negative electrode and, in turn, the formation of
α-Ni(OH)
2, higher Fe-content is ideally beneficial to cycle life performance. However, the cycle life test presents the opposite result, specifically higher Fe-content leads to shorter cycle life. Furthermore, the SEM micrographs in
Figure 6 show that the spherical Ni(OH)
2 particles are in good shape for all cycled samples and no obvious swelling or pulverization is observed. The effects of Al leaching from the negative electrodes is not observed. Therefore, it is unlikely that the shortened cycle life of Fe3 to Fe5 is caused by the degradation of the positive electrode.
The chemical compositions of the cycled negative electrodes were measured using ICP and the data is listed in
Table 5. After cycle testing at RT, the composition of each negative electrode does not change significantly compared to that of the original HAA powder (data shown in
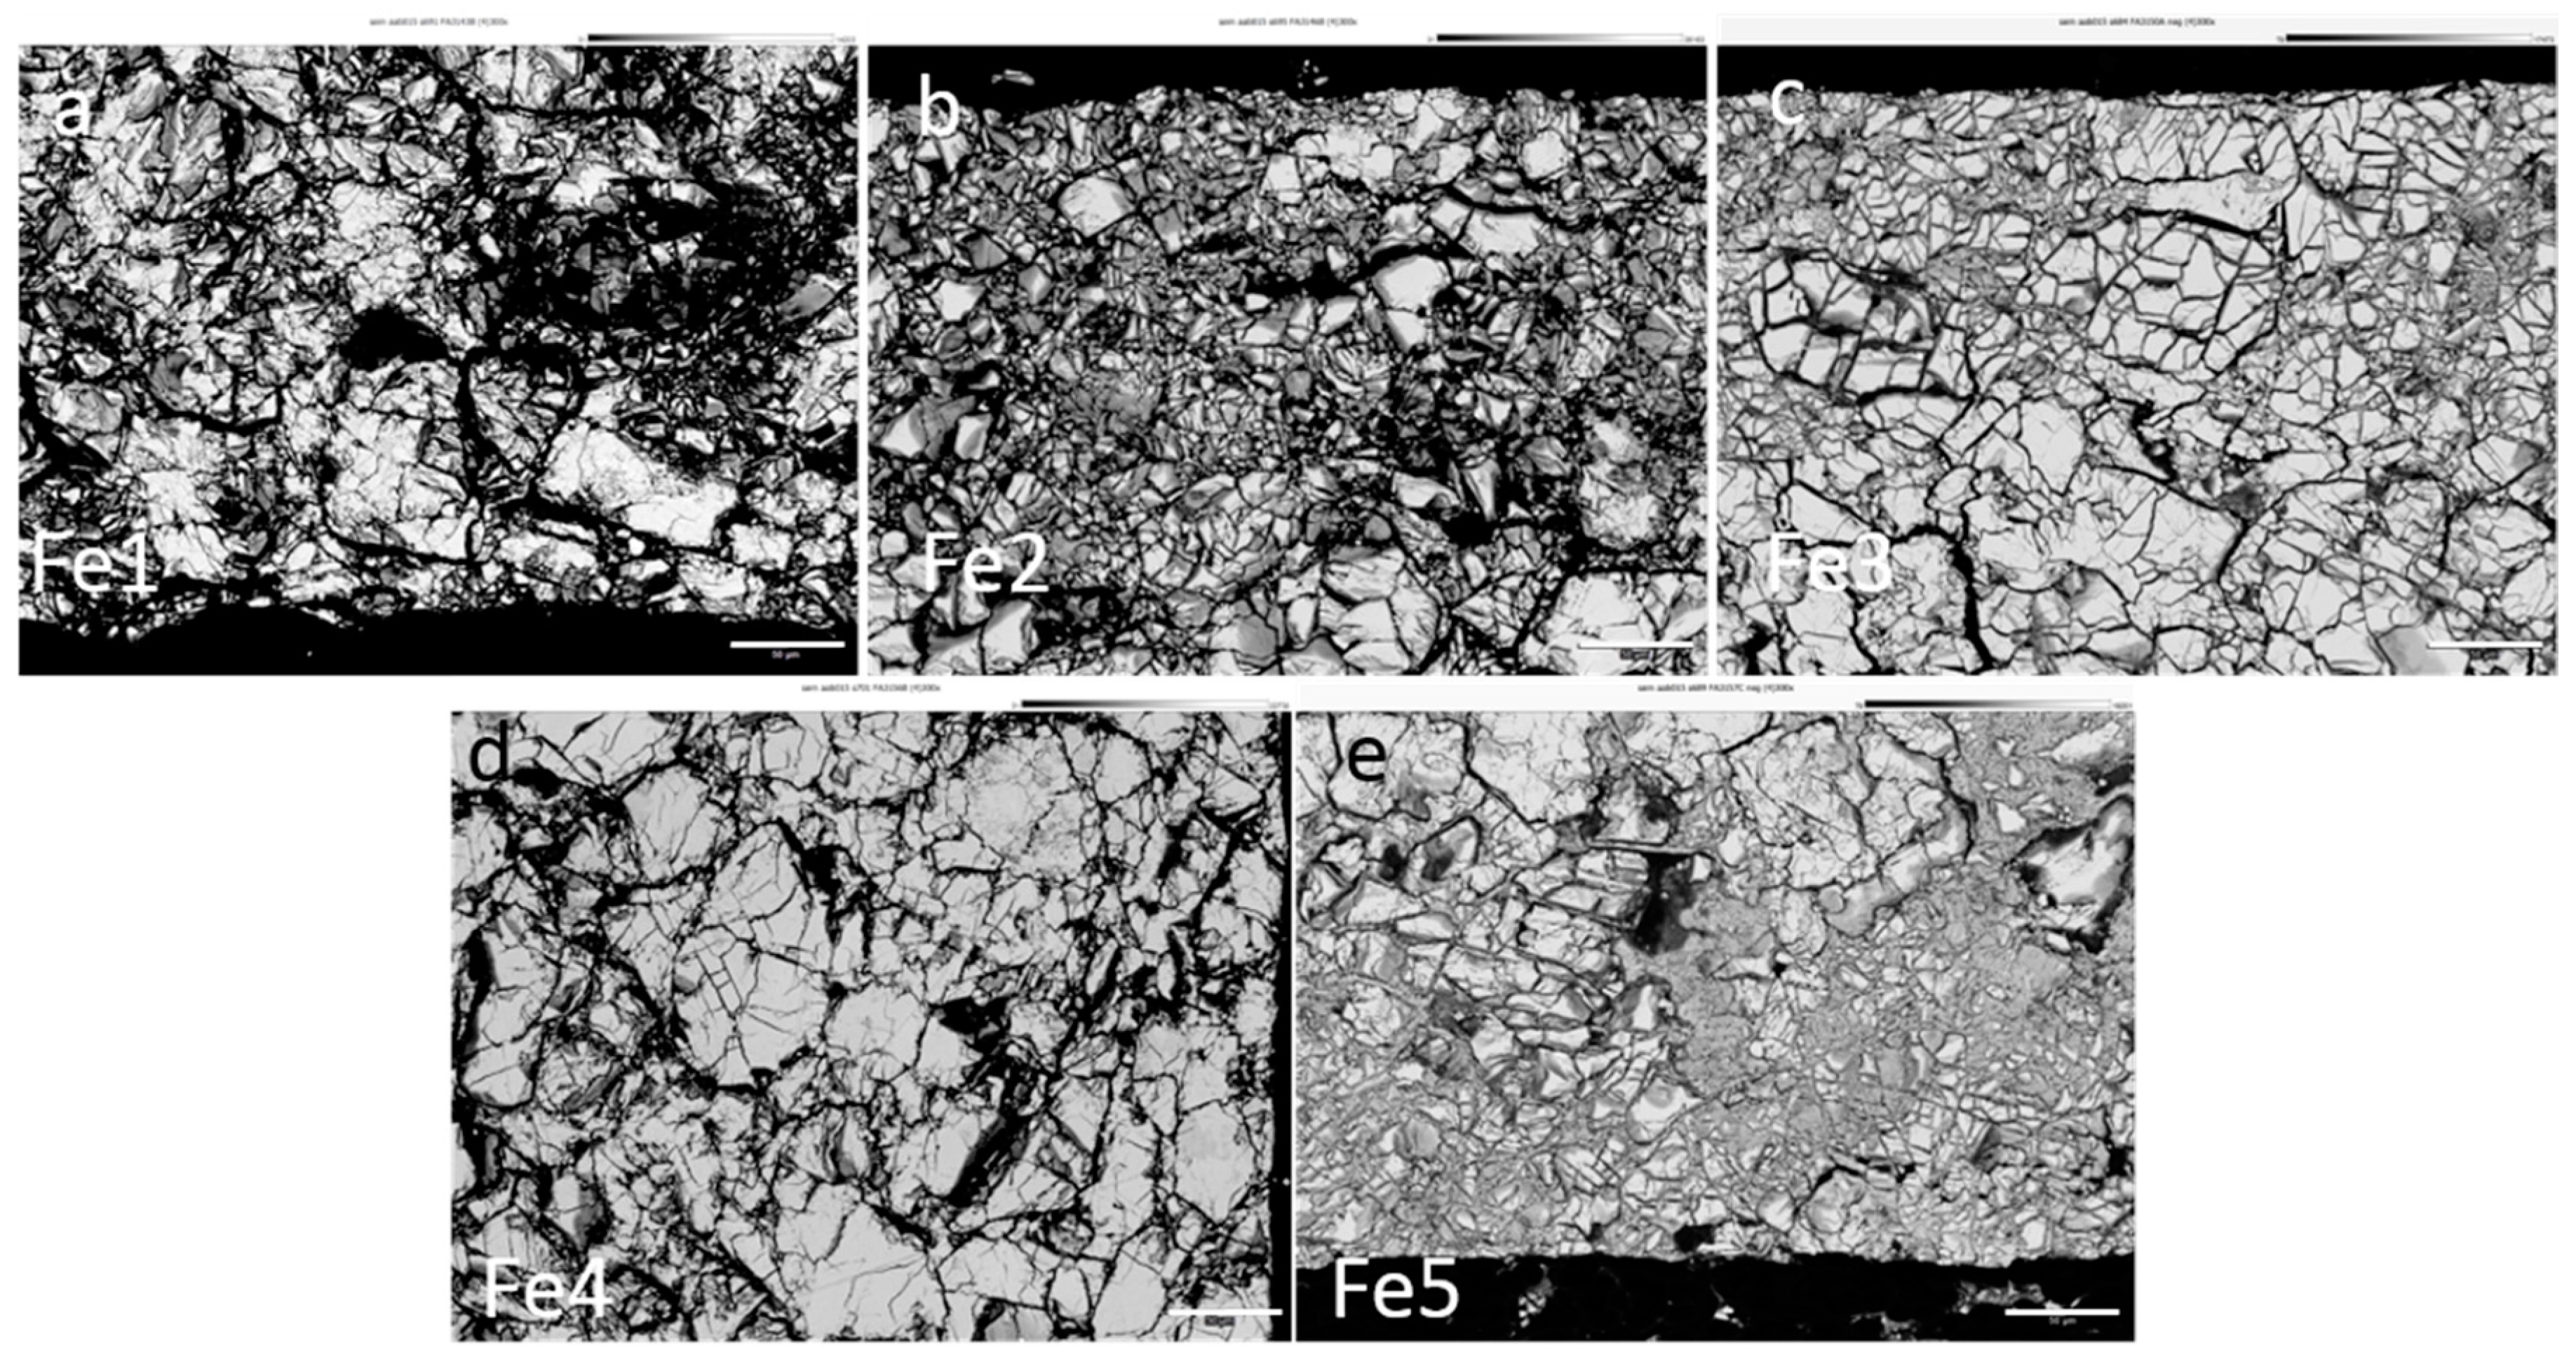
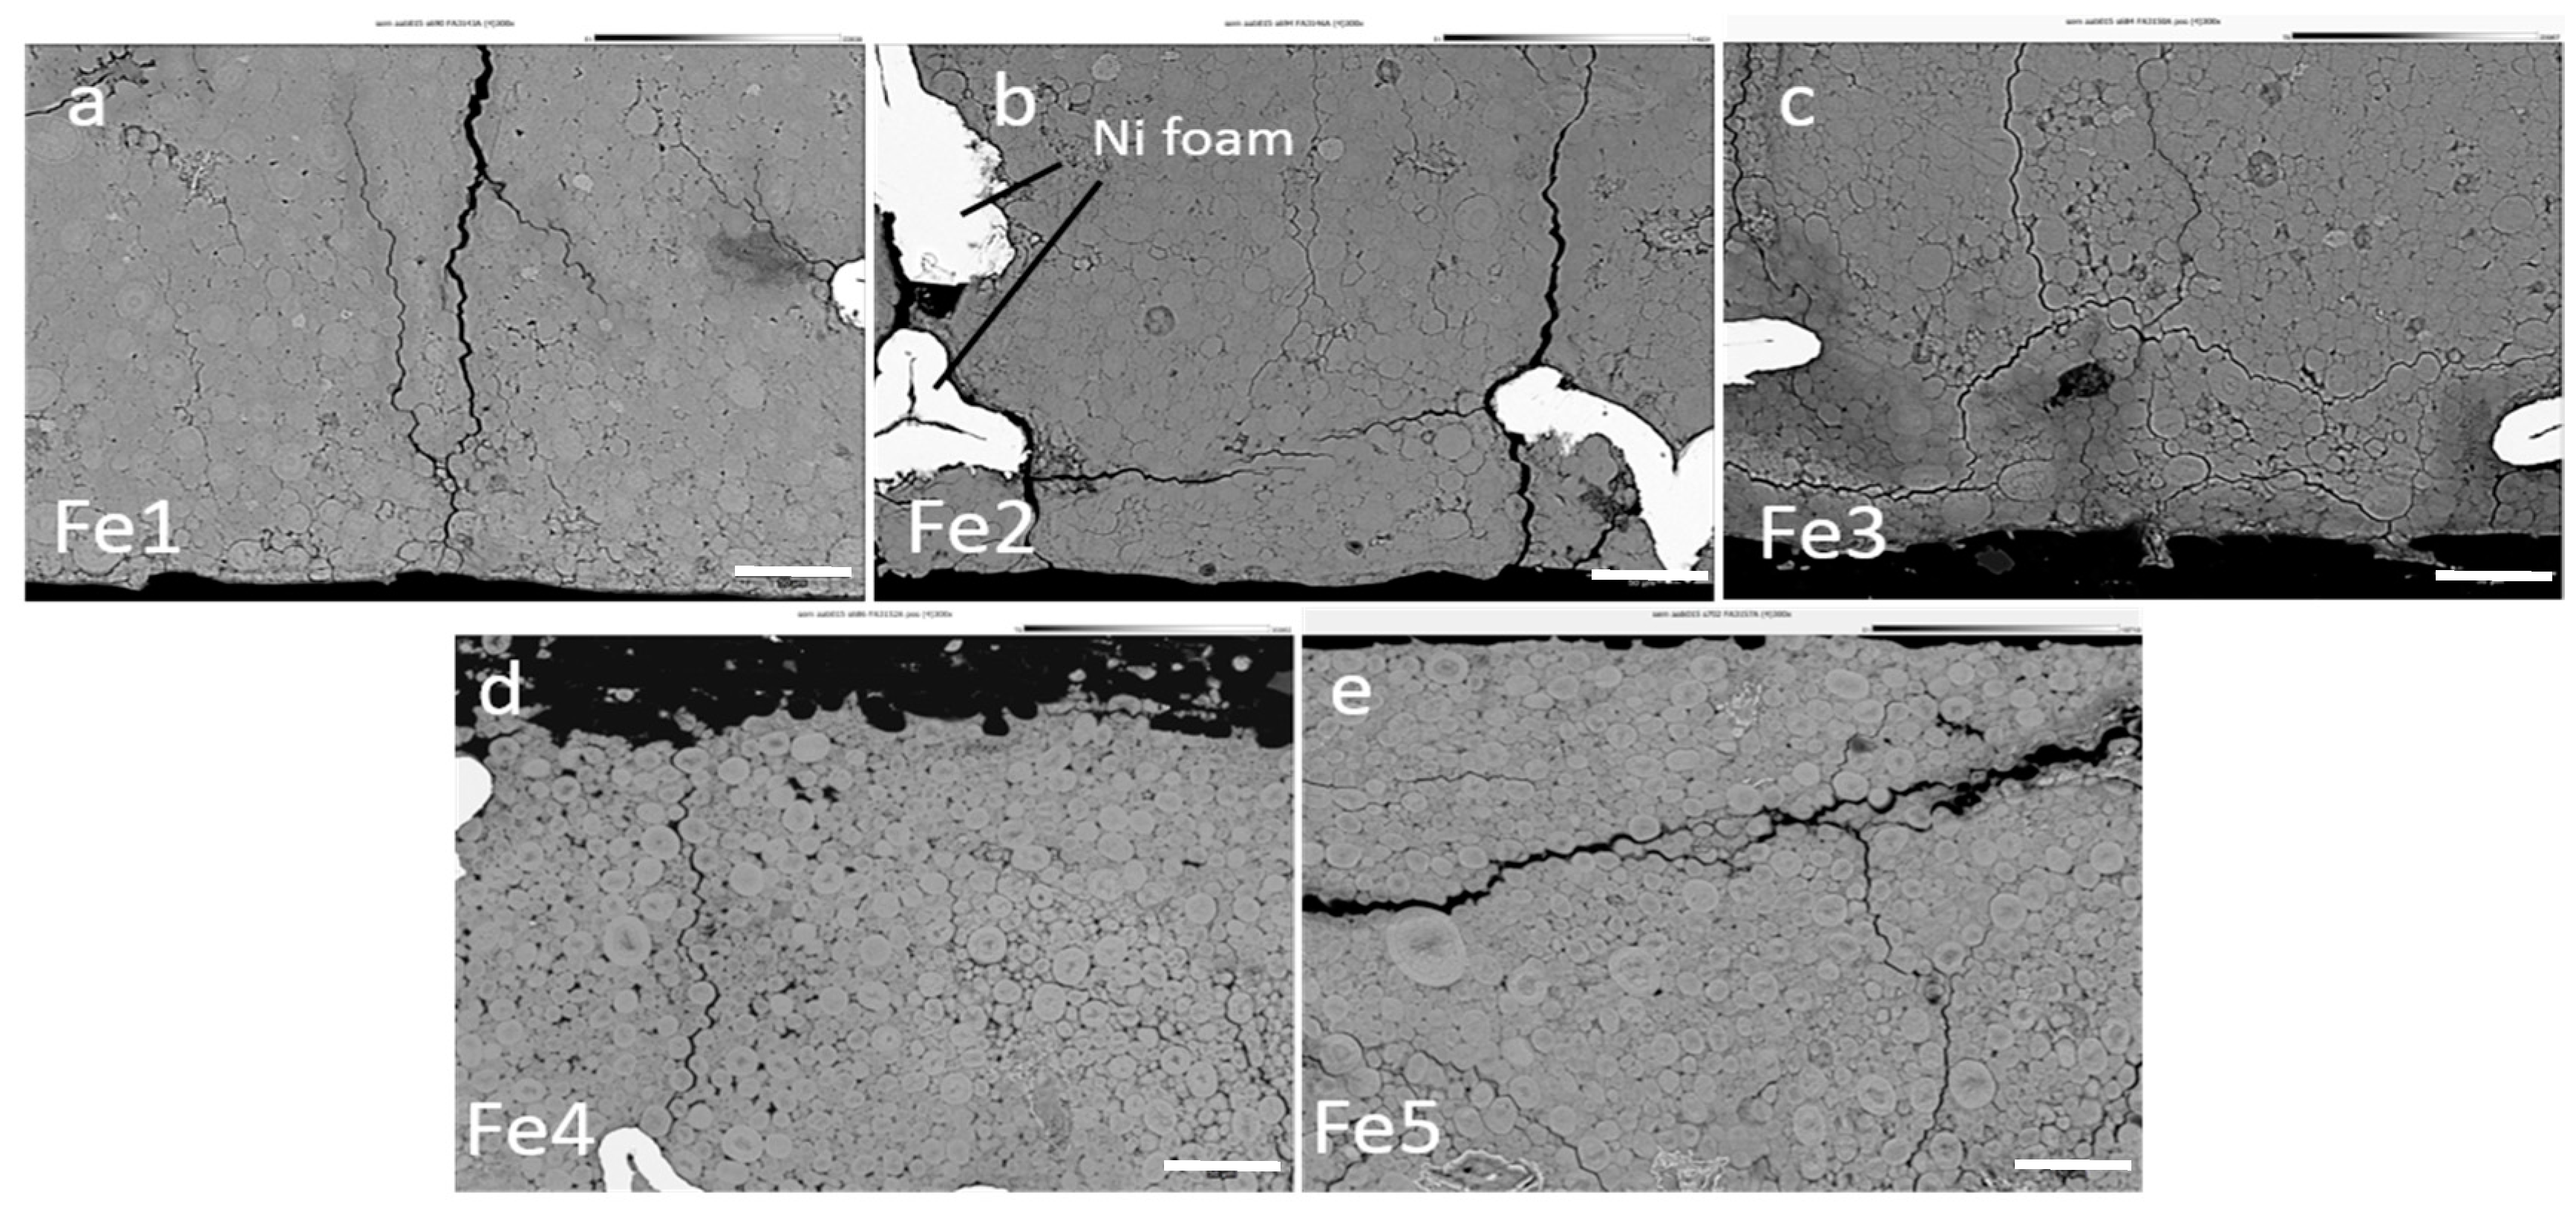
Table 1 in Part 1) except that the Al content in all the samples decreases by nearly 1%, which results in a corresponding increase in Al in the positive electrodes. The increase of the Fe-content and decrease of the Ni content from Fe1 to Fe5 occur by alloy design. The SEM BEI micrographs of the cycled negative electrodes from cells Fe1 to Fe5 are shown in
Figure 7. The cycled Fe1 (
Figure 7a) exhibits severe pulverization and the HAA particles break into smaller pieces and gradually lose electrical connections to the current collector, which is a common failure mode for Ni/MH batteries [
22,
31,
32]. Fe2 also suffers from severe pulverization, as shown in
Figure 7b. In addition, the large darker grey colored area indicates that oxidation occurs around the pulverized HAA particles, which was confirmed by spot EDS measurements. The oxygen content in the grey area varies between 34 to 54 at%, as measured by EDS. Fe3 to Fe5 exhibit much shorter cycle life performances than Fe1, and their SEM BEI micrographs (
Figure 7c–e) do not show signs of severe pulverization. The large HAA chunks do not appear to break into pieces and still occupy the largest portion of the surfaces. Instead, the large grey areas observed in Fe3 to Fe5 suggest severe oxidation, which was also confirmed by EDS measurements. For Fe5, the grey area occupies the majority of the image, indicating that severe oxidation occurred in all the samples. Pressure-composition-temperature (PCT) hysteresis, a strong indicator for the inclination for HAA pulverization [
33], for this series of alloys [
10] does not support the direct link of degree-of-pulverization to the Fe-content. The heavy pulverization found in cells with Fe-free or low-Fe-content HAAs is due to the large number of cycles.
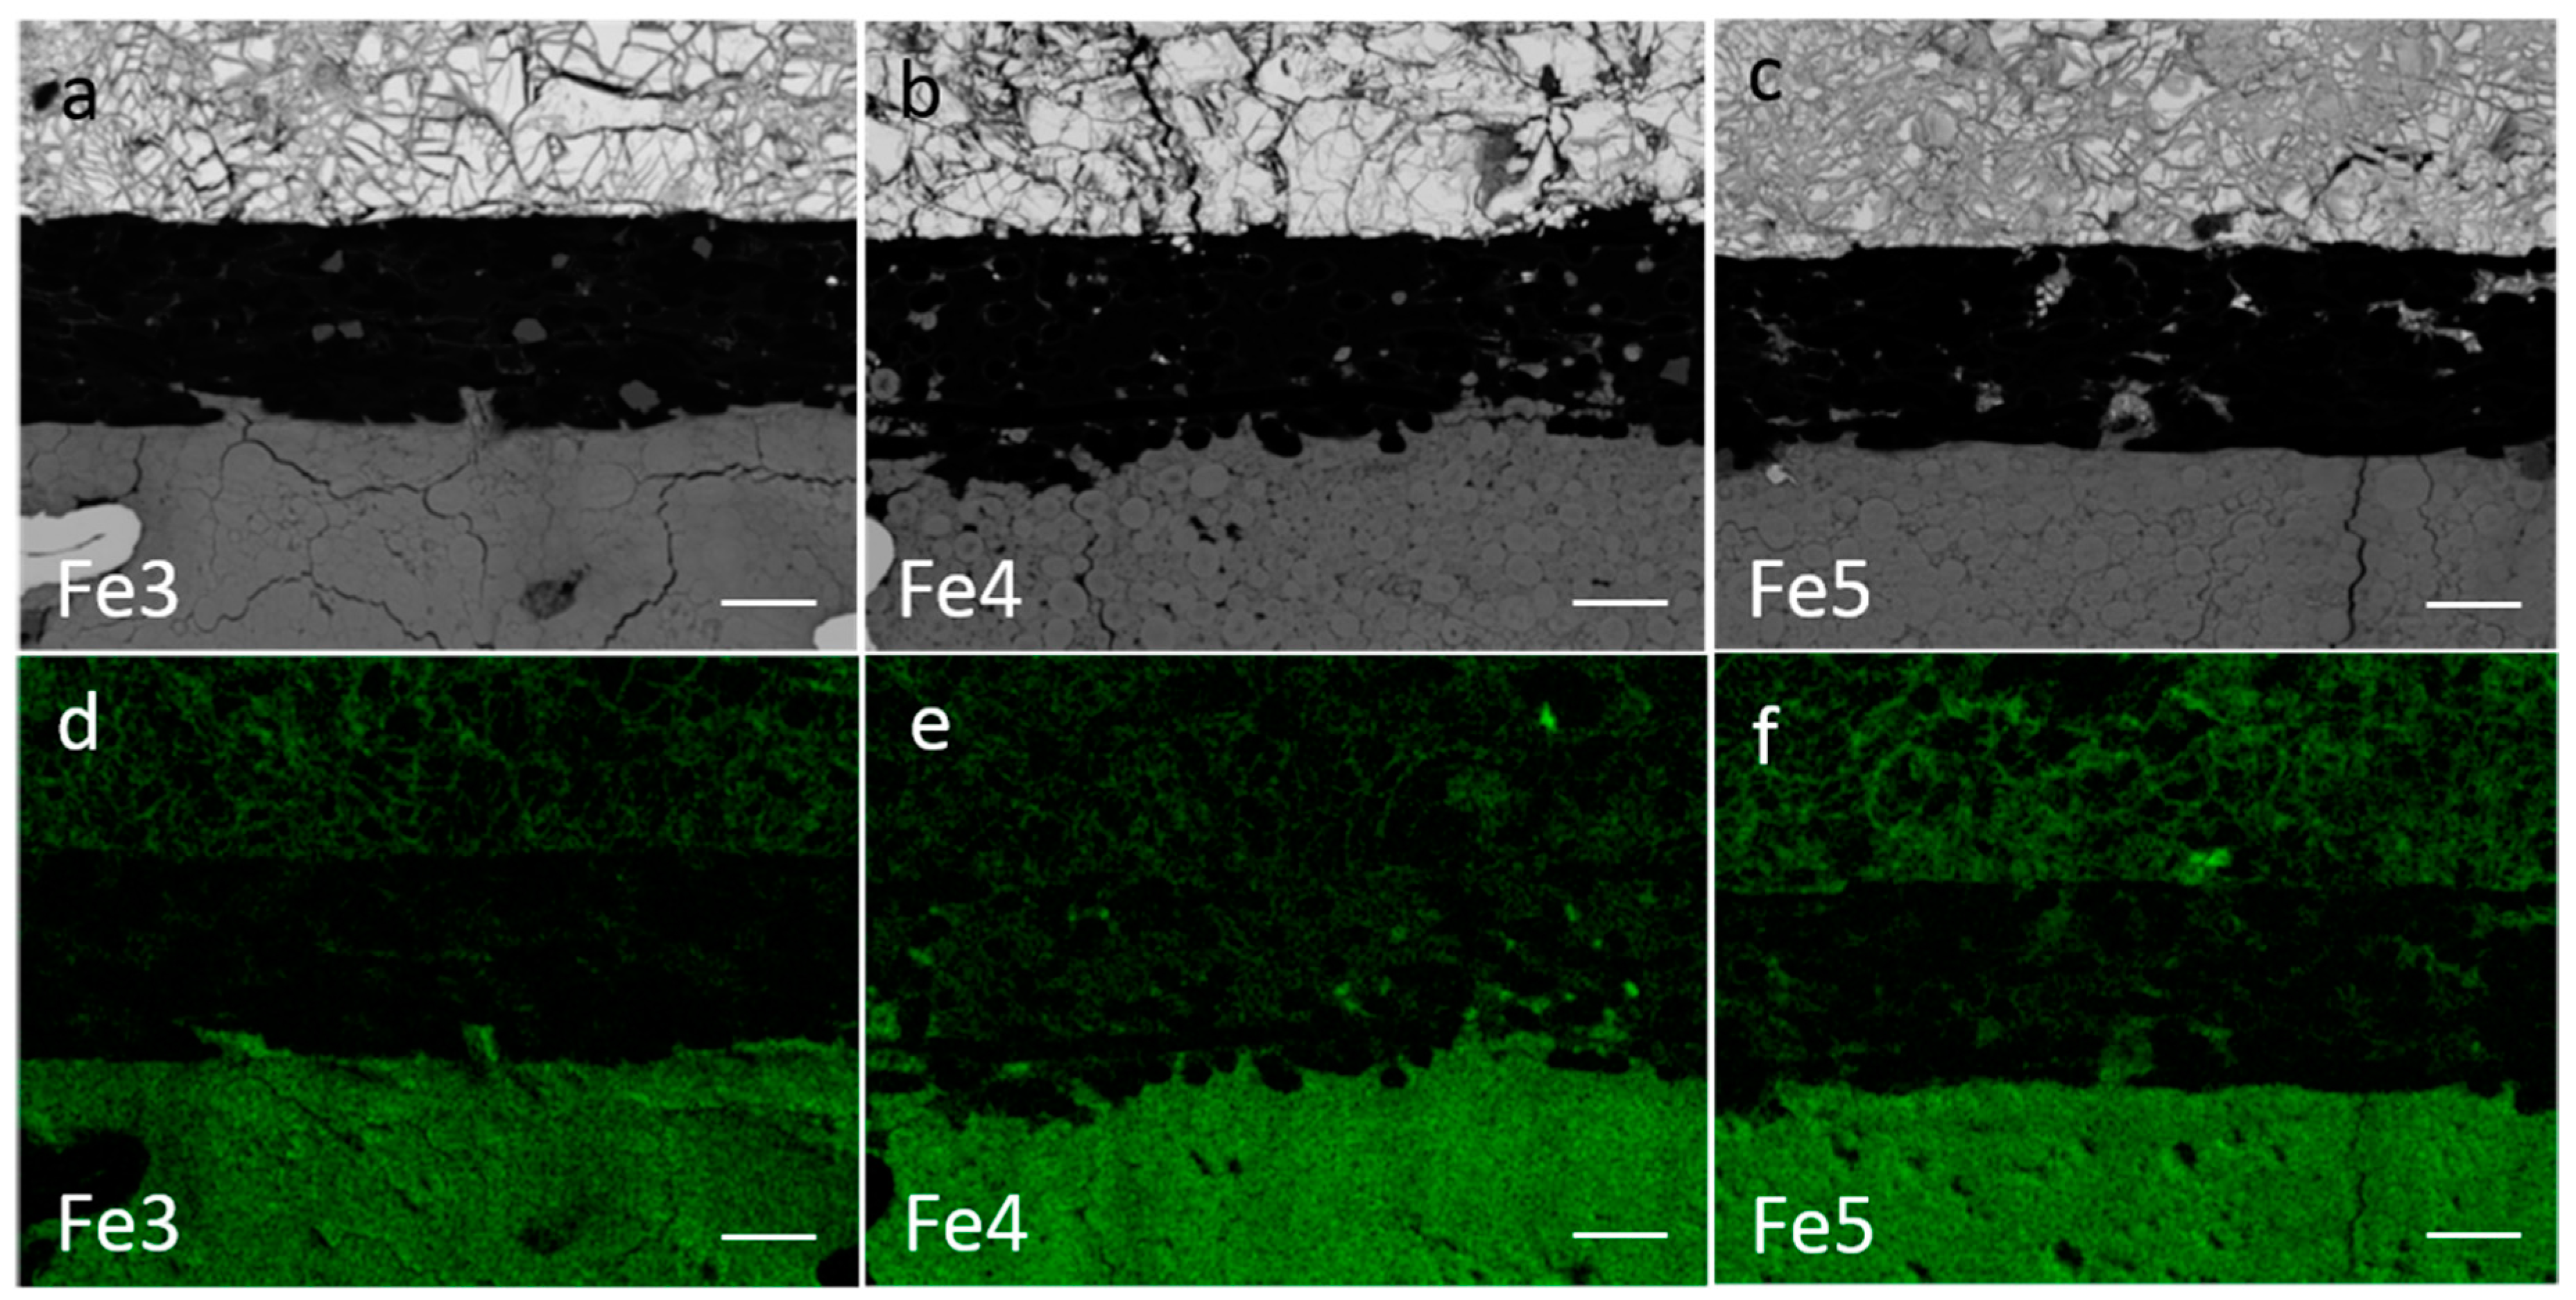
SEM/EDS analyses were used to study the cross-section of the positive electrode/separator/negative electrode sandwich structure of the heavily oxidized Fe3 to Fe5 after cycle life testing at RT. The SEM BEI micrographs are shown in
Figure 8a–c and their corresponding oxygen-EDS (O-EDS) micrographs are presented in
Figure 8d–f. Each figure, from top to bottom of the sandwich, consists of the negative electrode, separator and positive electrode. The O-EDS mappings for Fe3 and Fe4 indicate that the oxidation of the negative electrode occurs mainly around the particle/grain boundaries, while Fe5—which has the highest Fe-content—exhibits a heavily oxidized surface across the negative electrode. This finding is consistent with the SEM BEI study above, confirming that the cell failure is caused by severe oxidation instead of pulverization with increasing Fe-content in HAAs. A heavily oxidized surface layer increases the internal resistance of the cell and leads to a shorter cycle life.
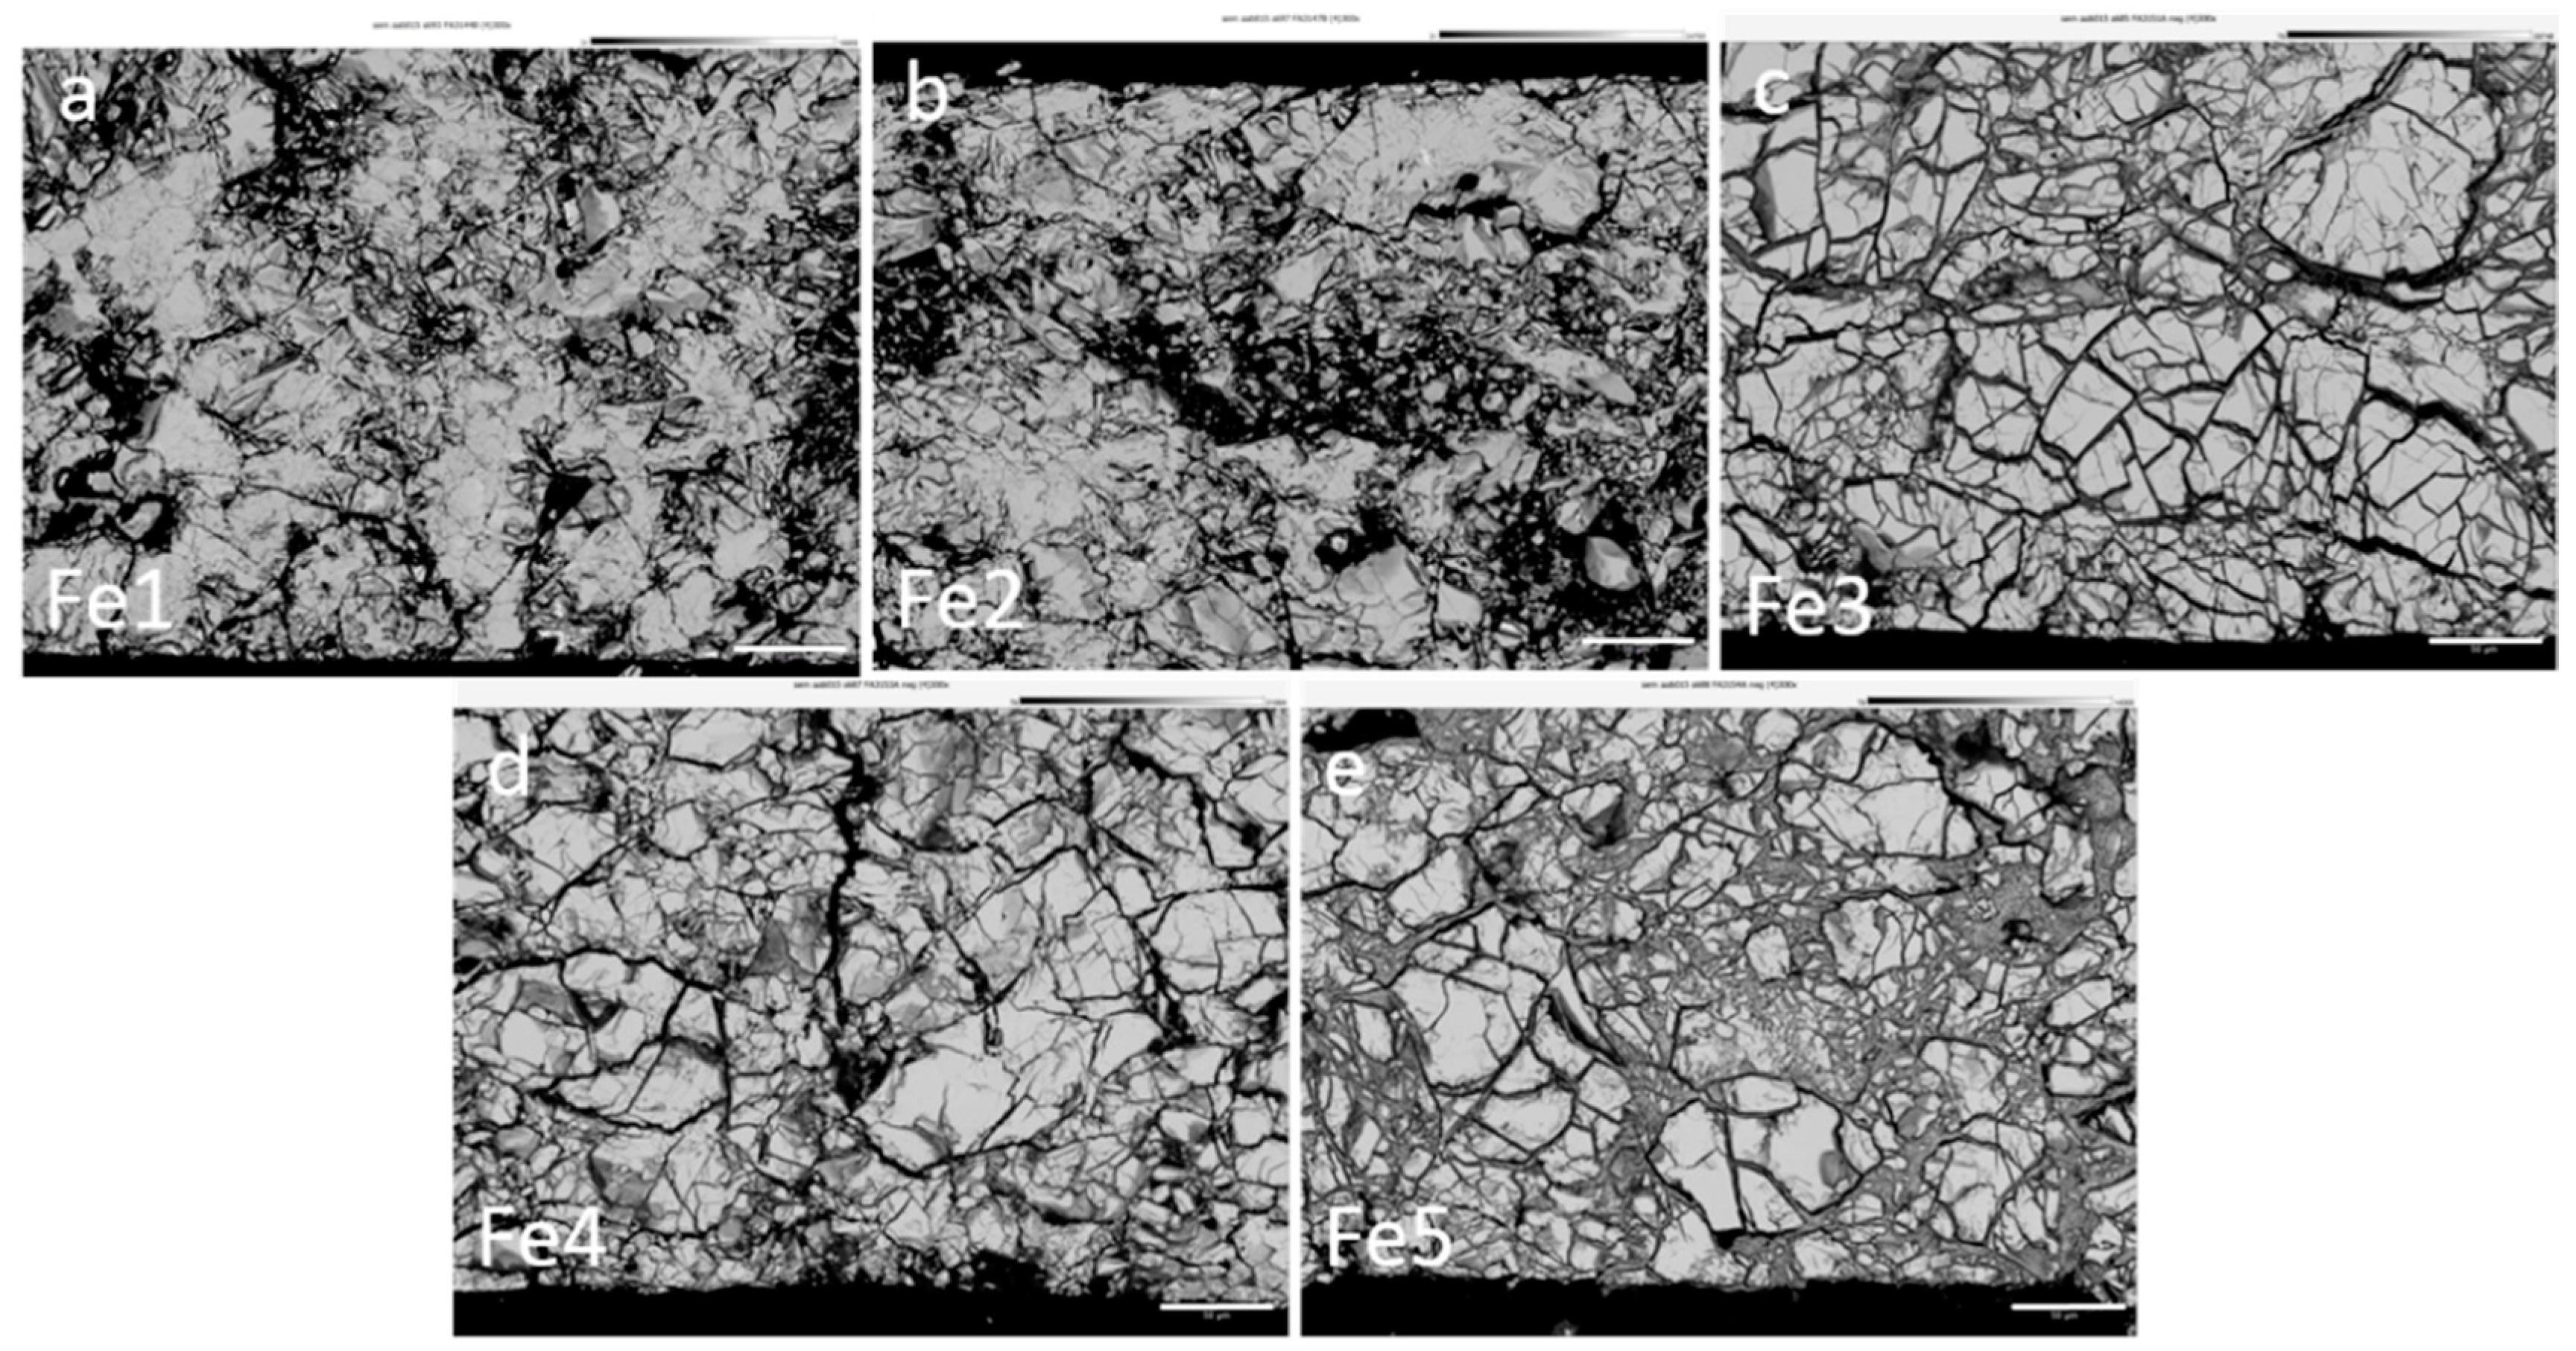
The cells after cycle life testing at 50 °C were also taken apart and investigated by SEM/EDS. Cycle life performance decreases dramatically with increasing temperature. In addition, the failure modes are similar. As shown in
Figure 9, cells with the Fe-free (Fe1) and low-Fe-content (Fe2) HAAs show significant pulverization at the negative electrodes during the end of cycle life, which is the main cause of cell failure. When the Fe-content increases above 1.2 at% (Fe3 to Fe5), oxidation at the HAA surfaces becomes more significant (
Figure 9c–e). Fe5 exhibits the most severe oxidation among all alloys.
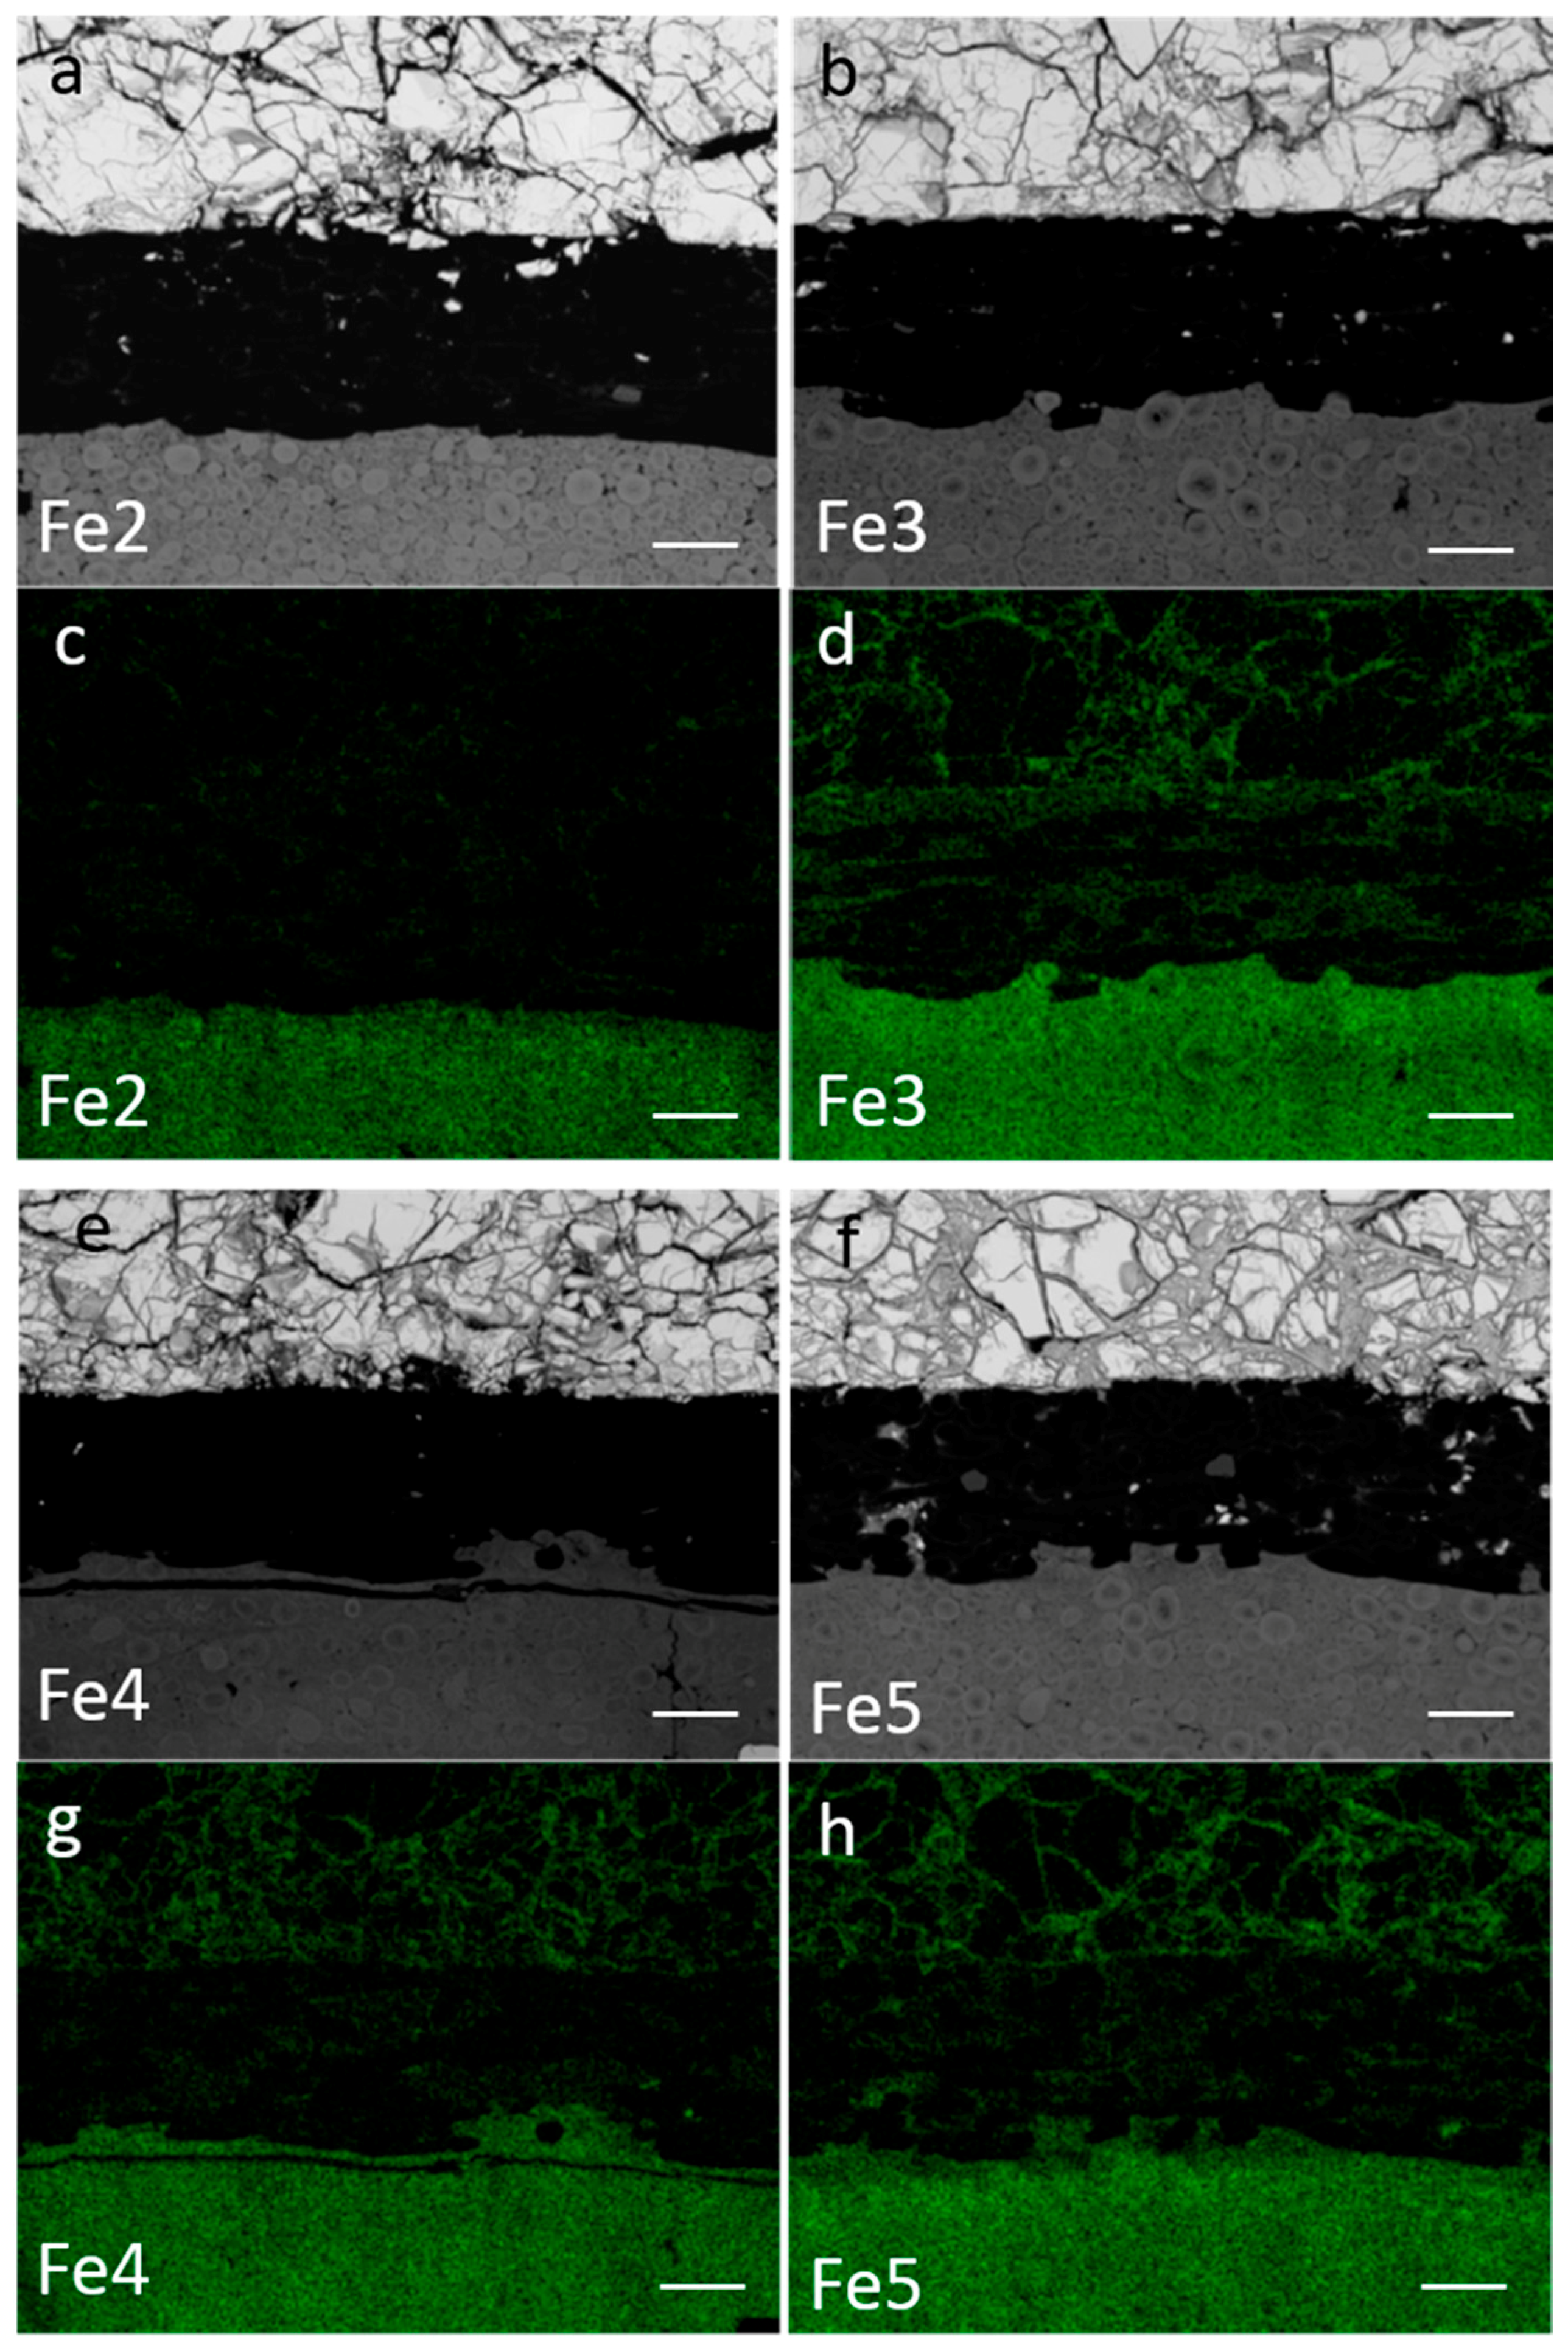
Figure 10 shows the SEM BEI micrographs of the cross-sections and their corresponding O-EDS mappings for Fe2 to Fe5. O-EDS mapping does not show a significant oxygen level in the cycled negative electrode in cell Fe2, which indicates that oxidation should be excluded as the main cause of cell failure. For Fe3 to Fe5, the negative electrodes are severely oxidized, whereas no obvious pulverization is observed. In addition to negative electrode oxidation, the separators in Fe3 to Fe5 are squeezed by the expansion in the positive electrode and debris/deposits are found in the separators, which is attributed to electrolyte dry-out. Electrolyte dry-out is another typical failure mode and caused cell failure of the Co-substituted HAA cells tested at 50 °C. EDS measurements show that the debris/deposits contain Ni, Co, Mg and Al (mainly Ni and Co), which originated from the corroded negative electrode and formed a micro-shortage network that is detrimental to cycle life performance. Such debris/deposits were also observed in the high Fe-content cells Fe4 and Fe5 after cycling at RT.
The cells cycled at RT and 50 °C show similar failure mechanisms. Cells with Fe-free and low-Fe-content HAAs demonstrate long cycle life and eventually fail due to pulverization/disintegration of the negative electrode. With increasing Fe-content in HAAs, oxidation/corrosion of the negative electrode dominates and has two negative influences. First, surface oxidation may lead to increased internal resistance and deterioration of the cell capacity and cycle life. Second, during the oxidation/corrosion of HAAs, Ni, Co or other elements may leach from the negative electrode and deposit on the separator. Such deposits/debris may eventually develop into a micro-shortage network and therefore reduce cell capacity, cycle life and shelf life.


