Article

Studies on the Synergetic Effects in Multi-Phase Metal Hydride Alloys

1
Department of Chemical Engineering and Materials Science, Wayne State University, Detroit, MI 48202, USA
2
BASF/Battery Materials-Ovonic, 2983 Waterview Drive, Rochester Hills, MI 48309, USA
*
Author to whom correspondence should be addressed.
Batteries 2016, 2(2), 15; https://doi.org/10.3390/batteries2020015
Submission received: 24 March 2016 / Revised: 8 May 2016 / Accepted: 10 May 2016 / Published: 19 May 2016
(This article belongs to the Special Issue Nickel Metal Hydride Batteries)

Abstract

:
The electrochemical reactions of multi-phase metal hydride (MH) alloys were studied using a series of Laves phase-related body-centered-cubic (BCC) Ti15.6Zr2.1V43Cr11.2Mn6.9Co1.4Ni18.5Al0.3X (X = V, B, Mg, Y, Zr, Nb, Mo, La, and Nd) alloys. These alloys are composed of BCC (major), TiNi (major), C14 (minor), and Ti2Ni (minor) phases. The BCC phase was found to be responsible for the visible equilibrium pressure plateau between 0.1 MPa and 1 MPa. The plateaus belonging to the other phases occurred below 0.005 MPa. Due to the synergetic effects of other non-BCC phases, the body-centered-tetragonal (BCT) intermediate step is skipped and the face-centered-cubic (FCC) hydride phase is formed directly. During hydrogenation in both gaseous phase and electrochemistry, the non-BCC phases were first charged to completion, followed by charging of the BCC phase. In the multi-phase system, the side with a higher work function along the grain boundary is believed to be the first region that becomes hydrogenated and will not be fully dehydrided after 8 h in vacuum at 300 °C. While there is a large step at approximately 50% of the maximum hydrogen storage for the equilibrium pressure measured in gaseous phase, the charge/discharge curves measured electrochemically are very smooth, indicating a synergetic effect between BCC and non-BCC phases in the presence of voltage and charge non-neutrality. Compared to the non-BCC phases, the C14 phase benefits while the TiNi phase deteriorates the high-rate dischargeability (HRD) of the alloys. These synergetic effects are explained by the preoccupied hydrogen sites on the side of the hydrogen storage phase near the grain boundary.

Graphical Abstract

1. Introduction

The synergetic effects in multi-phase metal hydride (MH) alloys refer to the presence of microsegregated secondary phases occurring in the melted alloys that effectively provide beneficial effects [1]. Some examples of synergetic effects in the gaseous phase and electrochemical environment are summarized in Table 1. In general, the synergetic effects in the gaseous phase hydrogen storage can improve the storage capacity and reversibility, and are characterized by a continuous transition in the pressure-concentration-temperature (PCT) isotherm, from the plateau pressure corresponding to the phase with a stronger metal–hydrogen (M–H) bond strength to the phase with a weaker M–H bond strength (Figure 7b in [2]). The interface region between two phases is considered to be critical for the synergy to take place. Transmission electron microscopy (TEM) studies have demonstrated the interface between the main C14 phase and other secondary phases (C15, Zr7Ni10, etc.) are clean [3,4], and strong crystallographic orientation alignment can be established by electron beam back-scattering diffraction pattern studies [5,6]. Some synergetic effects in the electrochemical environment are similar to those in the gaseous phase, i.e., improvement in capacity and hydrogen absorption/desorption rate. Interestingly, the properties established by the scope of the gaseous phase can be further enhanced by synergetic effects in the electrochemical environment. For example, it has been found that the electrochemical discharge capacities of certain multi-phase MH alloys can be increased substantially by lowering the equivalent plateau pressure (observed through open-circuit voltage (OCV) changes during charge/discharge [7]) through synergetic effects [8,9]. Therefore, a systematic study in the difference between the synergetic effects in the two environments is of significant interest.
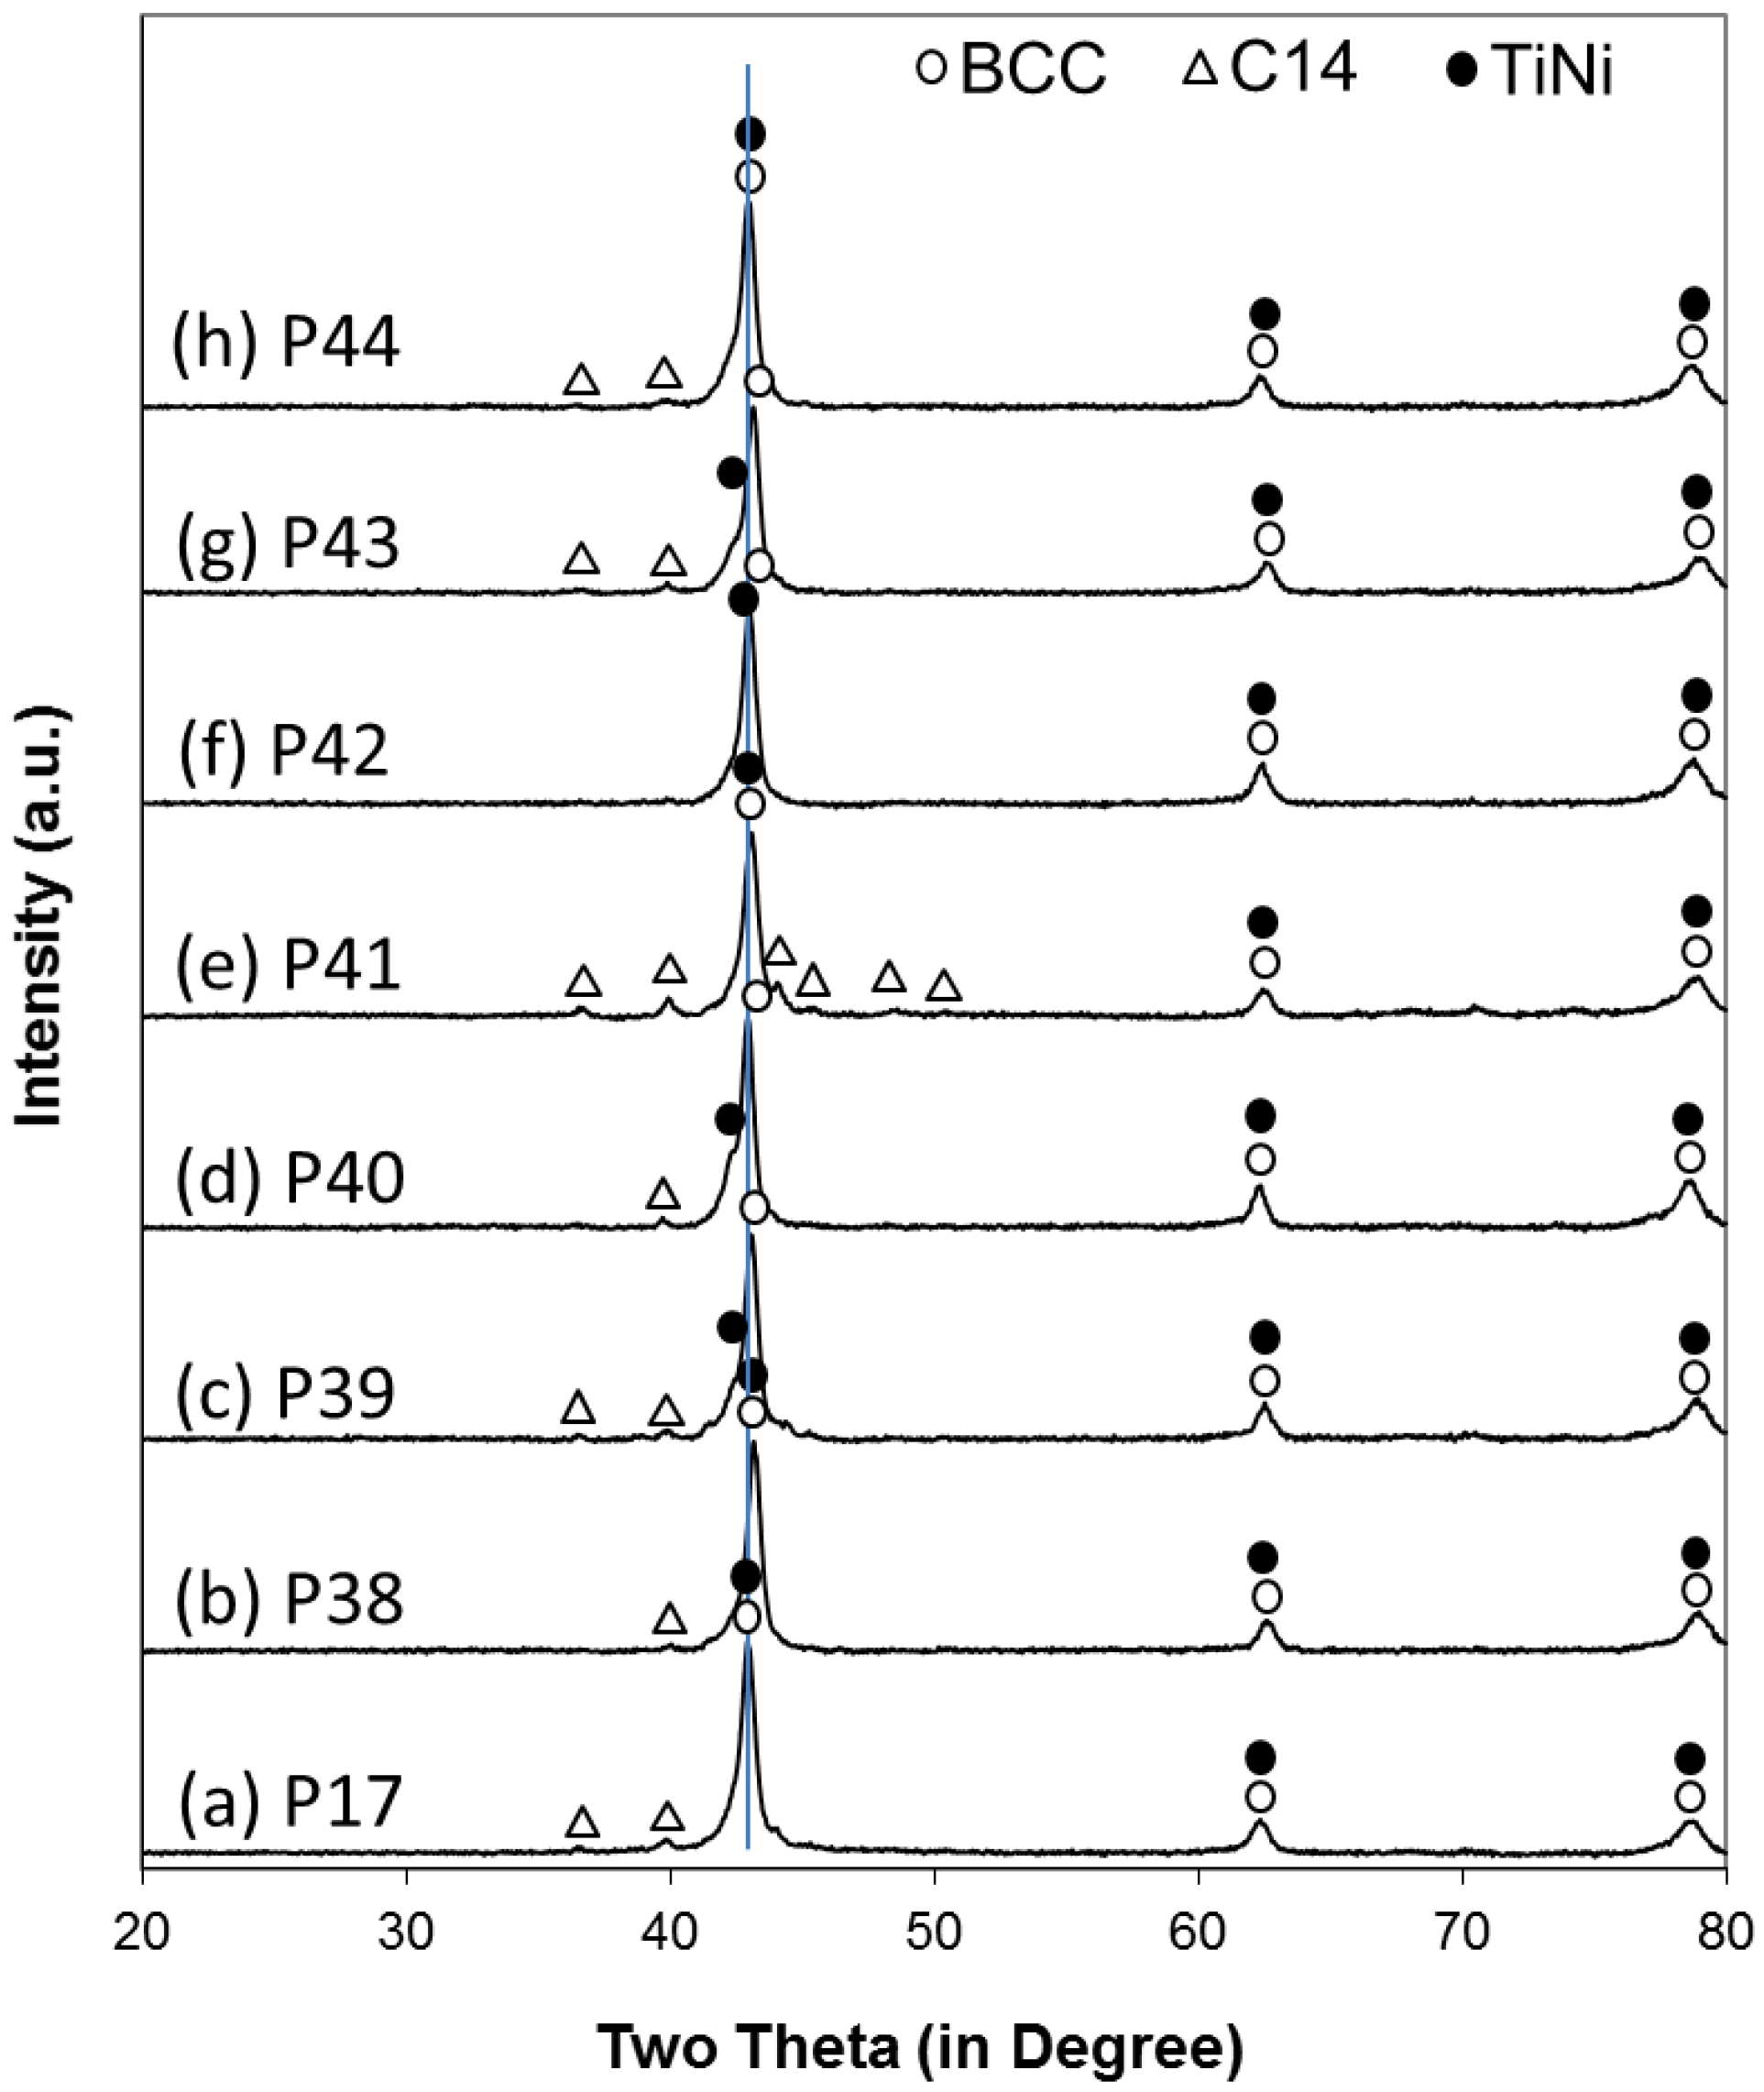
Laves phase-related body-centered-cubic (BCC) solid solution alloys were chosen for this study. By combining the high-capacity main storage BCC phase with catalytic phases, such as C14, TiNi, and Ti2Ni, one alloy in the family demonstrated a 30% increase in capacity when discharged at a current density of 100 mA·g‒1, which is adequate for electric vehicle applications [31]. The development of this family of alloys proceeded in stages and the X-ray diffraction (XRD) and PCT analyses demonstrated strong evidence of synergetic effects between the main storage phase and the catalytic phase [32,33,34,35]. With a base alloy of P17 (Ti15.6Zr2.1V44Cr11.2Mn6.9Co1.4Ni18.5Al0.3), the V/Ni content was adjusted to increase the high-rate dischargeability (HRD) [36]. The synergetic effects in an electrochemical environment were studied in detail using this same base alloy, P17, with substitutions of other A-site atoms (B, Mg, Y, Zr, Nb, Mo, La, and Nd) and presented here.

2. Experimental Setup

The alloy samples were prepared using an arc-melting technique. The melting was performed in an Ar environment with an average alloy weight of 12 g. The chemical composition of the ingot, compared to the ratios in the raw materials, was determined with a Varian Liberty 100 inductively coupled plasma-optical emission spectrometer (ICP-OES, Agilent Technologies, Santa Clara, CA, USA). The microstructures of the as-prepared samples were examined by a Philips X’Pert Pro X-ray diffractometer (XRD, Philips, Amsterdam, The Netherlands) and a JEOL-JSM6320F scanning electron microscope (SEM, JEOL, Tokyo, Japan) equipped with energy-dispersive spectroscopy (EDS). The PCT analysis was performed with a Suzuki-Shokan multi-channel PCT (Suzuki Shokan, Tokyo, Japan) system. The MH alloys were compacted on Ni mesh to achieve the negative electrode, and the battery cells were made by using a standard Ni(OH)2-positive electrode and 30 wt% KOH electrolyte. The electrochemical testing of the battery cells was performed at room temperature (RT) using a CTE MCL2 Mini (Chen Tech Electric MFG. Co., Ltd., New Taipei, Taiwan) cell test system.

3. Results

3.1. X-Ray Diffraction Structure Analysis

Eight alloys with the targeted compositions listed in Table 2 were prepared by arc melting. The base alloy, P17, originated from a composition optimization study [35]. Other alloys were derivatives of this base alloy with 1 at% replacement aimed at the A-site element (B, Mg, Y, Nb, Mo, La, and Nd). The chemical composition of the as-prepared ingot was verified by ICP and shows a large discrepancy only in alloy P39, where the added Mg was not found in the ingot due to loss from evaporation during melting. Mg has a high vapor pressure at temperatures near the melting point of the alloy and low solubility in the AB2 phase [37,38]. The content of La in the final ingot of P43 was less than 50% of the targeted content due to the high chemical reactivity of La metal with the residual oxygen and the formation of oxide slag during melting. The B/A ratios for the ingots ranged from 4.24 to 4.68, assuming that Ti, Zr, and the additive elements are A-site atoms and the remaining constituent elements are B-site atoms. The XRD patterns of the alloys are shown in Figure 1. The three major peaks detected in all alloys belong to a BCC structure. All the minor peaks can be attributed to a C14 Laves phase. A TiNi phase with a B2 structure (a close derivative of a BCC structure) and a slightly larger lattice constant were separated from the BCC phase using software deconvolution (JADE 9, Christchurch, New Zealand).
The lattice constants, crystallite size, and phase abundances calculated from the XRD pattern are listed in Table 3.
The lattice constants a from the three constituent phases are plotted against the metallic radii of the additive elements in the Laves-phase alloy [39] in Figure 2a. At a glance, the lattice constants from all three phases follow the same trend: a rapid increase followed by a decrease with increasing radii of the additive. However, the later EDS analysis indicates that most of the additives have zero or limited solubility in these three main phases. Therefore, the changes in lattice constant are tied to other characteristics of this group of alloys. For example, the lattice constants show a reasonably consistent trend of decreasing with increasing Mn-content (with a relatively small radius) in the BCC phase, as shown in Figure 2b. The spread of c/a ratio (a parameter that can be used to estimate the preferential occupation site for foreign atoms [36,40]) in the A-atom substitution (1.626–1.641) is approximately the same as the spread in the B-atom substitution study (1.627–1.644) [35]. No preference for occupation site substitution can be deduced in the current study. From the abundances shown in Table 3, BCC (32‒61 wt%) and TiNi (29‒62 wt%) are the two major phases, with C14 as the secondary phase. The crystallite of the secondary phase (C14) is larger than those in the main phases (BCC and TiNi), which has previously been observed in BCC-Laves-related alloys [33,36], but which is not common in multi-phase AB2 MH alloys [41]. It is interesting to observe that there is a correlation between the abundance and the crystallite size in each phase. For example, as the TiNi phase becomes more popular (larger abundance), its crystallite becomes larger. In the case of BCC and C14 phases, the trend is the opposite (Figure 3).

3.2. Scanning Electron Microscope Phase Analysis

The composition of the constituent phase was studied through a combination of SEM and EDS on a few selected areas. A representative SEM-backscattering electron image (BEI) from each alloy is shown in Figure 4, and the corresponding EDS data are listed in Table 4. In contrast to the composition information obtained from ICP, EDS results are far less accurate and representative but are still useful for qualitatively studying the composition in each constituent phase. The two main phases, BCC and TiNi, form separate 3D frameworks that interlace with each other (for a schematic drawing, see Figure 4 in [32]). This microstructure suggests an early formation of a V-rich BCC framework, which pushes the Ni and Ti into grain boundaries and later forms the C14 and TiNi phases. According to an earlier TEM study of the C14-predomintaed MH alloy, the C14 phase is solidified before the formation of the TiNi phase [3,4]. The B/A ratio in each spot was calculated assuming B occupies the A-site in the C14 phase [42] but occupies the A-site in the TiNi and Ti2Ni phases [34]. All the calculated B/A ratios are slightly above their stoichiometric values (hyper-stoichiometry), i.e., 2.0 (C14), 1.0 (TiNi), and 0.5 (Ti2Ni). The anti-site defect (Ni in the A-site) is energetically more favorable, compared to the vacancy defect [43], which explains the hyper-stoichiometry. The average electron density (e/a), calculated from the number of conduction electrons in the constituent metals [44] in the C14 phase, is lower than the C14/C15 threshold [45] and thus a C14-structure is expected instead of a C15-structure, except for alloy P17. There may be some of the C15 phase in alloy P17, according to its relatively higher e/a ratio. From the EDS study, we found that only additive Nb participated in all three main phases and only Mo was found in the BCC phase. Boron (B) is too light to be detected by EDS, but definitely exists in the alloy, and Mg is missing completely, which can both be confirmed by ICP. Rare earth elements, such as Y, La, and Nd, promote formation of the AB phase and have undetectable solubilities in the BCC, TiNi, and C14 phases. The Mn-content in the C14 phase has been correlated with the lattice constants of the three phases in Figure 2b. Other correlations are less obvious.

3.3. Gaseous Phase Characteristics

The characteristics of gaseous phase hydrogen storage for these eight alloys were studied by PCT analysis and the resulting isotherms, obtained at 30 °C and 60 °C, are shown in Figure 5. Similar to other alloys in the same family [32,33,35,36], the PCT isotherm shows only one plateau in the pressure range of our apparatus (0.001–5 MPa). There is at least one more known plateau below 0.001 MPa. The PCT hysteresis from this family of alloys is much larger than those from the AB2 [46], AB5 [47], and A2B7 [27] MH alloy families. The gaseous phase properties obtained from the PCT analysis are summarized in Table 5. The desorption plateau pressures of the substituted alloys are higher than that in the base alloy (P17), except for Nd-doped P44, which indicates that most of the additives weaken the M–H bond in the hydride. By comparing the capacities of these alloys, we found that while La is beneficial to both maximum and reversible capacities, both B and Nb increase the reversible capacity. The irreversible hydrogen storage capacity (the difference between the maximum and reversible capacities) is proportional to the TiNi phase abundance (shown in Figure 6). The PCT hysteresis originates from the elastic lattice deformation energy needed at the metal (α)‒hydride (β) interface during hydrogen absorption [48,49]. The higher PCT hysteresis in this family of alloys suggests an environment which results in difficulty with respect to expansion inside the alloy. The substituted alloys show larger PCT hysteresis at 30 °C, but smaller PCT hysteresis at 60 °C when compared to those from the base alloy P17.
Thermodynamic properties, including changes in enthalpy (ΔH) and entropy (ΔS), were calculated from the equation for free energy (G):
Δ G = Δ H T Δ S = R T In P
where R is the ideal gas constant and T is the absolute temperature. Based on plateau pressures in the absorption, desorption, and halfway point, three sets of ΔH and ΔS were calculated and listed in Table 6. Conventionally, the values obtained using the desorption isotherm (ΔHD and ΔSD) are adopted because the hysteresis is mainly due to the energy barrier from lattice distortion at the α‒β interface during hydrogen absorption. In the current study, the ΔSA value is more consistent, suggesting that the absorption isotherm may be increasingly unaffected, and at least should be included in the report. As can be seen in Table 6, ΔHD is always lower than ΔHA, and ΔH(A+D)/2 falls between the two values. ΔSD can be higher or lower than ΔSA, and ΔS(A+D)/2 also falls in the middle. In our previous publication, we adopted an estimation method for ΔH from the atomic percentage and obtained a ΔH of the three hydride-former atoms, Zr (∆Hh = −163 kJ·mol−1 H2 for ZrH2), Ti (∆Hh = −124 kJ·mol−1 H2 for TiH2), and V (∆Hh = −34 kJ·mol−1 H2 for VH2). This estimation is based on the following assumptions. The complete heat of hydride formation of ABn alloy should be:
ΔH (ABnH2m) = Δ H (AHm) + ΔH BnHm) − ΔH (ABn) [50]
However, the ΔH for the alloy ABn and the non-hydride former atoms are smaller than those in the hydride former atoms (for example, ΔH for VCr2 and NiH0.5 are −2 kJ·mol−1 H2 [51] and −6 kJ·mol−1 H2 [52], respectively). Therefore, the heat of hydride formation can be estimated by:
ΔH (A1hA2kA3lBnH2) = hΔH (A1H2) + kΔH (A2H2) + lΔH (A3H2)
where h, k, l, and m are the atomic percentages of the hydride former elements A1, A2, and A3 and the non-hyride former element B. According to this calculation, the ΔH for the hydride of the constituent phases of alloy P17 are −28.5 (BCC), −55.4 (TiNi) and −49.3 kJ·mol−1 H2 (C14). Therefore, the pressure plateaus in the PCT shown in Figure 5 should correspond to the BCC phase, and those from TiNi and C14 phases are below the minimum pressure used in our PCT apparatus (0.001 MPa). This explains why the irrevesible part of the capacity (below 0.001 MPa) has a linear correlation with the abundance of the TiNi phase, as shown in Figure 6.
The ΔHs calculated with Equation (3) and the composition of the BCC phase highlighted in Table 4 for each alloy are listed in the last column of Table 6 and compared to the measured ΔH values in Figure 7a. Except for alloy P42 (Mo), the measured ΔHs, no matter the variation from the absorption (A), desorption isotherms (D) or half-point (half), are lower (more negative) and do not vary much compared to the calculated values. The decrease in the measured ΔH is due to the synergetic effects associated with the other two phases that have a much lower ΔH and will be discussed in the next section of this paper. In addition, the plateau pressure for the PCT and BCC phase lattice constants have been correlated to the calculated ΔH in the BCC phase, and the results are shown in Figure 7b. Except for alloy P42 (Mo), it is logical to connect the larger BCC unit cell volume to both lower plateau pressure and lower (more negative) ΔH, indicating a stronger M–H bond. There is an appreciable amount of Mo in the BCC phase of alloy P42 (1.4 at %). Mo has a relatively large atomic size and contributes to the increase in lattice parameter. However, instead of lowering the ΔH, Mo has a positive contribution (ΔH for MoH0.5 = +10 kJ·mol−1 H2 [52]). This explains the abnormal behavior of alloy P42 (Mo) in Figure 7.

3.4. Electrochemical Properties

The electrochemical hydrogen storage properties were determined in a flooded half-cell configuration with a commercially available co-precipitated Ni91Co4.5Zn4.5 hydroxide (BASF, Rochester Hills, MI, USA) counter electrode and 30 wt % KOH electrolyte. The pressed electrode was charged with a current density of 100 mA·g−1 for 5 h and then discharged with the same current density to a cut-off voltage of 0.9 V with two more pulls at 24 mA·g−1 and 8 mA·g−1 at the same cut-off voltage. The obtained total capacities and HRDs (as defined by the ratio between capacities obtained from 100 mA·g−1 and the total discharge capacity) from the first 13 cycles are plotted in Figure 8a,b, respectively, to demonstrate the activation behavior of these alloys. Most of the alloys reach their maximum capacity at Cycle 3 or 4, except for alloys P38 (B) and P40 (Y) which require more cycles to stabilize the capacity. It is easier to achieve HRD activation for alloys with higher HRD than those with lower HRD (alloys P40, P38, and P43). The capacities from 100 mA·g−1 and 8 mA·g−1 discharge currents and their ratios for Cycle 5 are listed in Table 7. It is obvious that while the increase in the full capacity is only marginal with B (P38) and Nd (P44), the decrease in high-rate capacity and HRD is significant. The additives chosen for this study do not significantly improve the electrochemical properties of the base alloy (P17). The gaseous phase capacity is converted to the electrochemical capacity following 1 wt% H2 = 268 mAh g−1 and plotted in Figure 9. As in other MH alloys [53], both the low-rate and high-rate electrochemical capacities fall in between the boundaries set by the maximum and reversible gaseous phase capacities. There is no clear correlation between the gaseous phase maximum storage capacity and the electrochemical low-rate capacity, but there is a strong similarity between the gaseous phase reversible capacity and the electrochemical high-rate capacity, except for the base alloy P17 (V).
In order to further study HRD performance, the bulk diffusion constant (D) and surface exchange current (I0) of each sample were measured at RT according to previously described procedures [54] and are listed in Table 7. We found that while D values in the modified alloys are higher than the base alloy, the opposite is true for I0 values (except for alloy P41 (Nb)). The increase in the degree of disorder, achieved by introducing an additional element, facilitates the diffusion of hydrogen in the bulk; the decrease in the V-content with a high leaching rate in KOH [55] impedes the surface reaction, except for substitutions with Nb, which is in the same column of V and is expected to have a high corrosion rate in KOH solution. It is difficult to attribute the large decrease observed in I0 to a 1% decrease in V-content, which will be discussed in the next session. The deterioration of HRD with various additives is mainly due to the decrease in surface electrochemical reaction activity.
The OCV was measured at a state-of-charge of 50% and results are listed in Table 7. Theoretically, OCV can be related to the equilibrium pressure in the gaseous phase through the Nernst equation:
OCV (vs. NiOOH at 0.36 V) = 1.294 + 0.029logp(H2) [7]
However, the plot of the desorption pressure versus OCV, as shown in Figure 10, does not follow the trend where higher pressure corresponds to higher OCV, as indicated in Equation (4). However, the OCV in this study seems to correlate closely with the maximum hydrogen storage in the gaseous phase (Figure 10). The alloys with higher OCV show smaller gaseous phase H-storage capacities. Similar phenomena have been observed previously, but were tied to the change in plateau pressure and strength of M–H bonding [56].

4. Discussion

It is generally believed that in a multi-phase MH system the phase with a lower plateau pressure and more negative ∆H is a main storage phase, which has a larger hydrogen storage capacity (Zr7Ni10, for example [57]), and the secondary phase with a higher plateau pressure and less negative ∆H is considered to be the catalytic phase (Zr2Ni7, for example [57]). In the case of funneling phenomenon, the gaseous phase hydrogen storage is accomplished with the catalytic phase as the necessary funnel to move hydrogen in and out of the alloy [2]. In the case of Laves phase-related BCC MH alloy, the BCC phase is considered to be the main storage phase; although it has a large hydrogen storage capacity, it has limited absorption/desorption kinetics that require an additional catalytic phase to facilitate the hydrogen storage process [58]. Therefore, both C14 and TiNi were considered to be catalytic phases in this family of alloys [32,33,34,35,36]. However, the ∆H values estimated from Equation (3) for the C14 and TiNi phases are much lower than those of the BCC phase, and the visible plateau in the pressure between 0.1 MPa and 1 MPa was assigned to the BCC phase. It is necessary to verify the correctness of such an assignment.
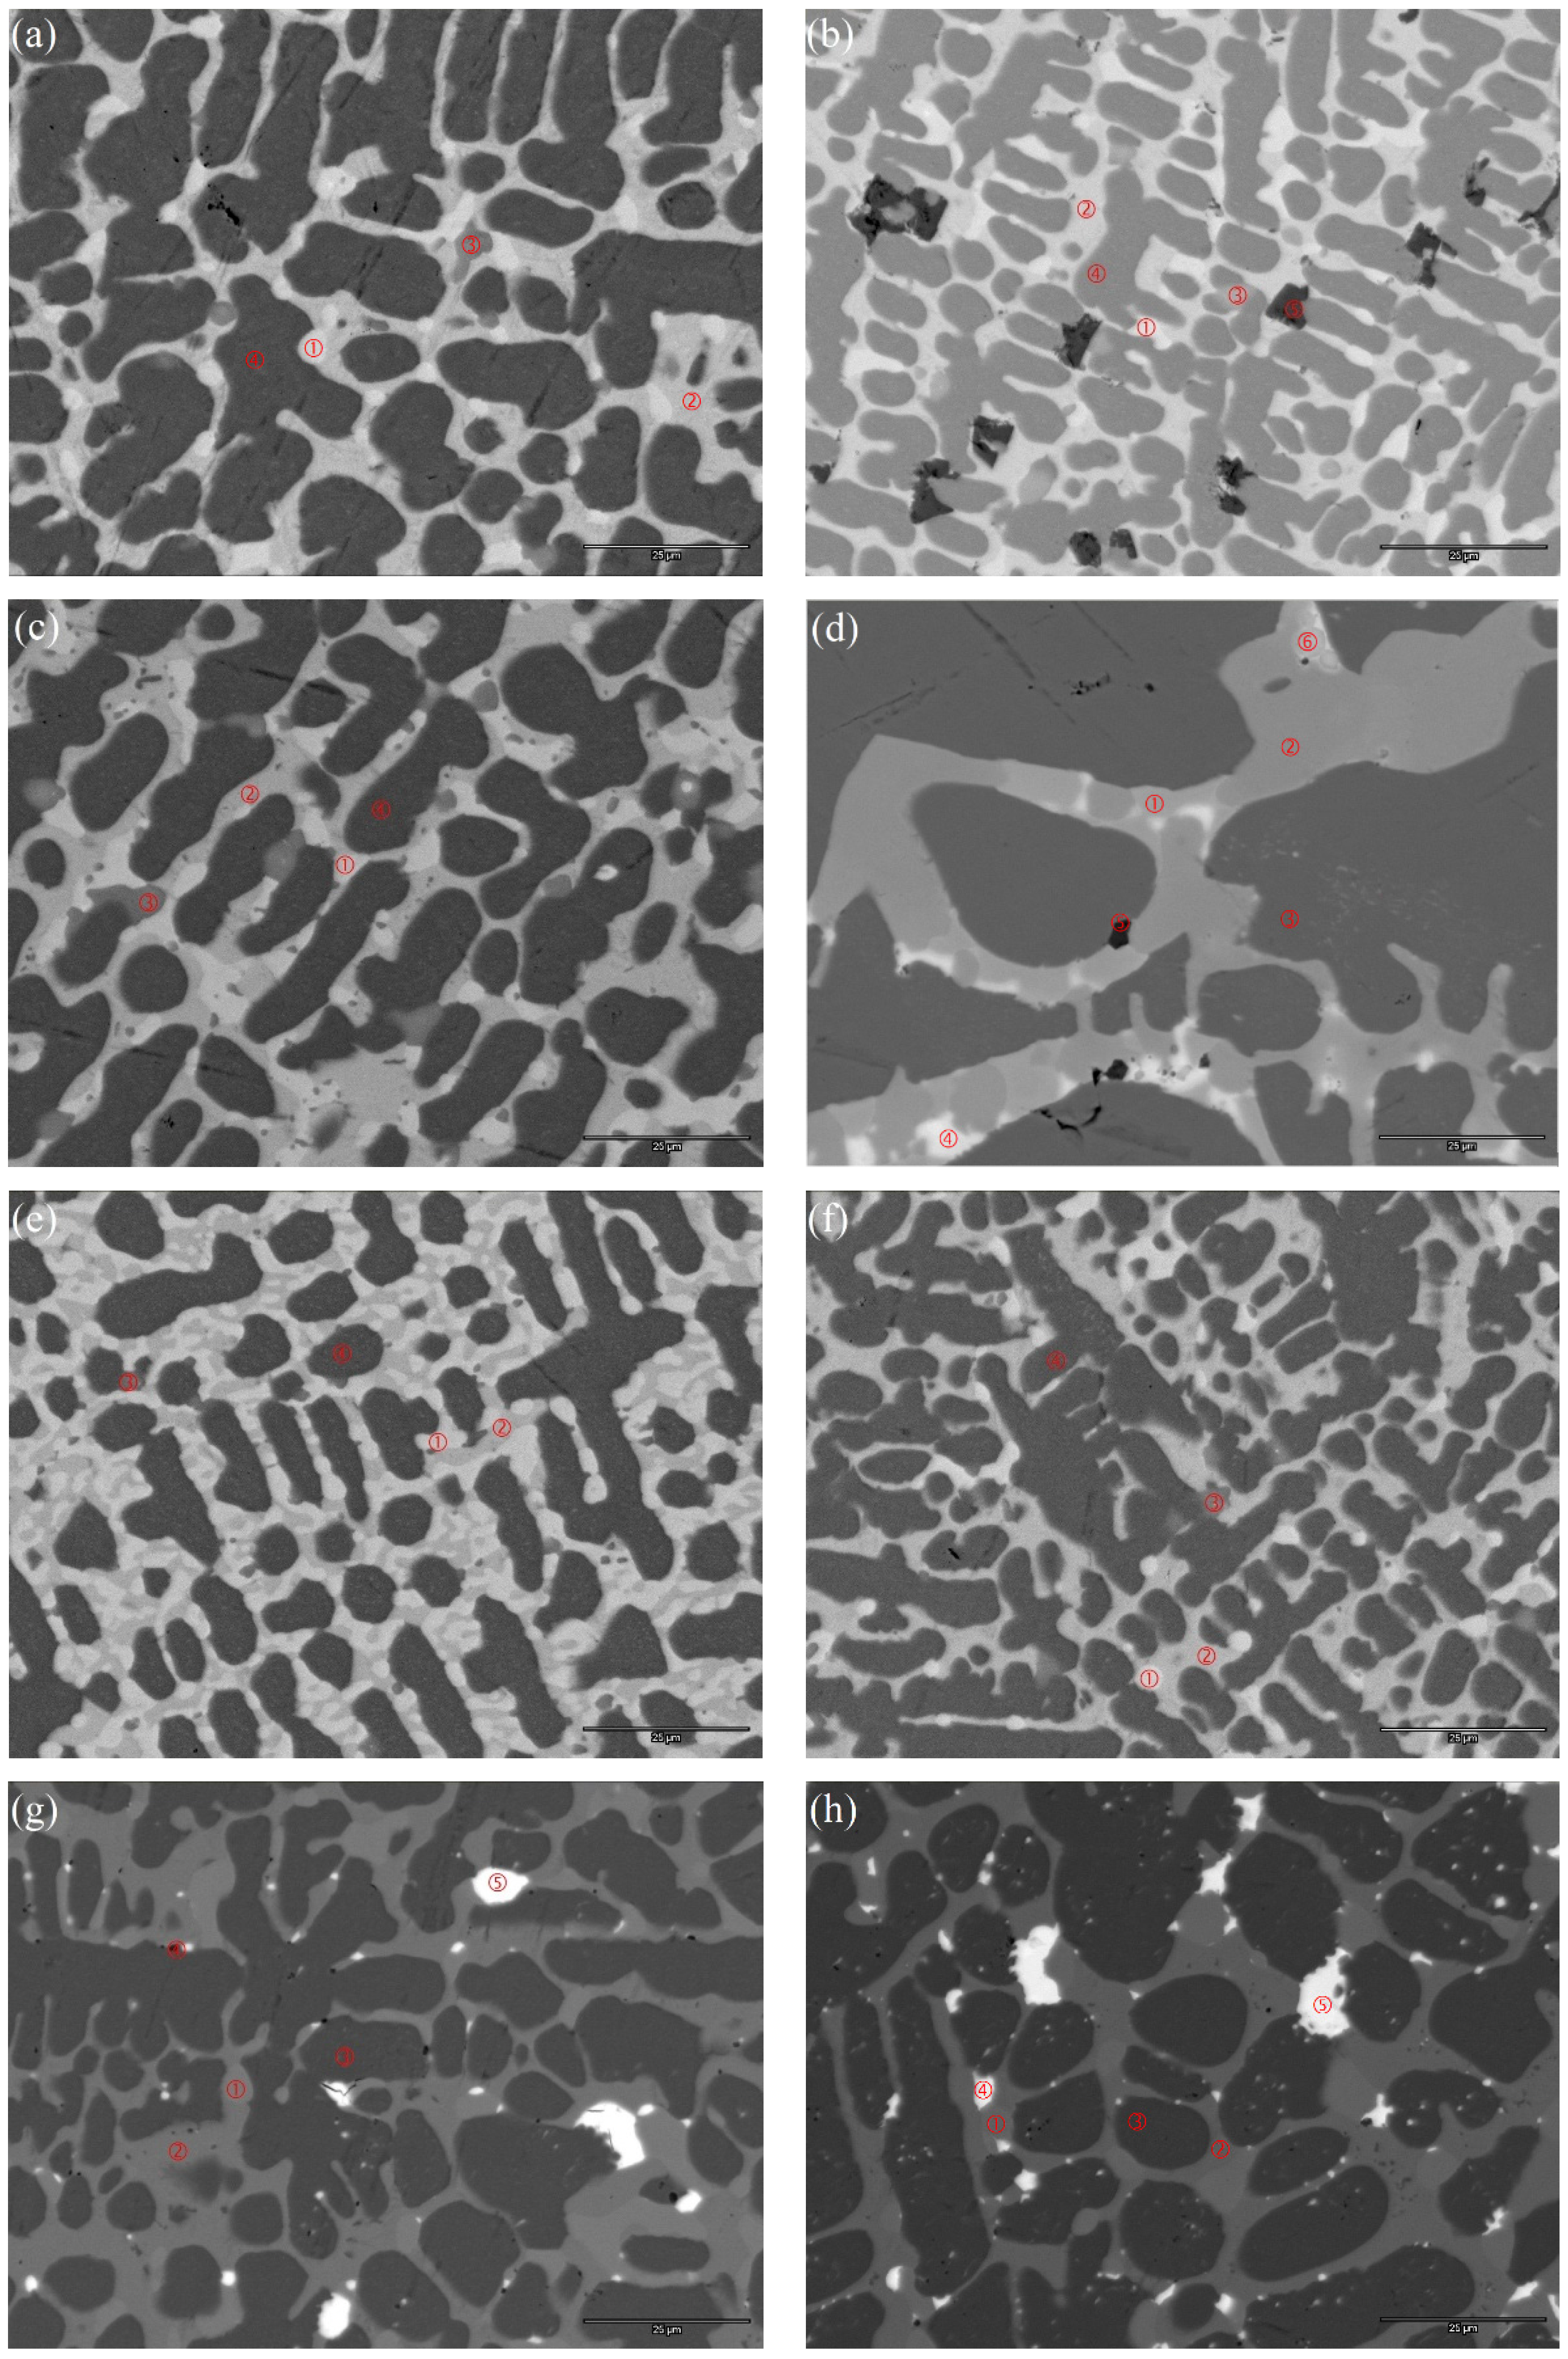
In order to investigate the phase abundance evolution during both gaseous phase and electrochemical hydrogen absorption/desorption, an alloy with a target composition of P17 (
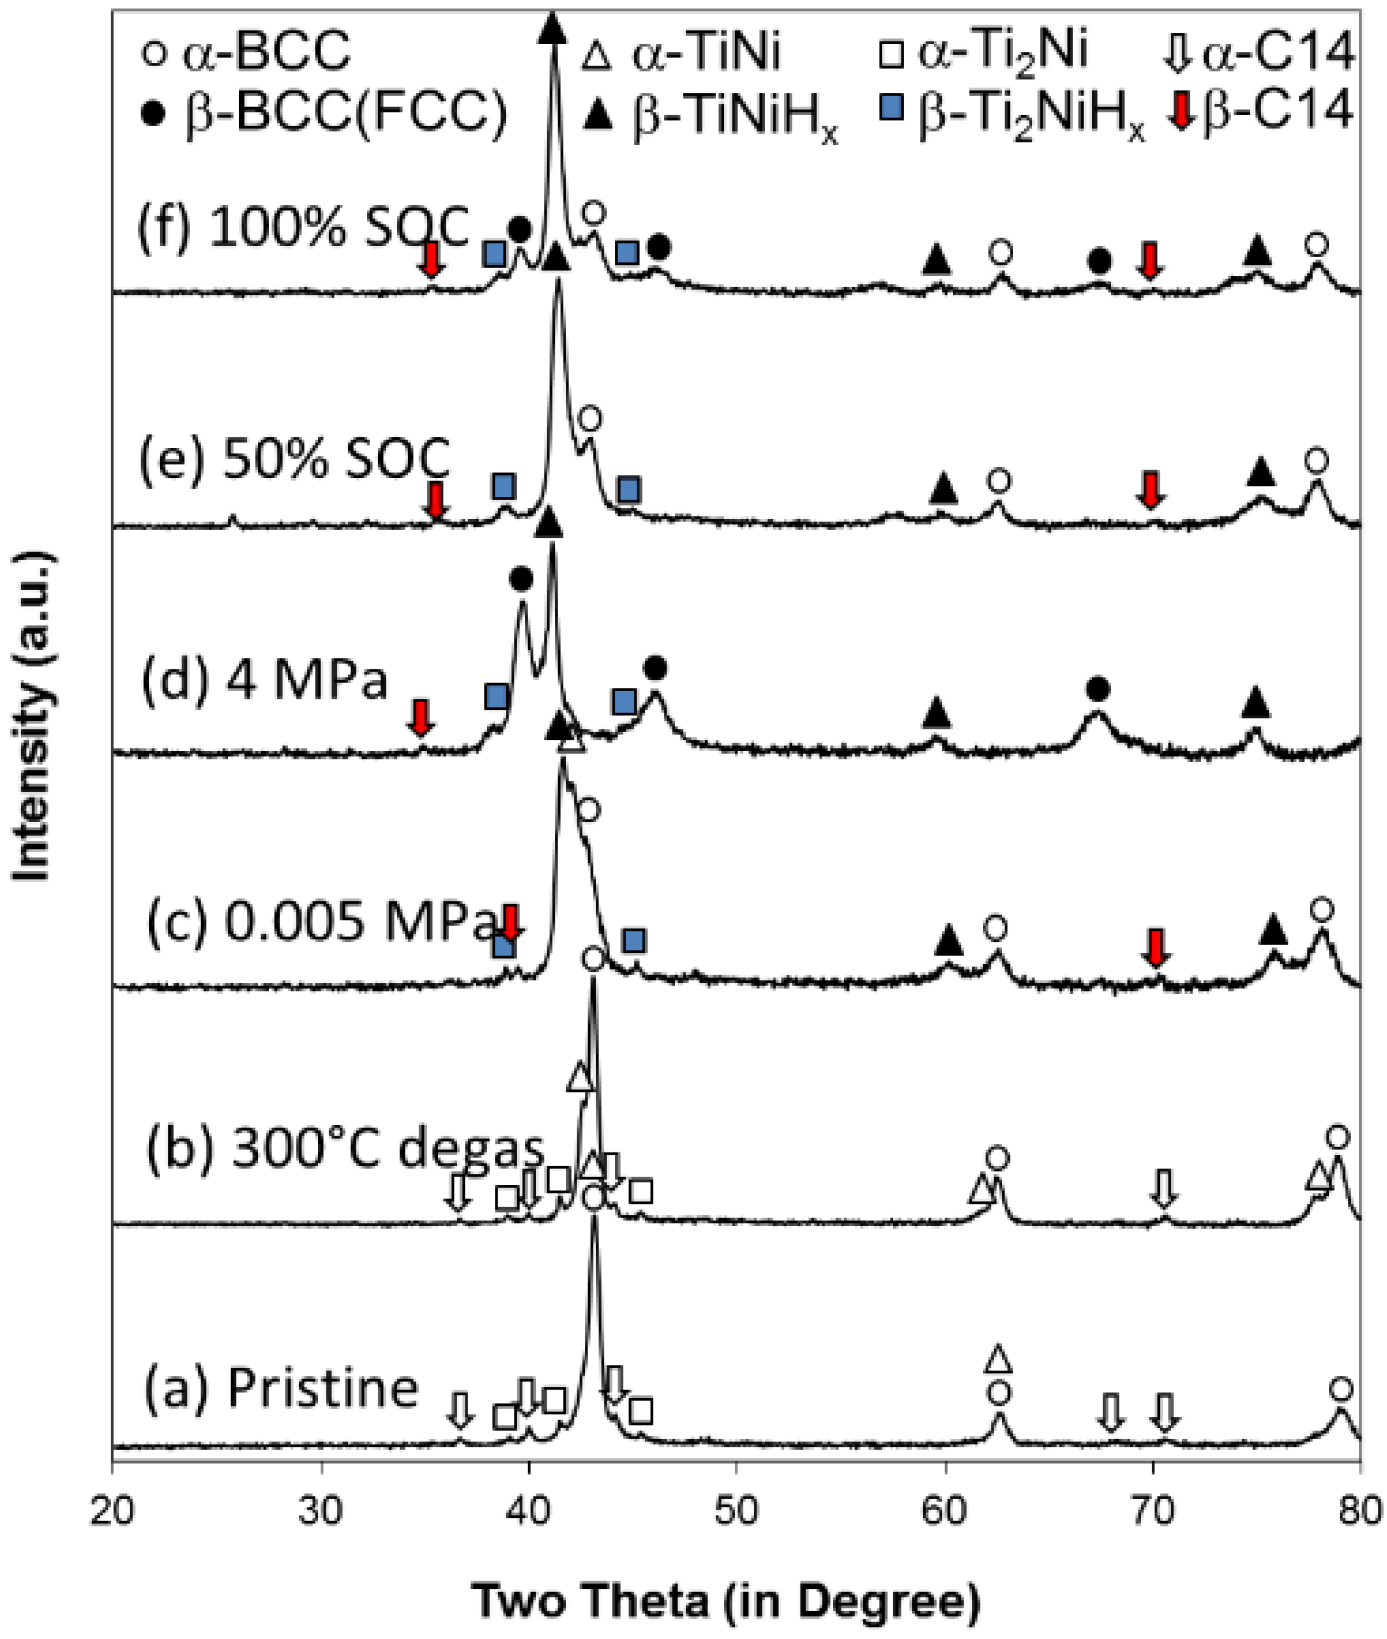
Table 2) was reproduced through conventional induction melting. The XRD patterns from the as-prepared samples show an additional Ti2Ni phase (Figure 11a) which was not observed in the sample prepared by arc melting, due to different cooling rates (Figure 1). The Rietveld refinement indicates percentages of 53.6% BCC, 29.4% TiNi, 10.8% Ti2Ni, and 6.2% C14 (Table 8). The sample was activated in a 4 MPa hydrogen environment first and then degassed under vacuum for 8 h at 300 °C. XRD analysis at this stage (Figure 11b) shows a shift for TiNi peaks to lower angles, which indicates the presence of some hydrogen remaining in the α-TiNi. The Rietveld refinement shows the β-phase (MH) of C14 and Ti
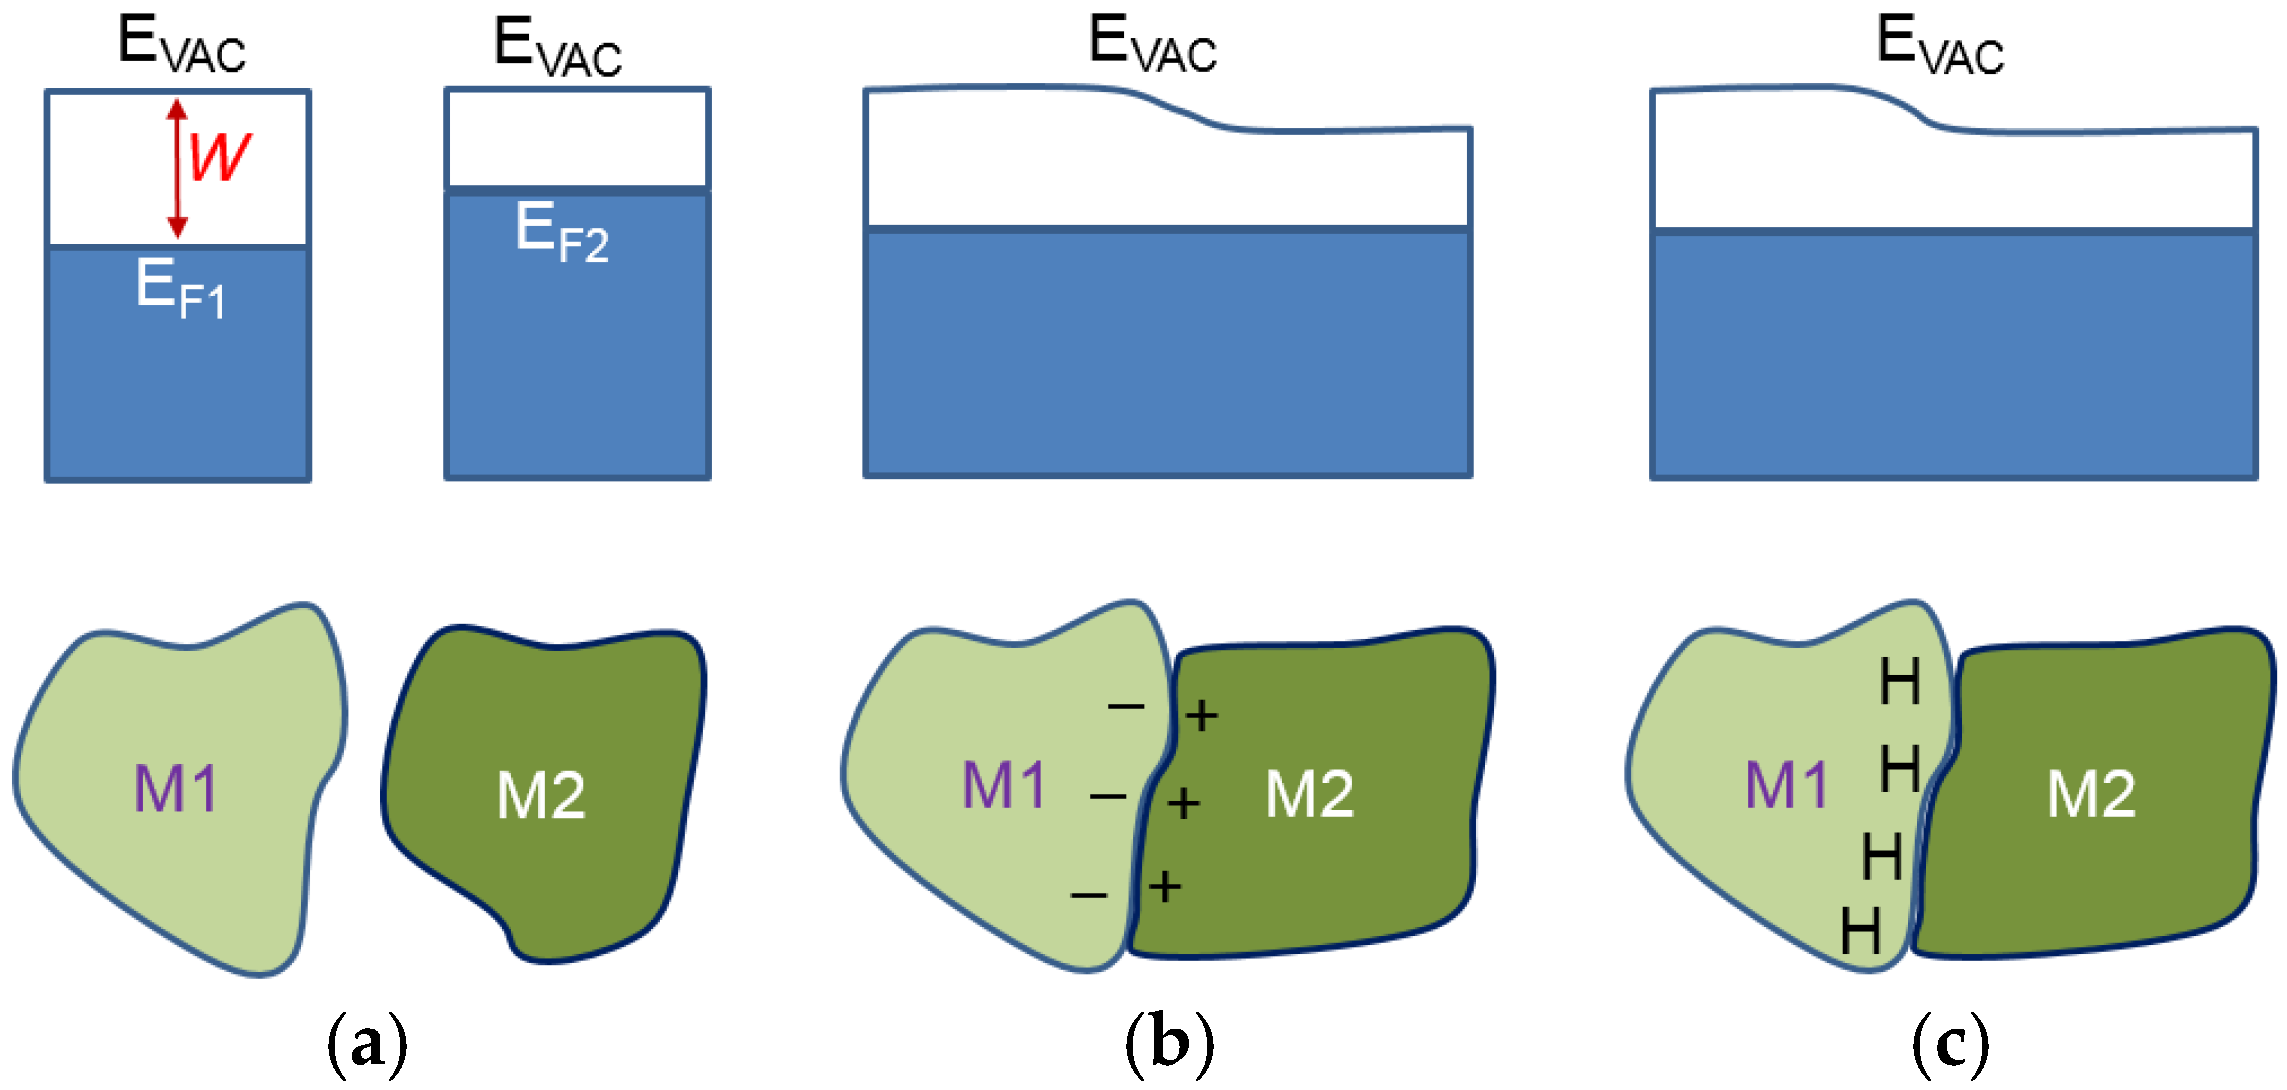
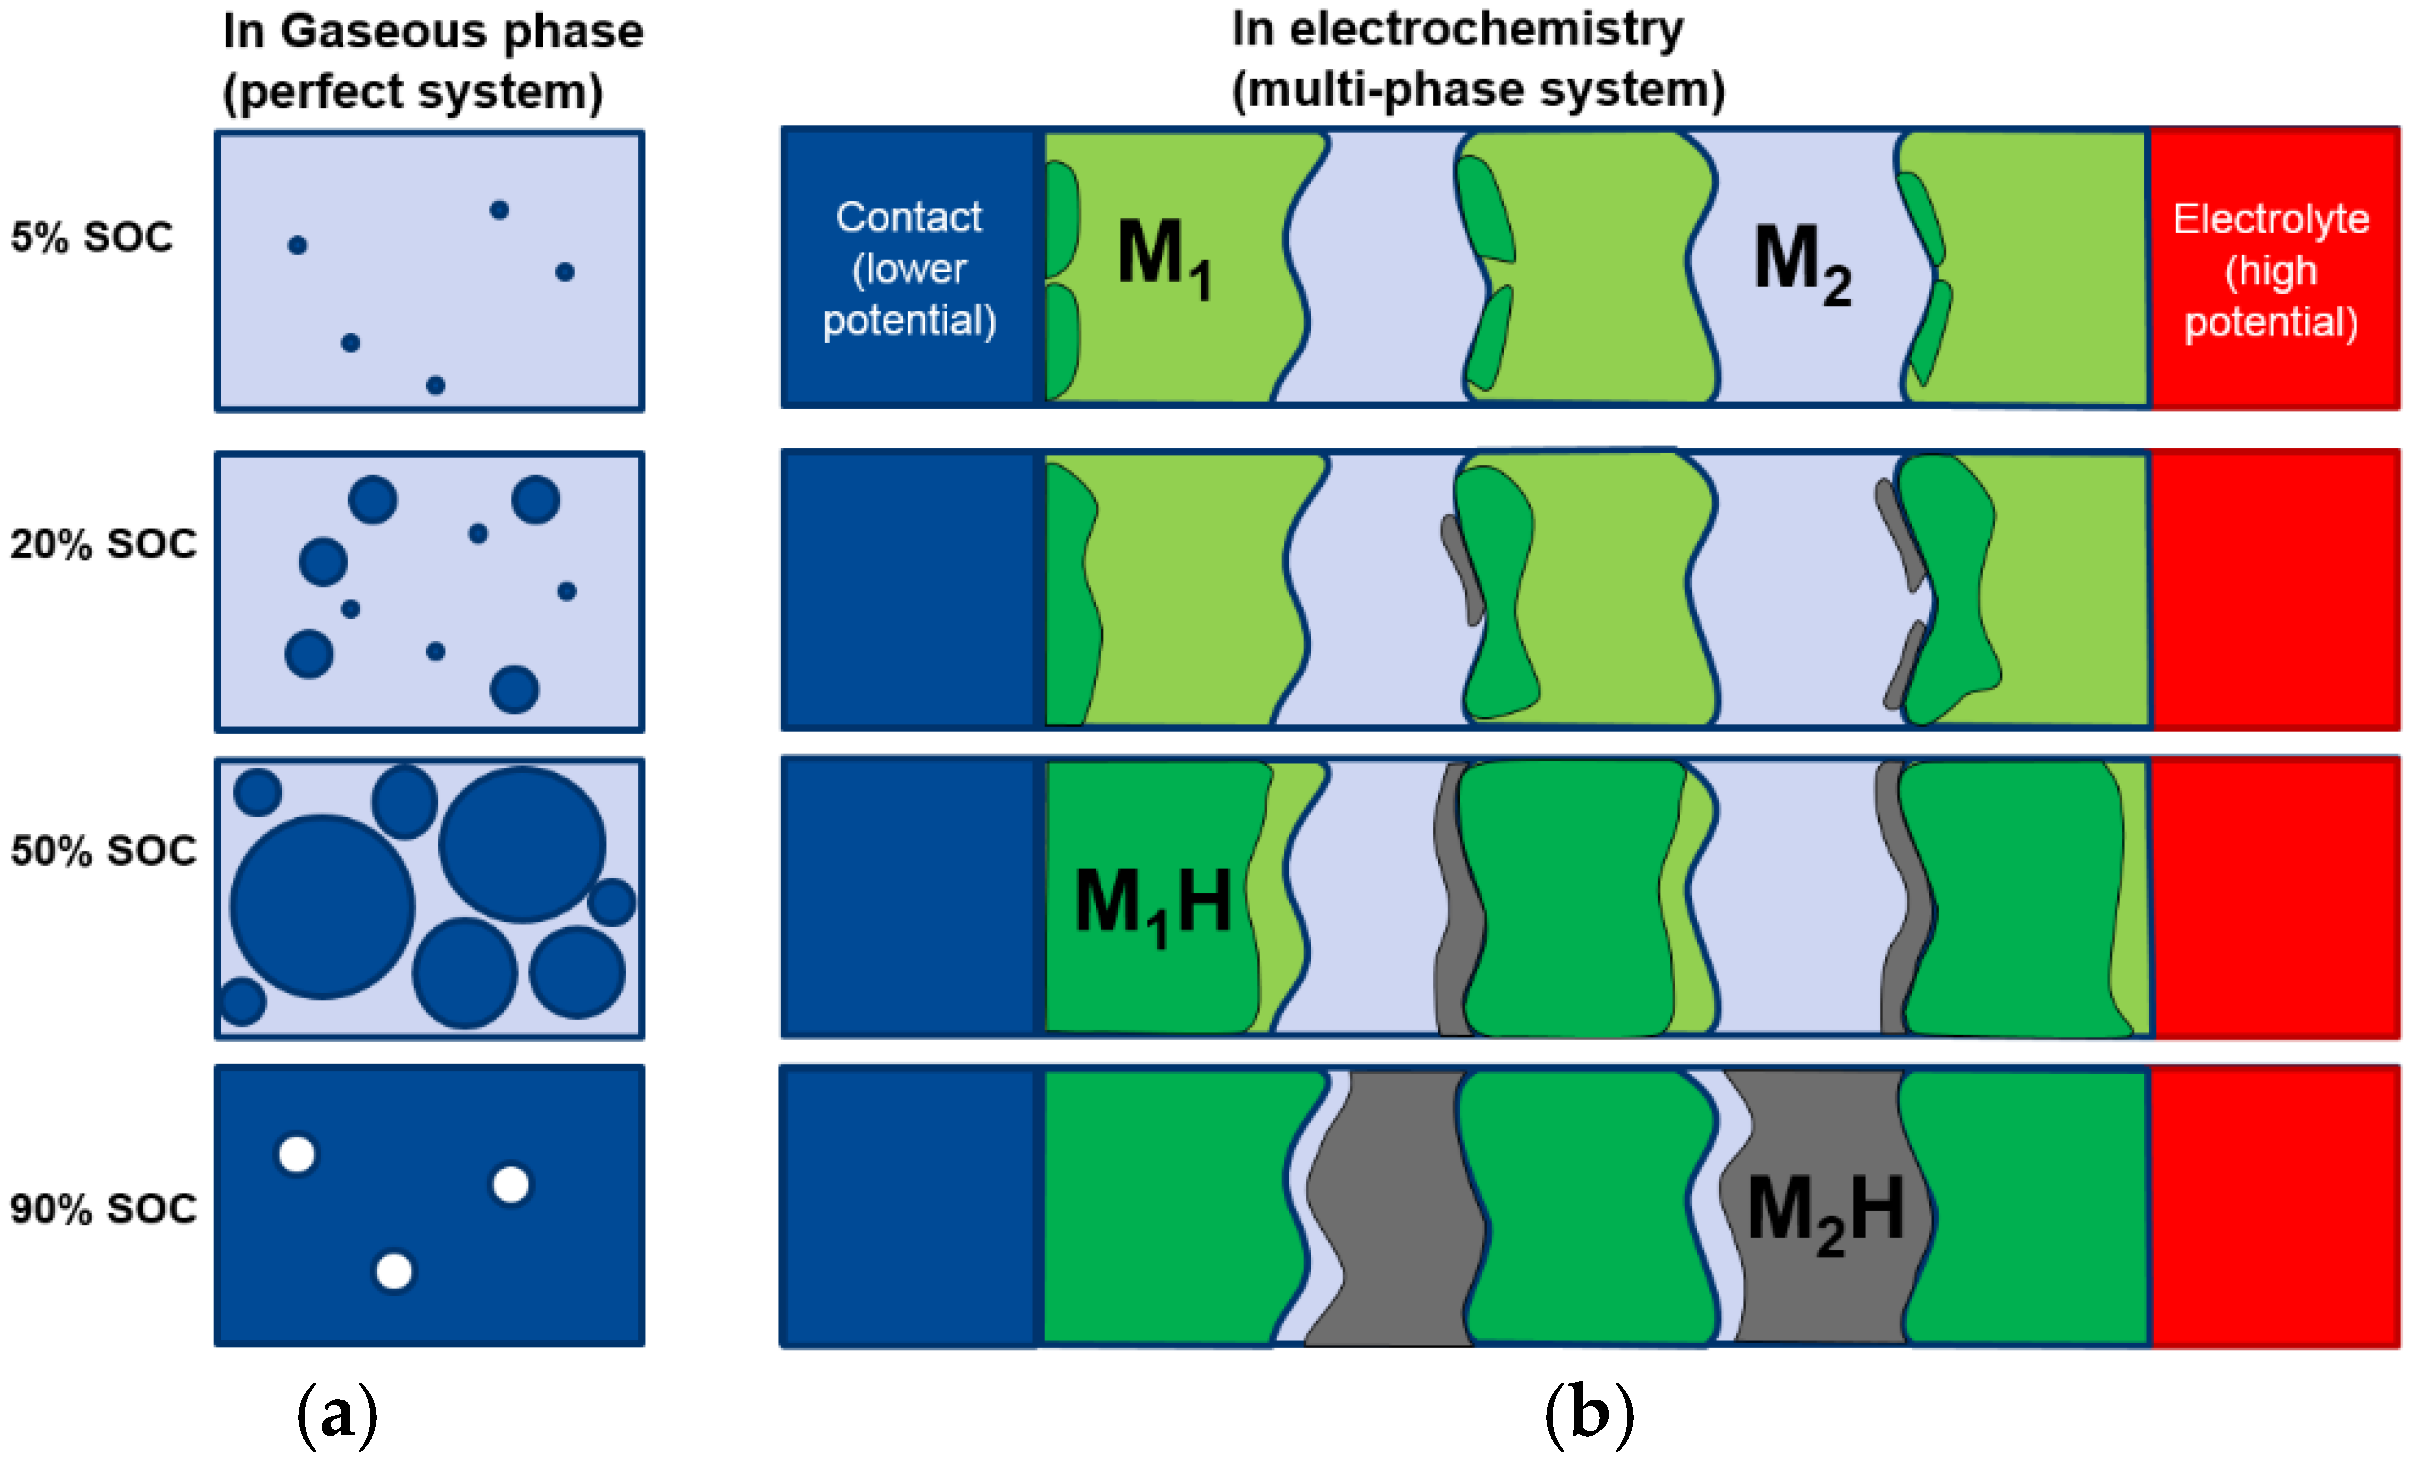
2Ni. There are still MH remaining in the alloy after 8 h of degassing. In order to understand the cause of the remaining hydride after 8 h degassing, a discussion of two dissimilar metals is necessary. When two metallic phases, M1 and M2, with different work functions (differences between the electron potential in vacuum (EVAC) and the Fermi level (EF)) are brought into contact (Figure 12b), there will be a small charge transfer that builds a potential (contact potential), preventing electron flow from the metal with a smaller work function (M2) into the metal with a larger work function (M1). During the initial hydrogenation, the neutral hydrogen (proton plus a nearby electron) will reside on the M1 side of the boundary. The extra electron brought by proton will contribute to the conduction-band and raise the Fermi level, as shown in Figure 12c [
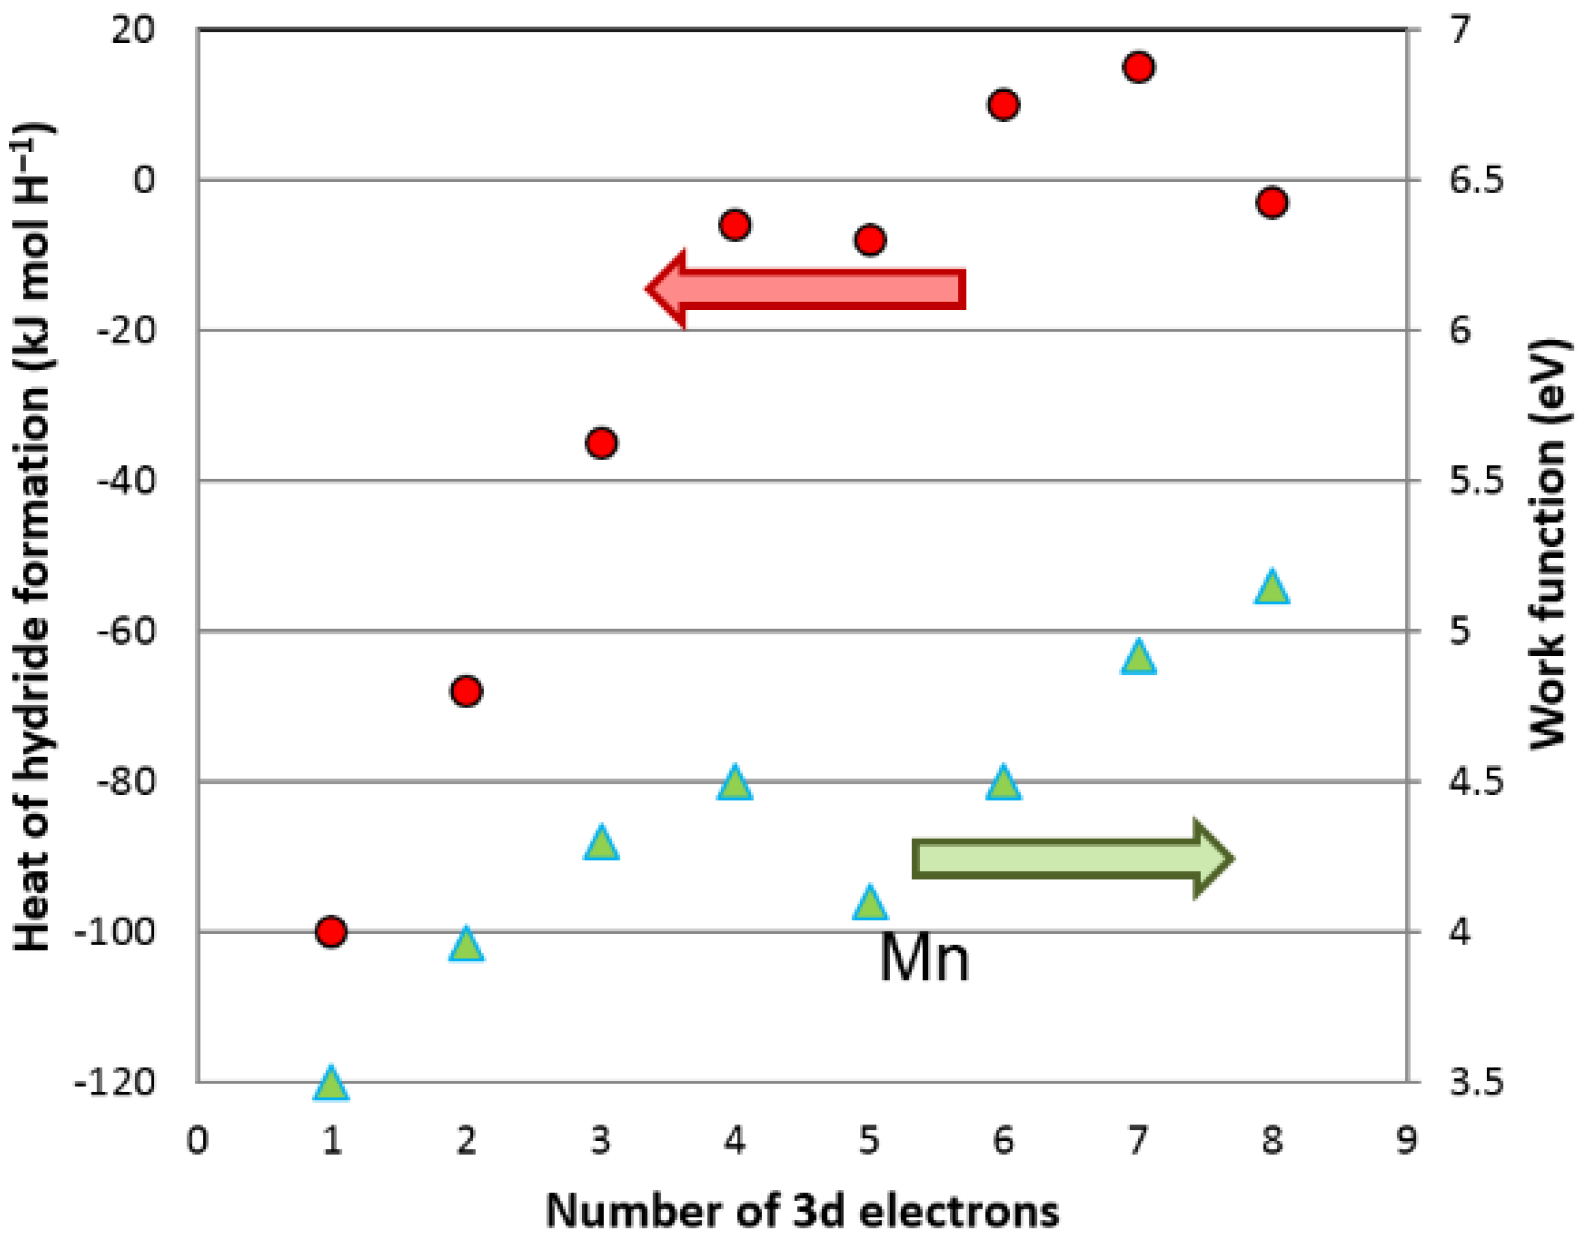
59]. These protons will stay balanced in equilibrium under vacuum. In the case of MH, the hydrogen storage capability of a hydride former metal is related to its own electron density. For the study in MH from elements, the heat of hydride formation (indicator for M–H bond strength) and the work function for the first row of transition metals (from Sc to Ni) were plotted against their number of 3d electron in Figure 13. As the number of electrons increases, the work function increases due to the increase in the charge of the nucleus, and the host metal starts to resist incorporation of extra electrons brought by the absorbed hydrogen and consequently weakens the MH bond strength (less negative ∆H), with the exception of Mn. Mn has an extraordinarily low work function due to its containing of the maximum number of un-paired electrons (five) and also to a lower ∆H than predicted by the trend. For MH from intermetallic alloys, the situation is the opposite. Comparing the alloys LaNi2 and LaNi5, for example, the former has a lower electron density (lower Ni-content), a lower EF (as M1 in Figure 13), and a tendency to trap the residual hydrogen near the interface. According to Equation (3), LaNi2 (33% of La) has a stronger MH bond strength compared to that of LaNi5 (16% of La). Therefore, we believe the phase with a stronger MH bond will keep the MH (β-phase) during a total degassing in vacuum. In this study, C14 and Ti2Ni are deemed to be the phases with the strongest MH bond strength, which agrees with the prediction from Equation (3). These pre-occupied sites at the grain boundary on the side with a higher work function will act as the nucleation center for the β-phase growth (as illustrated in Figure 14). Therefore, the PCT absorption/desorption hysteresis of a single-phase AB5 MH alloy is always larger than that from a typical multi-phase AB2 MH alloy [7].
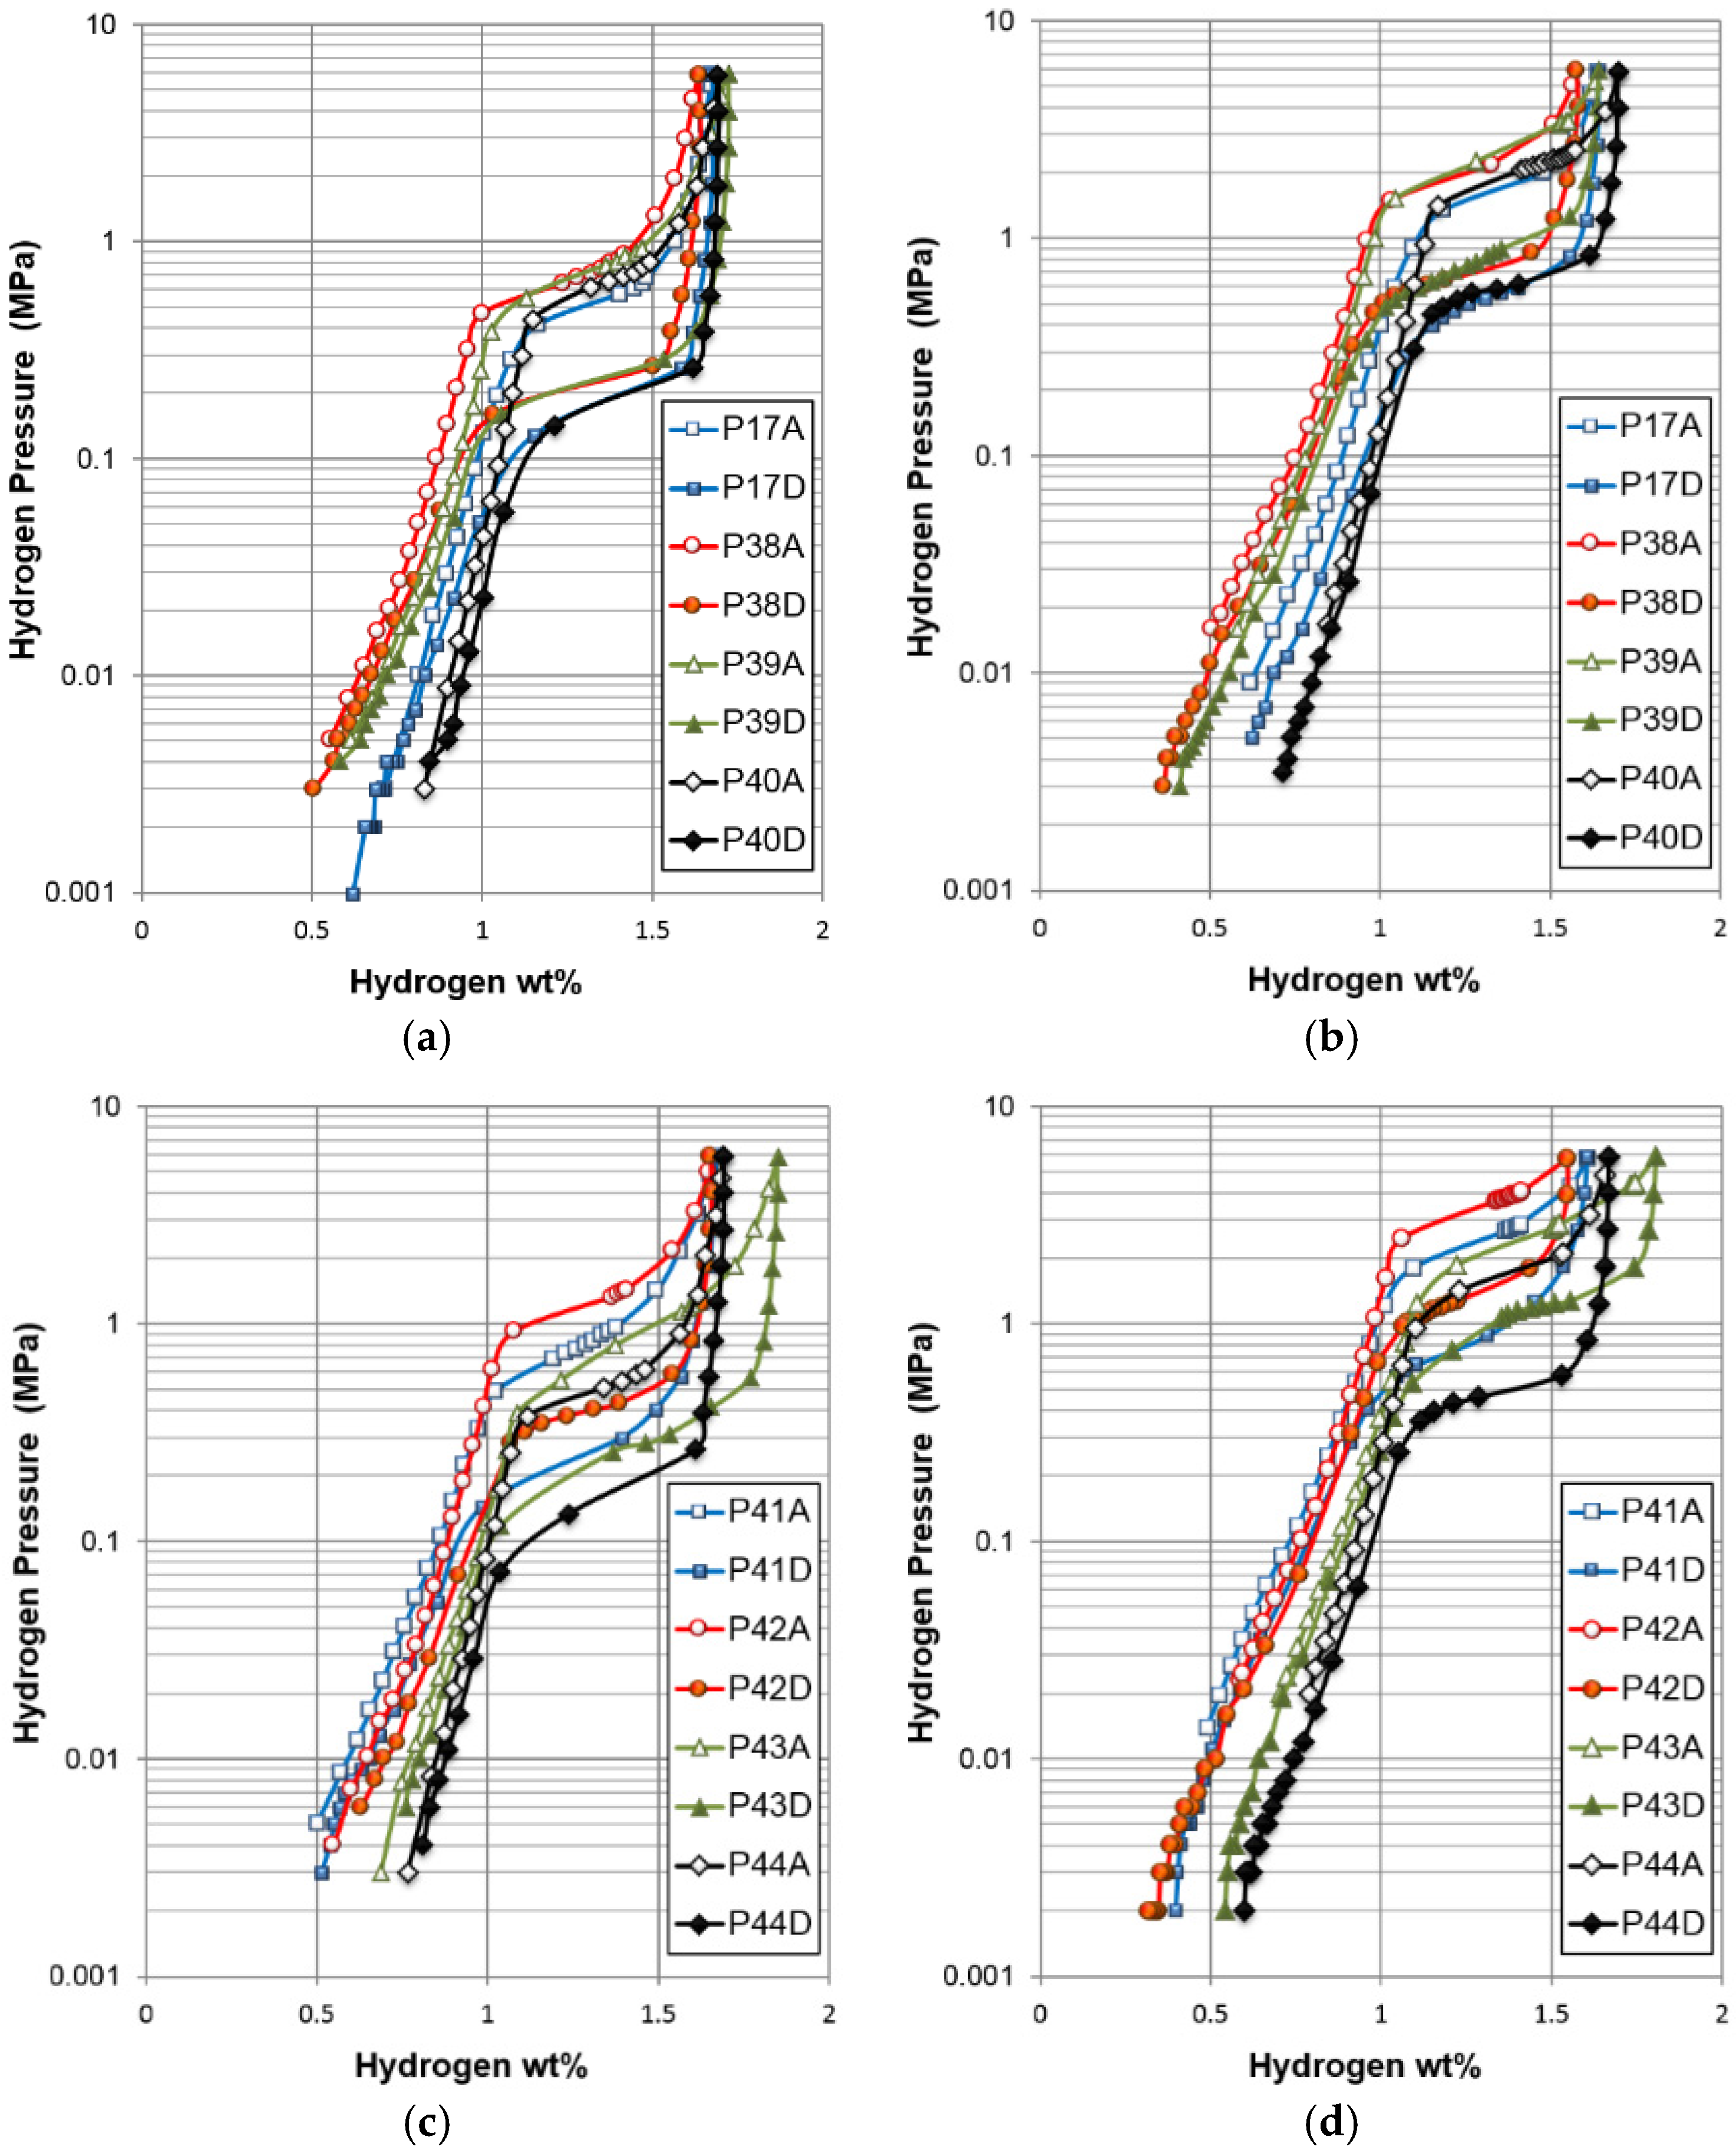
A sample was removed from the PCT apparatus with an equilibrium hydrogen pressure of 0.005 MPa, a pressure that separates the two plateaus in the PCT isotherms, as shown in Figure 5. From previous studies in BCC MH alloys, we believe the oxide layer formed at the alloy surface during the sudden exposure to air can prevent the loss of hydrogen into atmosphere [61]. Its XRD pattern is shown in Figure 11c, and the Rietveld analysis shows an unchanged BCC phase with 2/3 hydrided TiNi and Ti2Ni phase (Table 8) and demonstrates that the higher plateau (from 0.1 MPa to 1 MPa) belongs to the BCC phase. Another sample was removed at the maximum hydrogen pressure (4 MPa). The XRD pattern of this sample shows a 90% transition from BCC (M) to FCC (MH) in the BCC phase and complete α- to β-phase transitions for the other three phases.
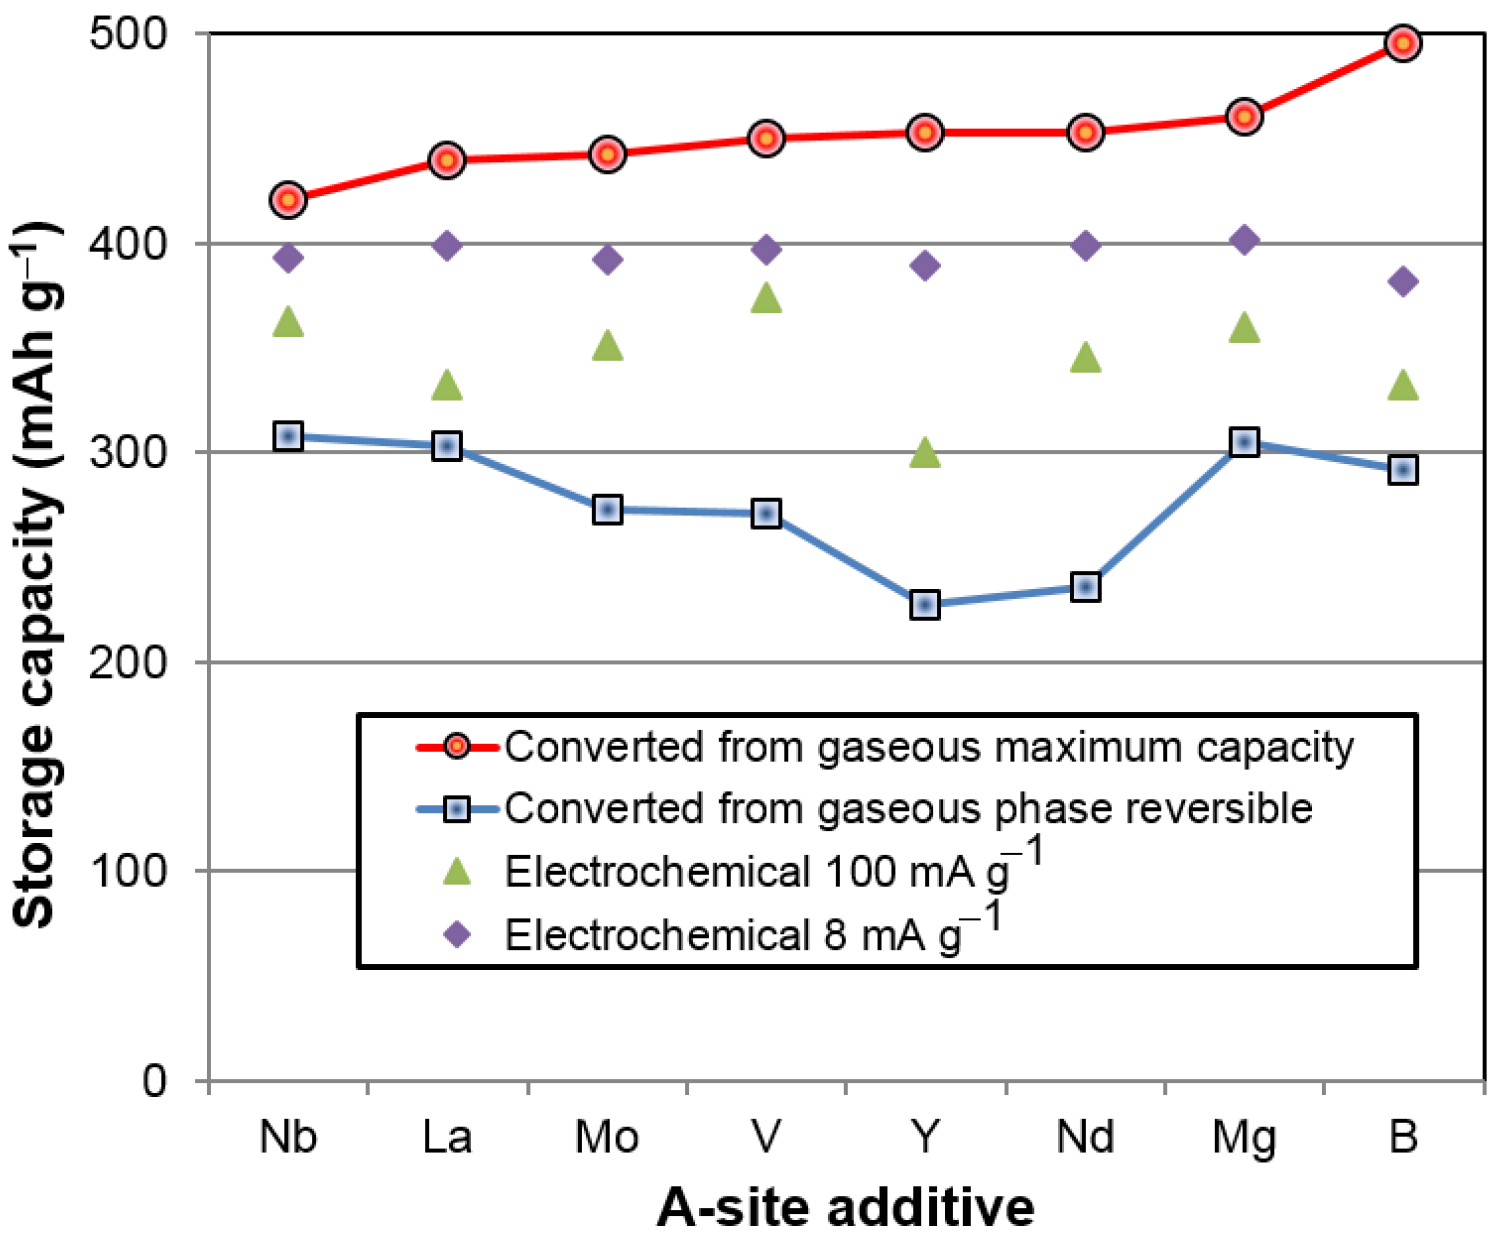
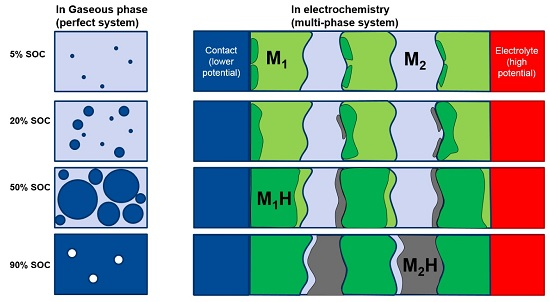
Besides the phase transition in the gaseous phase hydrogen reaction, we also performed XRD analysis on two pieces of electrode made from the same P17 alloy by induction melting with 50% and 100% state of charge (SOC). The resulting patterns are shown in Figure 11e,f. The Rietveld analysis shows a clear α-BCC phase and almost fully hydrided TiNi, Ti2Ni, and C14 phases for the 50% SOC sample, while a 40% hydrided BCC (β-BCC) phase with the other phases fully hydrided are seen for the 100% SOC. During charging, the phases with stronger MH bond strength (more negative ∆
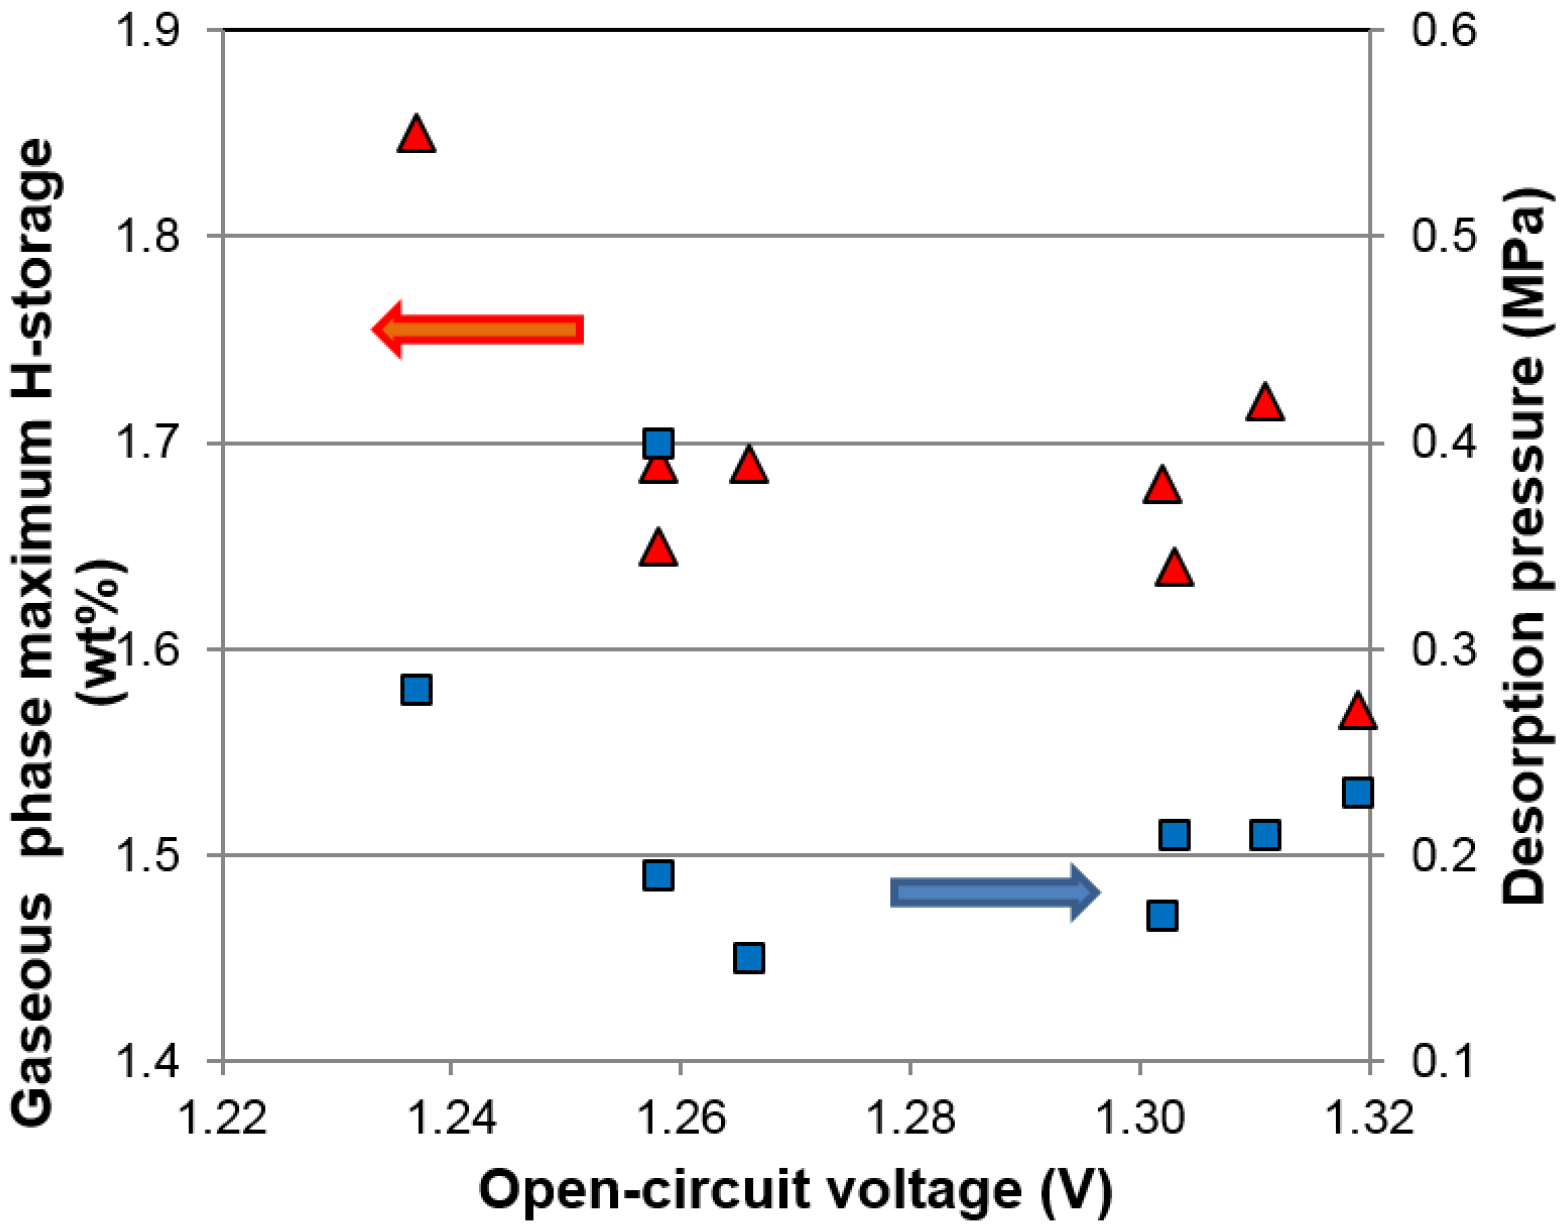
H) were hydrided first, and BCC was charged last, as in the case of the gaseous phase reaction. The BCC phase was not hydrogenated before completion of hydride formation in other non-BCC phases. The BCC phase was never fully charged in the half-cell testing, due to the nature of the open-to-air configuration used in the electrochemical study. This explains the low electrochemical discharge capacity found in Figure 9, when compared to the gaseous phase maximum capacity.
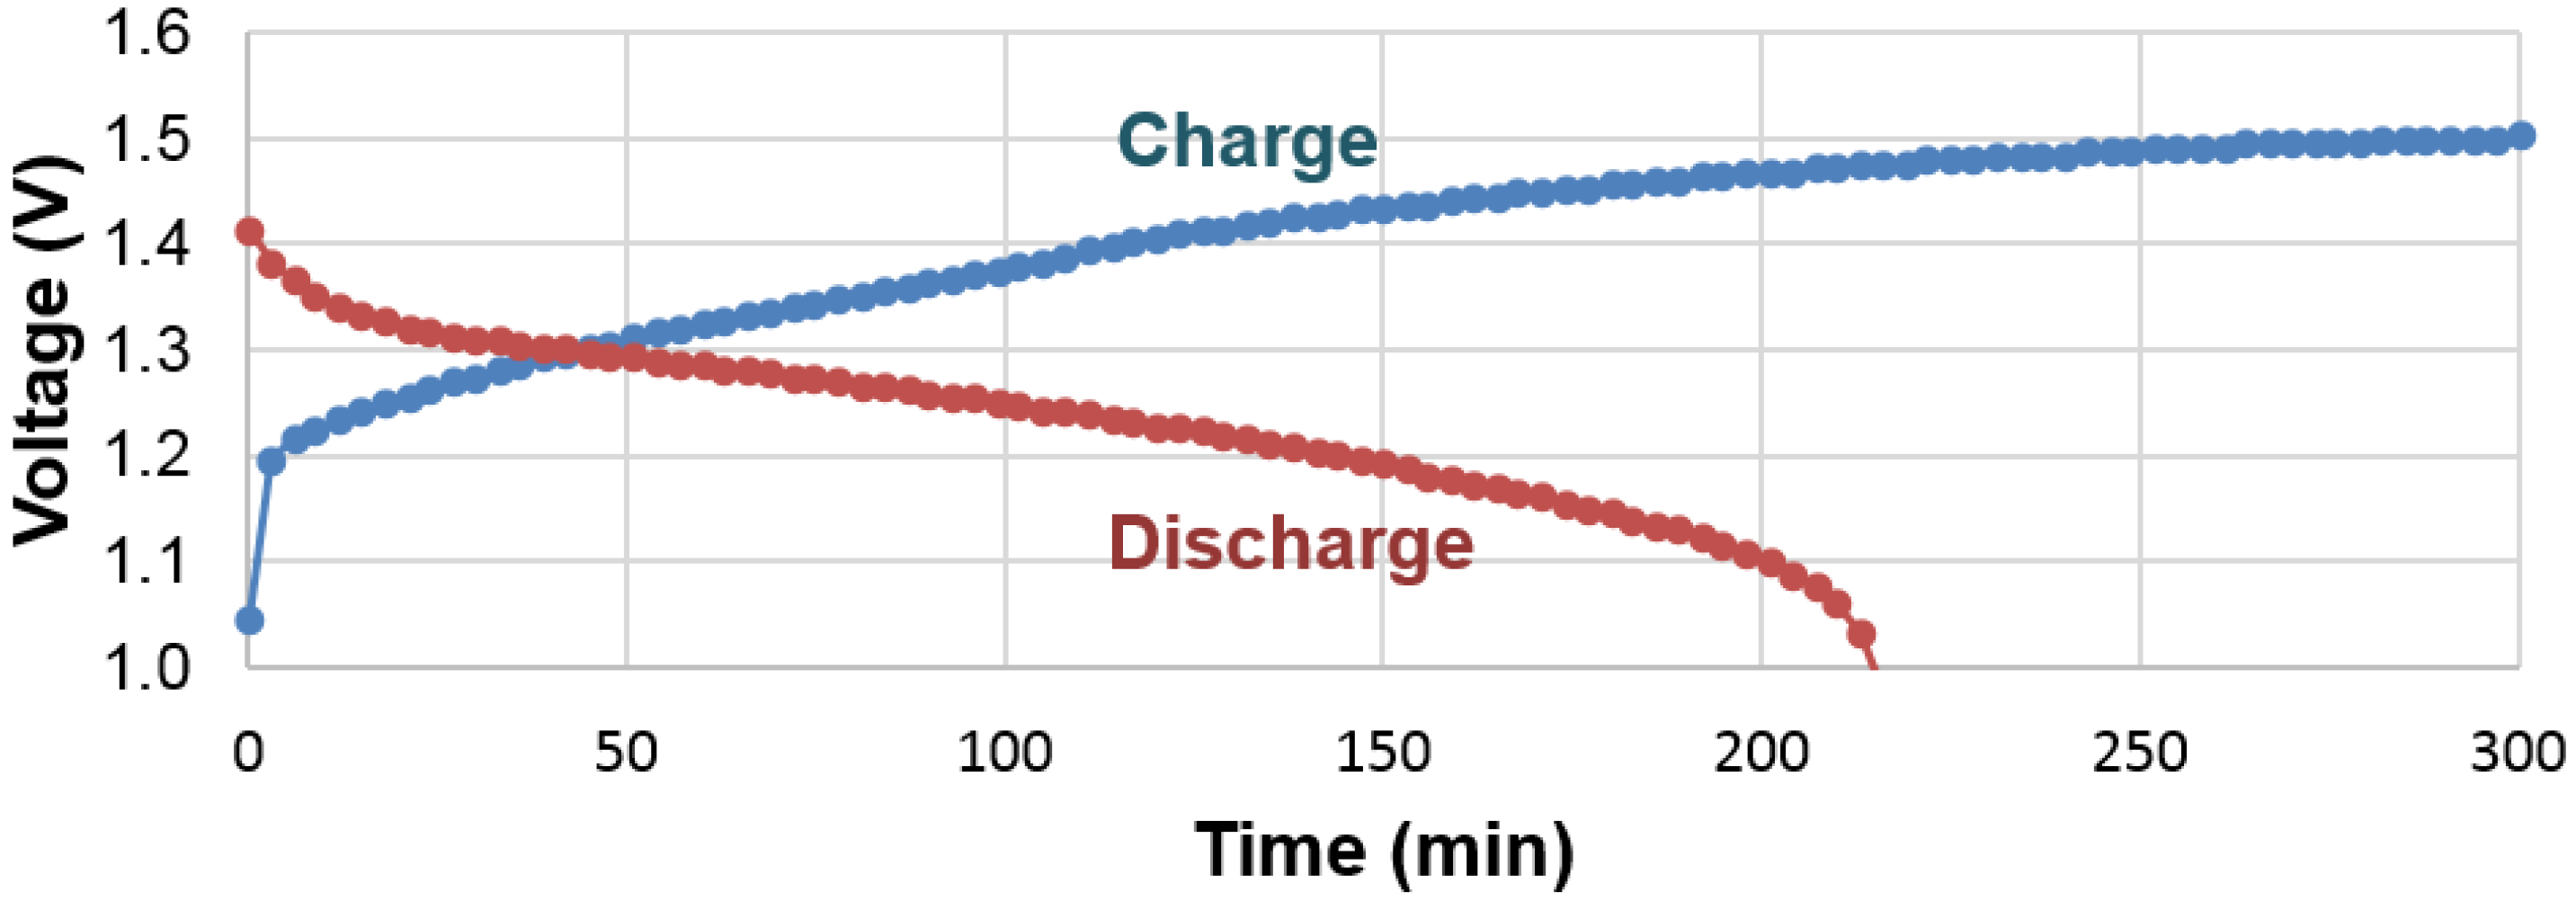
There are some important differences in hydrogen storage between gaseous phase and electrochemistry, especially when the PCT isotherm (Figure 5) is compared with the electrochemical charge and discharge curves (Figure 15). While the gaseous hydrogen charging occurs through hydrogen gas molecule adsorption and splitting into two hydrogen atoms at the clean surface of metals (free from oxide), the electrochemical hydrogen charging is implemented by an applied voltage, which drives electrons into the negative electrode and leads to water splitting at the surface (which is typically covered with a thin oxide [62]). In PCT, hydrogen absorption can begin as soon as any amount of hydrogen gas is available. However, in the case of an electrochemical environment, a minimal voltage is required to generate enough of a strong electric field to split water into protons and hydroxide ions. Also in PCT, the equilibrium pressure depends only on the concentration of hydrogen in the MH; the electrochemical voltage is mainly determined by the surface reaction and thus a sudden change in the charge voltage profile is not seen when the active storing material switches from one phase into another one (at approximately 50% SOC). The discharge processes between the gaseous phase and electrochemistry are also different. For the gaseous phase, the movement of proton is influenced by diffusion and an equilibrium is reached when the same amount of hydrogen gas leaves and enters the metal. The electrochemical case is far more complicated. During discharge, the electron moves away from the MH alloy into the current collector, which forces the proton to move in the opposite direction, reaching the surface. Unless the surface recombination of either proton-hydroxide or proton-oxygen is very slow (which is unlikely) and there is a large number of protons accumulated at the electrolyte interface, the proton should continue to arrive at the interface to reach charge neutrality. Energy is gained from both the reduction in number of electrons in the metal system and the dehydride process. Therefore, there is no sudden drop in the discharge voltage profile when the system finishes discharging for one phase and starts the discharge for the next phase. This finding is very encouraging with regard to the electrochemical applications of MH alloys. In a multi-phase system, as long as there is an electrochemically active phase, the so called “irreversible” or “no participation” phases found in PCT can be fully utilized in the electrochemical environment. This finding can be used to explain the unpredicted high electrochemical capacity (compared to the gaseous phase capacities) observed in multi-phase systems involving the Zr2Ni7 phase [8,9].
With the knowledge that the visible plateaus of the PCT isotherm in the 0.1–1 MPa range originate entirely from the phase transition from BCC to FCC, the mechanism of this step, at equilibrium pressure in pure BCC alloys [61,63], is not well understood. Evidently, with synergetic effects through the non-BCC phases, the intermediate body-centered-tetragonal (BCT) phase is skipped. Although the hysteresis of the BCC phase is still very large (compared to all other MH alloy families), it has been significantly reduced through the synergetic effects of the non-BCC phases. In this study, it is clearly observed that, during hydrogenation, the non-BCC phases hydrogenate first and expand the lattice on the non-BCC phase side of the grain boundary. The lattice of the BCC phase is also pre-expanded before hydrogenation by the stress from the hydride on the other side, which reduces the energy barrier needed to expand the BCC lattice, and thus reduces the hysteresis and changes the FCC β-phase directly.
After we identified BCC as the storage phase and the others (C14, TiNi, and Ti
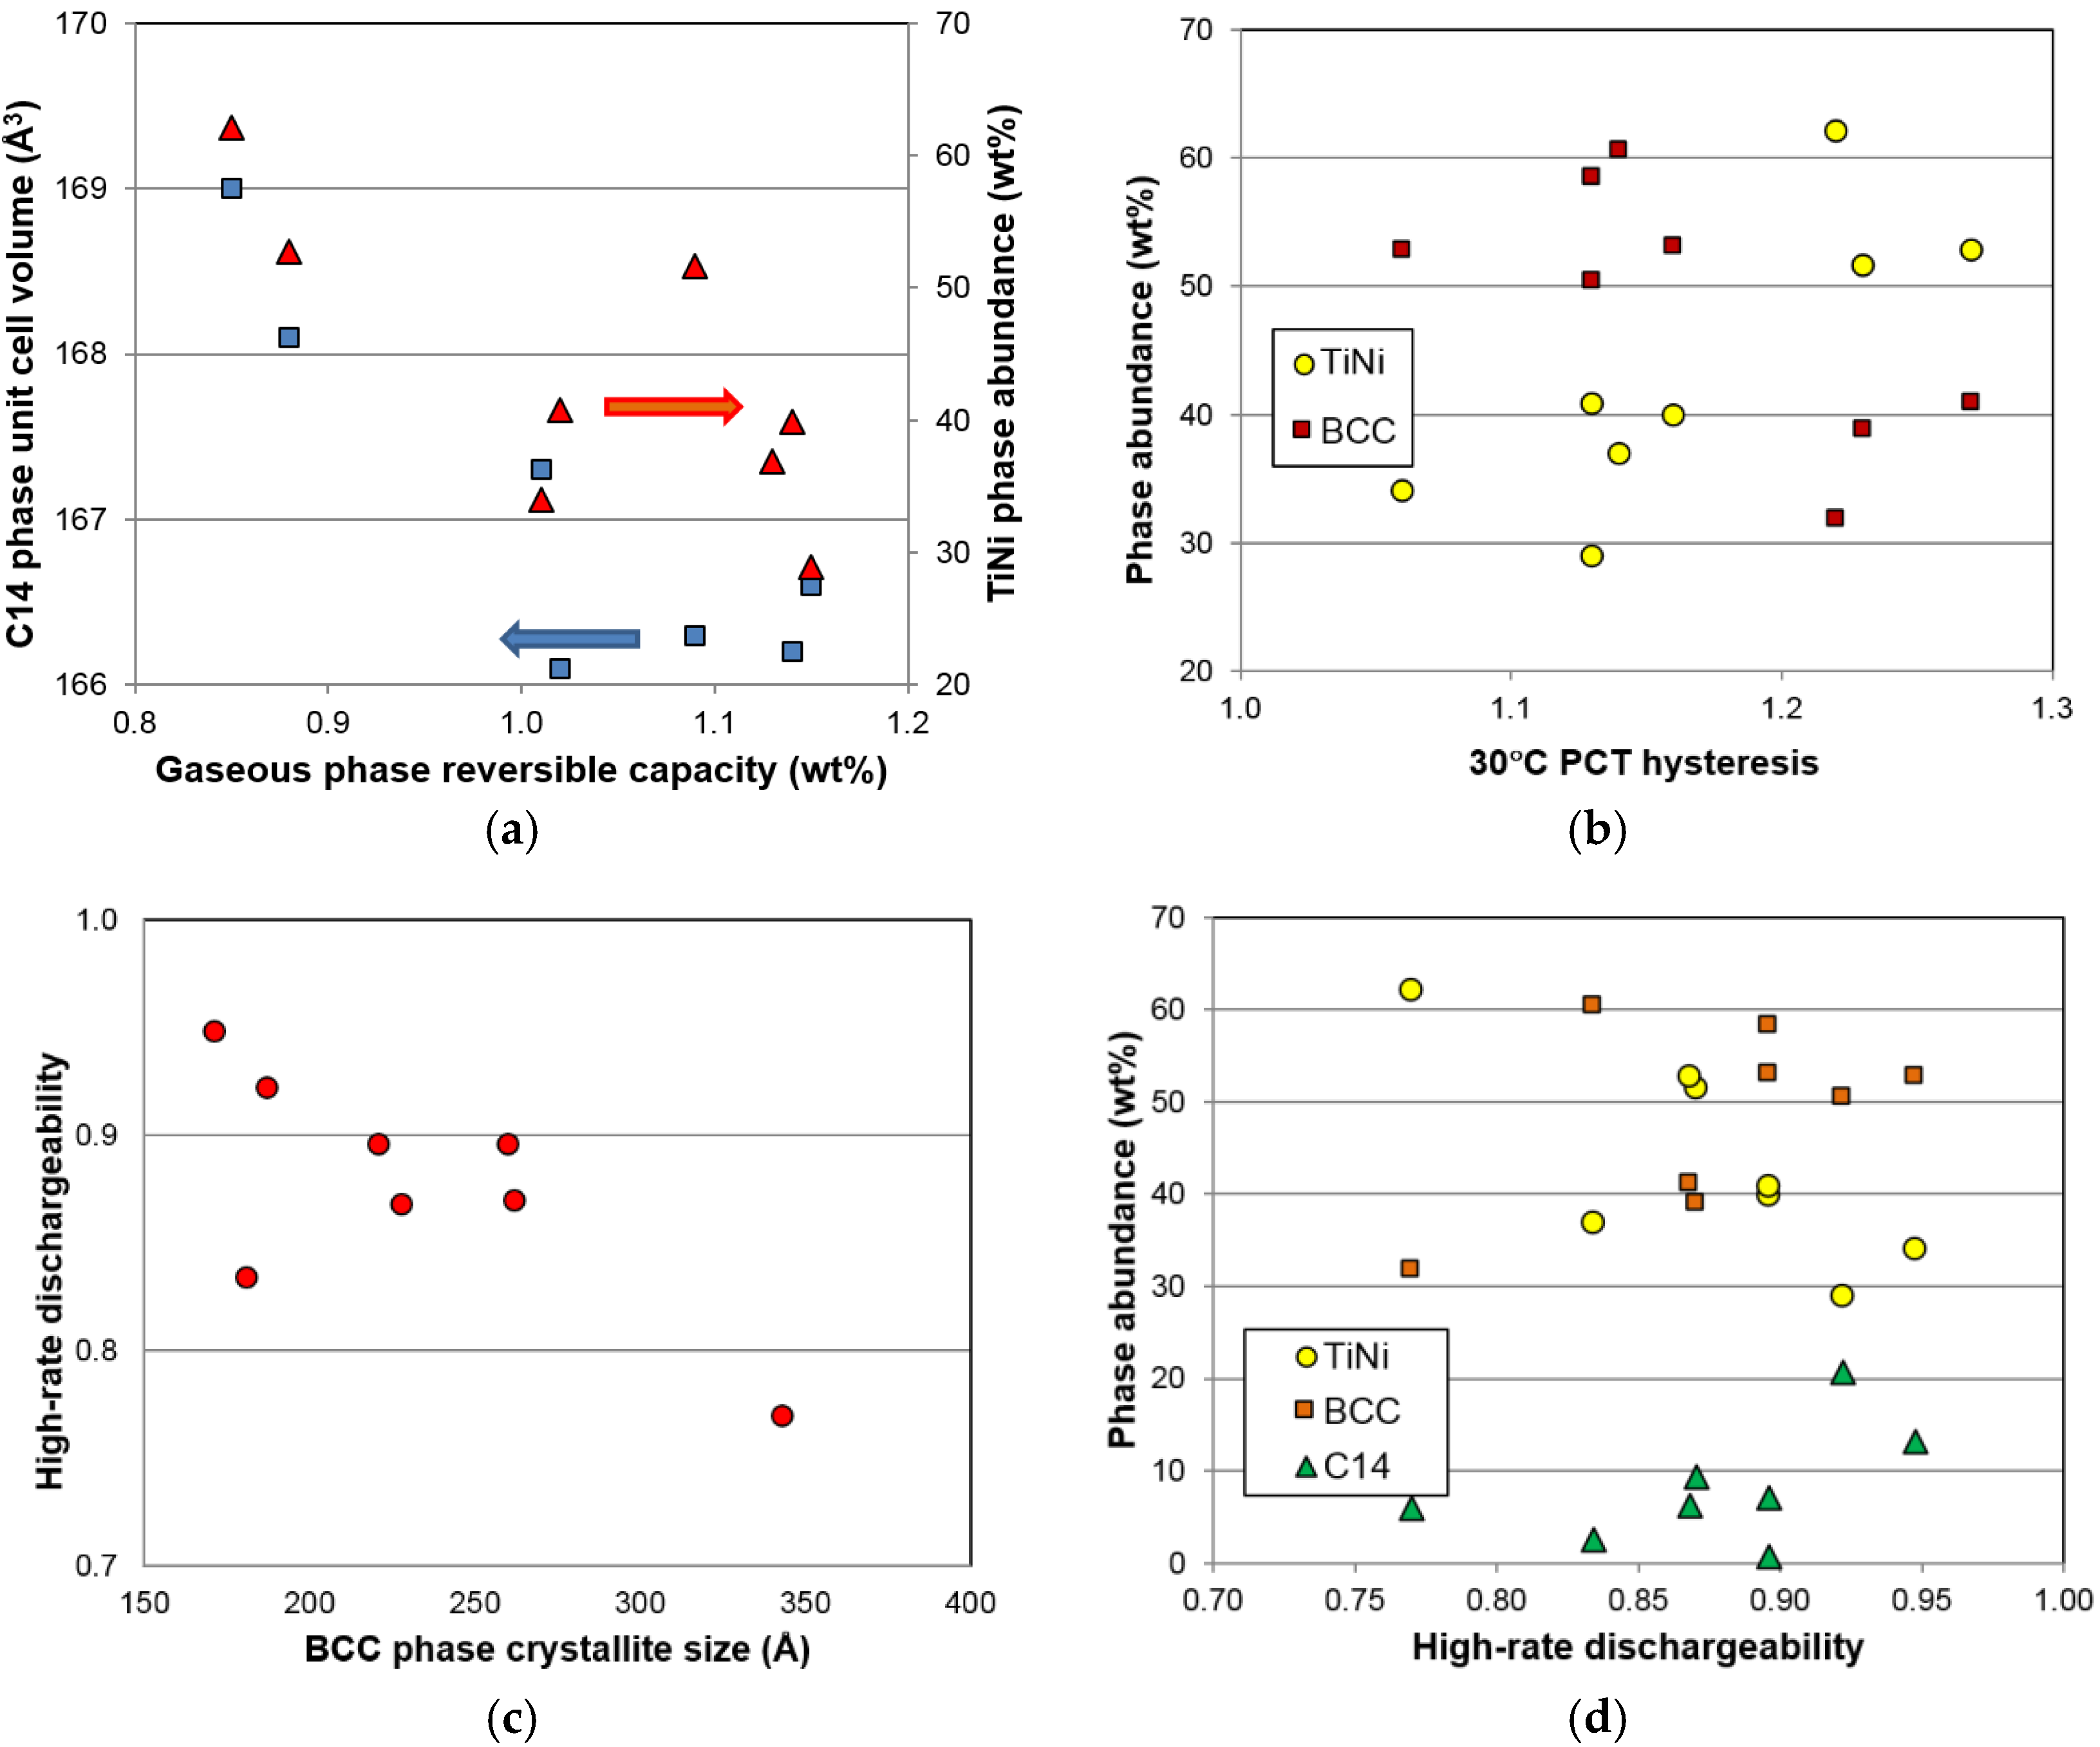
2Ni) as the catalytic phase, a correlation study between the properties of the constituent phases and the hydrogen storage characteristics (both in gaseous phase and electrochemistry) was conducted; the results are summarized in Table 9. Those with significant correlation (larger 
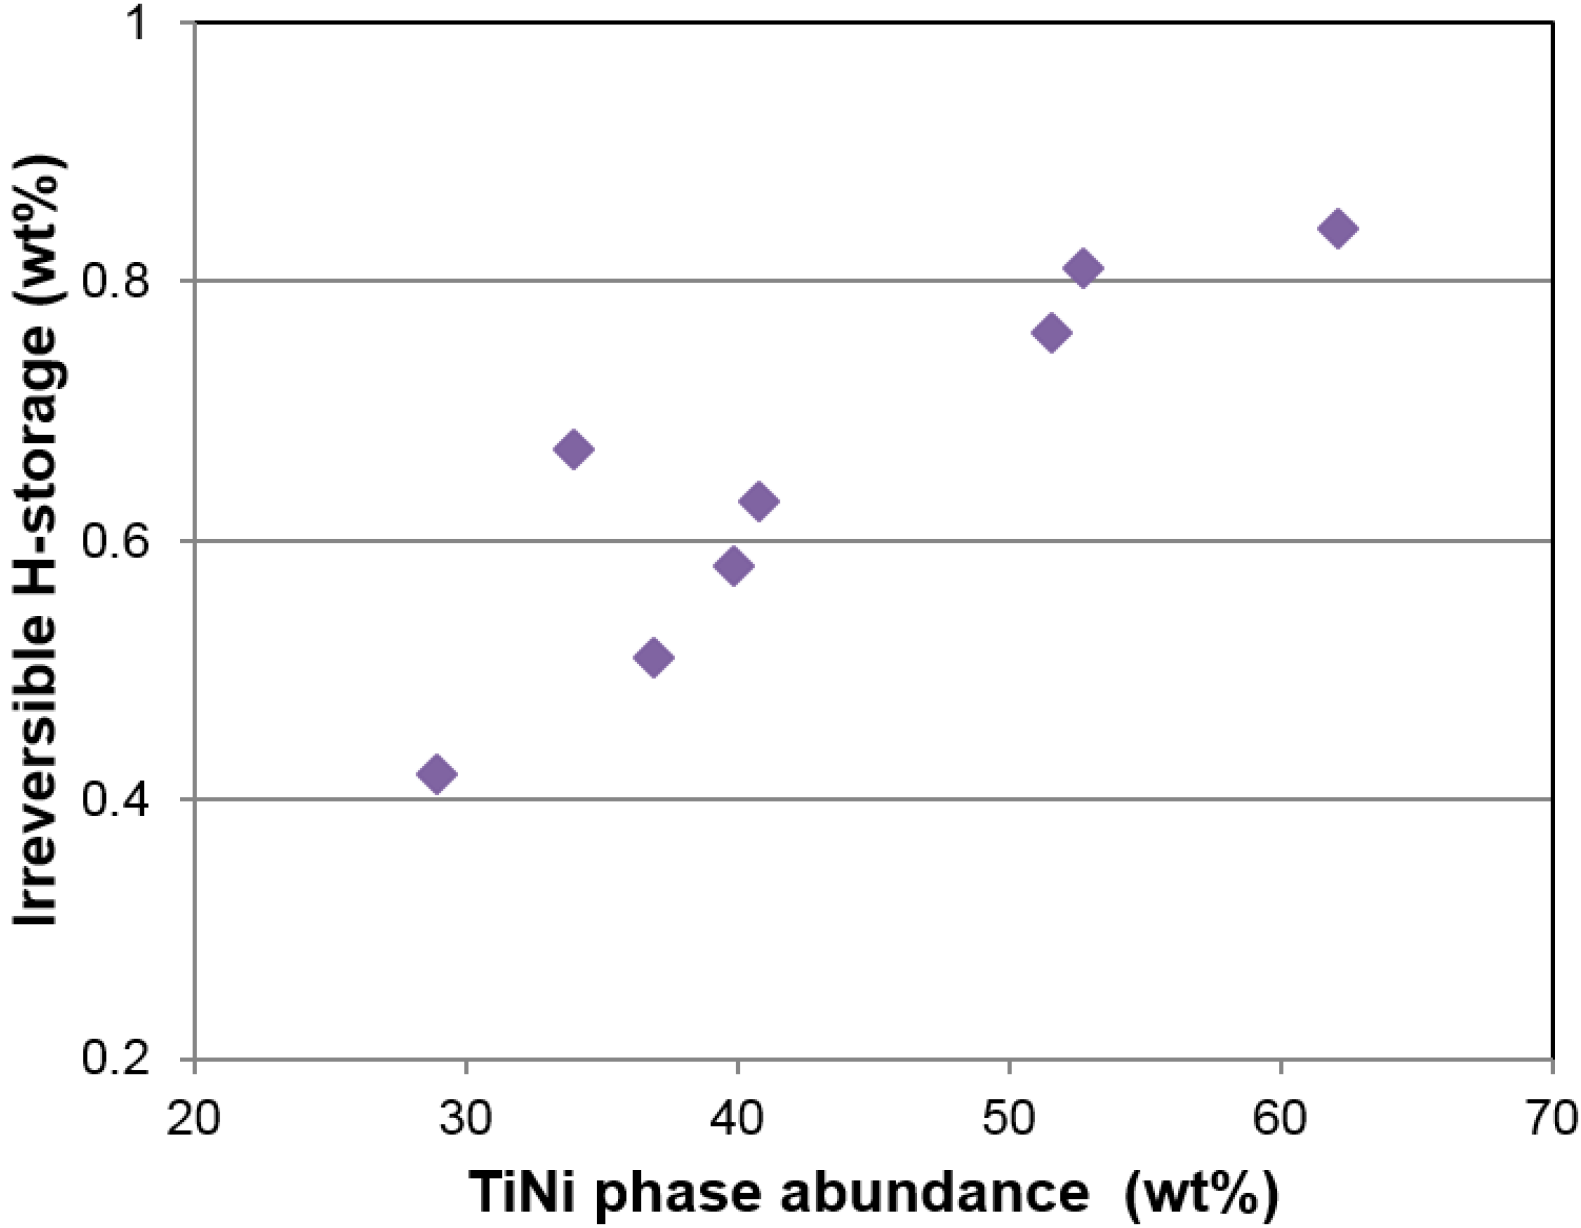
R2) are highlighted. There are two noticeable correlations in the gaseous phase properties. The first is the reversible capacity, which decreases with the increase in TiNi phase abundance and C14 unit cell volume (Figure 16a). The former has already been explained by the TiNi phase being the largest component in the lower plateau (not seen from the PCT isotherm in Figure 5) and makes the largest contribution to the irreversible part of the gaseous phase hydrogen storage capacity (Figure 6). The source of the latter correlation is less clear. C14, although it has a relatively low ∆H, may be still a catalytic phase. With the decrease in the unit cell volume, hydride from the C14 phase becomes less stable and contributes positively to the reversible capacity of the storage phase (TiNi and BCC). The second noticeable correlation found in the gaseous phase properties is related to the PCT hysteresis—more precisely, the hysteresis of the BCC phase. It has been found that the 30 °C PCT hysteresis increases with increasing TiNi phase abundance and decreasing BCC phase abundance (Figure 16b). Many studies have been conducted on the PCT hysteresis (for a review see [64]). It is generally accepted that the PCT hysteresis is the elastic energy needed for the deformation of the lattice near the α-β boundary. Higher PCT hysteresis in an MH alloy increases the difficulty of hydrogenation. From this aspect, the BCC phase facilitates reaction, while TiNi phase retards the hydrogenation of the BCC phase, which is very difficult to observe from the large value of hysteresis since it involves phase changes from BCC to FCC [6].
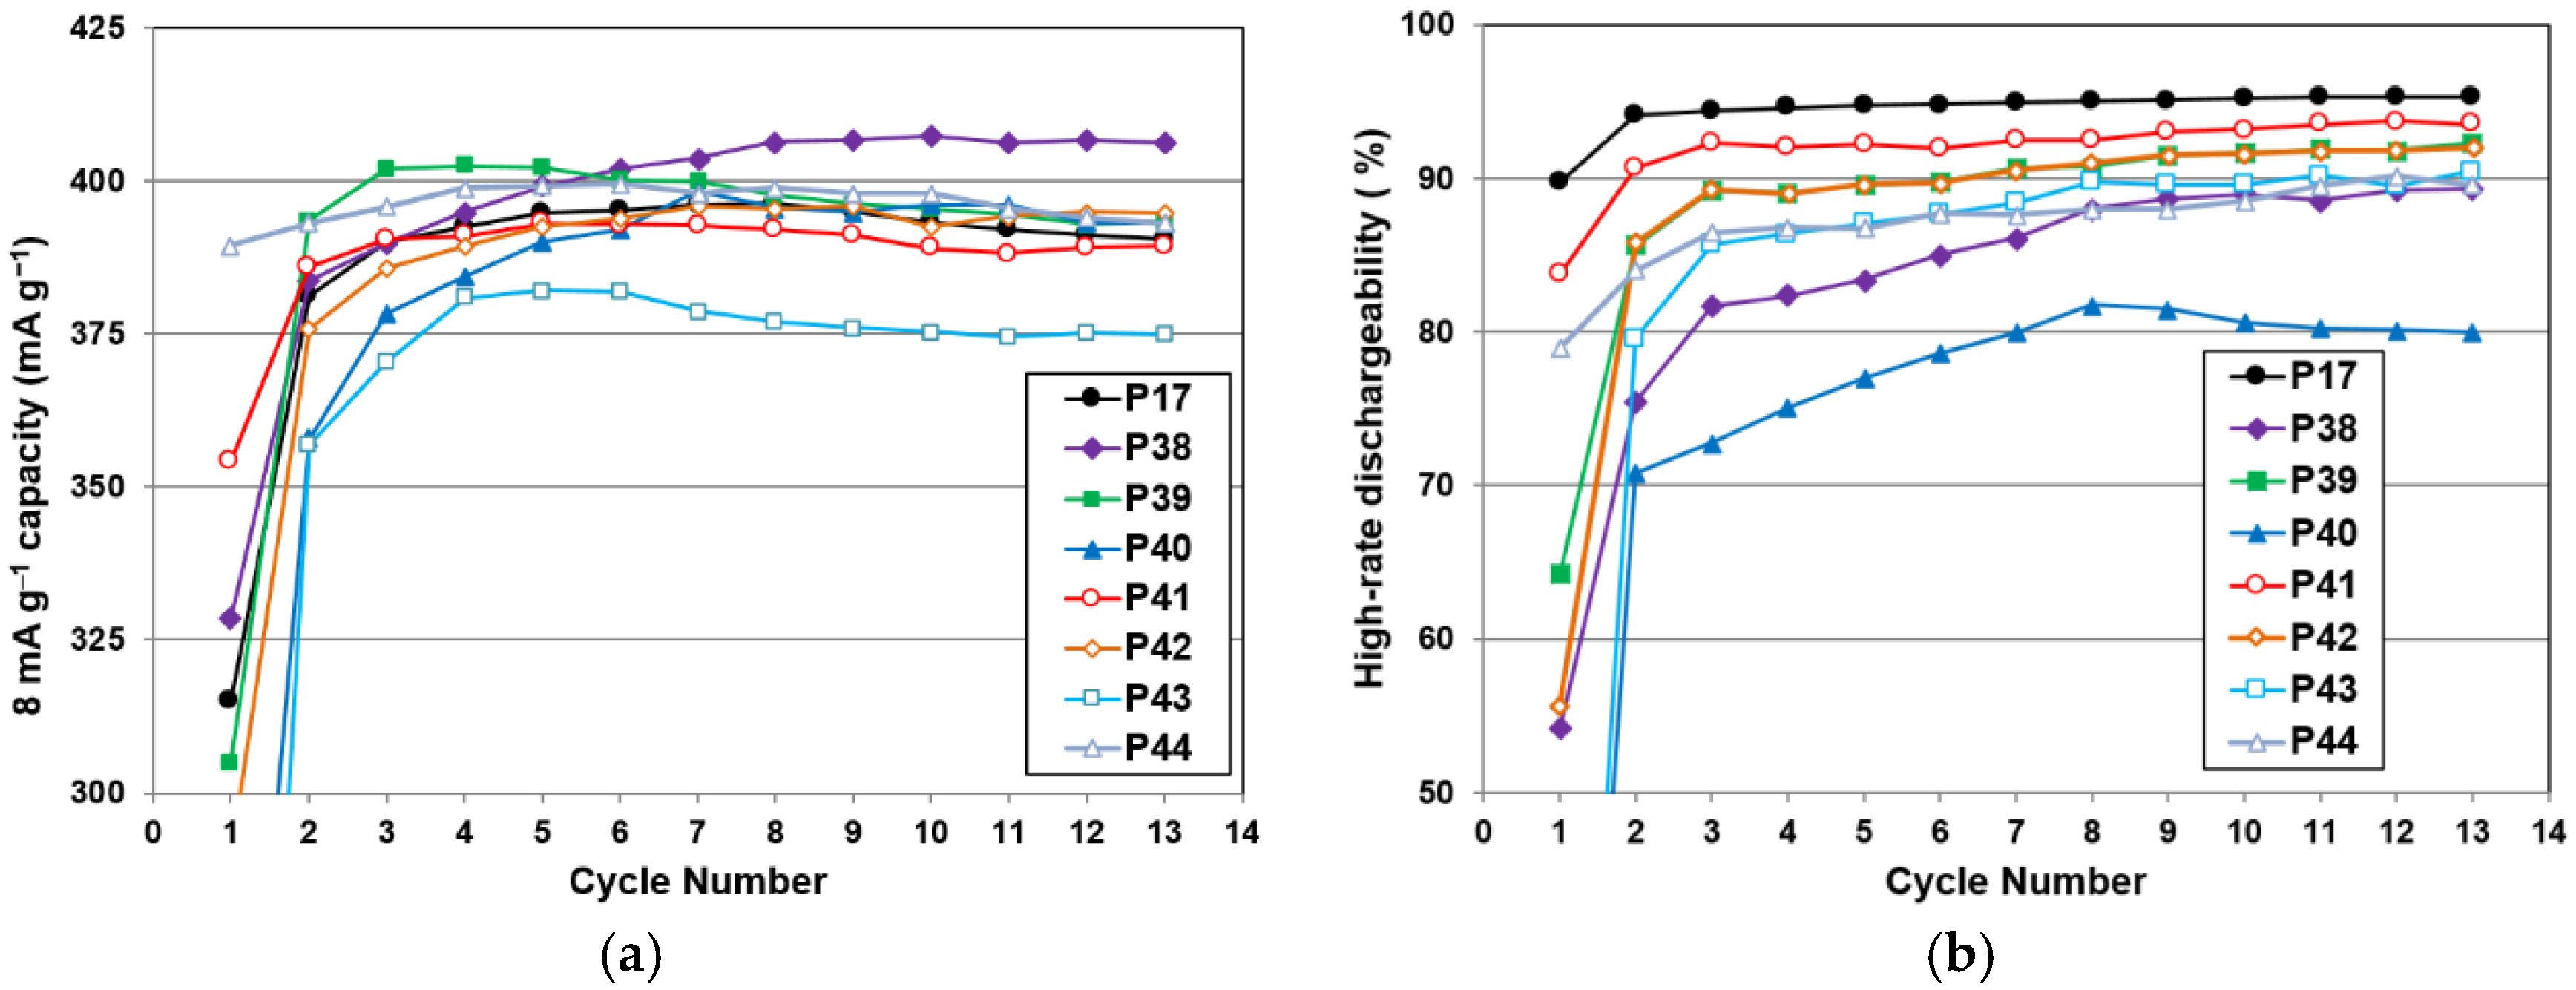
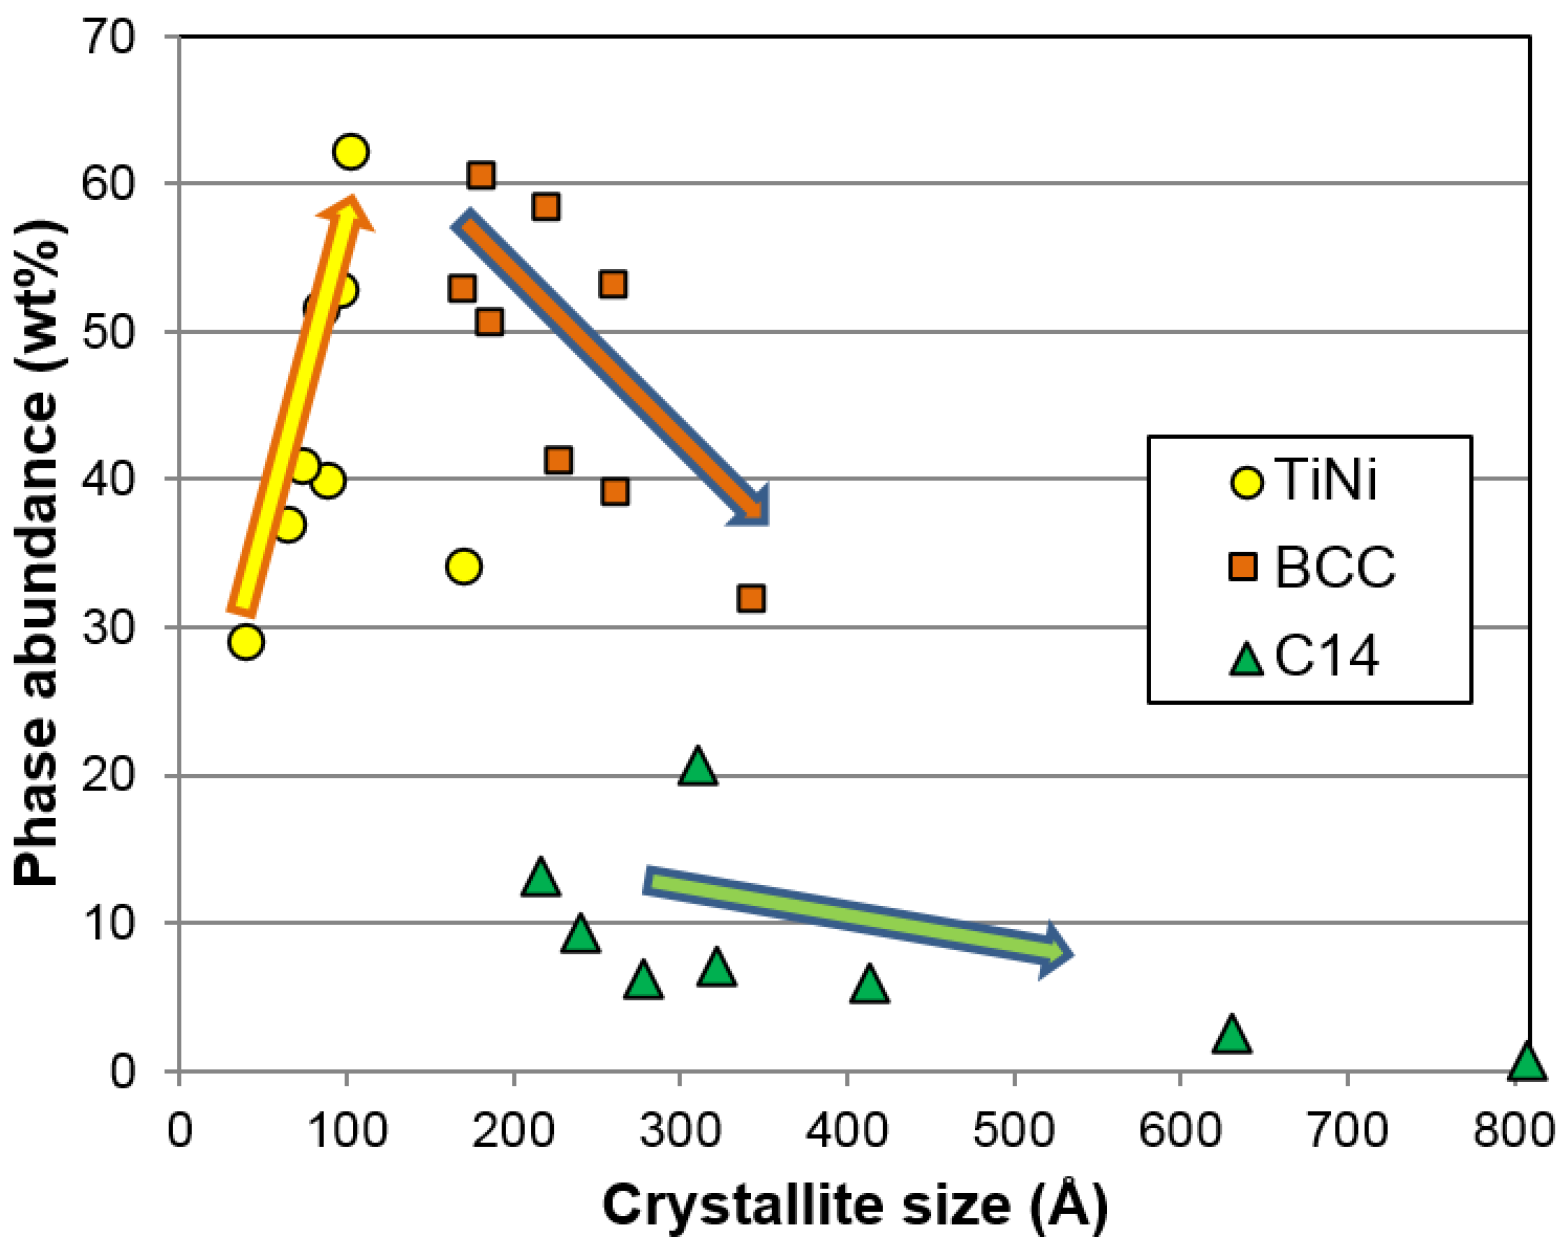
As for correlation to the electrochemical properties, both the BCC crystallite size and the TiNi phase abundance show significant correlation to the high-rate discharge performance. A smaller crystallite in the BCC phase is more desirable, as it gives better high-rate performance (Figure 16c). It is possible that smaller crystallite sizes will generate more grain boundaries (shown in Figure 12c) and facilitate more charge transfer between the two phases. The phase abundances from the three major phases are plotted against HRD in Figure 16d. The general trends suggest that the BCC and C14 phases are more beneficial to HRD, while the TiNi phase deteriorates it.

5. Conclusions

In this study on the synergetic effects in MH alloys, we challenge the argument that the catalytic phase must have a weaker MH bond strength compared to that in the main storage phase. The C14 phase, with an ostensibly stronger MH bond, contributes to the reversibility in the hydrogen storage of other storage phases. The BCC phase, in a multi-phase system, demonstrates a relatively weak MH bond. On the other hand, the TiNi phase, also with a strong MH bond, hinders the hydrogenation of the BCC phase. The driving force for proton movement in the alloy varies for gaseous phase and electrochemistry. The former occurs by diffusion and the equilibrium with gaseous hydrogen at the clean surface, while the latter proceeds via the electric field and the local distribution of valence electrons. The synergetic effects in a multi-phase MH system can be explained by the pre-occupied hydrogen sites on the side of the metal with a larger work function near the grain boundary.

Acknowledgments

The authors would like to thank the following individuals from BASF-Ovonic for their help: Su Cronogue, Baoquan Huang, Jean Nei, David Pawlik, Allen Chan, and Ryan J. Blankenship.

Author Contributions

Kwo-hsiung Young conceived and designed the experiments; Taihei Ouchi performed the experiments; and Tiejun Meng and Diana Wong analyzed, interpreted the data, and prepared the manuscript.

Conflicts of Interest

The authors declare no conflict of interest.

Abbreviations

BCCBody-centered-cubic
BCTBody-centered-tetragonal
FCCFace-centered-cubic
MHMetal hydride
PCTPressure-centration-temperature
M–HMetal–hydrogen
XRDX-ray diffraction
HRDHigh-rate dischargeability
ICP-OESInductively coupled plasma-optical emission spectrometer
SEMScanning electron microscopy
EDSEnergy-dispersive spectroscopy
BEIBackscattering electrode image
TEMTransmission electron microscopy
e/aAverage electron density
OCVOpen-circuit voltage
EVACVacuum potential
EFFermi level
WWork function
SOCState of charge

References

  1. Visintin, A.; Peretti, A.A.; Fruiz, F.; Corso, H.L.; Triaca, W.E. Effect of additional catalytic phases imposed by sintering on the hydrogen absorption behavior of AB2 type Zr-based alloys. J. Alloys Compd. 2007, 428, 244–251. [Google Scholar] [CrossRef]
  2. Wong, D.F.; Young, K.; Nei, J.; Wang, L.; Ng, K.Y.S. Effects of Nd-addition on the structural, hydrogen storage, and electrochemical properties of C14 metal hydride alloys. J. Alloys Compd. 2015, 647, 507–518. [Google Scholar] [CrossRef]
  3. Boettinger, W.J.; Newbury, D.E.; Wang, K.; Bendersky, L.A.; Chiu, C.; Kattner, U.R.; Young, K.; Chao, B. Examination of multiphase (Zr,Ti)(V,Cr,Mn,Ni)2 Ni-MH electrode alloys: Part I. Dendritic solidification structure. Metall. Mater. Trans. A 2010, 41, 2033–2047. [Google Scholar] [CrossRef]
  4. Bendersky, L.A.; Wang, K.; Boettinger, W.J.; Newbury, D.E.; Young, K.; Chao, B. Examination of multiphase (Zr,Ti)(V,Cr,Mn,Ni)2 Ni-MH electrode alloys: Part II. Solid-state transformation of the interdendritic B2 phase. Metall. Mater. Trans. A 2010, 41, 1891–1906. [Google Scholar] [CrossRef]
  5. Liu, Y.; Young, K. Microstructure investigation on metal hydride alloys by electron backscatter diffraction technique. Batteries 2016. submitted for publication. [Google Scholar]
  6. Shen, H.; Young, K.; Bendersky, L.A. Clean grain boundary found in C14/bcc multi-phase metal hydride alloys. Batteries 2016. submitted for publication. [Google Scholar]
  7. Mosavati, N.; Young, K.; Meng, T.; Ng, K.Y.S. Electrochemical open-circuit voltage and pressure-concentration-temperature isotherm comparison for metal hydride alloys. Batteries 2016, 2. [Google Scholar] [CrossRef]
  8. Young, M.; Chang, S.; Young, K.; Nei, J. Hydrogen storage properties of ZrVxNi3.5−x (x = 0.0–0.9) metal hydride alloys. J. Alloys Compd. 2013, 580, S171–S174. [Google Scholar] [CrossRef]
  9. Young, K.; Young, M.; Chang, S.; Huang, B. Synergetic effects in electrochemical properties of ZrVxNi4.5−x (x = 0.0, 0.1, 0.2, 0.3, 0.4, and 0.5) metal hydride alloys. J. Alloys Compd. 2013, 560, 33–41. [Google Scholar] [CrossRef]
  10. McCormack, M.; Badding, M.E.; Vyas, B.; Zahurak, S.M.; Murphy, D.W. The role of microcracking in ZrCrNi hydride electrodes. J. Electrochem. Soc. 1996, 143, L31–L33. [Google Scholar] [CrossRef]
  11. Zhang, W.K.; Ma, C.A.; Yang, X.G.; Lei, Y.Q.; Wang, Q.D.; Lu, G.L. Influences of annealing heat treatment on phase structure and electrochemical properties of Zr(MnVNi)2 hydrogen storage alloys. J. Alloys Compd. 1999, 293–295, 691–697. [Google Scholar] [CrossRef]
  12. Zhang, Q.A.; Lei, Y.Q.; Yang, X.G.; Ren, K.; Wang, Q.D. Annealing treatment of AB2-type hydrogen storage alloys: II. Electrochemical properties. J. Alloys Compd. 1999, 292, 241–246. [Google Scholar] [CrossRef]
  13. Bououdina, M.; Lenain, C.; Aymard, L.; Soubeyroux, J.L.; Fruchart, D. The effects of heat treatments on the microstructure and electrochemical properties of the ZrCr0.7Ni1.3 multiphase alloy. J. Alloys Compd. 2001, 327, 178–184. [Google Scholar] [CrossRef]
  14. Rongeat, C.; Roué, L. On the cycle life improvement of amorphous MgNi-based alloy for Ni-MH batteries. J. Alloys Compd. 2005, 404–406, 679–681. [Google Scholar] [CrossRef]
  15. Sun, J.C.; Li, S.; Ji, S.J. The effects of the substitution of Ti and La for Zr in ZrMn0.7V0.2Co0.1Ni1.2 hydrogen storage alloys on the phase structure and electrochemical properties. J. Alloys Compd. 2007, 446–447, 630–634. [Google Scholar] [CrossRef]
  16. Ruiz, F.C.; Castro, E.B.; Real, S.G.; Peretti, H.A.; Visintin, A.; Triaca, W.E. Electrochemical characterization of AB2 alloys used for negative electrodes in Ni/MH batteries. Int. J. Hydrog. Energy 2008, 33, 3576–3580. [Google Scholar] [CrossRef]
  17. Ruiz, F.C.; Peretti, H.A.; Visintin, A.; Real, S.G.; Castro, E.B.; Corso, H.L. Effect of thermal treatment on the electrochemical hydrogen absorption of ZrCrNi alloy. J. New Mater. Electrochem. Syst. 2007, 10, 249–254. [Google Scholar]
  18. Ruiz, F.C.; Castro, E.B.; Peretti, H.A.; Visintin, A. Study of the different ZrxNiy phases of Zr-based AB2 materials. Int. J. Hydrog. Energy 2010, 35, 9879–9887. [Google Scholar] [CrossRef]
  19. Young, K.; Ouchi, T.; Liu, Y.; Reichman, B.; Mays, W.; Fetcenko, M.A. Structural and electrochemical properties of TixZr7–xNi10. J. Alloys Compd. 2009, 480, 521–528. [Google Scholar] [CrossRef]
  20. Young, K.; Ouchi, T.; Huang, B.; Chao, B.; Fetcenko, M.A.; Bendersky, L.A.; Wang, K.; Chiu, C. The correlation of C14/C15 phase abundance and electrochemical properties in the AB2 alloys. J. Alloys Compd. 2010, 506, 841–848. [Google Scholar] [CrossRef]
  21. Young, K.; Nei, J.; Ouchi, T.; Fetcenko, M.A. Phase abundances in AB2 metal hydride alloys and their correlations to various properties. J. Alloys Compd. 2011, 509, 2277–2284. [Google Scholar] [CrossRef]
  22. Young, K.; Chao, B.; Bendersky, L.A.; Wang, K. Ti12.5Zr21V10Cr8.5MnxCo1.5Ni46.5–x AB2-type metal hydride alloys for electrochemical storage application: Part 2. Hydrogen storage and electrochemical properties. J. Power Sources 2012, 218, 487–494. [Google Scholar] [CrossRef]
  23. Pei, L.; Han, S.; Hu, L.; Zhao, X.; Liu, Y. Phase structure and hydrogen storage properties of LaMg3.93Ni0.21 alloy. J. Rare Earths 2012, 30, 534–539. [Google Scholar] [CrossRef]
  24. Young, K.; Chao, B.; Huang, B.; Nei, J. Studies on the hydrogen storage characteristic of La1–xCex(NiCoMnAlCuSiZr)5.7 with a B2 secondary phase. J. Alloys Compd. 2015, 585, 760–770. [Google Scholar] [CrossRef]
  25. Wang, Y.; Zhao, M. Electrochemical characteristics and synergetic effect of Ti0.10Zr0.15V0.35Cr0.10Ni0.30-10 wt.% LaNi5 hydrogen storage composite electrode. J. Rare Earths 2012, 30, 146–150. [Google Scholar] [CrossRef]
  26. Nei, J.; Young, K.; Salley, S.O.; Ng, K.Y.S. Effects of annealing on Zr8Ni19X2 (X = Ni, Mg, Al, Sc, V, Mn, Co, Sn, La, and Hf): Hydrogen storage and electrochemical properties. Int. J. Hydrog. Energy 2012, 37, 8414–8427. [Google Scholar] [CrossRef]
  27. Young, K.; Ouchi, T.; Huang, B. Effects of various annealing conditions on (Nd, Mg, Zr)(Ni, Al, Co)3.74 metal hydride alloys. J. Power Sources 2014, 248, 147–153. [Google Scholar] [CrossRef]
  28. Zhang, L.; Chen, L.; Xiao, X.; Chen, Z.; Wang, S.; Fan, X.; Li, S.; Ge, H.; Wang, Q. Superior dehydrogenation performance of nanoscale lithium borohydride modified with fluorographite. Int. J. Hydrog. Energy 2014, 39, 896–904. [Google Scholar] [CrossRef]
  29. Zhang, L.; Zheng, J.; Chen, L.; Xiao, X.; Qin, T.; Jiang, Y.; Li, S.; Ge, H.; Wang, Q. Remarkable enhancement in dehydrogenation properties of Mg(BH4)2 modified by the synergetic effect of fluorographite and LiBH4. Int. J. Hydrog. Energy 2015, 40, 14163–14172. [Google Scholar] [CrossRef]
  30. Zhou, C.; Fang, Z.Z.; Sun, P. An experimental survey of additives for improving dehydrogenation properties of magnesium hydride. J. Power Sources 2015, 278, 38–42. [Google Scholar] [CrossRef]
  31. Young, K.; Ng, K.Y.S.; Bendersky, L.A. A Technical Report of the Robust Affordable Next Generation Energy Storage System-BASF Program. Batteries 2016, 2. [Google Scholar] [CrossRef]
  32. Young, K.; Nei, J.; Wong, D.; Wang, L. Structural, hydrogen storage, and electrochemical properties of Laves-phase related body-centered-cubic solid solution metal hydride alloys. Int. J. Hydrog. Energy 2014, 39, 21489–21499. [Google Scholar] [CrossRef]
  33. Young, K.; Wong, D.F.; Wang, L. Effect of Ti/Cr content on the microstructures and hydrogen storage properties of Laves phase-related body-centered-cubic solid solution alloys. J. Alloys Compd. 2015, 622, 885–893. [Google Scholar] [CrossRef]
  34. Young, K.; Ouchi, T.; Nei, J.; Wang, L. Annealing effects on Laves phase-related body-centered-cubic solid solution metal hydride alloys. J. Alloys Compd. 2016, 654, 216–225. [Google Scholar] [CrossRef]
  35. Young, K.; Ouchi, T.; Nei, J.; Meng, T. Effects of Cr, Zr, V, Mn, Fe, and Co to the hydride properties of Laves phase-related body-centered-cubic solid solution alloys. J. Power Sources 2015, 281, 164–172. [Google Scholar] [CrossRef]
  36. Young, K.; Wong, D.F.; Nei, J. Effects of vanadium/nickel contents in Laves phase-related body-centered-cubic solid solution metal hydride alloys. Batteries 2015, 1, 34–53. [Google Scholar] [CrossRef]
  37. Young, K.; Ouchi, T.; Huang, B.; Fetcenko, M.A. Effects of B, Fe, Gd, Mg, and C on the structure, hydrogen storage, and electrochemical properties of vanadium-free AB2 metal hydride alloy. J. Alloys Compd. 2012, 511, 242–250. [Google Scholar] [CrossRef]
  38. Chang, S.; Young, K.; Ouchi, T.; Meng, T.; Nei, J.; Wu, X. Studies on incorporation of Mg in Zr-based AB2 metal hydride alloys. Batteries 2016, 2. [Google Scholar] [CrossRef]
  39. Gakkai, N.K. Hi Kagaku Ryouronteki Kinzoku Kagobutu; Maruzen: Tokyo, Japan, 1975; p. 296. (In Japanese) [Google Scholar]
  40. Young, K.; Ouchi, T.; Huang, B.; Reichman, B.; Fetcenko, M.A. Effect of molybdenum content on structural, gaseous storage, and electrochemical properties of C14-predominant AB2 metal hydride alloys. J. Power Sources 2011, 196, 8815–8821. [Google Scholar] [CrossRef]
  41. Young, K.; Wong, D.F.; Nei, J.; Reichman, B. Electrochemical properties of hypo-stoichiometric Y-doped AB2 metal hydride alloys at ultra-low temperature. J. Alloys Compd. 2015, 643, 17–27. [Google Scholar] [CrossRef]
  42. Young, K.; Fetcenko, M.A.; Li, F.; Ouchi, T.; Koch, J. Effect of vanadium substitution in C14 Laves phase alloys for NiMH battery application. J. Alloys Compd. 2009, 468, 482–492. [Google Scholar] [CrossRef]
  43. Wong, D.F.; Young, K. Density function theory calculation of defects in Zr-Ni intermetallic compounds. Batteries 2016. to be submitted for publication. [Google Scholar]
  44. Johnston, R.L.; Hoffmann, R. Structure-bonding relationships in the Laves phase. Z. Anorg. Allg. Chem. 1992, 616, 105–120. [Google Scholar] [CrossRef]
  45. Nei, J.; Young, K.; Salley, S.O.; Ng, K.Y.S. Determination of C14/C15 phase abundance in Laves phase alloys. Mater. Chem. Phys. 2012, 136, 520–527. [Google Scholar] [CrossRef]
  46. Young, K.; Ouchi, T.; Huang, B.; Reichman, B.; Blankenship, R. Improvement in −40 °C electrochemical properties of AB2 metal hydride alloy by silicon incorporation. J. Alloys Compd. 2013, 575, 65–72. [Google Scholar] [CrossRef]
  47. Young, K.; Ouchi, T.; Reichman, B.; Koch, J.; Fetcenko, M.A. Effects of Mo additive on the structural and electrochemical properties of low-temperature AB5 metal hydride alloys. J. Alloys Compd. 2011, 509, 3995–4001. [Google Scholar] [CrossRef]
  48. Schwarz, R.B.; Khachaturyan, A.G. Thermodynamics of open two-phase systems with coherent interfaces: Application to metal–hydrogen systems. Acta Mater. 2006, 54, 313–323. [Google Scholar] [CrossRef]
  49. Lexcellent, Ch.; Gondor, G. Analysis of hydride formation for hydrogen storage: Pressure-composition isotherm curves modeling. Intermetallic 2007, 15, 934–944. [Google Scholar] [CrossRef]
  50. Osumi, Y. Suiso Kyuzou Goukin–Sono Bussei to Ouyou; Agne Gijutsu Center Inc.: Tokyo, Japan, 1993; p. 57. (In Japanese) [Google Scholar]
  51. De Boer, F.R.; Boom, R.; Mattens, W.C.M.; Miedema, A.R.; Niessen, A.K. Cohesion in Metal Transition Metal Alloys; North-Holland Physics Publishing: Amsterdam, The Netherlands, 1989; Volume 1, p. 150. [Google Scholar]
  52. Griessen, R.; Riesterer, T. Heat of Formation Models. In Hydrogen in Intermetallic Compounds I Electronic, Thermodynamic, and Crystallographic Properties, Preparation; Schlapbach, L., Ed.; Springer-Verlag: Berlin, Germany, 1988; p. 267. [Google Scholar]
  53. Li, F.; Young, K.; Ouchi, T.; Fetcenko, M.A. Annealing effects on structural and electrochemical properties of (LaPrNdZr)0.83Mg0.17(NiCoAlMn)3.3 alloy. J. Alloys Compd. 2009, 471, 371–377. [Google Scholar] [CrossRef]
  54. Young, K.; Fetcenko, M.A.; Li, F.; Ouchi, T. Structural, thermodynamic, and electrochemical properties of TixZr1x(VNiCrMnCoAl)2 C14 Laves phase alloys. J. Alloys Compd. 2008, 464, 238–247. [Google Scholar] [CrossRef]
  55. Young, K.; Huang, B.; Regmi, R.K.; Lawes, G.; Liu, Y. Comparisons of metallic clusters imbedded in the surface oxide of AB2, AB5, and A2B7 alloys. J. Alloys Compd. 2010, 506, 831–840. [Google Scholar] [CrossRef]
  56. Wang, L.; Young, K.; Meng, T.; Ouchi, T.; Yasuoka, S. Partial substitution of cobalt for nickel in mixed rare earth metal based superlattice hydrogen absorbing alloy—Part 1 structural, hydrogen storage and electrochemical properties. J. Alloys Compd. 2016, 660, 407–415. [Google Scholar] [CrossRef]
  57. Joubert, J.M.; Latroche, M.; Percheron-Guégan, A. Hydrogen absorption properties of several intermetallic compounds of the Zr-Ni system. J. Alloys Compd. 1995, 31, 494–497. [Google Scholar] [CrossRef]
  58. Qiu, S.; Chu, H.; Zhang, Y.; Sun, D.; Song, X.; Sun, L.; Xu, F. Electrochemical kinetics and its temperature dependence behaviors of Ti0.17Zr0.08V0.35Cr0.10Ni0.30 alloy electrode. J. Alloys Compd. 2009, 471, 453–456. [Google Scholar] [CrossRef]
  59. Gupta, M.; Schlapbach, L. Electronic Properties. In Hydrogen in Intermetallic Compounds I: Electronic, Thermodynamic, and Crystallographic Properties, Preparation; Schlapbach, L., Ed.; Springer-Verlag: Berlin, Germany, 1988; pp. 139–216. [Google Scholar]
  60. Drummond, T.J. Work Functions of the Transition Metals and Metal Silicides; No. SAND99-0391J; Sandia National Labs.: Albuquerque, NM, USA; Livermore, CA, USA. Available online: http://www.osti.gov/scitech/biblio/3597/ (accessed on 20 February 2016).
  61. Young, K.; Fetcenko, M.A.; Ouchi, T.; Im, J.; Ovshinsky, S.R.; Li, F.; Reinhout, M. Hydrogen Storage Materials Having Excellent Kinetics, Capacity, and Cycle Stability. U.S. Patent 7,344,676, 18 March 2008. [Google Scholar]
  62. Young, K.; Chao, B.; Liu, Y.; Nei, J. Microstructures of the oxides on the activated AB2 and AB5 metal hydride alloys surface. J. Alloys Compd. 2014, 606, 97–104. [Google Scholar] [CrossRef]
  63. Young, K.; Ouchi, T.; Huang, B.; Nei, J. Structure, hydrogen storage, and electrochemical properties of body-centered-cubic Ti40V30Cr15Mn13X2 alloys (X = B, Si, Mn, Ni, Zr, Nb, Mo, and La). Batteries 2015, 1, 74–90. [Google Scholar] [CrossRef]
  64. Young, K.; Ouchi, T.; Fetcenko, M.A. Pressure-composition-temperature hysteresis in C14 Laves phase alloys: Part 1. Simple ternary alloys. J. Alloys Compd. 2009, 480, 428–433. [Google Scholar] [CrossRef]
Figure 1. X-ray diffraction (XRD) patterns of alloys (a) P17; (b) P38; (c) P39; (d) P40; (e) P41; (f) P42; (g) P43; and (h) P44. The vertical line highlights the shifts of the main body-centered-cubic (BCC) and TiNi peaks.
Batteries 02 00015 g001
Figure 2. Plots of the lattice constants a for the TiNi, BCC, and C14 phases vs. (a) the metallic radius of the additives and (b) the Mn-content in the BCC phase.
Batteries 02 00015 g002
Figure 3. Plots of abundances vs. crystallite size for the TiNi, BCC, and C14 phases.
Batteries 02 00015 g003
Figure 4. Scanning electron microscope SEM backscattering images from alloys (a) P17; (b) P38; (c) P39; (d) P40; (e) P41; (f) P42; (g) P43; and (h) P44. The scale bar at the lower right corner represents 25 μm.
Batteries 02 00015 g004
Figure 5. Pressure-concentration-temperature (PCT) isotherms measured at (a) 30 °C and (b) 60 °C for alloys P17, P38, P39, and P40; and (c) 30 °C and (d) 60 °C for alloys P41, P42, P43, and P44.
Batteries 02 00015 g005
Figure 6. Plot of the amount of irreversible hydrogen storage found in PCT analysis vs. the TiNi phase abundance.
Batteries 02 00015 g006
Figure 7. (a) The measured ∆H based on the absorption, half-point, and desorption isotherms and (b) Plateau pressure and BCC phase lattice constants vs. the calculated ∆H based on BCC composition determined by EDS (Table 4) and Equation (3).
Batteries 02 00015 g007
Figure 8. The evolution of (a) maximum capacity and (b) HRD in the first 13 cycles.
Batteries 02 00015 g008
Figure 9. Comparison of capacities obtained from gaseous phase and electrochemical measurements. The gaseous phase capacity is converted by 1 wt% = 268 mAh·g‒1.
Batteries 02 00015 g009
Figure 10. The plots of gaseous phase maximum hydrogen storage capacity and equilibrium plateau pressure from PCT desorption isotherm vs. the OCV obtained from the half-cell measurement.
Batteries 02 00015 g010
Figure 11. XRD patterns of a P17 alloy prepared by the conventional melt-and-cast process: (a) pristine; (b) hydrided at 4 MPa H2 gas and then degassed in vacuum for 8 h at 300 °C; (c) withdrawn from an equilibrium state with 0.005 MPa H2 pressure; and (d) pull-out from an equilibrium state with 4 MPa H2 pressure, and the electrodes made from the same alloy with (e) 50% and (f) 100% state of charge achieved electrochemically.
Batteries 02 00015 g011
Figure 12. Two MH alloys with different work functions (W): (a) before making contact; (b) after making contact; and (c) after hydrogenation and dehydrogenation.
Batteries 02 00015 g012
Figure 13. A plot of the heat of hydride formation (data from [52]) and work function (data from [60]) vs. the number of 3d electrons for the first row of transition metal elements from Sc to Ni.
Batteries 02 00015 g013
Figure 14. Comparison of hydrogen storage through (a) a gaseous phase reaction in a perfect single-component system and (b) an electrochemical reaction in a two-phase system with different work functions (WM1 > WM2) at different states of charge (SOC). In this illustration, the M1 phase has a larger W than M2, and contains a small amount of hydride near the boundary, even at a very low SOC. The MH (β) phase nucleates from a randomly distributed proton (α) in the gaseous phase (left) that, during electrochemistry, starts from the remaining MH in the phase with a larger W near the grain boundary.
Batteries 02 00015 g014
Figure 15. The second cycle electrochemical charge and discharge voltage profiles for an electrode made from alloy P40. The smooth curves seen here are very different from the step-shape PCT isotherm shown in Figure 5.
Batteries 02 00015 g015
Figure 16. Plots of (a) C14 unit cell volume and TiNi phase abundance vs. gaseous phase reversible capacity; (b) TiNi and BCC phase abundance vs. PCT hysteresis measured at 30 °C; (c) HRD vs. BCC phase crystallite size; and (d) TiNi, BCC, and C14 phase abundances vs. HRD.
Batteries 02 00015 g016
Table 1. Examples of synergetic effects in multi-phase metal hydride (MH) alloys. GP and EC denote gaseous phase and electrochemistry experiments, respectively. HRD: high-rate dischargeability.
Main PhaseSecondary PhaseMain ImprovementEnvironmentReference
C14Zr7Ni10Capacity and activation *EC[10]
C14/C15Zr7Ni10, ZrNiCapacity and activationEC[11]
C15Zr7Ni10HRDEC[12]
C15Zr7Ni10CapacityEC[13]
MgNiTiCycle stabilityEC[14]
C14/C15Zr7Ni10 and TiNiHRDEC[15]
C14/C15Zr7Ni10 and Zr9Ni11Capacity and HRDEC[1]
Zr8Ni21Zr7Ni10, Zr9Ni11Capacity and HRDEC[16]
C14Zr8Ni21Activation, bulk diffusion, cycle stabilityEC[17,18]
Zr7Ni10C15HRDEC[19]
C14/C15Zr7Ni10 and TiNiCapacity and reversibilityGP[20]
C14/C15Zr9Ni11Activation, HRD, charge retention, and cycle stabilityEC[21]
C14Zr9Ni11 and TiNiCapacityGP[21]
C14Zr9Ni11 and TiNiCapacity, charge retention, and cycle stabilityEC[21]
C14Zr7Ni10 and ZrNiHRDEC[21]
C14/C15Zr7Ni10 and TiNiHRDEC[22]
MgMg2NiDesorption kineticsGP[23]
AB5AlMnNi2Capacity and HRDEC[24]
BCC, C14ZrNiCapacity, activation, and cycle stabilityEC[25]
Zr2Ni7Zr7Ni0CapacityGP, EC[26]
Zr7Ni0Zr8Ni21CapacityEC[26]
Zr2Ni7ZrNi3, ZrNi5, VNi2, VNi3CapacityEC[9]
Zr2Ni7ZrNi3 and ZrNi5CapacityEC[8]
NdNi5Nd2Ni7HRDEC[27]
LiBH4FluorographiteDesorption kineticsGP[28]
Mg(BH4)2FluorographiteDesorption kineticsGP[29]
MgH2In, TiMn2 additivesDesorption kineticsGP[30]
* indicates that the authors attributed improvement to micro-cracking at the surface instead of to synergetic effects.
Table 2. Design compositions (bold) and inductively coupled plasma (ICP) results for alloys in this study in at %.
AlloySourceTiZrVCrMnCoNiAlXB/A
P17Design15.62.14411.26.91.418.50.304.65
ICP15.6244.111.36.41.418.90.304.68
P38 (X = B)Design15.62.14311.26.91.418.50.314.35
ICP15.72.242.710.66.71.419.30.31.14.26
P39 (X = Mg)Design15.62.14311.26.91.418.50.314.35
ICP15.52.244.510.67.11.418.30.504.65
P40 (X = Y)Design15.62.14311.26.91.418.50.314.35
ICP15.1244.911.45.41.418.70.30.84.59
P41 (X = Nb)Design15.62.14311.26.91.418.50.314.35
ICP15.82.141.211.77.41.519.20.40.84.35
P42 (X = Mo)Design15.62.14311.26.91.418.50.314.35
ICP15243.1117.71.418.50.414.56
P43 (X = La)Design15.62.14311.26.91.418.50.314.35
ICP16.12.240.911.87.41.519.30.40.44.34
P44 (X = Nd)Design15.62.14311.26.91.418.50.314.35
ICP15.92.2439.86.81.419.60.314.24
Table 3. Lattice parameters, unit cell volumes, phase abundances, and crystallite sizes of phases derived from XRD analysis. XS denotes crystallite size.
AlloysBCCC14TiNi
a (Å)XS (Å)Abundance (wt%)a (Å)c (Å)c/aUnit Cell Volume (Å3)XS (Å)Abundance (wt%)a (Å)XS (Å)Abundance (wt%)
P172.97717152.84.9128.0101.631167.321513.22.99317034.0
P382.96118160.54.8757.9981.641164.66312.62.9746536.9
P392.96826053.04.8928.0191.639166.23227.02.9828939.9
P402.97434331.84.9298.0301.629169.04146.12.98610262.1
P412.97118750.44.9067.9911.629166.630920.72.9864128.9
P422.97322158.44.8938.0131.638166.18080.82.9877440.8
P432.96226238.94.8998.0031.634166.32409.52.9768551.6
P442.97322841.04.9248.0071.626168.12786.32.9889752.7
Table 4. Energy-dispersive spectroscopy (EDS) composition data from select spots in Figure 4. All numbers are in at%. B/A ratios for the C14 phase were calculated assuming V is in the B-site, while those in the TiNi and VNi phases were calculated assuming V in the A-site. Compositions in the main BCC phase are highlighted in bold.
LocationZrTiVCrMnCoNiAlXB/Ae/aPhase
P17-116.216.37.84.45.91.847.50.10.02.087.28C14
P17-24.736.47.80.83.62.044.40.30.01.04-TiNi
P17-36.248.411.71.22.31.828.30.10.00.51-Ti2Ni
P17-40.15.563.516.97.40.85.60.20.0--BCC
P38-19.922.020.34.76.62.033.90.60.02.136.62C14
P38-24.437.06.41.12.82.744.80.80.01.09-TiNi
P38-35.545.415.42.42.81.826.40.30.00.51-Ti2Ni
P38-40.15.262.817.58.40.85.00.20.0--BCC
P38-50.113.173.48.83.20.21.10.10.06.58-Oxide
P39-19.722.820.04.87.12.232.51.00.02.086.56C14
P39-23.833.911.92.43.42.840.61.10.01.01-TiNi
P39-36.348.511.41.42.81.827.50.30.00.51-Ti2Ni
P39-40.15.761.718.57.80.85.10.30.0--BCC
P40-111.821.320.43.34.81.636.20.70.02.026.66C14
P40-25.237.95.50.92.02.845.20.40.01.06-TiNi
P40-30.14.666.217.17.20.83.70.20.0--BCC
P40-42.00.81.40.50.30.053.40.840.81.22-YNi
P40-56.684.95.70.50.40.11.70.20.0--TiO2
P40-60.01.41.70.40.00.02.31.392.9--Y
P41-16.122.921.15.97.42.031.20.52.82.146.54C14
P41-22.837.57.21.43.32.743.80.80.51.08-TiNi
P41-34.247.913.32.22.71.827.00.30.60.52-Ti2Ni
P41-40.15.262.917.77.10.75.70.20.5--BCC
P42-110.321.920.04.46.42.034.30.60.12.106.63C14
P42-24.537.06.30.92.62.745.20.80.01.09-TiNi
P42-36.245.514.82.32.51.626.80.30.00.51-Ti2Ni
P42-40.47.058.615.47.91.18.00.21.4--BCC
P43-19.223.520.65.37.32.131.30.70.02.066.51C14
P43-24.138.55.91.12.53.044.30.70.01.06-TiNi
P43-30.15.961.118.68.10.85.20.20.0--BCC-1
P43-41.130.245.512.76.30.53.30.10.3--BCC-2
P43-50.21.32.60.80.00.338.30.156.40.65-LaNi
P44-19.923.120.84.46.42.132.80.60.02.036.56C14
P44-24.338.46.00.92.52.844.40.70.01.05-TiNi
P44-30.15.864.016.20.85.10.20.0--BCC
P44-40.52.92.90.30.90.146.50.245.70.92-NdNi
P44-50.11.84.50.71.202089.8--Nd
Table 5. Summary of gaseous phase and thermodynamic properties.
AlloyDesorption Pressure @30 °C (MPa)Desorption Pressure @60 °C (MPa)Maximum Capacity @30 °C (wt%)Reversible Capacity @30 °C (wt%)PCT Hysteresis @30 °CPCT Hysteresis @60 °C
P170.170.531.681.011.061.10
P380.210.651.641.131.141.06
P390.210.711.721.141.161.06
P400.190.601.690.851.221.06
P410.230.761.571.151.131.05
P420.401.291.651.021.130.91
P430.281.051.851.091.230.76
P440.150.471.690.881.271.22
Table 6. Thermodynamic properties ∆H and ∆S calculated from the equilibrium pressure plateaus (A: absorption, D: desorption, (A + D)/2:half-point) measured at 30, 45, and 60 °C with error bars of approximately ±3%. −∆HCalc is the calculated value from the BCC phase composition obtained with SEM-EDS (Table 4) using Equation (3).
Alloy−∆HA (kJ·mol−1)−∆SA (J·mol−1·K−1)−∆HD (kJ·mol−1)−∆SD (J·mol−1·K−1)−∆H(A+D)/2 (kJ·mol−1)−∆S(A+D)/2 (J·mol−1·K−1)−∆HCalc (kJ·mol−1)
P1729.211130.910730.411028.6
P3828.711131.711130.211128.0
P3929.411333.911831.711528.2
P4030.011432.211131.111328.4
P4128.311134.011930.811428.1
P4229.911932.812031.412029.3
P4328.011137.213132.412028.3
P4431.611831.610831.811329.1
Table 7. Summary of electrochemical properties. Cap100 and Cap8 are discharge capacities measured for discharge currents at 100 mA·g‒1 and 8 mA·g‒1, respectively. HRD100 is the ratio of capacities measured at 100 mA·g‒1 and 8 mA·g−1. RT: room temperature; and OCV: open circuit voltage.
AlloyCap100 at 5th Cycle (mAh·g−1)Cap8 at 5th Cycle (mAh·g−1)HRD100 (Cap100/Cap8)Activation Cycle to Reach Maximum CapacityDiffusion Coefficient, D @RT (1010 cm2·s−1)Exchange Current Io @RT (mA·g−1)OCV (V)
P17374.0397.40.94871.6936.51.302
P38332.6399.00.834102.2422.31.303
P39360.3402.10.89641.8135.61.311
P40300.2389.90.77071.7515.01.258
P41362.5392.90.92252.4937.61.319
P42351.5392.40.89672.2719.61.258
P43332.6382.10.87052.5719.21.237
P44346.1399.20.86841.9915.41.266
Table 8. Summary of the phase abundance of a P17 alloy prepared by induction melting through various gaseous phases and electrochemical hydrogen absorption/desorption processes.
StageBCCC14TiNiTi2Ni
αβαβαβαβ
Pristine53.6-6.2 29.4-10.8
300 °C vacuum54.0-3.02.030.6-4.26.2
0.005 MPa51.7--4.111.322.23.67.1
4 MPa6.146.4-3.6-34.9-9.0
50% SOC53.4--5.10.732.0-8.8
100% SOC29.521.1-4.7-36.5-8.2
Table 9. Table of correlation coefficient (R2) between hydrogen storage properties and phase component characteristics. Significant correlations are highlighted in bold.
PropertyGaseous PhaseElectrochemistry
Plateau Pressure @30 °CPlateau Pressure @60 °CMaximum CapacityReversible CapacityPCT HysteresisHigh-Rate Discharge CapacityFull Discharge CapacityHRD
BCC, lattice constant0.020.040.140.360.050.070.040.06
BCC, crystallite size0.000.040.210.260.400.570.150.53
BCC, abundance0.110.010.220.410.530.380.270.28
C14, unit cell volume0.170.080.010.720.170.090.020.08
C14, crystallite size0.310.320.130.000.040.040.000.06
C14, abundance0.100.080.050.090.070.190.020.26
TiNi, lattice constant0.030.050.130.260.080.170.050.16
TiNi, crystallite size0.160.150.090.190.060.040.020.04
TiNi, abundance0.020.000.310.570.660.640.150.59

