Article

Characterising Lithium-Ion Battery Degradation through the Identification and Tracking of Electrochemical Battery Model Parameters

1
WMG, International Digital Laboratory, University of Warwick, Coventry CV4 7AL, UK
2
Maplesoft Europe Ltd., Broers Building, 21 JJ Thompson Avenue, Cambridge CB3 OFA, UK
*
Author to whom correspondence should be addressed.
Batteries 2016, 2(2), 13; https://doi.org/10.3390/batteries2020013
Submission received: 10 March 2016 / Revised: 8 April 2016 / Accepted: 12 April 2016 / Published: 26 April 2016
(This article belongs to the Special Issue Battery Modeling)

Abstract

:
Lithium-ion (Li-ion) batteries undergo complex electrochemical and mechanical degradation. This complexity is pronounced in applications such as electric vehicles, where highly demanding cycles of operation and varying environmental conditions lead to non-trivial interactions of ageing stress factors. This work presents the framework for an ageing diagnostic tool based on identifying and then tracking the evolution of model parameters of a fundamental electrochemistry-based battery model from non-invasive voltage/current cycling tests. In addition to understanding the underlying mechanisms for degradation, the optimisation algorithm developed in this work allows for rapid parametrisation of the pseudo-two dimensional (P2D), Doyle-Fuller-Newman, battery model. This is achieved through exploiting the embedded symbolic manipulation capabilities and global optimisation methods within MapleSim. Results are presented that highlight the significant reductions in the computational resources required for solving systems of coupled non-linear partial differential equations.

1. Introduction

Since the commercialisation of lithium-ion (Li-ion) batteries, significant improvements in energy density and power capability have made Li-ion batteries the preferred solution for low carbon mobility for the next 10–15 years [1]. However, the change in behaviour of Li-ion batteries over a vehicle lifetime can have a significant detrimental effect on vehicle performance and lifetime [2,3]. Exploring the causes of battery ageing and developing mitigation strategies to avoid premature degradation is therefore of paramount importance to vehicle manufacturers.
Understanding battery ageing is convoluted since many factors from environmental conditions to vehicle utilization interact to generate different ageing effects [4]. Battery degradation is accelerated with factors that include, but are not constrained too: the frequency of cycling, large change in state of charge (ΔSoC), large current magnitudes during both charge and discharge, elevated temperatures, and elevated voltage exposure [2].
The resulting physical degradation [4] can broadly manifest itself in two ways that an energy storage systems engineer is interested in: capacity fade that affects the range of the vehicle and power fade, which is the increase in the internal resistance or impedance of the cell and limits the power capability of the system and decreases the efficiency of the vehicle. Through a comprehensive understanding of the root causes of degradation, engineers can develop and embed mitigation strategies within the system design process and within the control function that comprise the vehicle’s battery management system (BMS). Recent examples highlighted within the literature include: More accurate ageing estimation algorithms [5], better fault diagnostics [5], more advanced thermal management systems [6], focused battery sizing [7,8].
Experimental techniques for studying and quantifying battery degradation can classified as either destructive [9] or non-destructive [10]. While destructive tests can provide detailed data, non-destructive tests are sustainable and provide a valuation for capacity fade and power fade. For detailed interpretation, diagnosis and prognosis of degradation and failure however, mathematical models are required [5]. To this end, based on Uddin et al.’s work [11], a technique for applying sustainable, non-destructive experimental techniques to quantify the detailed degradation associated with different ageing stress factors is presented. The authors employ an electrochemistry based battery model which extends the work of Doyle et al. [12] that combines concentrated solution kinetics, mass conservation, charge conservation, and transport and conduction in porous media. To investigate battery degradation, we analyse changes in model parameters as the cell ages. In order to estimate changes in model parameters a framework is presented in which simulation results from the electrochemical model are compared to voltage and current data measured from cell characterisation experiments undertaken at different stages of cell calendar aging. The numerical fitting, i.e., minimising the square of the error between simulated and measured voltage, is done using a non-linear fitting algorithm. The authors assert that since model parameters are connected to intrinsic properties of the battery, the evolution of these parameters will highlight physical changes within the battery. Thus, by tracking the evolution of model parameters it will be possible to deduce the mechanisms by which the battery has degraded over time.
Offline parameter identification of battery models using electrical cycling data is widely employed for the parameterisation of equivalent circuit battery models where a set of n parallel resistor–capacitor pairs are connected to each other in series [3,6]. Parameterisation of higher fidelity models such as the single particle (SP) model with various dynamic and thermal extensions has also been undertaken using various system identification methods [13]. Santhanagopalan et al. [14] for example used the Levenberg–Marquardt optimization algorithm to identify a subset of five parameters for both the pseudo two-dimensional (P2D) porous electrode model and SP models using constant charge and discharge cycles. An important contribution to parameter identification was made by Forman et al. [15] who identified the full set of parameters (88 scalars and function control points) of the P2D model using a genetic algorithm derived from the drive-cycle data from a plug-in hybrid electric vehicle (PHEV). In the context of battery degradation, perturbative terms have been introduced into the SP model and then identification used to obtain values of these perturbative parameters [16,17]. In the case of well-understood ageing mechanisms such as film formation on the negative electrode where models of degradation already exist, as was considered in [16,17], this approach is suitable. However, for mechanisms that are not well understood, it is difficult to introduce perturbative terms into the model because the appropriate governing equations for these perturbative terms are non-existent or not well established. Therefore, in this work we propose a diagnostic technique that employs tracking the evolution of the P2D model parameters directly. That is, understanding of battery degradation is sought from changes in model parameters themselves and not from additional models coupled to the P2D model.
As emphasised in the leading research introduced, excessive simulation times—inherent to electrochemical battery models are prohibitive and represent a significant challenge within the domain of optimisation where many thousands of simulation runs are performed. A key attribute of this work is the minimisation of the computational resources required for optimising a large parameter set. The Symbolic Manipulator embedded within Maple has been effectively employed to simplify the system of equations generated from the model during initial compilation leading to a significant reduction in the computational effort required to solve the system of equations.
The remainder of this article is organised as follows. Section 2 describes the mathematical formulation of the P2D model and the model parameters. In Section 3, an overview of ageing stress factors and ageing mechanism are presented. This is used to show how the number of parameters to be identified can be constrained. In Section 4, the model optimisation scheme is presented along with a refined set of parameters for the 3.03 Ah LiNiCoAlO2 (NCA) battery. Using this set of parameters, the voltage response for a real life driving cycle is estimated; a comparison with experimental results are presented in Section 4. In Section 5, we present key results for aged cells that highlight the potential causality between cell degradation as a function of calendar ageing. Conclusions and further work are summarised in Section 6.

2. Model Formulation and Parameters

2.1. Pseudo Two-Dimensional Model Formulation

Within the electrochemistry domain, continuum models that incorporate electrochemical kinetics and transport phenomena to produce more accurate predictions than that possible through the use of empirical models have long been employed. The P2D Li-ion battery model, based on principles of transport phenomena, electrochemistry and thermodynamics, is the accepted model within the battery research community [18]. It solves for the electrolyte concentration, electrolyte potential, solid-state potential, and solid-state concentration within the porous electrodes and the electrolyte concentration and electrolyte potential within the separator. This model consists of three primary domains: the negative electrode (in this work LiC6), the separator (in this work polyethylene) and the positive electrode (in this work NCA) sandwiched between current collectors and immersed in an electrolyte solution. During electrical discharge, lithium ions that occupy interstitial sites with the LiC6 electrode diffuse to the surface where they react (de-intercalate) and transfer from a solid into a liquid phase. The ions then diffuse and migrate through the electrolyte solution via the separator to the positive electrode where they react (intercalate) and occupy interstitial sites within the metal oxide material. During electrical charging the reverse reactions take place, in summary: lithium ions de-intercalate from the positive electrode (metal oxide) and intercalate within the negative electrode (carbon).
Table 1 presents the governing equations and boundary conditions that comprise the P2D electrochemical model. A complete derivation of the model is beyond the scope of this paper; discussions of the P2D model can be found within Reference [19].

2.2. Pseudo Two-Dimensional Model Parameters

The model parameters for the P2D model are listed in Table 2. There are a total of 57 scalar model parameters listed in Table 2 of which 21 contribute to the definition of the open circuit potentials U+ and U. The positive electrode equilibrium potential function U+ is obtained from measurements of a cell’s open circuit voltage, assuming a known negative electrode (LixC6) equilibrium potential function U from the literature. Moreover, stoichiometry of both electrodes at 100% and 0% SoC (four parameters), anodic and cathodic charge transfer coefficients (two parameters), the electrolyte activity co-efficient (one parameter) and the Bruggemen coefficient (one parameter) are taken to be known constants, with values compatible with those found in the literature [20]. This means a further eight parameters are assumed known, thus leaving a subset 28 = (57 − 21 − 8) parameters that need to be identified. This is the maximum number of parameters that theoretically need to be identified. However, in the next section we show that in practice, not all of these parameters will change; depending on the stress factors applied to the battery, one is able to systematically reduce the number of parameters requiring identification.
where the electrode potentials are defined in the form:
U = b 1 + b 2 x + b 3 x 0.5 + b 4 x 1 + b 5 x 1.5 + b 6 exp [ b 7 ( b 8 x ) ] + b 9 exp [ b 10 ( x b 11 ) ]
U + = b 1 + + b 2 + x + + b 3 + x + 2 + b 4 + x + 3 + b 5 + x + 4 + b 6 + x + 5 + b 7 + x + 6 + b 8 + exp [ b 9 + x + b 10 + ]
the stoichiometry is defined by:
x = x , 0 + ( x , 100 x , 0 ) S o C 100
x + = x + , 0 + ( x + , 100 x + , 0 ) S o C 100
and the electrolyte conductivity (coefficients of which are found in [19,22] is:
κ = g 0 + g 1 c e + g 2 c e 2 + g 3 c e 3 + g 4 c e 4

3. Method for Restricting the Number of Parameters for Identification

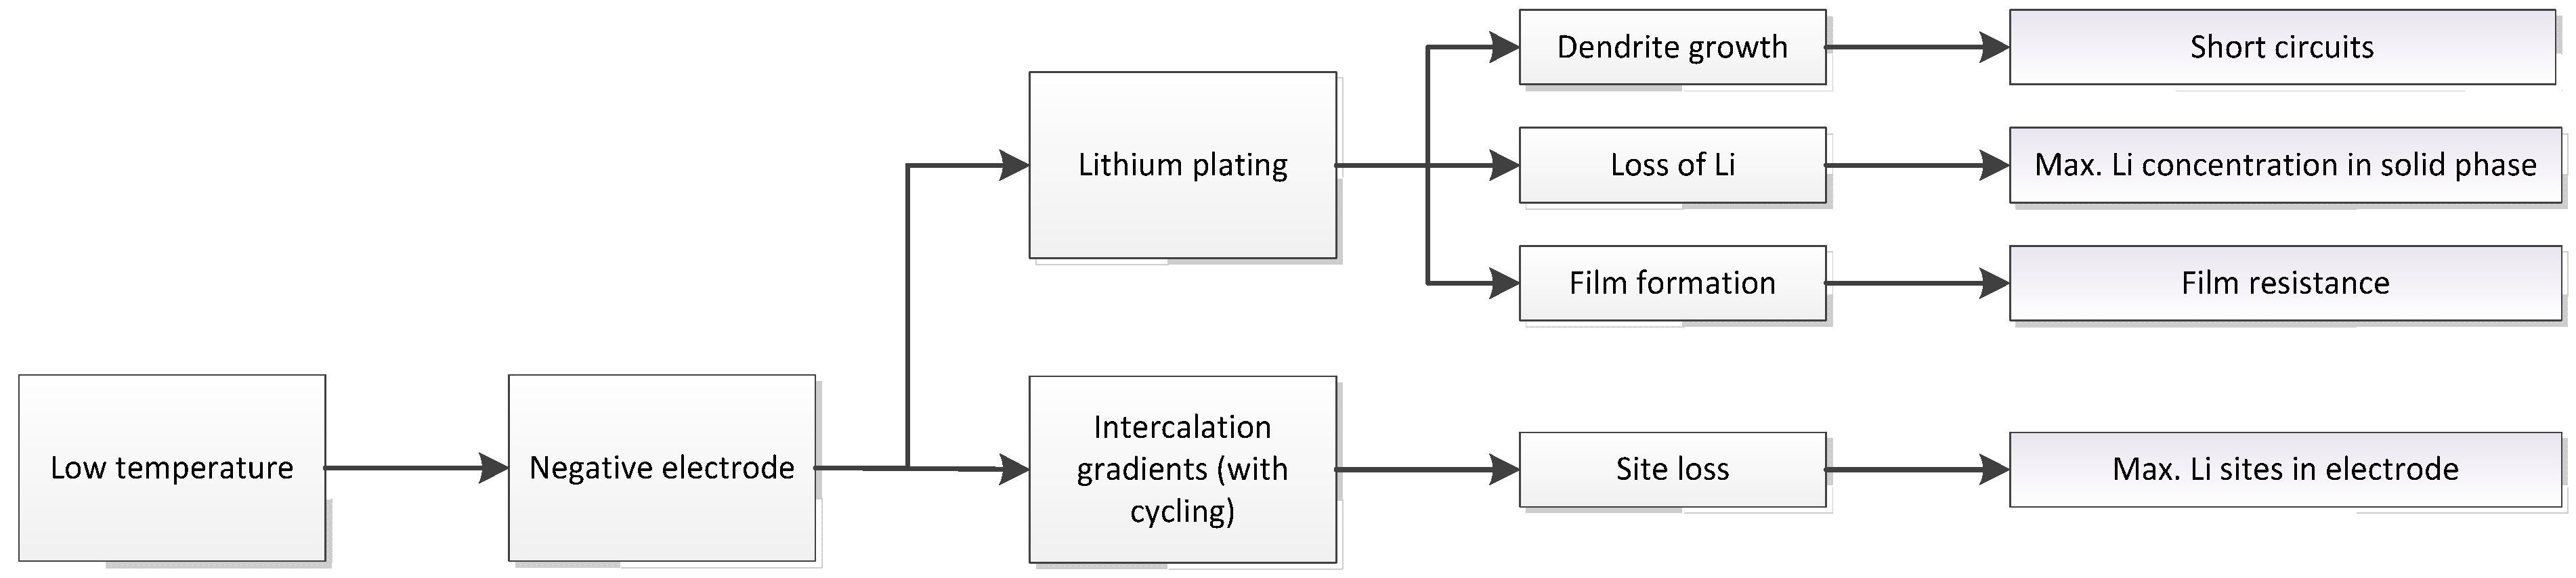
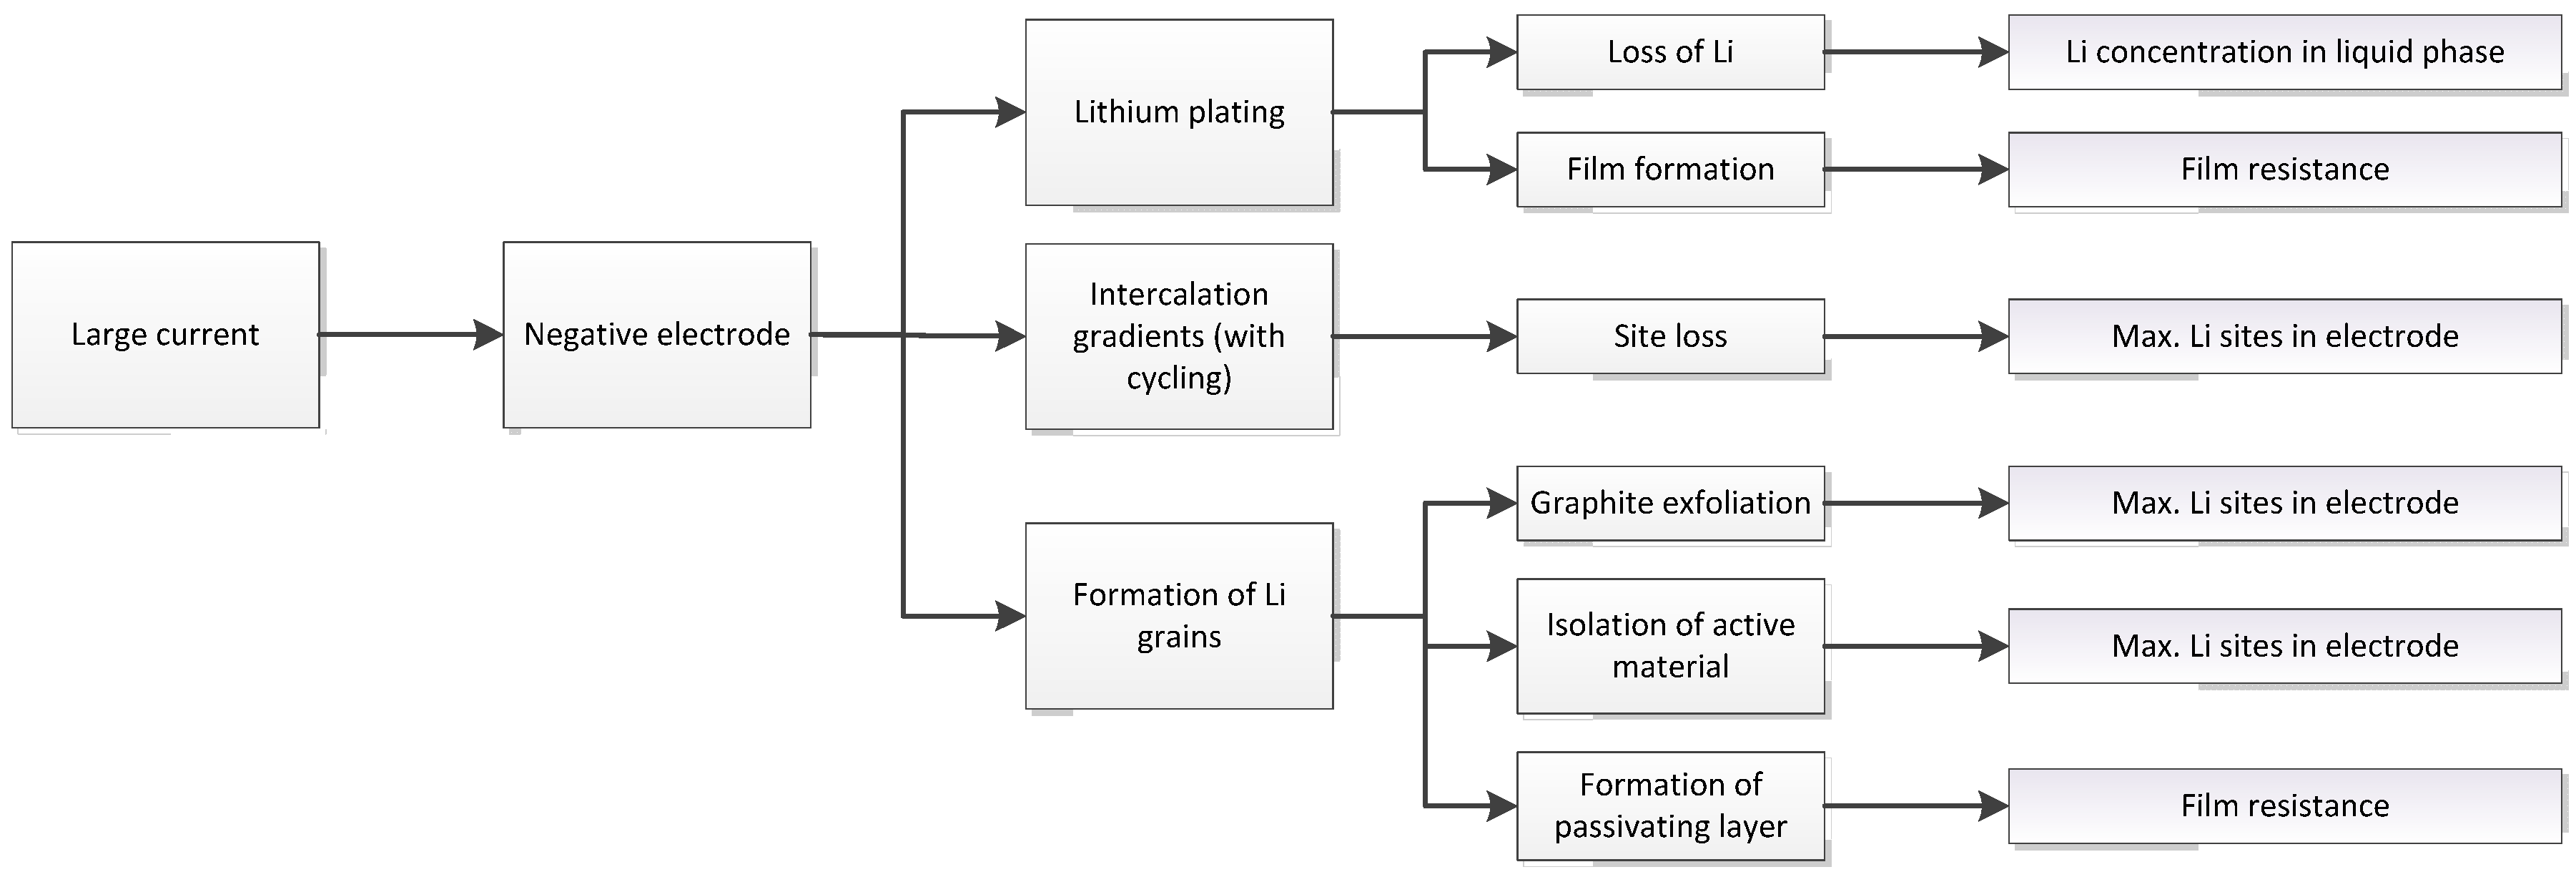
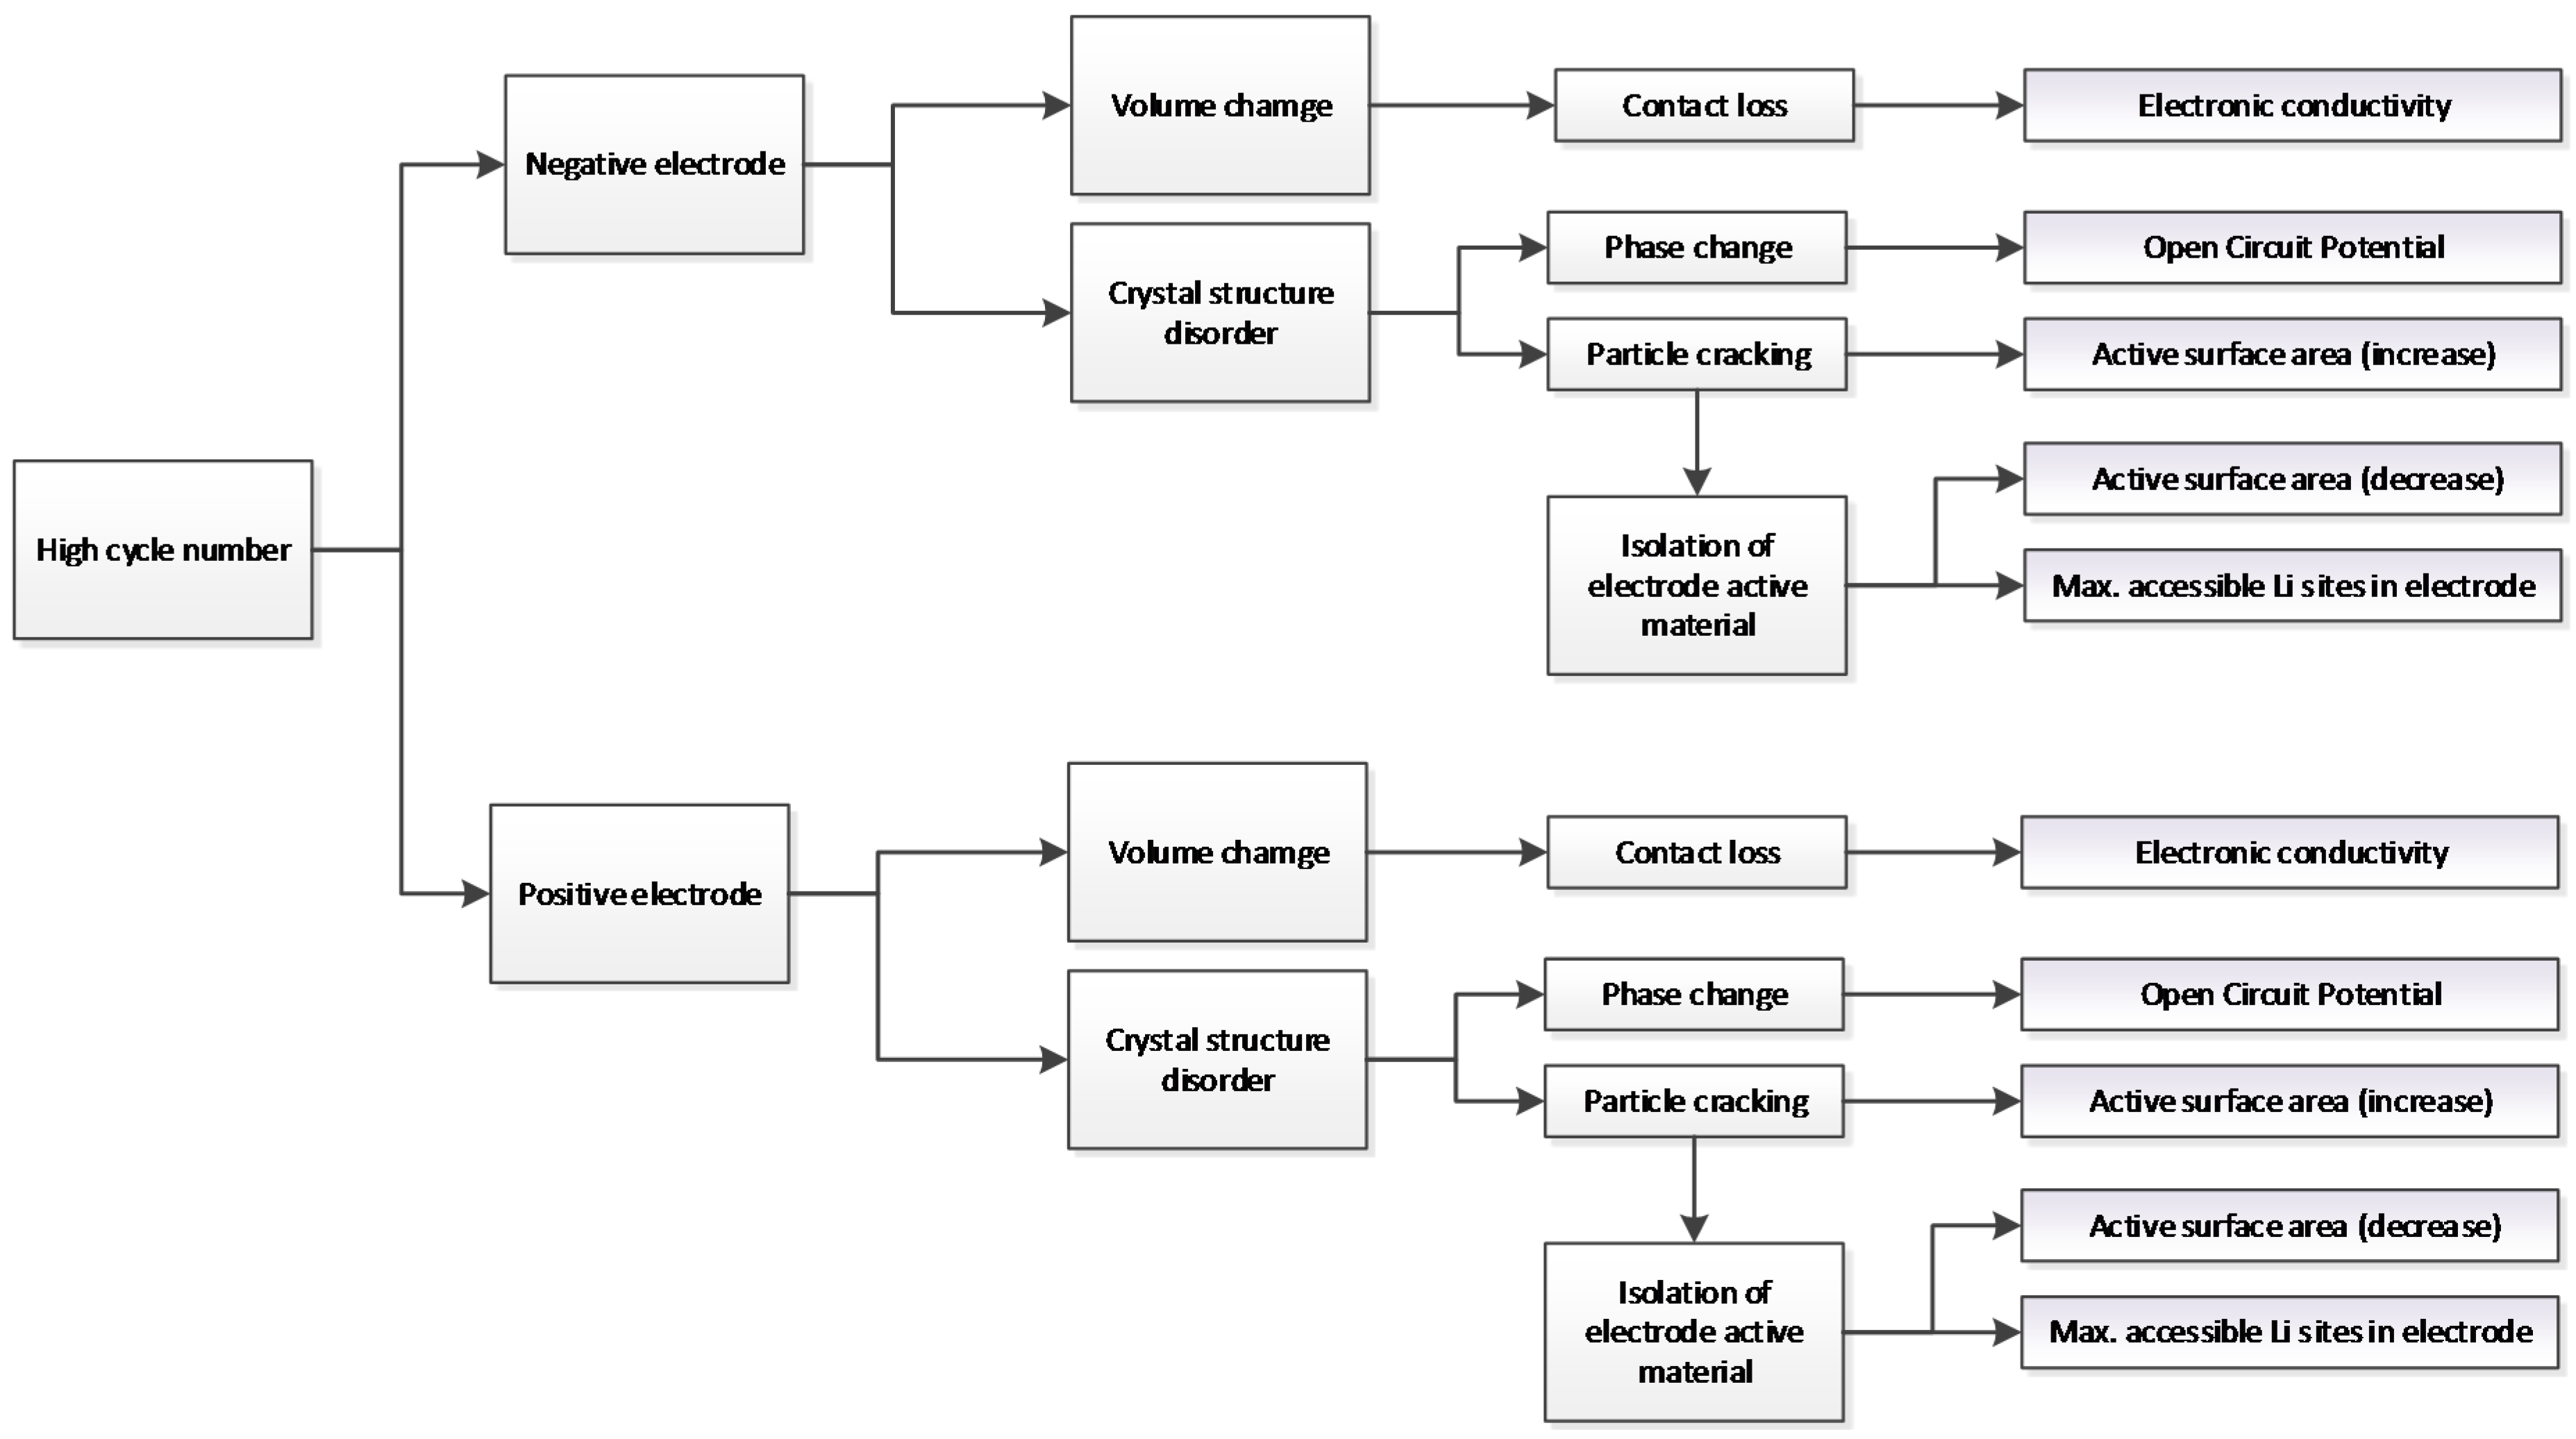
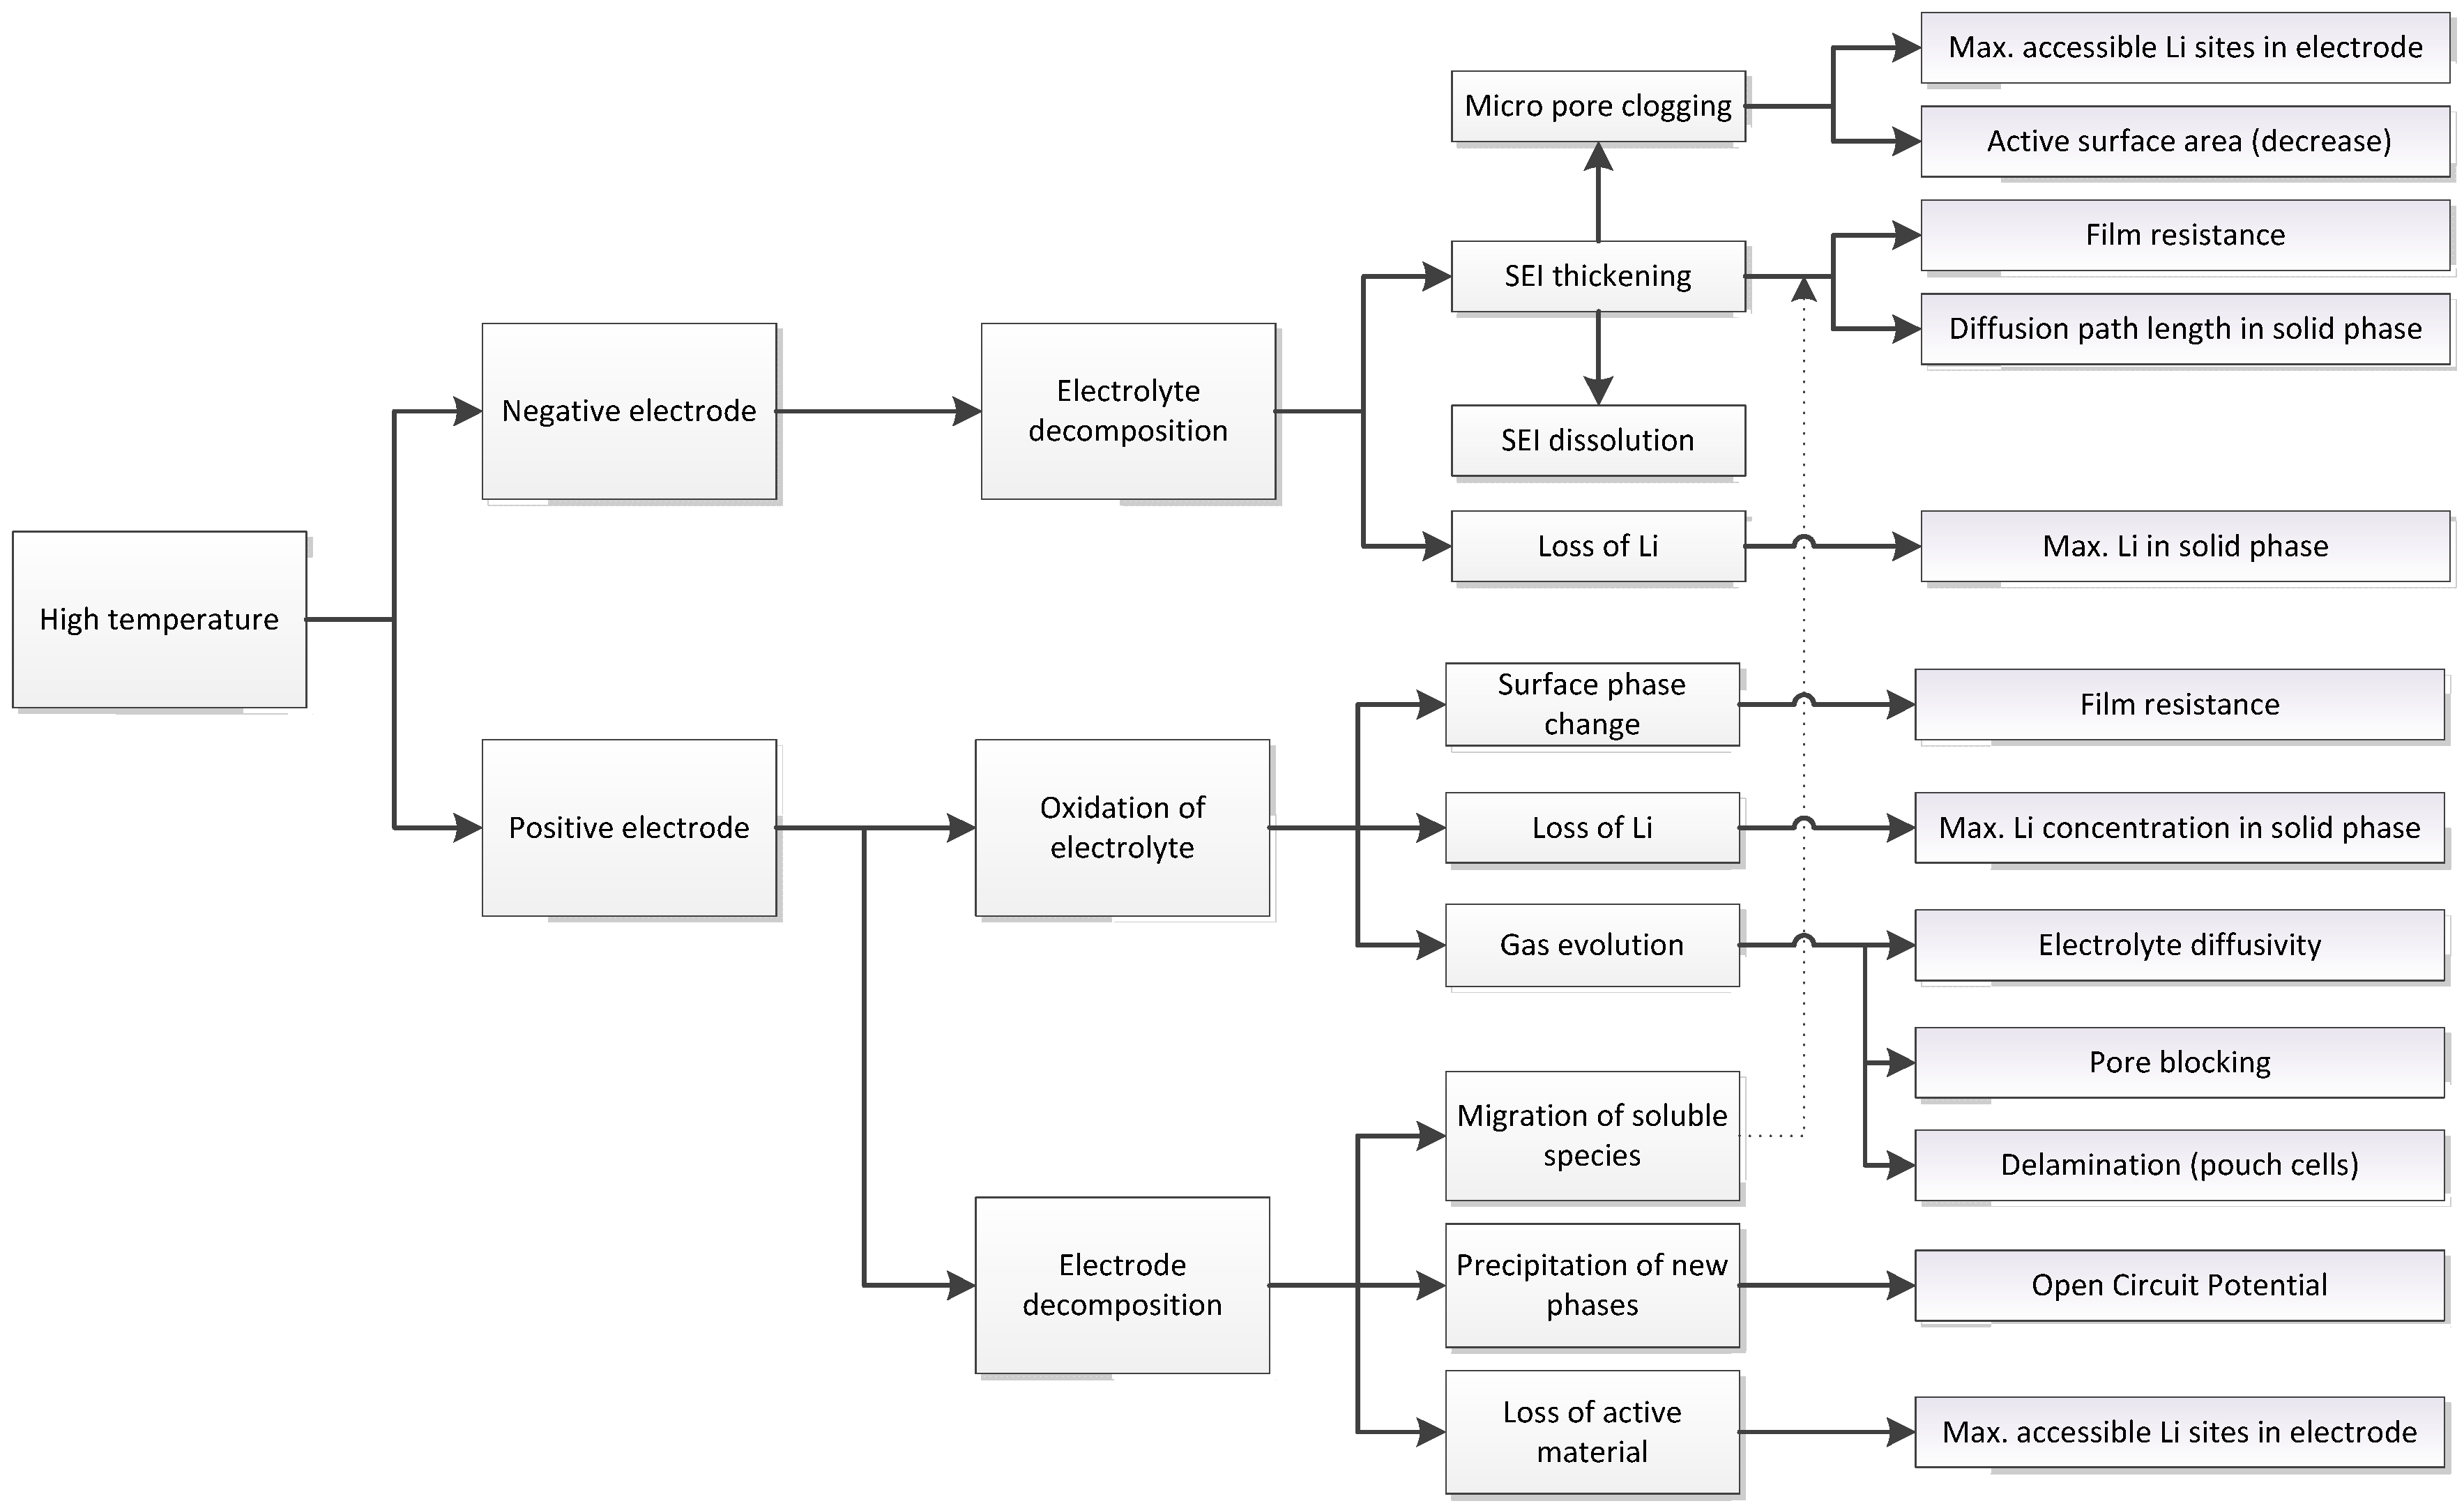
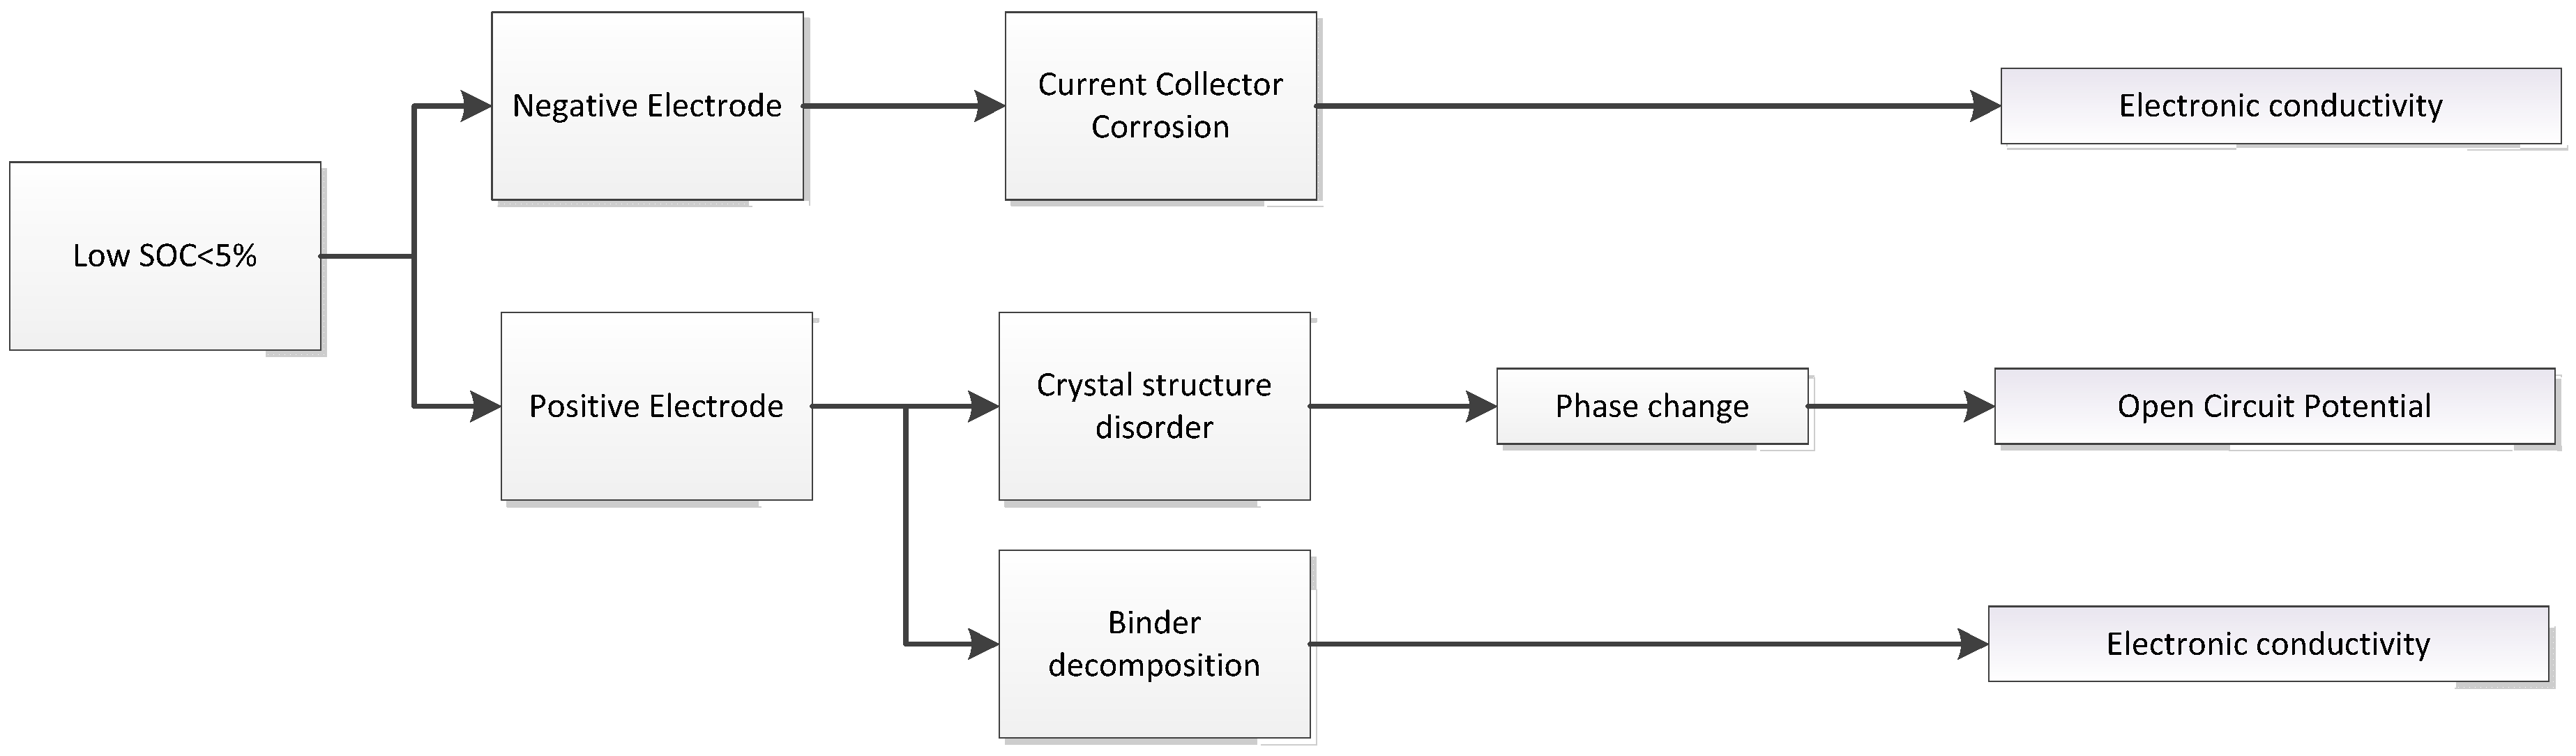
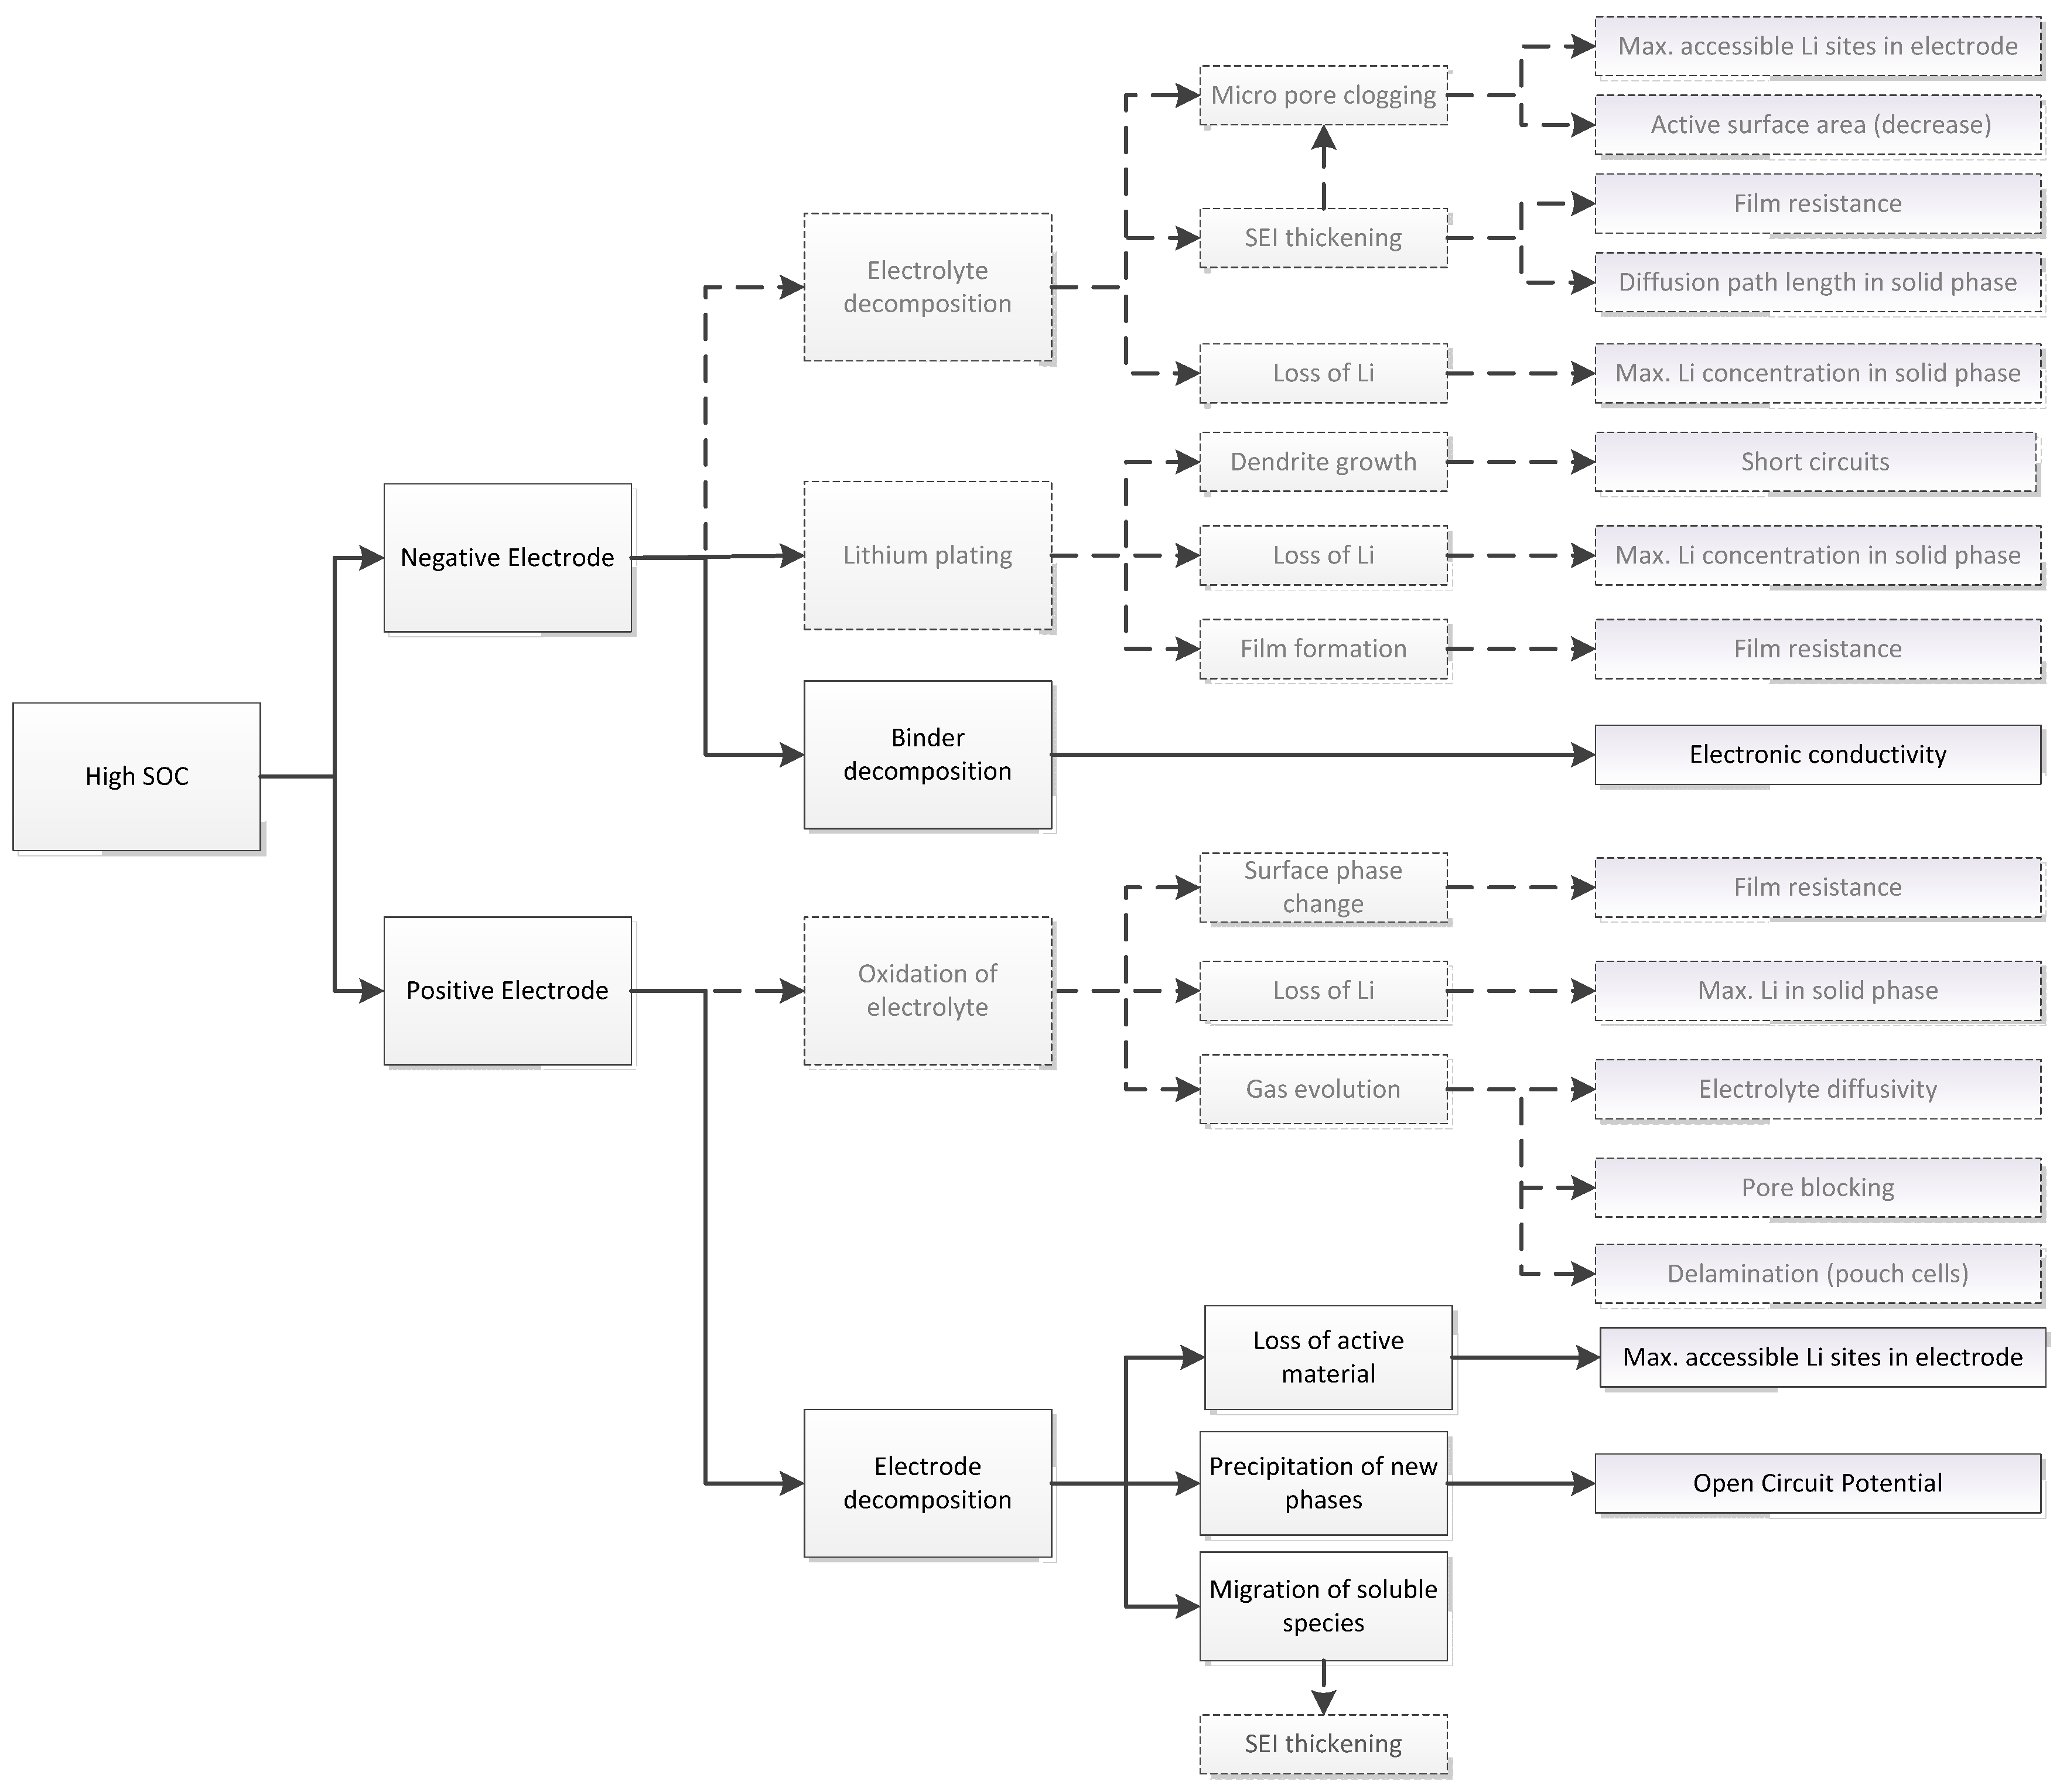
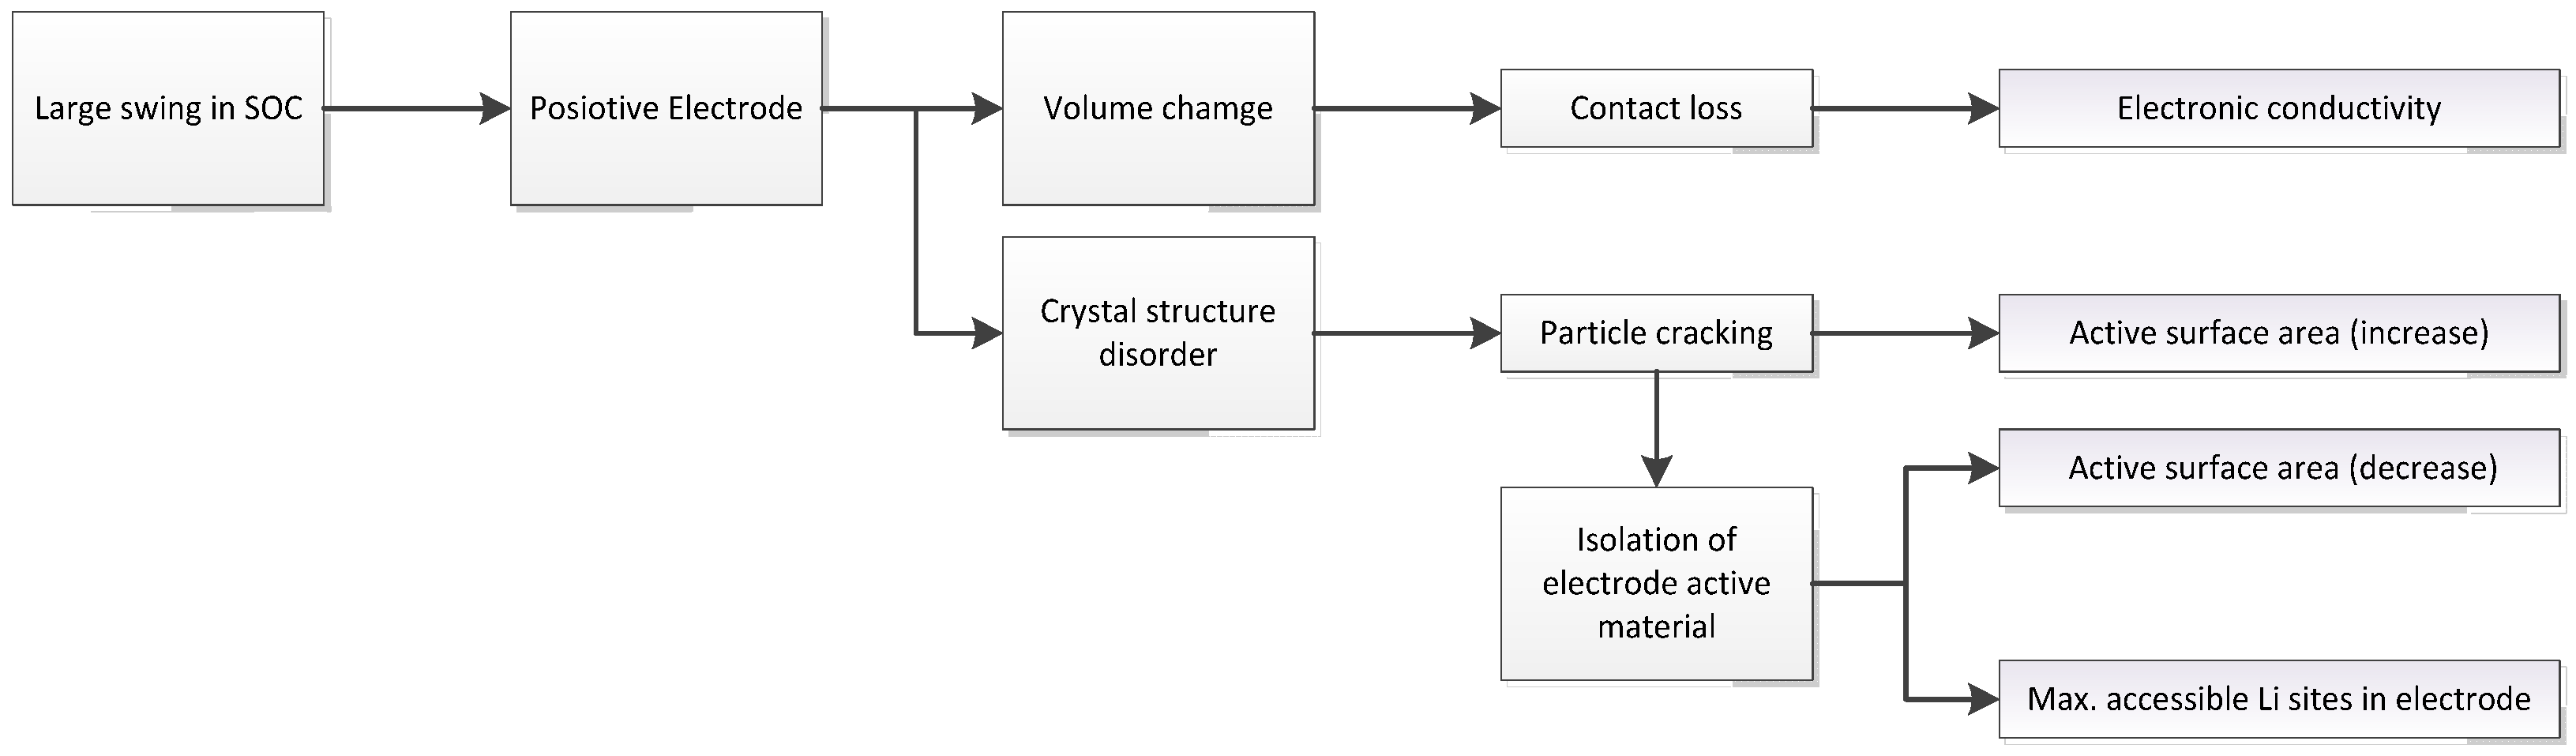
3.1. Expected Parameter Changes Resulting from Battery Degradation

In addition to calendar age (tage) and cycle number (N) which are known to cause degradation in proportion to tz [13] and N [14], respectively; temperature [4,23], SoC [24], ΔSoC [25] and current [26] are also known accelerators of battery degradation. The effects of these stress factors—based on published literature—at the microscopic level along with their quantifications in the P2D model are presented using flow charts below. The charts begin with stress factors and subsequently categorise degradation expected at each electrode. Typically, parasitic reactions lead to film formation while mechanical fatigue leads to structural degradation.
The effects of high temperature storage are depicted in Figure 1. The most notable cause of degradation attributed with elevated temperatures is electrolyte decomposition reactions at the negative electrode/electrolyte boundary which consume lithium ions—resulting in capacity fade—subsequently forming a solid electrolyte interphase (SEI) layer on the negative electrode surface [27]. The SEI then acts as an impediment to ionic diffusion leading to power fade [28].
At cold temperatures, on the other hand, lithium metal deposition is the principle degrader [28]. Lithium precipitates from the liquid solvent onto the electrode surface (deposition) when the proximity of the anode reversible potential is close to that of the lithium deposition potential and is exaggerated by conditions where Li intercalation kinetics are hindered. In addition to low operating temperatures as depicted in Figure 2, poor current distribution and high charging rates also lead to Li plating, as shown in Figure 3 [29].
During such conditions, intercalation becomes energetically less favourable causing the potential to drop to (or below) the lithium plating potential (0 V relative to Li/Li+). Li plating then occurs at a rate proportional to the overpotential relative to the 0 V equilibrium [15].
Large cycling currents have also been linked with the formation of lithium grains through exfoliation which leads to the decrease of secondary active volume, and therefore capacity fade [30].
Current collector corrosion—where the current collector reacts with electrolyte components—is a prominent degradation mechanism at low SOCs where the potential of the anode gets too positive versus Li/Li+ (Figure 4). This leads to loss of electronic and mechanical contact between the current collector and the other electrode components. Furthermore, corrosion products that exhibit poor electronic conductivity cause overpotentials and favour inhomogeneous current and potential distributions, and thus, lithium plating [4].
The coupling of high SoC storage and high temperature is known to accelerate degradation. The Arrhenius equation suitably represents this coupling [16] and elucidates their interactions. As the SoC increases, activation energy—which represents the energy barrier for the thermal activation process—falls, thus promoting further parasitic reactions; see Figure 5 for a depiction of typical parasitic reaction paths.
For some positive electrode chemistries, active material dissolution into the electrolyte solvent is a key aging effect [31]. Though it is present to some extent for many olivine, layered, and spinel structures, it is particularly severe for lithium manganese oxide (LiMn2O4) [32].
Mechanical stresses on active electrode particles are usually attributed with the non-negligible volume changes caused by Li+ intercalation into the host matrix; the displacement causes a strain in the active material eventually leading to particle cracking [33]. As expressed in Figure 6 large swings in SoC intensifies volume expansion and hence the stress at the host electrode [27]. It is also argued that concentration discontinuities at phase boundaries in materials that undergo a phase change during intercalation result in stress discontinuities leading to cracking [34].
Even under moderate conditions the battery is expected to degrade thorough the formation of SEI as time passes and mechanically as the battery is cycled [35]. Figure 7 highlights the expected degradation resulting from large amounts of cycling.

3.2. Reducing the Number of Parameters Selected for Identification

As mentioned in Section 2.2, 28 parameters can theoretically be identified, but not all of these parameters will change due to applying a particular stress factor. Therefore, by selecting parameters that are likely to change we are able to restrict the number of parameters needing identification and thus moderate the indefinability problem. To do this, given knowledge of the stress factors applied to a battery, the charts presented in Section 3.1 are used to estimate parameters likely to vary and consequently restrict the identification process to these parameters, assuming all remaining parameters are unchanged.
For example, in a case where the battery is cycled from 100% to 0% SoC continuously (under relatively small currents and an ambient temperature of 15 °C), we expect that structural degradation will dominate. In particular, utilising Figure 6, we find that electronic conductivity (σs,+), active surface area (A+) and the maximum number of accessible Li sites ( c s , + max ) in the positive electrode will significantly change. Therefore, rather than identifying all 28 parameters we can focus of identifying these three parameters.
In cases where multiple stress factors are involved or multiple degradation mechanism excited, additional parameters may be included. Thus, building on the previous example, if we also assume that in addition, binder decomposition occurred at the negative electrode when the battery was cycled at low SoC’s we can also include ( c s , max ).

4. Parameter Identification Process

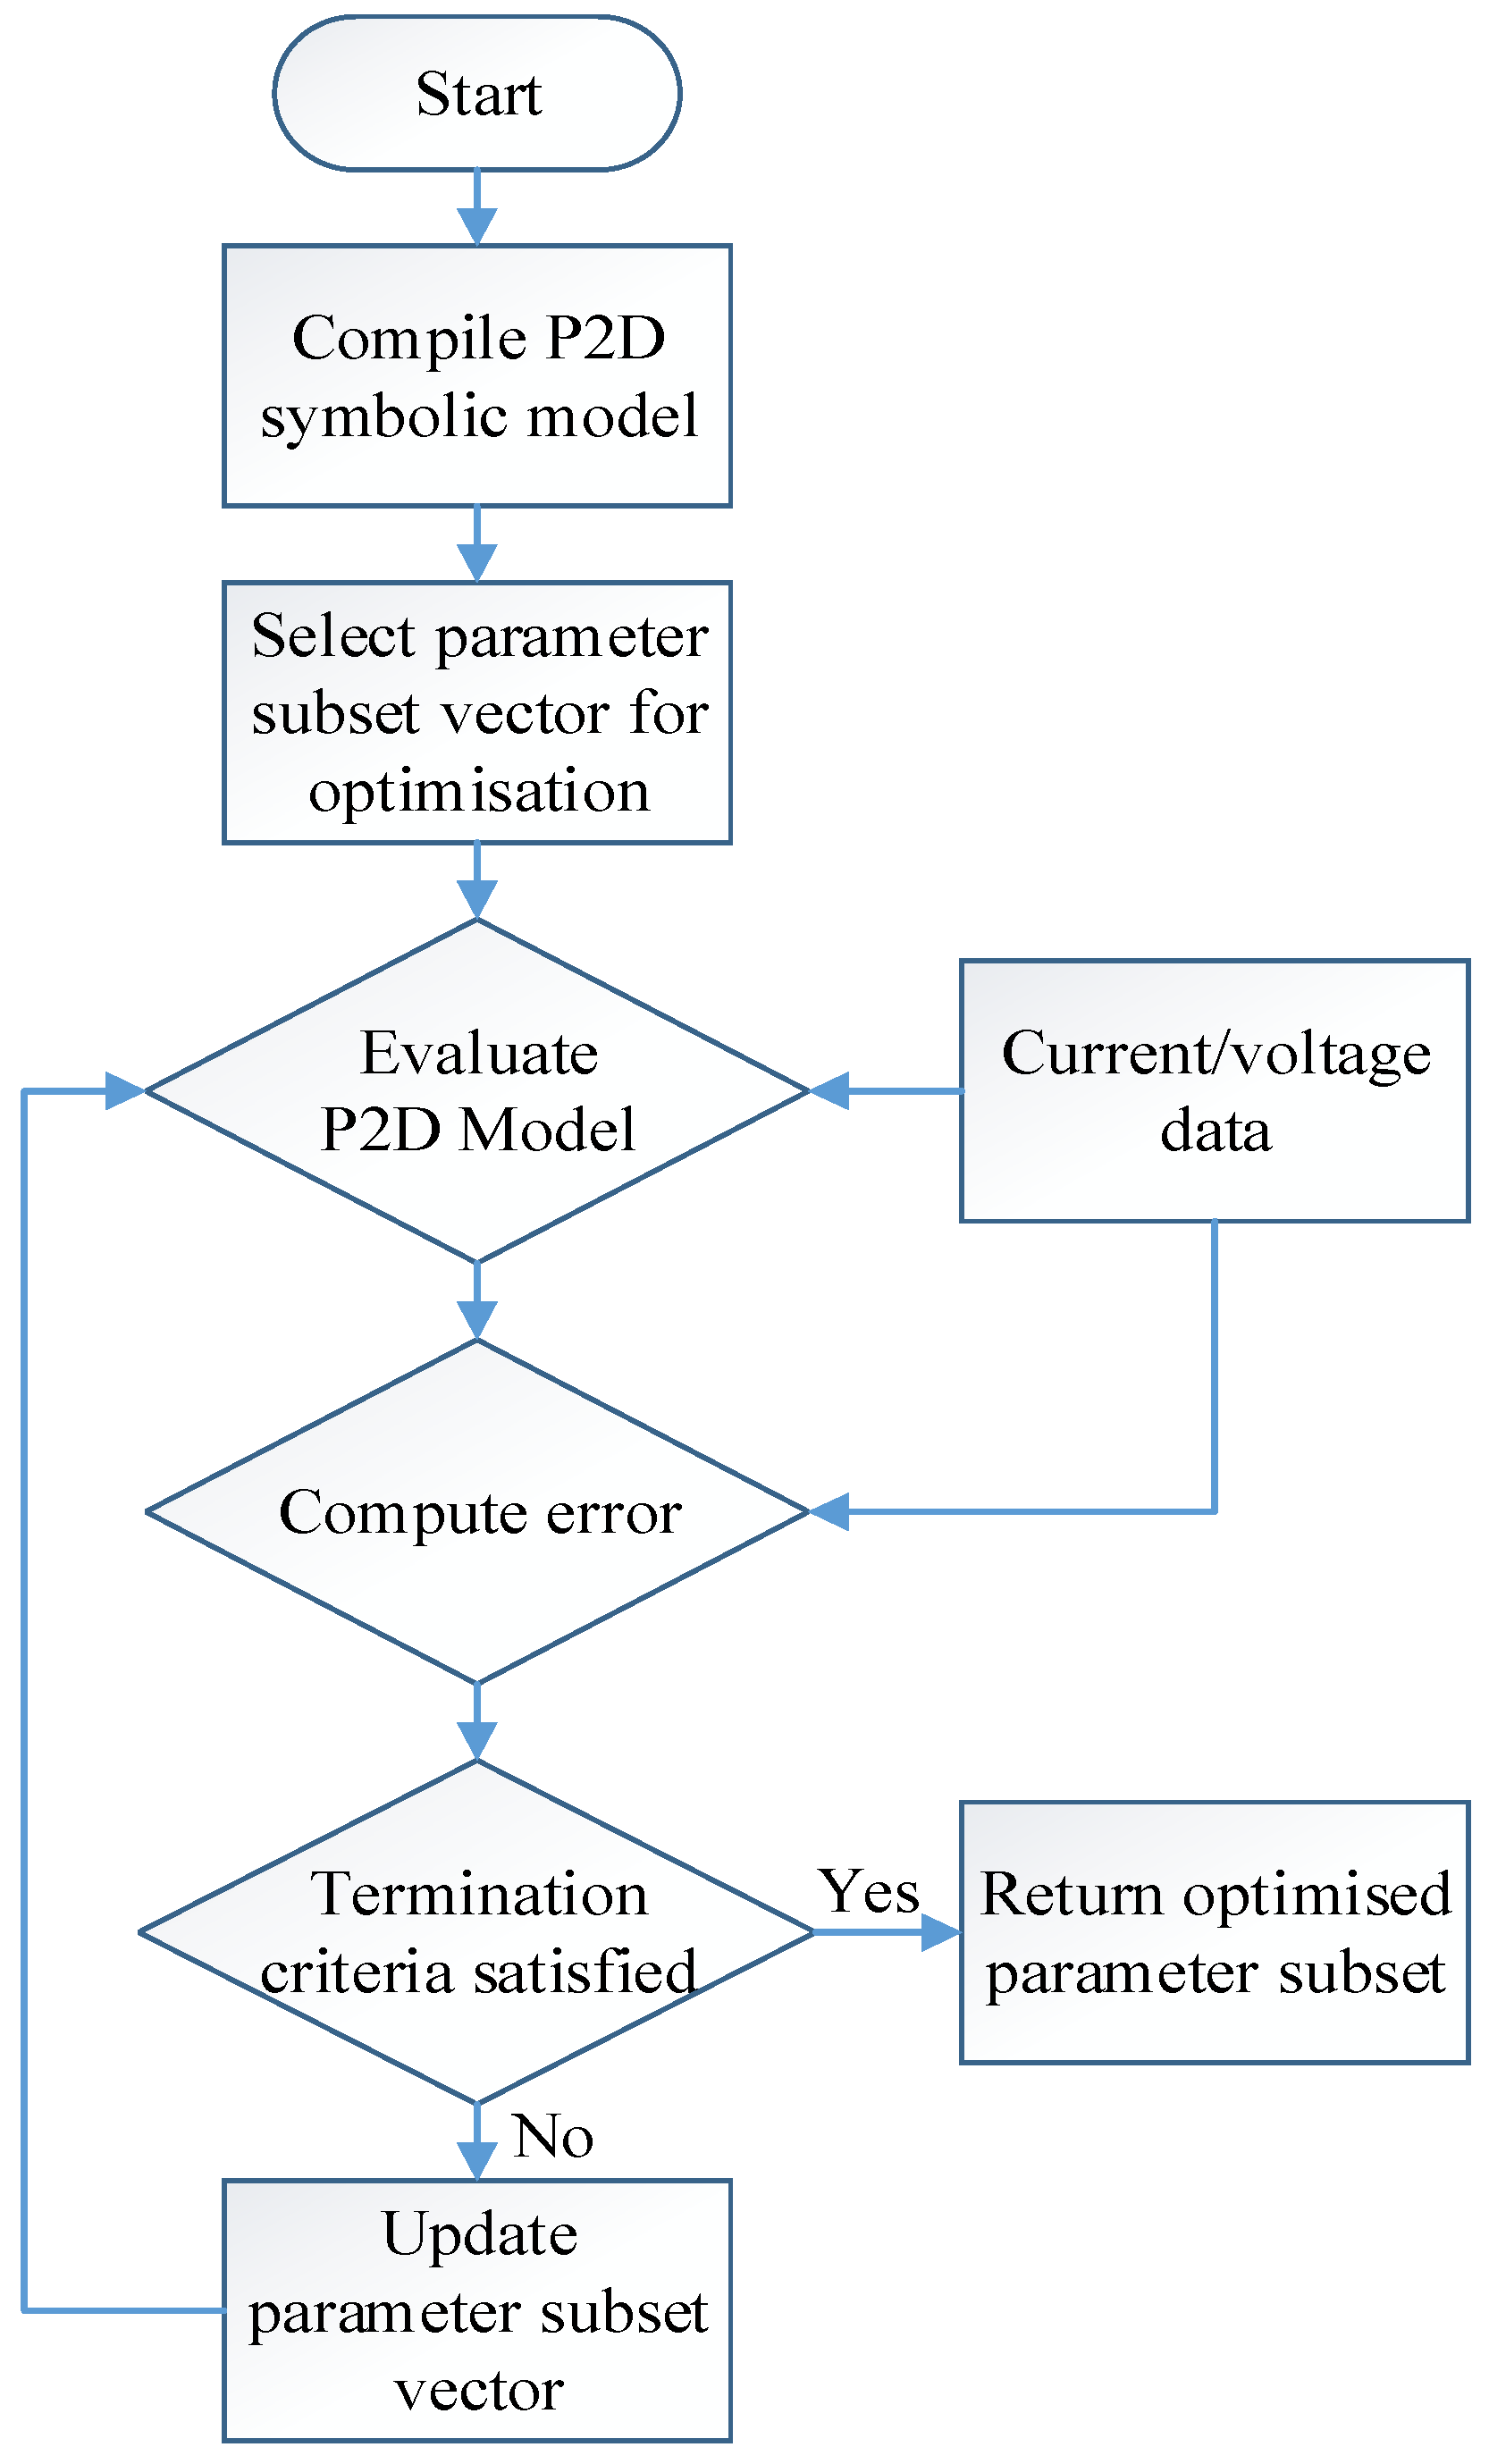
4.1. Optimisation Strategy

An overview of the optimisation procedure is shown in Figure 8. The ideal aim of the optimisation strategy is to uniquely identify the parameters of the model for a given cell degradation scenario. There are two parts to achieving this research objective: (1) solving the P2D model for a given set of model parameters; and (2) finding the parameter set that minimises the sum of squared error between the simulated response of the cell and the experimentally observed voltage for a given drive cycle. For the latter, the P2D model script is embedded within the optimisation algorithm that identifies the best set of model parameters that minimises the square of the error.
The electrochemical model equations given in Section 2 are solved using the finite difference approach within Maple. To achieve increased simulation times that subsequently facilitate non-linear parameter fittings, during compilation, redundant model equations are removed. The simulation framework generates a highly optimised derivative of the model in C-code that optimises system memory and run-time performance. Because the battery model is numerically stiff a robust numerical integration algorithm is required that is able to dynamically change the magnitude of the integration interval in line with the evolution of the model states. Within this research the Rosenbrock algorithm has been employed [36].
For a cell aged by one or more of the identified stress factors, a current cycling profile and corresponding voltage response at a given cell age is used to estimate the model parameters (or a subset of them). Generating a trace of the optimised parameters with cell age, thereby facilitates cell degradation to be characterised and consequently the nature of the degradation mechanism to be estimated.
For a given discharge current-voltage profile, the optimum parameters are obtained by minimising a quadratic error cost function (Equation (6)). In Equation (6), v is voltage, tend is the final time, the subscripts e and m represent experimentally measured and modelled values respectively, wi represent weights attributed to terms in the cost function, and γ is the vector of parameters to be optimised.
Minimise  F ( γ ) =   w 1 t = 0 t max [ v e ( t ) v m ( t , γ ) ] 2 + w 2 [ ( t e end t m end ) ] 2 ,  subject to  γ i 0
The weighted, bounded nonlinear optimisation problem in Equation (6) is iteratively minimised using a differential evolution (DE) algorithm (diffevol) within Maple’s Global Optimisation package. The diffevol algorithm is the Maple implementation of DE innovated by Storn and Price [17,18]. While traditional optimization methods such as the quasi-newton method requires the optimization problem to be differentiable, DE does not use the gradient function of the problem being optimized and therefore is more suitable for optimization problems that are variable, noisy and non-continuous. DE is a essentially a way of generating a trial vector from two known candidate vectors by adding the weighted difference between them; the scheme is then to keep whichever candidate solution has the best fitness for the optimization problem being considered. A detailed discussion of DE is beyond the scope of this paper; theoretical and practical aspects of using DE is well documented and can be found in [37]. In multi-objective, stochastic problems with non-linear, non-differentiable objective functions and multiple possible local minima, such as the problem in this work, the DE algorithm is a well-established method for deriving approximate solutions [38,39]. As the minimisation routine is iterative the values listed in the second column of Table 2 are used to initiate the optimisation algorithm and terminates if the pre-defined maximum number of iterations is reached or the variation over each successively optimised parameters is below a predefined tolerance. For the research presented here, the maximum number of iterations was 320 and the parameter variation tolerance was 1 × 10⁻³.

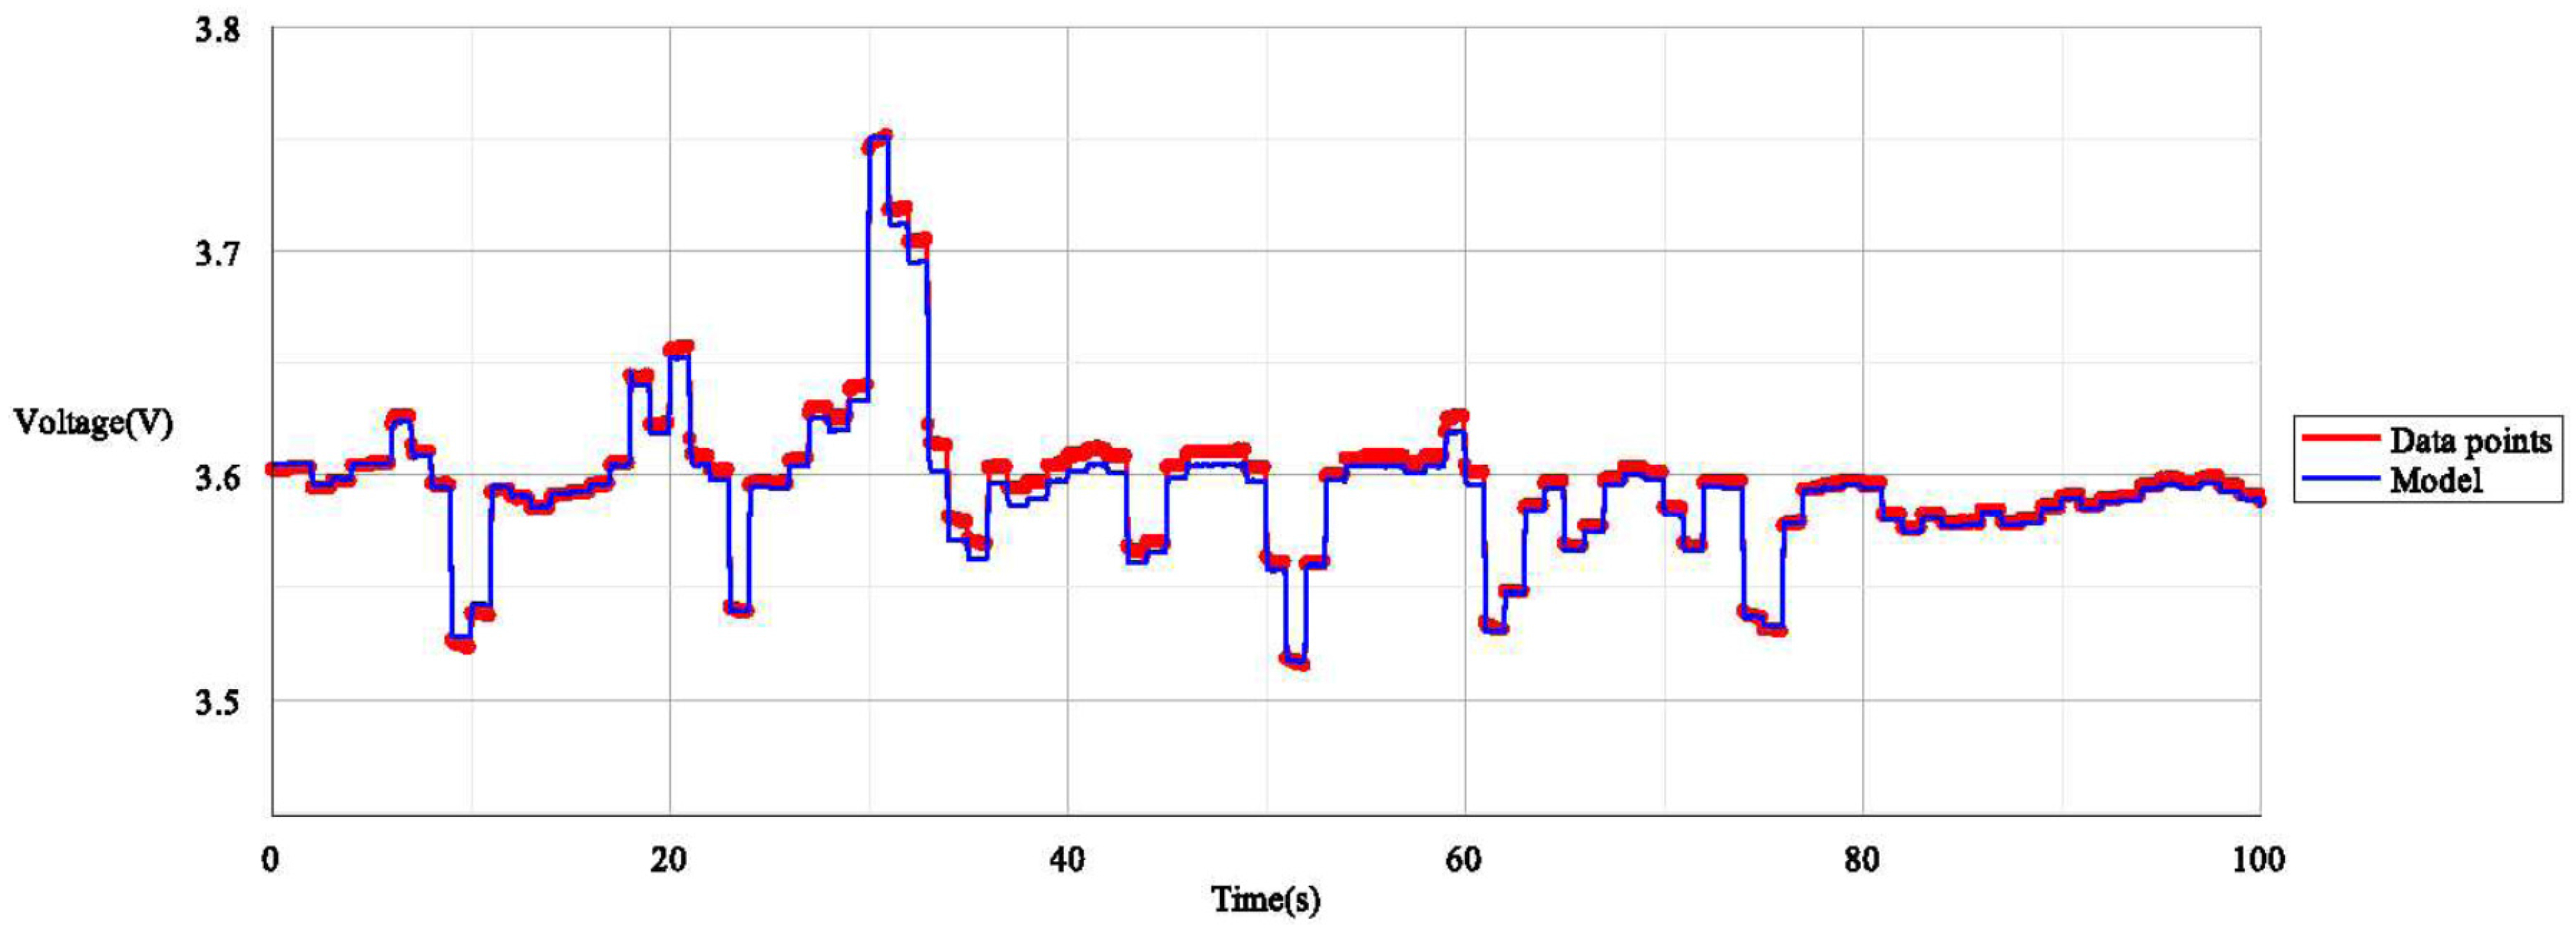
4.2. Verifying the Non-Aged Refined Parameter Set for LiNiCoAlO2

In this study we use a 3.03 Ah NCA 18650 cell; using the optimisation method described in the previous sub-section and the initial parameter set detailed in Table 2. Based a number of recent studies [14,20,21], refined parameter set presented in the second column of Table 2 that is used as an initial guess for the optimisation process. The potential U of the graphite (LixC6) negative electrode is assumed to initially follow the empirical correlation from [40]. The positive electrode potential (U+) is derived by subtracting U from the cell’s open circuit voltage and fitting to Equation (2) using the non-linear least squares approach:
U + = 7.3203 42.6905 x + + 211.1859 x + 2 504.6774 x + 3 + 614.6070 x + 4 367.1214 x + 5 + 84.1478 x + 6 0.0016 e x p [ 10.8867 x + 10.4676 ]
Using U from [16] and U+ as defined in Equation (2) the parameter values listed in Table 2 are refined against the initial (age 0 days) 1C discharge curve. This new “refined” parameter set forms the baseline parameter set for the NCA battery model parameters from which ageing causes deviations.
As is usual practice (e.g., as discussed within [20]), to validate the identified parameter set, the authors compare the simulated voltage response for a drive cycle with the measured voltage. A vector comprising a 100 s of measured versus actual voltage data is presented in Figure 9 which shows a good fit between measured and estimated voltage. The maximum voltage discrepancy was <0.02 V which is comparable to transient error presented in the literature [19]. Thus, the refined parameter set in Table 2, derived from 1C discharge data, is shown to replicate a dynamical usage cycle with negligible error. Hence, the refined set of parameters is considered to be the baseline parameter set for the NCA battery used in this study.

5. Results and Discussions

5.1. Conditions for the Cell Ageing Experiment

To illustrate techniques developed in this paper, an example of degradation caused by high temperature storage—of a 3.03 Ah NCA/C6 18650 cell stored at 45 °C at 50% SoC for approximately 500 days—is studied. This stress factor was chosen because at elevated temperatures the most notable cause of degradation is electrolyte decomposition reactions at the negative electrode/electrolyte boundary which consume lithium ions—resulting in capacity fade—subsequently forming a SEI layer on the negative electrode surface [4]. The SEI then acts as an impediment to ionic diffusion leading to power fade. The growth of SEI is a well-established-well-studied degradation mechanism and therefore provides a method for corroborating the results presented in this work. Comparing results derived from the identification technique presented here with established trends for EIS growth in the literature provides a level of validation, which is otherwise difficult to achieve in such a context.
The effect of high temperatures at the microscopic level along with its quantifications in the P2D model is presented in Figure 1. The chart begins with the stress factor and subsequently categorises degradation expected at each electrode. Typically, parasitic reactions lead to film formation while mechanical fatigue leads to structural degradation. Given that electrolyte decomposition is the dominant ageing mode [4] the parameters likely to change include: maximum Li-ion concentration in the negative electrode ( c s , max ); thickness of the SEI layer on the negative electrode particle (s) which will contribute to power fade through the increased solid diffusion path length which in turn leads to higher film resistance (Rfilm) since , where κ is the SEI resistivity; and the effective capacity (Ceff) which will account for capacity fade arising from loss of Li through parasitic reactions and loss of sites.
Material properties of the SEI used in the model included: an SEI molar mass of 26 g/mol [41]; and an SEI molar density of 2.6 g/cm3 [41]. The SEI conductivity (σSEI), defined such that Rfilm = (σSEI·s)−1, is estimated via fitting to be 2000 S/cm. To contextualise the latter, it is worth noting that Pinson and Bazant [41] assumed the SEI conductivity to be infinitely large in their models, so the fitted value of 2000 S/cm is acceptable.

5.2. Battery Ageing Characterisation

Cells available off-the-shelf were characterised upon delivery. The characterisation tests involved: discharge and charge capacity tests at 1C, C/10 ad C/25 rates at 25 °C; pulse power tests at 90%, 50% and 20% SoCs at 25 °C using 10-s current pulses at 20%, 40%, 60%, 80% and 100% of manufacturer recommended maximum charge and discharge currents; electrochemical impedance spectroscopy (EIS) tests at 90%, 50% and 20% SoCs at 25 °C. After this initial characterisation test, the cells were stored in a thermal storage chamber. After approximately two-months at elevated temperature storage, the cells were re-characterised using the same characterisation tests (except the C/25 capacity tests). This storage-characterisation cycle continued until the cells were aged for 476 days.

5.3. Battery Ageing Diagnostics Using Parameter Identification

From the ageing characterisation data set, the 1C constant current discharge data and 10 s pulse data were used in conjunction to fit the P2D model, optimising for c s , max , Rfilm and Ceff. That is, all model parameters were left unaltered from the 0-day (refined) parameter set, except for these parameters. To refine these parameters for a particular vintage data set, the P2D model is executed many times for different combinations of parameters. Excluding the time required to compile and install the model for a new data set which takes in the order of 10 min, a single execution of the P2D model for a given parameter vector set took significantly less than one-second. This is considerably faster than 63 s for a single run reported in previous work [15], which can lead to hours of simulation time.
Variations of c s , max , Rfilm and Ceff as a function of age are depicted in Figure 10. The maximum lithium concentration of the negative electrode ( c s , max ) fell from 30,055 mol·m−3 to 27,532 mol·m−3, i.e., the number of accessible sites in the negative electrode fell by 8.2%; this relates to sites that are blocked by SEI and not necessarily those lost through dissolution or other mechanism. Film resistance (Rfilm) rose from 0.000723 Ω to 0.00637 Ω, a rise of 781%. The results suggest that towards 476 days the thickness of the SEI began to stabilize (i.e., the rate of SEI growth began slowing down). Finally the effective capacity of the cell fell from 2.84 Ah to 2.63 Ah exhibiting a total capacity fade of 7.4%.

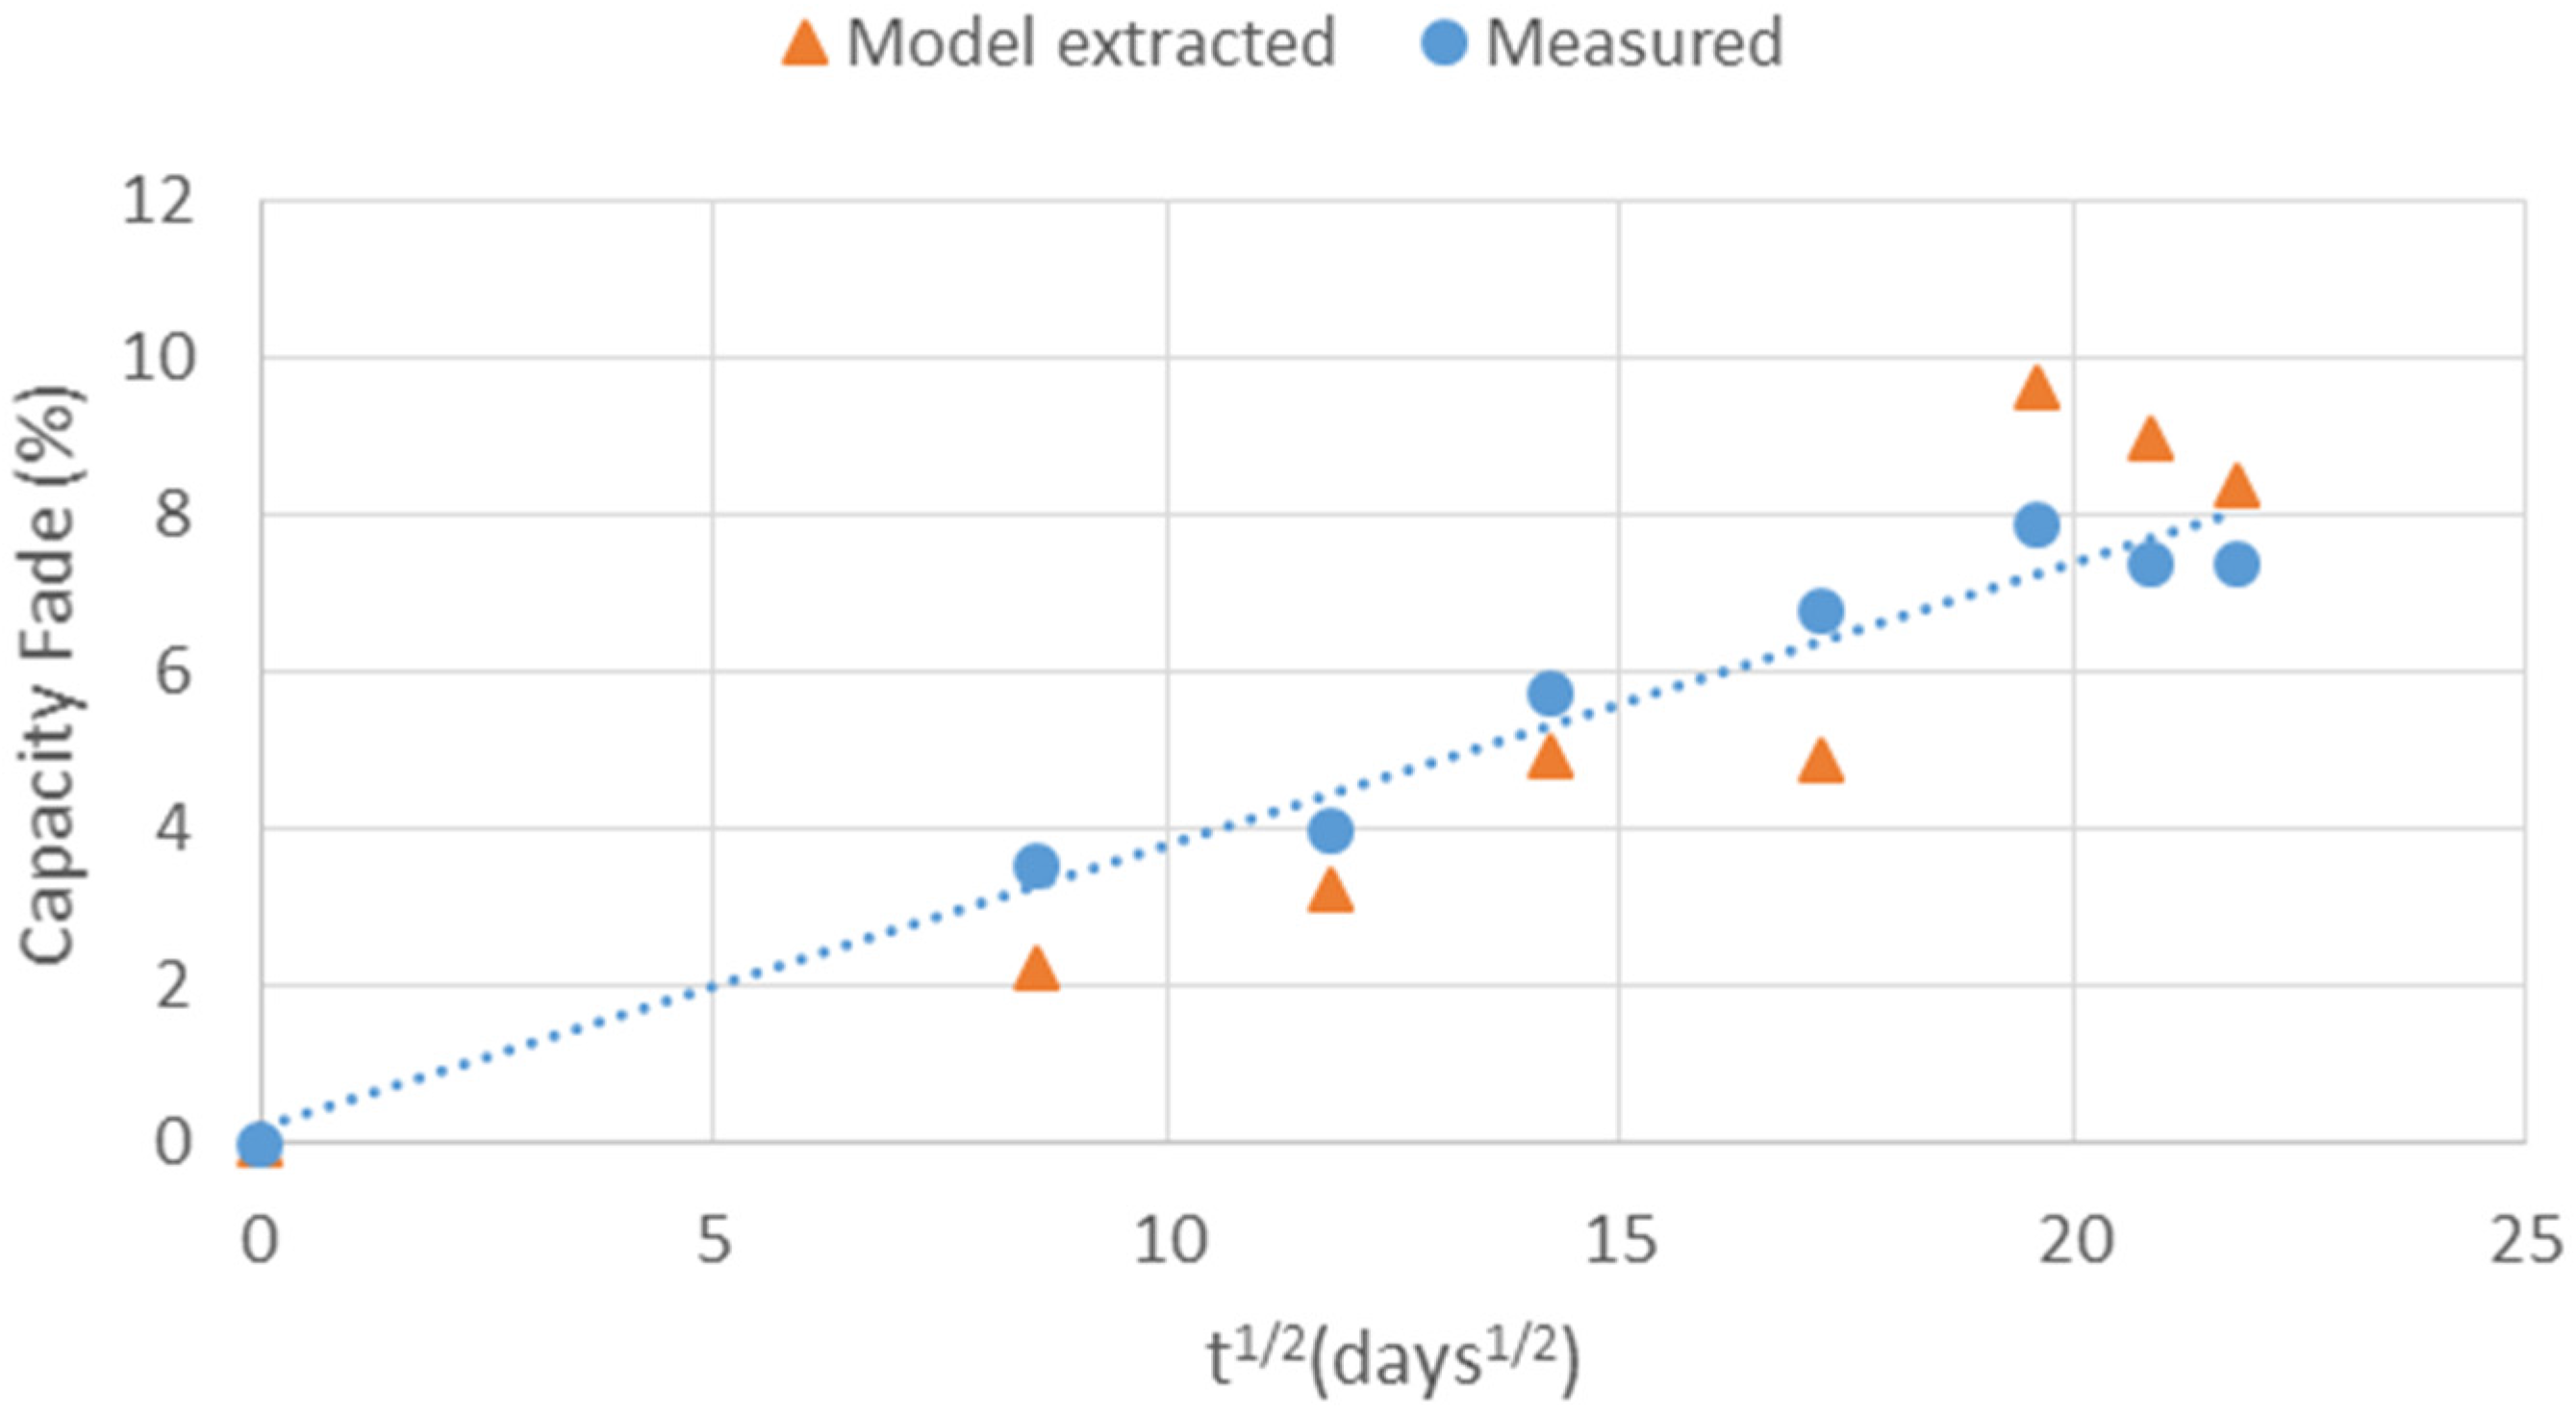
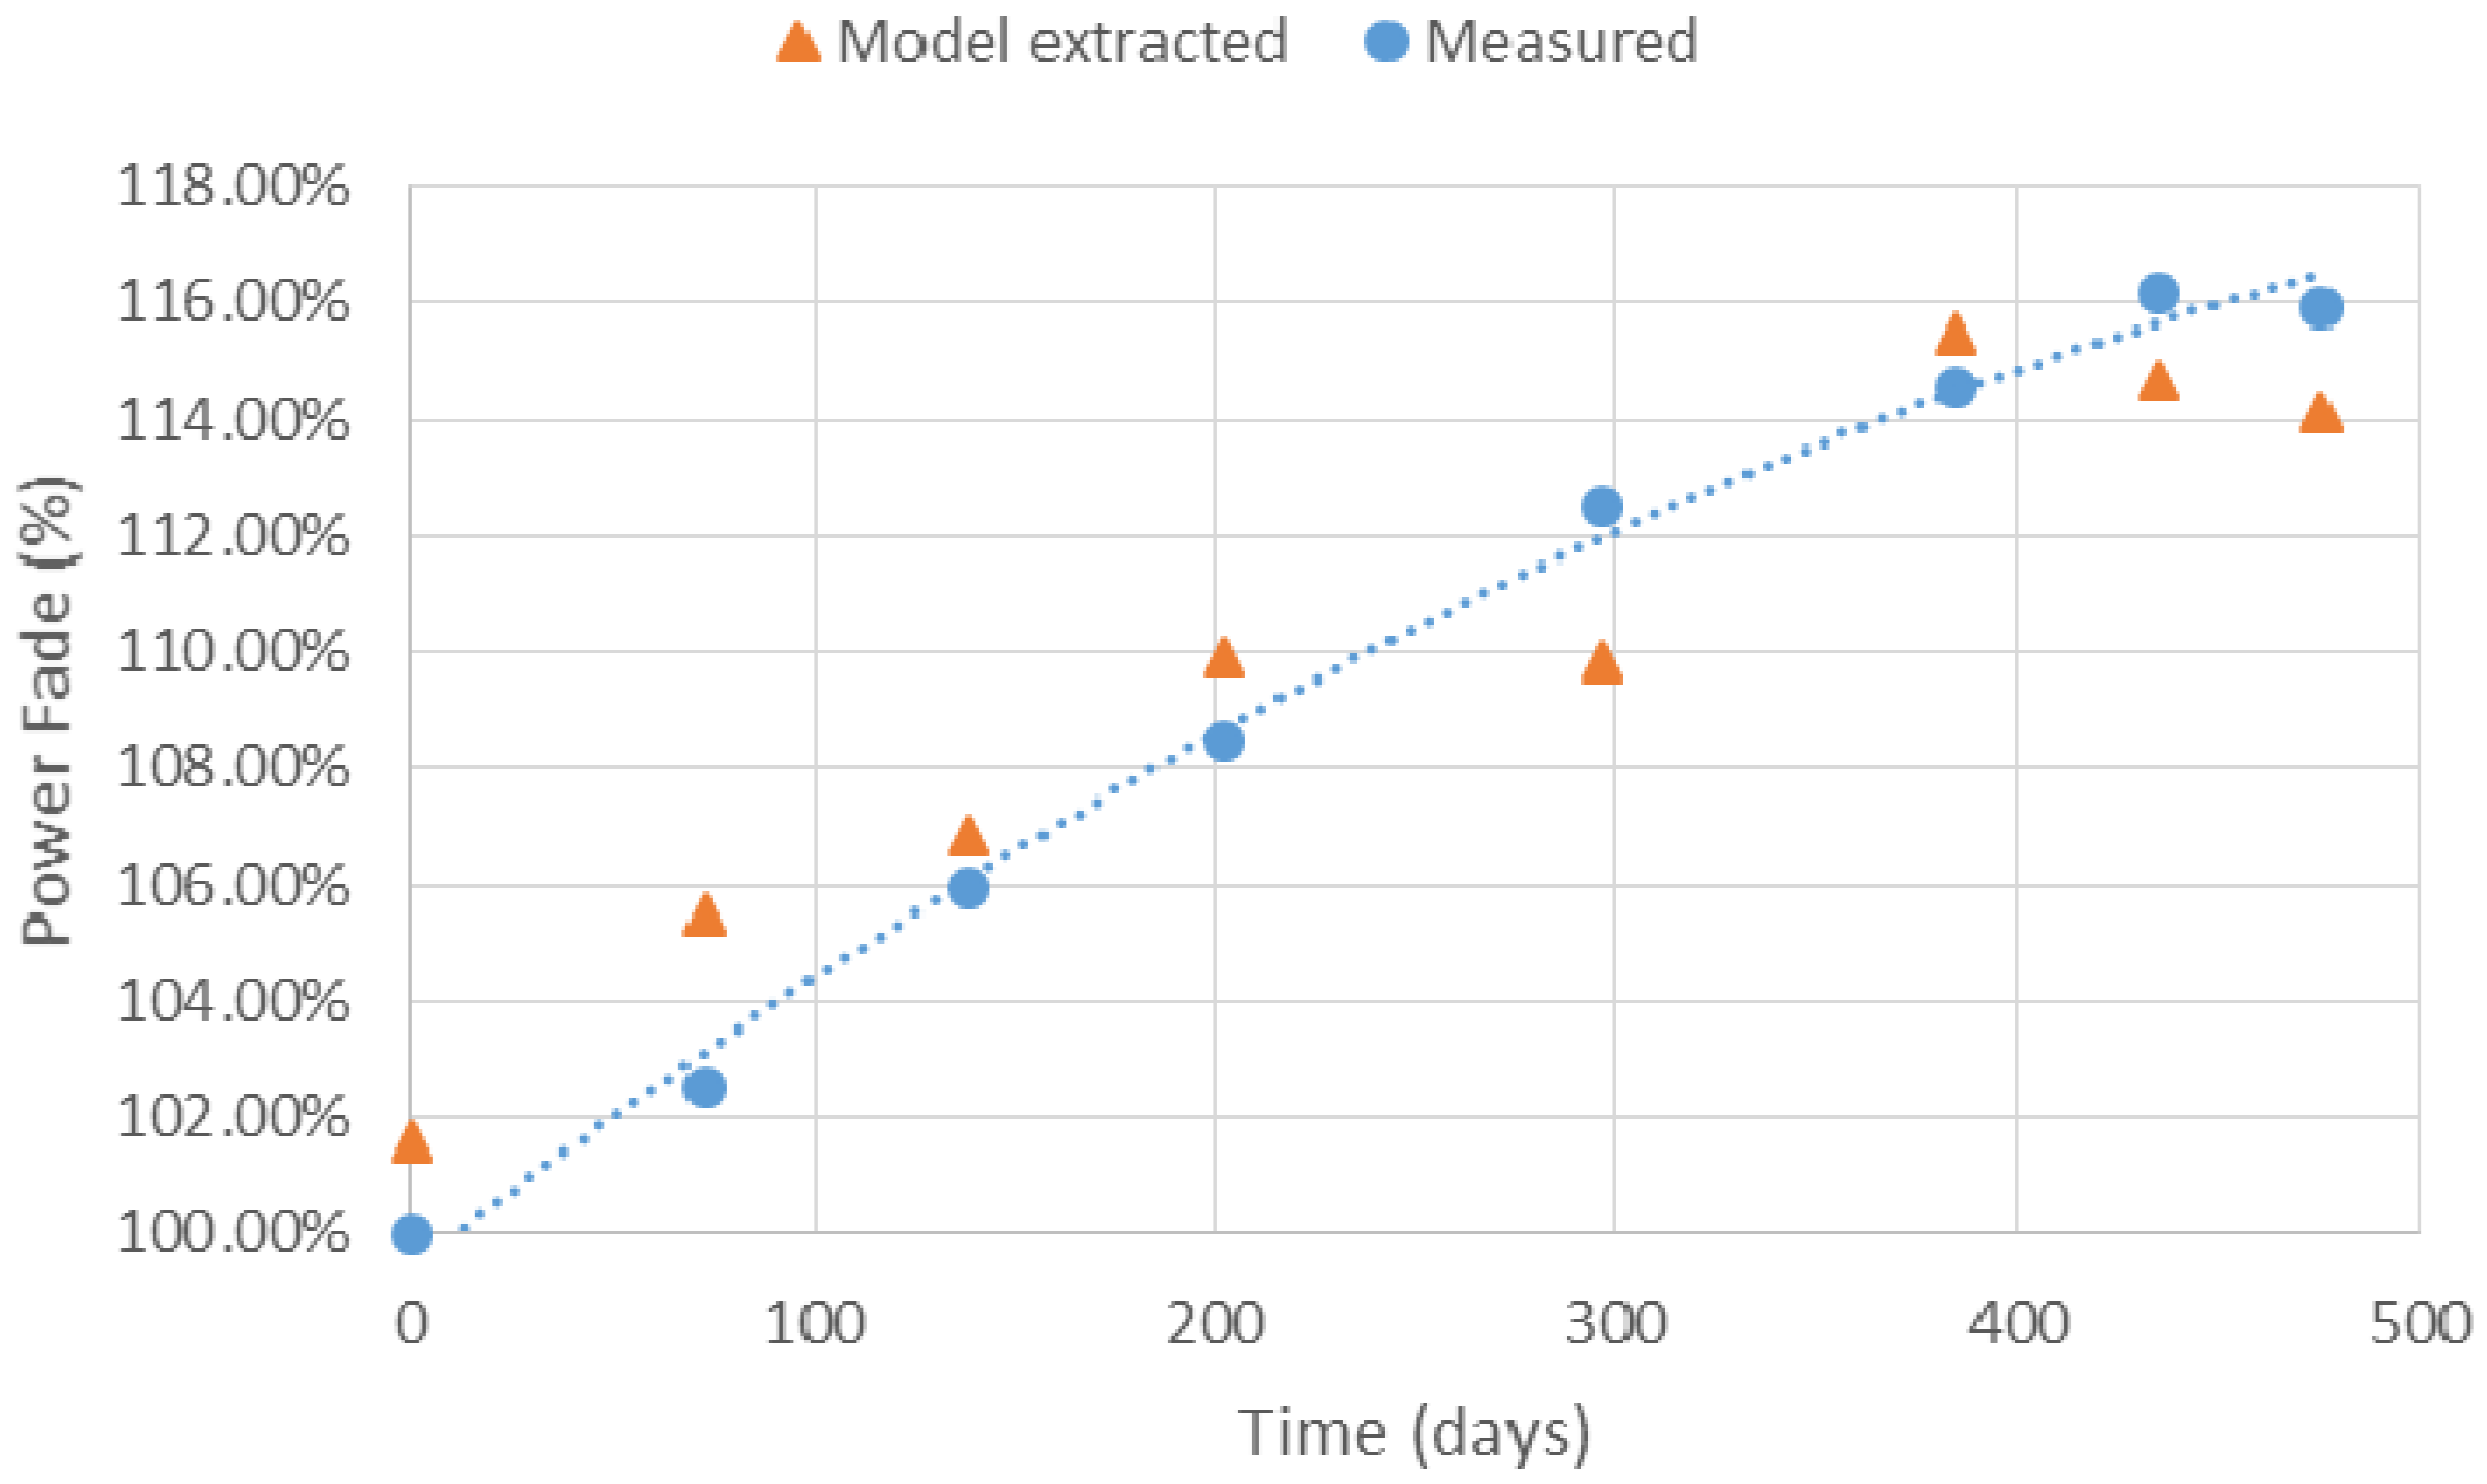
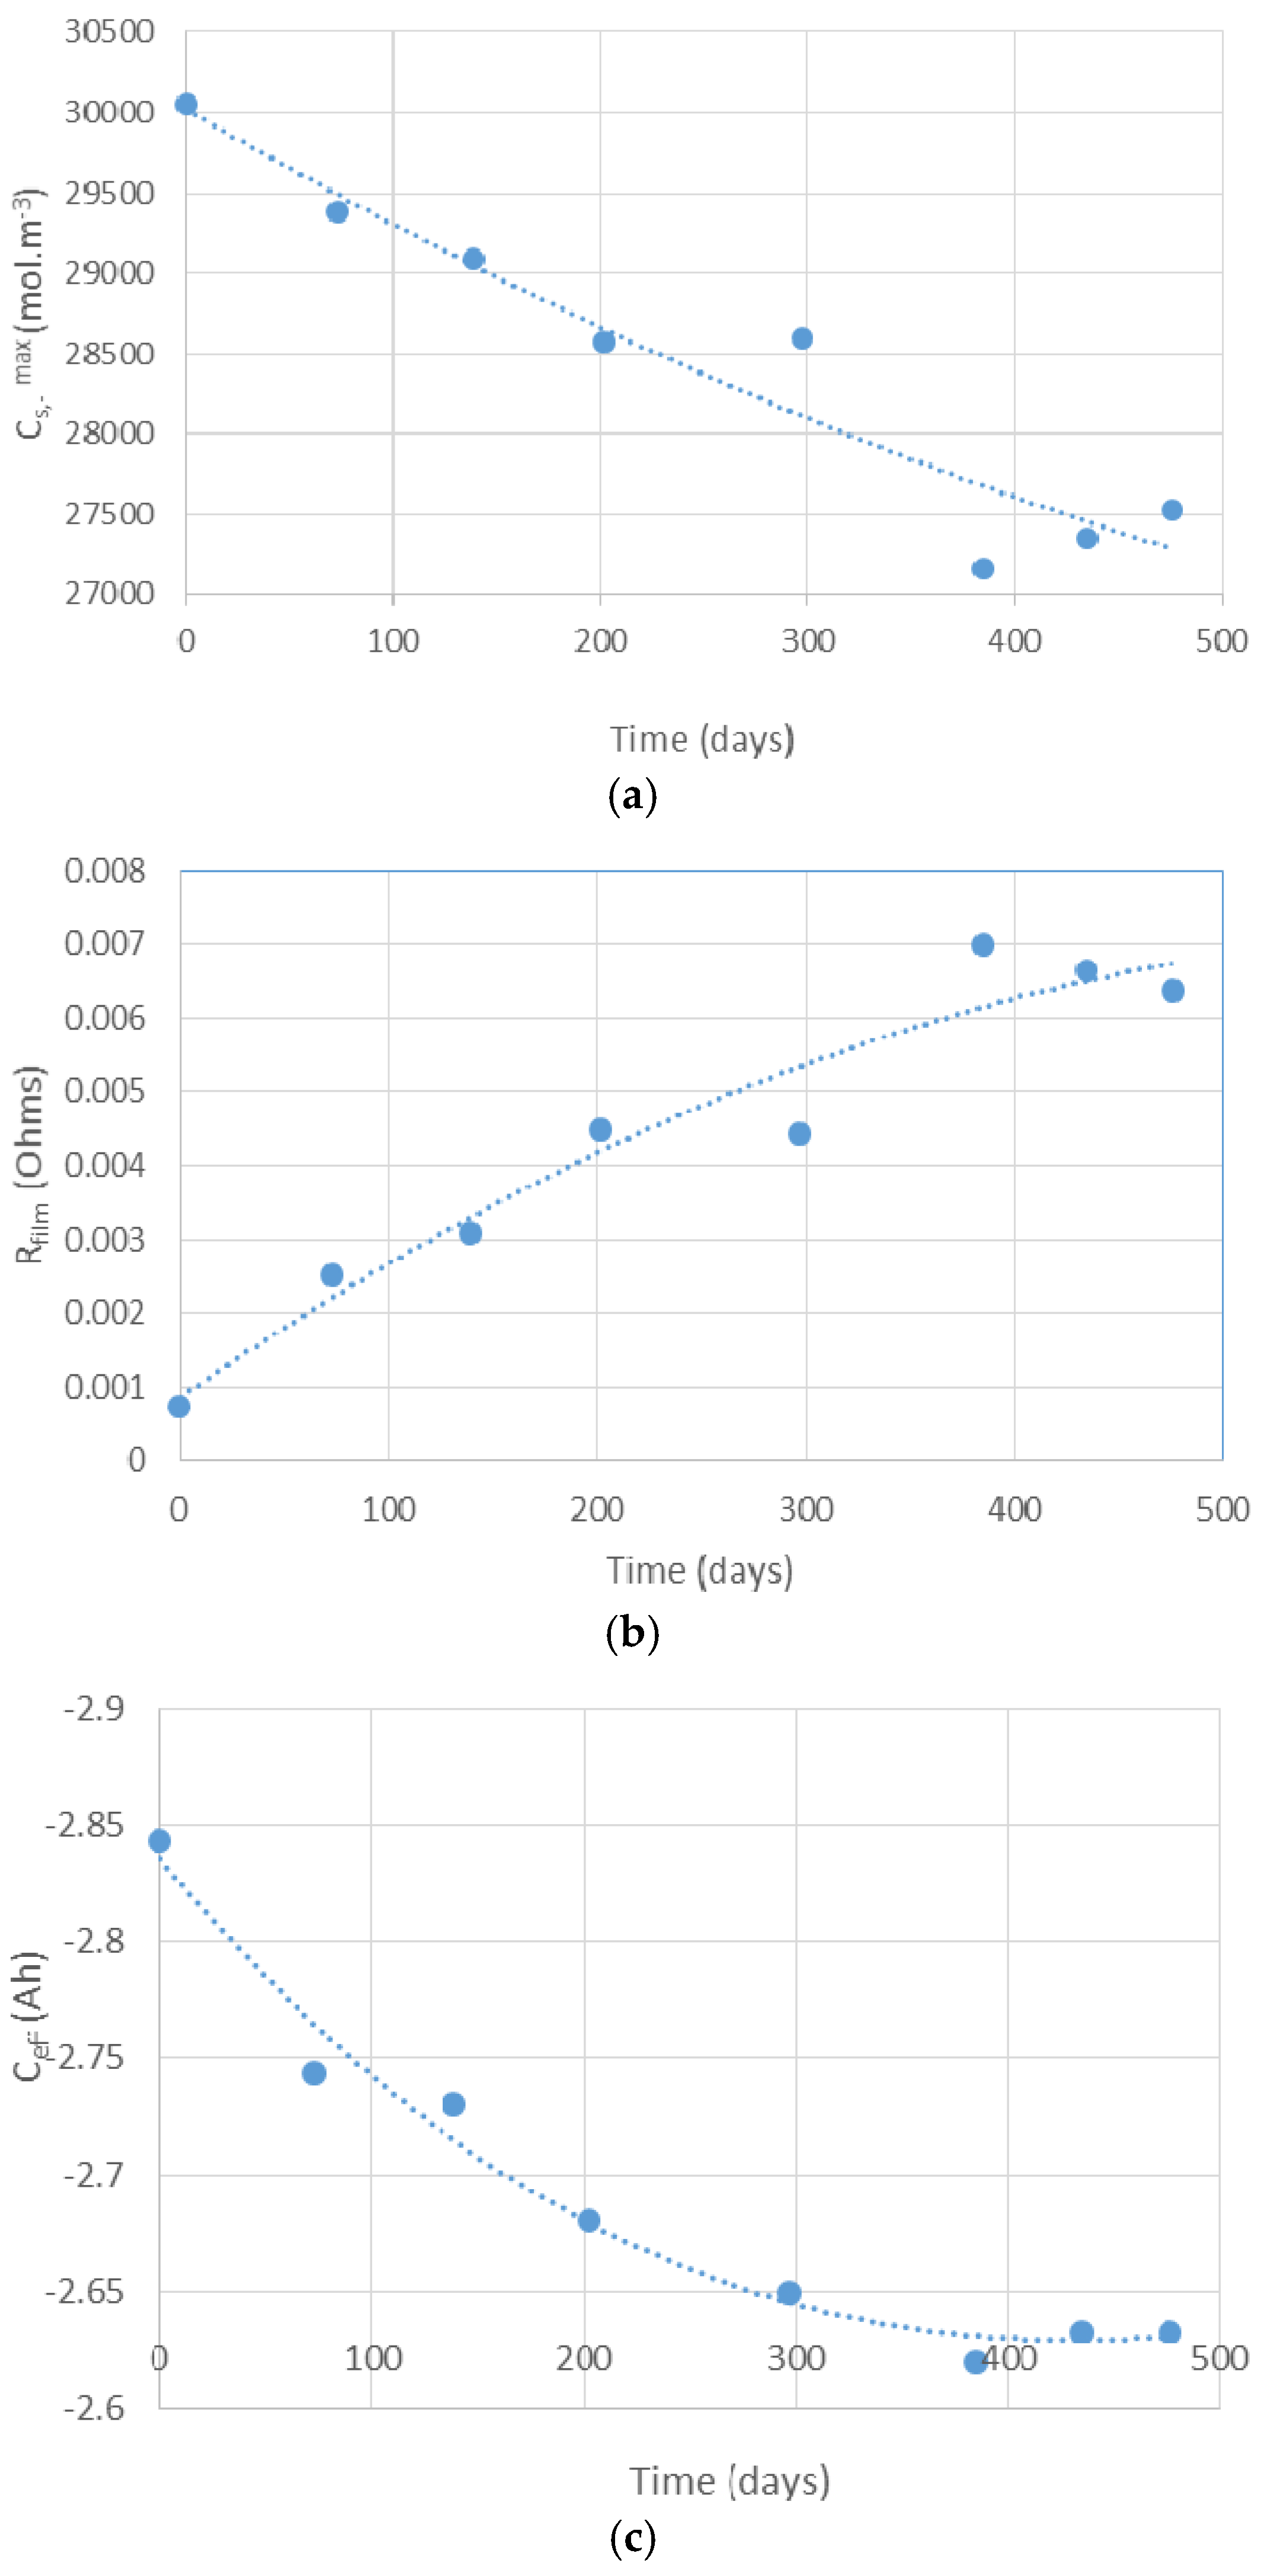
5.4. Analysis of Model Extracted Results

Due to the difficulty in experimentally validating the parameters presented in this paper, both in terms of the resources required and the fact that robust experimental techniques for such measurements are yet to be established, to verify the evolution of model parameters derived from model parameter identification we compare capacity and power fade extracted from the model with measurements made from traditional non-invasive tests. In the case of capacity, we use the C/10 discharge capacity as a measure of capacity fade. Given that electrolyte decomposition and the subsequent formation of SEI is the dominant ageing mechanism for high temperature storage [4], capacity fade is expected to follow a t relationship [42]. This is because within the context of a one-dimensional model based on solvent diffusion and kinetics, film formation is assumed to be a first-order reaction, i.e., the rate constant for film formation is first-order. In the limit of large times, the solution for the differential mass balance at the electrode/film boundary is then found to be proportional to t . In Figure 11, model extracted versus experimentally measured discharge capacity as a function of t is shown.
The evaluation presented in Figure 11 shows that the level of capacity fade (difference in C/10 discharge) estimated from the model parameters coincides well with laboratory measured data with a discrepancy of ~1% in the final 476 day data point.
Assuming solvent decomposition is a first order reaction, an assumption also employed within [41], it would be expected that capacity fade is proportional to the thickness of the SEI. In agreement with results presented in [41], Figure 10 and Figure 11 highlight a linear relationship between model extracted SEI thickness (s) and capacity fade. The resistance of the SEI layer, the main contributor to resistance rise and consequently power fade, is proportional to the thickness of the SEI layer. The power fade (shown in Figure 12) measured using a 10 s, 1C current pulses compared to that extracted form model parameters again shows good agreement as shown in Figure 8.
This agreement of model-extracted results for capacity fade and power fade indicates that the technique can indeed be used, in addition to established techniques, to investigate detailed changes in the battery resulting from degradation. Here we have considered the example of elevated temperatures because the resulting degradation mechanism (growth of SEI) is well established and studied in the literature and hence provides a method for substantiating our results. Extending this argument, the same technique can be used for other stress factors and ageing mechanisms.

6. Conclusions

In this, paper the framework and procedure for a battery ageing diagnostics technique based on identifying the parameters of the P2D battery model is presented. The technique employs a DE optimisation algorithm to iteratively identify the parameters of the model by minimising the sum of square errors between predicted and experimental voltage. This technique was used to first estimate the full set of P2D model parameters matching a 3.03 Ah LiC6/NCA battery, which was subsequently validated using a drive cycle. The maximum discrepancy between measured and estimated voltage during the validation drive cycle was found to be less than 0.02 V. Hence, this set of parameters formed the “refined parameter” set which was the basis of the ageing study.
After identifying a set of “refined parameters” corresponding to a new cell, subsequent parameter fittings are made on aged cells to track the evolution of parameter values as the cell is progressively aged. As an example, the degradation of a 3.03Ah LiC6/NCA battery stored at 45 °C at 50% SoC for 476 days is studied. This particular ageing mode was chosen because the resulting growth of the SEI is well studied and therefore provided a method of validating the results. Adopting the systematic approach presented for reducing the number of parameters required to be identified, c s , max , Rfilm and Ceff as a function of calendar age were traced. These parameters were found to evolve, under the ageing conditions considered, in agreement with trends identified in the literature. While the example presented in this paper, for purposes of validation, considered calendar ageing for a unique temperature only, the techniques presented are applicable to a wider range of ageing stress factors and degradation mechanism that fall within the scope of the P2D model.
The procedure employed in this work allows for a set of parameter values for the P2D model to be identified quickly and non-invasively. Model compilation, initialisation and initial simulation take approximately ten minutes; subsequent runs for a single parameter set is considerably less than a second. Thus, to optimise c s , max , Rfilm and Ceff took less than 20 s—significantly quicker than the 63 s for a single run reported within previous studies.

Acknowledgments

The authors also thank MapleSoft engineers for support in debugging. This work drew on the MapleSim Battery Library. The research presented within this paper utilized is supported by MapleSoft Europe Ltd. as well as Innovate UK through the WMG centre High Value Manufacturing (HVM) Catapult in collaboration with Jaguar Land Rover.

Author Contributions

Kotub Uddin conceived the technique and wrote the majority of manuscript; Kotub Uddin and W. Dhammika Widanage developed the P2D model code under the guidance of Surak Perera; Surak Perera guided the development of the P2D model, and ran the optimization scripts; both W. Dhammika Widanage and Surak Perera also participated in in writing the manuscript; Limhi Somerville researched and produced the work shown in Figure 1, Figure 2, Figure 3, Figure 4, Figure 5, Figure 6 and Figure 7 and they were adjusted for modelling use by Kotub Uddin; James Marco guided and revised the manuscript.

Conflicts of Interest

The authors declare no conflict of interest.

Abbreviations

BMSBattery management system
NCALiNiCoAlO2
PHEVPlug-in hybrid electric vehicle
P2DPseudo two-dimensional
SEISolid electrolyte interphase
SoCState of charge
SPSingle particle
ΔSoCChange in state of charge

References

  1. Tarascon, J.-M.; Armand, M. Issues and challenges facing rechargeable lithium batteries. Nature 2001, 414, 359–367. [Google Scholar] [CrossRef] [PubMed]
  2. Smith, K.; Earleywine, M.; Wood, E.; Neubauer, J.; Pesaran, A. Comparison of Plug-In Hybrid Electric Vehicle Battery Life across Geographies and Drive Cycles. In Proceedings of the 2012 SAE World Congress and Exhibition, Detroit, MI, USA, 24–26 April 2012. [CrossRef]
  3. Uddin, K.; Picarelli, A.; Lyness, C.; Taylor, N.; Marco, J. An Acausal Li-Ion Battery Pack Model for Automotive Applications. Energies 2014, 7, 5675–5700. [Google Scholar] [CrossRef]
  4. Vetter, J.; Novák, P.; Wagner, M.R.; Veit, C.; Möller, K.C.; Besenhard, J.O.; Winter, M.; Wohlfahrt-Mehrens, M.; Vogler, C.; Hammouche, A. Ageing mechanisms in lithium-ion batteries. J. Power Sources 2005, 147, 269–281. [Google Scholar] [CrossRef]
  5. Barré, A.; Deguilhem, B.; Grolleau, S.; Gérard, M.; Suard, F.; Riu, D. A review on lithium-ion battery ageing mechanisms and estimations for automotive applications. J. Power Sources 2013, 241, 680–689. [Google Scholar] [CrossRef]
  6. Serrao, L.; Onori, S.; Sciarretta, A.; Guezennec, Y.; Rizzoni, G. Optimal Energy Management of Hybrid Electric Vehicles Including Battery Aging. In Proceedings of the 2011 American Control Conference (ACC), San Francisco, CA, USA, 29 June–1 July 2011; pp. 2125–2130.
  7. Moura, S.J.; Callaway, D.S.; Fathy, H.K.; Stein, J.L. Impact of Battery Sizing on Stochastic Optimal Power Management in Plug-In Hybrid Electric Vehicles. In Proceedings of the 2008 IEEE International Conference Vehicular Electronics and Safety, Columbus, OH, USA, 22–24 September 2008; pp. 96–102.
  8. Taylor, J.; Ball, R.; Mcgordon, A.; Marco, J. Sizing Tool for Rapid Optimisation of Pack Configuration at Early-Stage Automotive Product Development. In Proceedings of the EVS28 International Electric Vehicle Symposium and Exhibition, Goyang, Korea, 3–6 May 2015; pp. 1–8.
  9. Li, Y.; Tan, B.; Wu, Y. Mesoporous Co3O4 Nanowire Arrays for Lithium Ion Batteries with High Capacity and Rate Capability. Nano Lett. 2008, 8, 265–270. [Google Scholar] [CrossRef] [PubMed]
  10. Waag, W.; Käbitz, S.; Sauer, D.U. Experimental investigation of the lithium-ion battery impedance characteristic at various conditions and aging states and its influence on the application. Appl. Energy 2013, 102, 885–897. [Google Scholar] [CrossRef]
  11. Uddin, K.; Perera, S.; Widanage, W.D.; Marco, J. Characterising Li-Ion Battery Degradation through the Identification of Perturbations in Electrochemical Battery Models. In Proceedings of the EVS28 International Electric Vehicle Symposium and Exhibition, Goyang, Korea, 3–6 May 2015; pp. 1–9.
  12. Doyle, M.; Fuller, T.F.; Newman, J. Modeling of galvanostatic charge and discharge of the lithium/polymer/insertion cell. J. Electrochem. Soc. 1993, 140, 1526–1533. [Google Scholar] [CrossRef]
  13. Schmidt, A.P.; Bitzer, M.; Imre, Á.W.; Guzzella, L. Experiment-driven electrochemical modeling and systematic parameterization for a lithium-ion battery cell. J. Power Sources 2010, 195, 5071–5080. [Google Scholar] [CrossRef]
  14. Santhanagopalan, S.; Guo, Q.; White, R.E. Parameter estimation and model discrimination for a lithium-ion cell. J. Electrochem. Soc. 2007, 154, A198–A206. [Google Scholar] [CrossRef]
  15. Forman, J.C.; Moura, S.J.; Stein, J.L.; Fathy, H.K. Genetic identification and fisher identifiability analysis of the Doyle–Fuller–Newman model from experimental cycling of a LiFePO4 cell. J. Power Sources 2012, 210, 263–275. [Google Scholar] [CrossRef]
  16. Zhang, L.; Wang, L.; Lyu, C.; Li, J.; Zheng, J. Non-destructive analysis of degradation mechanisms in cycle-aged graphite/LiCoO2 batteries. Energies 2014, 7, 6282–6305. [Google Scholar] [CrossRef]
  17. Narayanrao, R.; Joglekar, M.M.; Inguva, S. A phenomenological degradation model for cyclic aging of lithium ion cell materials. J. Electrochem. Soc. 2012, 160, A125–A137. [Google Scholar] [CrossRef]
  18. Santhanagopalan, S.; Guo, Q.; Ramadass, P.; White, R.E. Review of models for predicting the cycling performance of lithium ion batteries. J. Power Sources 2006, 156, 620–628. [Google Scholar] [CrossRef]
  19. Dao, T.S.; Vyasarayani, C.P.; McPhee, J. Simplification and order reduction of lithium-ion battery model based on porous-electrode theory. J. Power Sources 2012, 198, 329–337. [Google Scholar] [CrossRef]
  20. Smith, K.; Wang, C.-Y. Solid-state diffusion limitations on pulse operation of a lithium ion cell for hybrid electric vehicles. J. Power Sources 2006, 161, 628–639. [Google Scholar] [CrossRef]
  21. Ye, Y.; Shi, Y.; Cai, N.; Lee, J.; He, X. Electro-thermal modeling and experimental validation for lithium ion battery. J. Power Sources 2012, 199, 227–238. [Google Scholar] [CrossRef]
  22. Doyle, M.; Newman, J.; Gozdz, A.S.; Schmutz, C.N.; Tarascon, J.-M. Comparison of modeling predictions with experimental data from plastic lithium ion cells. J. Electrochem. Soc. 1996, 143, 1890–1903. [Google Scholar] [CrossRef]
  23. Fleckenstein, M.; Bohlen, O.; Roscher, M.A.; Bäker, B. Current density and state of charge inhomogeneities in Li-ion battery cells with LiFePO4 as cathode material due to temperature gradients. J. Power Sources 2011, 196, 4769–4778. [Google Scholar] [CrossRef]
  24. Fu, R.; Xiao, M.; Choe, S.-Y. Modeling, validation and analysis of mechanical stress generation and dimension changes of a pouch type high power Li-ion battery. J. Power Sources 2013, 224, 211–224. [Google Scholar] [CrossRef]
  25. Wang, J.; Liu, P.; Hicks-Garner, J.; Sherman, E.; Soukiazian, S.; Verbrugge, M.; Tataria, H.; Musser, J.; Finamore, P. Cycle-life model for graphite-LiFePO4 cells. J. Power Sources 2011, 196, 3942–3948. [Google Scholar] [CrossRef]
  26. Savoye, F.; Venet, P.; Millet, M.; Groot, J. Impact of periodic current pulses on Li-ion battery performance. IEEE Trans. Ind. Electron. 2012, 59, 3481–3488. [Google Scholar] [CrossRef]
  27. Abraham, D.; Liu, J.; Chen, C.; Hyung, Y.; Stoll, M.; Elsen, N.; MacLaren, S.; Twesten, R.; Haasch, R.; Sammann, E.; et al. Diagnosis of power fade mechanisms in high-power lithium-ion cells. J. Power Sources 2003, 119–121, 511–516. [Google Scholar] [CrossRef]
  28. Broussely, M.; Herreyre, S.; Biensan, P.; Kasztejna, P.; Nechev, K.; Staniewicz, R. Aging mechanism in Li ion cells and calendar life predictions. J. Power Sources 2001, 97–98, 13–21. [Google Scholar] [CrossRef]
  29. Liao, L.; Zuo, P.; Ma, Y.; Chen, X.; An, Y.; Gao, Y.; Yin, G. Effects of temperature on charge/discharge behaviors of LiFePO4 cathode for Li-ion batteries. Electrochim. Acta 2012, 60, 269–273. [Google Scholar] [CrossRef]
  30. Gabrisch, H.; Wilcox, J.; Doeff, M.M. TEM study of fracturing in spherical and plate-like LiFePO4 particles. Electrochem. Solid State Lett. 2008, 11, A25–A29. [Google Scholar] [CrossRef]
  31. Chen, G.; Song, X.; Richardson, T.J. Electron microscopy study of the LiFePO4 to FePO4 phase transition. Electrochem. Solid State Lett. 2006, 9, A295–A298. [Google Scholar] [CrossRef]
  32. Aurbach, D. A short review of failure mechanisms of lithium metal and lithiated graphite anodes in liquid electrolyte solutions. Solid State Ion. 2002, 148, 405–416. [Google Scholar] [CrossRef]
  33. Woodford, W.H.; Chiang, Y.-M.; Carter, W.C. “Electrochemical Shock” of Intercalation Electrodes: A Fracture Mechanics Analysis. J. Electrochem. Soc. 2010, 157, A1052–A1059. [Google Scholar] [CrossRef]
  34. Huang, H.-Y.S.; Wang, Y.-X. Dislocation based stress developments in lithium-ion batteries. J. Electrochem. Soc. 2012, 159, A815–A821. [Google Scholar] [CrossRef]
  35. Bourlot, S.; Blanchard, P.; Robert, S. Investigation of aging mechanisms of high power Li-ion cells used for hybrid electric vehicles. J. Power Sources 2011, 196, 6841–6846. [Google Scholar] [CrossRef]
  36. Himmelblau, D.M. Applied Nonlinear Programming; McGraw-Hill Companies: New York, NY, USA, 1972. [Google Scholar]
  37. Chakraborty, U.K. Advances in Differential Evolution; Springer: Berlin/Heidelberg, Germany, 2008. [Google Scholar] [CrossRef]
  38. Storn, R.; Price, K. Differential evolution—A simple and efficient heuristic for global optimization over continuous spaces. J. Glob. Optim. 1997, 11, 341–359. [Google Scholar] [CrossRef]
  39. Storn, R. On the Usage of Differential Evolution for Function Optimization. In Proceedings of the North American Fuzzy Information Processing Society, Berkeley, CA, USA, 19–22 June 1996; IEEE: New York, NY, USA; pp. 519–523.
  40. Doyle, M.; Fuentes, Y. Computer Simulations of a Lithium-Ion Polymer Battery and Implications for Higher Capacity Next-Generation Battery Designs. J. Electrochem. Soc. 2003, 150, A706–A713. [Google Scholar] [CrossRef]
  41. Pinson, M.; Bazant, M. Theory of SEI formation in rechargeable batteries: Capacity fade, accelerated aging and lifetime prediction. J. Electrochem. Soc. 2013, 160, A243–A250. [Google Scholar] [CrossRef]
  42. Ploehn, H.J.; Ramadass, P.; White, R.E. Solvent diffusion model for aging of lithium-ion battery cells. J. Electrochem. Soc. 2004, 151, A456–A462. [Google Scholar] [CrossRef]
Figure 1. Flow chart showing the expected battery degradation caused by elevated temperatures.
Batteries 02 00013 g001
Figure 2. Chart showing the effects of cold temperature when cycling.
Batteries 02 00013 g002
Figure 3. Chart representing degradation attributed to large cycling currents.
Batteries 02 00013 g003
Figure 4. Chart showing the effect of storage at low SoC.
Batteries 02 00013 g004
Figure 5. The effect of high SoC storage. Dashed lines indicate that the correspondence is secondary to temperature.
Batteries 02 00013 g005
Figure 6. Chart depicting the degradation associated with large swings in SoC.
Batteries 02 00013 g006
Figure 7. A depiction of the effects of large cycle number.
Batteries 02 00013 g007
Figure 8. Flowchart summarising the optimisation procedure.
Batteries 02 00013 g008
Figure 9. Comparison of the experimental and modelled drive cycle voltage response with the non-aged 3.03 Ah NCA refined battery parameters in Table 2.
Batteries 02 00013 g009
Figure 10. Trace of the estimated parameters with calendar ageing at 45 °C 50% SoC. (a) Changes in maximum lithium concentration of negative electrode ( c s , max ) as a function of calendar age; (b) change in film resistance (Rfilm) as a function of calendar age, obtained via optimised thickness of the SEI layer s; and (c) reduction of effective capacity (Ceff) as a function of calendar age.
Batteries 02 00013 g010
Figure 11. Model extracted vs. experimentally measured C/10 capacity fade.
Batteries 02 00013 g011
Figure 12. Power fade as a function of time.
Batteries 02 00013 g012
Table 1. A summary of the governing equations for the pseudo two-dimensional (P2D) model.
Relation/DomainGoverning EquationsBoundary Conditions
Conservation of chargeElectrolyte phase · ( κ e eff ϕ e ) + · [ κ e , D eff  ln ( c e ) ] = a s j   ϕ e x | x = 0 = ϕ e x | x = L = 0
Solid Phase · ( σ s eff ϕ s ) = a s j ϕ s x | x = L ns =   ϕ s x | x = L ps + = 0 , σ s , n eff ϕ s x | x = 0 = I S n = σ s , p eff ϕ s x | x = L = I A = i ( t )
Conservation of lithiumElectrolyte phase ( ε e c e ) t = · ( D e eff c e ) + 1 t + 0 F a s j c e x | x = 0 =   c e x | x = L = 0
Solid Phase ( ε s c s ) t = D s r 2 r ( r 2 c s r ) c s r | r = 0 = 0 , c s r | r = R s = j a s F
KineticsElectrochemical reaction rate j = k e ( c e ) α a ( c s max c s , e ) α a ( c s , e ) α c { exp [ α a F R T ( η R film a s j ) ] exp [ α c F R T ( η R film a s j ) ] }
Overpotential η = ϕ s ϕ e U
Table 2. In cases where measured or modelled values for generic LiNiCoAlO2 (NCA) 18650 cells were unavailable initial values were taken from the literature with validated parameter sets; these values were considered to be generic for all batteries of any format or chemistry. Parameters taken from references [14] (), [20] (*) and [21] ()—work with some level of parameter validation—are indicated by corresponding symbols. Refined parameters relate to the non-aged 3.03 Ah NCA 18650 cell studied in this work. SoC: state of charge; and SEI: solid electrolyte interphase.
ParameterSymbolInitialRefinedDifference (%)
Thickness of negative electrodeL (10−4 cm)149.9153.12.1
Thickness of positive electrodeL+ (10−4 cm)134.0129.8−3.2
Thickness of separatorLsep (10−4 cm)25.027.59.1
Surface area of negative electrode,A (cm2)428.4437.52.1
Surface area of positive electrodeA+ (cm2)389.61377.4−3.2
Surface area of separatorAsep (cm2)448.35493.29.1
Modal radius of negative electrode particleRs,− (10−4 cm)10.710.91.8
Modal radius of positive electrode particleRs,+ (10−4 cm)5.77.927.8
Active material volume fraction of negative electrodeεs,−0.30.313.2
Active material volume fraction of positive electrodeεs,+0.30.4938.8
Electrolyte phase volume fraction of negative electrodeεe,−0.5950.5950.0
Electrolyte phase volume fraction of positive electrodeεe,+0.630.630.0
Volume fraction of separator in liquid phaseεe,sep0.50.45−11.1
Volume fraction of inactive material in negative electrodeεf,−0.1050.04−162.5
Volume fraction of inactive material in positive electrodeεf,+0.070.9992.9
Maximum li-concentration in negative electrode c s , max (10−3 mol·cm−3)30.6 30.60.0
Maximum li-concentration in positive electrode c s , + max (10−3 mol·cm−3)51.6 51.0−1.2
Average electrolyte concentrationce,0 (10−3 mol·cm−3)1.2 *1.04−15.4
Stoichiometry of negative electrode at 0% SoCx,00.126 *0.1260.0
Stoichiometry of positive electrode at 0% SoCx+,00.936 *0.9360.0
Stoichiometry of negative electrode at 100% SoCx,1000.676 *0.6760.0
Stoichiometry of positive electrode at 100% SoCx+,1000.442 *0.4420.0
Diffusion coefficient of negative electrode in solid phaseDs,− (10−12 cm2·s−1)1.141.140.0
Diffusion coefficient of positive electrode in solid phaseDs,+ (10−12 cm2·s−1)3.7 *3.70.0
Diffusion coefficient in liquid phaseDe (10−6 cm2·s−1)2.6 *2.60.0
Conductivity of negative electrode in solid phaseσs,− (S·cm−1)1.0 *10.0
Conductivity of positive electrode in solid phaseσs,+ (S·cm−1)1.0 10.0
Charge transfer coefficient in negative electrodeke,− (10−6 cm2.5·mol−0.5·s−1)5.035.030.0
Charge transfer coefficient in positive electrodeke,+ (10−6 cm2.5·mol−0.5·s−1)2.332.330.0
Anodic charge transfer coefficientαa0.50.50.0
Cathodic charge transfer coefficientαc0.50.50.0
Li transference number t + 0 0.360.360.0
Electrolyte activity coefficient f ± 1.010.0
Bruggeman porosity exponentp1.51.50.0
Resistivity of film layers (including SEI)-0.10.001−990
Resistivity of the current collectorRf (Ω·cm2)2010−100
Negative electrode potential, U coefficients b 1 b 11 ---
Positive electrode potential, U + , coefficients b 1 + b 10 + ---

