2.1. Metal Hydride Alloy in Negative Electrode
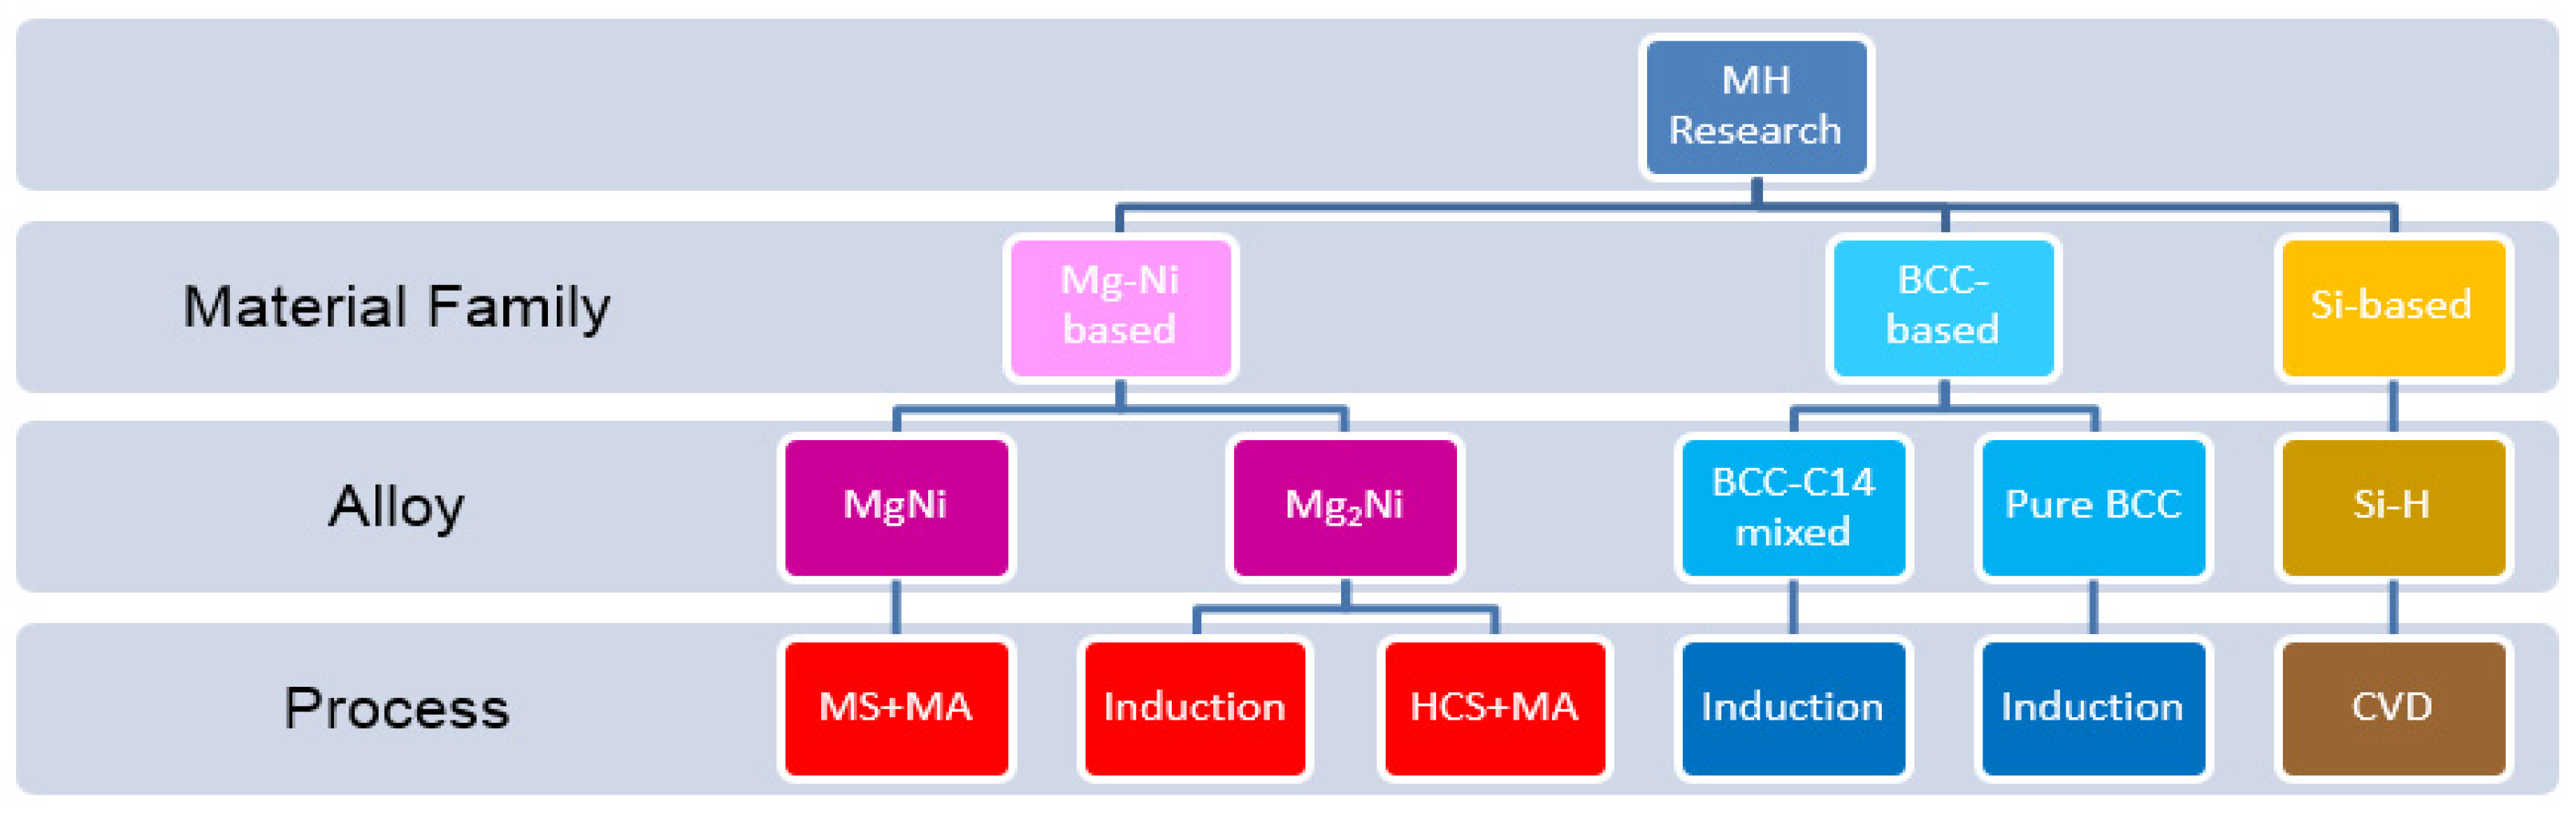
In the development of negative electrode (anode), five MH systems, MgNi, Mg
2Ni, BCC-C14, pure BCC, and Si, were investigated according to the original plan (
Figure 3). Results of capacities are summarized in
Table 1. MgNi (AR3: Mg
52Ni
39Co
3Mn
6) prepared by a melt-spinning and mechanical alloying (MA) process showed a good low-rate capacity but failed when the discharge current increased to 100 mA·g
−1. We tried five crystalline Mg
2Ni alloys doped with Cr, Co, Mn, and Si and the electrochemical results were disappointing. The BCC-C14 alloys went through a sequence of composition refinements [
7,
8,
9,
10,
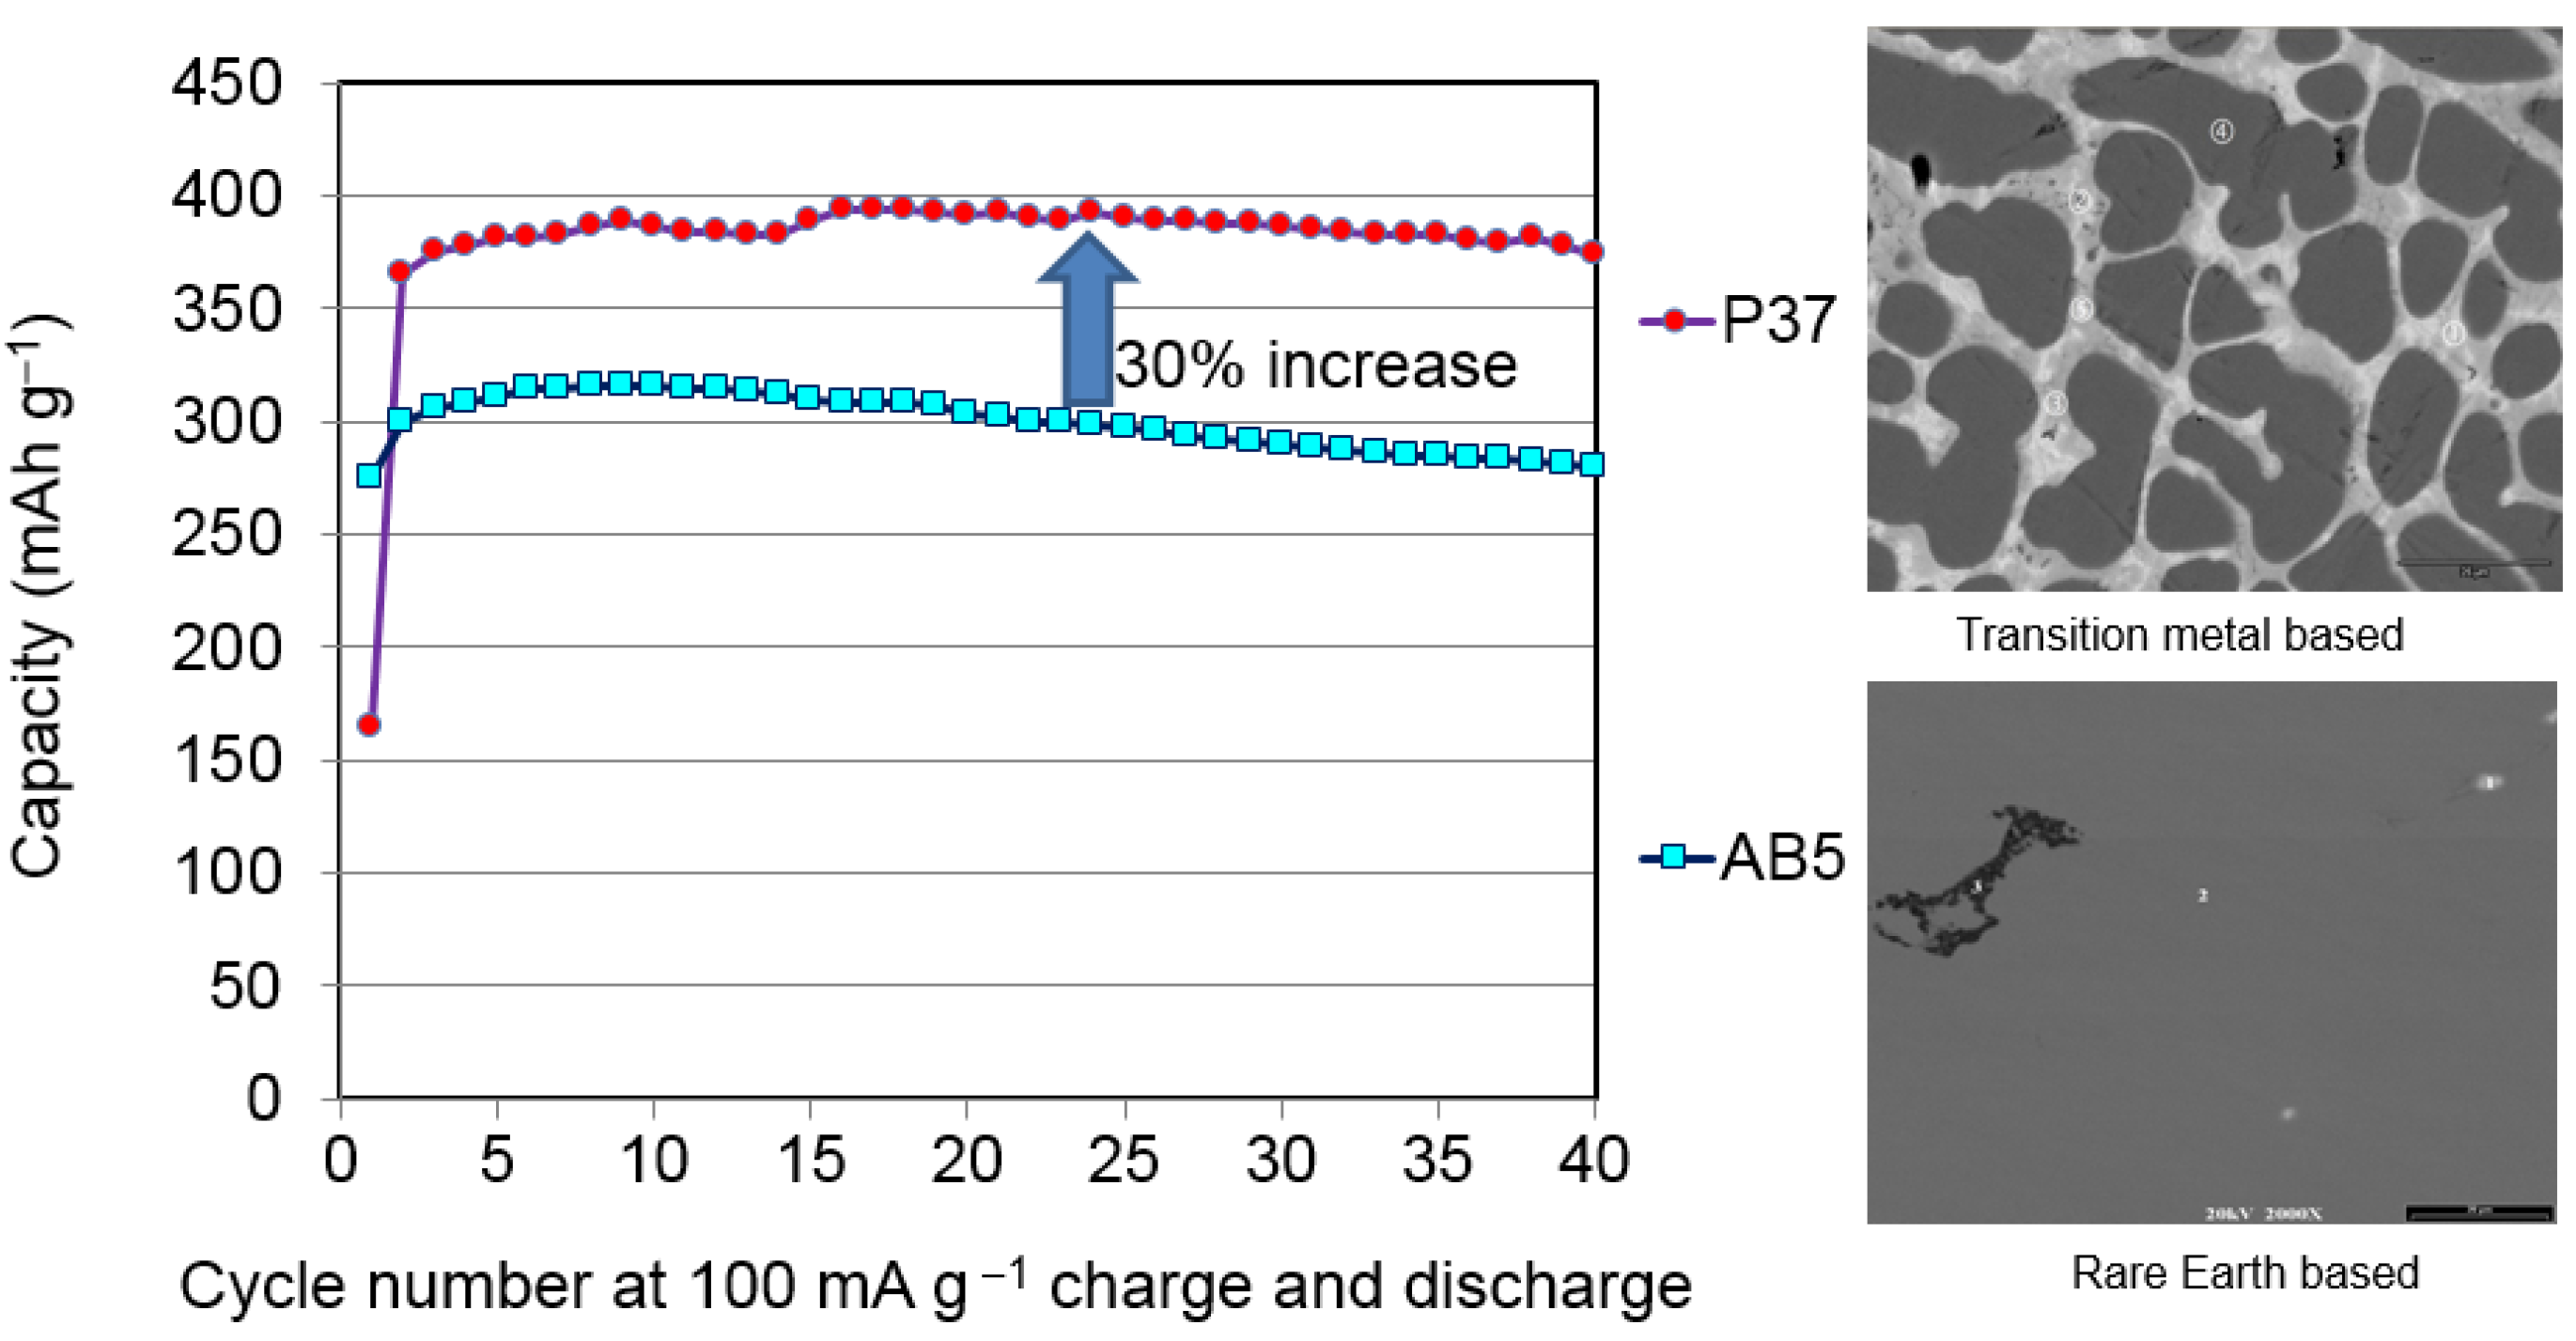
11] and the final champion, P37 with a composition of Ti
14.5Zr
1.7V
46.6Cr
11.9Mn
6.5Co
1.5Ni
16.9Al
0.4, showed the highest capacity under a 100 mA·g
−1 discharge current, with a comparable cycle stability to AB
5 (
Figure 5).
Table 1.
Electrochemical discharge capacities (mAh·g−1) for MH alloys developed in the RANGE-BASF program. AR3: Mg52Ni39Co3Mn6.
Table 1.
Electrochemical discharge capacities (mAh·g−1) for MH alloys developed in the RANGE-BASF program. AR3: Mg52Ni39Co3Mn6.
| Alloy system | Alloy No. | Capacity @8 mA·g−1 | Capacity @100 mA·g−1 |
|---|
| MgNi | AR3 | 501 | 67 |
| Mg2Ni | Mg66Ni31Mn3 | 18 | 147 |
| BCC-C14 | P12 | 460 | 259 |
| BCC-C14 | P37 | 414 | 400 |
| Pure BCC | P08 | 408 | 340 |
| Si | CVD a-Si:H | >3635 | >3635 |
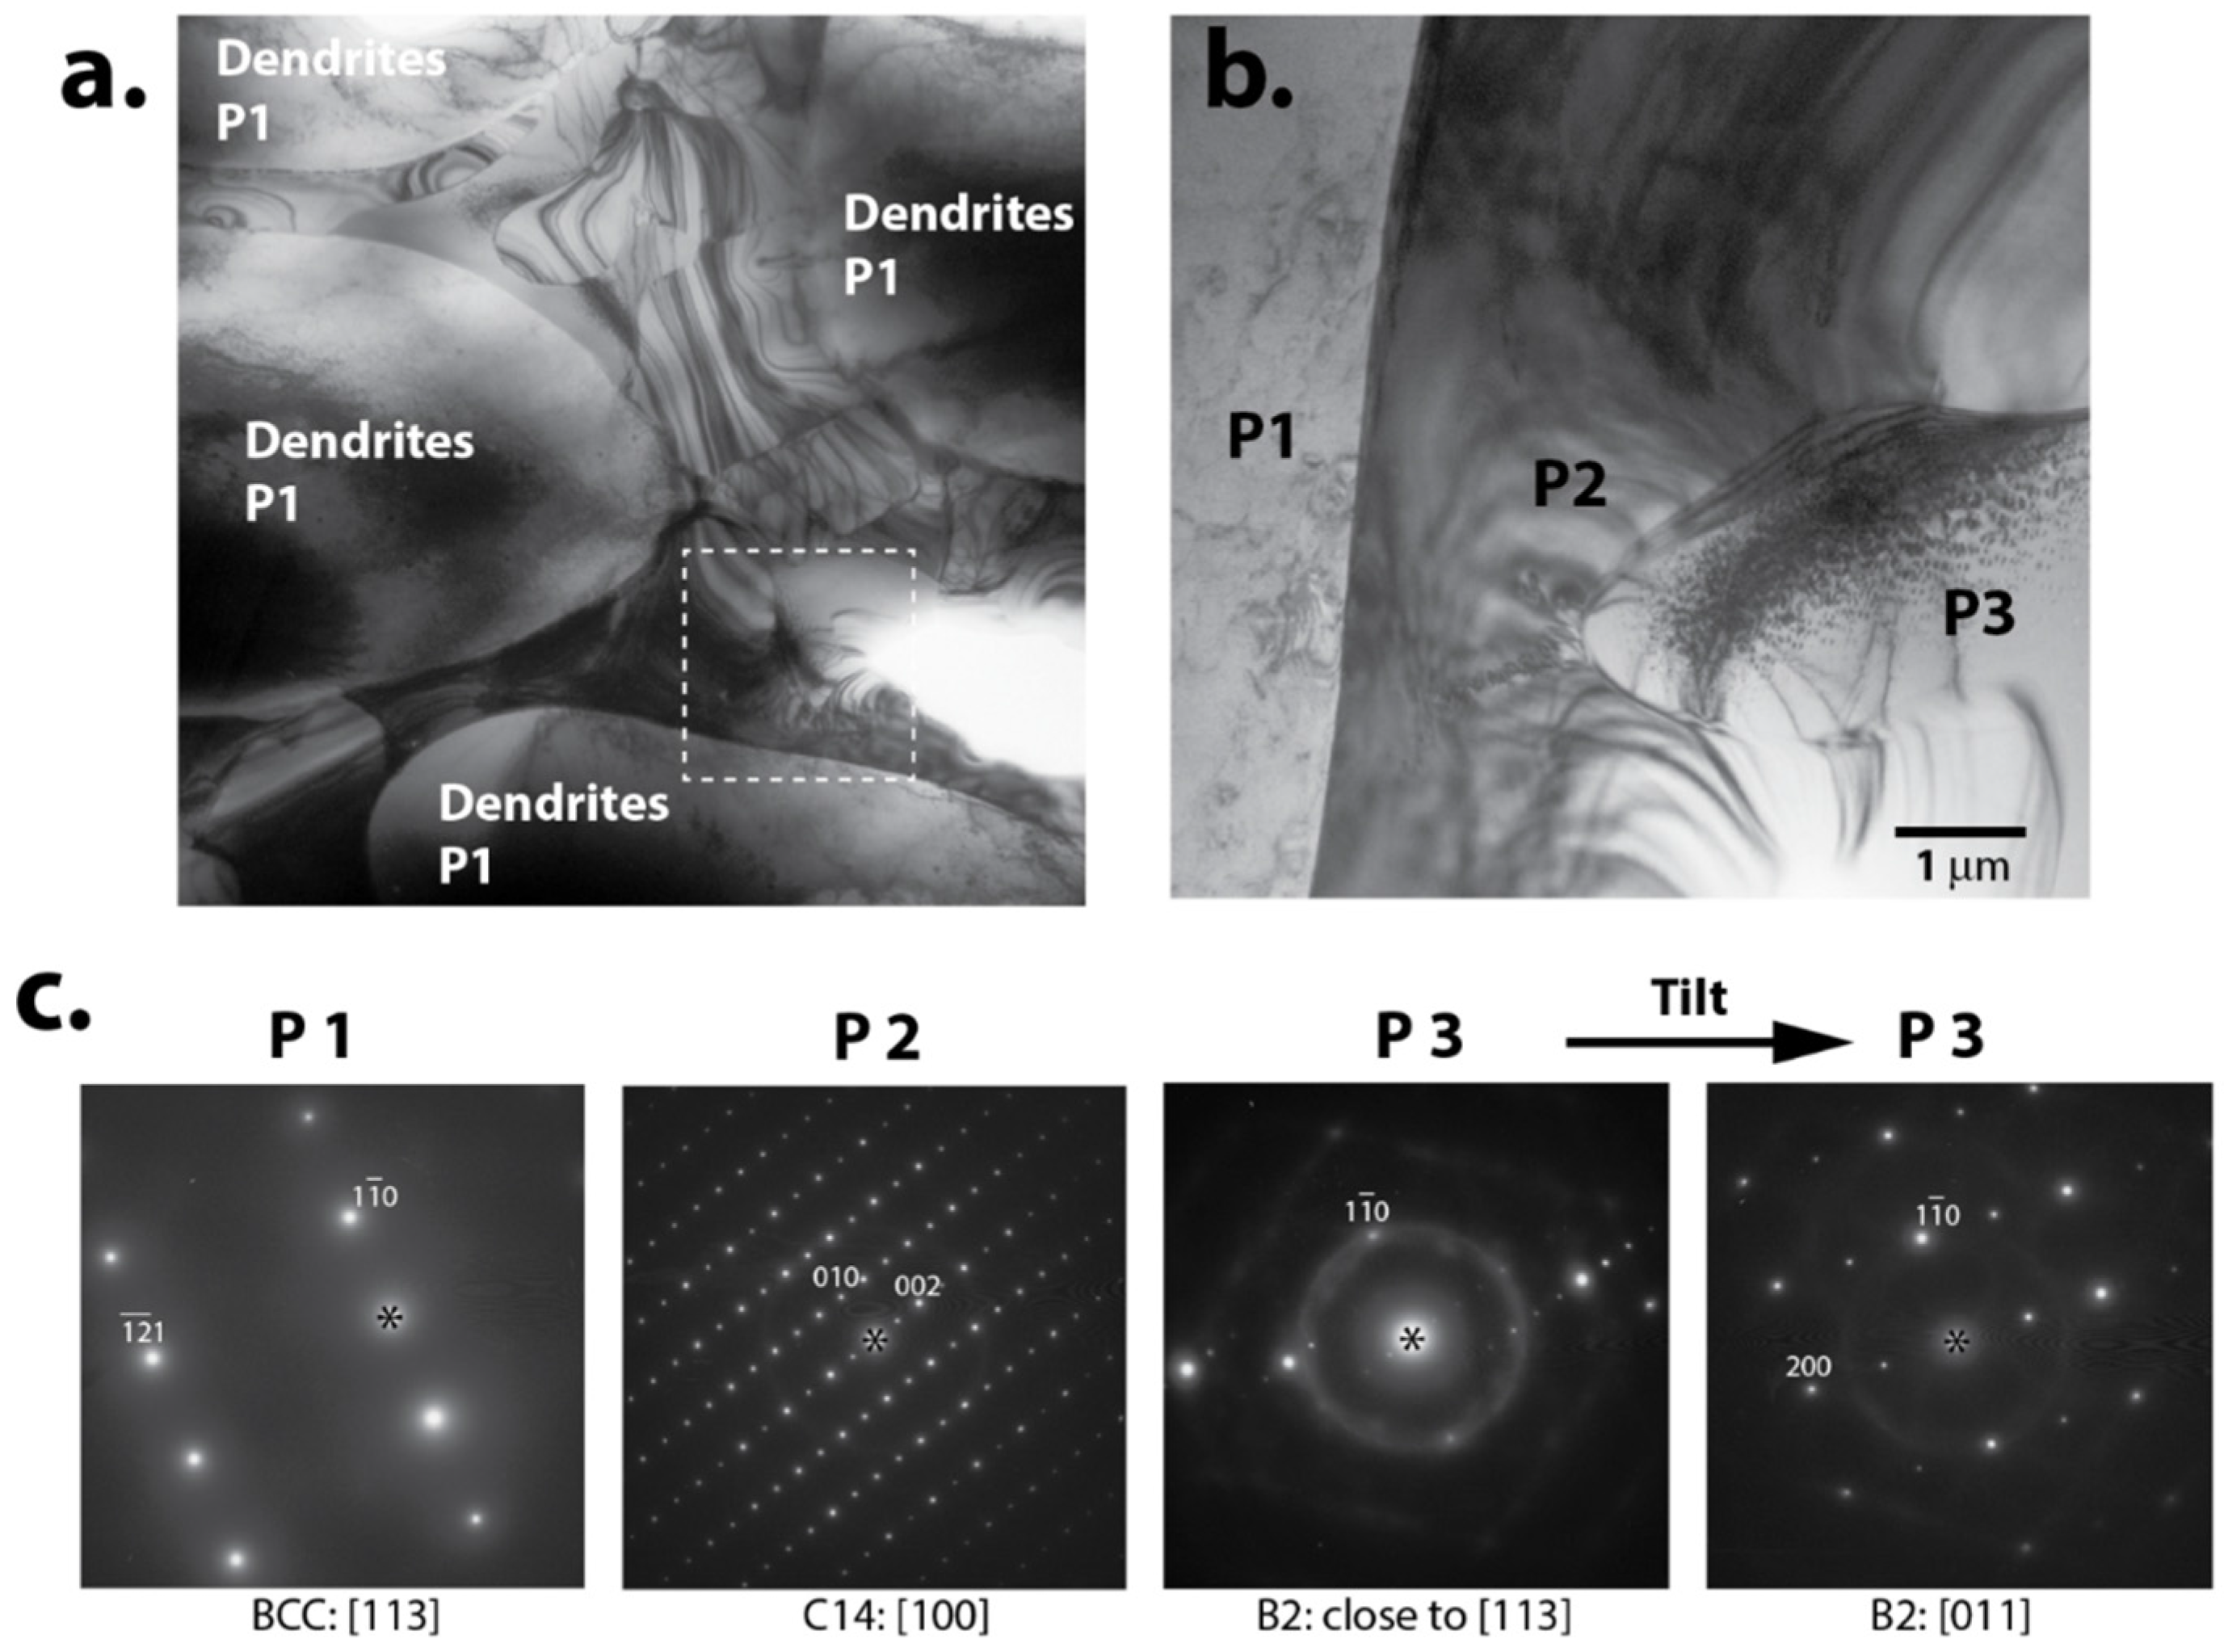
The transmission electron microscope (TEM) study on a complicated multi-phase BCC-C14 MH alloy (P7) shows clean boundaries between Laves C14, Ti
xNi
y (B2 structure) and BCC structures (
Figure 6). This clean phase boundary facilitates the hydrogen diffusion through the bulk of the alloy.
Figure 5.
(Left) Comparison of capacities between P37 (BCC-C14 mixed phased) and AB5 (conventional) MH alloys in the first 40 cycles; and scanning electron microscopy (SEM) micrographs of the (upper right) P37 and (lower right) AB5 corners.
Figure 5.
(Left) Comparison of capacities between P37 (BCC-C14 mixed phased) and AB5 (conventional) MH alloys in the first 40 cycles; and scanning electron microscopy (SEM) micrographs of the (upper right) P37 and (lower right) AB5 corners.
Figure 6.
Transmission electron microscope (TEM) study of BCC-C14 alloy (P7): (a) TEM micrograph showing dendrites of phase 1 (P1) and an interdenritic region consisting of two phases shown in enlargement (b) as P2 and P3; (c) selected area electron diffraction patterns from different phases in (b) show that P1 is disordered BCC, P2—Laves C14, and P3—ordered BCC (proved to be B2 after tilting to [011] zone axis.
The further electron backscattering diffraction (EBSD) study of the same sample reveals the crystallographic orientation dependences among various constituent phases (
Figure 7), which is more evidence that shows clean grain boundaries among various phases in the alloy.
In the pure BCC MH alloy, the electrochemical discharge capacities increased from 408 mAh·g
−1 [
12] to 639 mAh·g
−1 with optimizations in composition, process, and the electrolyte combination [
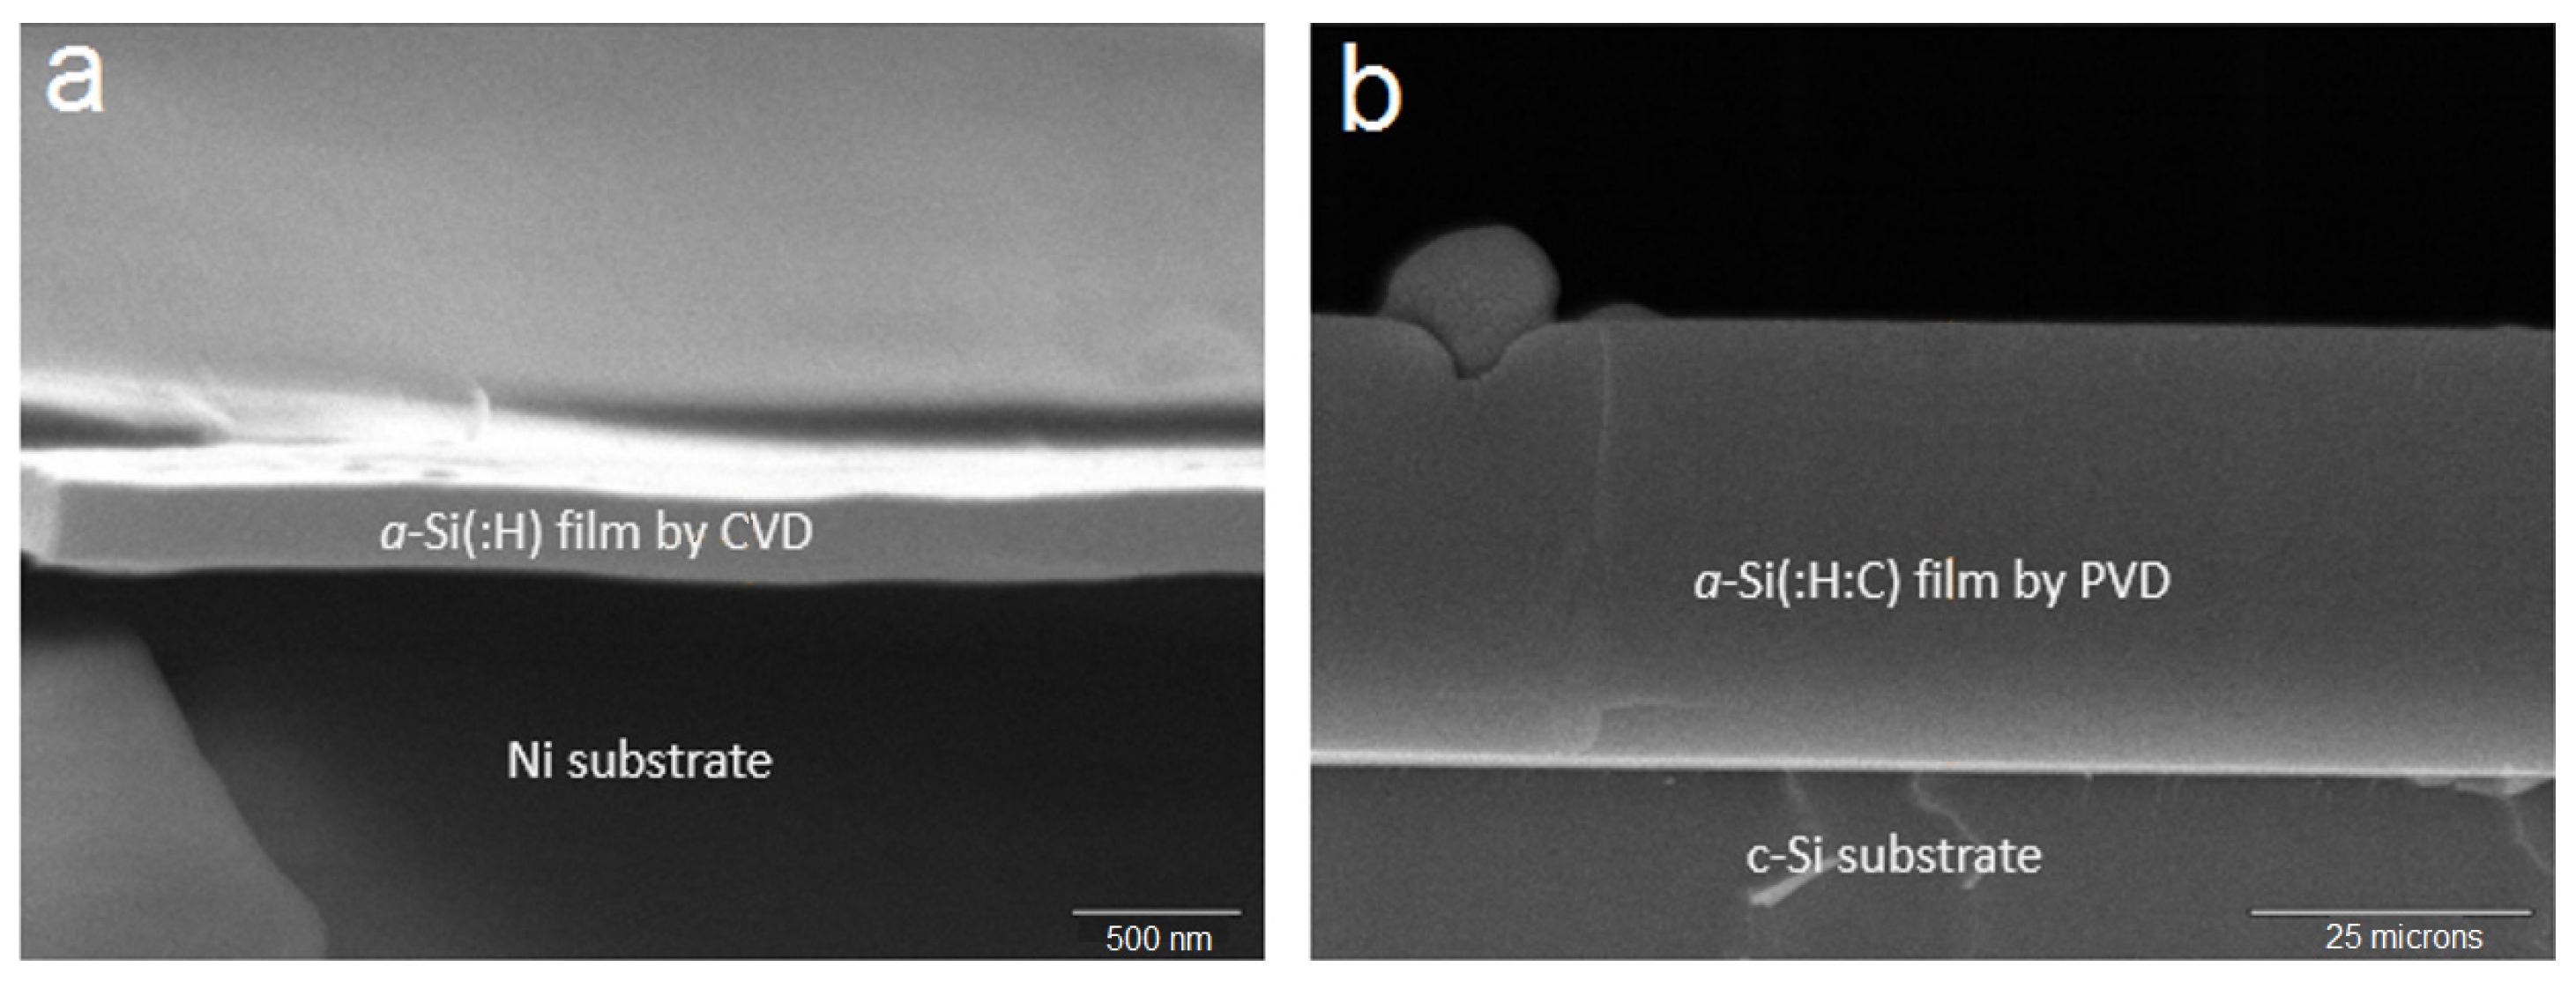
13]. Finally, the Si-based thin film work showed the highest capacity of 3635 mAh·g
−1 [
14]. Both chemical vapor deposition (CVD) and physical vapor deposition (PVD) were employed to grow amorphous Si thin-films on the substrate (
Figure 8). The high capacity and cycle stability of the Si-electrode can be seen in
Figure 9.
Besides those five MH systems in
Figure 3, we also studied other alternative negative electrode materials and received some unexpected results, such as 370-mAh·g
−1 discharge capacity from perovskite oxide and 55-mAh·g
−1 discharge capacity from an electrode containing NiCoMn(OH)
6.
Figure 7.
(
a–
c) Three BCC and (
d–
g) four C14 electron backscattering diffraction (EBSD) patterns collected from various grains on a typical BCC-C14 alloy (P7) with the computer generated matching orientation information. A few alignments in crystallographic orientation can be identified. For example, the <100>
BCC in
Figure 7c is aligned with the <0001>
C14 in both
Figure 7d,e.
Figure 8.
Cross-section SEM micrographs of (a) an a-Si:H thin film prepared by CVD and (b) an a-Si:H:C thin-film prepared by physical vapor deposition (PVD).
Figure 8.
Cross-section SEM micrographs of (a) an a-Si:H thin film prepared by CVD and (b) an a-Si:H:C thin-film prepared by physical vapor deposition (PVD).
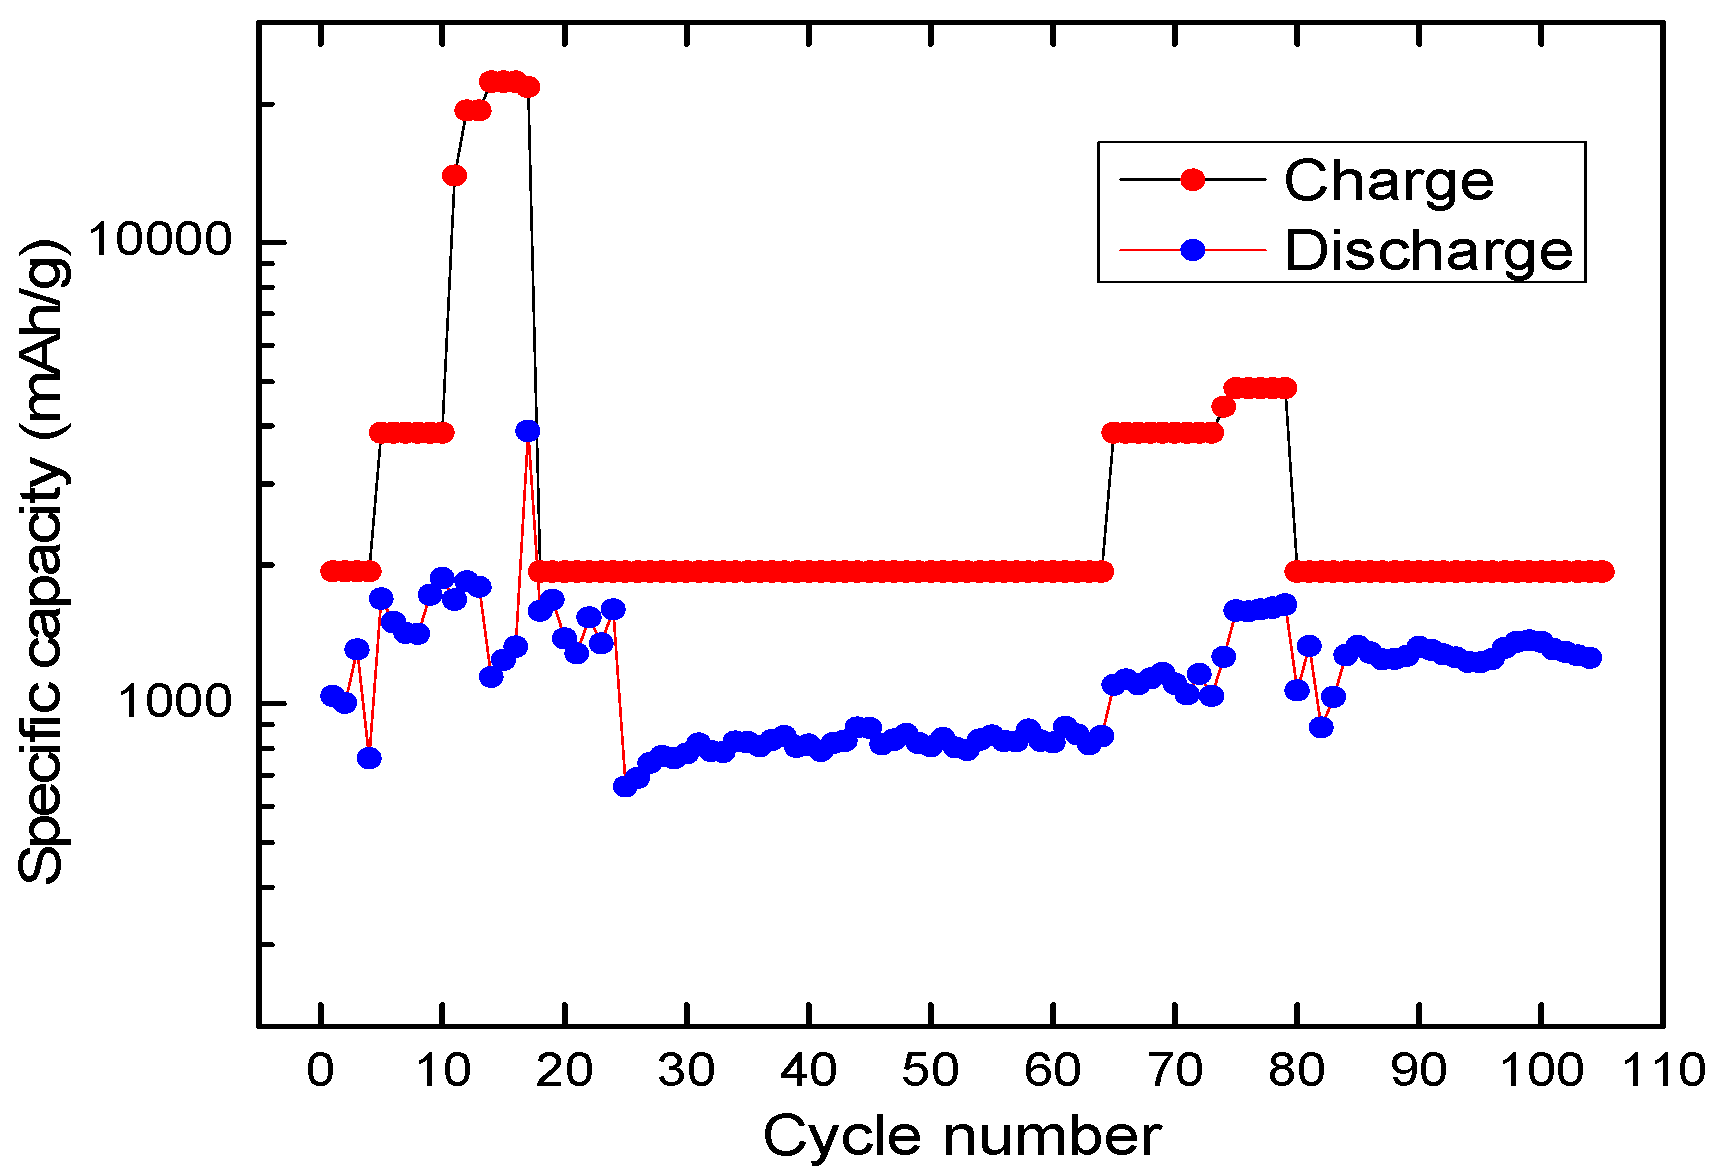
Figure 9.
Charge-in and charge-out as functions of cycle number for an a-Si:H thin-film electrode prepared by CVD.
Figure 9.
Charge-in and charge-out as functions of cycle number for an a-Si:H thin-film electrode prepared by CVD.
2.2. Development in Electrolyte
The electrolyte research in RANGE-BASF started from the modifications to the currently used 30 wt% KOH aqueous solution with different hydroxides and various salt additives to reduce the corrosion and then expanded to ionic liquid (IL) for the expansion of voltage window, which proved difficult with the current alkaline system. Three other directions highlighted in the original plan (
Figure 4) faced different challenges and only exhibited marginal improvement over the currently used electrolyte.
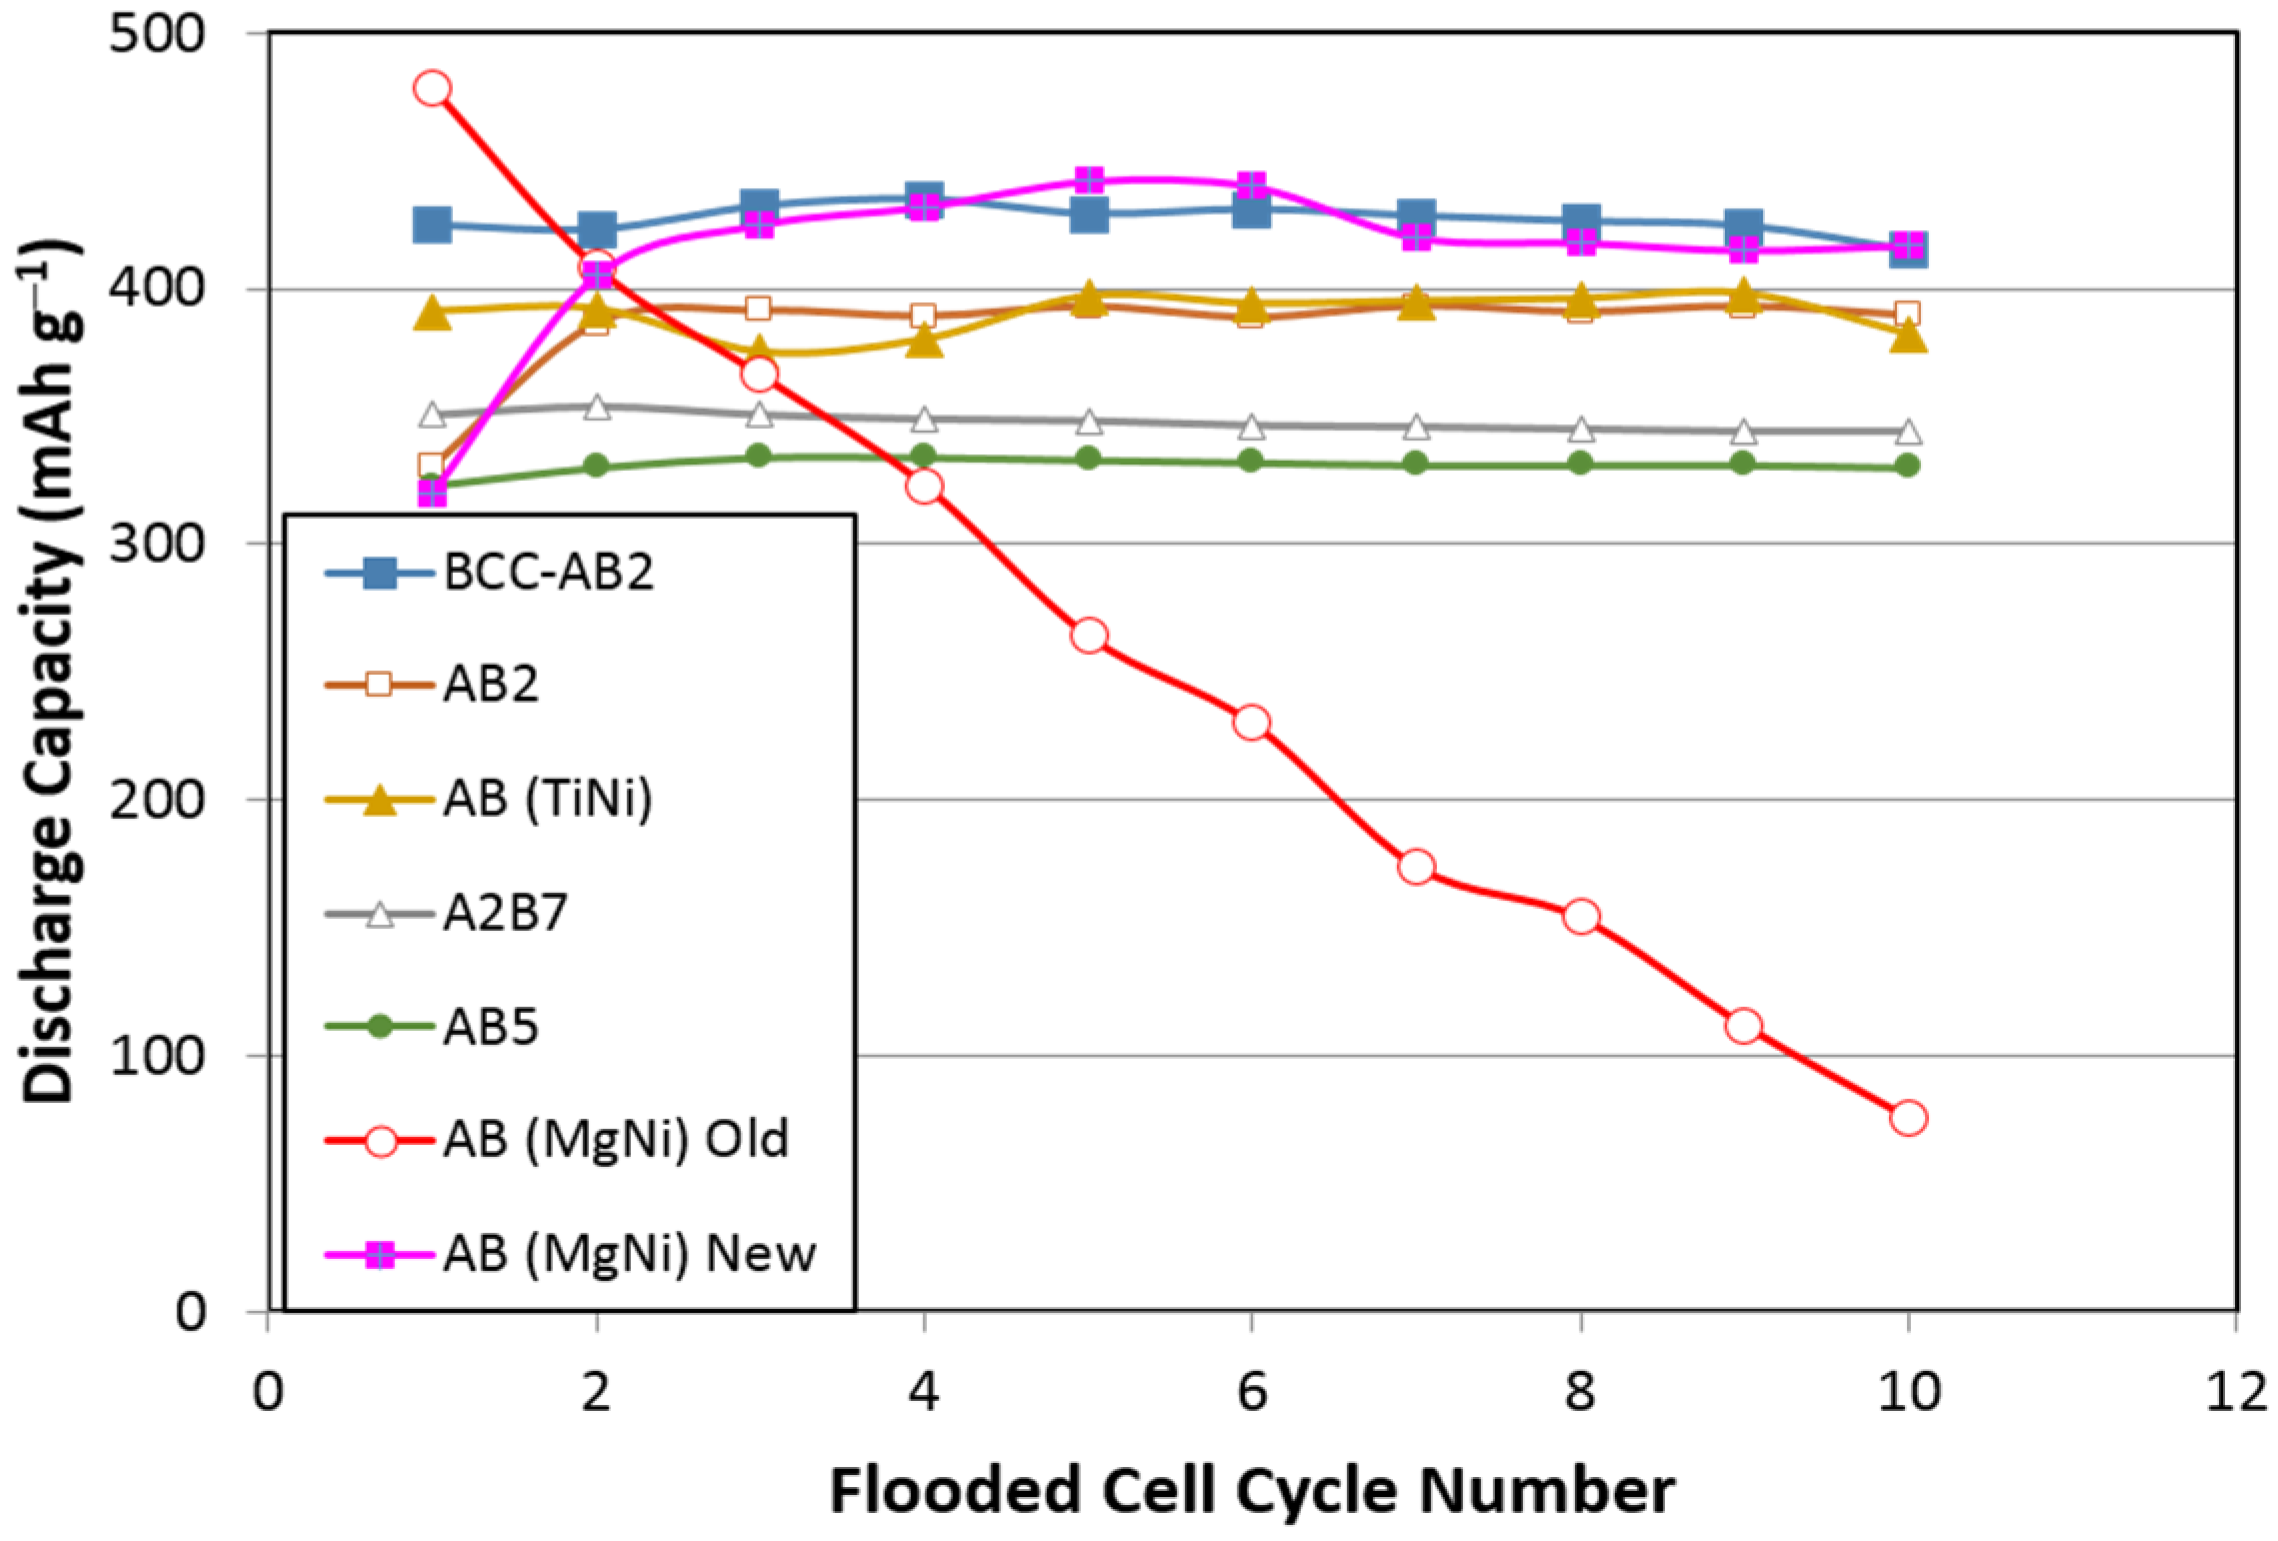
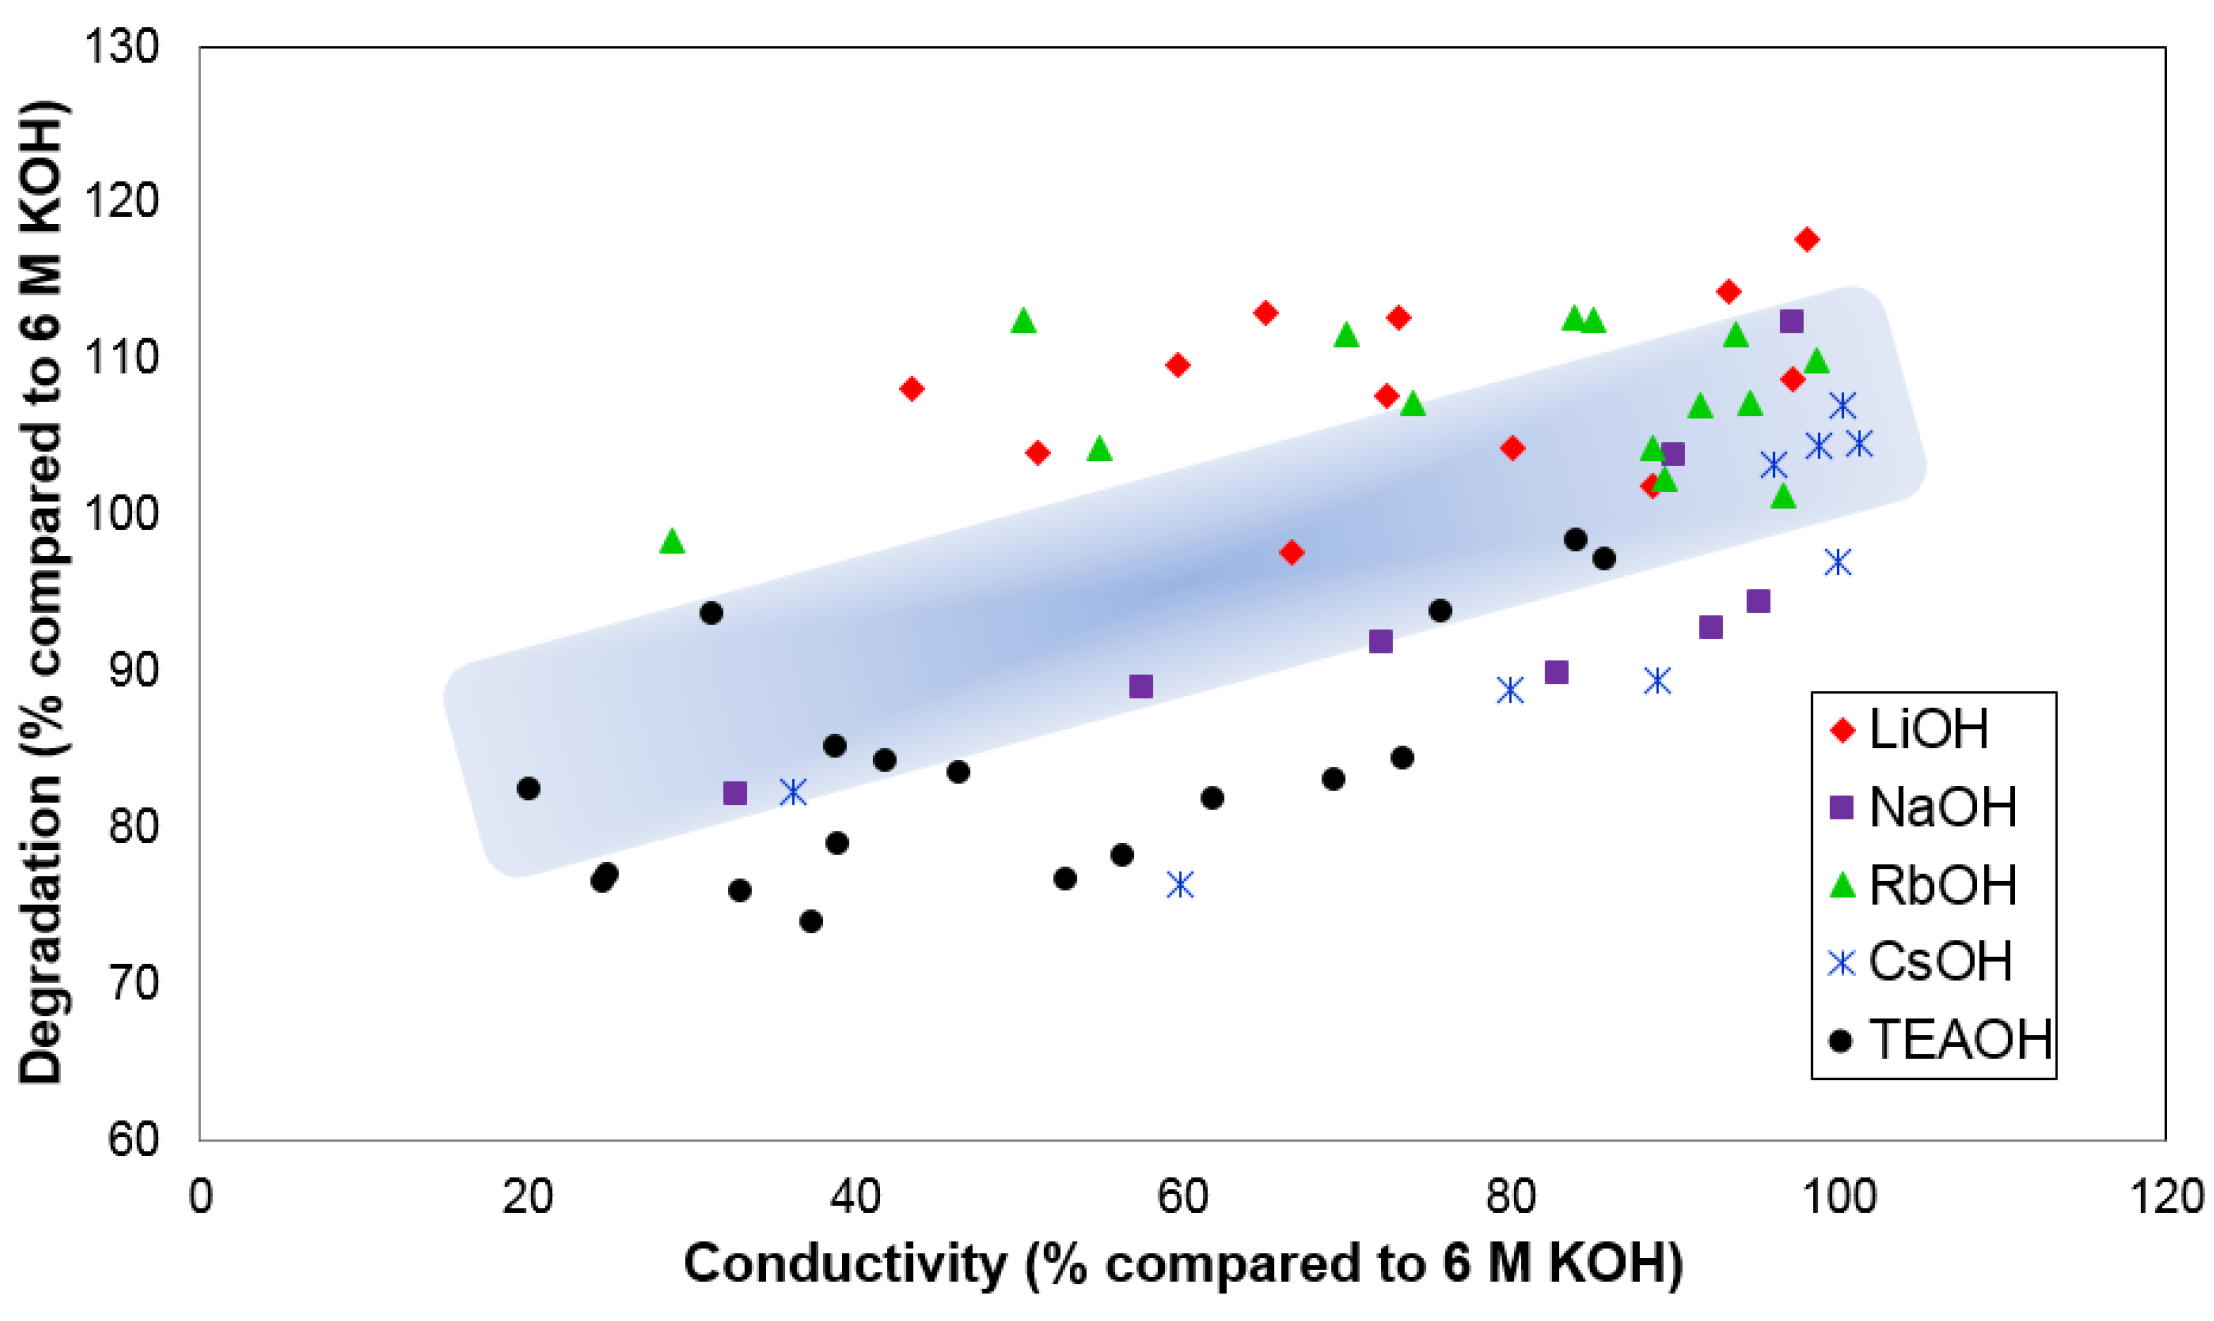
Results from different hydroxides can be summarized by plotting the degradation in the first 15 cycles (normalized to that observed in 30 wt% KOH) in the MgNi alloy
versus the conductivity in
Figure 10. In general, we found the corrosion capability in various hydroxides in this sequence: LiOH > RbOH > KOH > NaOH > CsOH > TEAOH (tetraethylammonium hydroxide) [
15]. The corrosion rate is closely related to the chemical activity of the hydroxide (as indicated by its oxidation potential, for example). TEAOH opens the window to other organic basic chemicals, which are currently under investigation. When a less corrosive electrolyte (1 M KOH + 1 M NaOH) was used, the cycle stability of MgNi alloy improved substantially as seen from
Figure 1 (pink curve).
Figure 10.
The degradation and conductivity of MgNi electrodes in various hydroxide as replacement for the 6 M KOH conventional electrolyte. The shaded area highlights the general trend of data points.
Figure 10.
The degradation and conductivity of MgNi electrodes in various hydroxide as replacement for the 6 M KOH conventional electrolyte. The shaded area highlights the general trend of data points.
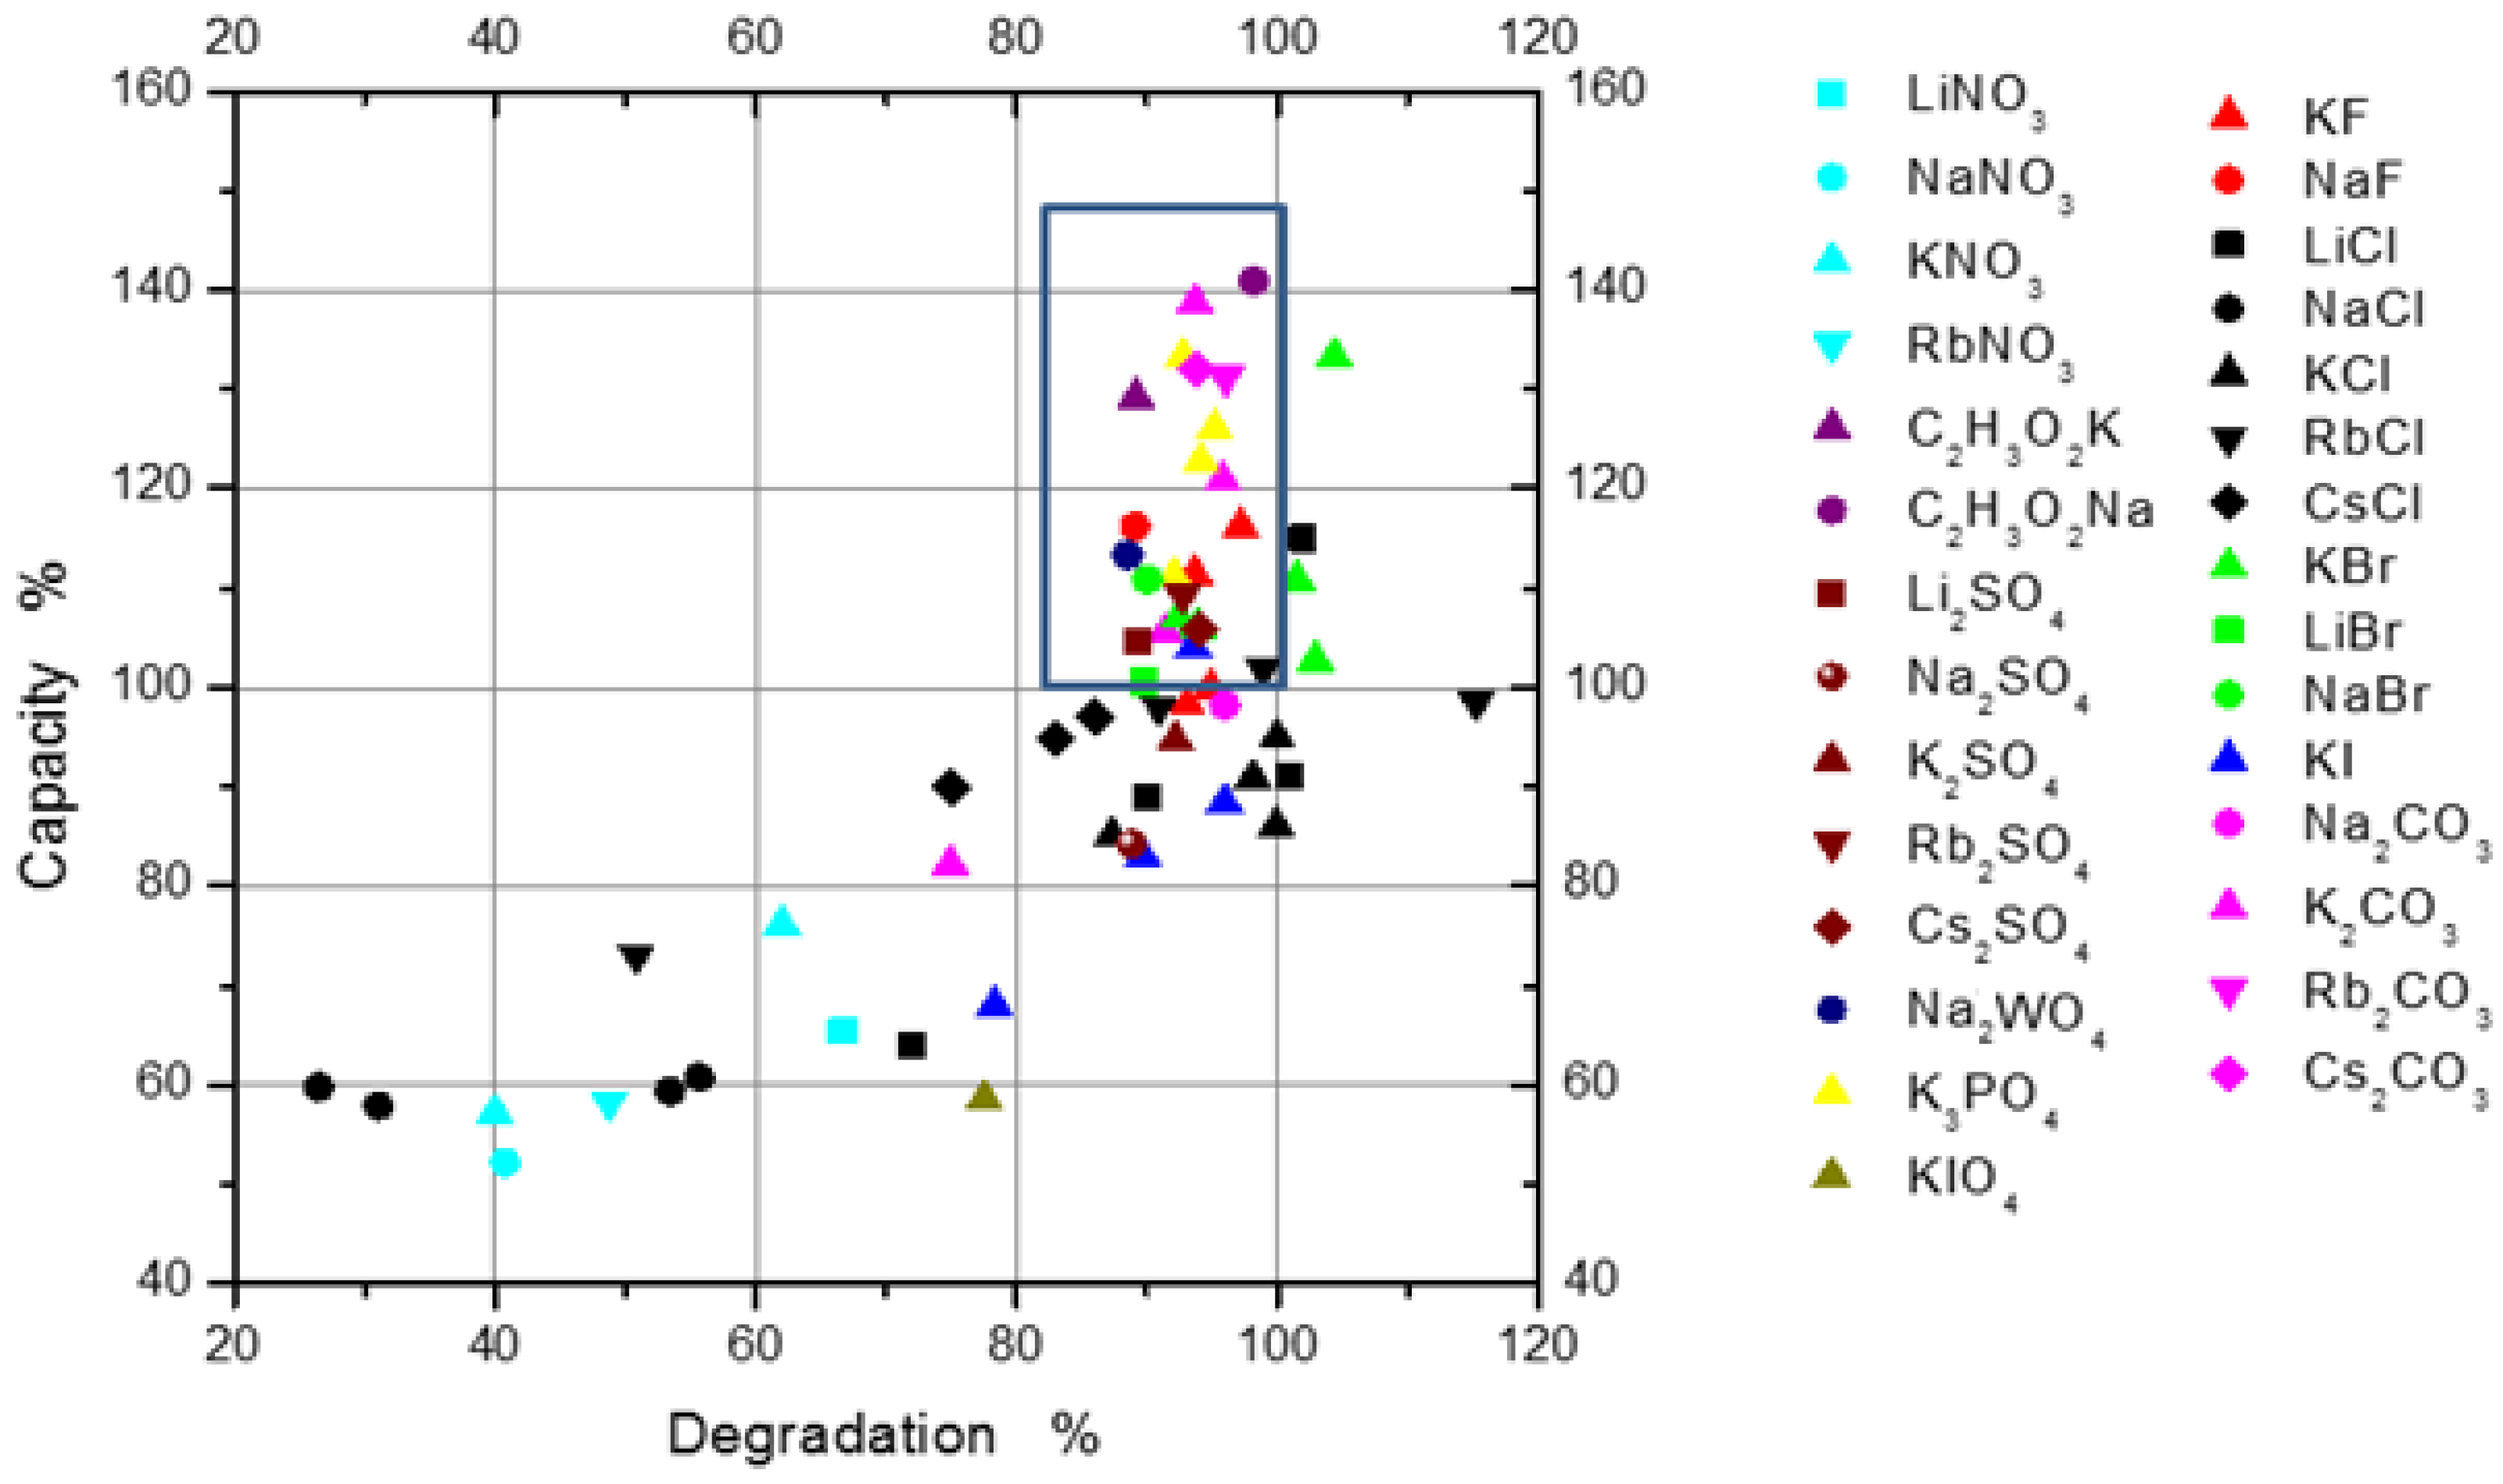
More than 50 soluble salts were tested as additives to the 6 M KOH electrolyte, and their performance results are summarized in
Figure 11. The degradation rate was obtained from the first 15 cycles. The initial capacity and degradation of the MH alloy correlate well with the reduction potential of the alakine cations and radii of the halogen anions. A synergistic effect between KOH and some oxyacid salt additives was observed and greatly influenced by the nature of the salt additives [
16]. The decrease in the degradation of the electrodes and the increase in the discharge capacity can be sttributed to two sources: a solid film formed on the MH alloy surface and a faster ionic conduction in the modified electrolyte [
16]. In the end, we identified NaC
2H
3O
2, KC
2H
3O
2, K
2CO
3, Rb
2CO
3, Cs
2CO
3, K
3PO
4, Na
2WO
4, Rb
2SO
4, Cs
2SO
4, NaF, KF, and KBr to be responsible for increasing the corrosion resistance of the MgNi alloys [
16].
The reason why Ni/MH has a lower specific energy compared to Li-ion battery is mainly because of the relatively low voltage (1.3 V
versus 3.7 V) limited by the electrolysis voltage of water. The standard electrode potential and discharge specific capacity of these two batteries are compared in
Table 2. In order to make a direct comparison, standard hydrogen electrode (SHE) is used as the reference electrode, which is 0.1 V lower and 3.0 V higher than the commonly used Hg/HgO and Li-metal (Li/Li
+) reference electrodes, respectively. On the cathode side, the Li-ion battery uses the +3/+4 oxidation state change in transition metals, which is 0.2 V higher than the +2/+3 oxidation state change in Ni/MH battery. The oxygen gas evolution limits the selection of cathode materials in Ni/MH battery. Likewise, the selection of anode materials for the Ni/MH battery is limited by the hydrogen gas evolution (−0.83 V
versus SHE). The difference in specific capacities between Li-ion and Ni/MH batteries is much smaller compared to the difference in cell voltage. Therefore, increasing the cell voltage is one of the primary goals for the electrolyte development in RANGE-BASF. However, in the study with the conventional 30 wt% KOH electrolyte, only the addition of the anode materials collected from a commercial Ni-Zn battery showed a 0.2 V expansion on the anode side. Other Zn- and Pb-containing additives showed no effect in expanding the voltage window of the KOH electrolyte, which pushed us to pursue the IL.
Figure 11.
Discharge capacity and degradation of MgNi electrodes in 6 M KOH electrolyte with different salt additives. Salts in the blue rectangle increase the capacity and reduce the corrosion.
Figure 11.
Discharge capacity and degradation of MgNi electrodes in 6 M KOH electrolyte with different salt additives. Salts in the blue rectangle increase the capacity and reduce the corrosion.
Table 2.
Comparison of conventional cathode and anode used in Li-ion and Ni/MH batteries. SHE: standard hydrogen electrode.
Table 2.
Comparison of conventional cathode and anode used in Li-ion and Ni/MH batteries. SHE: standard hydrogen electrode.
| Electrode | Potential (vs. SHE) | Capacity (mAh·g−1) |
|---|
| Cathode in Li-ion | 0.7 V | 230 |
| Cathode in current Ni/MH | 0.5 V | 280 |
| Cathode in future Ni/MH (Mn) | 1.5 V | 1116 |
| Anode in Li-ion | −3.0 V | 330 |
| Anode in current Ni/MH | −0.8 V | 320 |
| Anode in future Ni/MH (Si) | −1.0 V | 3635 |
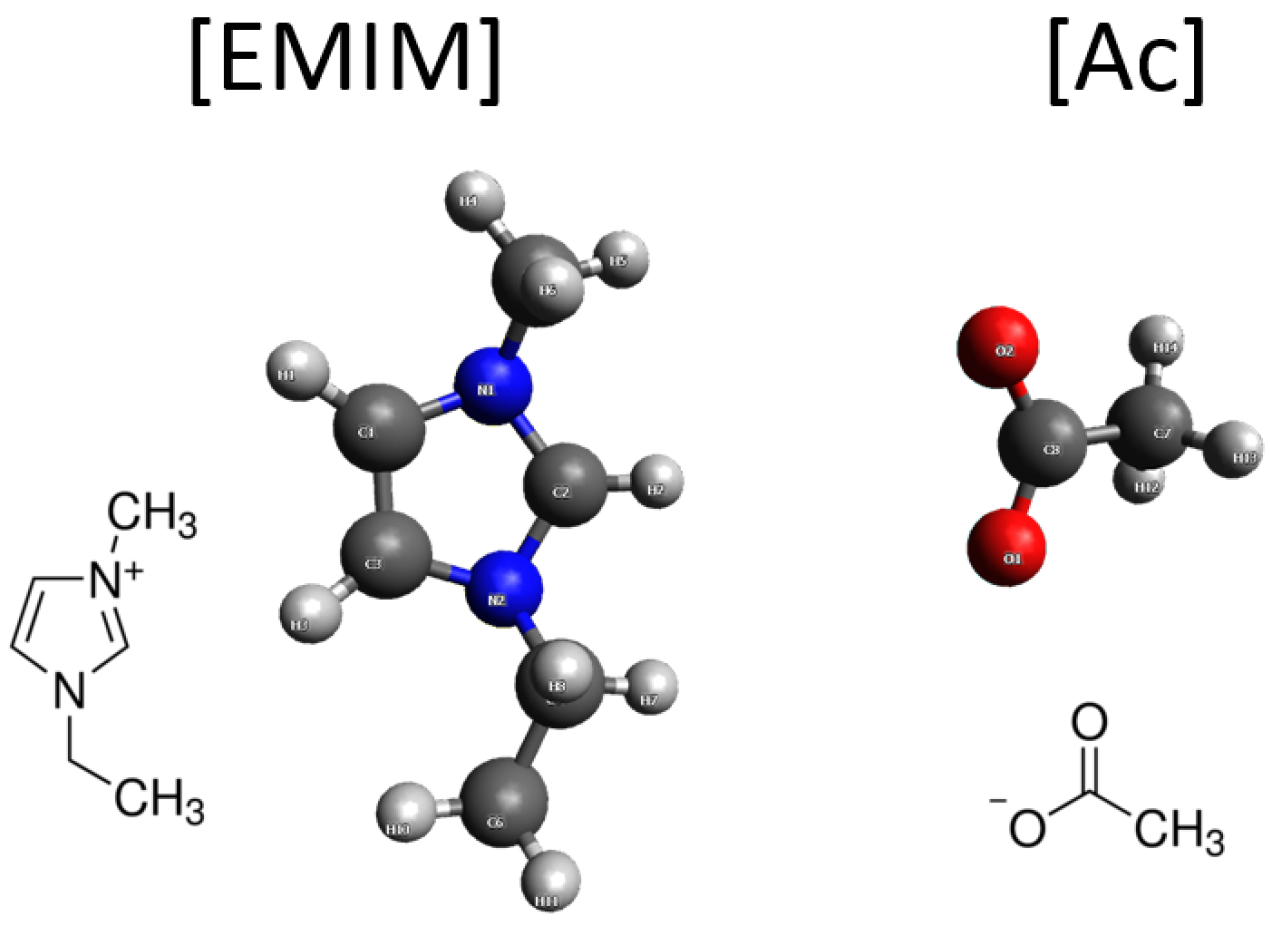
ILs are liquids consisting exclusively of cations and anions and exhibit superior physicochemical properties such as low melting points, high thermal and electrochemical stability, high ionic conductivity, negligible vapor pressure, and non-inflammability, which make them ideal candidates for electrochemical applications. After screening a few combinations of ILs and anhydrous acids, we found that the mixture of aprotic [EMIM][Ac] (1-ethyl-3-methylimidazolium acetate, structure shown in
Figure 12) and glacial acetic acid was a suitable candidate to replace the conventional electrolyte (30 wt% KOH in H
2O) [
17]. Acid is needed in aprotic IL to supply the protons to carry the charge.
Figure 12.
Molecular structure of 1-ethyl-3-methylimidazolium acetate ([EMIM][Ac]) that has been used extensively in the RANGE-BASF program.
Figure 12.
Molecular structure of 1-ethyl-3-methylimidazolium acetate ([EMIM][Ac]) that has been used extensively in the RANGE-BASF program.
A cyclic voltammogram (CV) of an AB
5 electrode in 2 M acetic acid in [EMIM][Ac] shows a 0.6 V separation between the hydride reduction and hydrogen gas evolution peaks (
Figure 13a). Using [EMIM][Ac]/Ac mixtures electrolyte, we are able to study the Si-anode in this non-aqueous system since
a-Si is highly reactive with the KOH electrolyte [
18].
Figure 13.
Cyclic voltammetry (CV) graph of an AB5 electrode in: (a) an ionic liquid (IL) (2 M acetic acid in [EMIM][Ac]); and (b) aqueous electrolytes (30 wt% KOH).
Figure 13.
Cyclic voltammetry (CV) graph of an AB5 electrode in: (a) an ionic liquid (IL) (2 M acetic acid in [EMIM][Ac]); and (b) aqueous electrolytes (30 wt% KOH).
Other development efforts in the electrolyte area include adding a Nafion coating on the negative electrode to reduce corrosion, and replacing aqueous electrolyte with solid polymer membrane (300 mAh·g
−1,
Figure 14a,b) or gel (320 mAh·g
−1,
Figure 12c), or non-aqueous 1 M triflic acid in PC:DMC (propylene carbonate:dimethyl carbonate) = 1:1 (50 mAh·g
−1).
Figure 14.
(a,b) A flexible PEO-PVA-KOH-H2O gel film; and (c) PVA-KOH gel electrolyte. PEO: polyethylene oxide; and PVA: polyvinel alkahol.
Figure 14.
(a,b) A flexible PEO-PVA-KOH-H2O gel film; and (c) PVA-KOH gel electrolyte. PEO: polyethylene oxide; and PVA: polyvinel alkahol.
2.3. Development in Positive Electrode
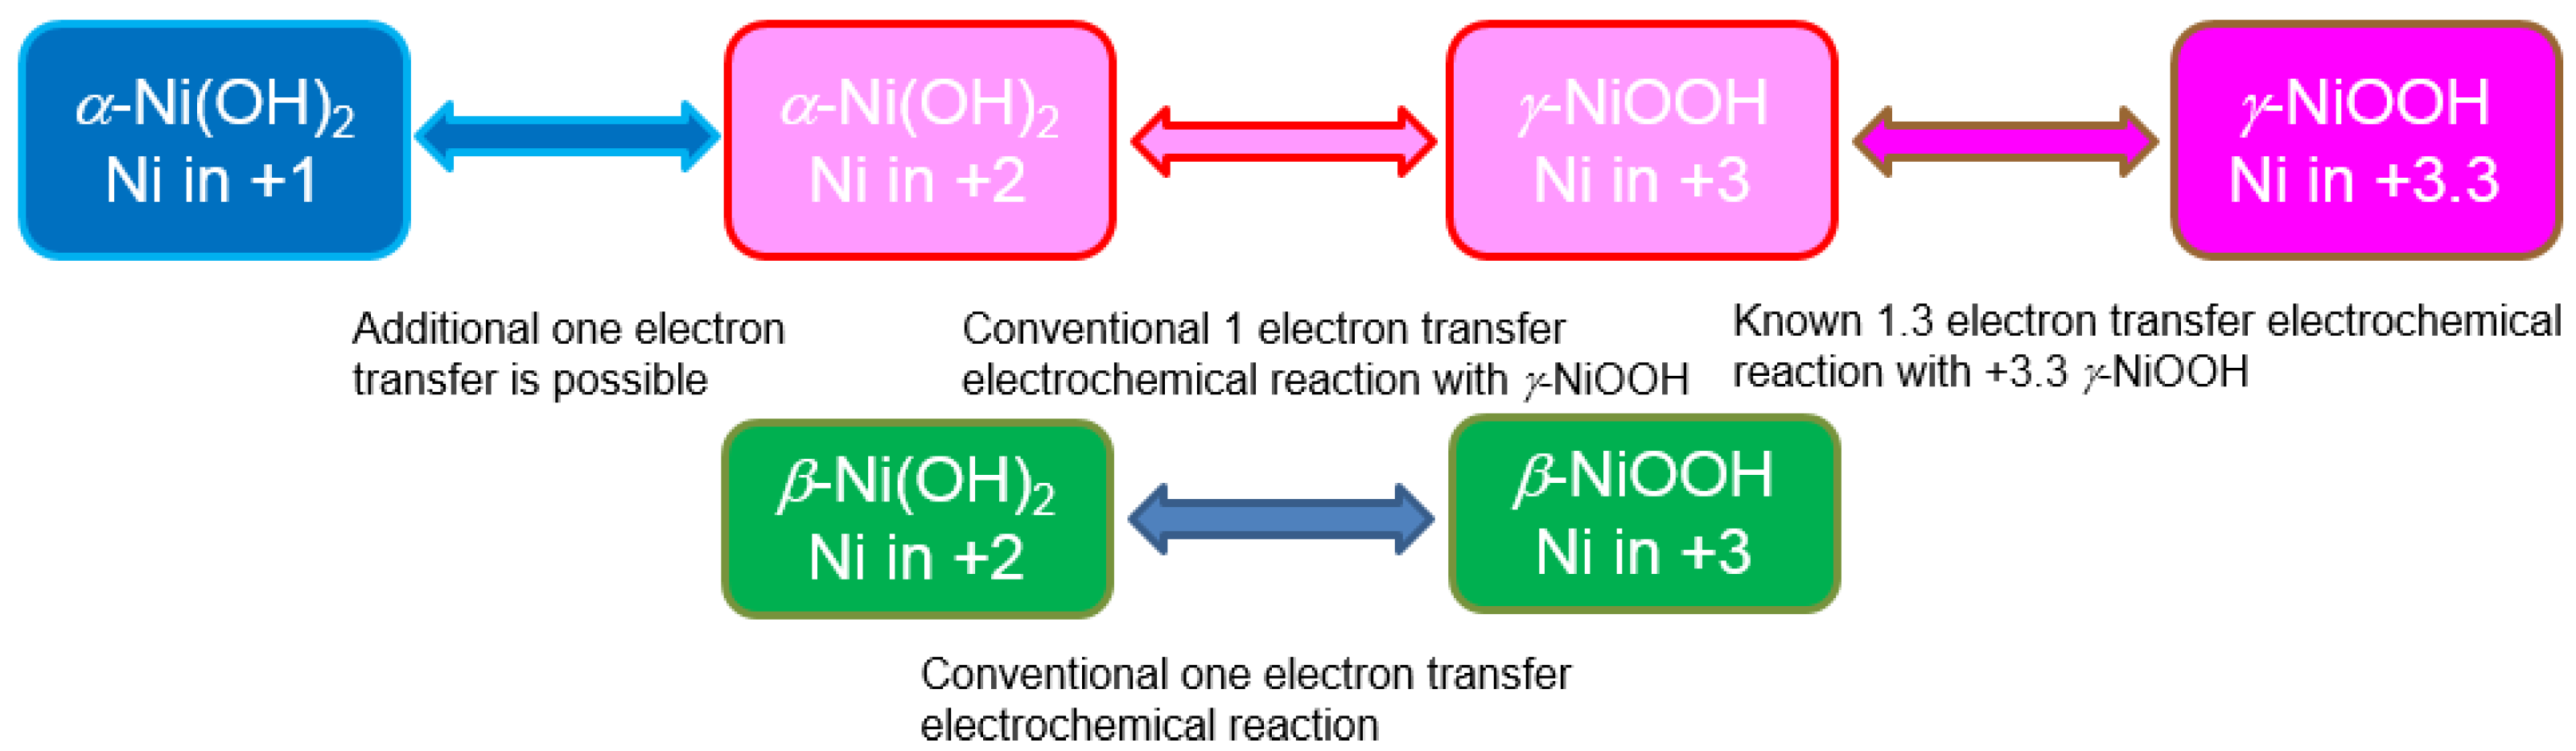
The development work on the positive electrode (cathode) started from the expansion of the oxidation swing window. Because of the limit from the oxygen gas evolution competition, the redox reaction for Ni(OH)
2 is conventionally between +2 and +3 oxidation states (
Figure 15).
Figure 15.
Changes in the oxidation states in Ni with different chemical reaction. Reactants in green boxes are used in the conventional Ni-based rechargeable batteries, while those in pink boxes are avoided to prevent electrode swelling/disintegration. The one in the blue box is the key element in the high-capacity positive electrode study in the RANGE-BASF program.
The Pourbaix diagram of Ni shows the +3/+4 redox reaction happens at about 0.2 V above the oxygen gas evolution potential (
Figure 16). The γ-NiOOH is known to have a higher oxidation state (+3.3 or higher) but is still allowed in the aqueous solution [
19]. However, transformation from β-Ni(OH)
2 into α-Ni(OH)
2 requires insertion of a water layer between the NiO
2 planes, which causes a swelling/disintegration of the positive electrode and is avoided by the addition of Zn or Cd [
20].
Figure 16.
Pourbaix diagram showing different oxidation states of Ni at different voltages vs. standard hydrogen electrode (SHE). The red line corresponds to the pH value of the 30% KOH electrolyte. Oxidation states in yellow boxes are well-known, while the one in the blue box is the focus of the RANGE-BASF study.
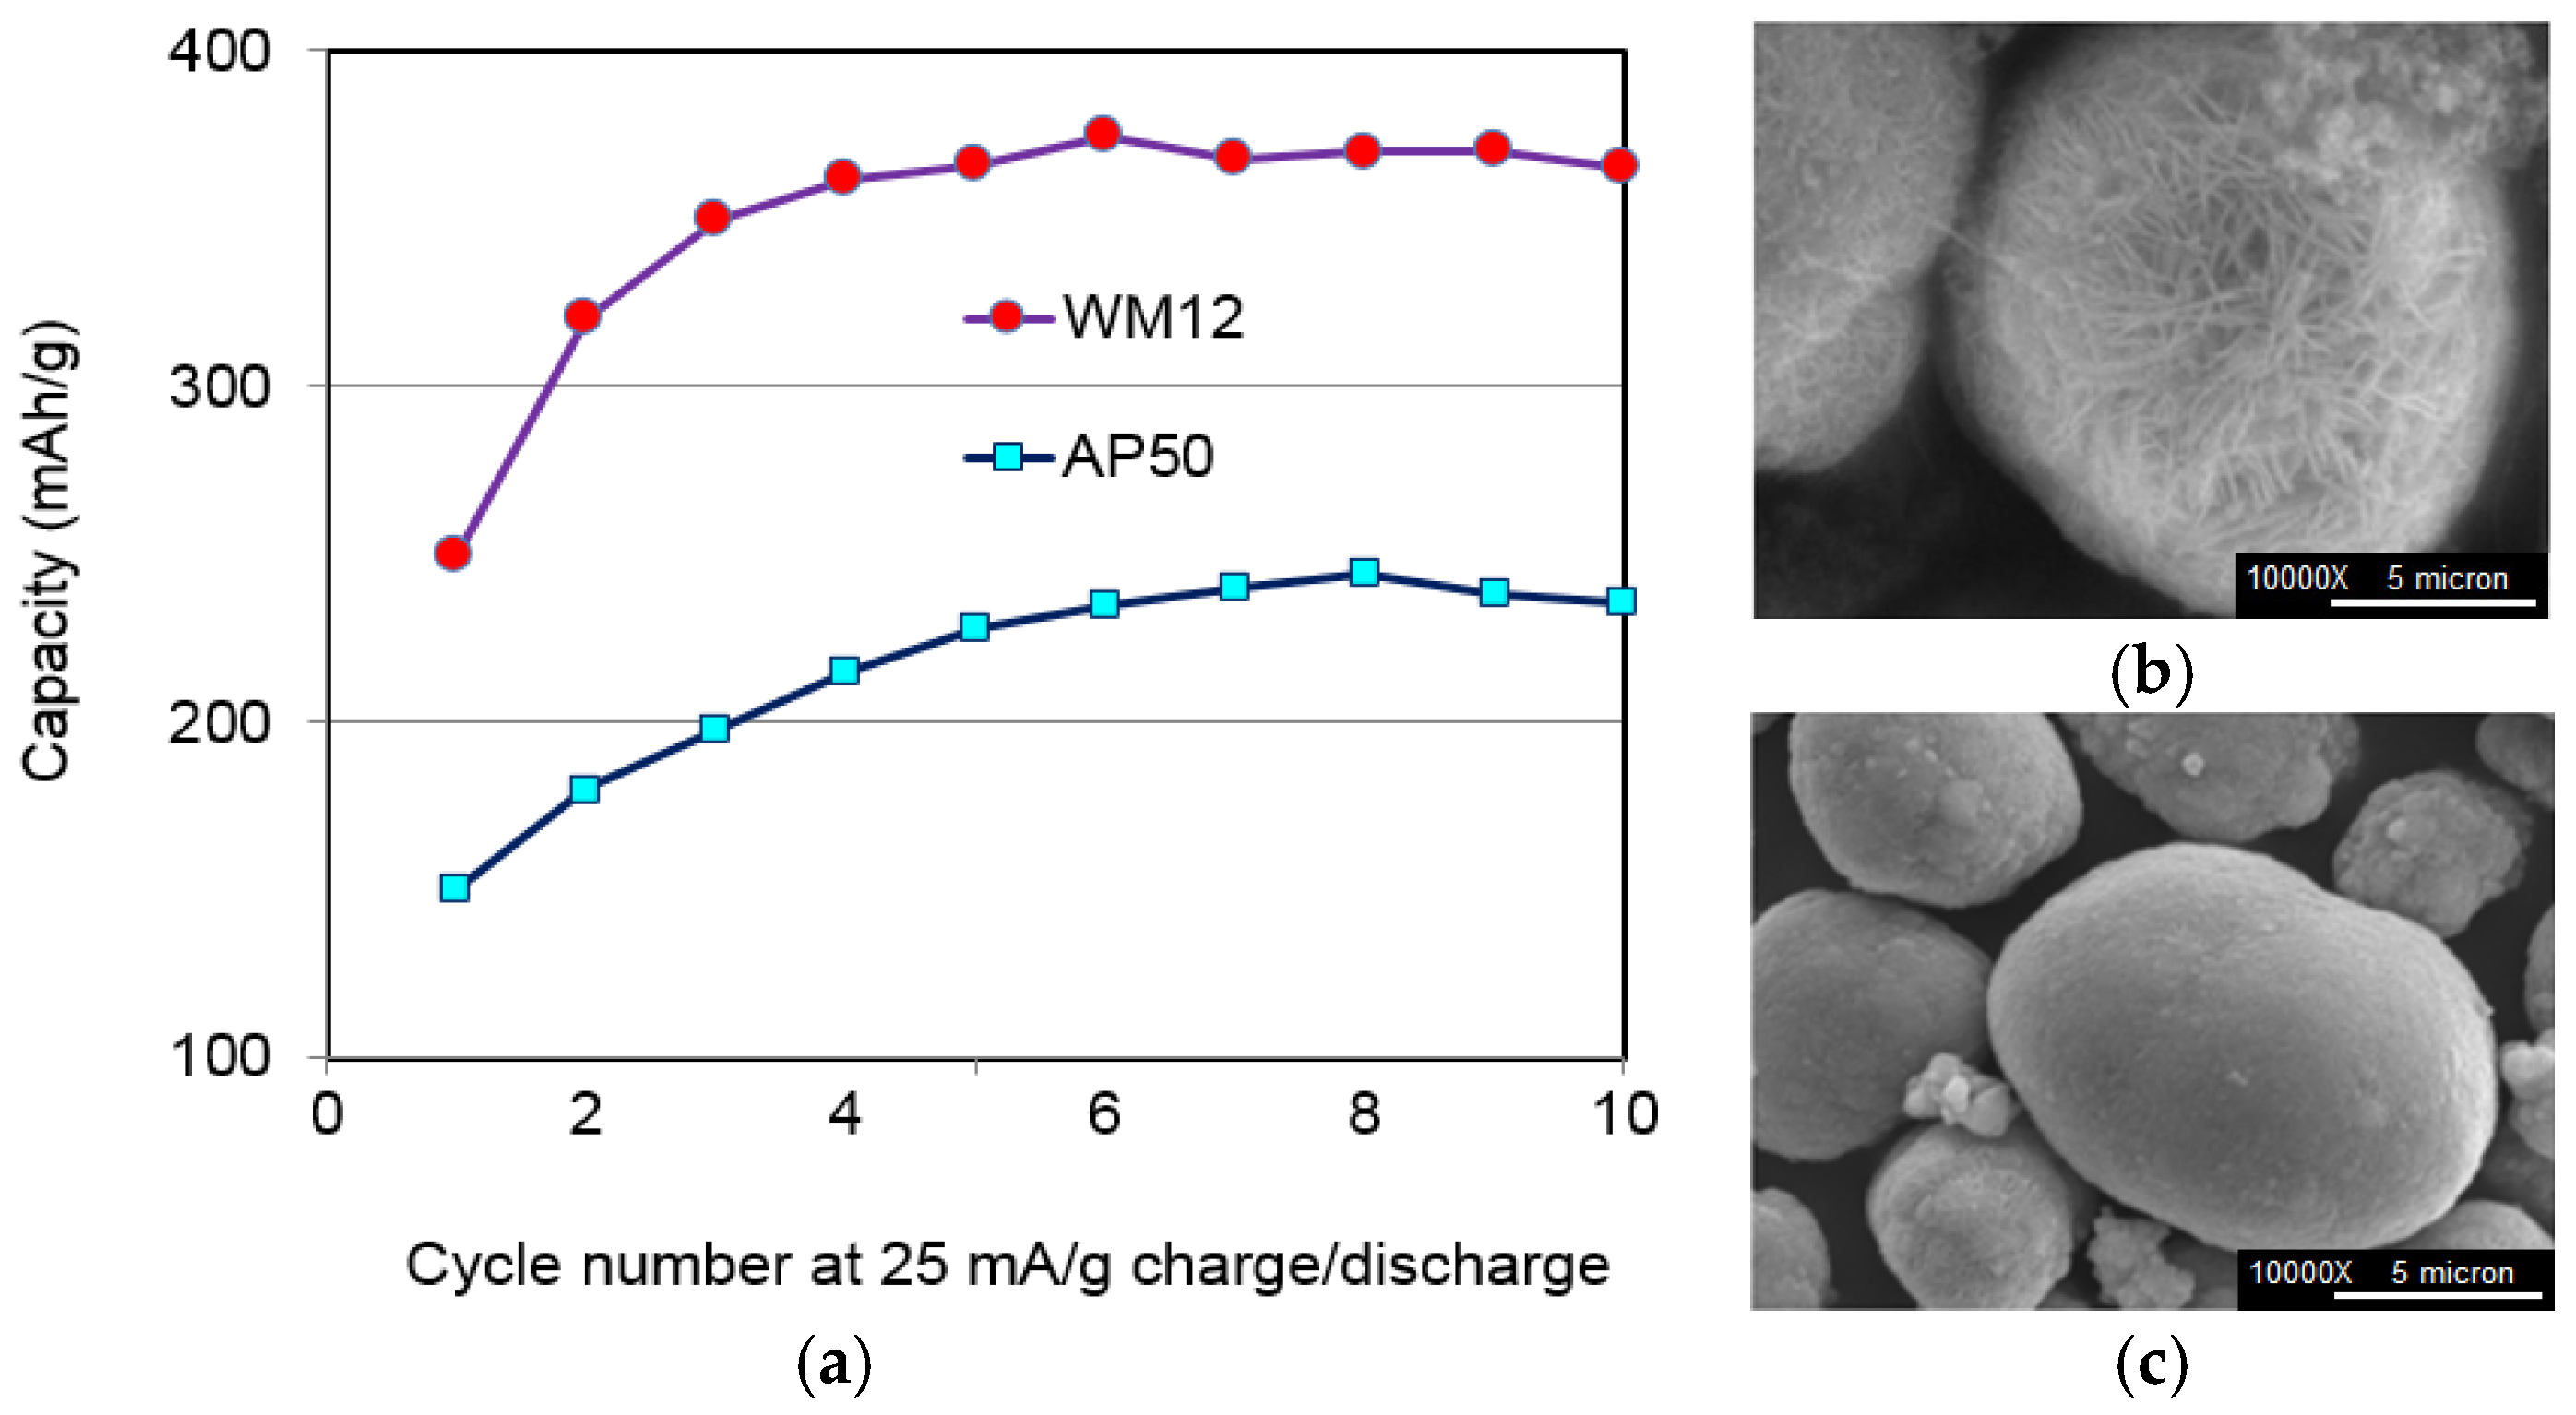
In the RANGE-BASF program, we developed a continuous process to fabricate core-shell α-β Ni(OH)
2 (WM12) with a 50% increase in specific capacity and good cycle stability (
Figure 17).
Figure 17.
(a) Capacity comparison between core-shell α-β WM12 and conventional β-Ni(OH)2 AP50 spherical particles. SEM micrographs of two materials: (b) WM12 and (c) AP50. Instead of a relative smooth surface of AP50, WM12 shows a very rough surface with a high reaction surface area.
Figure 17.
(a) Capacity comparison between core-shell α-β WM12 and conventional β-Ni(OH)2 AP50 spherical particles. SEM micrographs of two materials: (b) WM12 and (c) AP50. Instead of a relative smooth surface of AP50, WM12 shows a very rough surface with a high reaction surface area.
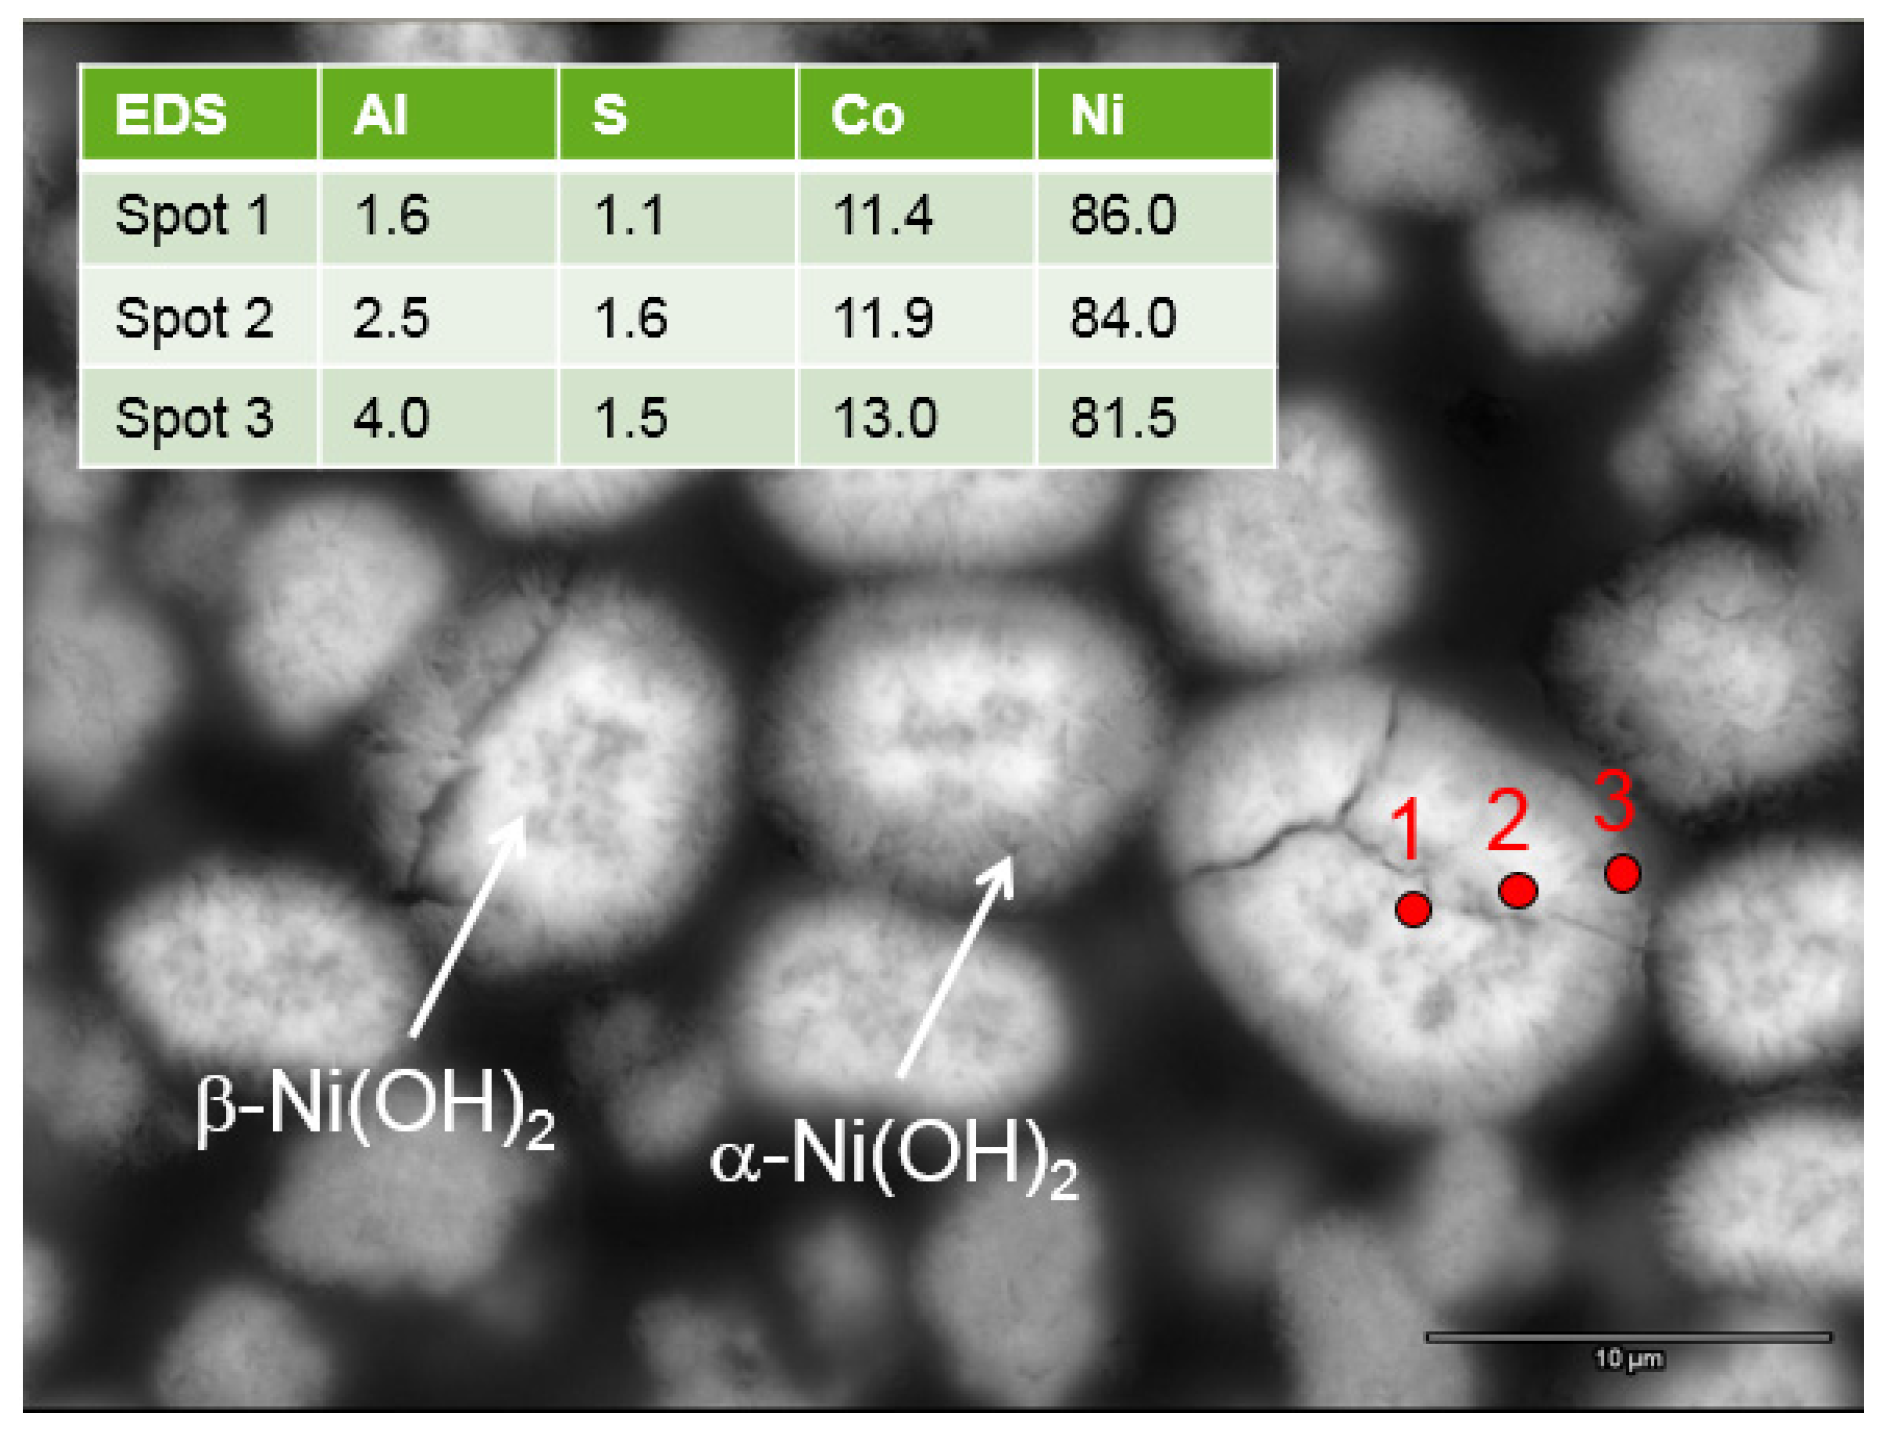
The X-ray energy dispersive spectroscopy (EDS)/scanning electron microscopy (SEM) study shows a higher Al (an α-phase promoter) content at the surface (
Figure 18).
Figure 18.
Cross-section SEM micrograph of the continuous process prepared WM12 Ni(OH)2, showing that the core (β)-shell (α) structure has different Al-contents, as shown in the X-ray energy dispersive spectroscopy (EDS) results in the inset.
Figure 18.
Cross-section SEM micrograph of the continuous process prepared WM12 Ni(OH)2, showing that the core (β)-shell (α) structure has different Al-contents, as shown in the X-ray energy dispersive spectroscopy (EDS) results in the inset.
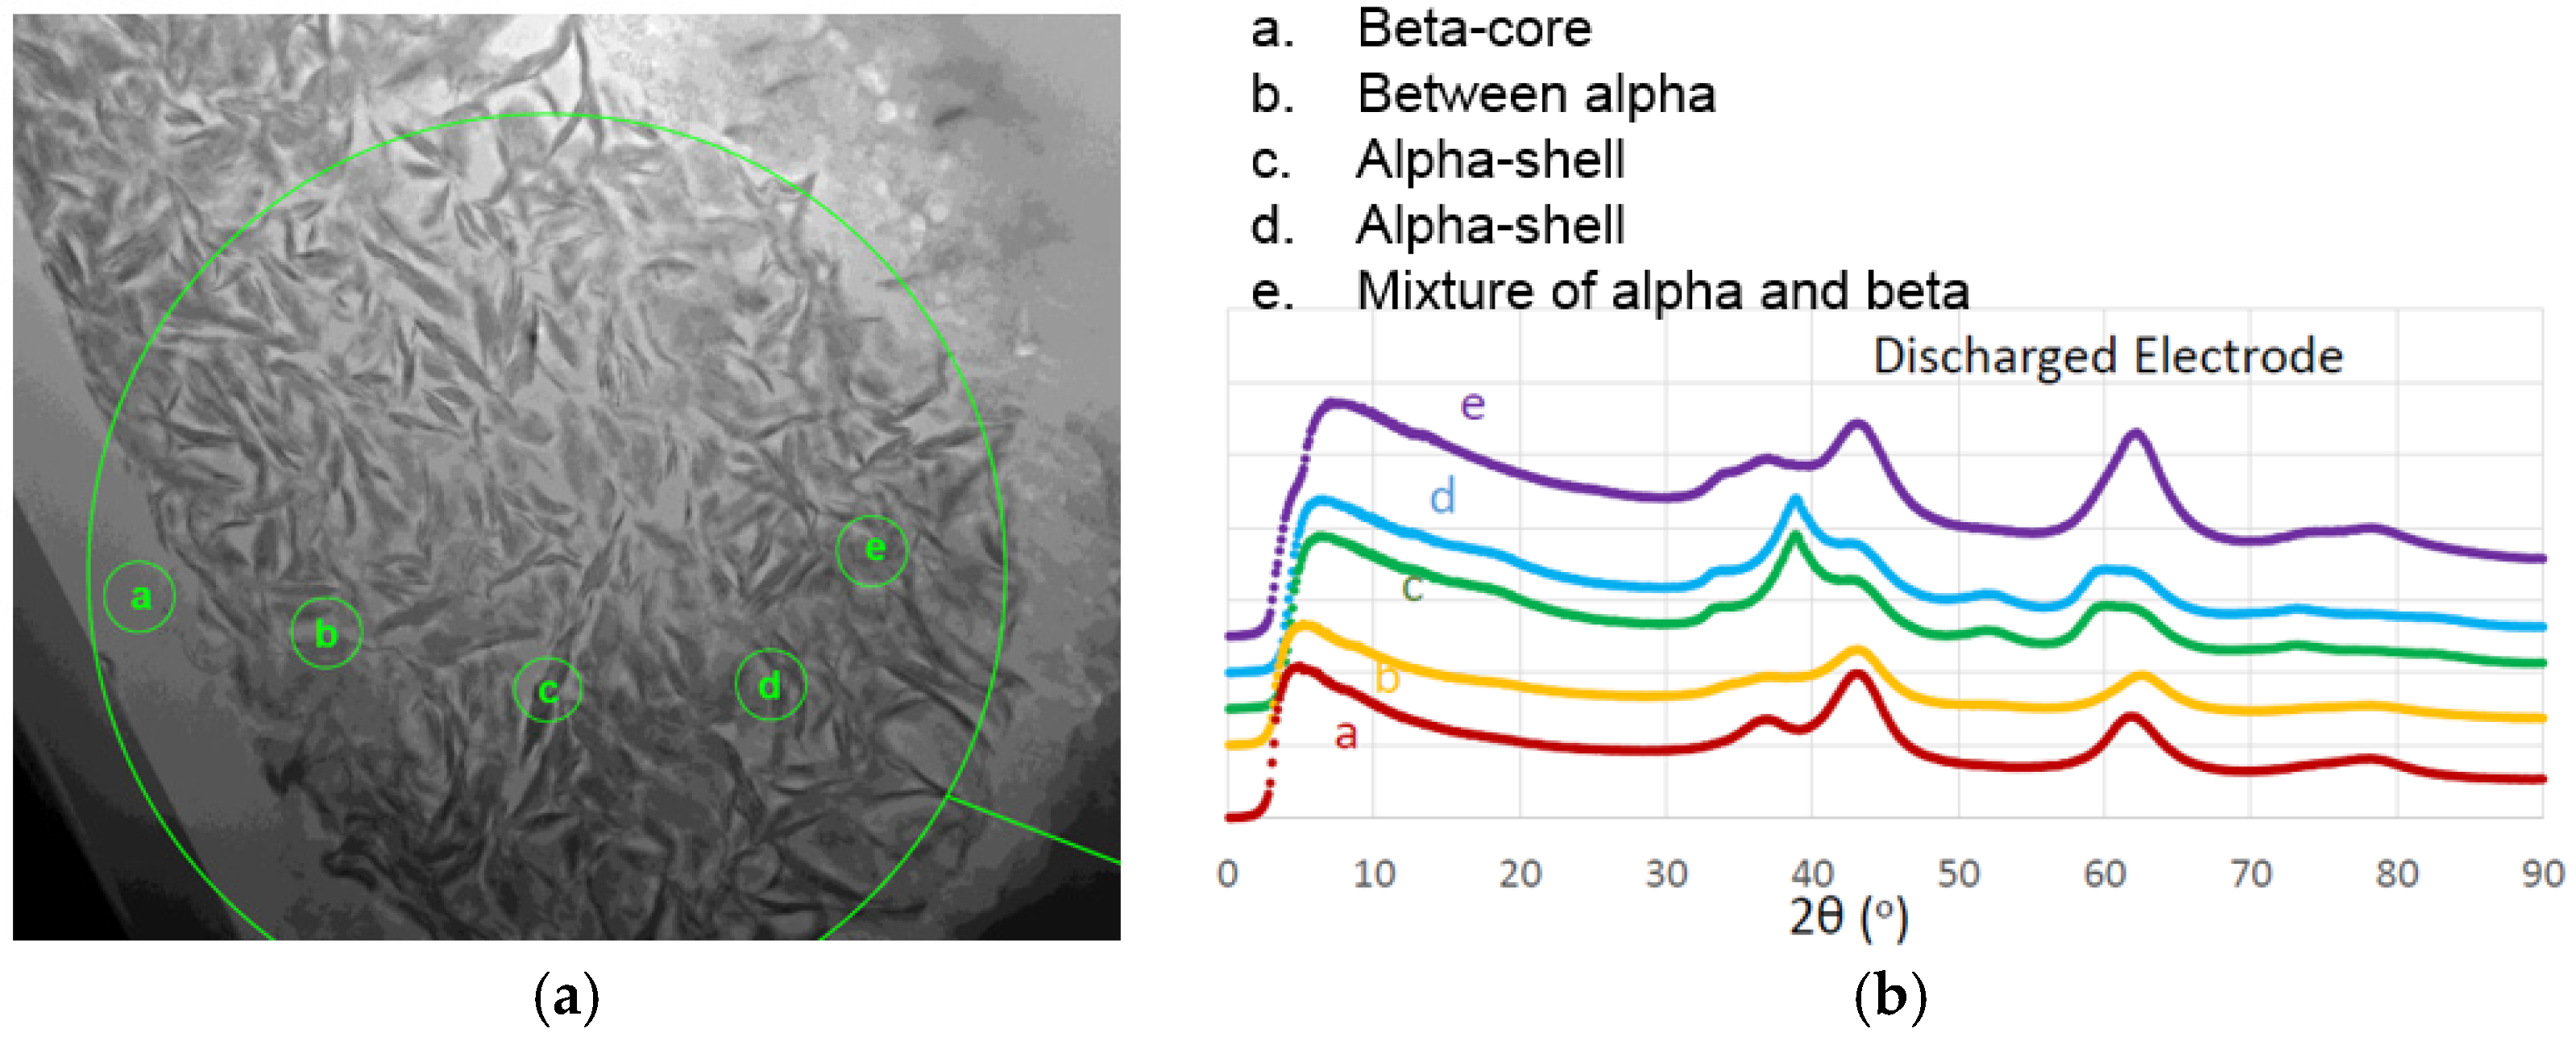
A TEM micrograph from the cross-section of a core-shell WM12 Ni(OH)
2 is shown in
Figure 19a. The corresponding electron yields across the diffraction resembling the X-ray diffraction (XRD) patterns are shown in
Figure 19b to show the microstructure of β-core and α-shell. The as-prepared material is purely β-phase Ni(OH)
2. During activation, the core with less Al remains the β-phase and the shell turns into α-phase with a higher Al-content. The surface is very fluffy, which allows α-phase to grow without disintegration. Besides the continuous process, WSU also developed batch processes to fabricate α-Ni(OH)
2 (
Table 3).
Figure 19.
(a) TEM micrograph of a cross-section of core-shell WM12 Ni(OH)2; and (b) the corresponding electron yield across diffraction patterns.
Figure 19.
(a) TEM micrograph of a cross-section of core-shell WM12 Ni(OH)2; and (b) the corresponding electron yield across diffraction patterns.
Table 3.
Design matrix and results for batch process prepare Ni(OH)2 performed in Wayne State University (WSU).
Table 3.
Design matrix and results for batch process prepare Ni(OH)2 performed in Wayne State University (WSU).
| Parameter | Ni-1 | Ni-2 | Ni-3 | Ni-4 |
|---|
| Preparation | Single-step precipitation | Multi-step precipitation | Homogeneous precipitation | Homogeneous precipitation |
| Precipitants | KOH | NaOH, Na2CO3, NH4OH, NH4Cl | Urea, Tween-20 | Urea |
| Composition | 100% Ni | 86% Ni, 14% Al | 86% Ni, 14% Al | 86% Ni, 14% Al |
| Structure | β-Ni(OH)2 | α-Ni(OH)2 | α-Ni(OH)2 | α-Ni(OH)2 |
| Activation cycles | 6 | 5 | 12 | 11 |
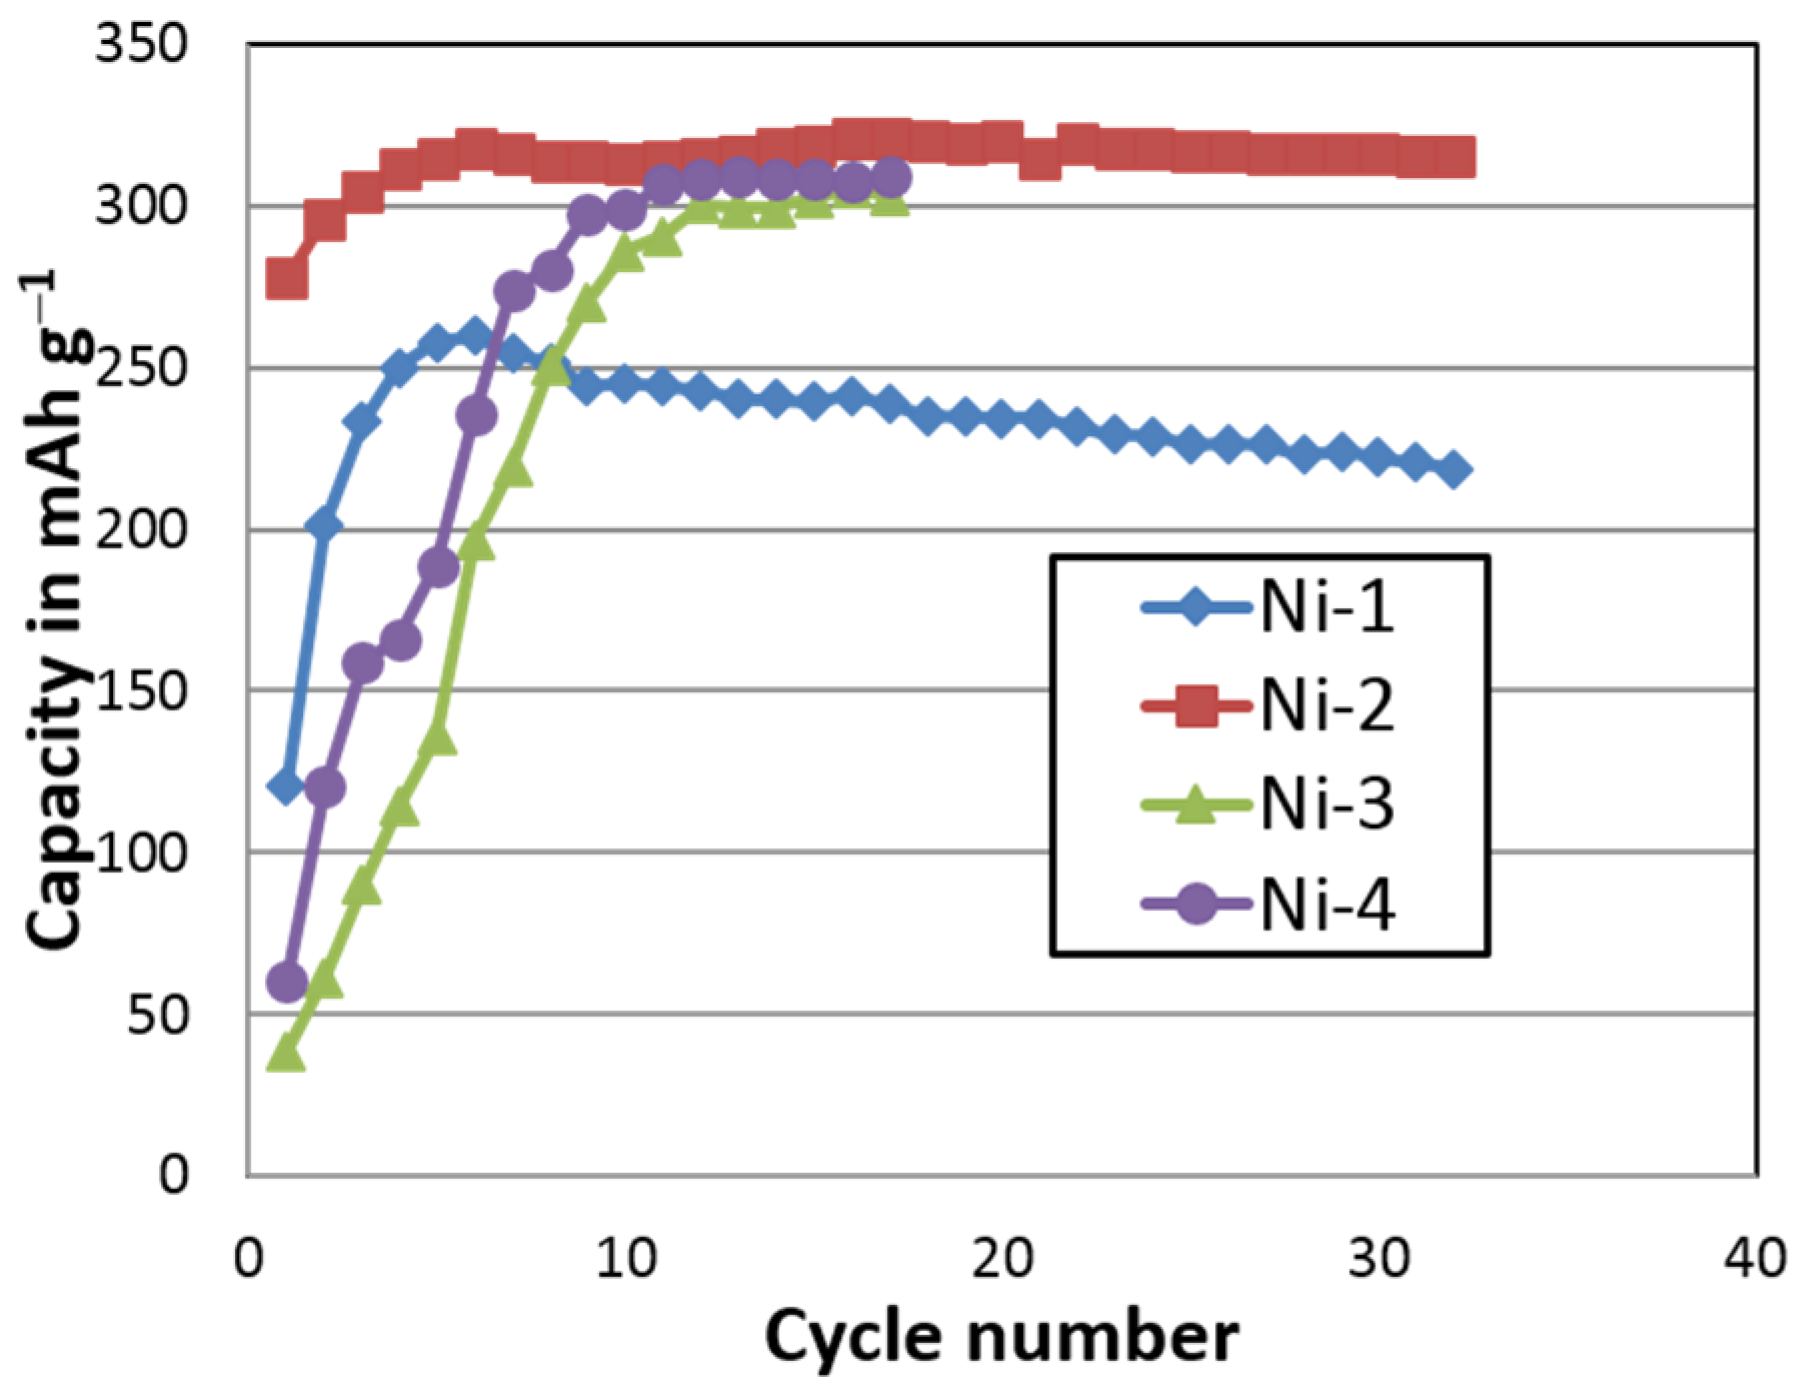
| Maximum capacity (mAh·g−1) | 260 | 346 | 305 | 310 |
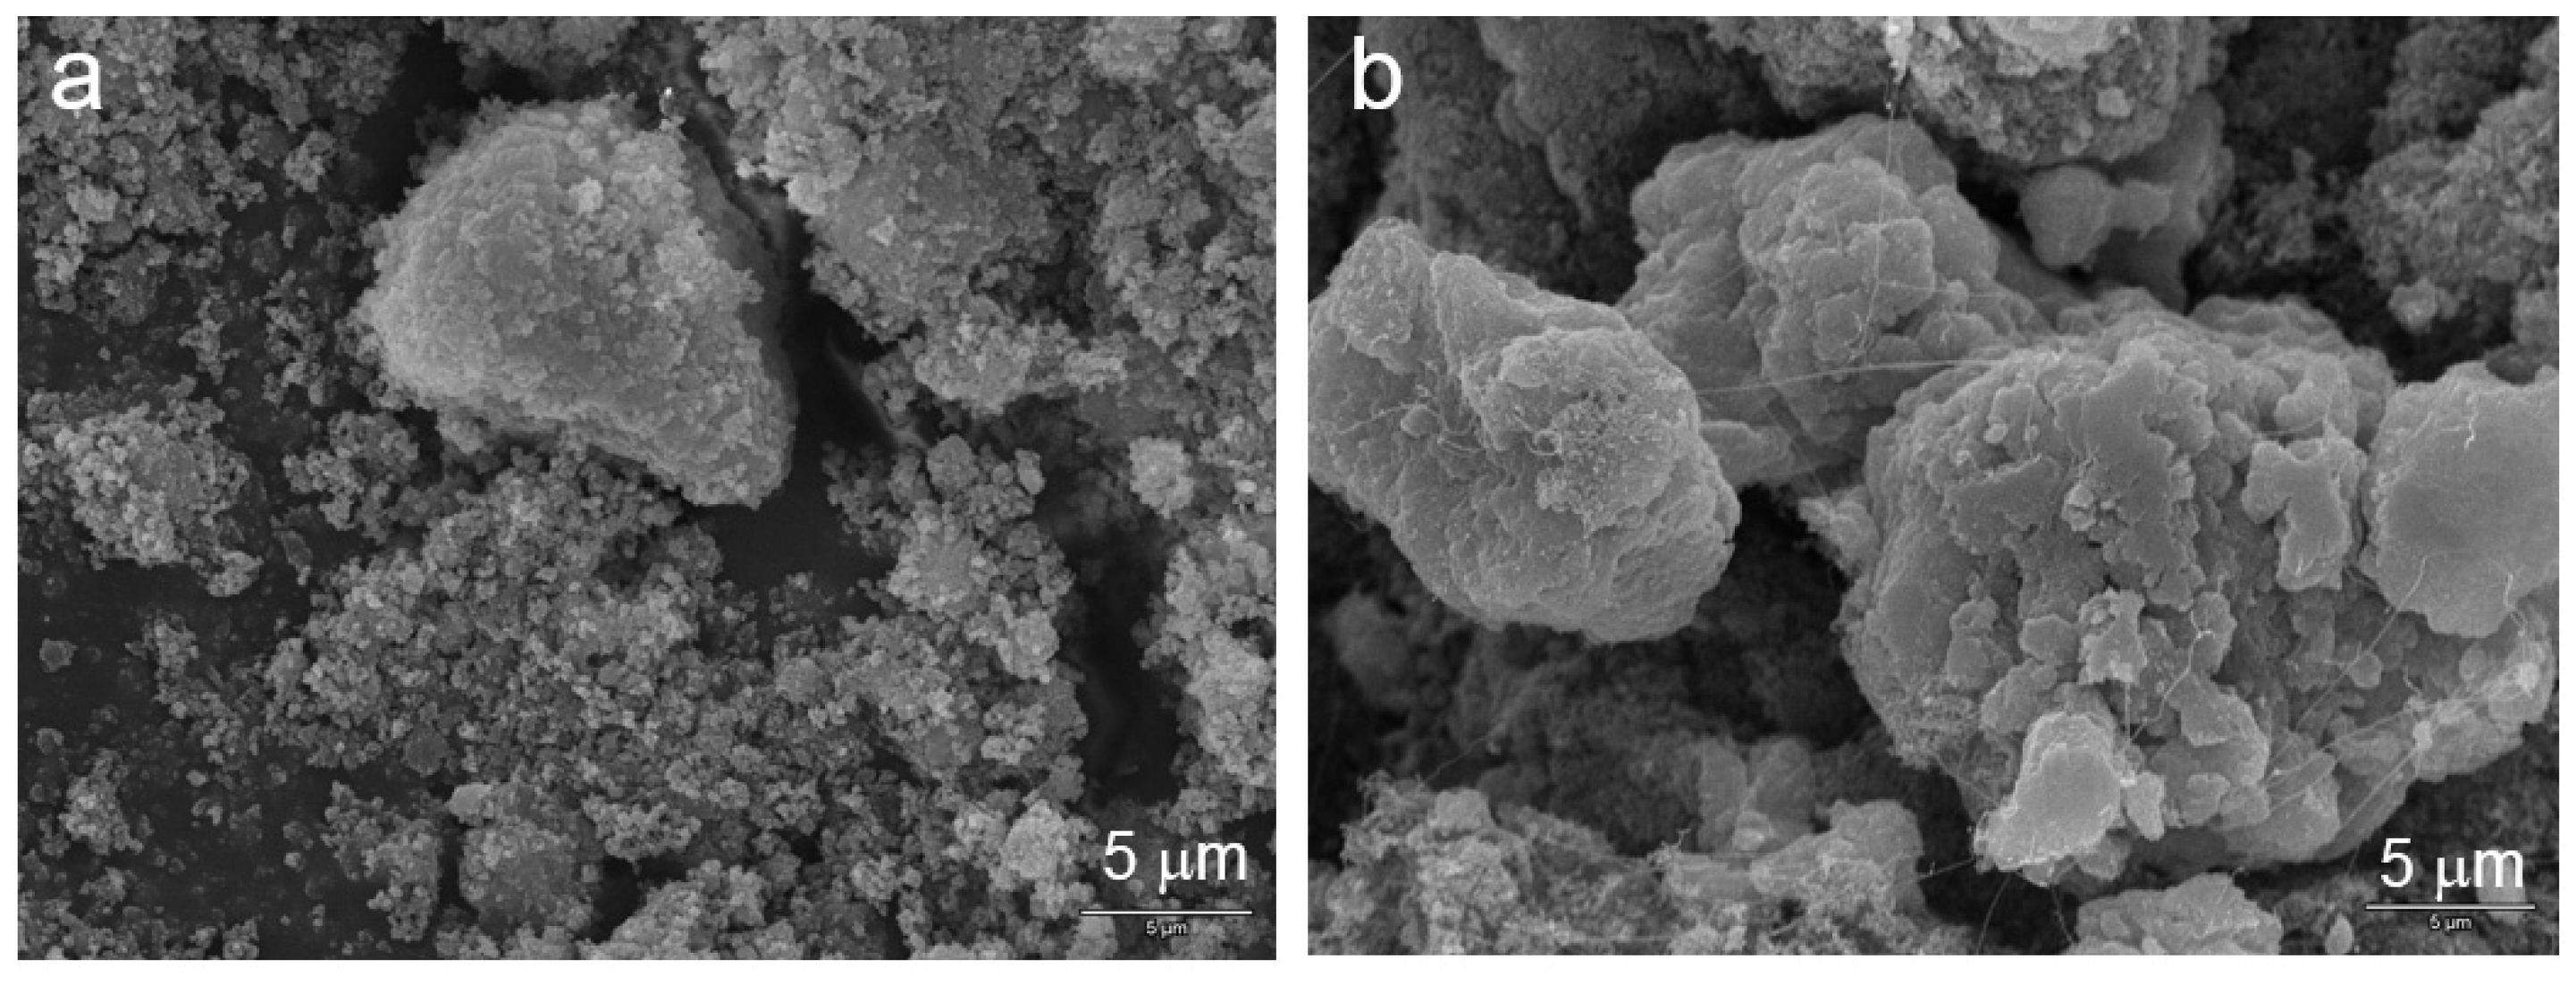
Since the material is α-phase before cycling, it does not go through the β-α transition. Therefore, the integrity of the Ni(OH)
2 particle is preserved (
Figure 20), and the capacity is very stable (
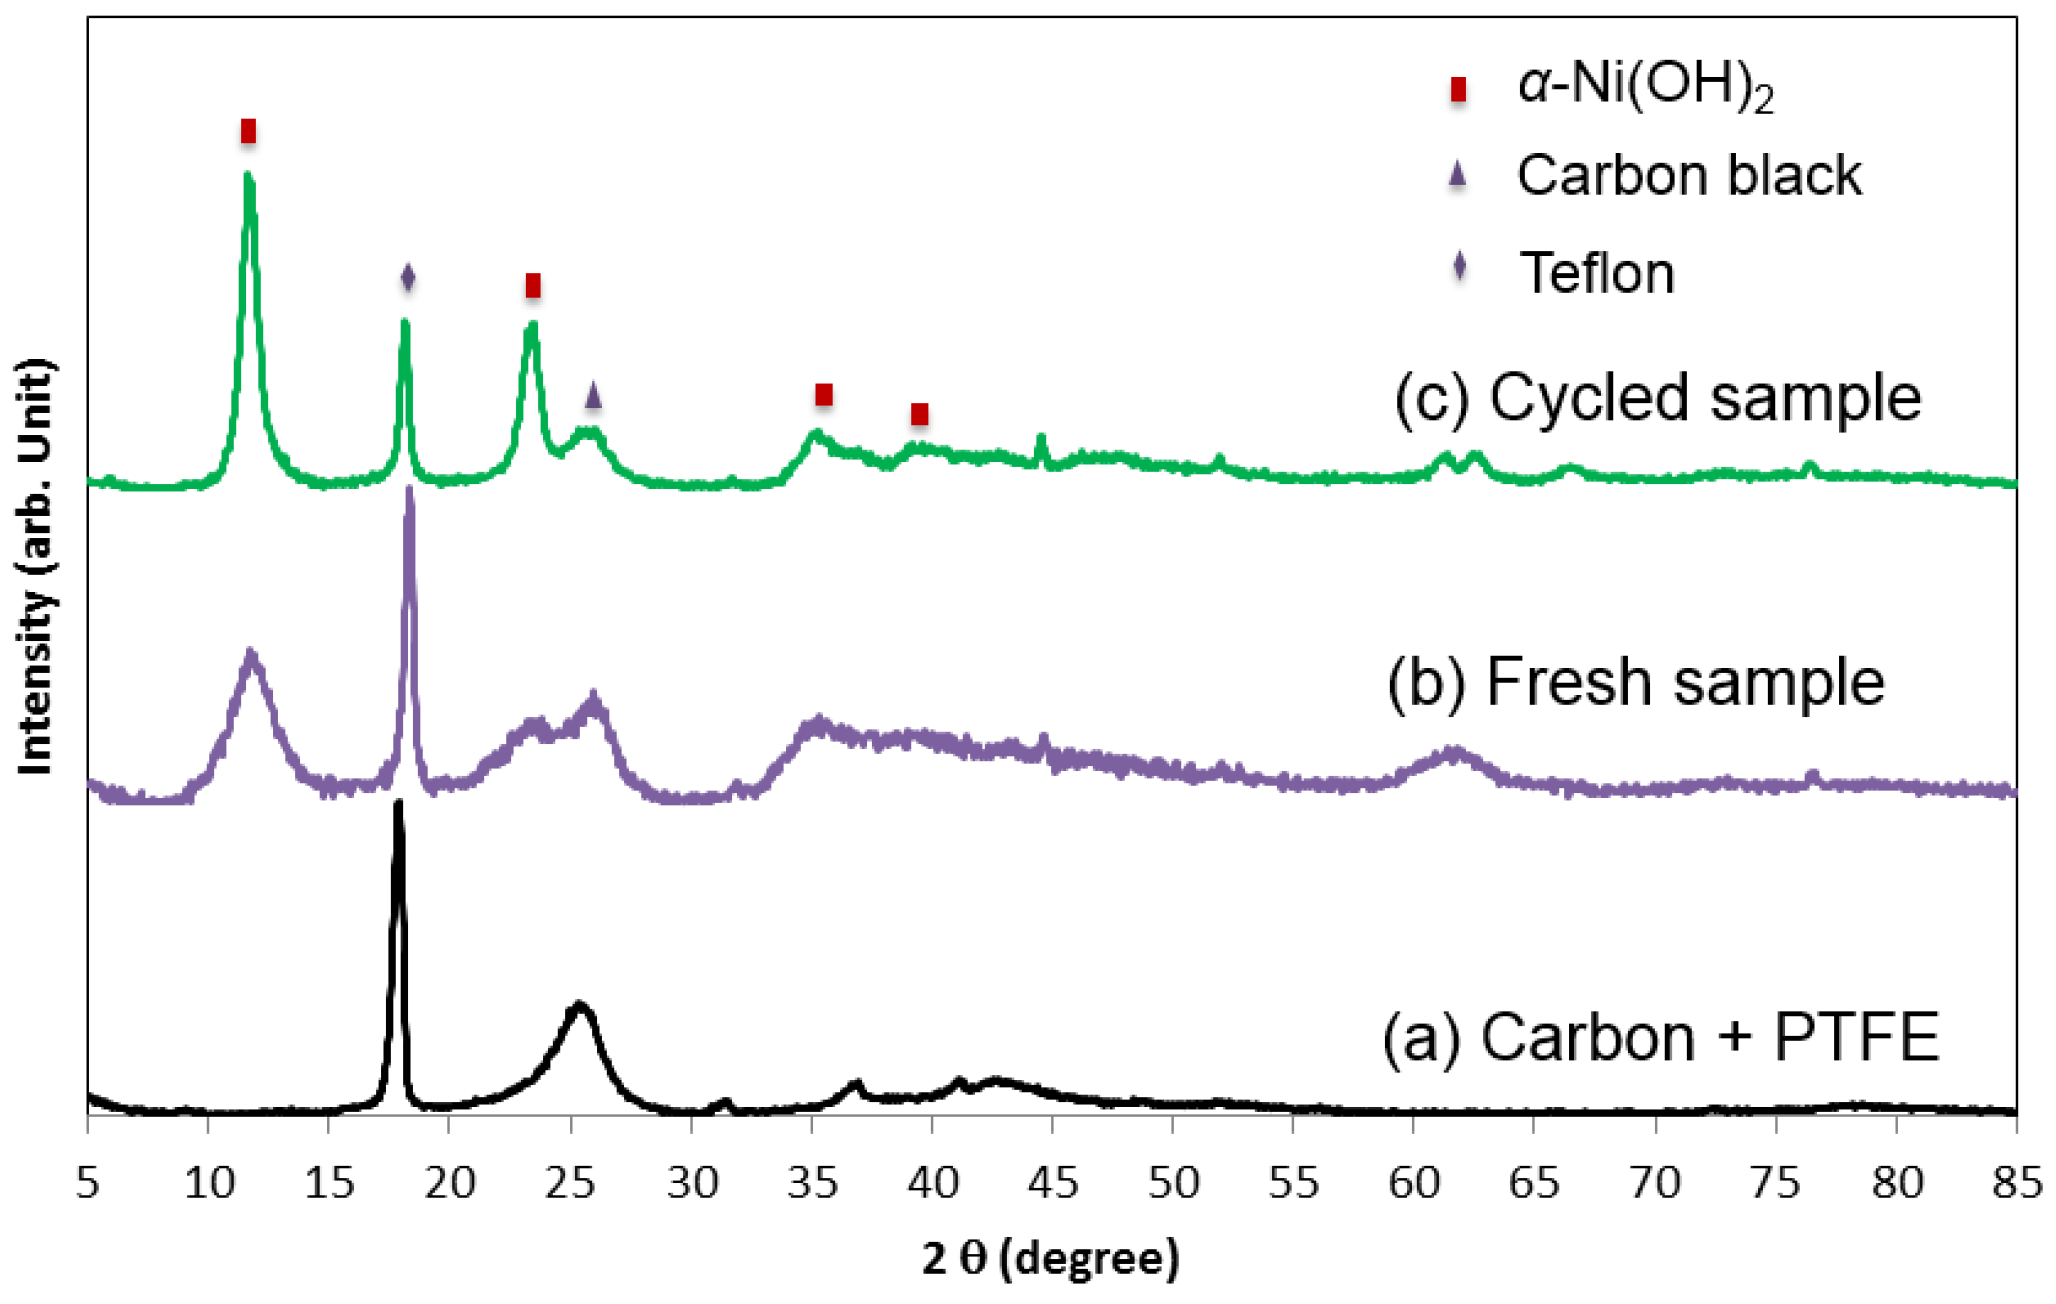
Figure 21). XRD analysis verifies the α-phase structure in both the pristine and cycled materials (
Figure 22).
Figure 20.
SEM micrographs of (a) pristine and (b) cycled α-Ni(OH)2 prepared by a batch co-precipitation process.
Figure 20.
SEM micrographs of (a) pristine and (b) cycled α-Ni(OH)2 prepared by a batch co-precipitation process.
Figure 21.
Cycle stability of one β-Ni(OH)2 (Ni-1) and three α-Ni(OH)2 (Ni-2, Ni-3, and Ni-4) samples prepared by a batch co-precipitation process.
Figure 21.
Cycle stability of one β-Ni(OH)2 (Ni-1) and three α-Ni(OH)2 (Ni-2, Ni-3, and Ni-4) samples prepared by a batch co-precipitation process.
Figure 22.
X-ray diffraction (XRD) of (a) the additives, (b) a pristine, and (c) a cycled a α-Ni(OH)2 (Ni-2) prepared by a batch co-precipitation process. From the decrease in the width of the diffraction pattern, the crystallite of α-Ni(OH)2 is found to increase with electrochemical cyclings.
Figure 22.
X-ray diffraction (XRD) of (a) the additives, (b) a pristine, and (c) a cycled a α-Ni(OH)2 (Ni-2) prepared by a batch co-precipitation process. From the decrease in the width of the diffraction pattern, the crystallite of α-Ni(OH)2 is found to increase with electrochemical cyclings.
In this program, we also investigated the possibility of further reducing α-Ni(OH)
2 into +1 or even lower oxidation state to maximize the range of redox reaction (
Figure 16). Discharge into lower potential shows an additional plateau at about 0.8 V
versus standard AB
5 negative electrode, which may be related to the +1 oxidation state of Ni, as demonstrated in the literature [
21]. The combined number of electron-transfer per Ni atom may exceed 1 when properly activated (
Table 4).
Table 4.
Discharge specific capacity (Q) and the number of electrons transferred during the redox reaction per Ni atom (Ne) for the first 11 cycles for the Ni(OH)2 samples developed in the RANGE-BASF program. QControl, QS1, QS2 and QS3 are the discharge specific capacities of the control sample (Ni0.91Co0.045Zn0.045(OH)2), Sample 1 (Ni0.94Co0.06(OH)2), Sample 2 (Ni0.85Co0.05Al0.10(OH)2) and Sample 3 (Ni0.69Co0.05Zn0.06Al0.20(OH)2) for a discharge current density of 25 mA·g−1, respectively.
| Cycle number | 1 | 2 | 3 | 4 | 5 | 6 | 7 | 8 | 9 | 10 | 11 |
|---|
| QControl (mAh·g−1) | 150 | 180 | 198 | 215 | 228 | 235 | 240 | 243 | 240 | 244 | 238 |
| Ne | 0.59 | 0.71 | 0.78 | 0.85 | 0.90 | 0.93 | 0.95 | 0.96 | 0.95 | 0.97 | 0.94 |
| QS1 (mAh·g−1) | 95 | 119 | 141 | 139 | 148 | 149 | 163 | 143 | 245 | 423 | 343 |
| Ne | 0.36 | 0.45 | 0.54 | 0.53 | 0.56 | 0.57 | 0.62 | 0.55 | 0.93 | 1.61 | 1.31 |
| QS2 (mAh·g−1) | 172 | 216 | 238 | 234 | 243 | 270 | 335 | 635 | 599 | 463 | 259 |
| Ne | 0.69 | 0.86 | 0.95 | 0.94 | 0.97 | 1.08 | 1.34 | 2.54 | 2.39 | 1.85 | 1.03 |
| QS3 (mAh·g−1) | 152 | 175 | 190 | 223 | 379 | 530 | 426 | 365 | 329 | 296 | 236 |
| Ne | 0.71 | 0.82 | 0.89 | 1.04 | 1.77 | 2.48 | 1.99 | 1.70 | 1.54 | 1.38 | 1.10 |
2.4. Cell Assembly
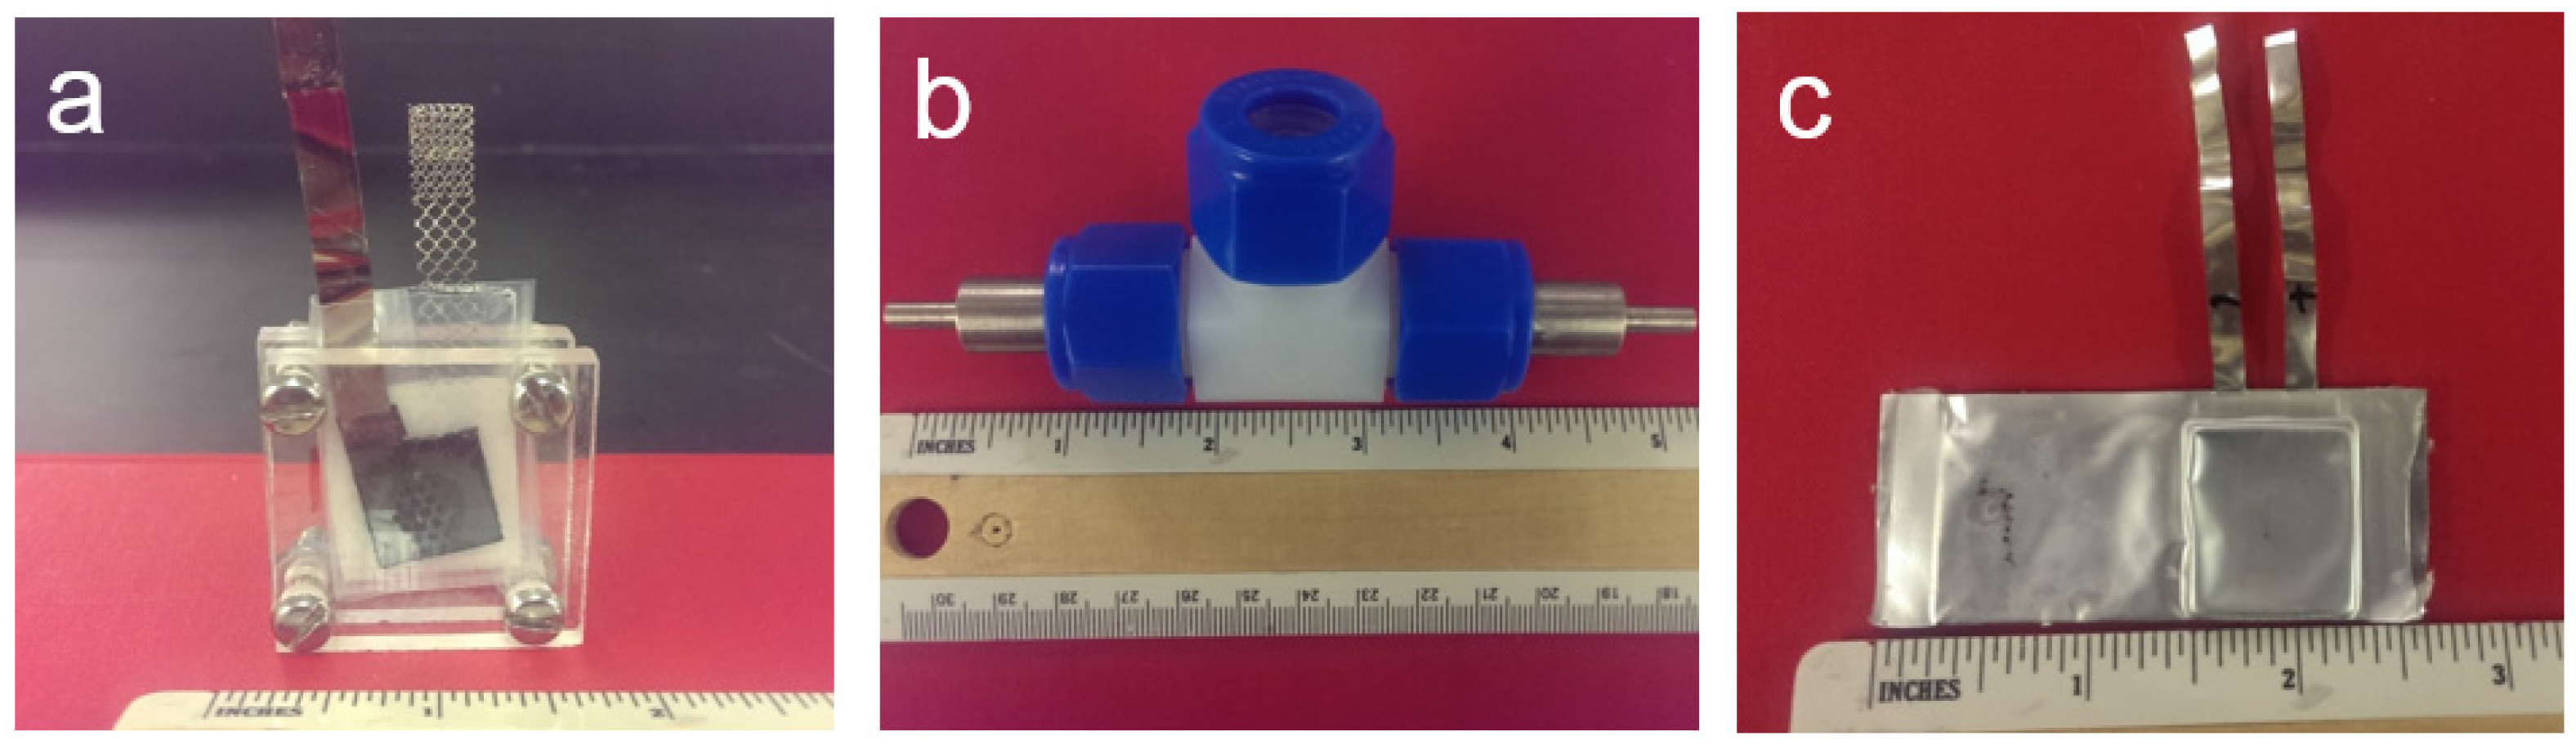
Three types of test fixtures were used in the RANGE-BASF program. The first one is a conventional open-air flooded half-cell plastic bag with two or three terminals sandwiched between two pieces of acrylic plates (
Figure 23a). The second is a sealed three-terminal Swagelok T-type cell (
Figure 23b). The third port (top) can be connected to a reference electrode, a pressure relief value, or a pressure transducer. The third one is a sealed pouch-type full-cell that uses the same materials as those used in the Li-ion pouch cell (
Figure 23c).
Figure 23.
Pictures of a: (a) flooded half-cell; (b) swagelok sealed half-cell; and (c) sealed pouch cell.
Figure 23.
Pictures of a: (a) flooded half-cell; (b) swagelok sealed half-cell; and (c) sealed pouch cell.
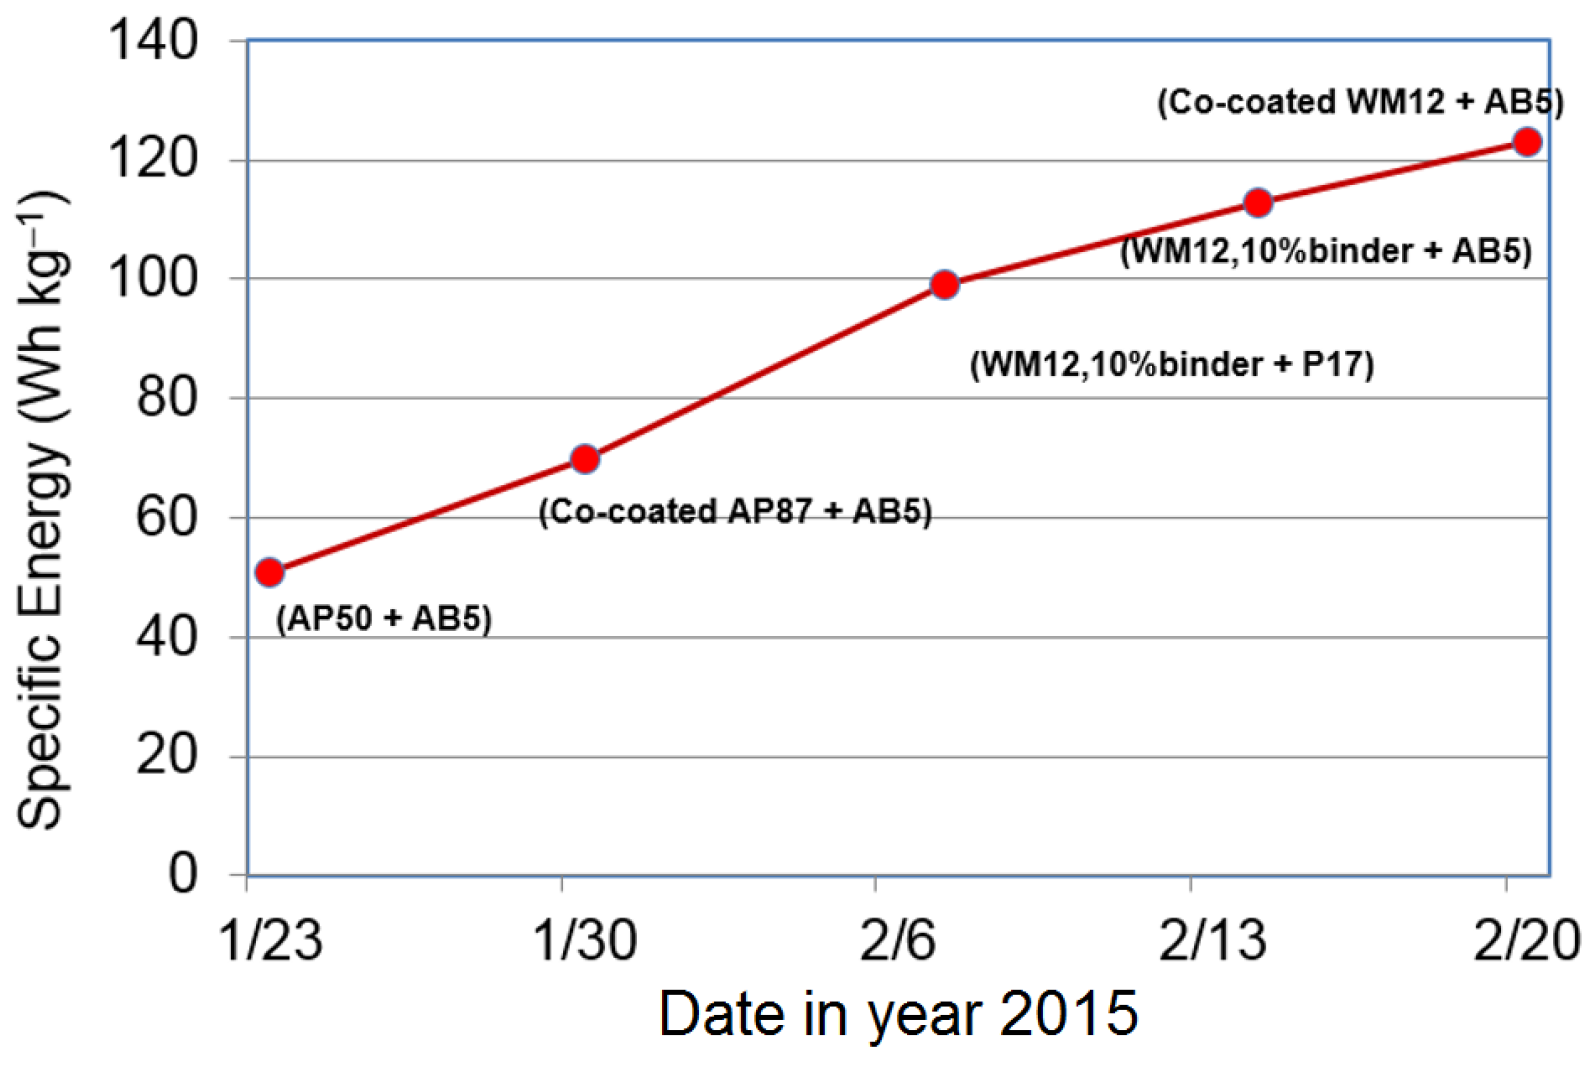
The Ni/MH pouch cell has the advantage of easy fabrication and high specific energy density [
20]. The development of the pouch cell took about a month, and a cell with a specific energy of 127 Wh·kg
−1 was developed in the end with a conventional AB
5 MH alloy and newly developed WM12 active materials (
Figure 24).
Figure 24.
Development timeline of sealed pouch cell showing improvement in the specific energy density from 1 January to 20 February 2015 in BASF-Ovonic.
Figure 24.
Development timeline of sealed pouch cell showing improvement in the specific energy density from 1 January to 20 February 2015 in BASF-Ovonic.
After applying the newly developed P37 MH alloy, we expect a specific energy of 145 Wh·kg
−1 can be realized in a 100-Ah pouch-type Ni/MH battery (
Table 5).
Table 5.
Design of a 100 Ah pouch-type Ni/MH battery with the cell dimension of 20 × 12 × 1.8 cm3 and an N/P ratio of 1.2. Total cell weight is 826 g and the projected gravimetric and volumetric energy densities are 145 Wh·kg−1 and 278 Wh·L−1, respectively.
Table 5.
Design of a 100 Ah pouch-type Ni/MH battery with the cell dimension of 20 × 12 × 1.8 cm3 and an N/P ratio of 1.2. Total cell weight is 826 g and the projected gravimetric and volumetric energy densities are 145 Wh·kg−1 and 278 Wh·L−1, respectively.
| Cell component | Active weight (g) | Additives weight (g) | Substrates weight (g) | Total weight (g) | Area (cm2) |
|---|
| Positive electrode | 303 | 34 | 69 | 406 | 1060 |
| Negative electrode | 316 | 0 | 23 | 339 | 1060 |
| Separator | - | - | - | 13 | - |
| Ni-tab | - | - | - | 4 | - |
| Electrolyte | - | - | - | 52 | - |
| Pouch (Al foil) | - | - | - | 12 | - |


