
Innovative Early Detection of High-Temperature Abuse of Prismatic Cells and Post-Abuse Degradation Analysis Using Pressure and External Fiber Bragg Grating Sensors

 , , , and
Abstract
:1. Introduction
2. Materials and Methods
2.1. The Device under Test
2.2. Thermal Abuse Conditions
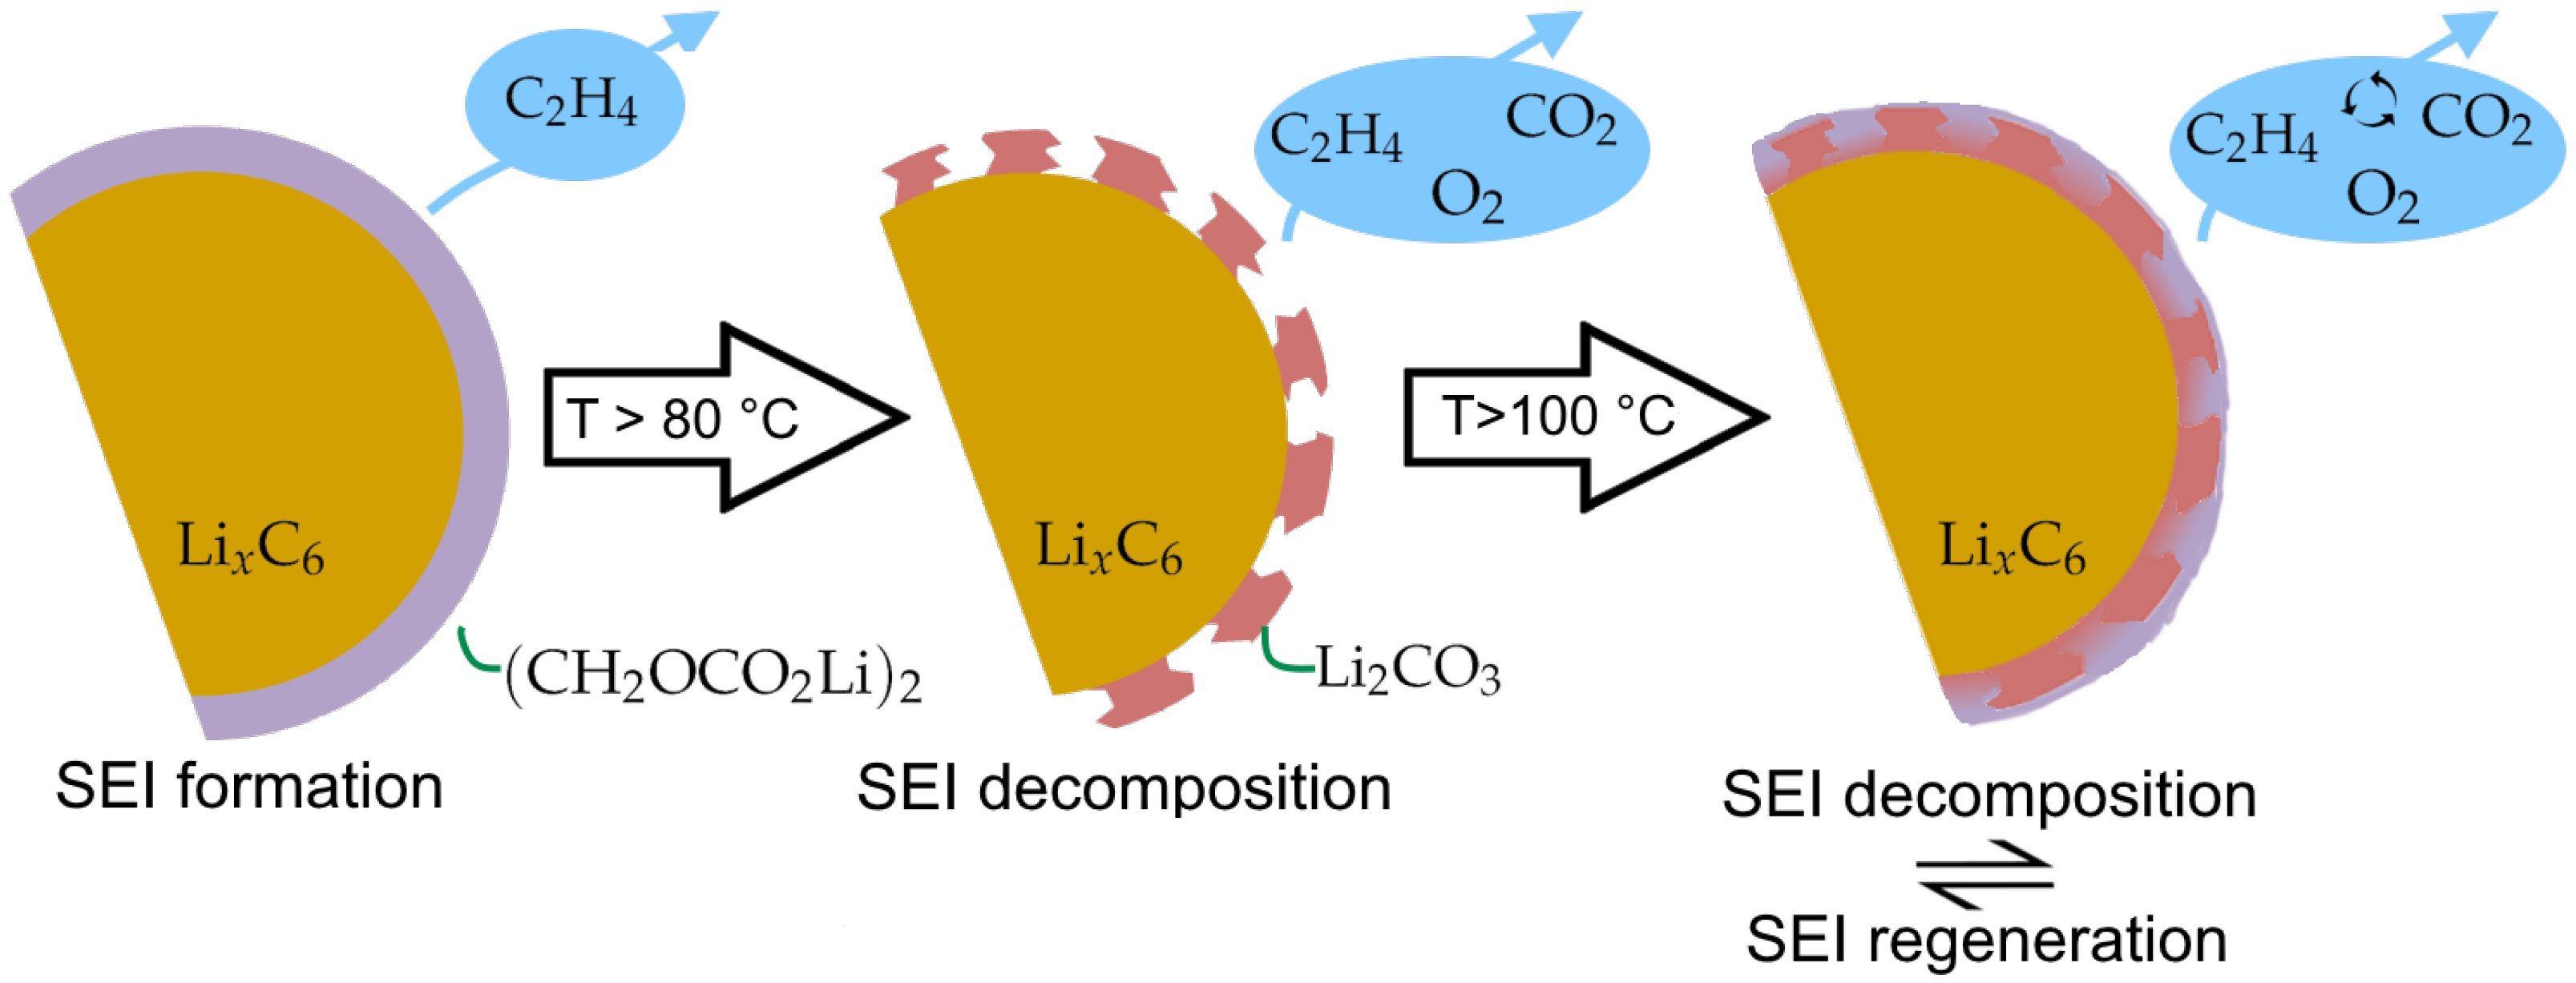
- Since the SEI layer is conductive for lithium ions, and with the tunneling effect for electrons, a new metastable SEI layer can be formed on already existing inorganic SEI [52].
2.3. Sensors
2.3.1. Pressure Sensor
- It provides easy access to the opening without the need for drilling, which could introduce metal shavings into the cell and potentially cause an internal short circuit.
- Remaining uncovered, the rupture disc of the cell preserves its functionality, thus enabling the authentic behavior that is crucial to the FBG sensor.
- The electrolyte does not flow into the measurement block because of its position on top of the cell, thereby ensuring that the electrochemical properties of the cell remain unchanged.
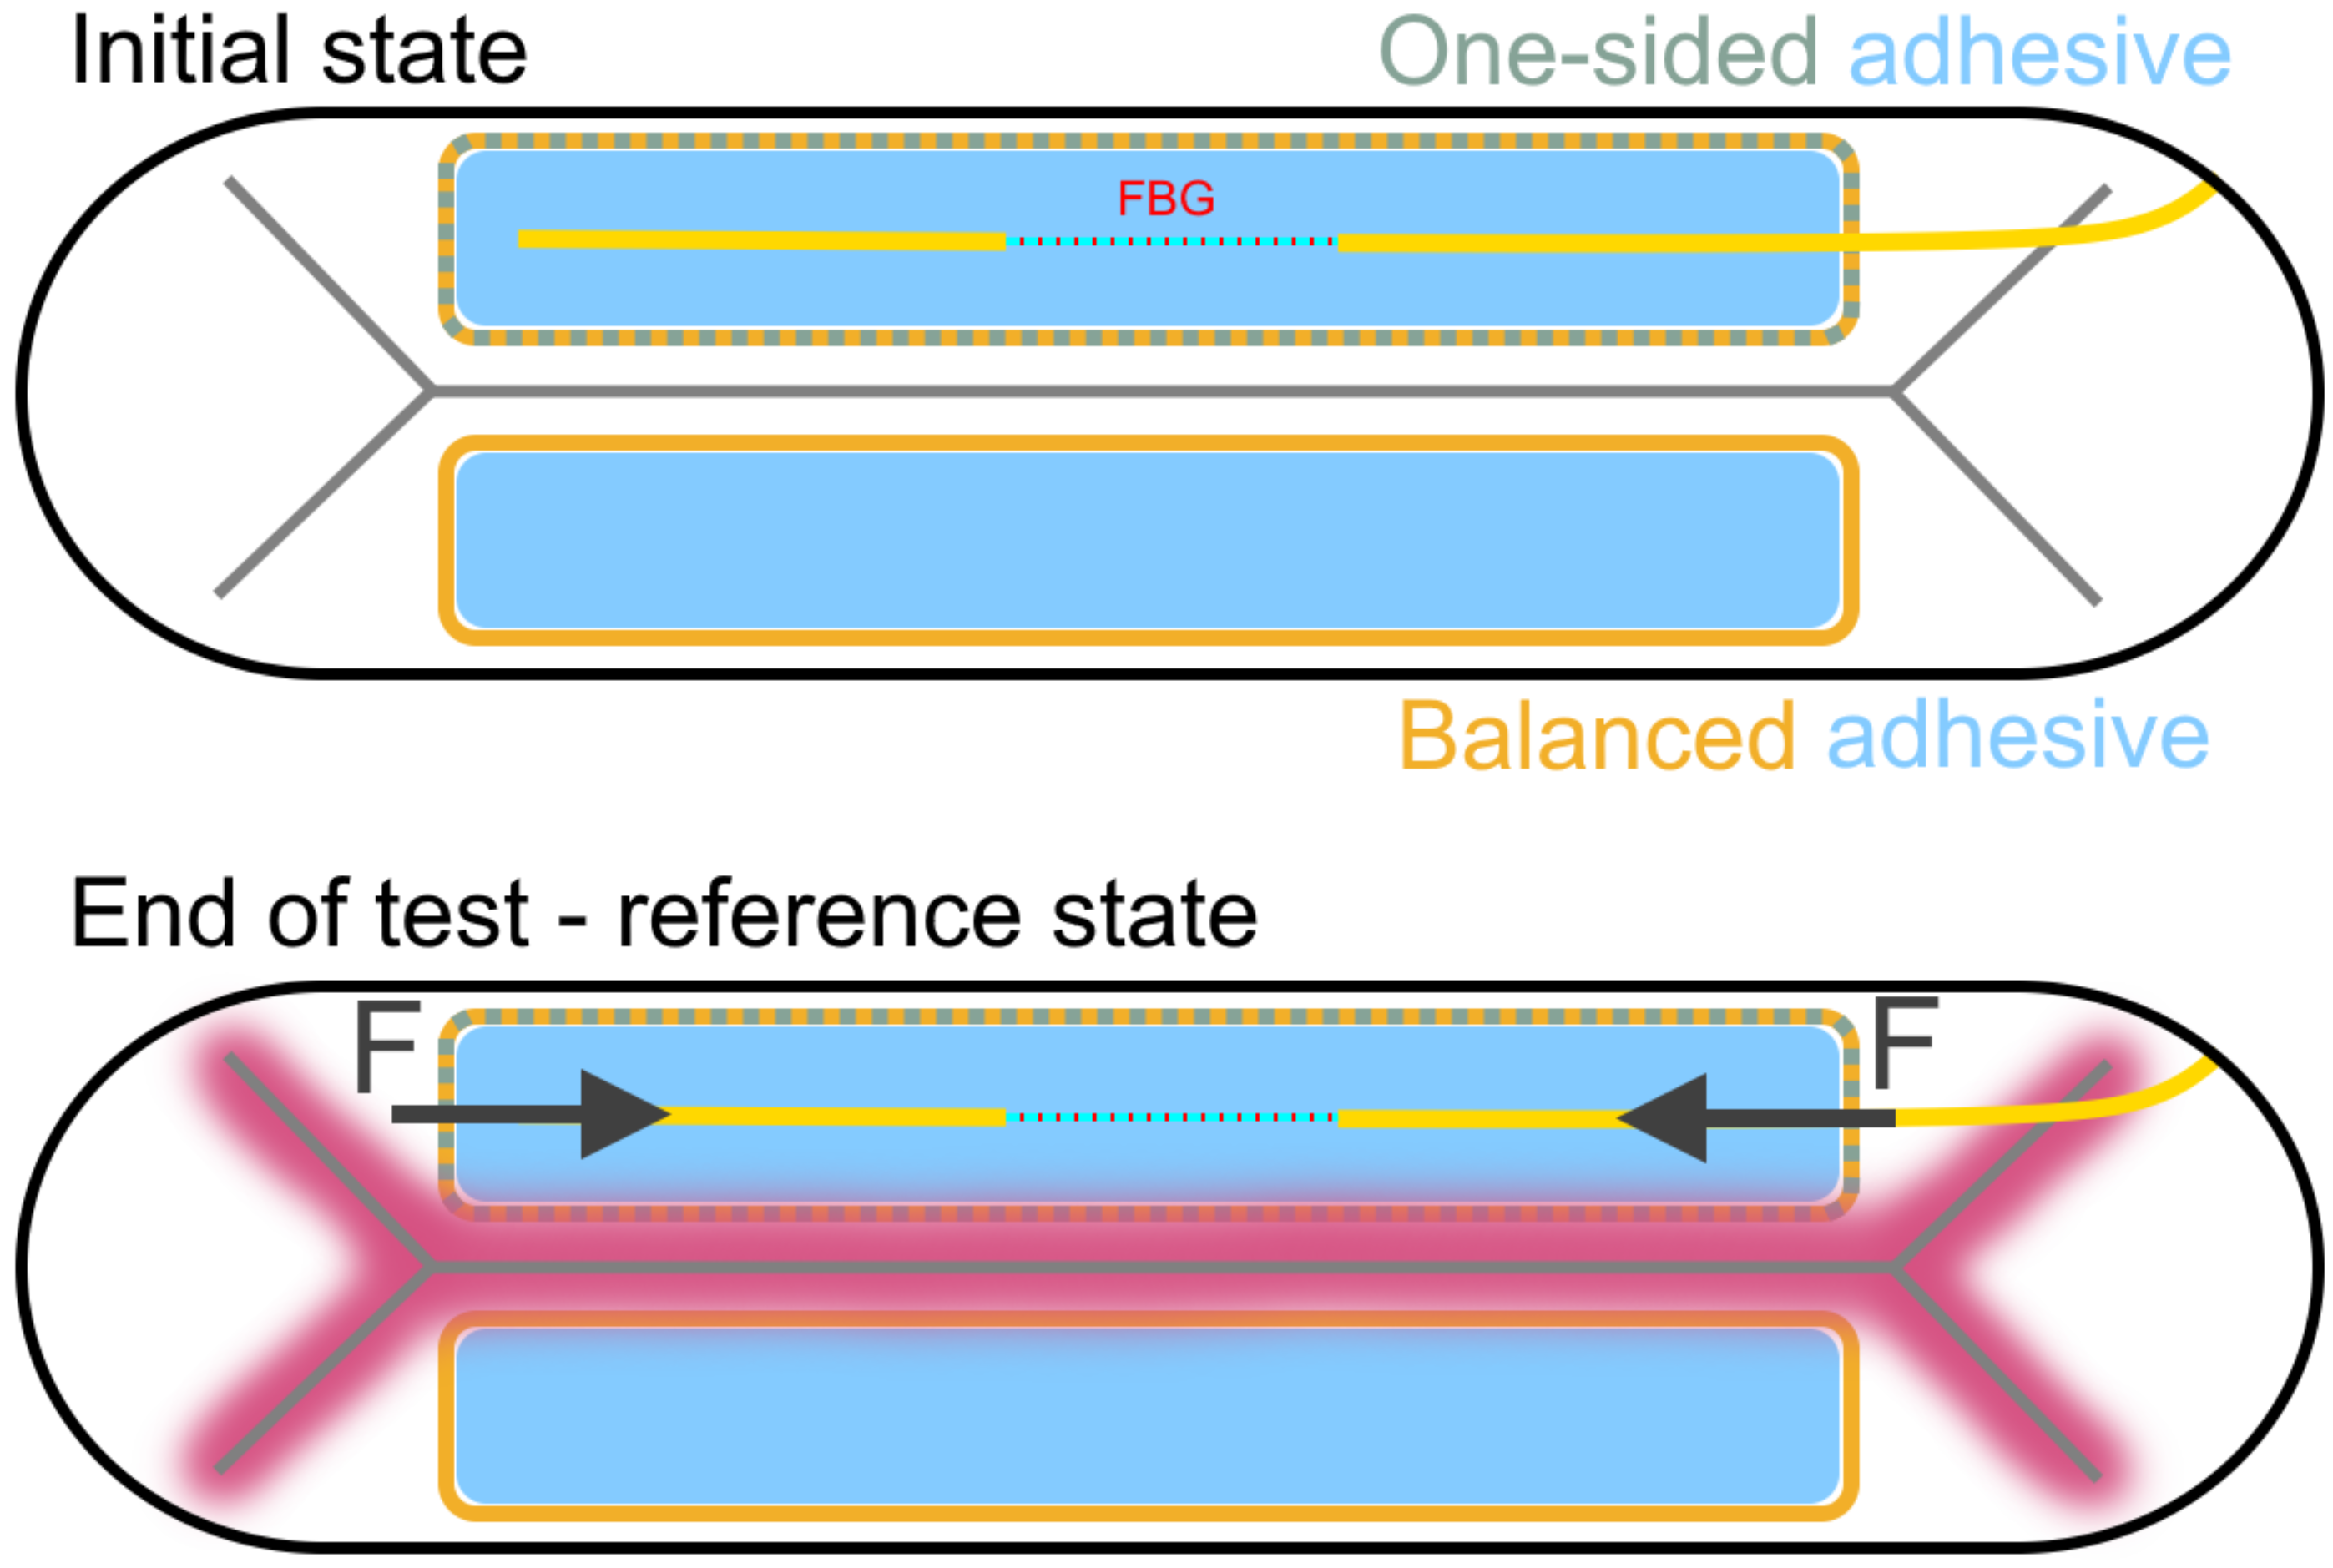
2.3.2. Fiber Bragg Grating Sensor
2.4. Experimental Method
- Hold voltage at 3.95 V for 4 h once the reference temperature of 25 °C is reached;
- GEIS at 5 A from 5 kHz to 10 mHz for 10 sine periods;
- Rest 1 h;
- Capacity check at 1 C (2×)
- (a)
- Discharge at 1 C until 3 V;
- (b)
- Rest 1 h;
- (c)
- Charge at 1 C until 4.2 V;
- (d)
- Hold voltage 4.2 V until C-rate drops to 0.05 C;
- (e)
- Rest 1 h.
- Discharge at 1 C to the desired 80% SOC;
- Rest 1 h;
- GEIS at 5 A from 5 kHz to 10 mHz for 10 sine periods;
- Hold voltage at 3.95 V during the next high-temperature phase.
3. Results and Discussion
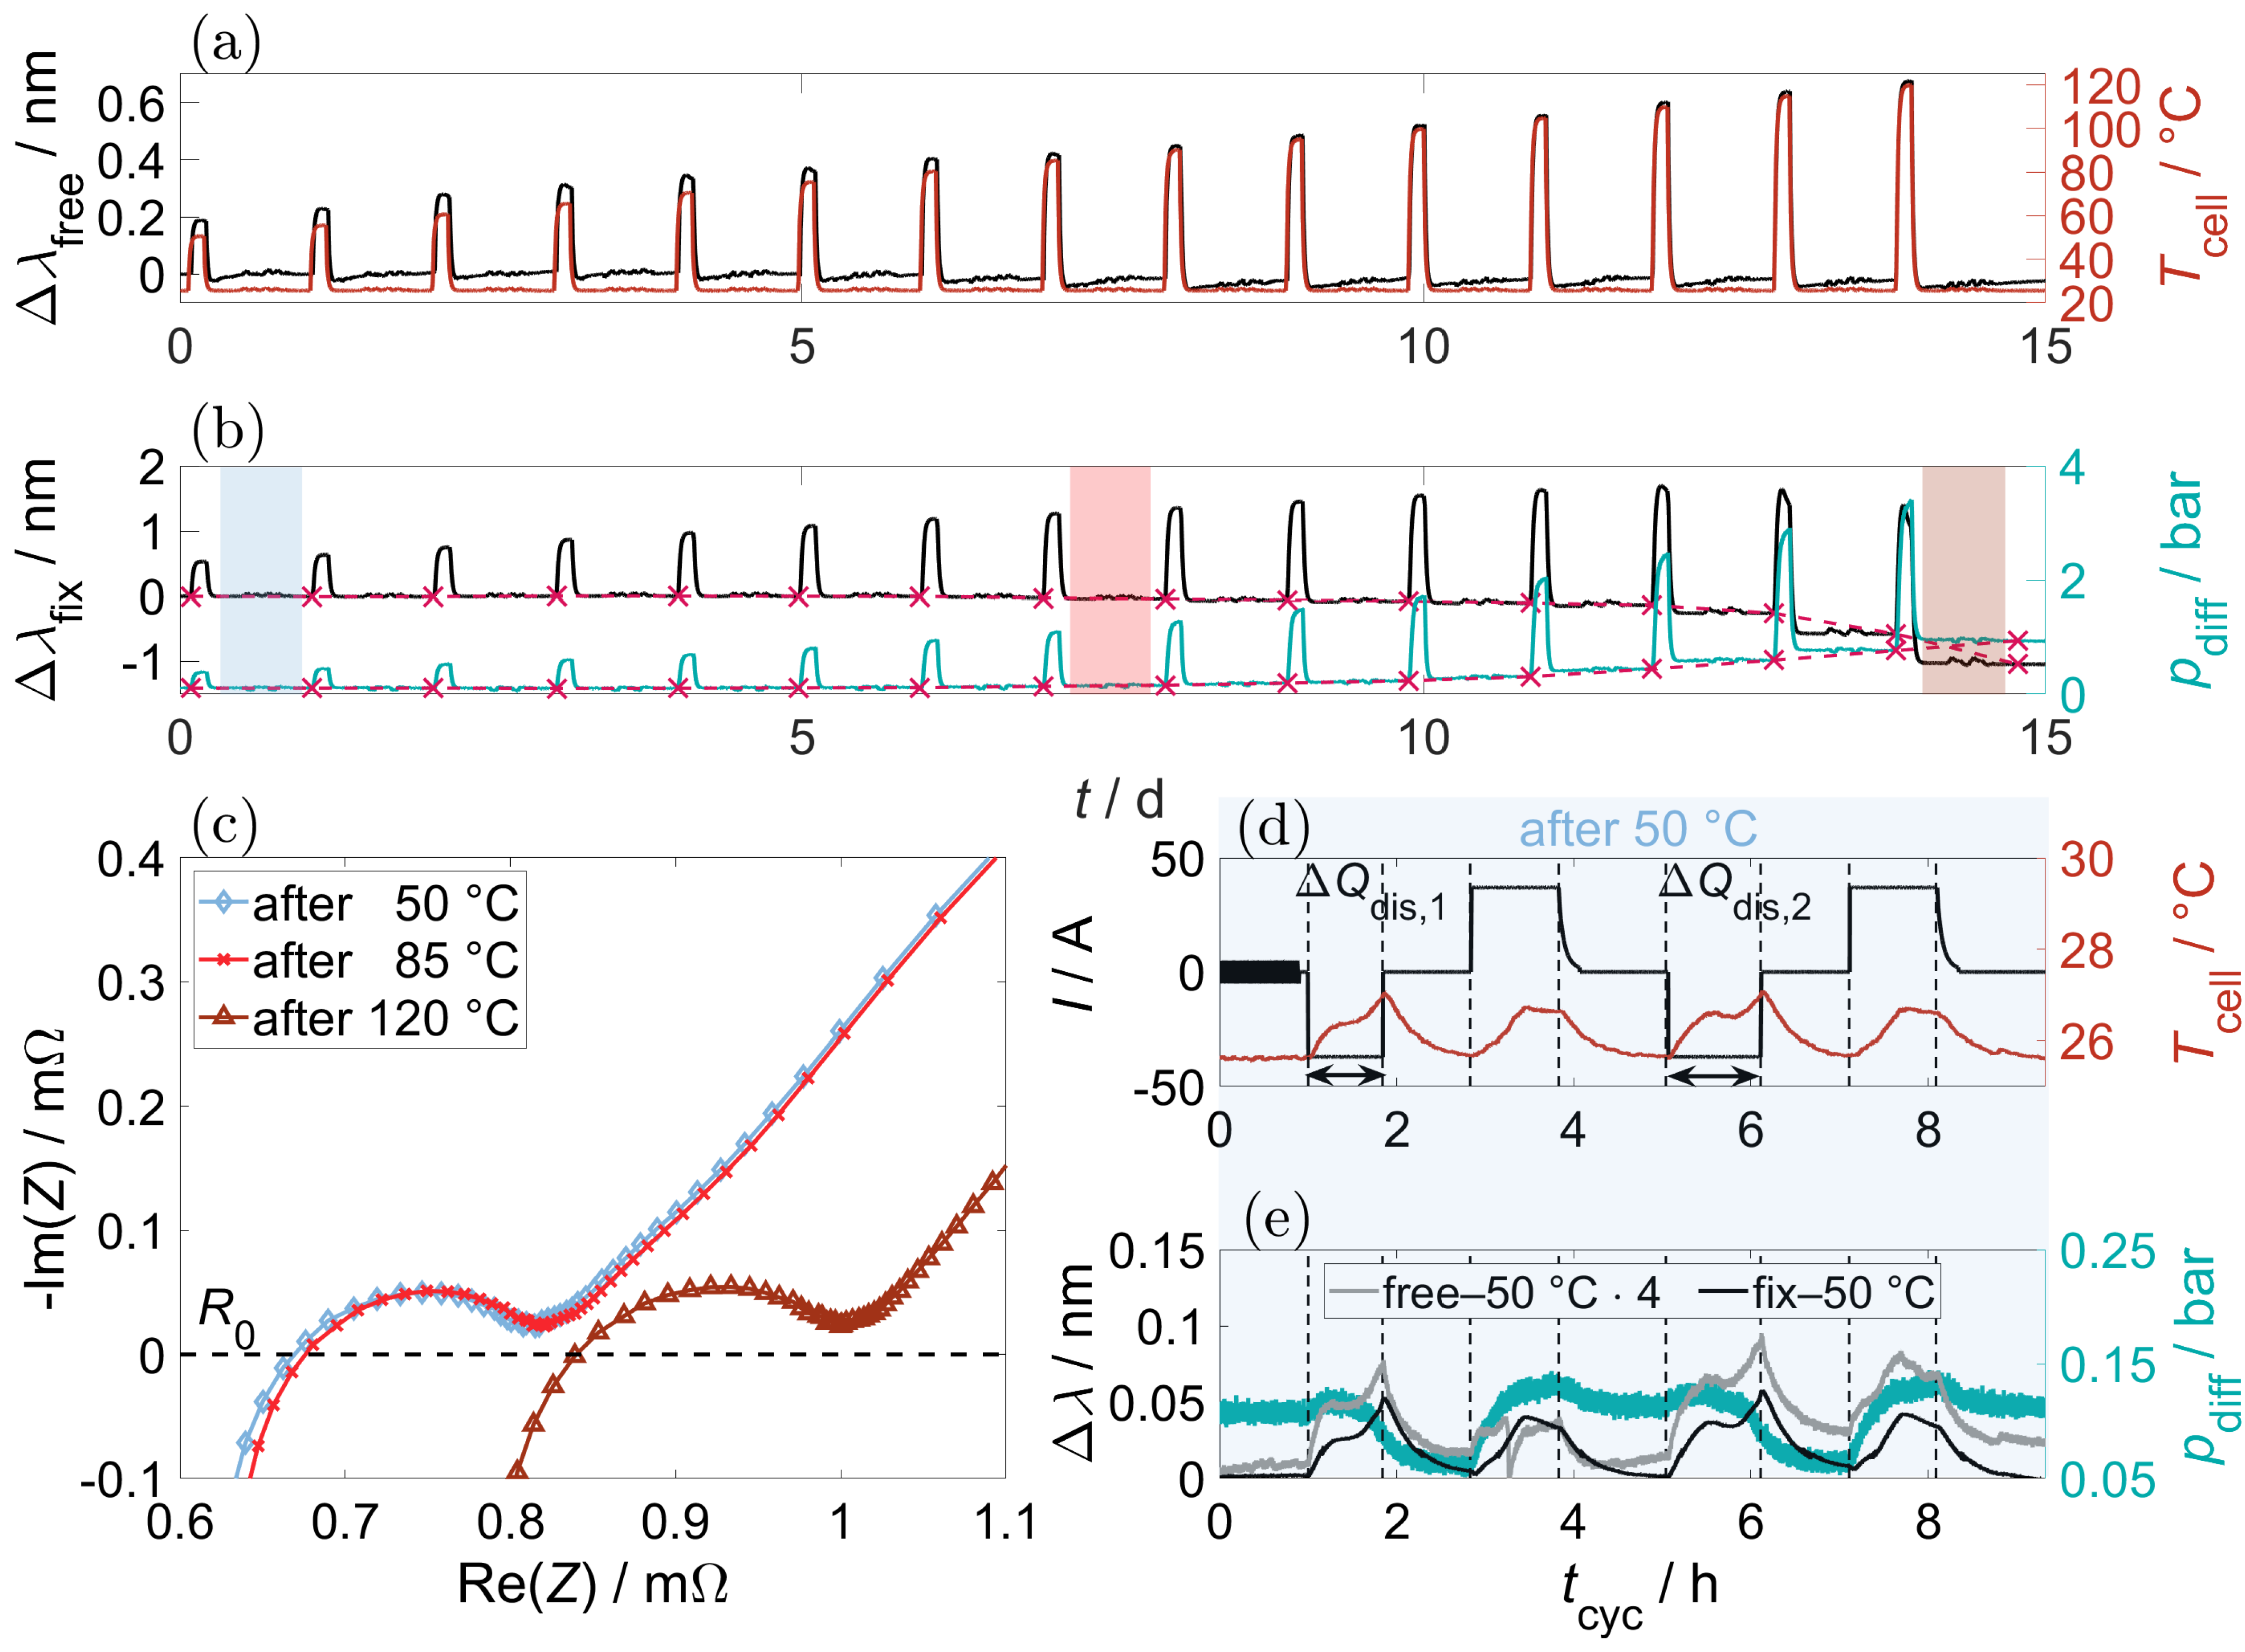
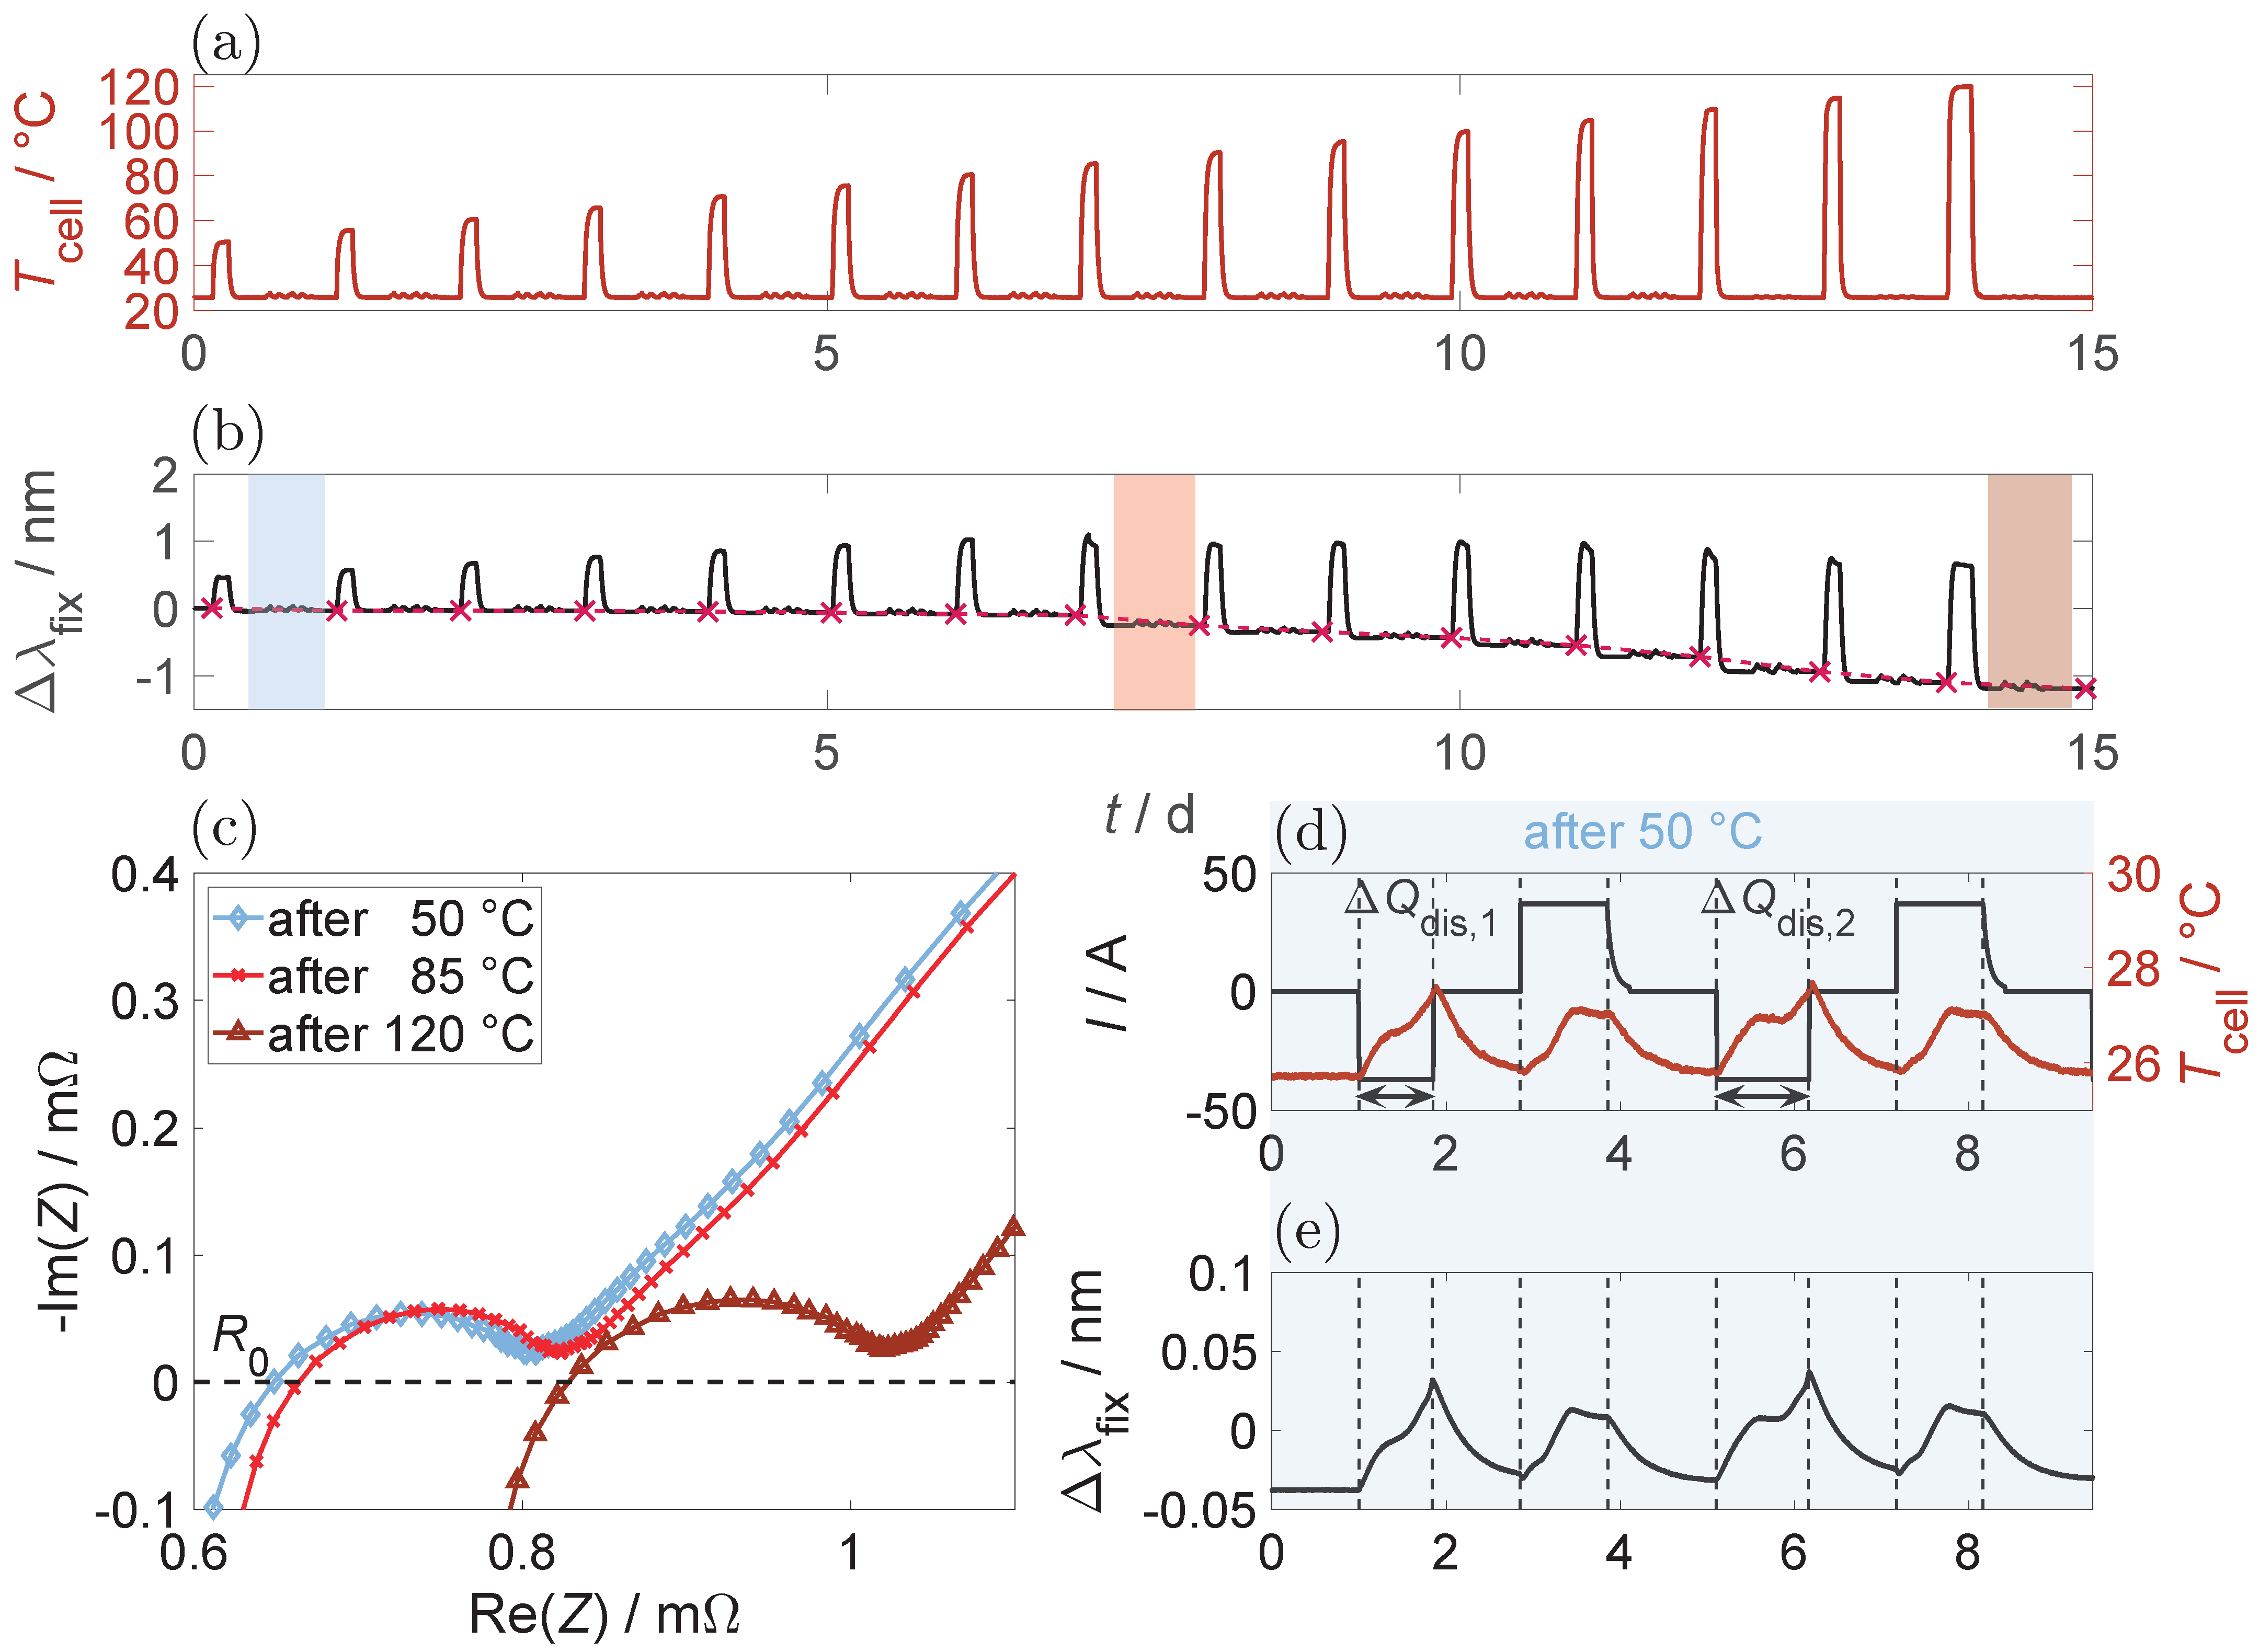
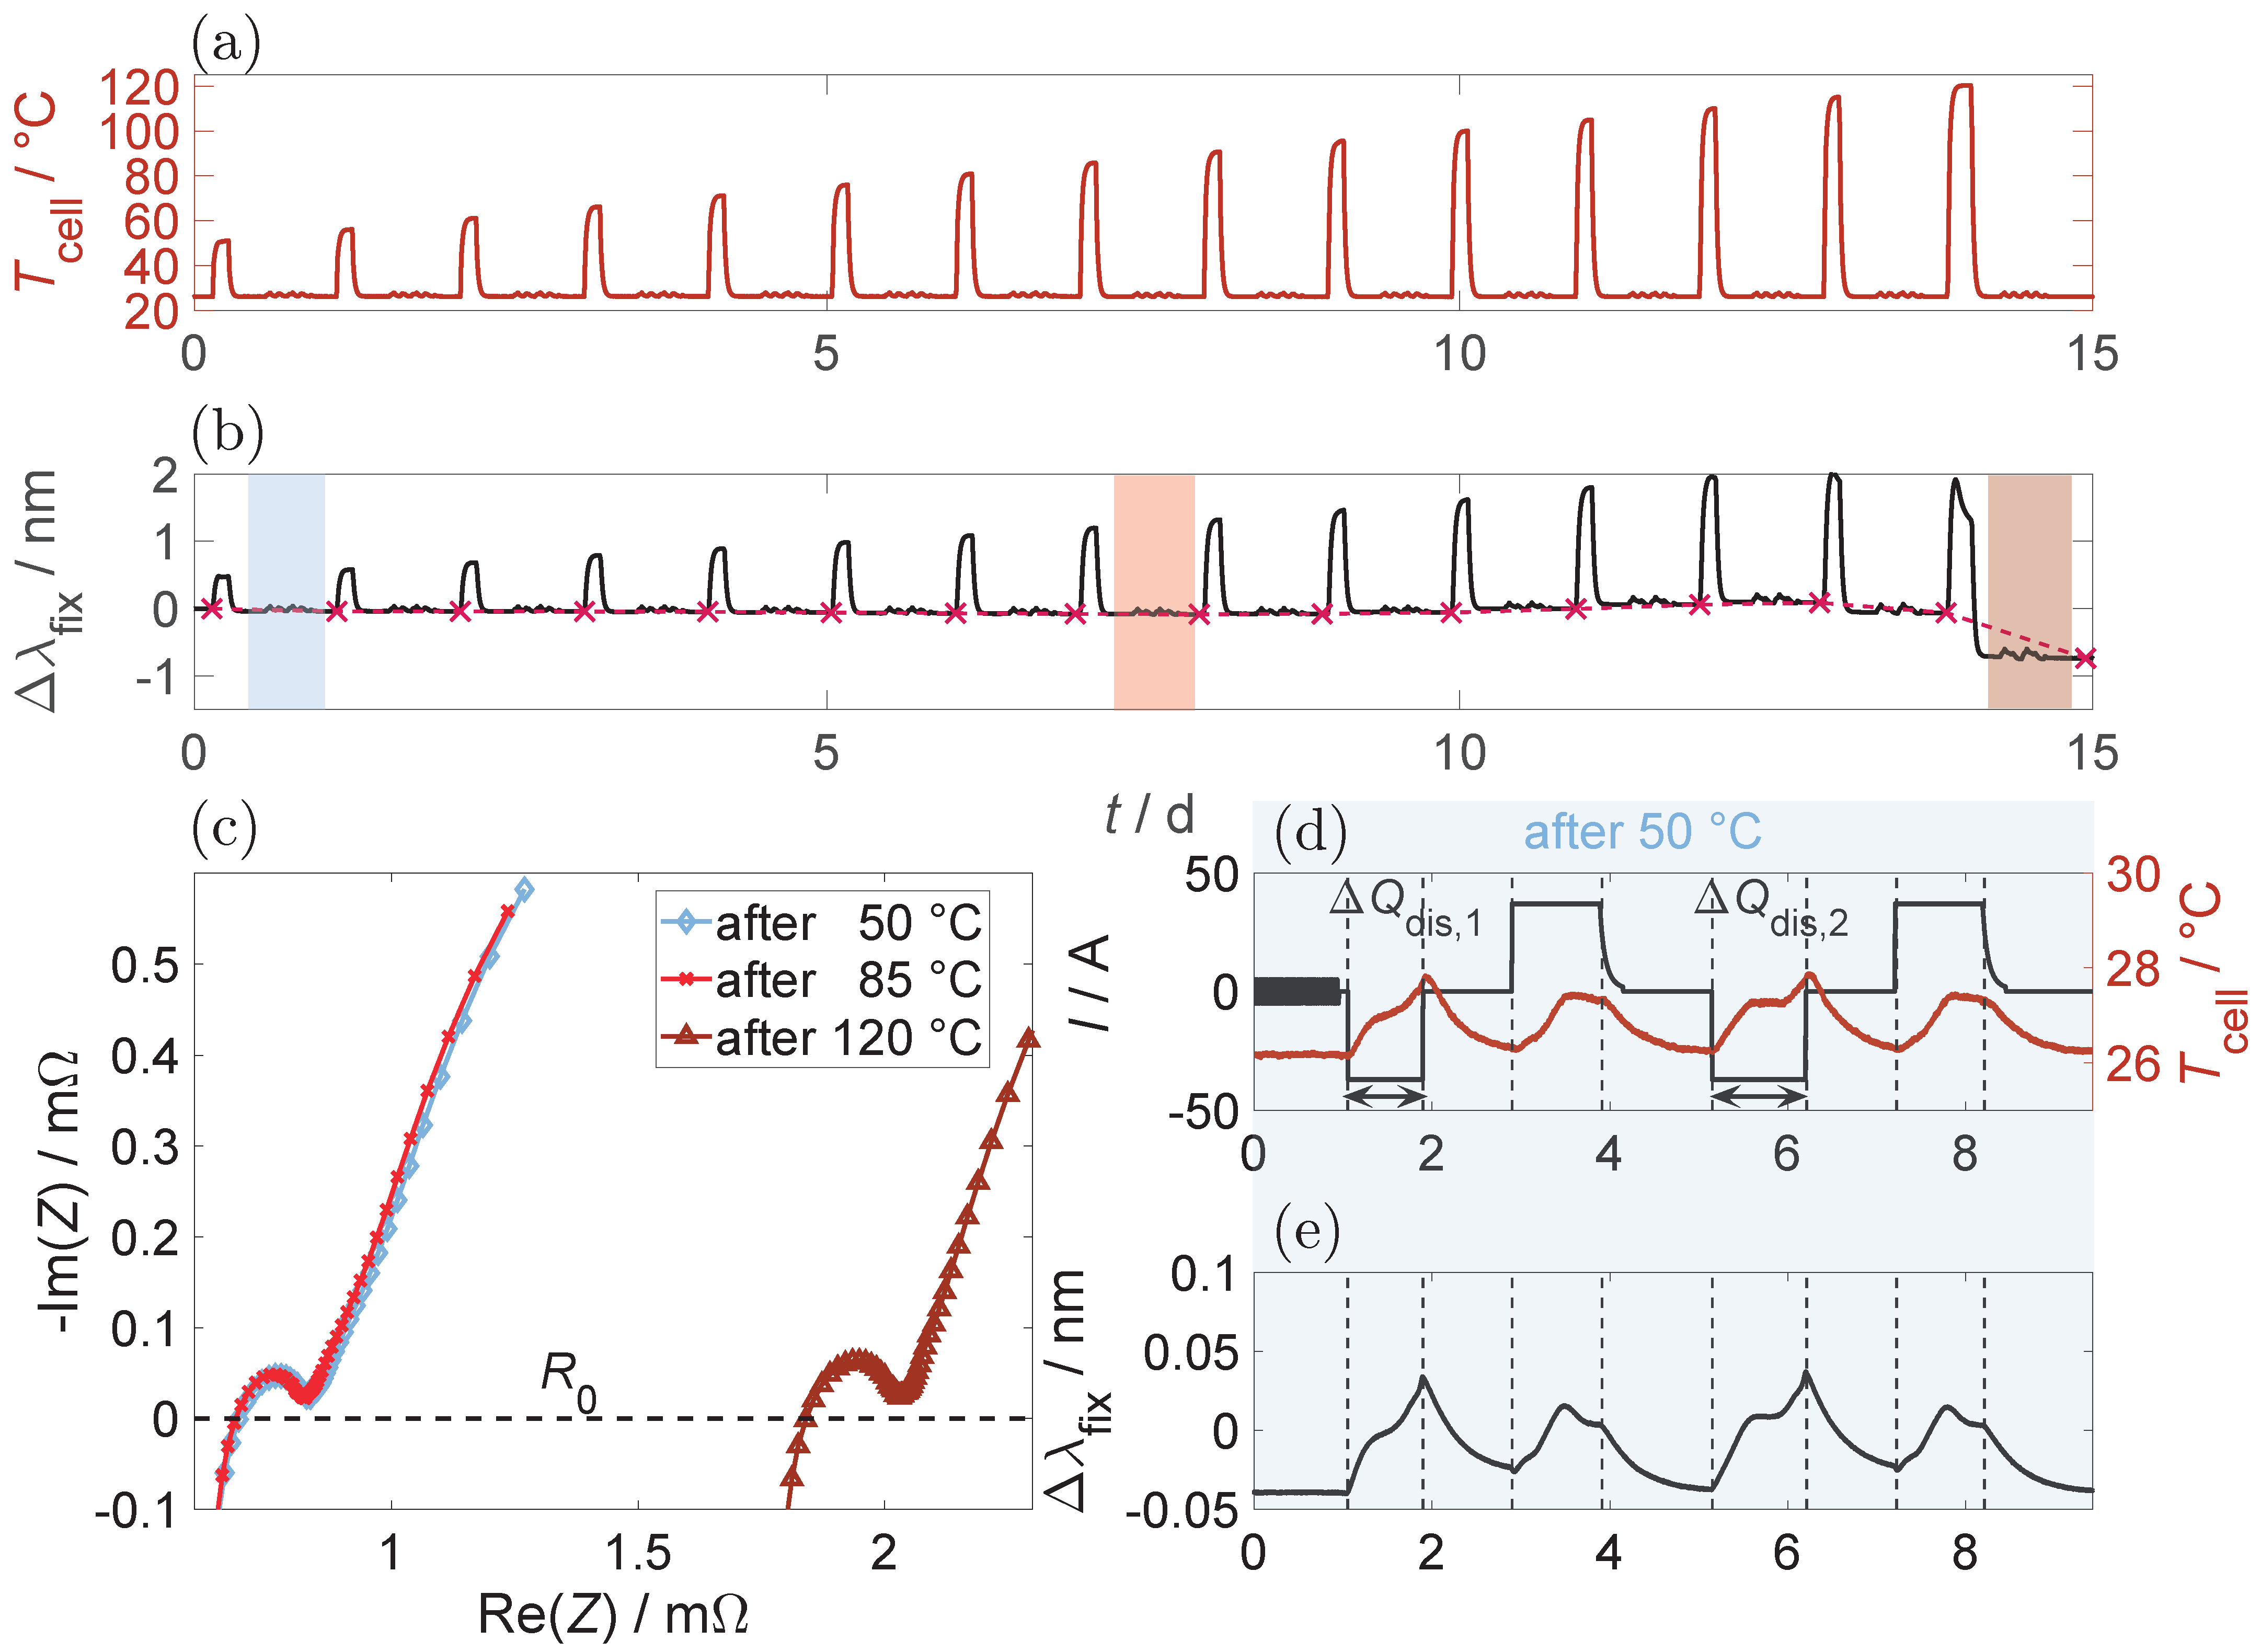
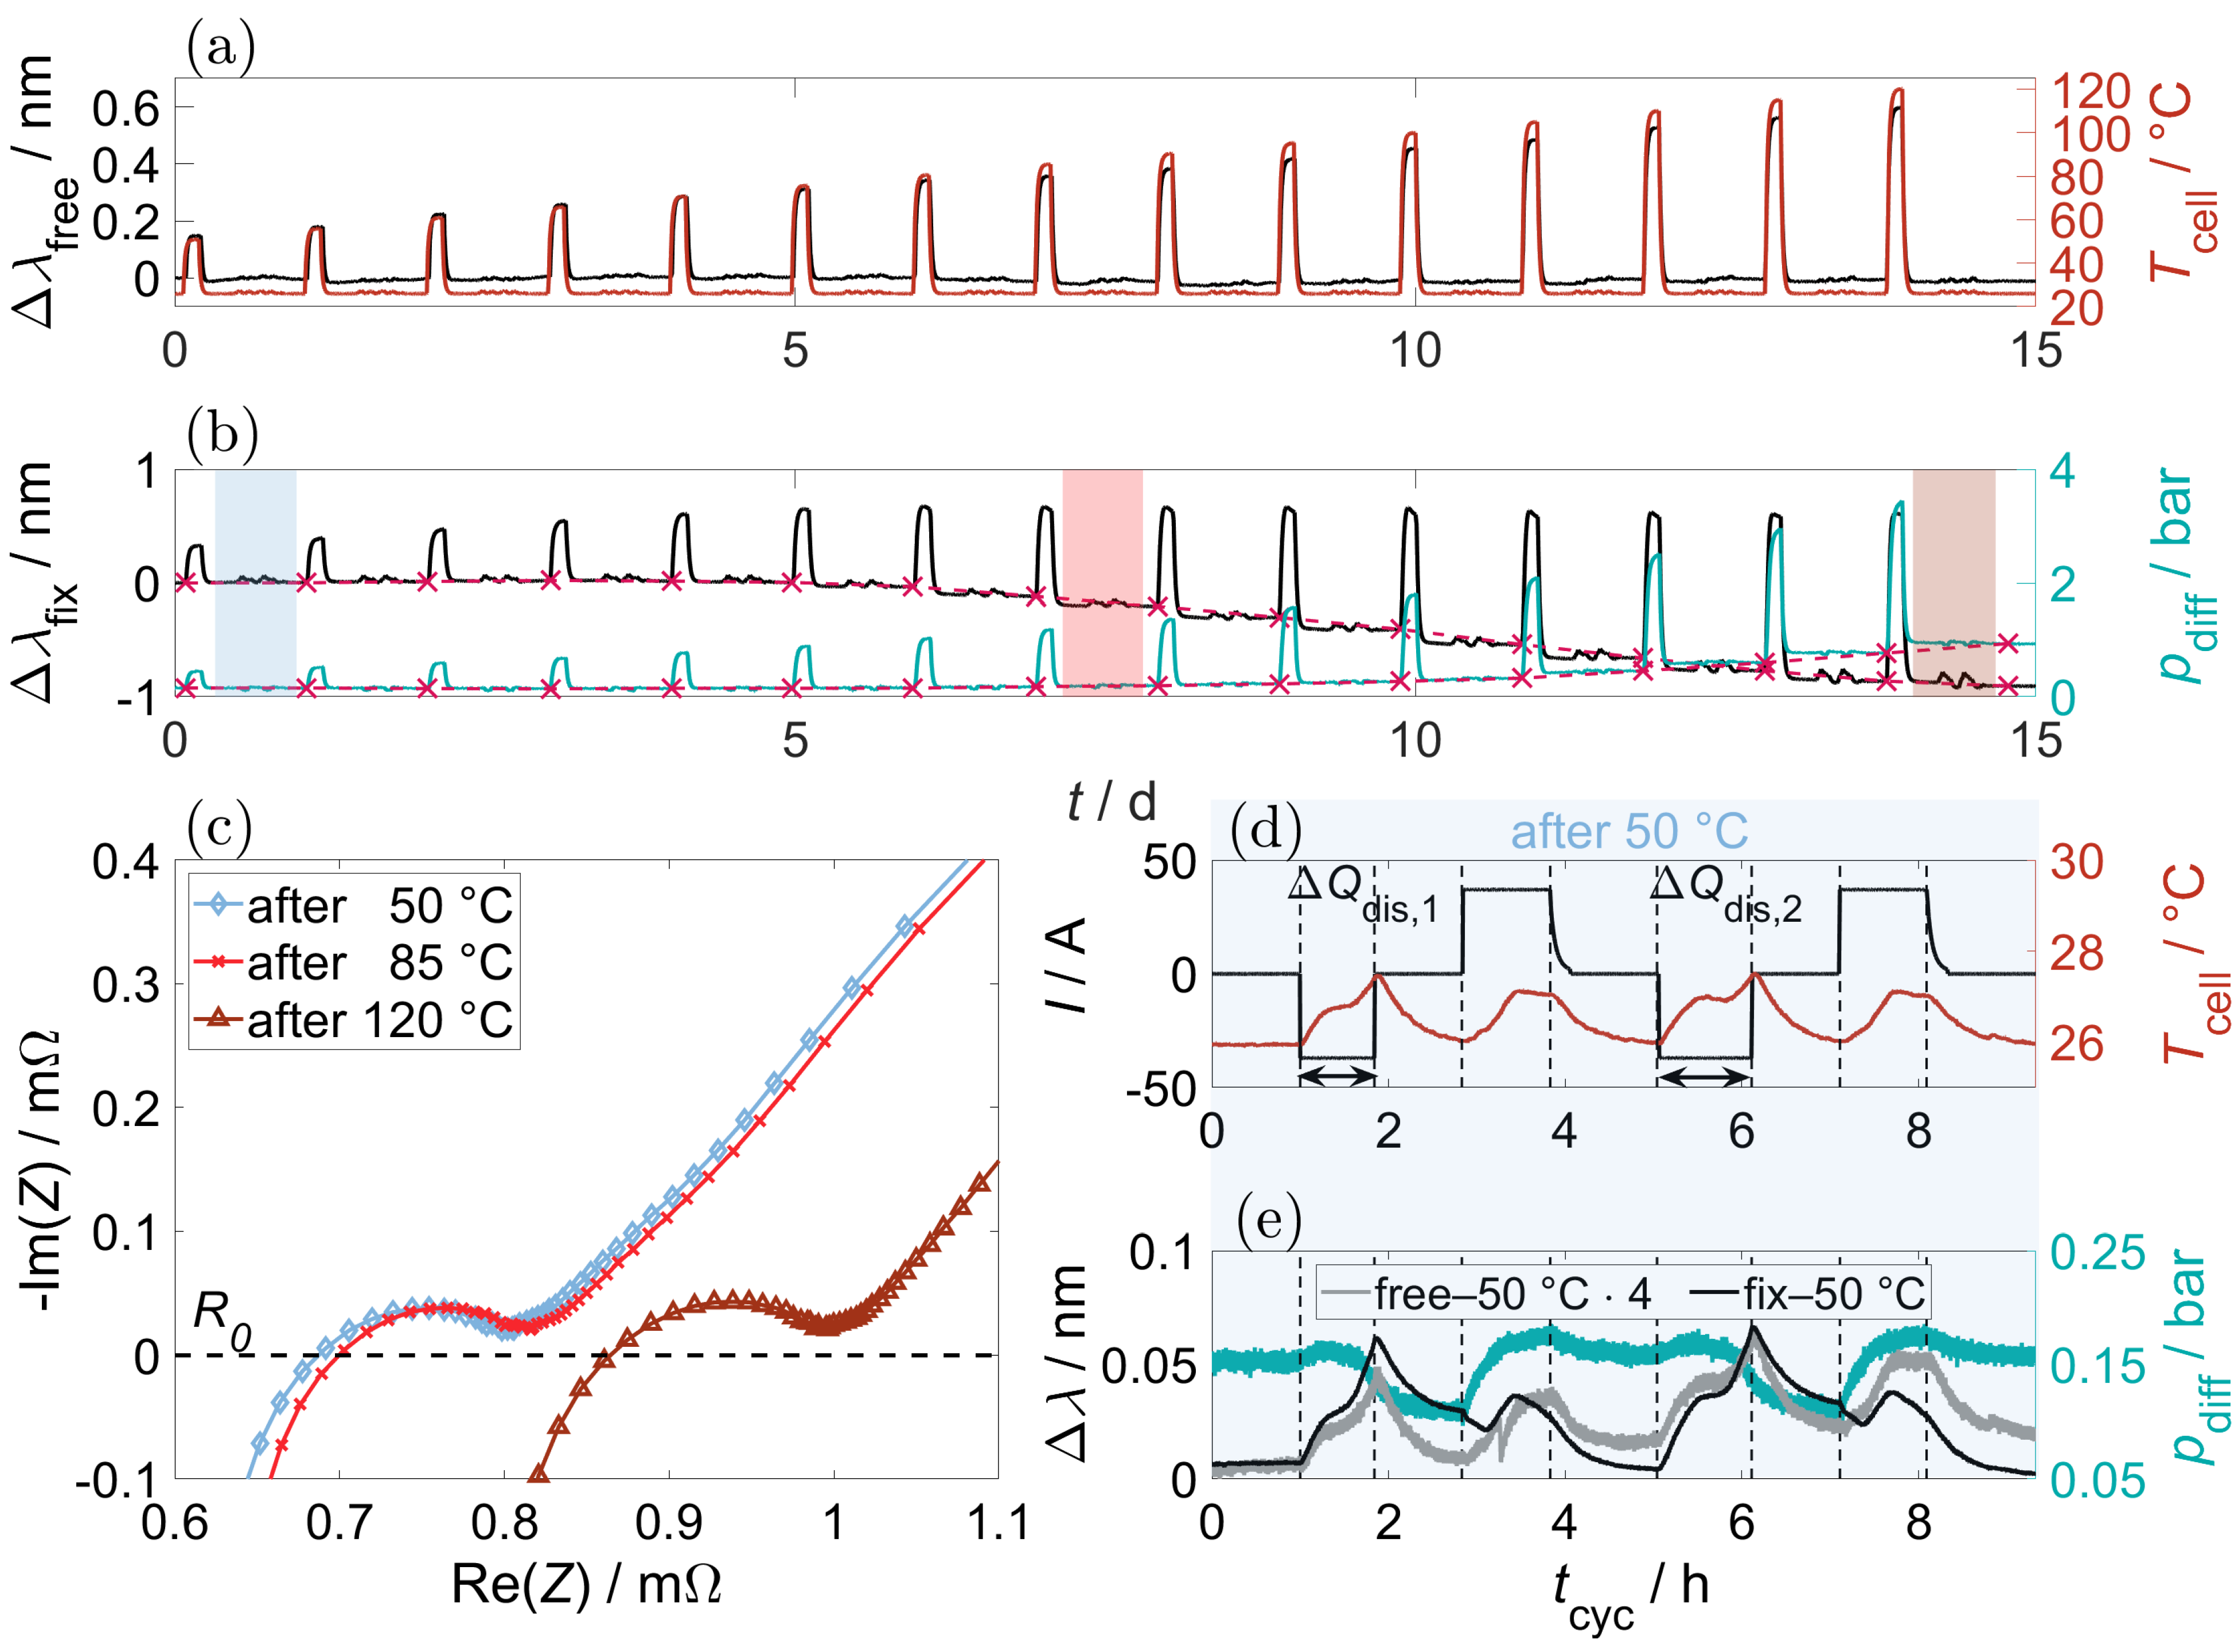
3.1. State Development during Thermal Degradation
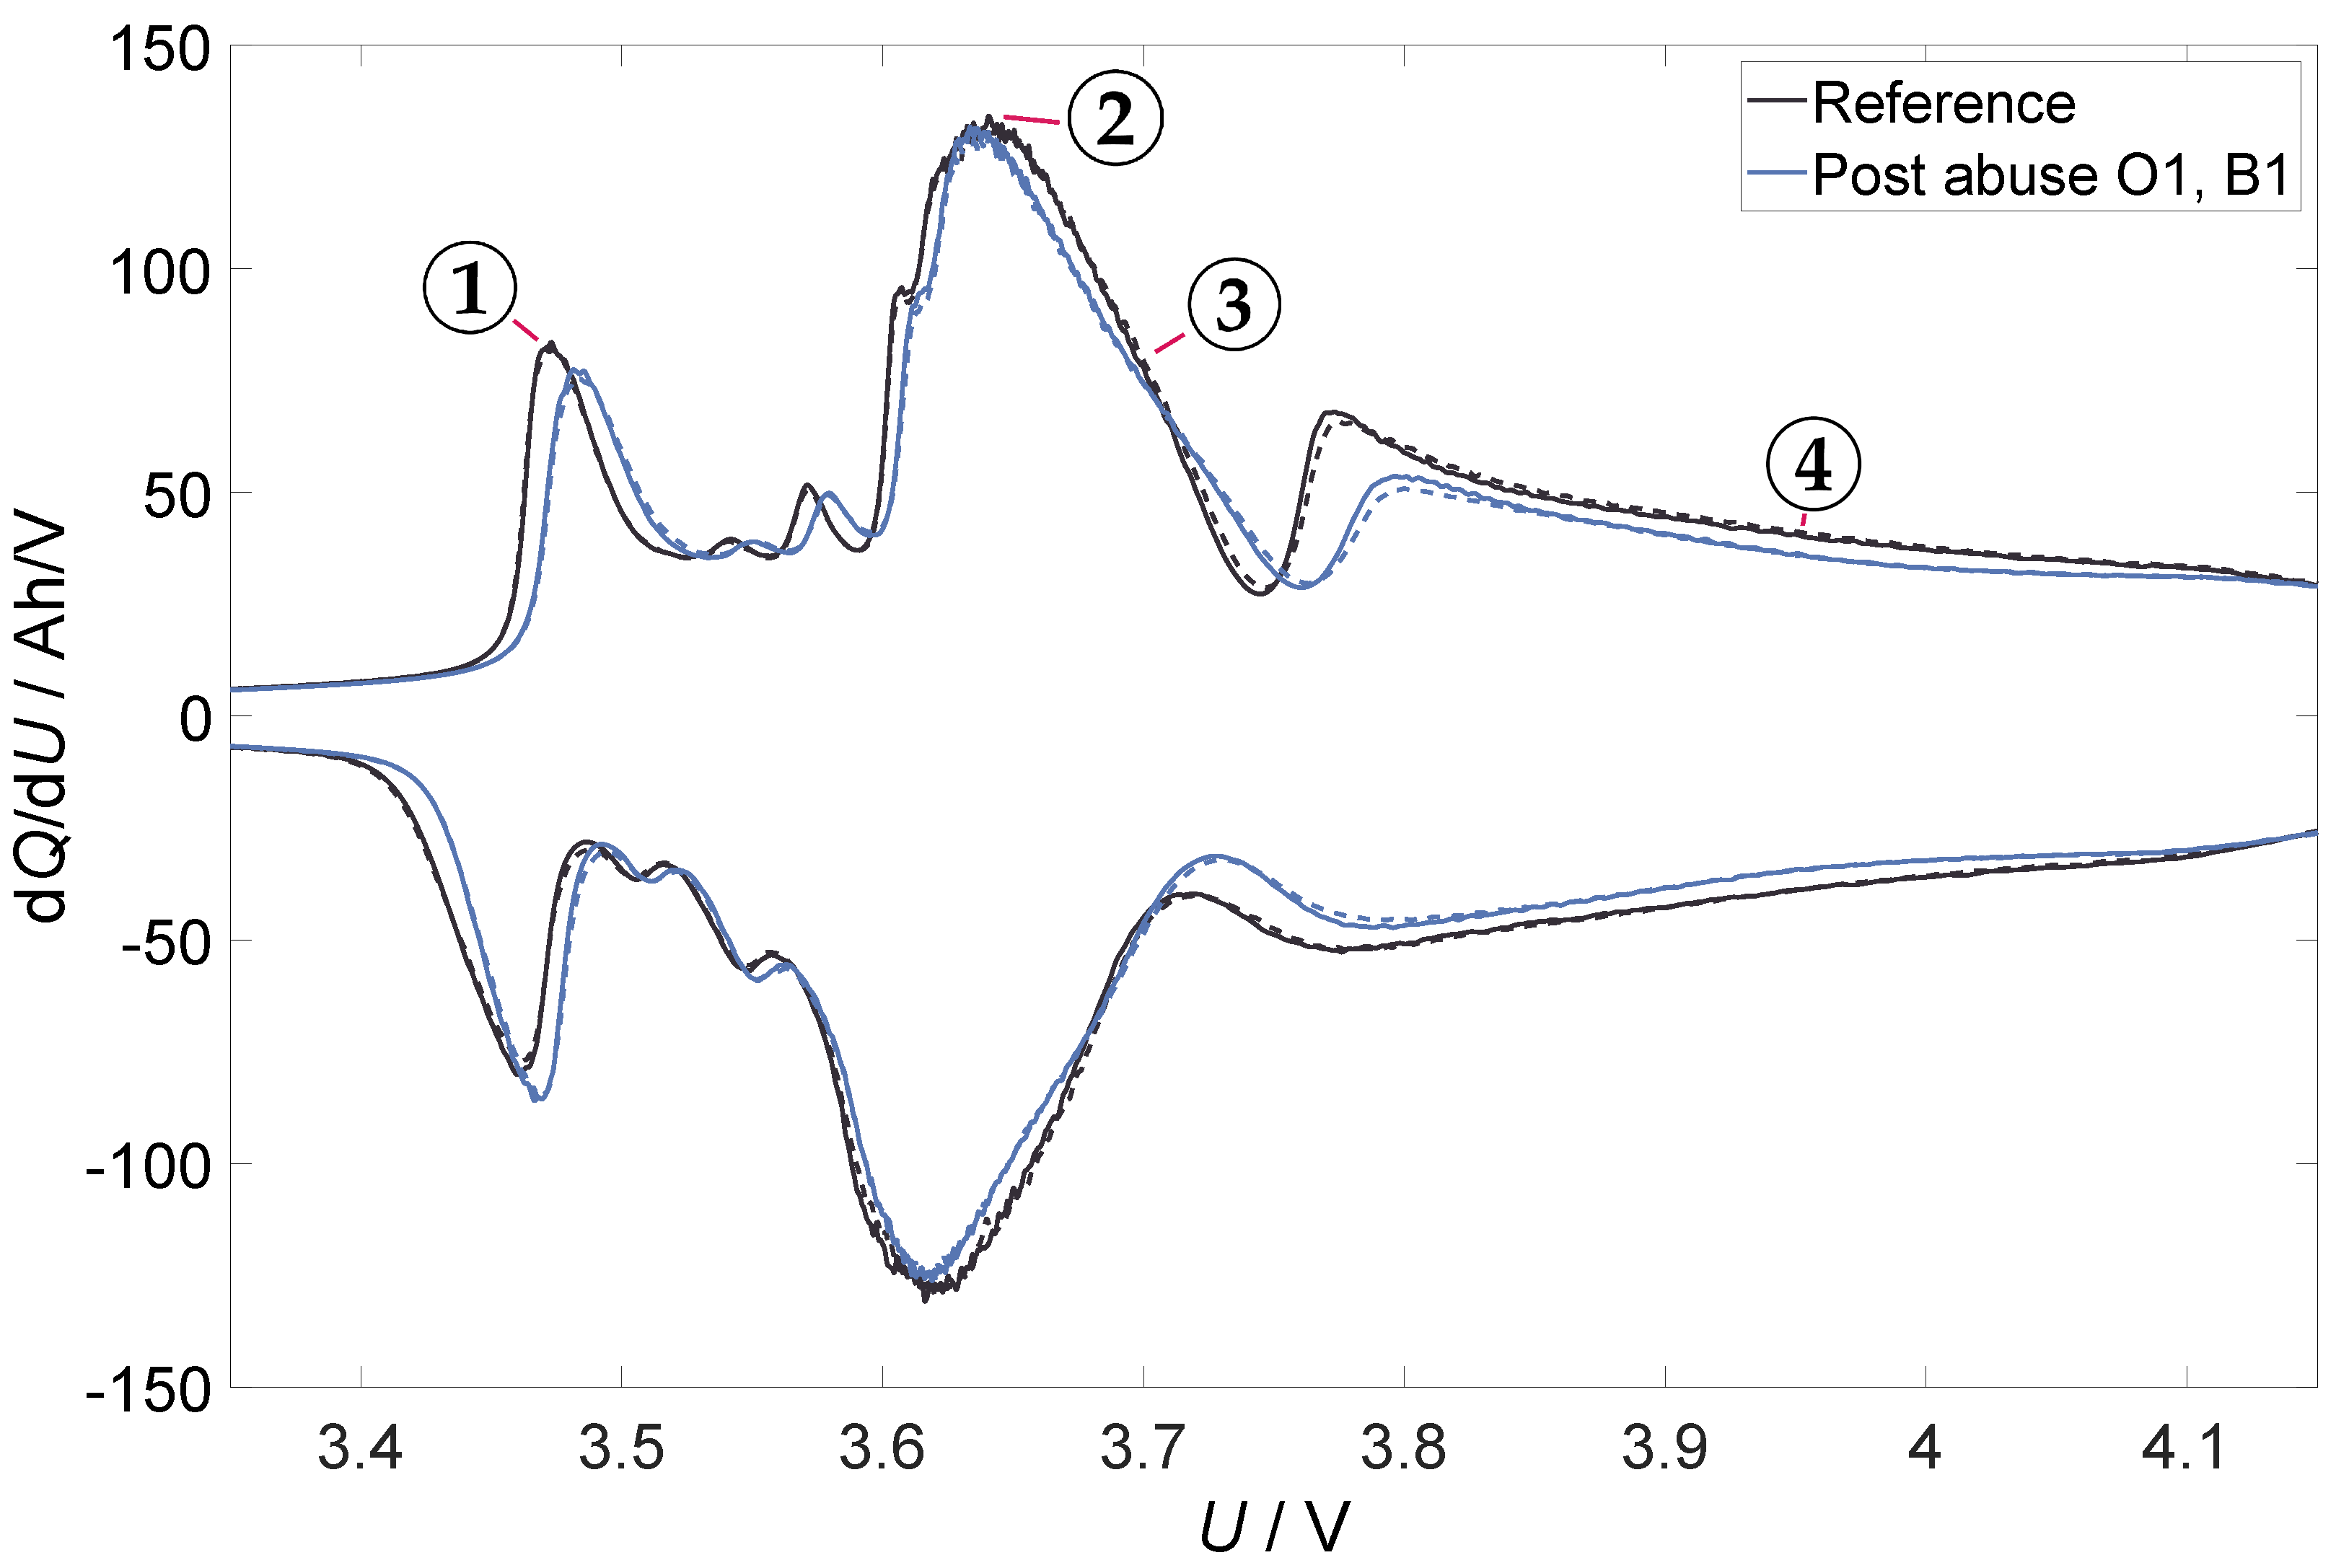
3.2. Incremental Capacity Analysis
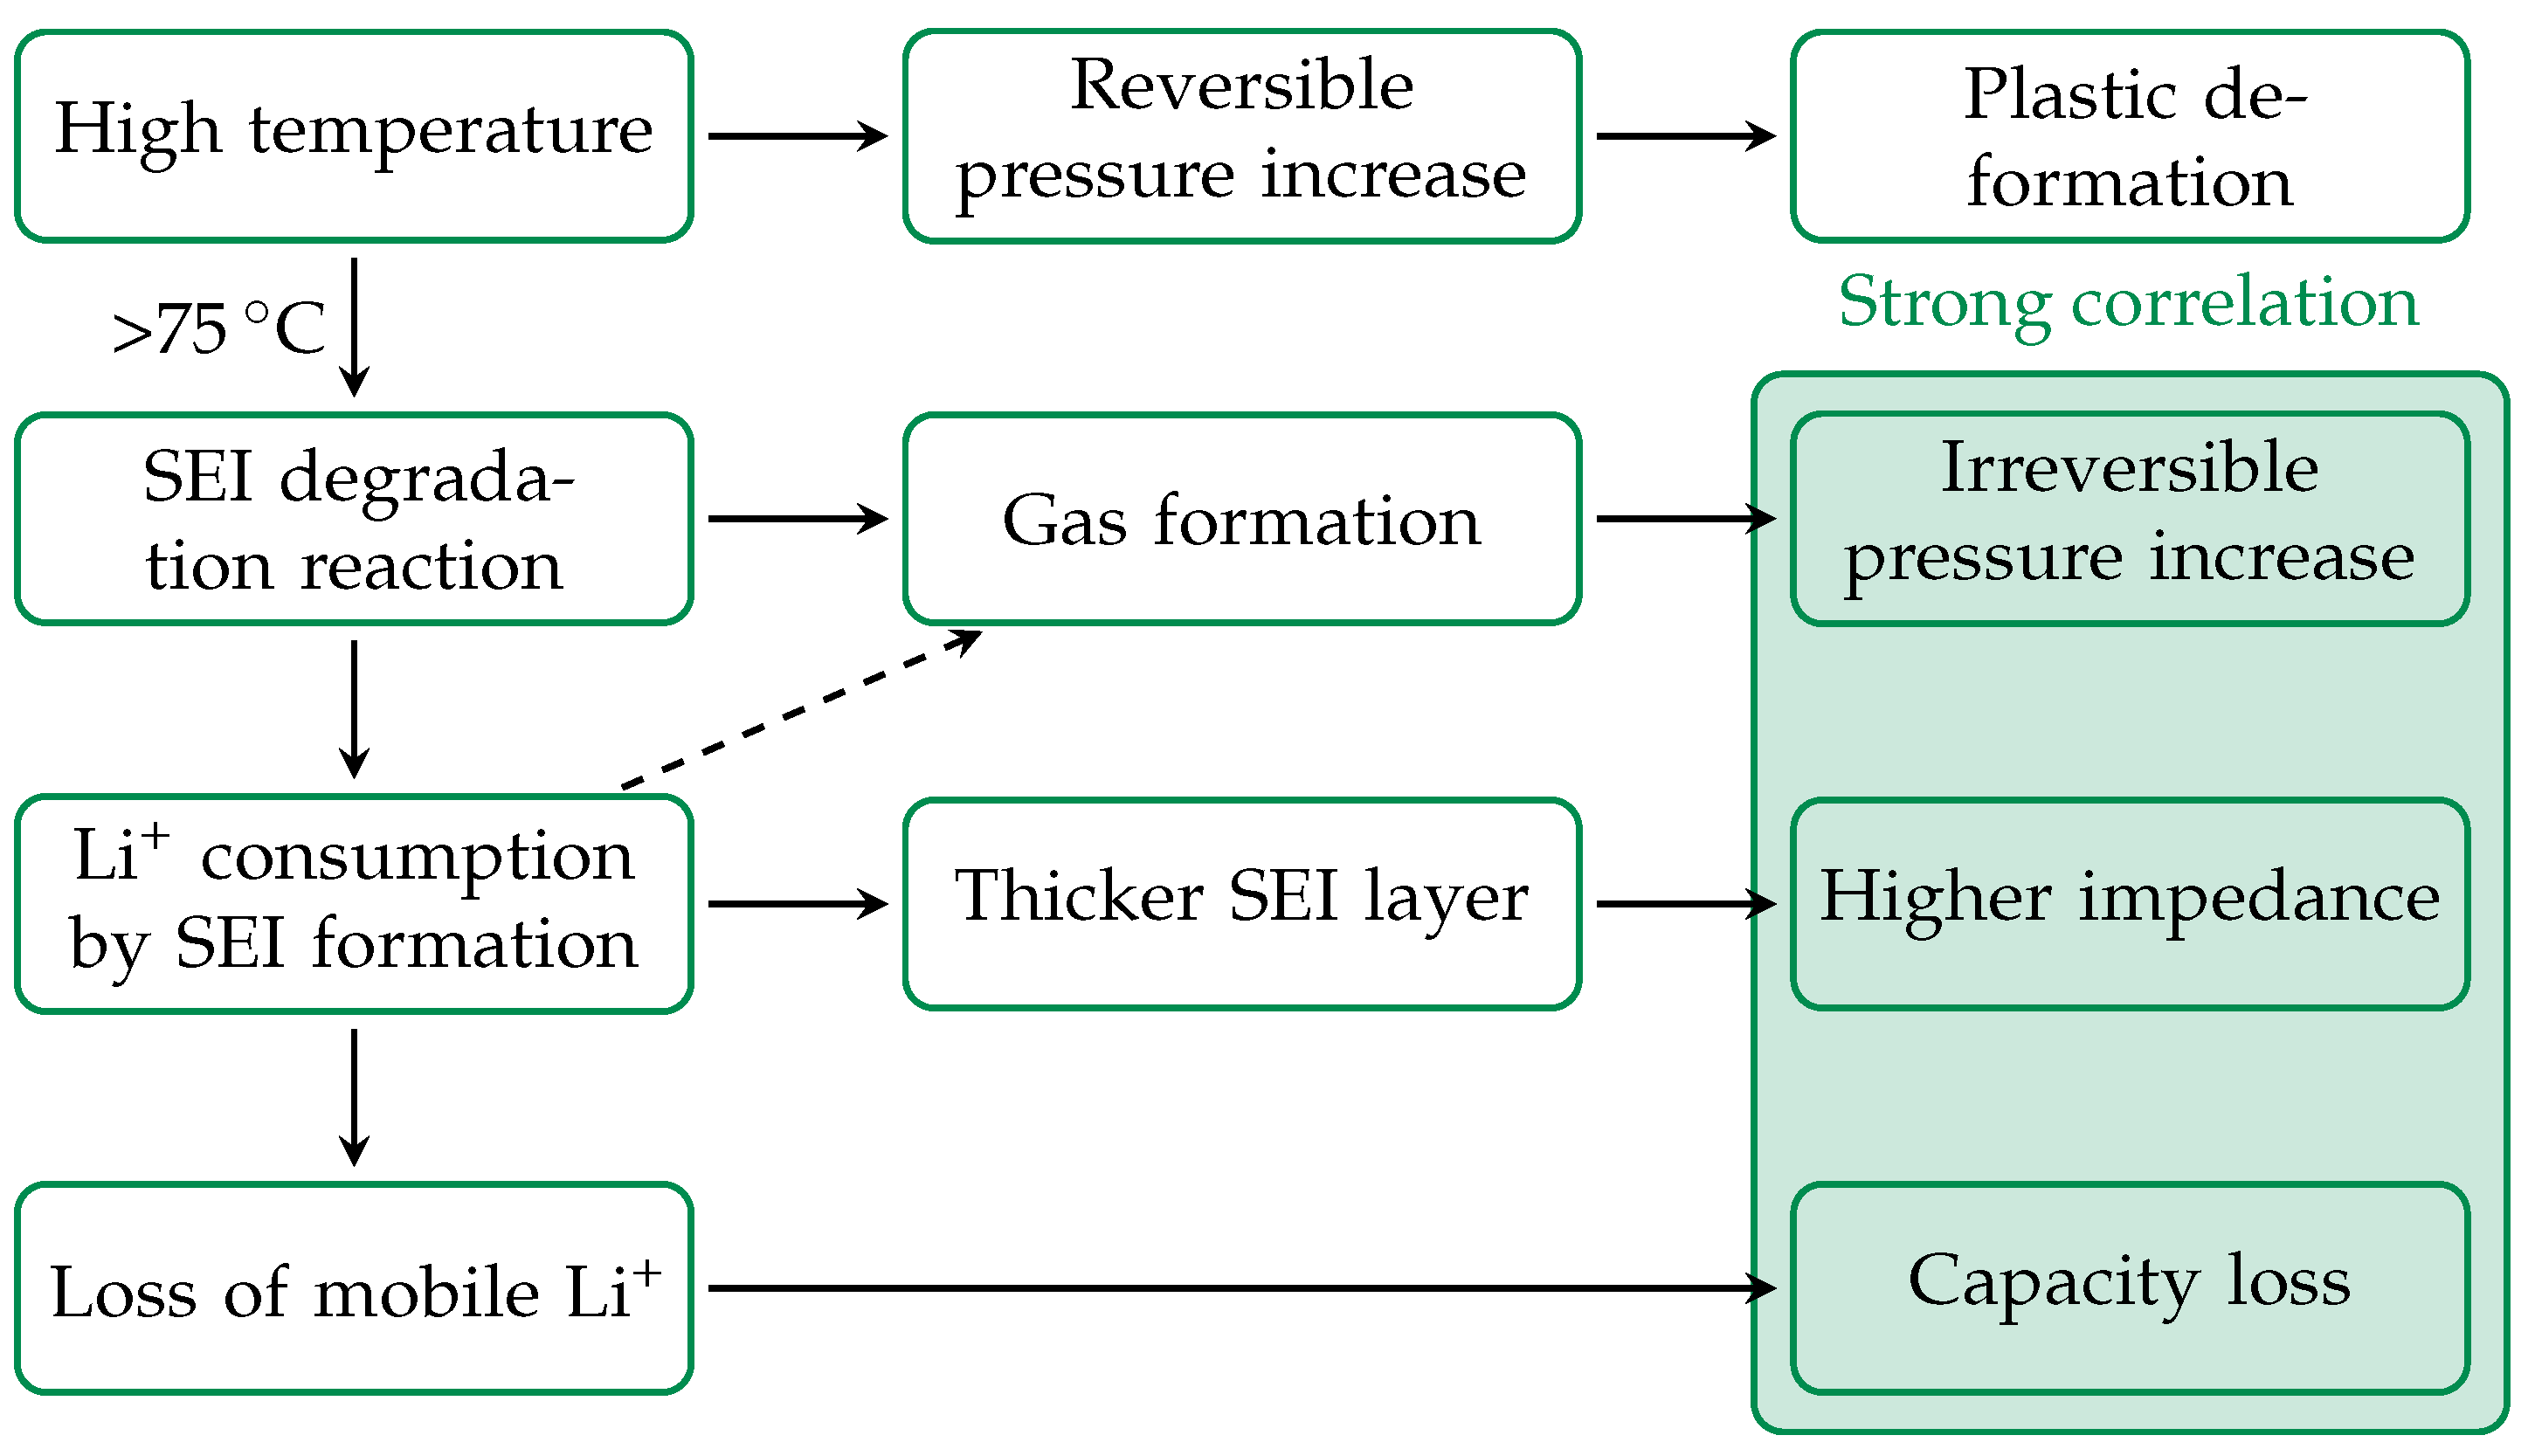
3.3. Pre-Critical Thermal Abuse Correlations
4. Conclusions
- On the rupture disc, the fixed FBG sensors showed highly sensitive proportionality to temperature, as well as an inverse proportionality to the cell pressure.
- The fixed FBG application displayed regardless of the adhesive configuration sufficient sensitivity for cell temperature monitoring, and it also showed potential for the in operando detection of critical cell states.
- The direct correlation of the plastic deformations to the pressure via the mechanical properties of the rupture disc allowed for the determination of cell-specific critical states within a battery system, as well as ensured early warnings for the cell rupture event.
Author Contributions
Funding
Data Availability Statement
Acknowledgments
Conflicts of Interest
Abbreviations
| CC | Constant Current |
| CV | Constant Voltage |
| DMC | Dimethyl Carbonate |
| EC | Ethylene Carbonate |
| FBG | Fiber Bragg Grating |
| FOI | Feature(s) Of Interest |
| ICA | Incremental Capacity Analysis |
| LAM | Loss of Active Material |
| LLI | Loss Lithium Inventory |
| ORI | Ohmic Resistance Increase |
| OSD | Over-charge Safety Device |
| PHEV | Plug-In Hybrid Electric Vehicle |
| SEI | Solid Electrolyte Interphase |
| SOC | State Of Charge |
| TR | Thermal Runaway |
Appendix A
Appendix A.1. Experimental Results
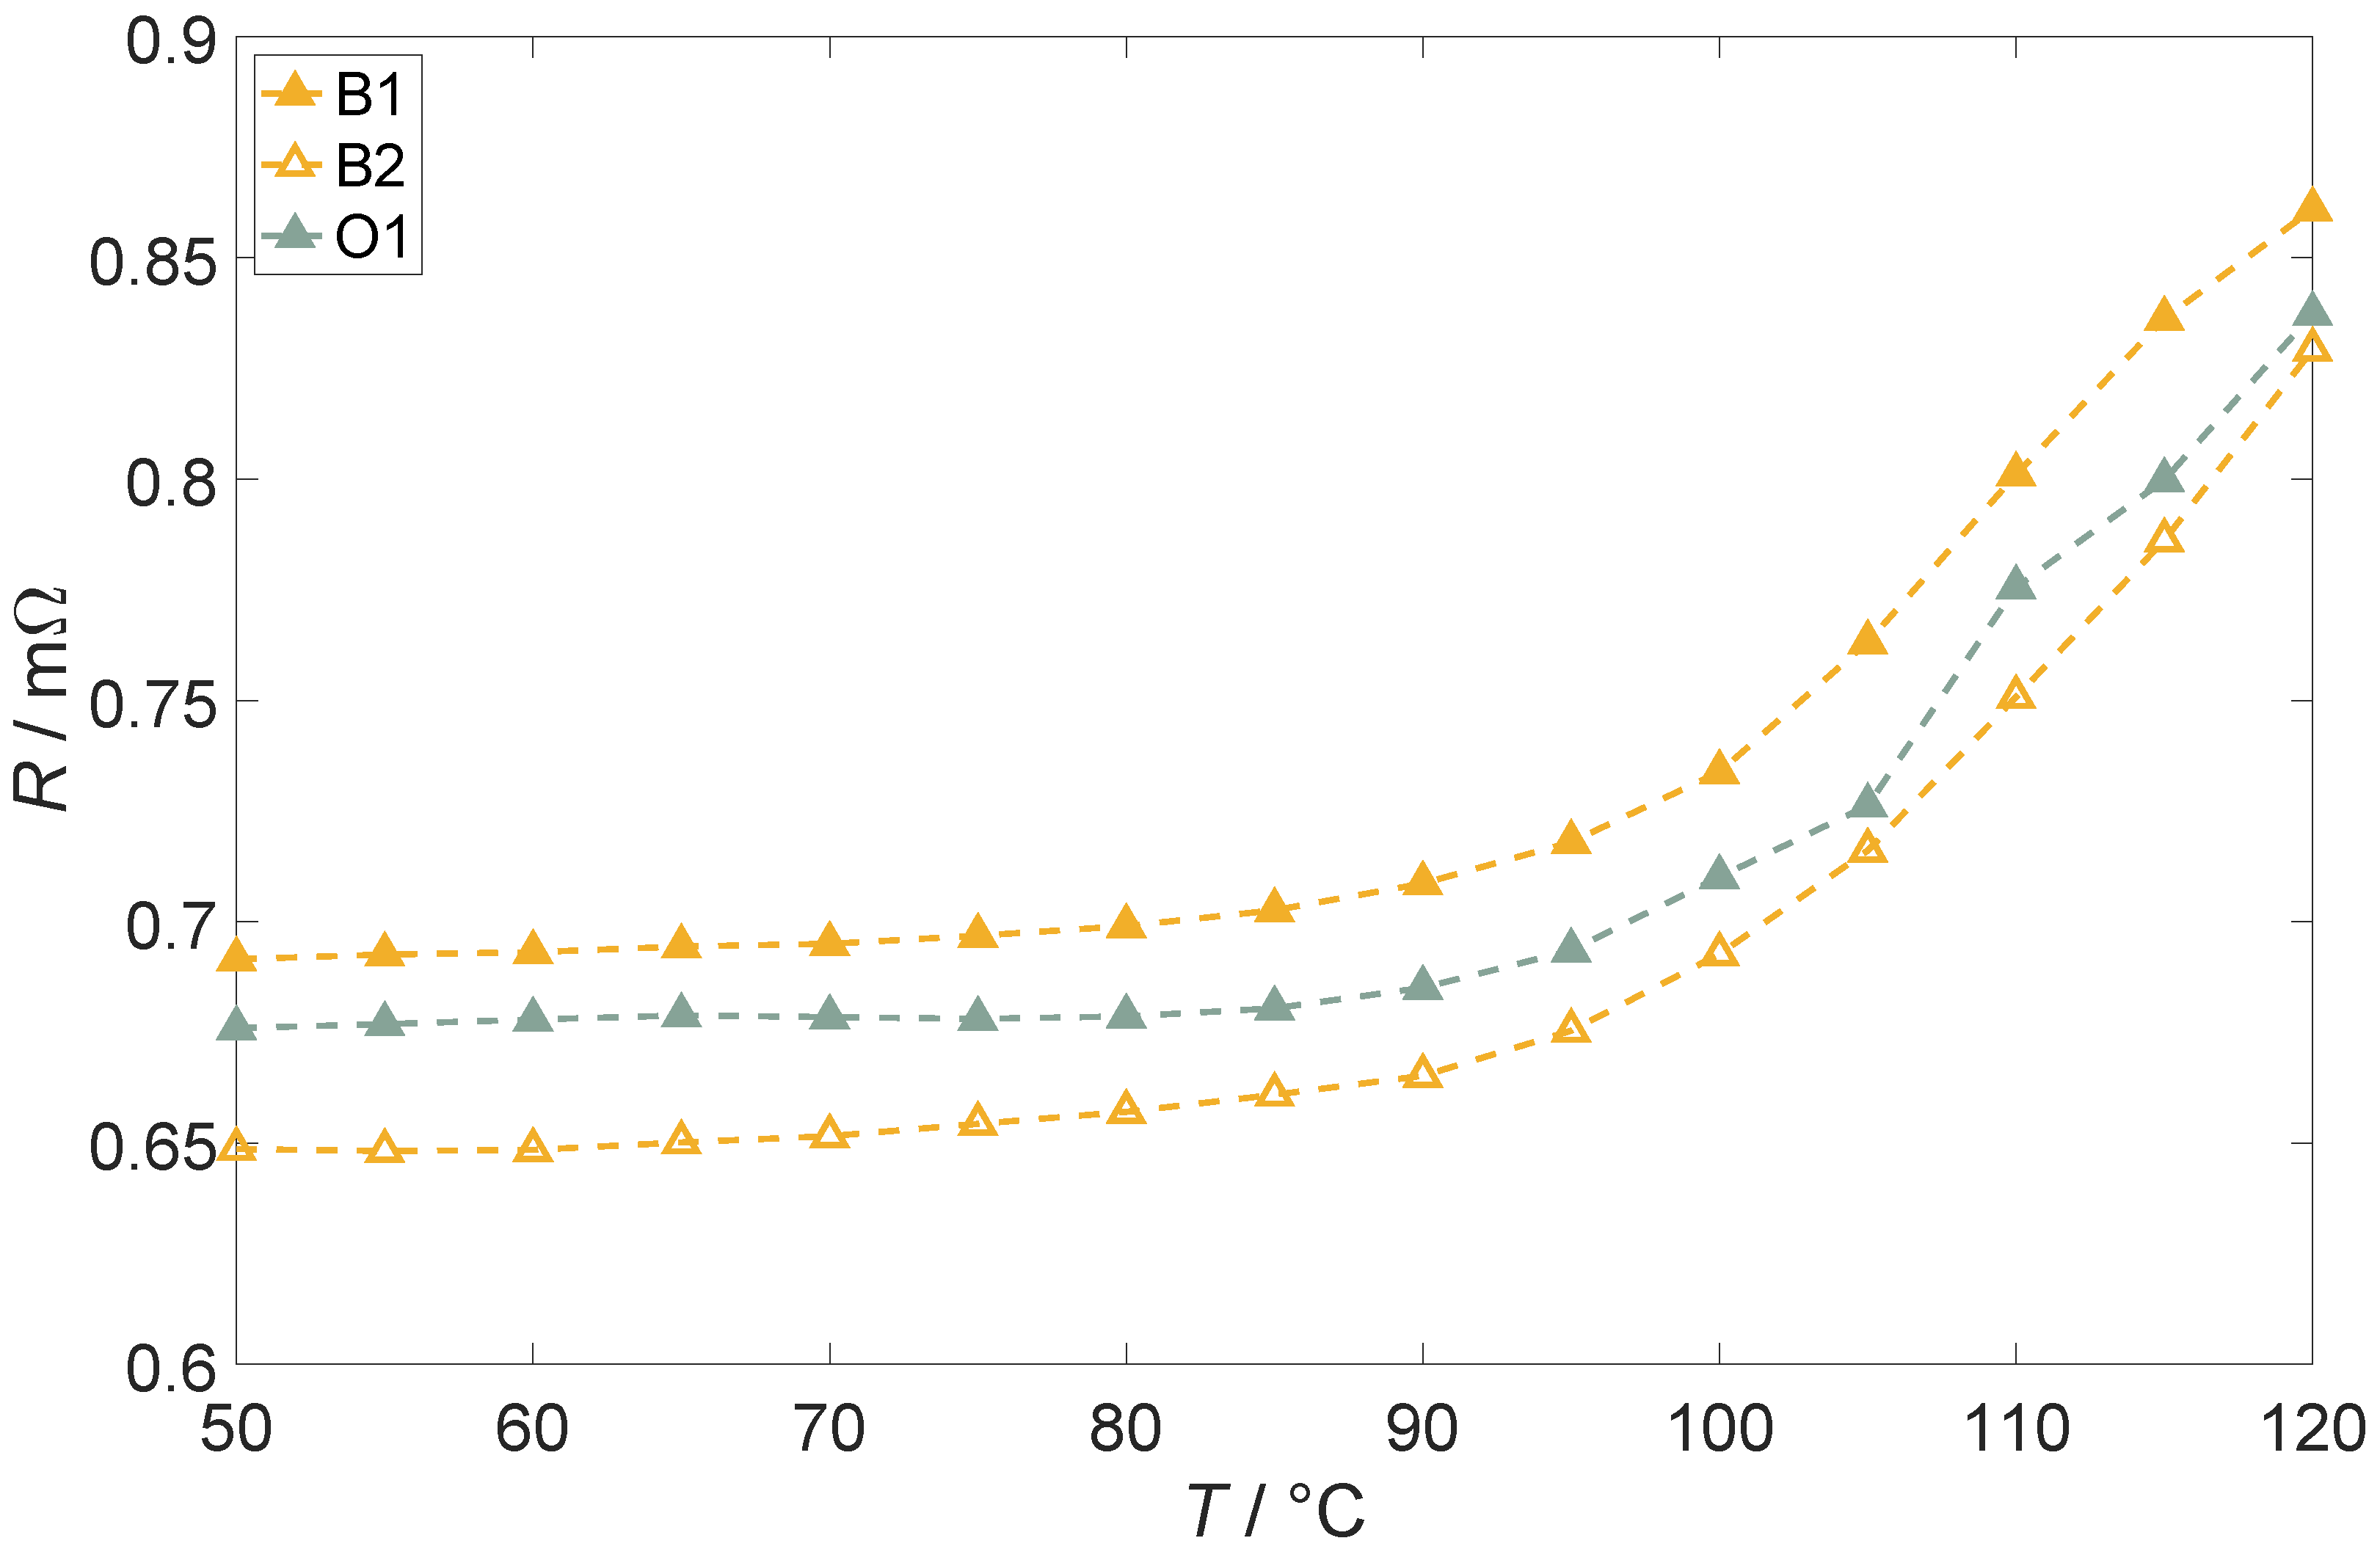
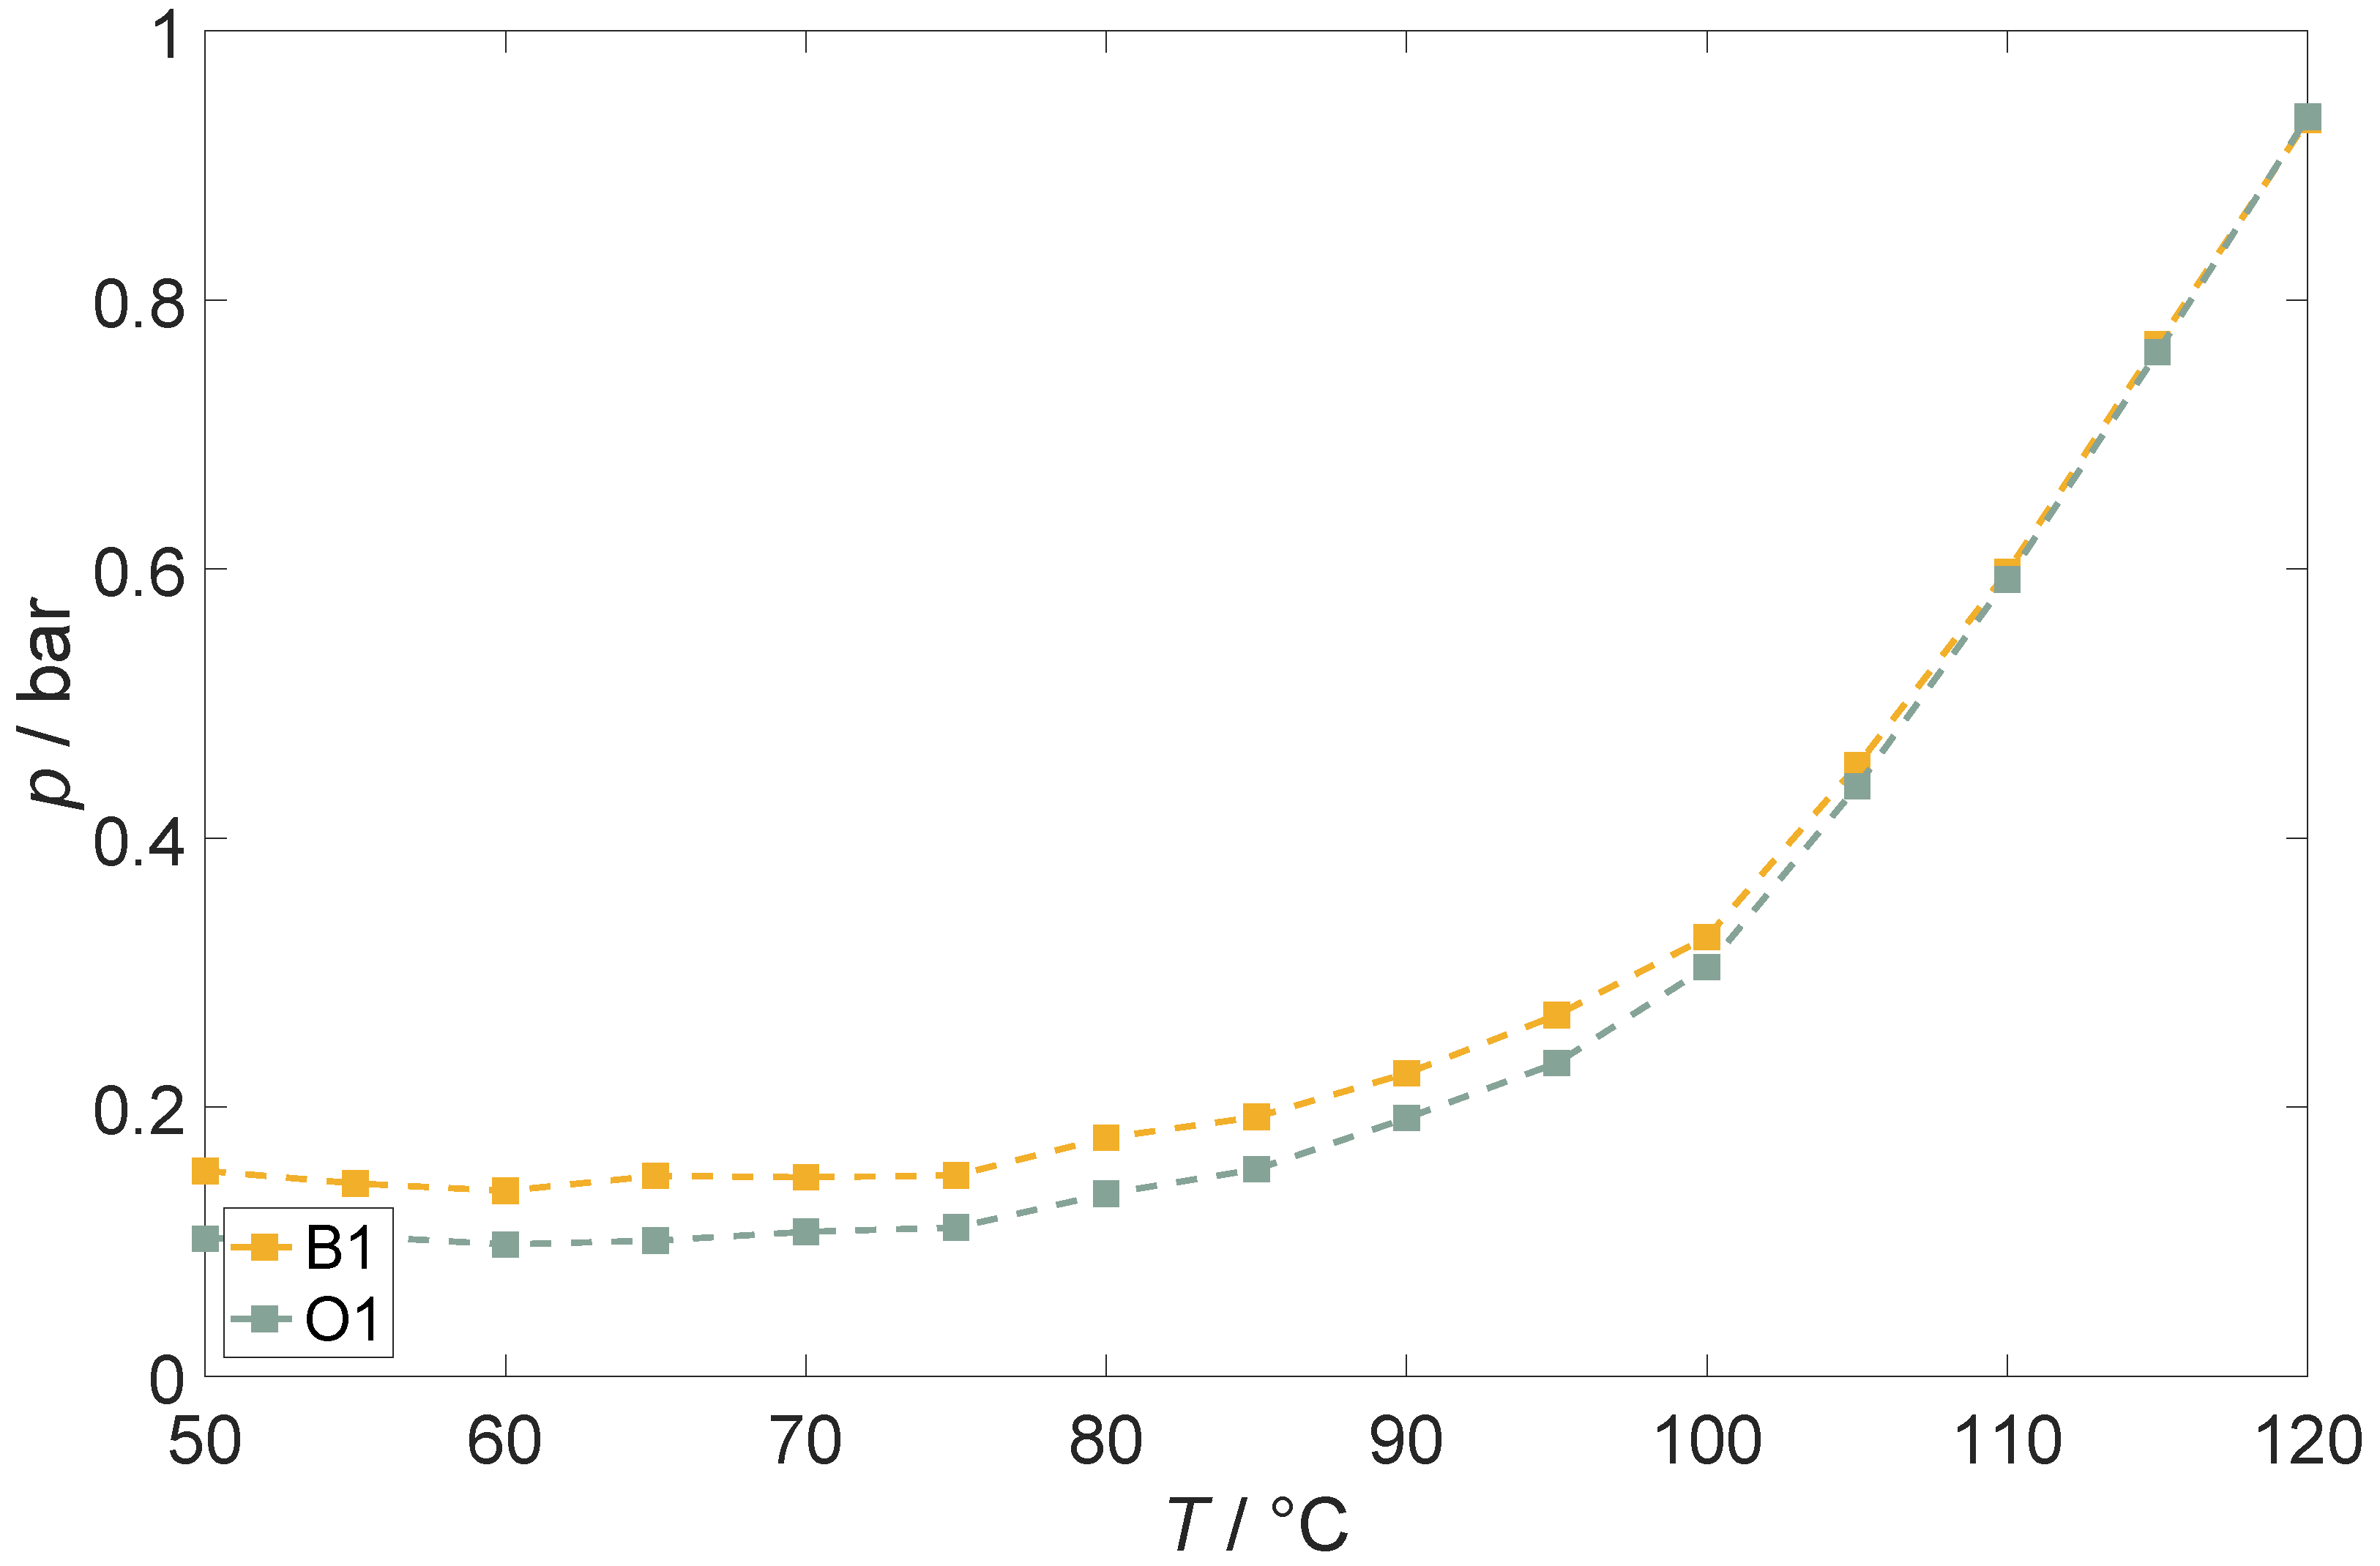
Appendix A.2. Characteristic Trends

References
- Bhandari, N.; Cai, A.; Yuzawa, K.; Zhang, J.; Joshi, V.; Fang, F.; Lee, G.; Harada, R.; Shin, S. Batteries: The Greenflation Challenge. Available online: https://www.goldmansachs.com/intelligence/pages/gs-research/batteries-the-greenflation-challenge/report.pdf (accessed on 11 January 2024).
- Degen, F.; Winter, M.; Bendig, D.; Tübke, J. Energy consumption of current and future production of lithium-ion and post lithium-ion battery cells. Nat. Energy 2023, 8, 1284–1295. [Google Scholar] [CrossRef]
- Liu, W.; Placke, T.; Chau, K.T. Overview of batteries and battery management for electric vehicles. Energy Rep. 2022, 8, 4058–4084. [Google Scholar] [CrossRef]
- Finegan, D.P.; Darcy, E.; Keyser, M.; Tjaden, B.; Heenan, T.M.M.; Jervis, R.; Bailey, J.J.; Malik, R.; Vo, N.T.; Magdysyuk, O.V.; et al. Characterising thermal runaway within lithium-ion cells by inducing and monitoring internal short circuits. Energy Environ. Sci. 2017, 10, 1377–1388. [Google Scholar] [CrossRef]
- Chen, Y.; Kang, Y.; Zhao, Y.; Wang, L.; Liu, J.; Li, Y.; Liang, Z.; He, X.; Li, X.; Tavajohi, N.; et al. A review of lithium-ion battery safety concerns: The issues, strategies, and testing standards. J. Energy Chem. 2021, 59, 83–99. [Google Scholar] [CrossRef]
- Finegan, D.P.; Darst, J.; Walker, W.; Li, Q.; Yang, C.; Jervis, R.; Heenan, T.M.; Hack, J.; Thomas, J.C.; Rack, A.; et al. Modelling and experiments to identify high-risk failure scenarios for testing the safety of lithium-ion cells. J. Power Sources 2019, 417, 29–41. [Google Scholar] [CrossRef]
- Essl, C.; Golubkov, A.W.; Fuchs, A. Comparing Different Thermal Runaway Triggers for Two Automotive Lithium-Ion Battery Cell Types. J. Electrochem. Soc. 2020, 167, 130542. [Google Scholar] [CrossRef]
- Grabow, J.; Klink, J.; Benger, R.; Hauer, I.; Beck, H.P. Particle Contamination in Commercial Lithium-Ion Cells—Risk Assessment with Focus on Internal Short Circuits and Replication by Currently Discussed Trigger Methods. Batteries 2023, 9, 9. [Google Scholar] [CrossRef]
- Li, H.; Duan, Q.; Zhao, C.; Huang, Z.; Wang, Q. Experimental investigation on the thermal runaway and its propagation in the large format battery module with Li(Ni1/3Co1/3Mn1/3)O2 as cathode. J. Hazard. Mater. 2019, 375, 241–254. [Google Scholar] [CrossRef]
- Cai, T. Detection of Lithium-Ion Battery Failure and Thermal Runaway. Ph.D. Thesis, The University of Michigan, Ann Arbor, MI, USA, 2021. [Google Scholar] [CrossRef]
- Klink, J.; Grabow, J.; Orazov, N.; Benger, R.; Börger, A.; Ahlberg Tidblad, A.; Wenzl, H.; Beck, H.P. Thermal fault detection by changes in electrical behaviour in lithium-ion cells. J. Power Sources 2021, 490, 229572. [Google Scholar] [CrossRef]
- Tran, M.K.; Mevawalla, A.; Aziz, A.; Panchal, S.; Xie, Y.; Fowler, M. A Review of Lithium-Ion Battery Thermal Runaway Modeling and Diagnosis Approaches. Processes 2022, 10, 1192. [Google Scholar] [CrossRef]
- Klink, J.; Hebenbrock, A.; Grabow, J.; Orazov, N.; Nylén, U.; Benger, R.; Beck, H.P. Comparison of Model-Based and Sensor-Based Detection of Thermal Runaway in Li-Ion Battery Modules for Automotive Application. Batteries 2022, 8, 34. [Google Scholar] [CrossRef]
- Zhang, Y.; Jiang, M.; Zhou, Y.; Zhao, S.; Yuan, Y. Towards High-Safety Lithium-Ion Battery Diagnosis Methods. Batteries 2023, 9, 63. [Google Scholar] [CrossRef]
- Feng, X.; Ren, D.; He, X.; Ouyang, M. Mitigating Thermal Runaway of Lithium-Ion Batteries. Joule 2020, 4, 743–770. [Google Scholar] [CrossRef]
- Li, A.; Yuen, A.C.Y.; Wang, W.; de Cachinho Cordeiro, I.M.; Wang, C.; Chen, T.B.Y.; Zhang, J.; Chan, Q.N.; Yeoh, G.H. A Review on Lithium-Ion Battery Separators towards Enhanced Safety Performances and Modelling Approaches. Molecules 2021, 26, 478. [Google Scholar] [CrossRef]
- Zhang, J.; Shao, D.; Jiang, L.; Zhang, G.; Wu, H.; Day, R.; Jiang, W. Advanced thermal management system driven by phase change materials for power lithium-ion batteries: A review. Renew. Sustain. Energy Rev. 2022, 159, 112207. [Google Scholar] [CrossRef]
- Qiu, M.; Liu, J.; Cong, B.; Cui, Y. Research Progress in Thermal Runaway Vent Gas Characteristics of Li-Ion Battery. Batteries 2023, 9, 411. [Google Scholar] [CrossRef]
- Ruiz, V.; Pfrang, A.; Kriston, A.; Omar, N.; van den Bossche, P.; Boon-Brett, L. A review of international abuse testing standards and regulations for lithium ion batteries in electric and hybrid electric vehicles. Renew. Sustain. Energy Rev. 2018, 81, 1427–1452. [Google Scholar] [CrossRef]
- Regulation (EU) 2023/1542; Concerning Batteries and Waste Batteries, Amending Directive 2008/98/EC and Regulation (EU) 2019/1020 and Repealing Directive 2006/66/EC. European Parliament: Strasbourg, France, 2023.
- Feng, X.; Ren, D.; Zhang, S.; He, X.; Wang, L.; Ouyang, M. Influence of aging paths on the thermal runaway features of lithium-ion batteries in accelerating rate calorimetry tests. Int. J. Electrochem. Sci. 2019, 14, 44–58. [Google Scholar] [CrossRef]
- Yamaki, J. Thermal stability of graphite anode with electrolyte in lithium-ion cells. Solid State Ion. 2002, 148, 241–245. [Google Scholar] [CrossRef]
- Spotnitz, R.; Franklin, J. Abuse behavior of high-power, lithium-ion cells. J. Power Sources 2003, 113, 81–100. [Google Scholar] [CrossRef]
- Zheng, S.; Wang, L.; Feng, X.; He, X. Probing the heat sources during thermal runaway process by thermal analysis of different battery chemistries. J. Power Sources 2018, 378, 527–536. [Google Scholar] [CrossRef]
- Schmidt, J.P. Verfahren zur Charakterisierung und Modellierung von Lithium-Ionen Zellen. Ph.D. Thesis, Karlsruhe Institute of Technology, Karlsruhe, Germany, 2013. [Google Scholar] [CrossRef]
- Zhang, Y.; Wang, H.; Wang, Y.; Li, C.; Liu, Y.; Ouyang, M. Thermal abusive experimental research on the large-format lithium-ion battery using a buried dual-sensor. J. Energy Storage 2021, 33, 102156. [Google Scholar] [CrossRef]
- Golubkov, A.W.; Fuchs, D.; Wagner, J.; Wiltsche, H.; Stangl, C.; Fauler, G.; Voitic, G.; Thaler, A.; Hacker, V. Thermal-runaway experiments on consumer Li-ion batteries with metal-oxide and olivin-type cathodes. RSC Adv. 2014, 4, 3633–3642. [Google Scholar] [CrossRef]
- Wang, H.; Frisco, S.; Gottlieb, E.; Yuan, R.; Whitacre, J.F. Capacity degradation in commercial Li-ion cells: The effects of charge protocol and temperature. J. Power Sources 2019, 426, 67–73. [Google Scholar] [CrossRef]
- Rowden, B.; Garcia-Araez, N. A review of gas evolution in lithium ion batteries. Energy Rep. 2020, 6, 10–18. [Google Scholar] [CrossRef]
- Mattinen, U.; Klett, M.; Lindbergh, G.; Wreland Lindström, R. Gas evolution in commercial Li-ion battery cells measured by on-line mass spectrometry—Effects of C-rate and cell voltage. J. Power Sources 2020, 477, 228968. [Google Scholar] [CrossRef]
- Feng, X.; Ouyang, M.; Liu, X.; Lu, L.; Xia, Y.; He, X. Thermal runaway mechanism of lithium ion battery for electric vehicles: A review. Energy Storage Mater. 2018, 10, 246–267. [Google Scholar] [CrossRef]
- Zou, K.; Chen, X.; Ding, Z.; Gu, J.; Lu, S. Jet behavior of prismatic lithium-ion batteries during thermal runaway. Appl. Therm. Eng. 2020, 179, 115745. [Google Scholar] [CrossRef]
- Cheng, A.; Xin, Y.; Wu, H.; Yang, L.; Deng, B. A Review of Sensor Applications in Electric Vehicle Thermal Management Systems. Energies 2023, 16, 5139. [Google Scholar] [CrossRef]
- Popp, H.; Koller, M.; Jahn, M.; Bergmann, A. Mechanical methods for state determination of Lithium-Ion secondary batteries: A review. J. Energy Storage 2020, 32, 101859. [Google Scholar] [CrossRef]
- Chen, D.; Zhao, Q.; Zheng, Y.; Xu, Y.; Chen, Y.; Ni, J.; Zhao, Y. Recent Progress in Lithium-Ion Battery Safety Monitoring Based on Fiber Bragg Grating Sensors. Sensors 2023, 23, 5609. [Google Scholar] [CrossRef]
- Jia, T.; Zhang, Y.; Ma, C.; Li, S.; Yu, H.; Liu, G. The early warning for overcharge thermal runaway of lithium-ion batteries based on a composite parameter. J. Power Sources 2023, 555, 232393. [Google Scholar] [CrossRef]
- Zhang, L.; Liu, X.; Li, K.; Du, D.; Zheng, M.; Niu, Q.; Yang, Y.; Zhou, Q.; Sun, T.; Grattan, K.T.V. Real-Time Battery Temperature Monitoring Using FBG Sensors: A Data-Driven Calibration Method. IEEE Sens. J. 2022, 22, 18639–18648. [Google Scholar] [CrossRef]
- Liu, S.; Li, K. Thermal monitoring of lithium-ion batteries based on machine learning and fibre Bragg grating sensors. Trans. Inst. Meas. Control. 2023, 45, 1570–1578. [Google Scholar] [CrossRef]
- Chang, L.; Chen, W.; Mao, Z.; Huang, X.; Ren, T.; Zhang, Y.; Cai, Z. Experimental study on the effect of ambient temperature and discharge rate on the temperature field of prismatic batteries. J. Energy Storage 2023, 59, 106577. [Google Scholar] [CrossRef]
- Tardy, E.; Thivel, P.X.; Druart, F.; Kuntz, P.; Devaux, D.; Bultel, Y. Internal temperature distribution in lithium-ion battery cell and module based on a 3D electrothermal model: An investigation of real geometry, entropy change and thermal process. J. Energy Storage 2023, 64, 107090. [Google Scholar] [CrossRef]
- DIN 91252:2016-11; Elektrische Straßenfahrzeuge–Batteriesysteme–Electrically Propelled Road Vehicles–Battery Systems–Design Specifications for Lithium-Ion Battery Cells. German Institute for Standardization: Berlin, Germany, 2016. [CrossRef]
- Barai, A.; Tangirala, R.; Uddin, K.; Chevalier, J.; Guo, Y.; McGordon, A.; Jennings, P. The effect of external compressive loads on the cycle lifetime of lithium-ion pouch cells. J. Energy Storage 2017, 13, 211–219. [Google Scholar] [CrossRef]
- Holland, A.A. The Effects of Compression on Lithium-Ion Batteries. Ph.D. Thesis, Imperial College London, London, UK, 2018. [Google Scholar] [CrossRef]
- Kohlberger, M. Sicherheitselement für Batteriezelle. European Patent Office EP2779271A2, 21 January 2014. [Google Scholar]
- Peled, E. The Electrochemical Behavior of Alkali and Alkaline Earth Metals in Nonaqueous Battery Systems—The Solid Electrolyte Interphase Model. J. Electrochem. Soc. 1979, 126, 2047–2051. [Google Scholar] [CrossRef]
- Peled, E.; Menkin, S. Review—SEI: Past, Present and Future. J. Electrochem. Soc. 2017, 164, A1703–A1719. [Google Scholar] [CrossRef]
- Pinson, M.B.; Bazant, M.Z. Theory of SEI Formation in Rechargeable Batteries: Capacity Fade, Accelerated Aging and Lifetime Prediction. J. Electrochem. Soc. 2013, 160, A243–A250. [Google Scholar] [CrossRef]
- Son, K.; Hwang, S.M.; Woo, S.G.; Paik, M.; Song, E.H.; Kim, Y.J. Thermal and chemical characterization of the solid-electrolyte interphase in Li-ion batteries using a novel separator sampling method. J. Power Sources 2019, 440, 227083. [Google Scholar] [CrossRef]
- Chen, S.; Gao, Z.; Sun, T. Safety challenges and safety measures of Li-ion batteries. Energy Sci. Eng. 2021, 9, 1647–1672. [Google Scholar] [CrossRef]
- Aurbach, D.; Ein-Eli, Y.; Markovsky, B.; Zaban, A.; Luski, S.; Carmeli, Y.; Yamin, H. The Study of Electrolyte Solutions Based on Ethylene and Diethyl Carbonates for Rechargeable Li Batteries: II. Graphite Electrodes. J. Electrochem. Soc. 1995, 142, 2882–2890. [Google Scholar] [CrossRef]
- Tanaka, N. Modeling and Simulation of Thermo-Electrochemistry of Thermal Runaway in Lithium-Ion Batteries. Ph.D. Thesis, University of Stuttgart, Stuttgart, Germany, 2015. [Google Scholar] [CrossRef]
- Richard, M.N.; Dahn, J.R. Accelerating Rate Calorimetry Study on the Thermal Stability of Lithium Intercalated Graphite in Electrolyte. I. Experimental. J. Electrochem. Soc. 1999, 146, 2068–2077. [Google Scholar] [CrossRef]
- Wang, Q.; Sun, J.; Yao, X.; Chen, C. Thermal stability of LiPF6/EC+DEC electrolyte with charged electrodes for lithium ion batteries. Thermochim. Acta 2005, 437, 12–16. [Google Scholar] [CrossRef]
- Deshpande, R.D.; Bernardi, D.M. Modeling Solid-Electrolyte Interphase (SEI) Fracture: Coupled Mechanical/Chemical Degradation of the Lithium Ion Battery. J. Electrochem. Soc. 2017, 164, A461–A474. [Google Scholar] [CrossRef]
- Palacín, M.R.; de Guibert, A. Why do batteries fail? Science 2016, 351, 1253292. [Google Scholar] [CrossRef]
- Zhou, M.; Zhao, L.; Okada, S.; Yamaki, J.I. Quantitative Studies on the Influence of LiPF 6 on the Thermal Stability of Graphite with Electrolyte. J. Electrochem. Soc. 2011, 159, A44–A48. [Google Scholar] [CrossRef]
- Agubra, V.A.; Fergus, J.W. The formation and stability of the solid electrolyte interface on the graphite anode. J. Power Sources 2014, 268, 153–162. [Google Scholar] [CrossRef]
- Carter, R.; Kingston, T.A.; Atkinson, R.W.; Parmananda, M.; Dubarry, M.; Fear, C.; Mukherjee, P.P.; Love, C.T. Directionality of thermal gradients in lithium-ion batteries dictates diverging degradation modes. Cell Rep. Phys. Sci. 2021, 2, 100351. [Google Scholar] [CrossRef]
- Dubarry, M.; Anseán, D. Best practices for incremental capacity analysis. Front. Energy Res. 2022, 10, 1023555. [Google Scholar] [CrossRef]
- Schmitt, J.; Kraft, B.; Schmidt, J.P.; Meir, B.; Elian, K.; Ensling, D.; Keser, G.; Jossen, A. Measurement of gas pressure inside large-format prismatic lithium-ion cells during operation and cycle aging. J. Power Sources 2020, 478, 228661. [Google Scholar] [CrossRef]
- Werneck, M.M.; Allil, R.C.S.B.; Ribeiro, B.A.; de Nazaré, F.V.B. A Guide to Fiber Bragg Grating Sensors. In Current Trends in Short- and Long-Period Fiber Gratings; Cuadrado-Laborde, C., Ed.; InTech: London, UK, 2013. [Google Scholar] [CrossRef]
- Sahota, J.K.; Gupta, N.; Dhawan, D. Fiber Bragg grating sensors for monitoring of physical parameters: A comprehensive review. Opt. Eng. 2020, 59, 060901. [Google Scholar] [CrossRef]
- Schlüter, V.G. Entwicklung Eines Experimentell Gestützten Bewertungsverfahrens zur Optimierung und Charakterisierung der Dehnungsübertragung Oberflächenapplizierter Faser-Bragg-Gitter-Sensoren. Ph.D. Thesis, Technische Universität Berlin, Berlin, Germany, 2009. [Google Scholar]
- Wan, K.T.; Leung, C.K.Y.; Olson, N.G. Investigation of the strain transfer for surface-attached optical fiber strain sensors. Smart Mater. Struct. 2008, 17, 035037. [Google Scholar] [CrossRef]
- Barai, A.; Uddin, K.; Dubarry, M.; Somerville, L.; McGordon, A.; Jennings, P.; Bloom, I. A comparison of methodologies for the non-invasive characterisation of commercial Li-ion cells. Prog. Energy Combust. Sci. 2019, 72, 1–31. [Google Scholar] [CrossRef]
- Matasso, A.; Wetz, D.; Liu, F. The Effects of Internal Pressure Evolution on the Aging of Commercial Li-Ion Cells. J. Electrochem. Soc. 2015, 162, A92–A97. [Google Scholar] [CrossRef]
- Schweidler, S.; de Biasi, L.; Schiele, A.; Hartmann, P.; Brezesinski, T.; Janek, J. Volume Changes of Graphite Anodes Revisited: A Combined Operando X-ray Diffraction and In Situ Pressure Analysis Study. J. Phys. Chem. C 2018, 122, 8829–8835. [Google Scholar] [CrossRef]
- Ansean, D.; Gonzalez, M.; Blanco, C.; Viera, J.C.; Fernandez, Y.; Garcia, V.M. Lithium-ion battery degradation indicators via incremental capacity analysis. In Proceedings of the 2017 IEEE International Conference on Environment and Electrical Engineering and 2017 IEEE Industrial and Commercial Power Systems Europe (EEEIC/I&CPS Europe), Milan, Italy, 6–9 June 2017; pp. 1–6. [Google Scholar] [CrossRef]
- Feng, X.; Sun, J.; Ouyang, M.; He, X.; Lu, L.; Han, X.; Fang, M.; Peng, H. Characterization of large format lithium ion battery exposed to extremely high temperature. J. Power Sources 2014, 272, 457–467. [Google Scholar] [CrossRef]
- Birkl, C.R.; Roberts, M.R.; McTurk, E.; Bruce, P.G.; Howey, D.A. Degradation diagnostics for lithium ion cells. J. Power Sources 2017, 341, 373–386. [Google Scholar] [CrossRef]


| Property | Value |
|---|---|
| Mass/g | 810 |
| Length × width × thickness/mm | 91 × 148 × 26.5 |
| Upper cut-off voltage/V | 4.2 |
| Lower cut-off voltage/V | 3.0 |
| Maximum charge current/A | 55 |
| Maximum discharge current/A | 123 |
| Maximum storage temperature/°C | 70 |
| Minimum storage temperature/°C | |
| Maximum operating temperature/°C | 60 |
| Property | Value | |||
|---|---|---|---|---|
| ID | O1 | O2 | B1 | B2 |
| Max pressure/bar | 3.40 | - | 3.44 | - |
| FBG hub/nm | −1.02 | −0.74 | −0.86 | −1.20 |
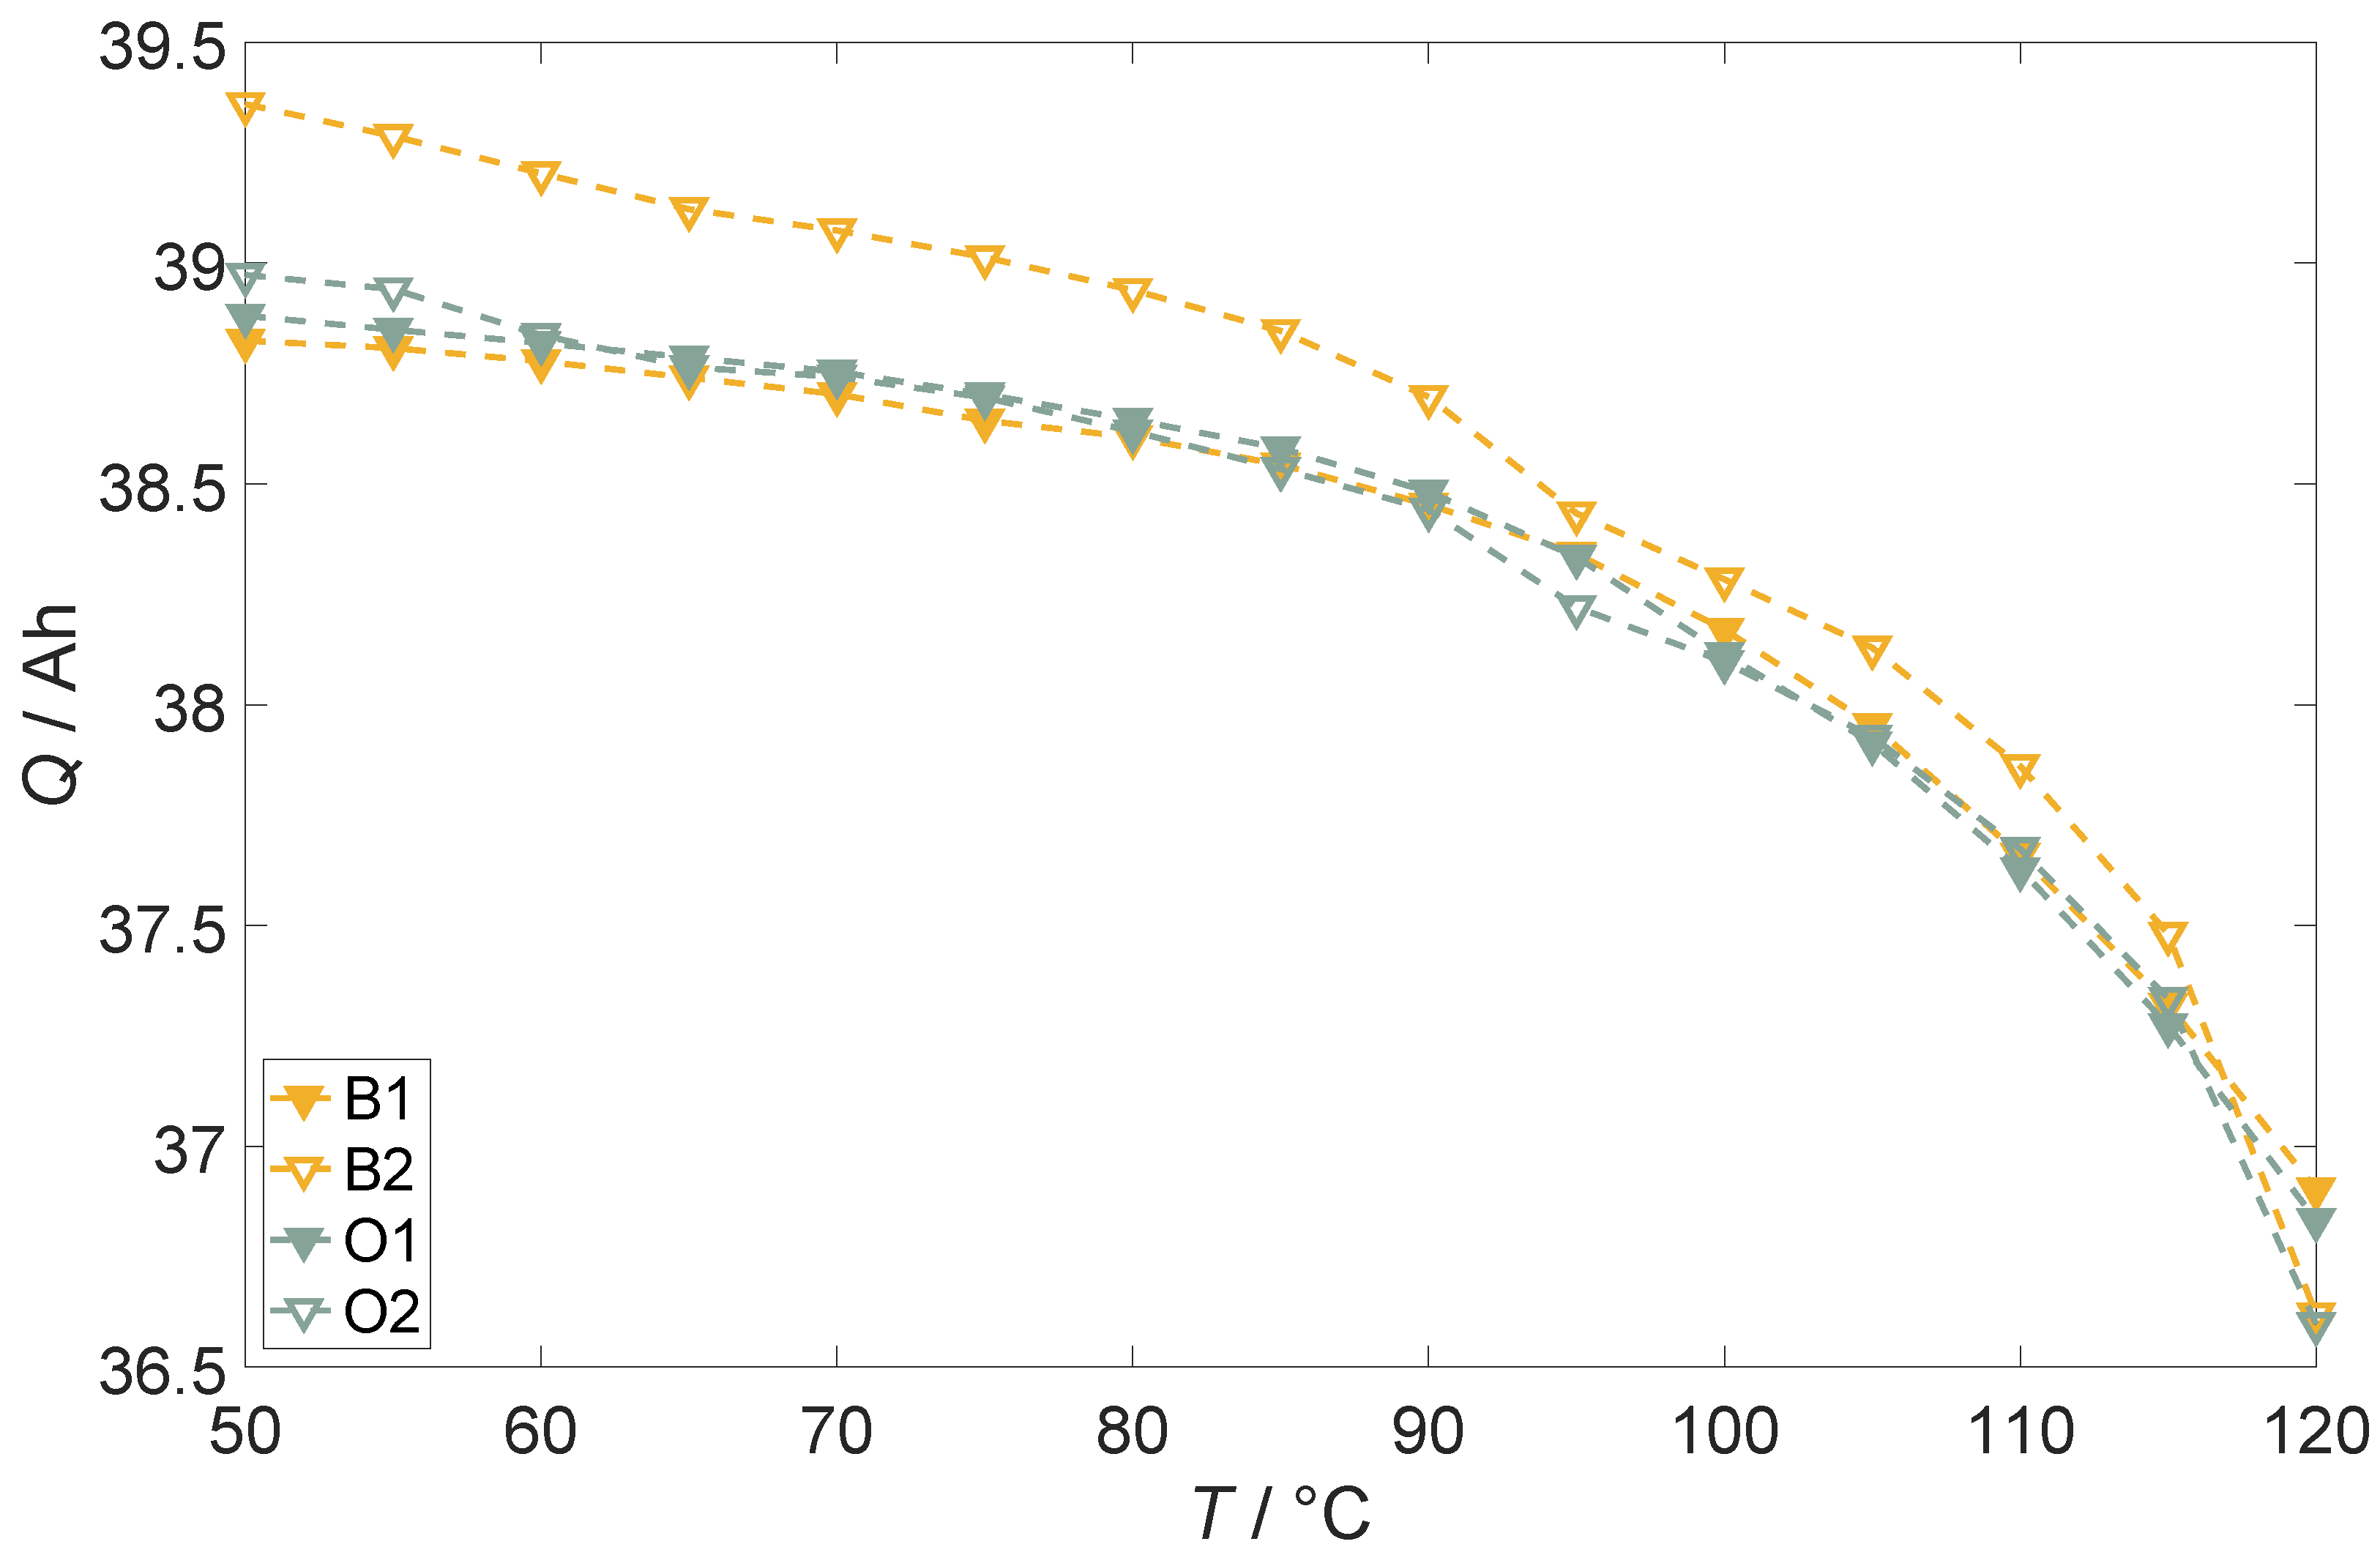
| Capacity decrease/% | 5.32 | 6.15 | 5.00 | 7.09 |
| ORI/% | 26.29 | 134.92 | 26.77 | 27.45 |
| /pm K−1—before until end of 50 °C phase | 21.2 | 19.1 | 13.2 | 18.4 |
| /pm K−1—cycle after 50 °C phase | 36.8 | 43.4 | 37.4 | 36.1 |
| Property | ① | ② | ③ | ④ |
|---|---|---|---|---|
| LLI | → | ↘ | = | = ↘ ↗ |
| LAMdeNMC111 | ←↙ | ↙ | ↙↗ | ↓ |
| LAMliNMC111 | ↘ | ↓ | = | ↓ |
| LAMdeGIC | = | = | ↙↖ | = ↘ ↗ |
| LAMliGIC | → | ↘ | = | = ↘ ↗ |
| ORI | → | → | → | → |
Disclaimer/Publisher’s Note: The statements, opinions and data contained in all publications are solely those of the individual author(s) and contributor(s) and not of MDPI and/or the editor(s). MDPI and/or the editor(s) disclaim responsibility for any injury to people or property resulting from any ideas, methods, instructions or products referred to in the content. |
© 2024 by the authors. Licensee MDPI, Basel, Switzerland. This article is an open access article distributed under the terms and conditions of the Creative Commons Attribution (CC BY) license (https://creativecommons.org/licenses/by/4.0/).
Share and Cite
Hebenbrock, A.; Orazov, N.; Benger, R.; Schade, W.; Hauer, I.; Turek, T. Innovative Early Detection of High-Temperature Abuse of Prismatic Cells and Post-Abuse Degradation Analysis Using Pressure and External Fiber Bragg Grating Sensors. Batteries 2024, 10, 92. https://doi.org/10.3390/batteries10030092
Hebenbrock A, Orazov N, Benger R, Schade W, Hauer I, Turek T. Innovative Early Detection of High-Temperature Abuse of Prismatic Cells and Post-Abuse Degradation Analysis Using Pressure and External Fiber Bragg Grating Sensors. Batteries. 2024; 10(3):92. https://doi.org/10.3390/batteries10030092
Chicago/Turabian StyleHebenbrock, André, Nury Orazov, Ralf Benger, Wolfgang Schade, Ines Hauer, and Thomas Turek. 2024. "Innovative Early Detection of High-Temperature Abuse of Prismatic Cells and Post-Abuse Degradation Analysis Using Pressure and External Fiber Bragg Grating Sensors" Batteries 10, no. 3: 92. https://doi.org/10.3390/batteries10030092