

Comparative Study-Based Data-Driven Models for Lithium-Ion Battery State-of-Charge Estimation
by
 , and
, and
Hossam M. Hussein
 ,
,
Mustafa Esoofally
,
Abhishek Donekal
,
S M Sajjad Hossain Rafin
and
Osama Mohammed
*
Energy System Research Laboratory, Department of Electrical and Computer Engineering, Florida International University, Miami, FL 33174, USA
*
Author to whom correspondence should be addressed.
Batteries 2024, 10(3), 89; https://doi.org/10.3390/batteries10030089
Submission received: 31 December 2023
/
Revised: 1 March 2024
/
Accepted: 1 March 2024
/
Published: 3 March 2024
(This article belongs to the Special Issue Advances in Battery Status Estimation and Prediction)
Abstract
:Batteries have been considered a key element in several applications, ranging from grid-scale storage systems through electric vehicles to daily-use small-scale electronic devices. However, excessive charging and discharging will impair their capabilities and could cause their applications to fail catastrophically. Among several diagnostic indices, state-of-charge estimation is essential for evaluating a battery’s capabilities. Various approaches have been introduced to reach this target, including white, gray, and black box or data-driven battery models. The main objective of this work is to provide an extensive comparison of currently highly utilized machine learning-based estimation techniques. The paper thoroughly investigates these models’ architectures, computational burdens, advantages, drawbacks, and robustness validation. The evaluation’s main criteria were based on measurements recorded under various operating conditions at the Energy Systems Research Laboratory (ESRL) at FIU for the eFlex 52.8 V/5.4 kWh lithium iron phosphate battery pack. The primary outcome of this research is that, while the random forest regression (RFR) model emerges as the most effective tool for SoC estimation in lithium-ion batteries, there is potential to enhance the performance of simpler models through strategic adjustments and optimizations. Additionally, the choice of model ultimately depends on the specific requirements of the task at hand, balancing the need for accuracy with the complexity and computational resources available and how it can be merged with other SoC estimation approaches to achieve high precision.
1. Introduction
Regardless of their types, energy storage systems (ESSs) are considered the backbone of many applications nowadays. For instance, pursuing sustainable and clean energy initiates the high penetration of renewable energy systems (RESs), forming what is now called distributed energy resources (DERs). However, their intermittent nature necessitates a storage system to store the surplus generated energy while covering the load demands during periods of scarcity [1,2]. Furthermore, the need to combat the global warming crisis brought on by the growing consumption of fossil fuels pushes governments and businesses to switch to electric vehicles (EVs), which may run partially or entirely on batteries. In this regard, batteries are recognized as the most common energy storage device that can be efficiently utilized in different sectors due to their unique capacities, durability, efficacy, and energy and power densities required by various applications. Therefore, over the last few years, batteries have undergone a revolutionary upgrade in their characteristics, features, performance, and capacities to align with the high demand in many sectors for their assistance and to cover a wide range of applications with their dynamics and variations [3].
Lithium-ion batteries (LIBs) stand out among the many energy storage systems because of their high power and energy densities, extended lifespan, exceptional efficiency, and unique sustainability features in contrast to other commercial and industrial battery types [4]. As a result, maintaining the safety of LIBs is essential for increasing their longevity, optimizing their functionality, and strengthening the system’s overall operational capacity. Several indicators are presented to provide a detailed inside view of the batteries to diagnose their performance, capability, aging, and degradation, including state of health (SoH), end of life (EoL), and state of charge (SoC). In its fundamental essence, the SoC is the present capacity status of a battery relative to its maximum charged state, while the SoH is the battery’s nominal capacity when fully charged, contrasted with its initial capacity, as shown in Equations (1) and (2). Conventionally, SoC attains 100% when the battery achieves a full charge and descends to 0% upon depletion. Conversely, SoH initiates at 100% upon the battery’s manufacturing, gradually reducing to 80% at the termination of its operational life, described as end of life (EoL). It is worth mentioning that any proper decision during the operation of EVs and microgrids (MGs) is regularly supported by these criteria, provided by the appropriate BMS [5,6,7].
If the battery is heavily engaged or regarded as the primary source of operation, as in the case of electric vehicles (EVs), prolonged charging or discharging will undoubtedly have a detrimental effect on its performance and accelerate its degradation. This might lead to a catastrophic failure or a total outage. Hence, care should be considered when utilizing the battery to ensure reliable and continuous performance and an extended lifespan [8]. As a crucial component of the BMS, SoC also serves as an input for several computations performed by the BMS, including SoH, power calculations, and cell balancing [9]. Although the SoC definition is conceptually straightforward, accurately estimating it is exceptionally challenging. The battery’s non-linear electrochemical characteristics, coupled with inconsistencies in cell performance and operating conditions within each battery pack, contribute to its complexity. Moreover, these characteristics are not static; they change with battery aging, varying temperatures, and the intricacies of charge/discharge cycles. This dynamic nature necessitates a nuanced and continuous understanding of the battery’s performance parameters, elevating the difficulty level in accurately assessing the available capacity under diverse internal and external conditions [10,11].
To achieve this target, many models with different approaches have been demonstrated and classified into three main categories, including white, gray, and black box models, varying in their complexity, estimation accuracy, and certain knowledge of battery behavior and performance. Considering at least one or more of the battery’s thermal, chemical, electrochemical, and/or electrical characteristics is the foundation of white box models. Nevertheless, these models require a thorough understanding of the non-linear behavior of batteries to reach satisfactory levels of prediction of these factors with the battery’s non-linearity. Moreover, the complexity of these models and the need for additional adaptive algorithms to manipulate the battery’s non-linear characteristics stand against their widespread use. To cope with these difficulties, gray models that employ data-driven (DD) or machine learning (ML) techniques besides the battery characteristics have been presented to minimize the previously mentioned obstacles. However, knowledge about the battery’s chemistry is still mandatory to meet the requirements. Hence, data-driven, or black box, models are presented as promising solutions that rely only on measuring specific parameters, such as voltage, current, and temperature, and do not require delving into batteries’ chemistry or characteristics.
In addition to the advantage of DD models of not requiring deep knowledge of battery characteristics, they also play a crucial role in modern BMS systems with advanced technologies such as Digital Twin (DT) [12,13]. These features motivate researchers to investigate different architectures and models to enhance state estimation results and improve BMS response. Several DD models have been introduced to provide accurate SoC estimation. The architecture of these models varies from simple models, such as linear regression approaches, to more complex models, such as long short-term memory (LSTM) and transformer NNs, with many others in between. The estimation process can be performed directly by integrating any of these models solely or by combining two or more models together as a data manipulation process before the final estimation process [14,15,16,17]. The most common models include feedforward neural networks [18], recurrent neural networks [19], fuzzy logic [20], and support vector machines [21]. However, models such as random forest regression (RFR) [22], transformer NNs [23], LSTM, and autoencoders are considered promising models for precise estimation results [24,25,26,27].
The main contribution of this paper is to provide a comparative study of the most common data-driven models used in the LIB’s state-of-charge estimation to enlighten the way for future deployment of any of these models and provide methods for model selection and to describe the main points regarding manipulating datasets and how to improve them. The investigation incorporates well-known models, such as linear regression (LR), neural networks (NNs), and random forest regression (RFR), along with others that have recently been presented, such as transformer models and LSTM. With the properties of memorizing and attention associated with some models, such as long short-term memory (LSTM) and transformer NNs, and feature extraction in random forest and autoencoder techniques, the scope of this work is to test and validate these models without incorporating any noise cancellation filters or adaptation algorithms. To address these issues, the paper is organized as follows: Section 2 covers the state-of-charge estimation approaches in general; Section 3 delves into the proposed models and their detailed structures, features, and drawbacks; Section 4 presents the system configurations, detailed models, and data preprocessing; the results and discussion follow in Section 5; and the conclusions are presented in Section 6.
2. State-of-Charge Estimation Approaches
White box models are considered completely physics-based models that rely on battery characteristics, even thermal, chemical, or electrochemical, besides a certain level of mathematical experience to build them. This category includes a variety of models, varying in their complexity and accuracy, from ampere-hour (AH) and open circuit voltage (OCV) models to more accurate and complex models such as equivalent circuit models (ECMs), electrochemical models (EMs), and electrochemical impedance models (EIMs). For instance, Rint, Thevenin, and Partnership for a New Generation of Vehicles (PNGV) are ECM models with different structures based on electrical elements, such as resistors and capacitors, as shown in Figure 1, to precisely emulate a battery’s actual behavior. Single-particle (SP) and pseudo-two-dimensional (P2D) models are kinds of EM models that describe the chemical reactions inside the battery [10,28]. To accurately estimate the SoC using any of these models, the model’s parameters must be determined precisely, which is challenging. Therefore, these models might be manipulated with adaptive filter algorithms or observers to enhance their estimation performance [29,30,31].
The main gauging factors to differentiate among these approaches are complexity, accuracy, and processing time, as shown in Figure 2. OCV is technically considered one of the simplest methods of determining a battery’s SoC, and the needed relaxation time for the battery to be chemically stable after any charging or discharging cycles is somewhat tricky and might take several hours, which makes it suitable only for providing a general indication if the battery is full or empty [32,33]. Similarly, an ampere-hour approach can give acceptable results if accurate sensors are utilized. Similarly, ECM models might need long relaxation times; however, increasing the model’s complexity, as in the PNGV and fractional order models, will provide more accuracy in the estimation and reduce the negative impact of OCV error [11]. In the same context, EIMs might be considered more accurate than others, yet the sophisticated procedures needed to build accurate models will negatively impact the processing time [34]. Furthermore, the requirement of knowledge about chemical structure has led to the P2D model’s being considered among the most sophisticated methods, as with the SP model, though to a lesser extent [28]. In contrast, the noticeable enhancements in the data-driven approach have increased their utilization. These enhancements have not only improved the existing DD models but also the conventional white models, resulting in what are known as gray box models.
Gray box models can be described in different ways. One of the more specific definitions of their function is identifying unclear patterns of specific laws within a system based on mathematical equations with machine learning techniques. Part of that is the description of the cell’s non-linearities in the equivalent circuit models (ECMs) and electrochemical-based equivalent circuit models (EECMs) through resistors and capacitors using an ensemble of NNs or prior empirical knowledge with experimental data [35,36,37,38]. Modeling a system with insufficient or limited data using a mathematical approach defined by the gray system theory is more general. For instance, a state-space representation can be introduced as a gray box model that can define the relationship between the input and output of the battery through differential equations, as in [39]. Gray Model-GM (1,1), shown in Figure 3, and the traditional Even Gray Model-EGM (1,1) are considered the most used approaches of gray relational analysis (GRA), and they can be used in many different applications, not only with batteries [40,41,42].
Because of their versatility in managing many types of data and their ability to adequately capture complicated non-linear phenomena, data-driven methods are presented, such as fuzzy logic (FL) [43], artificial neural networks (ANNs) [44], genetic algorithms (GAs) [45], and support vector machines (SVMs) [46]. These data-driven, or black box, models have gained in popularity in battery modeling. Employing a huge dataset of battery measurements, these models deploy machine learning techniques to understand the link between output variables (such as voltage and capacity) and input factors (like temperature, current, and state of charge) [47]. The DD model’s capability to identify and track a battery’s dynamics and accurately estimate the SoC has led to an increase in their utilization, since this is considered a significant challenge with the conventional white models. Further, data-driven algorithms can be adjusted to changing battery behavior over time by learning from big datasets [13,48,49].
Meanwhile, data quality is crucial for accurate estimations; care should be taken during the data collection process to improve a model’s accuracy. Moreover, selecting the proper machine learning model can enhance decision making by manipulating the data differently to avoid undesired conditions such as overfitting or underfitting at the training stage and adjust the needed computational efforts. Despite all these issues, besides the open-loop estimation technique’s lack of any feedback mechanism to improve estimation, the continuous improvement in machine learning techniques and construction is making them a promising tool in the future of battery modeling [50,51].
The evaluation of various SoC estimation techniques can be quantitatively assessed using metrics such as maximum error (ME), mean average error (MAE), mean square error (MSE), root mean square error (RMSE), and R-squared (R2) or the coefficient of determination, as defined in Equations (3)–(7). While ME can be defined as the absolute value of the most significant difference between the actual value and the predicted value () for one sample, MAE determines the average error between the true and predicted values over all samples. MSE is another metric that squares the error value before taking the average. However, it cannot accurately replicate the model’s accuracy. Therefore, RMSE calculates the square root of the MSE value to provide an in-depth indication of how bad the model is. Finally, the percentage of variance in a dependent variable’s actual values that can be accounted for by the projected values of a regression model is expressed as the R-squared (R2) value, as shown in Equation (7), where ) represents the mean value of the predicted state of charge and is defined between 0 and 1. The mathematical representation of all the previously mentioned metrics is presented in the following equations [52,53]:
Based on what we stated earlier, data-driven models are gaining more popularity in battery management systems for their diagnosis and management and for providing detailed indices of their condition and capacity. The following section will delve more into the details of the proposed models, including their architectures, pros and cons, and their utilization for battery SoC estimation.
3. Proposed Data-Driven Approaches
Several data-driven models are presented to enhance the data manipulation process and better map the provided data to the targeted output. In this section, we will cover some of these developments, starting with one of the simplest models: the linear regression approach through the basic NN model, autoencoders, LSTM neural networks, and the most recent approaches with transformer neural networks.
3.1. Linear Regression (LR) Models
A prevalent methodology within statistical modeling and machine learning involves utilizing the linear regression model. This statistical technique seeks to model the linear association between a dependent variable denoted as (Y) and one or more independent variables (X), as illustrated in Figure 4a. The fundamental premise of the linear regression model posits that the dependent variable can be expressed as the sum of the independent variables, each multiplied by respective weights, as in Figure 4b, and further augmented by an associated error term as follows [54,55,56]:
where β0 stands for the Y intercept of the regression surface, while each βj signifies the slope of the regression surface concerning variable X, which represents the impact of each independent variable, and represents the random error component at a specific instance. The least squares approach is employed for estimating the coefficients, which determines the optimal coefficients by minimizing the sum of squared residuals, representing the disparities between the actual and predicted values of the dependent variable, y [57,58].
Utilizing its historical data, the LR model can estimate the coefficients (β) that reduce the difference between the estimated and actual SoC of the battery. To check if the model appropriately reflects the relationships in the data, its performance can be evaluated using measures like R-squared, mean squared error, or other pertinent indications. It is imperative to acknowledge that, although linear regression is a clear and understandable methodology, the association between SOC and influential parameters within a battery system may not consistently adhere to a strictly linear pattern. In instances where the relationship exhibits non-linearity, more sophisticated machine learning methodologies, including but not limited to dual linear regression, random forest regression, support vector machines, and deep learning techniques such as ANNs, could be contemplated to effectively capture the intricate non-linear associations present in the dataset [59,60,61,62,63,64,65].
3.2. Random Forest Regression (RFR)
The random forest regressor constitutes an ensemble learning technique designed for regression tasks, wherein it generates an assembly of decision trees during the training process and provides the mean prediction of individual trees for a given input. During training, multiple decision trees are constructed on randomly chosen subsets of the training data, utilizing a randomized subset of features for each tree split. This injection of randomness mitigates overfitting, a concern more pronounced in a singular decision tree model. The construction of a random forest model encompasses several pivotal phases, as illustrated in Figure 5. Decision nodes and leaf nodes make up each decision tree. The decision nodes use a test function to assess each fed-in sample and then forward it to various branches according to the sample’s characteristics. To be specific, for each input vector, X, including m features with X = {X1, X2,…, Xm} and a scalar value output, Y, the training set with n samples can be described as follows [66,67,68]:
Commencing the process involves the random selection, potentially with duplication, of a subset from the training data, with this subset serving as the training set for each tree within the forest. Subsequently, a random subset comprising m characteristics is scrutinized for potential splits at each node across all trees. The feature that best segregates the data, determined by a specified objective function, often grounded in metrics such as mean squared error reduction or information gain, is then chosen as the criterion for splitting. After selecting the feature, the node undergoes division into subsidiary nodes, and this iterative process persists until a predefined stopping condition is met, such as reaching a maximum depth or having a minimum number of data points in a node [69,70,71]. Different trees (q) are created inside the random forest because of the repeated processes of feature selection, recursive node division, and record sampling. Each tree in the ensemble learns from a slightly different subset of data and features, introducing diversity to the overall forest. Upon the completion of the tree-building process, the random forest model becomes prepared for making predictions. It consolidates the predictions derived from each tree to yield more robust and accurate results, establishing itself as a formidable tool in machine learning applications, particularly in areas such as regression and classification. Once the model has completed all the previously mentioned steps, the outputs of each tree are then aggregated and averaged, where they can be calculated as follows [66,72,73,74]:
where is the output of ith tree, is the prediction function for each tree, and is a family independent of identical distributed random vectors.
With just two parameters to adjust, the number of trees (qtree) and the number of random characteristics considered for each split (Mtry) in the forest construction, the RFR approach is known for its ease of use. This simplicity renders the fine-tuning of parameters largely unnecessary to attain commendable performance. Generally, augmenting the number of trees within the forest enhances the robustness and precision of predictions, although it does introduce a heightened computational load. The generalization error tends to stabilize as the number of trees increases, signifying that the estimation accuracy plateaus beyond a certain threshold. Consequently, a sufficiently high number of trees, often defaulting to 500 trees (qtree), is commonly employed for prediction purposes. The parameter Mtry, influencing model strength and individual tree characteristics, also dictates the inter-tree correlation within the forest. While elevating Mtry can fortify each tree’s potency, it concurrently intensifies inter-tree correlations. The augmentation of tree strength contributes positively to overall model performance, although the rise in correlations among trees may have a diminishing effect. Notably, it has been observed that a default value of Mtry, set at one-third of the total number of predictive variables, is frequently an effective choice [75,76].
For estimation applications, RFR offers the advantage of handling complex datasets and capturing non-linear relationships between input variables such as voltage and currents and the state of charge [75]. Besides its simple structure, its unique features of manipulating fewer data facilitate its broad utilization in different applications [77]. Additionally, despite the lack of features, the RF is still capable of achieving promising performance for the degradation and classification tasks [78]. Furthermore, the unnecessity of the data preprocessing step, besides the quick training and estimation process, makes it an affordable option when compared to other models, such as linear regression and K-nearest neighbors [79,80]. Moreover, its ability to handle high-dimensional data and mitigate overfitting makes it well-suited for EVs and energy applications [70].
3.3. Neural Networks (NNs)
NNs represent a class of deep learning algorithms designed to mimic the structure and functionality of the human brain. These networks, composed of linked layers of artificial neurons, exchange information through numerical weights attributed to the connections, as shown in Figure 6. These weights, subject to modification based on experience, endow NNs with adaptability and learning capacity. The training phase exposes the neural network to labeled input/output pairs, wherein the network processes inputs through its layered neurons, culminating in generating output values. These outputs are then compared against the correct labels, and a loss function quantifies the error. The backpropagation process then spreads this mistake across the network, making it possible to optimize gradient descent and modify the weights between neurons. The iterative training process, characterized by the continual refinement of weights, iterates numerous times to systematically reduce the loss and enhance prediction accuracy, ultimately reaching the output layer, as calculated in the following equations [81,82,83]:
where is the input variable; is the output variable; is the output of the hidden layer; and are the weights between the input layer to the hidden layer and the hidden layer to the output layer, respectively; and, finally, and represent the deviation from the input layer to the hidden layer and the hidden to the output layer, respectively.
NNs exhibit diverse architectures, encompassing variations like feedforward neural networks, recurrent neural networks, and Elman neural networks. Throughout history, NNs have demonstrated exceptional efficacy as a class of machine learning algorithms, attributed to their proficiency in modeling intricate functions and discerning patterns within datasets. Add to this that their continuous adaptability allows them to capture intricate patterns and non-linear dependencies within battery data, making them well-suited for SoC estimation. However, notable limitations include their dependency on substantial training datasets for optimal performance, computational intensity, and susceptibility to overfitting. Therefore, the effectiveness of an NN is contingent on appropriate training data, architecture selection, and parameter tuning [13,84,85].
3.4. Autoencoders (AEs)
Within the dynamic field of deep learning, where NNs constantly evolve to discover complex patterns and representations, AEs constitute a robust and versatile family of architectures [86]. AEs have historically been employed for feature extraction or dimensionality reduction. However, autoencoders have been the front-runners in generative modeling due to the popularity of many deep learning models, particularly the models of generative adversarial networks [87]. AEs represent a distinct category of algorithms adept at acquiring the skill of compressing and proficiently portraying input data, even in the absence of explicit labels. This proficiency is achieved through a dual-component framework comprising an encoder, a decoder, and a bottleneck layer, as shown in Figure 7. The encoder converts input data into a condensed representation, commonly denoted as latent space, code, or encoding. Subsequently, the decoder reconstructs the original input from this representation. The interplay between encoding and decoding processes is pivotal for the network to discern meaningful patterns within the data, contributing to delineating crucial features [86,88]. These unsupervised learning models have drawn much attention due to their capacity to acquire efficient data representations and their applicability to various tasks, such as anomaly detection, forecasting, and image processing [89].
As we stated earlier, AEs are a compression or dimensional reduction algorithm of the input data for representation learning. For better understanding, assume we have a training set of , where , then the encoder and decoder functions, and , respectively, will be modeled as follows [87]:
where and are the encoder parameters, while and are the parameters for the decoder. If the algorithm implementation is performed through an NN, and for both will be the weight matrices and bias vectors concerning encoder and decoder neural networks [87]. It is worth mentioning that the architectural configuration of autoencoders may exhibit diversity, ranging from elementary feedforward networks to long short-term memory (LSTM) networks or convolutional neural networks (CNNs), contingent upon the specific application requirements. Since evaluating the whole process is essential to determining its accuracy, the reconstruction loss function () measures the difference between the input () and output () data similarly to the MSE [90]. Additionally, discouragement or regularization terms can be added to penalize the model when capturing noises in the training data instead of the features. This will enhance the autoencoder’s learning performance, minimize the risk of overfitting memorization, and avoid overly complex models. These two terms, which define the total loss, can be determined as follows:
where is the regularization parameter, M is the total number of wights and biases in the network, and represents the j-th parameter. The term that discourages can be either L1 regularization, which promotes sparsity, or L2 regularization, which promotes tiny weight values [90,91,92].
Deploying autoencoders in the battery state-of-charge estimation field is growing due to their unique features and continuous developments. One of the most straightforward architectures is the under-complete AE, which varies the reconstruction loss function to limit or constrain the number of hidden layer nodes or the copying task that will, in the end, reduce the amount of flowing information through the network. However, this oversimplification might lead to copying the data without extracting any features when the input capacity is too large [93,94]. Hence, sparse autoencoders (SAEs) solve this issue without reducing the hidden layer’s nodes by adding the penalization factor “regularizer”, as mentioned in Equation (3), to enhance the network sensitivity regarding a specific property within the input data. However, the performance of the autoencoder hinges on the careful choice of hyperparameters, which influences how different inputs activate specific nodes. While enforcing sparsity enhances feature discernment, it also increases computational complexity, underscoring the need for a balanced approach to hyperparameter tuning for optimal efficiency [95,96,97]. Denoising autoencoders (DAEs) are another set of popular AE models that use partially damaged input and training to recover the original, undistorted image. DAEs can efficiently extract crucial features while diminishing noise or extraneous elements, which can serve as a valuable tool for data augmentation, utilizing the restored images to generate additional training samples and enhance the model’s robustness. The denoising process, while effective, may lead to the loss of certain critical information required from the original input. This loss can potentially impact the accuracy of the resulting output [98,99,100].
In battery SoC estimation, autoencoders have proven their unique performance, outperforming many other DD models, such as support vector regression and Bayesian regression techniques [101]. Their abilities to compress data, reduce noise, and diminish dimensionality boost their wide implementation for SoC estimation [99], battery modeling [102], and SoH predictions [103]. Often, AEs have been used in combination with several estimation approaches, such as LSTM neural networks [104], look-up tables [105], particle filters [106], and deep neural networks [107]. They have mainly been used as feature extraction techniques, in addition to providing a better description of the capacity pattern concerning inputs like voltage and currents. Nevertheless, despite their remarkable accuracy, these networks frequently incur substantial computational expenses for prediction during deployment. Additionally, the majority of techniques prioritize capacity prediction for particular cell chemistries, thereby lacking the universal capability for onboard battery management system (BMS) state-of-health (SoH) predictions [101].
3.5. Long Short-Term Memory (LSTM)
NNs with LSTM are recurrent neural networks (RNNs) capable of recognizing long-term relationships between sequence data and timesteps. Because regular RNNs have trouble learning long-term temporal relationships, Hochreiter and Schmidhuber (1997) proposed LSTMs to solve some problems [108]. Because it permeates every link in the NN, the cell state is essential to LSTMs. LSTMs can retain information throughout lengthy sequences because information can flow freely along this cell state for as long as necessary [109]. Gradient-based learning becomes more challenging over extended lags due to the vanishing gradient problem that vanilla RNNs struggle with [110]. Information flowing into and out of the cell state is controlled by unique units in LSTMs called gates [108,111]. Forget, input, and output gates are the three different kinds of gates. The forget gate determines what information in the cell state can be ignored or forgotten. The input gate decides what new data are stored in the cell state. Lastly, the output gate controls the output flow of the cell state contents [112].
These gates have sigmoid and tanh activation units, which enable them to control, restrict, or permit information flow [108]. The sigmoid units, for instance, provide numbers between 0 and 1 that indicate how much of each component should pass through. To control flow, the tanh units compress values between −1 and 1. These gates determine which sequence data to retain and which to discard during LSTM training [113]. Because of this, long time lags between pertinent events enable LSTMs to establish a connection between causes and effects. After training, LSTM models perform well in anomaly detection, speech recognition [114], and other temporal sequence issues. Several LSTM layers are stacked in common LSTM architectures to allow for greater complexity [115]. To provide more context, bidirectional LSTMs pass sequence data in both directions [116]. There have also been other LSTM variations, such as GRU layers [117], peephole connections [112], and forget gate initialization [118]. Lastly, the ability to process sequential data, connect distant events in time series, and remember longer patterns has made LSTMs indispensable. LSTMs will probably become more important as research on this topic continues to use AI to analyze longitudinal data.
Figure 8 shows the architecture of the LSTM, where it can be observed that the LSTM architecture, a variant of RNNs, is structured around three gates—the input gate controlling input information, the forget gate managing the retention or deletion of past information, and the output gate regulating the information to be used for predictions. Alongside these gates, the LSTM maintains a cell state to store and propagate information across sequences, mitigating the vanishing gradient problem and enabling the model to effectively capture and retain long-term dependencies in sequential data. Moreover, the inputs and outputs of an LSTM for a single timestep are illustrated in Figure 8. These are one timestep input and output and the equations for a time unrolled representation. The LSTM has an input, xt, which can directly be the output of a CNN or the input sequence. Moreover, ht−1 and ct−1 are the inputs from the previous timestep LSTM.
Then, is the output of the LSTM for this timestep. Furthermore, the LSTM generates ct and ht to consume the next timestep LSTM. Moreover, the LSTM produces ft, it, and c′t for internal calculations. The equations are as follows [119]:
where ft and it are the forget gate and the input gate, respectively, and ct and ht are the cell state and hidden state, respectively. The dot operators (.) used in Equations (21) and (22) denote the Hadamard product or element-wise product. Furthermore, Wf, Wi, Wo, Wc, Uf, Ui, Uo, and Uc are the Wright matrices, and bf, bi, bo, and bc are biases that are time-independent variables. Finally, σg, and σc are sigmoid and tanh functions, respectively [119].
Battery management systems rely on accurately forecasting and controlling the SoC to ensure efficient operation across various industries. Long short-term memory (LSTM) networks have emerged as powerful tools for this task due to their ability to capture temporal dependencies from multidimensional time-series data [108]. This is due to their specialized architecture, which can learn long-term temporal dependencies from sequence data like charging/discharging cycles. Unlike regular recurrent neural networks, LSTMs overcome issues like vanishing gradients and can effectively model the non-linear response of batteries. In one study, a multilayer LSTM network for SoC estimation was created and trained using data from simulated lithium-ion batteries [28]. Across a range of operating conditions, the LSTM demonstrated over 95% SoC estimation accuracy, outperforming previous RNN and DNN models. The trained LSTM network was also implemented on a physical battery management system to confirm its real-time applicability. Moreover, LSTMs automatically extract features from sensor data, enabling real-time SoC estimation and control, which is crucial for maximizing driving range and battery life. Additionally, LSTM networks facilitate prompt identification of malfunctions or deteriorations in battery systems, enhancing overall dependability and durability [108]. LSTMs can optimize driving range, lifespan, and safety by tracking SoC when applied to battery management systems.
The input layer of the LSTM architecture begins by gathering unprocessed temperature, voltage, and current data from battery sensors. After processing the time-series data and identifying temporal relationships, this data flows into stacked LSTM layers. Real-time decision making in the battery management system is facilitated by the output layer of the LSTM network, which generates predictions and classifications based on the state of charge. An integrated training procedure that optimizes accuracy under various circumstances is performed in the central LSTM layers. Before the LSTM layers, separate data preprocessing and fusion stages normalize raw signals and concatenate sensor data. The main issues are future-focused, improving the network’s capacity to deliver reliable estimations across a range of operating scenarios and simplifying complexities for embedded systems. The overall goal of the synergistic elements is to precisely track the state of charge by utilizing LSTM’s strengths in temporal dependency analysis.
Several specialized LSTM architectures have been developed to address specific challenges in SoC estimation. An example of a hierarchically processed charge/discharge curve structure is a stacked LSTM structure, where the higher layers concentrate more on long-term history and the initial layers extract short-term patterns [120]. Compared to single-layer LSTM designs, such multiscale modeling increases accuracy across battery chemistries while reducing model complexity. Moreover, attention-based LSTM architectures have been developed, emphasizing more dynamic representative cycles using attention mechanisms [121]. Acquiring large-scale battery profile datasets that generalize across usages, ages, temperatures, and other factors is expensive to achieve robust model performance. Techniques such as transfer learning from less expensive surrogate batteries show the potential to lower the amount of data required by LSTM-based SoC estimators [122]. Furthermore, robust adaptive SoC tracking is provided by LSTM architectures. Additional studies on transfer learning techniques and constrained attention-based LSTM variants may address data availability bottlenecks.
Additionally, improvements like attention mechanisms, stacked bidirectional LSTMs, and hybrid models combined with physics-based components have all been tested in research [123]. When compared to standalone models, these extensions increase the accuracy of LSTM’s SoC estimation and fault diagnostic capabilities. As battery chemistry changes, paying particular attention enables the network to dynamically emphasize more pertinent charge/discharge parameters [124]. Furthermore, there is great potential for high-accuracy battery SoC tracking with LSTM neural networks. The temporal dynamics of battery cell chemistry are well suited to their sequence learning strengths. Smarter real-time battery management in electric vehicles, consumer electronics, and grid storage systems may eventually be made possible by technological advancements like lower-power machine learning chips and long short-term memory (LSTM).
Moreover, ConvLSTM methods use convolutional neural networks in tandem to find informative spatial patterns in the multivariate input signals that represent temperature, voltage, and current. Together, these LSTM developments capture the temporal and spatial dynamics present in battery data streams, learning to highlight significant correlations and pivotal moments throughout the series of measurements. The refined multimodal awareness via convolutional fusion, bidirectional passaging, attentional reweighting, and stacked representations eventually improves battery management and SoC forecasting. The integrated architecture highlights the importance of considering various angles when analyzing battery operating conditions.
3.6. Transformer (TR)
The Transformer architecture, a novel deep-learning method for sequence modeling that is entirely based on attention mechanisms, was first presented in [125]. Modern outcomes have been attained by transformers in critical tasks such as speech recognition [126], language modeling [127], and machine translation [128], outperforming recurrent and convolutional neural networks. Transformers use self-attention to infer global dependencies between inputs and outputs in a sequence, rather than recursion or convolution. The central transformer module makes long-range context modeling possible, determining the attention weights between each element pair. Since the self-attention layers lack intrinsic order sensitivity, positional encodings can capture ordering information. During training, gradient flow is aided by residual connections and layer normalization [125].
Some of the optimization and computational limitations of the original transformers are overcome by refinements like the use of deep residual learning frameworks [129], augmented memory [130], sparse factorizations [131], and bifurcated attention [132]. Variants tailored for graphs, images, and reinforcement learning tasks show how versatile the model family is [133]. Furthermore, various sequence learning problems have seen record-breaking performance thanks to the transformer architecture and its attention-focused methodology. Current research indicates that transformer interpretability, efficiency, and capability will continue to improve, enhancing numerous downstream artificial intelligence applications.
Transformer architectures have shown promise in sequential data tasks such as SoC estimation; they were first widely used in natural language processing. These models use self-attention mechanisms, which allow the network to analyze various input sequence segments and identify important information pertinent to SoC prediction. Instead of LSTMs, transformers process the entire sequence at once, making it more effective to compute dependencies throughout the sequence. Transformer-based ANNs’ attention mechanisms are critical in concentrating on pertinent sensor data, which vary in significance for precise SoC estimation. The self-attention mechanism enables the model to predict SoC levels by giving different sensor measurements to weights, highlighting important information. This flexibility regarding sensor inputs enhances the transformer’s capacity to manage various data types and recognize intricate patterns.
Transformer-based architectures are also excellent at processing multidimensional sensor data because of their high parallelizability. Transformers are excellent at capturing long-range dependencies and contextual information by processing the entire sequence simultaneously. This is important because it helps to understand the dynamics of battery behavior across a range of temporal scales. By adeptly capturing the complex patterns and dependencies in sequential battery data, transformer-based ANNs use their capacity for parallel processing, contextual understanding, and attention mechanisms to accurately predict battery SoC levels. These architectures provide an alternative method to LSTM-based models, demonstrating advantages in managing heterogeneous datasets and long-range dependencies and improving SoC forecast precision and flexibility.
Figure 9 illustrates the transformer model architecture, which consists of input embeddings that encode tokens and positional encodings to retain sequence order. Multi-head self-attention layers weigh different input parts, enabling the model to learn relationships between parts. Stacks of encoders process input sequences, while decoders generate outputs in translation tasks. Feedforward neural networks and normalization layers enhance transformations and stabilize training. Finally, output layers predict the successive parts or generate outputs. This architecture’s innovation lies in its ability to capture intricate dependencies within sequences, making it highly effective across diverse language tasks [125]. To describe the model in mathematical terms, the architecture may be divided into several segments, namely, self-attention, multi-head attention, feedforward networks, and layer normalization:
where Q, K, and V denote the query, key, and value matrices, respectively. Moreover, dk represents the dimensionality of the key.
where headi = Attention (QWiQ, KWiK, VWiV), WiQ, WiK, and WiV are linear transformation matrices and W0 is the output linear transformation matrix.
where W1 and W2 are weight matrices. Moreover, b1, and b2 are bias vectors, and ReLU represents the rectified linear unit activation function.
where γ and β are learnable parameters, μ and σ are the mean and standard deviation, and ϵ is a small constant for numerical stability.
As previously noted, sequence modeling issues, such as battery SoC estimation, have gained attention due to the transformer architecture that was suggested in [126]. Unlike recurrent networks, transformers only use self-attention to identify global dependencies between inputs. This allows implicit learning of complex cell dynamics over long charge/discharge profiles for battery SoC modeling [134]. Compared to RNN alternatives, research has developed transformer structures to capture long-range SoC correlations with fewer training samples [135]. SoC Transformers extract temporal features using sinusoidal positional encodings applied to battery operating measurements. After the transformer encoder and decoder stacks, linear layers are added to calculate the SoC values [136].
Compared to baseline models, improvements such as adding auxiliary losses are found to improve convergence and SoC accuracy [137]. SoC transformers have also been paired with physically based inductive biases, which constrain them to follow thermodynamic properties during training [138]. These hybrid methods show a reduction in SoC root mean square error of up to 2% for various lithium-ion battery chemistries [138]. Transformer networks generally exhibit a promising degree of adaptability when managing intricate temporal phenomena in battery systems. Enhancements like enhanced interpretability via attention heads may improve fault diagnostics and model transparency. Reducing the computational demands of SoC transformers could facilitate their implementation in battery management systems and electric vehicle applications with limited resources.
Raw time-series battery data measurements, including voltage, current, temperature, and so forth, are sent to the input layer. This input then goes through an input encoding layer to assign positional embeddings and prepare the data for the transformer model. There are encoders and decoders inside the transformer itself. The encoder uses multi-headed self-attention to extract long-range dependencies and patterns from the battery data sequences. To arrive at the final SoC predictions, the decoder combines these representations. Additional components could be incorporated to aid training and improve accuracy. After some postprocessing, the output layer finally yields the SoC estimates from the transformer architecture. Plotting or comparing the actual SoC values gives the estimation error.
Several essential elements comprise the transformer-based artificial neural network architecture for battery state-of-charge estimation. The input layer receives raw data signals from voltage, current, and temperature sensors that are fixed on the battery. A sequence of stacked transformer layers receive this sensor data and use attention mechanisms to identify intricate relationships between the input variables and the battery state of charge. The output from the subsequent transformer layers functions as state-of-charge predictions and classifications to provide the larger battery management system with crucial inputs for real-time decision making and control. An integrated training process that uses optimization techniques to raise prediction accuracy under various operating conditions envelops these core layers. Before the transformer layers, the architecture includes specific data preprocessing and fusion stages that normalize the unprocessed sensor data and combine various input signals into cohesive representations. Moreover, two noteworthy obstacles are improving the network’s capacity to yield precise approximations under widely disparate circumstances and minimizing the computational complexity of embedded system applications. The transformer-based approach has the potential to significantly improve battery state awareness and charge optimization capabilities by bringing these essential components into harmony.
4. System Configuration
The examined system, as illustrated in Figure 10, comprises a 52.8 V/5.4 kWh lithium iron phosphate battery interfaced with a personal computer via a controller area network (CAN) bus to monitor battery status and facilitate data collection. A strategic data collection was executed under diverse testing conditions to furnish an expansive array of datasets and operational scenarios, thereby enhancing precision in the estimation process. The data acquisition process involved a series of pulsed charging and discharging tests with rate of 0.1C, each constituting 10% increments of the actual SoC, interspersed with a two-hour relaxation period between successive segments to attain chemical stability in the battery. In addition to the pulsed tests, several continuous charging and discharging assessments with rates of 0.1C and 0.05C for both modes were conducted to emulate prevalent operational scenarios. Further, the continuous charging and discharging processes were performed at different SoC levels to provide more data during each step. For instance, we started to charge the battery fully from 70%; in other cases, we started the continuous full charging from 30%, which would have subjected the cells and battery to more chemical stress and increased the internal temperature as well. Similar conditions were imposed through the continuous discharging process with different SoC%s. This multifaceted approach to data collection contributes to the breadth of datasets and ensures a comprehensive representation of diverse operating conditions, thereby augmenting the accuracy of the subsequent estimation processes. Additionally, these different and repeated testing patterns provide a wide range of temperatures to fully reflect the different operating conditions for battery utilization in different applications.
4.1. Data Preprocessing
The dataset incorporates 94,955 entries of battery system measurements that encapsulate 14 distinct parameters associated with battery SoC. The dataset encompasses information regarding the battery unit, such as voltages, charging and discharging currents, SoC, unit pre-voltage, insulation resistance, and energy levels. Moreover, it includes other details regarding the unit cells, such as minimum and maximum cell voltage and temperature. A Python code was generated to handle the whole process, starting from preprocessing until the results of each model. The heatmap shown in Figure 11 presents the correlation coefficients between each pair of the collected data; however, it only provides the linear correlation between the data: non-linear relationships or dependencies are not captured in this measurement.
The dataset includes information regarding the 16 cells forming the battery pack or unit, such as maximum and minimum cell voltages and temperatures, named max cell volt, min cell volt, max temp, and min temp, respectively. Moreover, unit SoC, unit current, and unit voltage measurements replicate the total SoC, current, and voltage of the battery pack; these values are calculated on an average basis for all 16 cells of the battery. Further, charging and is Charging, are binary numbers categorizing the data into ‘charging’ or ‘discharging’ states. Additionally, insulation resistance is the parallel equivalent resistance of the insulation resistances of the positive and negative terminals with respect to the ground reference. Furthermore, avgcells is an added feature calculated based on the voltage measurement of the 16 cells in the battery pack.
The data preprocessing was created through several steps, as shown in Figure 12, to transform and standardize the raw input data, facilitate subsequent analyses, and ensure that the information was presented in a format conducive to accurate and efficient processing. To make the data cohesive with a continuous index, the preprocessing workflow starts by creating a new feature called combined_datetime, formed by concatenating the day and time columns and converting them into datetime objects, streamlining analysis by consolidating date and time information into a single timestamp. We dropped the redundant columns from the DataFrame during the second step to declutter the dataset and minimize usage memory. The combined_datetime column is then repositioned in the third step to be established as a primary index of temporal reference. Through the fourth step, we created a new feature named time_difference, which is generated by subtracting the minimum datetime value in the combined_datetime column from all the datetime entries within the same column, then converting them to total seconds and combining them into a single cohesive DataFrame at the fifth step. This process provides a continuous, numeric measure of the time elapsed since the beginning of data collection, facilitates time-series modeling, and assists in identifying trends and patterns over time. Further, it emphasizes the dataset’s chronological sequence, which is crucial for any form of temporal analysis, including forecasting and regression modeling.
Outlier detection and imputation are critical steps in the data preprocessing for statistical analysis and predictive modeling. Outliers can significantly impact the results and interpretations of analyses, often skewing the distribution and influencing parameter estimates. During the sixth step, the data were comprehensively analyzed through statistical metrics, including means, standard deviations, minimums, 25th percentiles, medians, 75th percentiles, and maximums. Boxplots serve as an exploratory tool for identifying such outliers in this step. Once outliers of 0.007% are identified, the strategy for imputation involves replacing these values with the nearest calculated boundary, which in our study was defined as the mean three times the standard deviation. This ensures that the data’s integrity is maintained, avoiding the introduction of arbitrary values. Only the upper boundary replacement is employed in contexts where negative values are not feasible, such as in certain physical measurements. Post-imputation, the dataset is characterized by the alignment of extreme values with the established thresholds, thus mitigating their skewing effect. Finally, we normalized the data using min–max scaling, which rescales the data without distorting differences in the ranges or values. This ensures that the scale of the features does not bias the performance of the learning algorithms. By systematically addressing temporal data, eliminating superfluous features, and standardizing the dataset structure, the preprocessing steps performed laid the groundwork for rigorous data-driven exploration and modeling of battery performance characteristics.
To facilitate a nuanced assessment of the proposed model’s efficacy and generalization capabilities, the dataset underwent partitioning into two distinct subsets, employing the widely endorsed 80/20 ratio. There are several data-split approaches that were used, such as the 80/20 or k-fold methodologies. In fact, k-fold cross-validation might reduce the variance of the model performance estimate by using different subsets of the data for training and validation. However, training models like LSTM, transformers, and deep autoencoders will be computationally expensive. In this study, we utilized the 80/20 split strategy to split the data randomly. This procedural approach entails allocating 80% of the data to the training set for model training while reserving the remaining 20% for the test set. In addition, we used the random seed concept to always use the same data in each iteration, irrespective of the randomness of the data. The 80/20 train–test split helped us provide a reliable estimate of model performance, considering our dataset was large enough. Given the diverse set of models, we prioritized ensuring that complex models like deep neural networks did not overfit a smaller training set, which could be a risk with repeated training on slightly different data subsets in k-fold cross-validation.
4.2. Linear Regression Model
The architecture of a linear regression model is straightforward, consisting of a single layer that represents the linear equation y = wx + b, where w represents the weights or coefficients, x represents the input features, and b represents the bias or intercept. The input to the model is the feature vector, which includes all the independent variables used for prediction. Meanwhile, the output is a single value representing the model’s prediction for the dependent variable. This value is calculated by applying the linear equation to the input features. During the compilation of a linear regression model, a loss function such as mean squared error (MSE) is used to measure how well the model predicts the dependent variable. The model is trained using an optimization algorithm like gradient descent to minimize this loss function by adjusting the weights and bias. Using the scikit-learn library, Python code was written to implement our linear regression model. Further, the model was trained using the .fit() method, and predictions were made with the .predict() method.
4.3. Random Forest Regression Model
In this study, the random forest regressor was chosen, a toolkit from Scikit-learn, to plant our forest of 100 trees. Firstly, a bootstrapped sample of the training data is generated. This sample is the same size as the original training set but is drawn with replacement, meaning some observations may be repeated while others are left out (known as out-of-bag instances). We observed in this study that raising the number of trees beyond the 100 threshold yields diminishing improvements in prediction accuracy and increases runtime. In the following step, each tree is grown on its bootstrapped sample. At each node, a random subset of features is chosen from the full feature set. The algorithm then starts to identify the best split from this subset based on the criterion of minimizing variance within the nodes created by the split. In the next step, the trees are grown to their maximum length unless other stopping criteria are met, such as a minimum number of samples required to split a node further or a minimum number of samples required to be at a leaf node. Once the training process is complete, the model makes predictions by averaging the predictions of 100 trees. For a regression task, each tree predicts a numerical value for the given input, and the forest’s output is the average of these values, which tends to be more accurate and robust than individual tree predictions.
4.4. Neural Network Model
The proposed neural network model architecture for the SoC application is characterized by an input layer that accepts a 12-dimensional feature vector, followed by two hidden layers, each with 32 neurons, and a final output layer that generates a single continuous output value. The information on the structure and process flow is illustrated in Figure 13. The input layer is implicitly defined by the first dense layer of the model, which specifies the input shape to match the 12 features of the input data. This layer is essential for adapting the model to the specific structure of the dataset. The proposed network incorporates two hidden dense layers with 32 neurons each. These layers employ the rectified linear unit (ReLU) activation function, which introduces non-linearity into the model, allowing it to learn complex patterns and interactions between the input features. The output layer consists of a single neuron with a linear activation function. This setup is chosen to produce a single scalar value as the output, fitting the requirements of a regression task.
The input layer is implicitly defined by the first dense layer of the model, which specifies the input shape to match the 12 features of the input data. This layer is essential for adapting the model to the specific structure of the dataset. The ‘none’ dimension is a placeholder for any batch size, which allows us to feed the network any number of samples at once during training or prediction. This flexibility in the number of samples allows us to experiment with many different training combinations. The 12 indicates that each sample in our dataset has 12 features. This is the dimensionality of the input data that the network expects. This term has the same function for the following models as well. The proposed network incorporates two hidden dense layers with 32 neurons each. These layers employ the rectified linear unit (ReLU) activation function, which introduces non-linearity into the model, allowing it to learn complex patterns and interactions between the input features. The output layer consists of a single neuron with a linear activation function. This setup is chosen to produce a single scalar value as the output, fitting the requirements of a regression task.
The model is compiled with the Adam optimizer, an algorithm for first-order gradient-based optimization of stochastic objective functions. The loss function is set to mean squared error, aligning with the regression objective to minimize the average of the squares of the differences between the predicted and actual values. An epoch represents a single pass through the entire training dataset, while the batch size dictates the number of samples processed before the model is updated. We fit and train the model on the training data over 100 epochs with a batch size of 32. The Keras library’s sequential model is utilized to establish the architecture, ensuring an intuitive and flexible environment for building and training the neural network. TensorFlow’s robust back end facilitates efficient training and model evaluation, rendering the neural network a potent tool for regression analysis.
4.5. Autoencoder Model
The proposed model leverages an autoencoder structure for feature extraction, followed by a regression layer for prediction. This approach combines the strengths of deep representation learning with the specificity of regression analysis. The autoencoder comprises symmetrical encoding and decoding pathways, interspersed with batch normalization and dropout layers, and culminates in a regression output. Figure 14 illustrates the structure of the AE used in the SOC application in this paper.
The encoder begins with an input layer designed to receive a feature vector of dimensions. It is followed by a fully connected layer with 128 neurons employing the rectified linear unit (ReLU) activation function, promoting non-linearity in the learned representations. To stabilize the learning process and accelerate convergence, a batch normalization layer follows, normalizing the activations from the previous layer. A subsequent dropout layer with a rate of 0.3 is employed to enhance generalization by randomly omitting a subset of the features during training, thus preventing overfitting. The encoding process continues by dimensionally compressing the data through another dense layer, this time reducing the feature space to 64 dimensions, again followed by batch normalization and dropout layers for regularization. At the heart of the autoencoder lies the bottleneck layer. This dense layer, comprising 32 neurons, represents the most compressed form of the input data. The bottleneck serves as a critical juncture where the model is forced to learn the most salient features of the data.
Mirroring the encoder, the decoding pathway begins with a dense layer of 64 neurons with ReLU activation to initiate the reconstruction of the original input from its compressed form. Batch normalization and dropout layers are again utilized to maintain the model’s robustness and mitigate overfitting. The reconstruction continues by expanding the feature representation back to 128 dimensions through another dense layer, similarly, followed by batch normalization and dropout for consistency in regularization. The model transitions from the unsupervised architecture of the autoencoder to supervised learning at the output layer. A final dense layer with a single neuron employs a linear activation function to produce the predicted continuous value, aligning the model’s output with the regression task.
The model is compiled with the Adam optimizer, selected for its adaptive learning rate capabilities, which adjust the learning rate for each network weight based on the gradients’ first and second moments. The loss function is set to MSE, quantifying the average of the errors’ squares between the predicted and actual values, with MAE providing an additional interpretive metric of average absolute errors. The constructed deep autoencoder demonstrates a sophisticated dimensionality reduction and predictive modeling synthesis. The architecture’s deliberate layering and regularization techniques, optimized with a robust learning algorithm, equip the model to learn efficient data representations and perform regression analysis effectively.
4.6. LSTM Model
The proposed LSTM-based model employs a deep architecture to process sequences and predict continuous outcomes. The LSTM model is fine-tuned using a specific configuration of hyperparameters and evaluated for its performance using mean squared error (MSE) as a loss function, under the optimization of the Adam algorithm. This study details the architecture of a sequential LSTM model tailored for regression in time-series forecasting, focusing on its parameterization and the empirical rationale for hyperparameter choices. The structure of the LSTM model used in this paper focusing on SOC applications is illustrated in Figure 15.
The sequential LSTM model commences with an LSTM layer containing 300 neurons. This layer is characterized by parameters that control the gates responsible for regulating the flow of information, including cell states and hidden states. The ReLU activation function introduces non-linearity, aiding the model in capturing complex relationships. To curtail overfitting and encourage robust learning, a dropout of 0.25 is applied, randomly turning off a proportion of neurons during training, along with a recurrent dropout of the same rate to regularize the internal connections of the LSTM. Following the LSTM layer is a cascade of dense layers with descending neuron counts: 300, 200, 100, and 50. These layers progressively refine the features extracted by the LSTM layer, each undergoing a ReLU transformation. The culmination of this series is a single-neuron output layer with a linear activation, yielding the final regression output.
The hyperparameters, including the number of neurons in the LSTM and dense layers, dropout rates, and a batch size of 64, were meticulously selected to balance the model’s capacity to learn from the data without overfitting. The batch size, in particular, was chosen to optimize the trade-off between the stability of the gradient estimation and computational efficiency. Adam was utilized as the optimizer, renowned for its adaptive learning rate capabilities that adjust based on the gradients’ moving averages. This choice ensures that the learning process is efficient and dynamic, adapting to the topology of the error surface.
4.7. Transformer Model
The structure of the transformer model used in this paper focusing on SOC applications is illustrated in Figure 16. The model’s architecture was established to process an input layer matching the feature vector’s dimensionality. A subsequent dense layer elevates the data into a higher-dimensional attribute space, a process governed by a set of parameters, including weights and biases. In this model, the hyperparameters include:
- Number of Attention Heads: This dictates how many different parts of the input sequence are attended to simultaneously. Set at 32, this allows the model to simultaneously attend to various segments of the input sequence, providing a rich and diverse representation of the input space.
- Embedding Dimensionality (d_model): This determines the size of the input projection space, impacting the model’s capacity to capture information. With a value of 64, it provides a balance between model complexity and computational efficiency, ensuring sufficient representation capacity without incurring prohibitive computational costs.
- Feedforward Network Dimensionality (dff): This influences the complexity of transformations within the feedforward network.
- Dropout Rate: This controls the dropout regularization technique to prevent overfitting. The dimensionality of 32 allows the network to perform a series of transformations that are complex enough to capture non-linear relationships but not so complex as to overfit the training data.
- Learning Rate: This affects the rate at which the model updates its parameters during training. A dropout rate of 0.1 helps in regularizing the model, encouraging the development of more robust features that are not reliant on any small subset of the neurons.
- Batch Size: This specifies the number of samples that are propagated through the network before the model’s parameters are updated. We use a smaller batch size of 32 because it is less demanding on memory resources and makes it feasible to train a complex model such as a transformer.
- Epochs: This defines the number of complete passes through the entire training dataset. We use 10 epochs as it is less demanding on memory resources and makes it feasible to train a complex model such as a transformer.
Due to its adaptive learning rate properties, the model is compiled with an Adam optimizer, a hyperparameter. The loss function, mean squared error, is selected to quantify the discrepancy between the predicted and actual values. Training proceeds across multiple epochs, with the model’s parameters being iteratively refined to minimize the loss function. Adam’s adaptive learning rates and efficient navigation of parameter spaces, combined with MSE’s direct correspondence with the regression objective, result in a synergistic effect that promotes accurate and reliable predictive modeling.
5. Results and Discussion
Before explaining the results, we must highlight the major differences between the proposed models in terms of their tunability, model or memory size, core parameters, number of layers, and type, as presented in Table 1. Typically, all deep learning models will have hidden layers, and the correlation between these layers is determined based on predefined mathematical equations; however, the situation is different with regression models. For instance, NNs and autoencoders have dense layers, while the LSTM has its own LSTM unit, and transformers are known for their multi-head attention units. In contrast, linear regression has no layers at all, while random forest regression is built based on trees, and the decision aggregated through these trees is based on the degree of certainty. In this regard, the details of these layers, such as their numbers, do not apply to the regression models.
Another critical aspect to differentiate between these models is their memory size and their ability to tune their hyperparameters. Since all the models, except the linear regression one, include many layers, the possibility of tuning more parameters can exist. For instance, the total number of layers, neurons per layer, and activation functions are the parameters for the NN and AE, while the total number of trees, their depth, and estimation cycles are associated with RFR models. Further, the number of attention heads and the return sequences are related to the transformer and LSTM models, respectively. An additional important aspect of the comparison is the size of the model and its complexity. As the LR typically has no layers, it is considered the least complex model, while reducing the number of layers and neurons can significantly reduce the complexity of the NN and LSTM models. On the other hand, the complex architectures of the AE, RER, and transformer models are inevitable, although they are known for their high precision. Other additional details for each model are illustrated in Table 1.
We assessed the performance of our models by plotting the models’ anticipated SOC values against the actual measurements on the dataset, as depicted in Figure 17. The resultant scatter plots enable visual evaluation of the agreement between predictions and observed values. The proximity of scattered data points to the diagonal 45-degree red line indicates each model’s efficacy. Furthermore, we computed essential regression metrics, summarized in Table 2, including mean squared error (MSE), mean absolute error (MAE), and R-squared values, to provide a detailed comparison of the models and their efficiency with a common baseline. From a closer look at Figure 17, besides Table 2, we can see clearly that the six models are able, in general, to capture the SoC pattern within the provided dataset. However, in an in-depth assessment, we can notice the remarkable performance of the RFR model, while the LR model is the worst. In between, the LSTM and transformer models can provide precise estimation, followed by AE and NN, respectively.
While the LR model, shown in Figure 17a, basically linearizes the input dataset to estimate the SoC, the non-linearity characteristics of the battery cannot be captured easily with this model. This is clear from its having the lowest R2 value of 0.949 among the six models. However, LR can serve as a baseline for other models with a faster training time. An augmentation in SoC prediction accuracy becomes evident upon transitioning to a non-linear NN model. The scatter plot in Figure 17b illustrates a closer alignment between forecasted and observed values when contrasting neural network predictions with authentic SoC values. This improvement is corroborated by reduced regression metrics, with an MSE of 19.13 and an MAE of 2.63 compared to the LR model. The heightened R-squared value of 0.97 indicates that the neural network model can elucidate a more significant proportion of the variance in actual SoC predicated on the input factors. The intricate layered architecture of the neural network facilitates the modeling of higher-order interactions and the discernment of patterns.
The AE model is typically used for unsupervised learning tasks like dimensionality reduction. In our study, we adapted it for the regression task of SoC estimation. Batch normalization in each layer promotes quick and stable learning, and the dropout at 0.3 aids in generalizing the model. However, its performance, as shown in Figure 17c, resulted in a lower R2 value of 0.983, indicating less accuracy in SoC estimation than the transformer model. Generally, transformer models are used for natural language processing tasks. Still, they perform better than expected when used for regression tasks due to being inherently good at handling sequential data, which is common in many regression tasks. The attention mechanism, a part of the transformer model, allows us to focus on different parts of the input sequence, which can be beneficial in identifying complex relationships in the data. The transformer model results, as shown in Figure 17d, demonstrated a high R-squared value of 0.993, suggesting a better fit to the data than the AE model.
The LSTM architecture is specifically designed to capture long-term dependencies in sequential data, an essential feature for accurately predicting SoC, which depends significantly on past and current battery states. The LSTM model utilizes its inherent strengths in processing time-series data, which are proven by its promising results. With its ability to effectively address the vanishing gradient problem common in traditional RNNs, the LSTM model performance, as illustrated in Figure 17e, achieved a high R-squared value of 0.9989, indicating higher efficiency when compared to the transformer model. In contrast to previously discussed models, the random forest regression model stands among the most effective tools. Its superiority lies in its ability to accurately predict SoCs with high precision, as evidenced by its outstandingly low mean square error (MSE) of less than 0.01%. This high level of accuracy can be attributed to the model’s ability to handle complex, non-linear data relationships, which are common in battery charge estimations.
This paper focuses on comparing different models for estimating the SoC in lithium-ion batteries. This comparison, as shown in Table 2, essentially revolves around evaluating which model performs the best and understanding the complexity levels of these models in achieving similar results. To enhance the performance of simpler models like LR, one could investigate feature extraction to identify more relevant predictors or create interaction terms that better capture the relationships in the data. For models like NNs, improvements could involve fine-tuning the network architecture, experimenting with different activation functions, and employing regularization techniques to avoid overfitting. Regarding the AE models, adapting the bottleneck layer to capturing essential data features is crucial. Its compilation with the proper optimizer can ensure robust and effective training toward a more precise SoC. Meanwhile, the transformer’s attention mechanism and the NN’s flexible architecture are well-suited for modeling complicated systems, but they may require more careful tuning to reduce the prediction spread and outliers. In our way to enhance the LSTM model, we used one LSTM layer as input and subsequently kept adding more dense layers until we hit a point where the errors started increasing. Also, when we implement just LSTM layers, the results are worse than just utilizing dense layers.
6. Conclusions
The assessment of a battery’s capabilities crucially involves the estimation of state of charge, with various methodologies, such as white, gray, and black box models and data-driven approaches, being employed. This study aims to comprehensively compare six widely utilized machine learning-based estimation techniques. The paper critically evaluates these models’ architectural aspects, computational complexity, advantages, drawbacks, and robustness validation. Utilizing actual measurements from diverse operating conditions at the Energy Systems Research Laboratory (ESRL) at Florida International University, the analysis is centered explicitly on the eFlex 52.8 V/5.4 kWh lithium iron phosphate battery pack. This research contributes to a nuanced understanding of the efficacy and suitability of these state-of-charge estimation techniques. The random forest regression model is the most effective tool for estimating lithium-ion batteries’ SoC followed by the LSTM neural network. While simpler models have the potential for improvement through strategic adjustments, the choice of model hinges on task-specific requirements, balancing accuracy with available computational resources. Despite the transformer model’s advantages for time-series data, it was outperformed by the LSTM in this application, providing a more accurate SoC estimation. Additionally, the autoencoder, not inherently designed for regression tasks, exhibited reasonable performance similar to the transformer model. This analysis underscores the importance of selecting a model tailored to data characteristics, especially in the dynamic realm of lithium-ion battery SoC estimation.
Moving forward, this research will refine the validation methodology by adopting a formal k-fold cross-validation approach with k = 5, ensuring a more robust evaluation of the models’ performance. Moreover, the future research scope includes but is not limited to the exploration of integrating hybrid models, advanced feature engineering techniques, and transfer–domain adaptation methods, which will be undertaken to further improve the accuracy and generalization capabilities of battery state-of-charge estimation. Furthermore, investigation of the practical aspects of real-time implementation and deployment will address challenges related to computational efficiency and scalability for seamless integration into battery management systems. Pursuing these avenues will advance the field of battery management and contribute to the development of more reliable and efficient energy storage solutions for diverse applications.
Author Contributions
Conceptualization, H.M.H. and S.M.S.H.R.; Data curation, H.M.H.; Formal analysis, H.M.H., M.E. and A.D.; Investigation, H.M.H., M.E., A.D. and S.M.S.H.R.; Methodology, H.M.H., M.E., A.D. and S.M.S.H.R.; Project administration, O.M.; Resources, H.M.H.; Software, M.E. and A.D.; Supervision, O.M.; Validation, M.E. and A.D.; Visualization, H.M.H. and S.M.S.H.R.; Writing—original draft, H.M.H. and S.M.S.H.R.; Writing—review and editing, H.M.H. and O.M. All authors have read and agreed to the published version of the manuscript.
Funding
This research received no external funding.
Conflicts of Interest
The authors declare no conflicts of interest.
References
- Hussein, H.; Aghmadi, A.; Mohammed, O.A. Design and Analysis of Voltage Control for Islanded DC Microgrids Based on a Fuzzy-PI Controller. In Proceedings of the 2023 IEEE Green Technologies Conference (GreenTech), Denver, CO, USA, 19–21 April 2023; pp. 229–233. [Google Scholar]
- Hussein, H.; Aghmadi, A.; Nguyen, T.L.; Mohammed, O. Hardware-in-the-Loop Implementation of a Battery System Charging/Discharging in Islanded DC Micro-Grid. In Proceedings of the SoutheastCon 2022, Mobile, AL, USA, 26 March–3 April 2022; IEEE: Mobile, AL, USA, 2022; pp. 496–500. [Google Scholar]
- Barré, A.; Deguilhem, B.; Grolleau, S.; Gérard, M.; Suard, F.; Riu, D. A review on lithium-ion battery ageing mechanisms and estimations for automotive applications. J. Power Sources 2013, 241, 680–689. [Google Scholar] [CrossRef]
- Hu, X.; Zou, C.; Zhang, C.; Li, Y. Technological developments in batteries: A survey of principal roles, types, and management needs. IEEE Power Energy Mag. 2017, 15, 20–31. [Google Scholar] [CrossRef]
- Ng, M.-F.; Zhao, J.; Yan, Q.; Conduit, G.J.; Seh, Z.W. Predicting the state of charge and health of batteries using data-driven machine learning. Nat. Mach. Intell. 2020, 2, 161–170. [Google Scholar] [CrossRef]
- Aghmadi, A.; Hussein, H.; Mohammed, O.A. Enhancing Energy Management System for a Hybrid Wind Solar Battery Based Standalone Microgrid. In Proceedings of the 2023 IEEE International Conference on Environment and Electrical Engineering and 2023 IEEE Industrial and Commercial Power Systems Europe (EEEIC/I&CPS Europe), Madrid, Spain, 6–9 June 2023; pp. 1–6. [Google Scholar]
- Abdelrahman, M.S.; Hussein, H.; Mohammed, O.A. Rule-Based Power and Energy Management System for Shipboard Microgrid with HESS To Mitigate Propulsion and Pulsed Load Fluctuations. In Proceedings of the 2023 IEEE Green Technologies Conference (GreenTech), Denver, CO, USA, 19–21 April 2023; pp. 224–228. [Google Scholar]
- Yang, R.; Xiong, R.; He, H.; Mu, H.; Wang, C. A novel method on estimating the degradation and state of charge of lithium-ion batteries used for electrical vehicles. Appl. Energy 2017, 207, 336–345. [Google Scholar] [CrossRef]
- Ali, M.U.; Zafar, A.; Nengroo, S.H.; Hussain, S.; Alvi, M.J.; Kim, H.-J. Towards a smarter battery management system for electric vehicle applications: A critical review of lithium-ion battery state of charge estimation. Energies 2019, 12, 446. [Google Scholar] [CrossRef]
- Zhang, R.; Xia, B.; Li, B.; Cao, L.; Lai, Y.; Zheng, W.; Wang, H.; Wang, W. State of the art of lithium-ion battery SOC estimation for electrical vehicles. Energies 2018, 11, 1820. [Google Scholar] [CrossRef]
- Rivera-Barrera, J.P.; Muñoz-Galeano, N.; Sarmiento-Maldonado, H.O. SoC estimation for lithium-ion batteries: Review and future challenges. Electronics 2017, 6, 102. [Google Scholar] [CrossRef]
- Wu, B.; Widanage, W.D.; Yang, S.; Liu, X. Battery digital twins: Perspectives on the fusion of models, data and artificial intelligence for smart battery management systems. Energy AI 2020, 1, 100016. [Google Scholar] [CrossRef]
- Hussein, H.; Aghmadi, A.; Abdelrahman, M.S.; Rafin, S.M.S.H.; Mohammed, O. A review of battery state of charge estimation and management systems: Models and future prospective. WIREs Energy Environ. 2024, 13, e507. [Google Scholar] [CrossRef]
- Vidal, C.; Malysz, P.; Kollmeyer, P.; Emadi, A. Machine learning applied to electrified vehicle battery state of charge and state of health estimation: State-of-the-art. IEEE Access 2020, 8, 52796–52814. [Google Scholar] [CrossRef]
- Lipu, M.H.; Hannan, M.A.; Hussain, A.; Ayob, A.; Saad, M.H.; Karim, T.F.; How, D.N. Data-driven state of charge estimation of lithium-ion batteries: Algorithms, implementation factors, limitations and future trends. J. Clean. Prod. 2020, 277, 124110. [Google Scholar] [CrossRef]
- How, D.N.T.; Hannan, M.A.; Hossain Lipu, M.S.; Ker, P.J. State of charge estimation for lithium-ion batteries using model-based and data-driven methods: A review. IEEE Access 2019, 7, 136116–136136. [Google Scholar] [CrossRef]
- Ren, L.; Dong, J.; Wang, X.; Meng, Z.; Zhao, L.; Deen, M.J. A Data-Driven Auto-CNN-LSTM Prediction Model for Lithium-Ion Battery Remaining Useful Life. IEEE Trans. Ind. Inform. 2021, 17, 3478–3487. [Google Scholar] [CrossRef]
- Vidal, C.; Kollmeyer, P.; Naguib, M.; Malysz, P.; Gross, O.; Emadi, A. Robust xev battery state-of-charge estimator design using a feedforward deep neural network. SAE Int. J. Adv. Curr. Pract. Mobil. 2020, 2, 2872–2880. [Google Scholar] [CrossRef]
- Jiao, M.; Wang, D.; Qiu, J. A GRU-RNN based momentum optimized algorithm for SOC estimation. J. Power Sources 2020, 459, 228051. [Google Scholar] [CrossRef]
- Xu, C.; Zhang, E.; Jiang, K.; Wang, K. Dual fuzzy-based adaptive extended Kalman filter for state of charge estimation of liquid metal battery. Appl. Energy 2022, 327, 120091. [Google Scholar] [CrossRef]
- Tan, X.; Zhan, D.; Lyu, P.; Rao, J.; Fan, Y. Online state-of-health estimation of lithium-ion battery based on dynamic parameter identification at multi timescale and support vector regression. J. Power Sources 2021, 484, 229233. [Google Scholar] [CrossRef]
- Liu, K.; Hu, X.; Zhou, H.; Tong, L.; Widanalage, D.; Marco, J. Feature analyses and modeling of lithium-ion battery manufacturing based on random forest classification. IEEE/ASME Trans. Mechatron. 2021, 26, 2944–2955. [Google Scholar] [CrossRef]
- Shen, H.; Zhou, X.; Wang, Z.; Wang, J. State of charge estimation for lithium-ion battery using Transformer with immersion and invariance adaptive observer. J. Energy Storage 2022, 45, 103768. [Google Scholar] [CrossRef]
- Bosello, M.; Falcomer, C.; Rossi, C.; Pau, G. To Charge or to Sell? EV Pack Useful Life Estimation via LSTMs, CNNs, and Autoencoders. Energies 2023, 16, 2837. [Google Scholar] [CrossRef]
- Audin, P.; Jorge, I.; Mesbahi, T.; Samet, A.; Beuvron, F.D.B.D.; Bone, R. Auto-encoder LSTM for Li-ion SOH prediction: A comparative study on various benchmark datasets. In Proceedings of the 20th IEEE International Conference on Machine Learning and Applications (ICMLA), Pasadena, CA, USA, 13–16 December 2021; pp. 1529–1536. [Google Scholar]
- Hossain Lipu, M.S.; Karim, T.F.; Ansari, S.; Miah, M.S.; Rahman, M.S.; Meraj, S.T.; Vijayaraghavan, R.R. Intelligent SOX estimation for automotive battery management systems: State-of-the-art deep learning approaches, open issues, and future research opportunities. Energies 2022, 16, 23. [Google Scholar] [CrossRef]
- Yang, K.; Tang, Y.; Zhang, S.; Zhang, Z. A deep learning approach to state of charge estimation of lithium-ion batteries based on dual-stage attention mechanism. Energy 2022, 244, 123233. [Google Scholar] [CrossRef]
- Xiong, R.; Cao, J.; Yu, Q.; He, H.; Sun, F. Critical review on the battery state of charge estimation methods for electric vehicles. IEEE Access 2017, 6, 1832–1843. [Google Scholar] [CrossRef]
- Waag, W.; Fleischer, C.; Sauer, D.U. Critical review of the methods for monitoring of lithium-ion batteries in electric and hybrid vehicles. J. Power Sources 2014, 258, 321–339. [Google Scholar] [CrossRef]
- Amir, U.; Tao, L.; Zhang, X.; Saeed, M.; Hussain, M. A novel SOC estimation method for lithium ion battery based on improved adaptive PI observer. In Proceedings of the 2018 IEEE International Conference on Electrical Systems for Aircraft, Railway, Ship Propulsion and Road Vehicles & International Transportation Electrification Conference, Nottingham, UK, 7–9 November 2018; pp. 1–5. [Google Scholar]
- Ghaeminezhad, N.; Ouyang, Q.; Wei, J.; Xue, Y.; Wang, Z. Review on state of charge estimation techniques of lithium-ion batteries: A control-oriented approach. J. Energy Storage 2023, 72, 108707. [Google Scholar] [CrossRef]
- Barai, A.; Chouchelamane, G.H.; Guo, Y.; McGordon, A.; Jennings, P. A study on the impact of lithium-ion cell relaxation on electrochemical impedance spectroscopy. J. Power Sources 2015, 280, 74–80. [Google Scholar] [CrossRef]
- Wu, L.; Lyu, Z.; Huang, Z.; Zhang, C.; Wei, C. Physics-based battery SOC estimation methods: Recent advances and future perspectives. J. Energy Chem. 2023, 89, 27–40. [Google Scholar] [CrossRef]
- Waag, W.; Kabitz, S.; Sauer, D.U. Experimental investigation of the lithium-ion battery impedance characteristic at various conditions and aging states and its influence on the application. Appl. Energy 2013, 102, 885–897. [Google Scholar] [CrossRef]
- Xu, Z.; Wang, J.; Lund, P.D.; Zhang, Y. Co-estimating the state of charge and health of lithium batteries through combining a minimalist electrochemical model and an equivalent circuit model. Energy 2022, 240, 122815. [Google Scholar] [CrossRef]
- Yang, C.; Wang, X.; Fang, Q.; Dai, H.; Cao, Y.; Wei, X. An online SOC and capacity estimation method for aged lithium-ion battery pack considering cell inconsistency. J. Energy Storage 2020, 29, 101250. [Google Scholar] [CrossRef]
- Luzi, M.; Mascioli, F.M.F.; Paschero, M.; Rizzi, A. A white-box equivalent neural network circuit model for SoC estimation of electrochemical cells. IEEE Trans. Neural Netw. Learn. Syst. 2019, 31, 371–382. [Google Scholar] [CrossRef] [PubMed]
- Peng, J.; Luo, J.; He, H.; Lu, B. An improved state of charge estimation method based on cubature Kalman filter for lithium-ion batteries. Appl. Energy 2019, 253, 113520. [Google Scholar] [CrossRef]
- Fleischer, C.; Waag, W.; Heyn, H.M.; Sauer, D.U. On-line adaptive battery impedance parameter and state estimation considering physical principles in reduced order equivalent circuit battery models part 2. Parameter and state estimation. J. Power Sources 2014, 262, 457–482. [Google Scholar] [CrossRef]
- Chen, L.; Tian, B.; Lin, W.; Ji, B.; Li, J.; Pan, H. Analysis and prediction of the discharge characteristics of the lithium–ion battery based on the Grey system theory. IET Power Electron. 2015, 8, 2361–2369. [Google Scholar] [CrossRef]
- Sun, Q.; Wang, S.; Gao, S.; Lv, H.; Liu, J.; Wang, L.; Du, J.; Wei, K. A State of Charge Estimation Approach for Lithium-Ion Batteries Based on the Optimized Metabolic EGM (1, 1) Algorithm. Batteries 2022, 8, 260. [Google Scholar] [CrossRef]
- Wang, C.-N.; Dang, T.-T.; Nguyen, N.-A.; Le, T.-T. Supporting better decision-making: A combined grey model and data envelopment analysis for efficiency evaluation in e-commerce marketplaces. Sustainability 2020, 12, 10385. [Google Scholar] [CrossRef]
- Kumar, A.S.; Aher, P.K.; Patil, S.L. SOC Estimation using Coulomb Counting and Fuzzy Logic in Lithium Battery. In Proceedings of the 2022 International Conference on Industry 4.0 Technology (I4Tech), Pune, India, 23–24 September 2022; pp. 1–5. [Google Scholar]
- Manoharan, A.; Sooriamoorthy, D.; Begam, K.; Aparow, V.R. Electric vehicle battery pack state of charge estimation using parallel artificial neural networks. J. Energy Storage 2023, 72, 108333. [Google Scholar] [CrossRef]
- Liu, B.; Wang, H.; Tseng, M.-L.; Li, Z. State of charge estimation for lithium-ion batteries based on improved barnacle mating optimizer and support vector machine. J. Energy Storage 2022, 55, 105830. [Google Scholar] [CrossRef]
- Chen, L.; Wang, Z.; Lü, Z.; Li, J.; Ji, B.; Wei, H.; Pan, H. A novel state-of-charge estimation method of lithium-ion batteries combining the grey model and genetic algorithms. IEEE Trans. Power Electron. 2017, 33, 8797–8807. [Google Scholar] [CrossRef]
- Lucaferri, V.; Quercio, M.; Laudani, A.; Riganti Fulginei, F. A Review on Battery Model-Based and Data-Driven Methods for Battery Management Systems. Energies 2023, 16, 7807. [Google Scholar] [CrossRef]
- Zhu, J.; Wang, Y.; Huang, Y.; Bhushan Gopaluni, R.; Cao, Y.; Heere, M.; Mühlbauer, M.J.; Ehrenberg, H. Data-driven capacity estimation of commercial lithium-ion batteries from voltage relaxation. Nat. Commun. 2022, 13, 2261. [Google Scholar] [CrossRef]
- Sesidhar, D.V.S.R.; Badachi, C.; Green, R.C., II. A review on data-driven SOC estimation with Li-Ion batteries: Implementation methods & future aspirations. J. Energy Storage 2023, 72, 108420. [Google Scholar]
- Chen, J.; Zhang, Y.; Wu, J.; Cheng, W.; Zhu, Q. SOC estimation for lithium-ion battery using the LSTM-RNN with extended input and constrained output. Energy 2023, 262, 125375. [Google Scholar] [CrossRef]
- Guo, Y.; Yang, Z.; Liu, K.; Zhang, Y.; Feng, W. A compact and optimized neural network approach for battery state-of-charge estimation of energy storage system. Energy 2021, 219, 119529. [Google Scholar] [CrossRef]
- Chandran, V.; Patil, C.K.; Karthick, A.; Ganeshaperumal, D.; Rahim, R.; Ghosh, A. State of Charge Estimation of Lithium-Ion Battery for Electric Vehicles Using Machine Learning Algorithms. World Electr. Veh. J. 2021, 12, 38. [Google Scholar] [CrossRef]
- Sahinoglu, G.O.; Pajovic, M.; Sahinoglu, Z.; Wang, Y.; Orlik, P.V.; Wada, T. Battery state-of-charge estimation based on regular/recurrent Gaussian process regression. IEEE Trans. Ind. Electron. 2017, 65, 4311–4321. [Google Scholar] [CrossRef]
- Hasan, A.S.M.J.; Yusuf, J.; Faruque, R.B. Performance comparison of machine learning methods with distinct features to estimate battery SOC. In Proceedings of the 2019 IEEE Green Energy and Smart Systems Conference (IGESSC), Long Beach, CA, USA, 4–5 November 2019; pp. 1–5. [Google Scholar]
- Babaeiyazdi, I.; Rezaei-Zare, A.; Shokrzadeh, S. State of charge prediction of EV Li-ion batteries using EIS: A machine learning approach. Energy 2021, 223, 120116. [Google Scholar] [CrossRef]
- Çelik, M.; Tanağardıgil, İ.; Soydemir, M.U.; Şahin, S. Battery Charge and Health Evaluation for Defective UPS Batteries via Machine Learning Methods. In The International Conference on Artificial Intelligence and Applied Mathematics in Engineering; Springer International Publishing: Cham, Switzerland, 2022; pp. 298–308. [Google Scholar]
- Hong, J.; Wang, Z.; Chen, W.; Wang, L.-Y.; Qu, C. Online joint-prediction of multi-forward-step battery SOC using LSTM neural networks and multiple linear regression for real-world electric vehicles. J. Energy Storage 2020, 30, 101459. [Google Scholar] [CrossRef]
- Vilsen, S.B.; Stroe, D.-I. Battery state-of-health modelling by multiple linear regression. J. Clean. Prod. 2021, 290, 125700. [Google Scholar] [CrossRef]
- Wu, T.; Wu, Q.; Zhuang, Q.; Li, Y.; Yao, Y.; Zhang, L.; Xing, S. Optimal Sample Size for SOC Content Prediction for Mapping Using the Random Forest in Cropland in Northern Jiangsu, China. Eurasian Soil Sci. 2022, 55, 1689–1699. [Google Scholar] [CrossRef]
- Yang, N.; Song, Z.; Hofmann, H.; Sun, J. Robust State of Health estimation of lithium-ion batteries using convolutional neural network and random forest. J. Energy Storage 2022, 48, 103857. [Google Scholar] [CrossRef]
- Castanho, D.; Guerreiro, M.; Silva, L.; Eckert, J.; Alves, T.A.; Tadano, Y.d.S.; Stevan, S.L., Jr.; Siqueira, H.V.; Corrêa, F.C. Method for SoC estimation in lithium-ion batteries based on multiple linear regression and particle swarm optimization. Energies 2022, 15, 6881. [Google Scholar] [CrossRef]
- Manriquez-Padilla, C.G.; Cueva-Perez, I.; Dominguez-Gonzalez, A.; Elvira-Ortiz, D.A.; Perez-Cruz, A.; Saucedo-Dorantes, J.J. State of Charge Estimation Model Based on Genetic Algorithms and Multivariate Linear Regression with Applications in Electric Vehicles. Sensors 2023, 23, 2924. [Google Scholar] [CrossRef] [PubMed]
- Manoharan, A.; Begam, K.M.; Aparow, V.R.; Sooriamoorthy, D. Artificial Neural Networks, Gradient Boosting and Support Vector Machines for electric vehicle battery state estimation: A review. J. Energy Storage 2022, 55, 105384. [Google Scholar] [CrossRef]
- Guo, Y.; Huang, K.; Yu, X.; Wang, Y. State-of-health estimation for lithium-ion batteries based on historical dependency of charging data and ensemble SVR. Electrochim. Acta 2022, 428, 140940. [Google Scholar] [CrossRef]
- Zhi, Y.; Wang, H.; Wang, L. A state of health estimation method for electric vehicle Li-ion batteries using GA-PSO-SVR. Complex Intell. Syst. 2022, 8, 2167–2182. [Google Scholar] [CrossRef]
- Li, Y.; Zou, C.; Berecibar, M.; Nanini-Maury, E.; Chan, J.C.-W.; van den Bossche, P.; Van Mierlo, J.; Omar, N. Random forest regression for online capacity estimation of lithium-ion batteries. Appl. Energy 2018, 232, 197–210. [Google Scholar] [CrossRef]
- Li, C.; Chen, Z.; Cui, J.; Wang, Y.; Zou, F. The lithium-ion battery state-of-charge estimation using random forest regression. In Proceedings of the 2014 Prognostics and System Health Management Conference (PHM-2014 Hunan), Zhangjiajie, China, 24–27 August 2014; pp. 336–339. [Google Scholar]
- Lipu, M.S.H.; Hannan, M.A.; Hussaion, A.; Ansari, S.S.; Rahman, S.A.; Saad, M.H.; Muttaqi, K. Real-time state of charge estimation of lithium-ion batteries using optimized random forest regression algorithm. IEEE Trans. Intell. Veh. 2022, 8, 639–648. [Google Scholar] [CrossRef]
- Lamprecht, A.; Riesterer, M.; Steinhorst, S. Random forest regression of charge balancing data: A state of health estimation method for electric vehicle batteries. In Proceedings of the 2020 International Conference on Omni-layer Intelligent Systems (coins), Barcelona, Spain, 31 August–2 September 2020; pp. 1–6. [Google Scholar]
- Sidhu, M.S.; Ronanki, D.; Williamson, S. State of charge estimation of lithium-ion batteries using hybrid machine learning technique. In Proceedings of the IECON 2019-45th Annual Conference of the IEEE Industrial Electronics Society, Lisbon, Portugal, 14–17 October 2019; Volume 1, pp. 2732–2737. [Google Scholar]
- Lipu, M.S.H.; Hannan, M.A.; Hussain, A.; Ansari, S.; Ayob, A.; Saad, M.H.; Muttaqi, K.M. Differential search optimized random forest regression algorithm for state of charge estimation in electric vehicle batteries. In Proceedings of the 2021 IEEE Industry Applications Society Annual Meeting (IAS), Vancouver, BC, Canada, 10–14 October 2021; pp. 1–8. [Google Scholar]
- Chen, Z.; Sun, M.; Shu, X.; Shen, J.; Xiao, R. On-board state of health estimation for lithium-ion batteries based on random forest. In Proceedings of the 2018 IEEE International Conference on Industrial Technology (ICIT), Lyon, France, 20–22 February 2018; pp. 1754–1759. [Google Scholar]
- Khawaja, Y.; Shankar, N.; Qiqieh, I.; Alzubi, J.; Alzubi, O.; Nallakaruppan, M.; Padmanaban, S. Battery management solutions for li-ion batteries based on artificial intelligence. Ain Shams Eng. J. 2023, 14, 102213. [Google Scholar] [CrossRef]
- Lipu, M.H.; Ayob, A.; Saad, M.H.M.; Hussain, A.; Hannan, M.A.; Faisal, M. State of charge estimation for lithium-ion battery based on random forests technique with gravitational search algorithm. In Proceedings of the 2018 IEEE PES Asia-Pacific Power and Energy Engineering Conference (APPEEC), Sabah, Malaysia, 7–10 October 2018; pp. 45–50. [Google Scholar]
- Hussein, H.; Donekal, A.; Aghmadi, A.; Rafin, S.M.S.H.; Mohammed, O.A. State of Charge Estimation Using Data-Driven Models for Inverter-Based Systems. In Proceedings of the 2023 IEEE Design Methodologies Conference (DMC), Miami, FL, USA, 24–26 September 2023; pp. 1–5. [Google Scholar] [CrossRef]
- Mawonou, K.S.; Eddahech, A.; Dumur, D.; Beauvois, D.; Godoy, E. State-of-health estimators coupled to a random forest approach for lithium-ion battery aging factor ranking. J. Power Sources 2021, 484, 229154. [Google Scholar] [CrossRef]
- Deb, S.; Goswami, A.K.; Chetri, R.L.; Roy, R. Prediction of plug-in electric vehicle’s state-of-charge using gradient boosting method and random forest method. In Proceedings of the 2020 IEEE International Conference on Power Electronics, Drives and energy Systems (PEDES), Jaipur, India, 16–19 December 2020; pp. 1–6. [Google Scholar]
- MayilvahaMayilvahanan, K.S.; Takeuchi, K.J.; Takeuchi, E.S.; Marschilok, A.C.; West, A.C. Supervised learning of synthetic big data for Li-ion battery degradation diagnosis. Batter. Supercaps 2022, 5, e202100166. [Google Scholar] [CrossRef]
- Lin, C.; Xu, J.; Shi, M.; Mei, X. Constant current charging time based fast state-of-health estimation for lithium-ion batteries. Energy 2022, 247, 123556. [Google Scholar] [CrossRef]
- Tran, M.K.; Panchal, S.; Chauhan, V.; Brahmbhatt, N.; Mevawalla, A.; Fraser, R.; Fowler, M. Python-based scikit-learn machine learning models for thermal and electrical performance prediction of high-capacity lithium-ion battery. Int. J. Energy Res. 2022, 46, 786–794. [Google Scholar] [CrossRef]
- Cui, Z.; Wang, L.; Li, Q.; Wang, K. A comprehensive review on the state of charge estimation for lithium-ion battery based on neural network. Int. J. Energy Res. 2022, 46, 5423–5440. [Google Scholar] [CrossRef]
- How, D.N.T.; Hannan, M.A.; Lipu, M.S.H.; Sahari, K.S.M.; Ker, P.J.; Muttaqi, K.M. State-of-charge estimation of li-ion battery in electric vehicles: A deep neural network approach. IEEE Trans. Ind. Appl. 2020, 56, 5565–5574. [Google Scholar] [CrossRef]
- Lipu, M.S.H.; Hannan, M.A.; Hussain, A.; Ayob, A.; Saad, M.H.M.; Muttaqi, K.M. State of charge estimation in lithium-ion batteries: A neural network optimization approach. Electronics 2020, 9, 1546. [Google Scholar] [CrossRef]
- Chen, C.; Xiong, R.; Yang, R.; Shen, W.; Sun, F. State-of-charge estimation of lithium-ion battery using an improved neural network model and extended Kalman filter. J. Clean. Prod. 2019, 234, 1153–1164. [Google Scholar] [CrossRef]
- Sun, W.; Qiu, Y.; Sun, L.; Hua, Q. Neural network-based learning and estimation of battery state-of-charge: A comparison study between direct and indirect methodology. Int. J. Energy Res. 2020, 44, 10307–10319. [Google Scholar] [CrossRef]
- Baldi, P. Autoencoders, unsupervised learning, and deep architectures. In Proceedings of the ICML Workshop on Unsupervised and Transfer Learning, Irvine, CA, USA, 27 June 2012; JMLR Workshop and Conference Proceedings. pp. 37–49. [Google Scholar]
- Zhai, J.; Zhang, S.; Chen, J.; He, Q. Autoencoder and its various variants. In Proceedings of the 2018 IEEE International Conference on Systems, Man, and Cybernetics (SMC), Miyazaki, Japan, 7–10 October 2018; pp. 415–419. [Google Scholar]
- Dor, B.; Koenigstein, N.; Giryes, R. Autoencoders. In Machine Learning for Data Science Handbook: Data Mining and Knowledge Discovery Handbook; Springer Nature: Berlin/Heidelberg, Germany, 2023; pp. 353–374. [Google Scholar]
- Cheng, Z.; Wang, S.; Zhang, P.; Wang, S.; Liu, X.; Zhu, E. Improved autoencoder for unsupervised anomaly detection. Int. J. Intell. Syst. 2021, 36, 7103–7125. [Google Scholar] [CrossRef]
- Jeng, S.-L.; Chieng, W.-H. Evaluation of Cell Inconsistency in Lithium-Ion Battery Pack Using the Autoencoder Network Model. IEEE Trans. Ind. Inform. 2022, 19, 6337–6348. [Google Scholar] [CrossRef]
- Ahmed, I.; Galoppo, T.; Hu, X.; Ding, Y. Graph Regularized Autoencoder and its Application in Unsupervised Anomaly Detection. Trans. Pattern Anal. Mach. Intell. 2022, 44, 4110–4124. [Google Scholar] [CrossRef] [PubMed]
- Rhodes, T.; Lee, D. Local Disentanglement in Variational Auto-Encoders Using Jacobian L1 Regularization. Adv. Neural Inf. Process. Syst. 2021, 34, 22708–22719. [Google Scholar]
- Savargaonkar, M.; Oyewole, I.; Chehade, A.; Hussein, A.A. Uncorrelated Sparse Autoencoder With Long Short-Term Memory for State-of-Charge Estimations in Lithium-Ion Battery Cells. IEEE Trans. Autom. Sci. Eng. 2022, 21, 15–26. [Google Scholar] [CrossRef]
- Pinaya; Lopez, W.H.; Vieira, S.; Garcia-Dias, R.; Mechelli, A. Autoencoders. In Machine Learning; Academic Press: Cambridge, MA, USA, 2020; pp. 193–208. [Google Scholar]
- Sun, Y.; Zhang, J.; Zhang, K.; Qi, H.; Zhang, C. Battery state of health estimation method based on sparse auto-encoder and backward propagation fading diversity among battery cells. Int. J. Energy Res. 2021, 45, 7651–7662. [Google Scholar] [CrossRef]
- Zhang, H.; Bai, Y.; Yang, S.; Li, C. State-of-Charge Prediction of Lithium-Ion Batteries Based on Sparse Autoencoder and Gated Recurrent Unit Neural Network. Energy Technol. 2023, 11, 2201510. [Google Scholar] [CrossRef]
- Sun, G.; Wang, X.; Zhang, X.; Wang, J.; Li, Z. Autoencoder-Enhanced Regularized Prototypical Network for New Energy Vehicle battery fault detection. Control Eng. Pract. 2023, 141, 105738. [Google Scholar] [CrossRef]
- Hong, S.; Kang, M.; Kim, J.; Baek, J. Investigation of denoising autoencoder-based deep learning model in noise-riding experimental data for reliable state-of-charge estimation. J. Energy Storage 2023, 72, 108421. [Google Scholar] [CrossRef]
- Chen, J.; Feng, X.; Jiang, L.; Zhu, Q. State of charge estimation of lithium-ion battery using denoising autoencoder and gated recurrent unit recurrent neural network. Energy 2021, 227, 120451. [Google Scholar] [CrossRef]
- Xu, F.; Yang, F.; Fei, Z.; Huang, Z.; Tsui, K.-L. Life prediction of lithium-ion batteries based on stacked denoising autoencoders. Reliab. Eng. Syst. Saf. 2021, 208, 107396. [Google Scholar] [CrossRef]
- Sudarshan, M.; Serov, A.; Jones, C.; Ayalasomayajula, S.M.; García, R.E.; Tomar, V. Data-driven autoencoder neural network for onboard BMS Lithium-ion battery degradation prediction. J. Energy Storage 2024, 82, 110575. [Google Scholar] [CrossRef]
- Valant, C.J.; Wheaton, J.D.; Thurston, M.G.; McConky, S.P.; Nenadic, N.G. Evaluation of 1D CNN autoencoders for lithium-ion battery condition assessment using synthetic data. In Proceedings of the Annual Conference of the Prognostics and Health Management Society 2019, 11th PHM Conference, Scottsdale, AZ, USA, 21–26 September 2019; Volume 11, pp. 1–11. [Google Scholar]
- Wu, J.; Chen, J.; Feng, X.; Xiang, H.; Zhu, Q. State of health estimation of lithium-ion batteries using Autoencoders and Ensemble Learning. J. Energy Storage 2022, 55, 105708. [Google Scholar] [CrossRef]
- Fasahat, M.; Manthouri, M. State of charge estimation of lithium-ion batteries using hybrid autoencoder and Long Short Term Memory neural networks. J. Power Sources 2020, 469, 228375. [Google Scholar] [CrossRef]
- Zhou, Z.; Liu, Y.; Zhang, C.; Shen, W.; Xiong, R. Deep neural network-enabled battery open-circuit voltage estimation based on partial charging data. J. Energy Chem. 2024, 90, 120–132. [Google Scholar] [CrossRef]
- Jiao, R.; Peng, K.; Dong, J. Remaining useful life prediction of lithium-ion batteries based on conditional variational autoencoders-particle filter. IEEE Trans. Instrum. Meas. 2020, 69, 8831–8843. [Google Scholar] [CrossRef]
- Ren, L.; Zhao, L.; Hong, S.; Zhao, S.; Wang, H.; Zhang, L. Remaining useful life prediction for lithium-ion battery: A deep learning approach. IEEE Access 2018, 6, 50587–50598. [Google Scholar] [CrossRef]
- Hochreiter, S.; Schmidhuber, J. Long Short-Term Memory. Neural. Comput. 1997, 9, 1735–1780. [Google Scholar] [CrossRef] [PubMed]
- Gers, F.A.; Schmidhuber, J.; Cummins, F. Learning to Forget: Continual Prediction with LSTM. Neural. Comput. 2000, 12, 2451–2471. [Google Scholar] [CrossRef] [PubMed]
- Bengio, Y.; Simard, P.; Frasconi, P. Learning long-term dependencies with gradient descent is difficult. IEEE Trans. Neural Netw. 1994, 5, 157–166. [Google Scholar] [CrossRef] [PubMed]
- Landi, F.; Baraldi, L.; Cornia, M.; Cucchiara, R. Working memory connections for LSTM. Neural Networks. 2021, 144, 334–341. [Google Scholar] [CrossRef]
- Gers, F.; Schmidhuber, J. Recurrent nets that time and count. In Proceedings of the IEEE-INNS-ENNS International Joint Conference on Neural Networks. IJCNN 2000. Neural Computing: New Challenges and Perspectives for the New Millennium, Como, Italy, 27 July 2000; Volume 3, pp. 189–194. [Google Scholar] [CrossRef]
- Olah, C. Understanding LSTM Networks. GitHub Repository. 2015. Available online: https://github.com/colah/LSTM (accessed on 27 August 2015).
- Graves, A.; Mohamed, A.; Hinton, G. Speech recognition with deep recurrent neural networks. In Proceedings of the 2013 IEEE International Conference on Acoustics, Speech and Signal Processing, Vancouver, BC, Canada, 26–31 May 2013; pp. 6645–6649. [Google Scholar] [CrossRef]
- Greff, K.; Srivastava, R.K.; Koutník, J.; Steunebrink, B.R.; Schmidhuber, J. LSTM: A Search Space Odyssey. IEEE Trans. Neural Netw. Learn. Syst. 2017, 28, 2222–2232. [Google Scholar] [CrossRef]
- Schuster, M.; Paliwal, K.K. Bidirectional recurrent neural networks. IEEE Trans. Signal Process. 1997, 45, 2673–2681. [Google Scholar] [CrossRef]
- Jozefowicz, R.; Zaremba, W.; Sutskever, I. An empirical exploration of recurrent network architectures. In Proceedings of the 32nd International Conference on International Conference on Machine Learning, Lille, France, 6–11 July 2015; Volume 37, pp. 2342–2350. [Google Scholar]
- Cho, K.; van Merriënboer, B.; Gulcehre, C.; Bahdanau, D.; Bougares, F.; Schwenk, H.; Bengio, Y. Learning phrase representations using RNN encoder-decoder for statistical machine translation. arXiv 2014, arXiv:1406.1078. [Google Scholar]
- Zhou, D.; Zuo, X.; Zhao, Z. Constructing a large-scale urban land subsidence prediction method based on neural network algorithm from the perspective of multiple factors. Remote Sens. 2022, 14, 1803. [Google Scholar] [CrossRef]
- Ren, X.; Liu, S.; Yu, X.; Dong, X. A method for state-of-charge estimation of lithium-ion batteries based on PSO-LSTM. Energy 2021, 234, 121236. [Google Scholar] [CrossRef]
- Wu, L.; Zhang, Y. Attention-based encoder-decoder networks for state of charge estimation of lithium-ion battery. Energy 2023, 268, 126665. [Google Scholar] [CrossRef]
- Almaita, E.; Alshkoor, S.; Abdelsalam, E.; Almomani, F. State of charge estimation for a group of lithium-ion batteries using long short-term memory neural network. J. Energy Storage 2022, 52, 104761. [Google Scholar] [CrossRef]
- Zhang, Y.; Xiong, R.; He, H.; Pecht, M.G. Long Short-Term Memory Recurrent Neural Network for Remaining Useful Life Prediction of Lithium-Ion Batteries. IEEE Trans. Veh. Technol. 2018, 67, 5695–5705. [Google Scholar] [CrossRef]
- Tang, A.; Huang, Y.; Liu, S.; Yu, Q.; Shen, W.; Xiong, R. A novel lithium-ion battery state of charge estimation method based on the fusion of neural network and equivalent circuit models. Appl. Energy 2023, 348, 121578. [Google Scholar] [CrossRef]
- Vaswani, A.; Shazeer, N.; Parmar, N.; Uszkoreit, J.; Jones, L.; Gomez, A.N.; Kaiser, Ł.; Polosukhin, I. Attention is all you need. In Proceedings of the Advances in Neural Information Processing Systems 30 (NIPS 2017), Long Beach, CA, USA, 4–9 December 2017; Volume 30. [Google Scholar]
- Dong, L.; Xu, S.; Xu, B. Speech-Transformer: A No-Recurrence Sequence-to-Sequence Model for Speech Recognition. In Proceedings of the 2018 IEEE International Conference on Acoustics, Speech and Signal Processing (ICASSP), Calgary, AB, Canada, 15–20 April 2018; pp. 5884–5888. [Google Scholar] [CrossRef]
- Dai, Z.; Yang, Z.; Yang, Y.; Carbonell, J.G.; Le, Q.V.; Salakhutdinov, R. Transformer-XL: Attentive language models beyond a fixed-length context. arXiv 2019, arXiv:1901.02860. [Google Scholar]
- Ott, M.; Edunov, S.; Grangier, D.; Auli, M. Scaling neural machine translation. arXiv 2018, arXiv:1806.00187. [Google Scholar]
- Chi, L.; Yuan, Z.; Mu, Y.; Wang, C. Non-local neural networks with grouped bilinear attentional transforms. In Proceedings of the IEEE/CVF Conference on Computer Vision and Pattern Recognition, Seattle, WA, USA, 13–19 June 2020; pp. 11804–11813. [Google Scholar]
- Weston, J.; Chopra, S.; Bordes, A. Memory networks. arXiv 2014, arXiv:1410.3916. [Google Scholar]
- Child, R.; Gray, S.; Radford, A.; Sutskever, I. Generating long sequences with sparse transformers. arXiv 2019, arXiv:1904.10509. [Google Scholar]
- Ke, G.; He, D.; Liu, T. Rethinking the Position Encoding in Vision Transformer. arXiv 2021, arXiv:2107.14222. [Google Scholar]
- Salman, K.; Naseer, M.; Hayat, M.; Zamir, S.W.; Khan, F.S.; Shah, M. Transformers in vision: A survey. ACM Comput. Surv. 2022, 54, 1–41. [Google Scholar]
- Shi, D.; Zhao, J.; Wang, Z.; Zhao, H.; Wang, J.; Lian, Y.; Burke, A.F. Spatial-Temporal Self-Attention Transformer Networks for Battery State of Charge Estimation. Electronics 2023, 12, 2598. [Google Scholar] [CrossRef]
- Karita, S.; Chen, N.; Hayashi, T.; Hori, T.; Inaguma, H.; Jiang, Z.; Someki, M.; Zhang, W. A comparative study on transformer vs. rnn in speech applications. In Proceedings of the 2019 IEEE Automatic Speech Recognition and Understanding Workshop (ASRU), Singapore, 14–18 December 2019; pp. 449–456. [Google Scholar]
- Ahn, H.; Shen, H.; Zhou, X.; Kung, Y.-C.; Wang, J. State of Charge Estimation of Lithium-Ion Batteries Using Physics-Informed Transformer for Limited Data Scenarios. ASME Lett. Dyn. Syst. Control 2023, 3, 041002. [Google Scholar] [CrossRef]
- Almarzooqi, A.H.; Alhusin, M.O.; Nikolakakos, I.P.; Husnain, A.; Albeshr, H.M. Improved NaS Battery State of Charge Estimation by Means of Temporal Fusion Transformer. In Proceedings of the 2023 IEEE Texas Power and Energy Conference (TPEC), College Station, TX, USA, 13–14 February 2023; pp. 1–6. [Google Scholar]
- Stensson, J.; Svantesson, K. Physics Informed Neural Network for Thermal Modeling of an Electric Motor. 2023. Available online: https://odr.chalmers.se/items/03b63aad-812d-4ec3-9679-1aa65981eff6 (accessed on 27 August 2015).
Figure 1.
Commonly used equivalent circuit models (ECMs) for batteries: (a) Rint; (b) Thevenin; (c) PNGV.
Figure 1.
Commonly used equivalent circuit models (ECMs) for batteries: (a) Rint; (b) Thevenin; (c) PNGV.
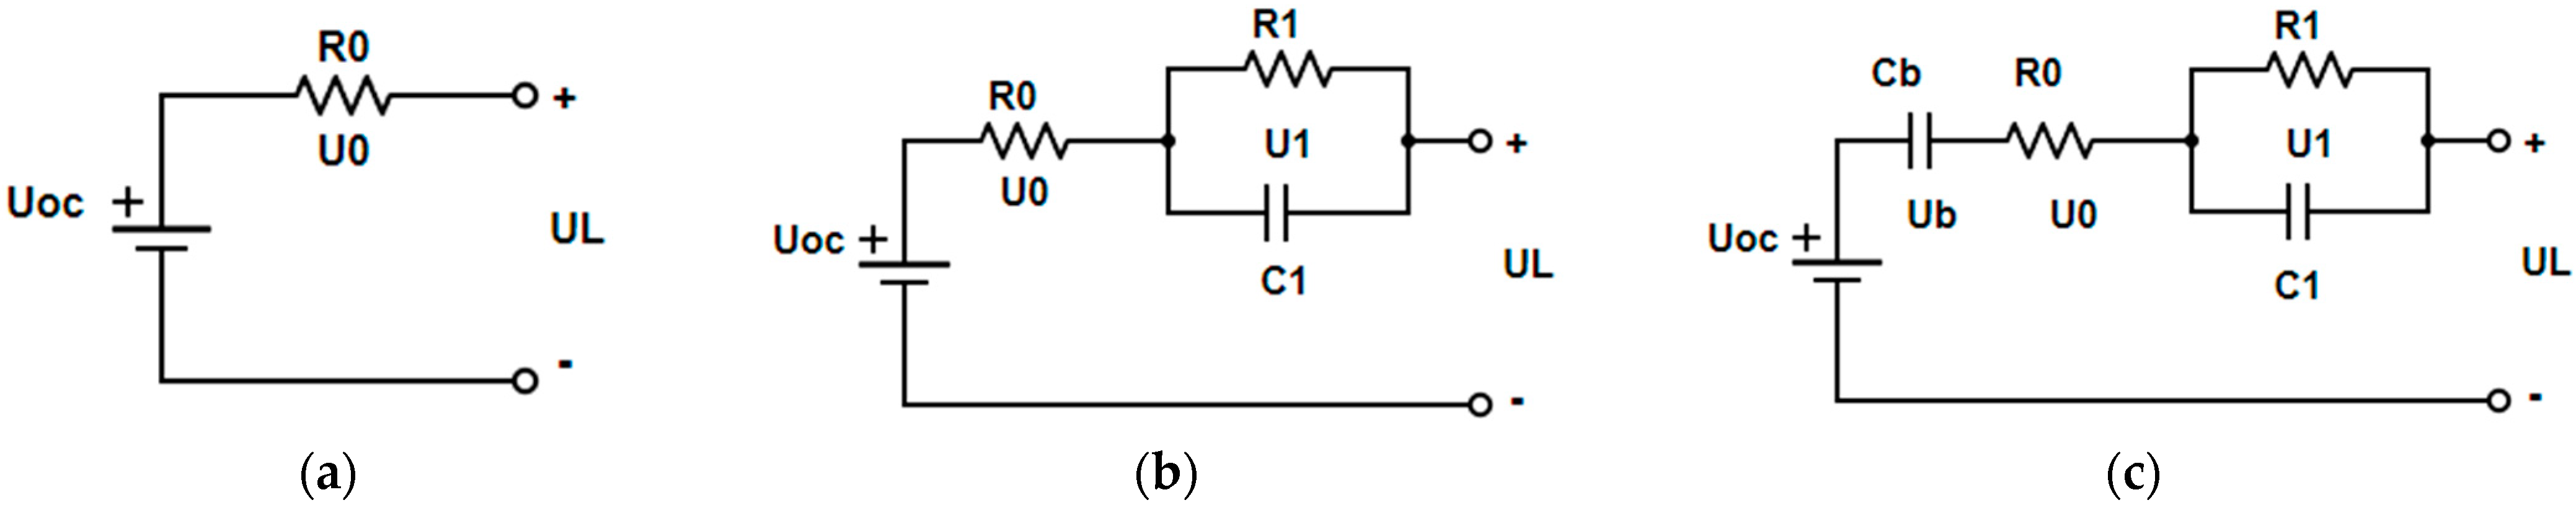
Figure 2.
Comparison of commonly used SoC estimation models for batteries.
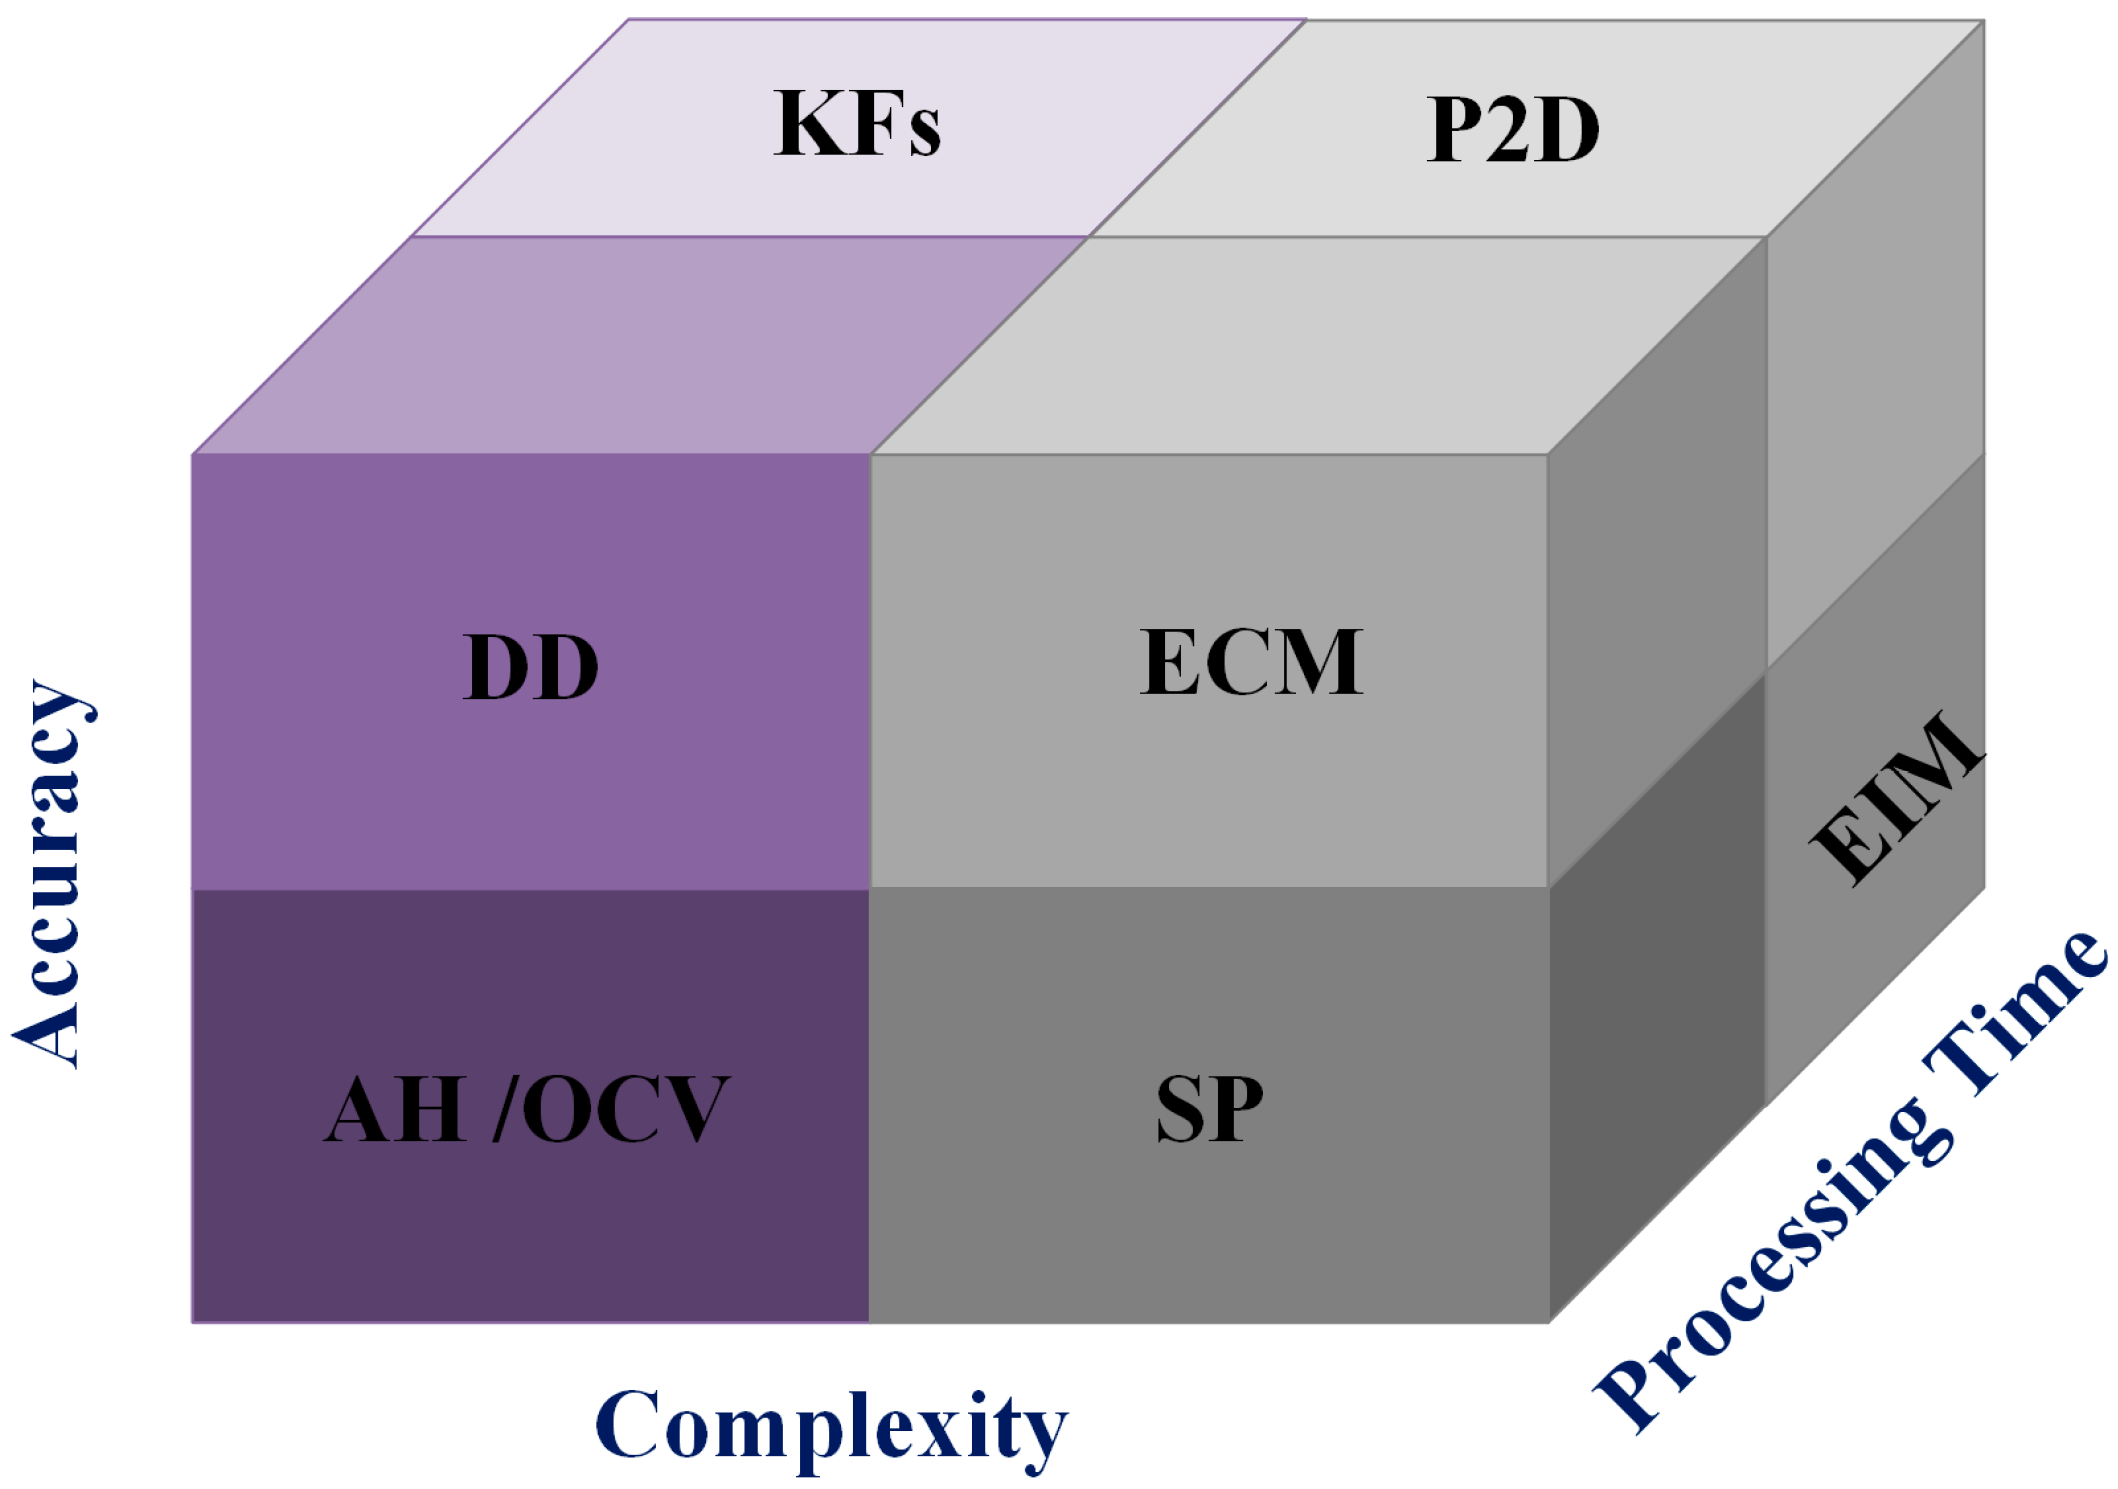
Figure 3.
The gray model GM (1,1) operation process [24].
Figure 3.
The gray model GM (1,1) operation process [24].
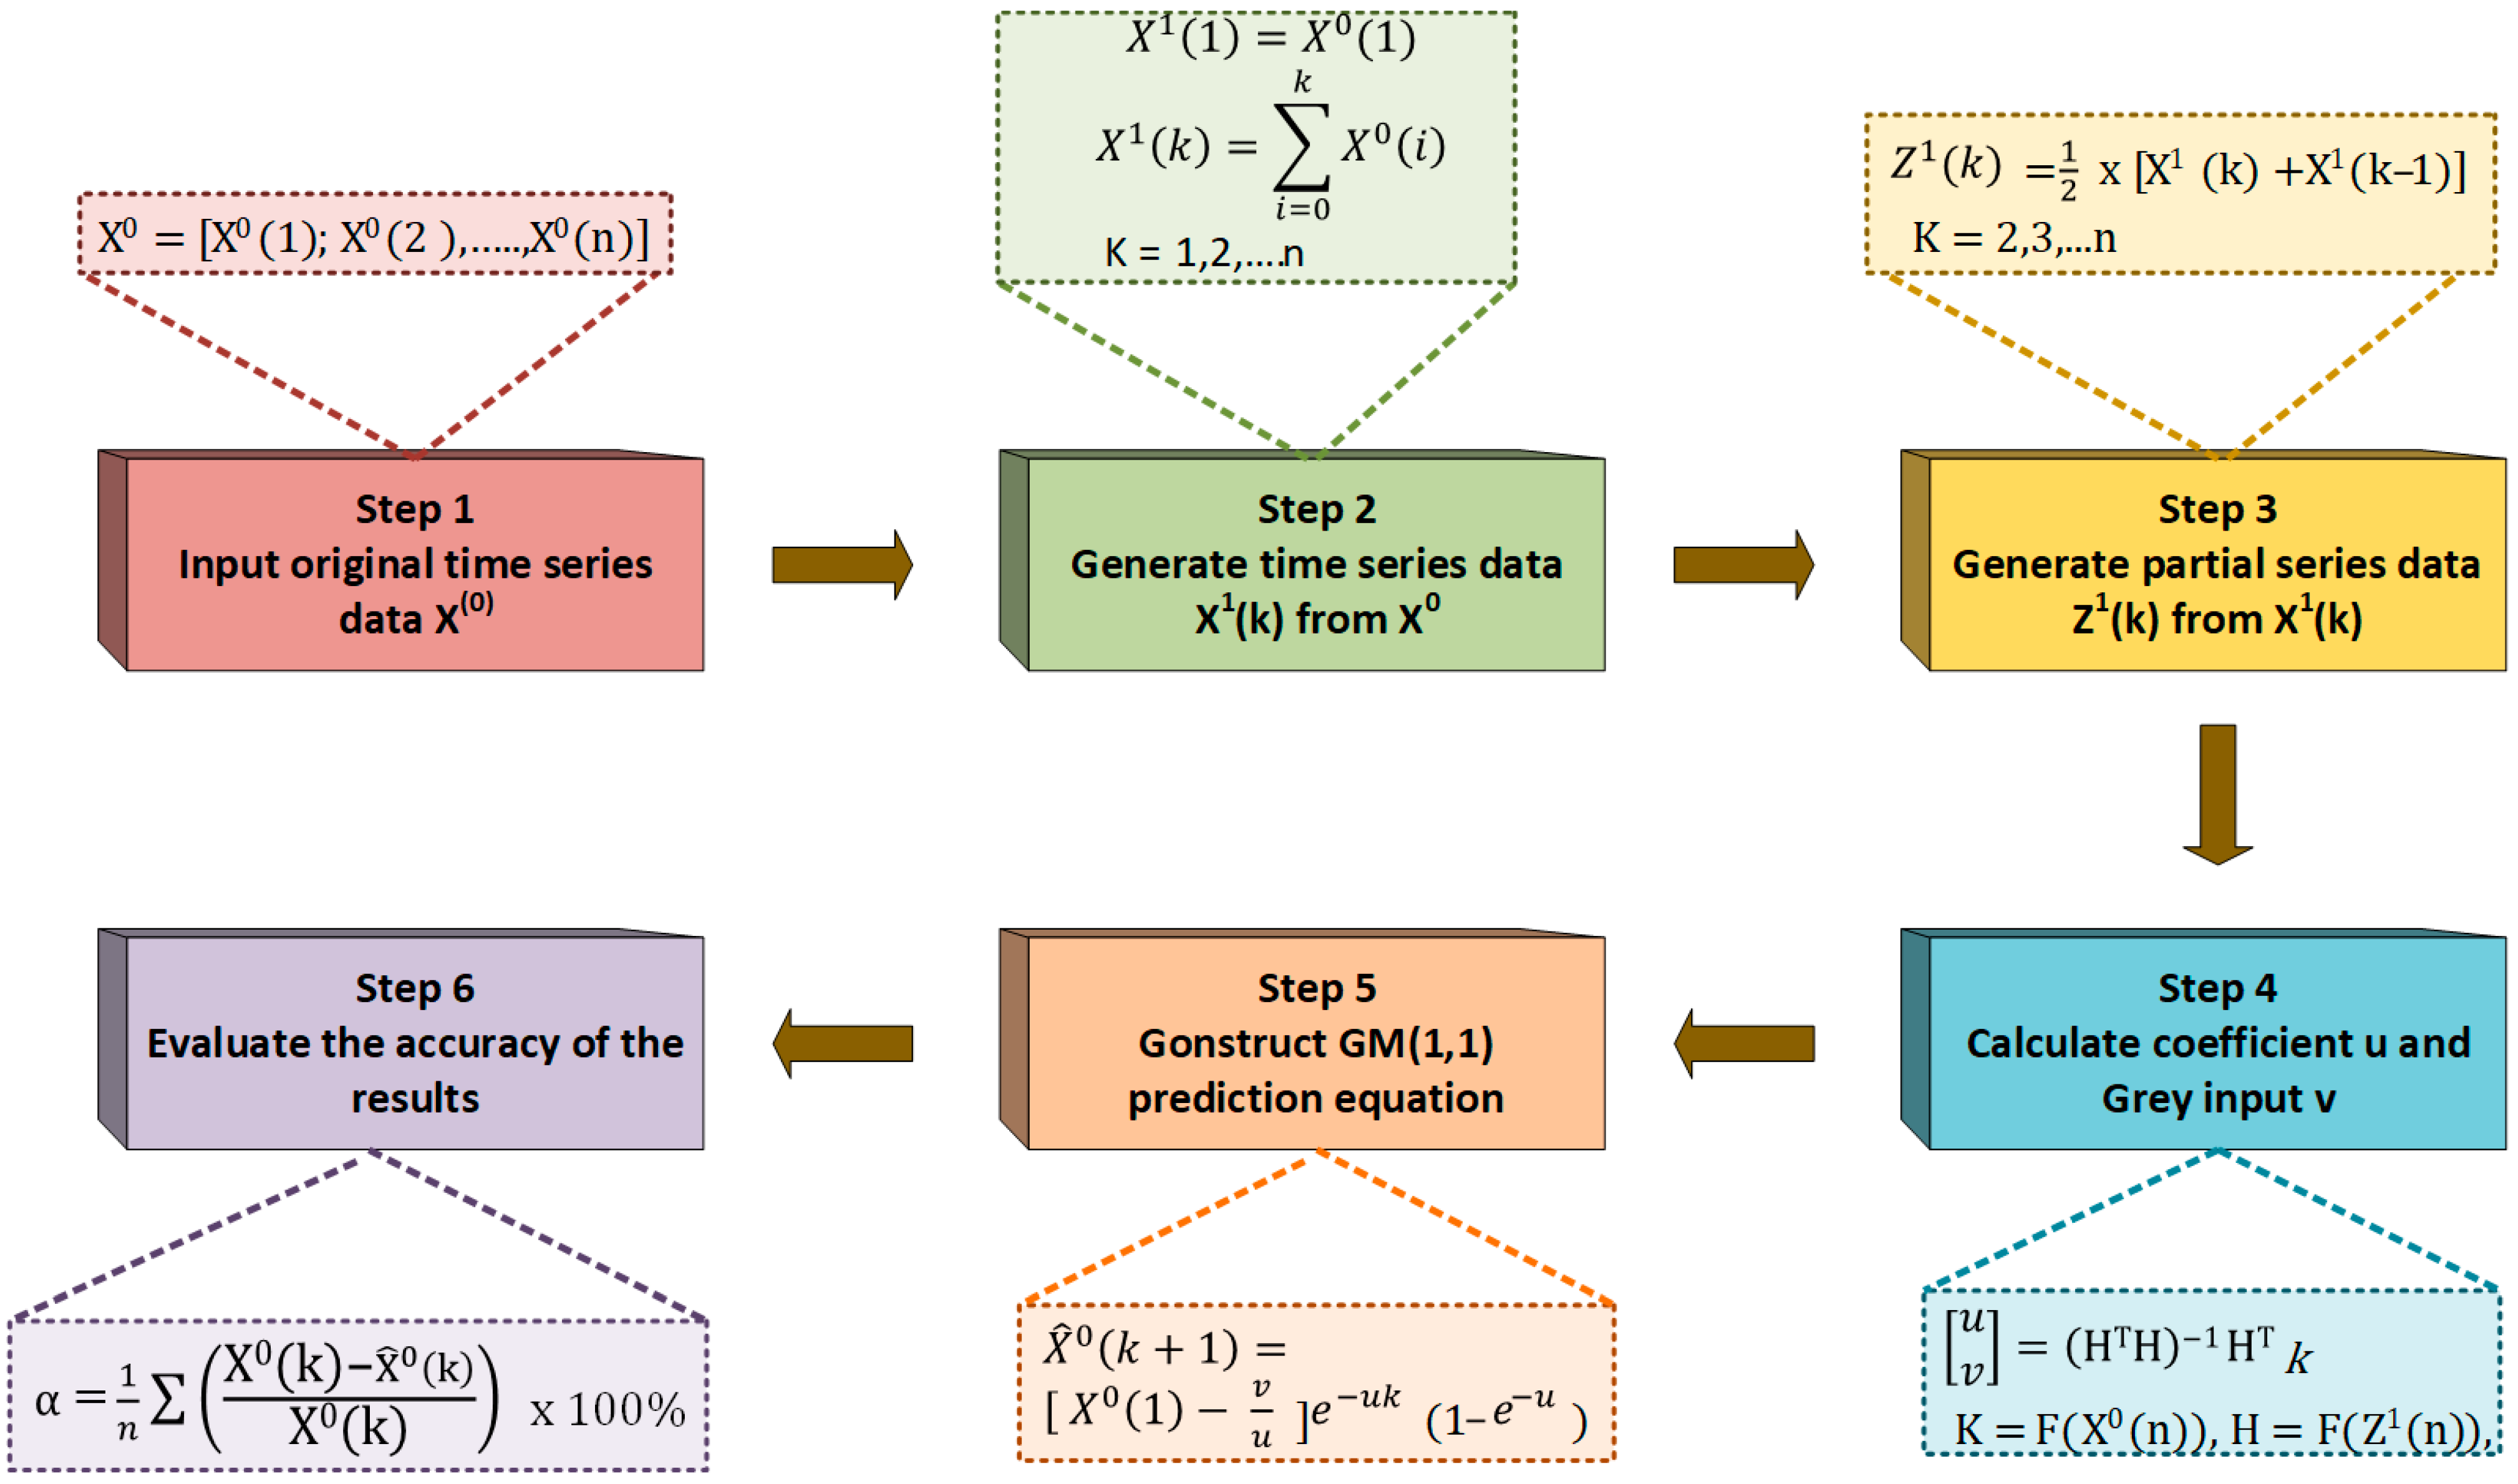
Figure 4.
Linear regression (LR) model: (a) linearizing the correlation between dependent and independent variables; (b) LR model structure.
Figure 4.
Linear regression (LR) model: (a) linearizing the correlation between dependent and independent variables; (b) LR model structure.
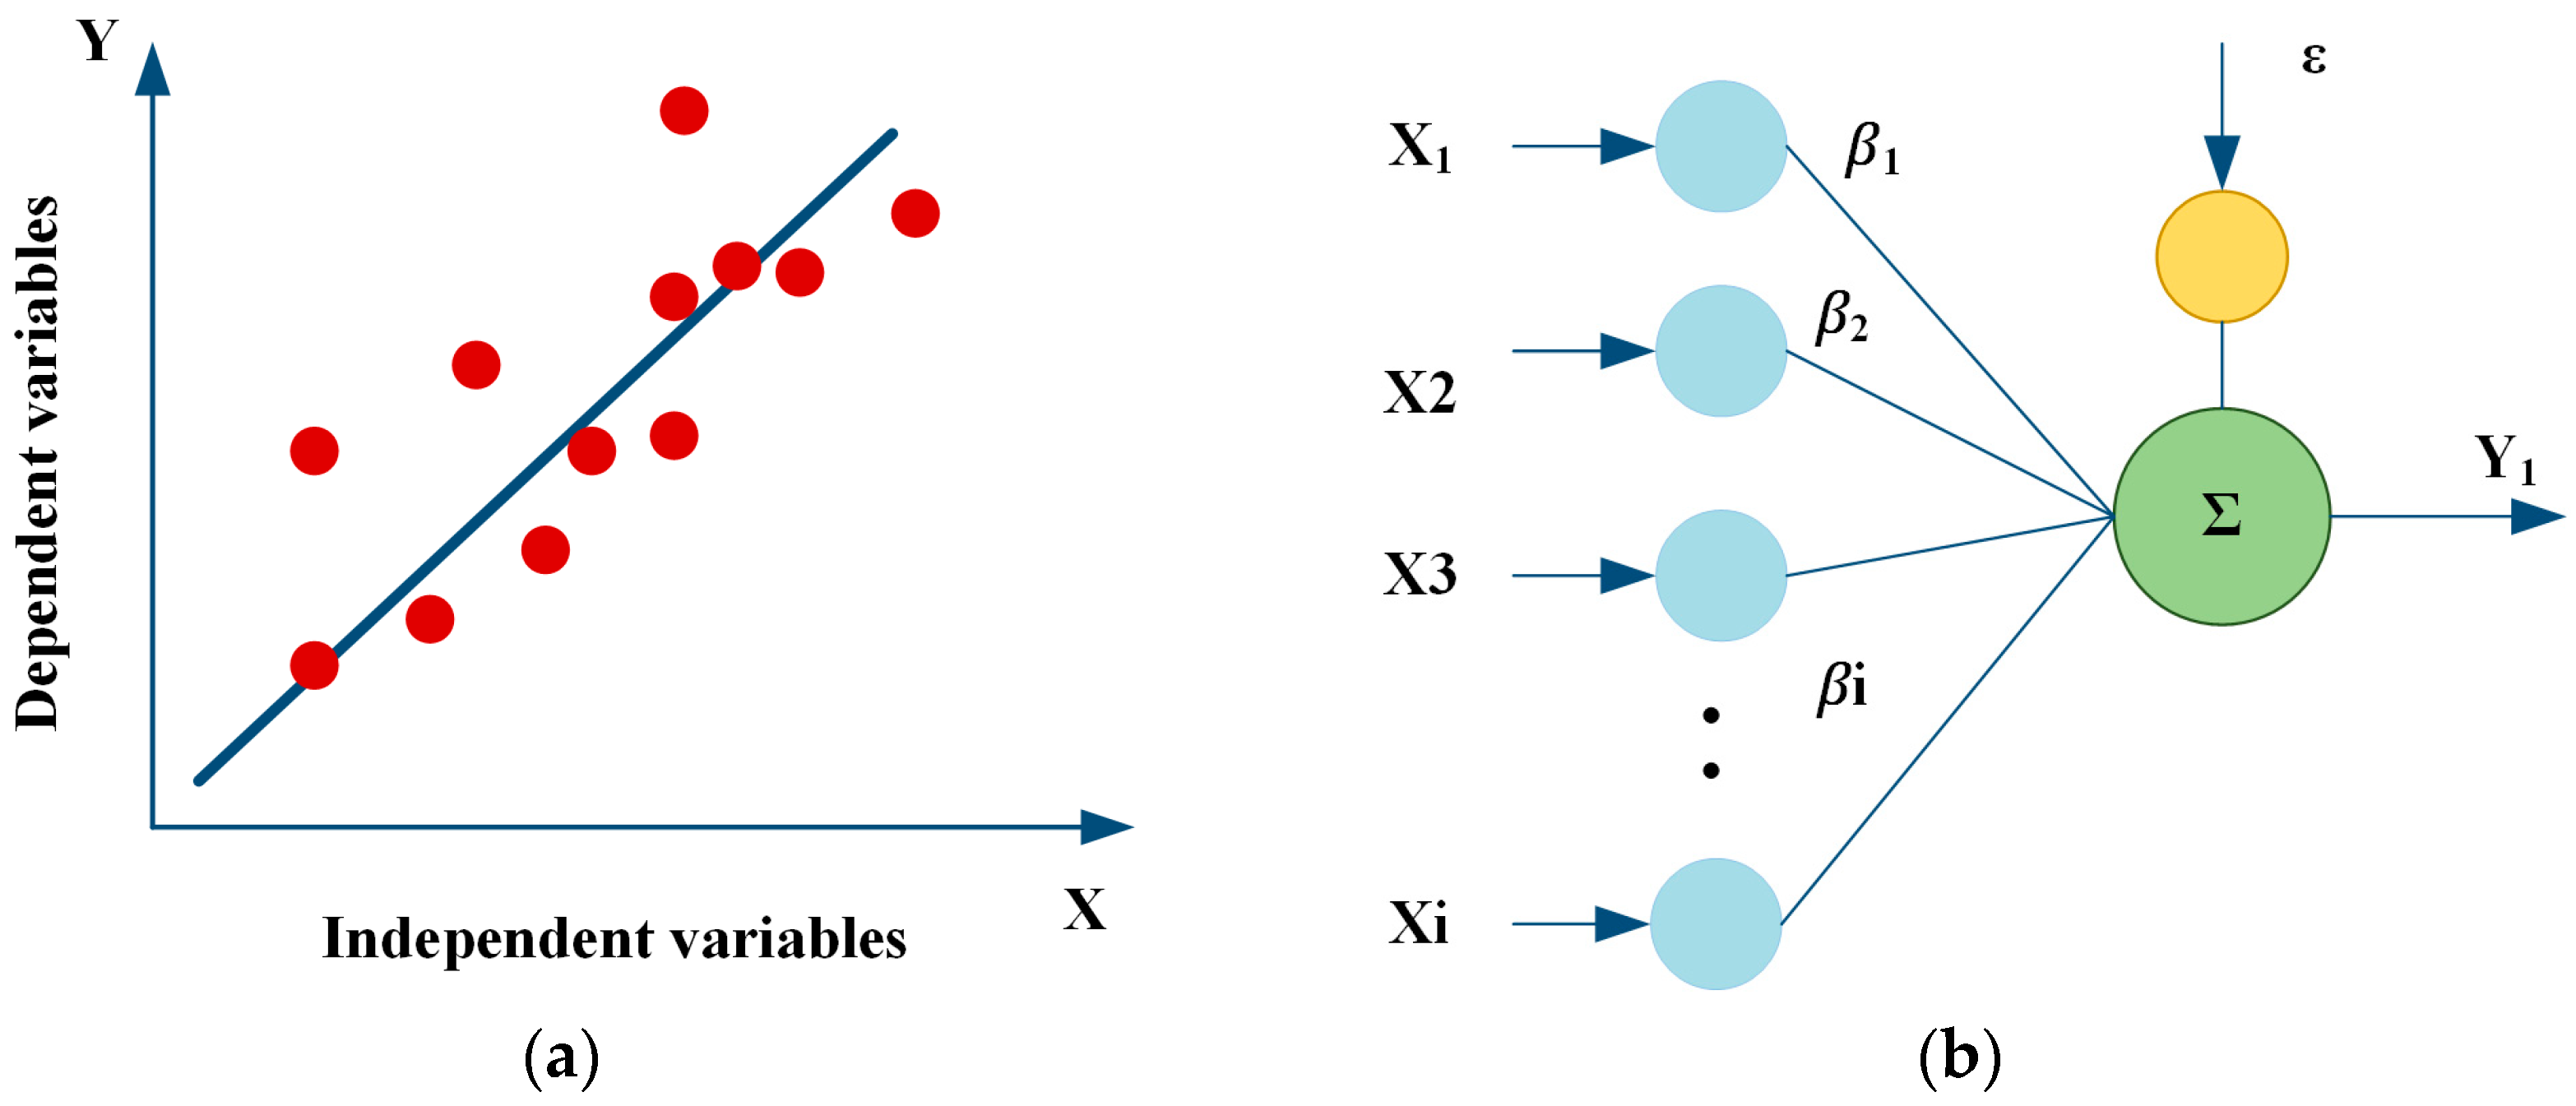
Figure 5.
Random forest regression (RFR) model structure.
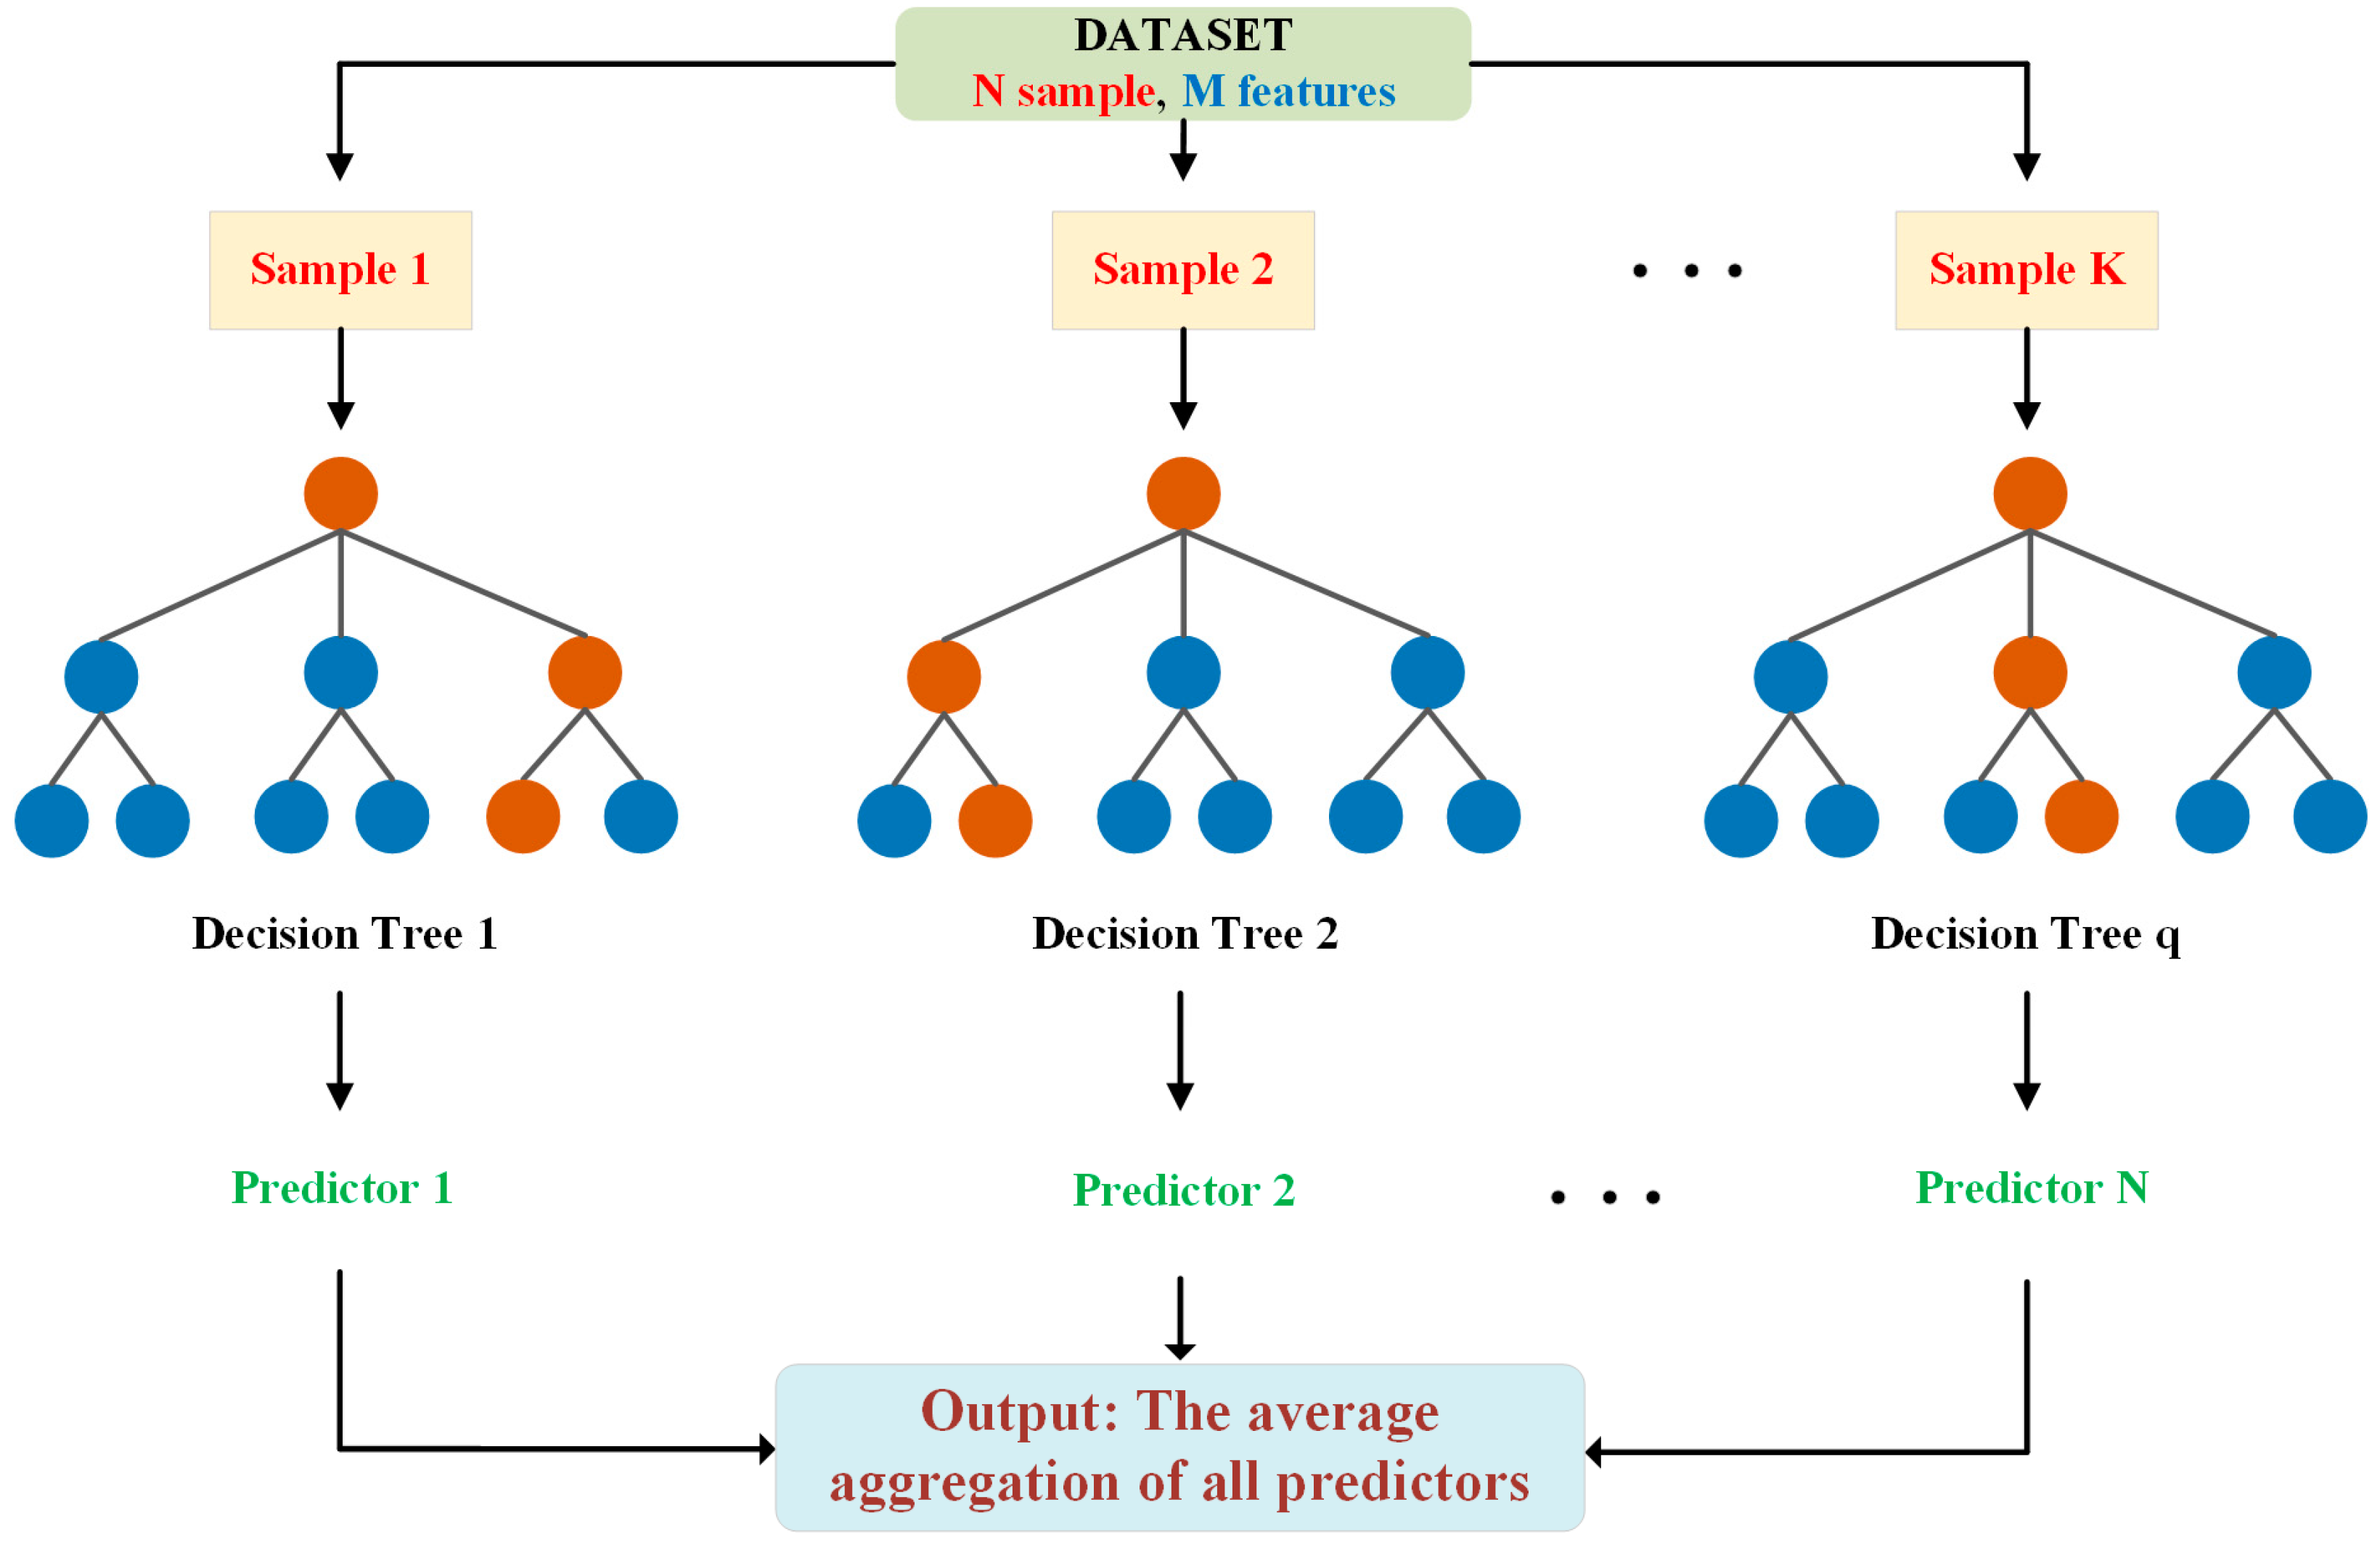
Figure 6.
Neural network (NN) structure.
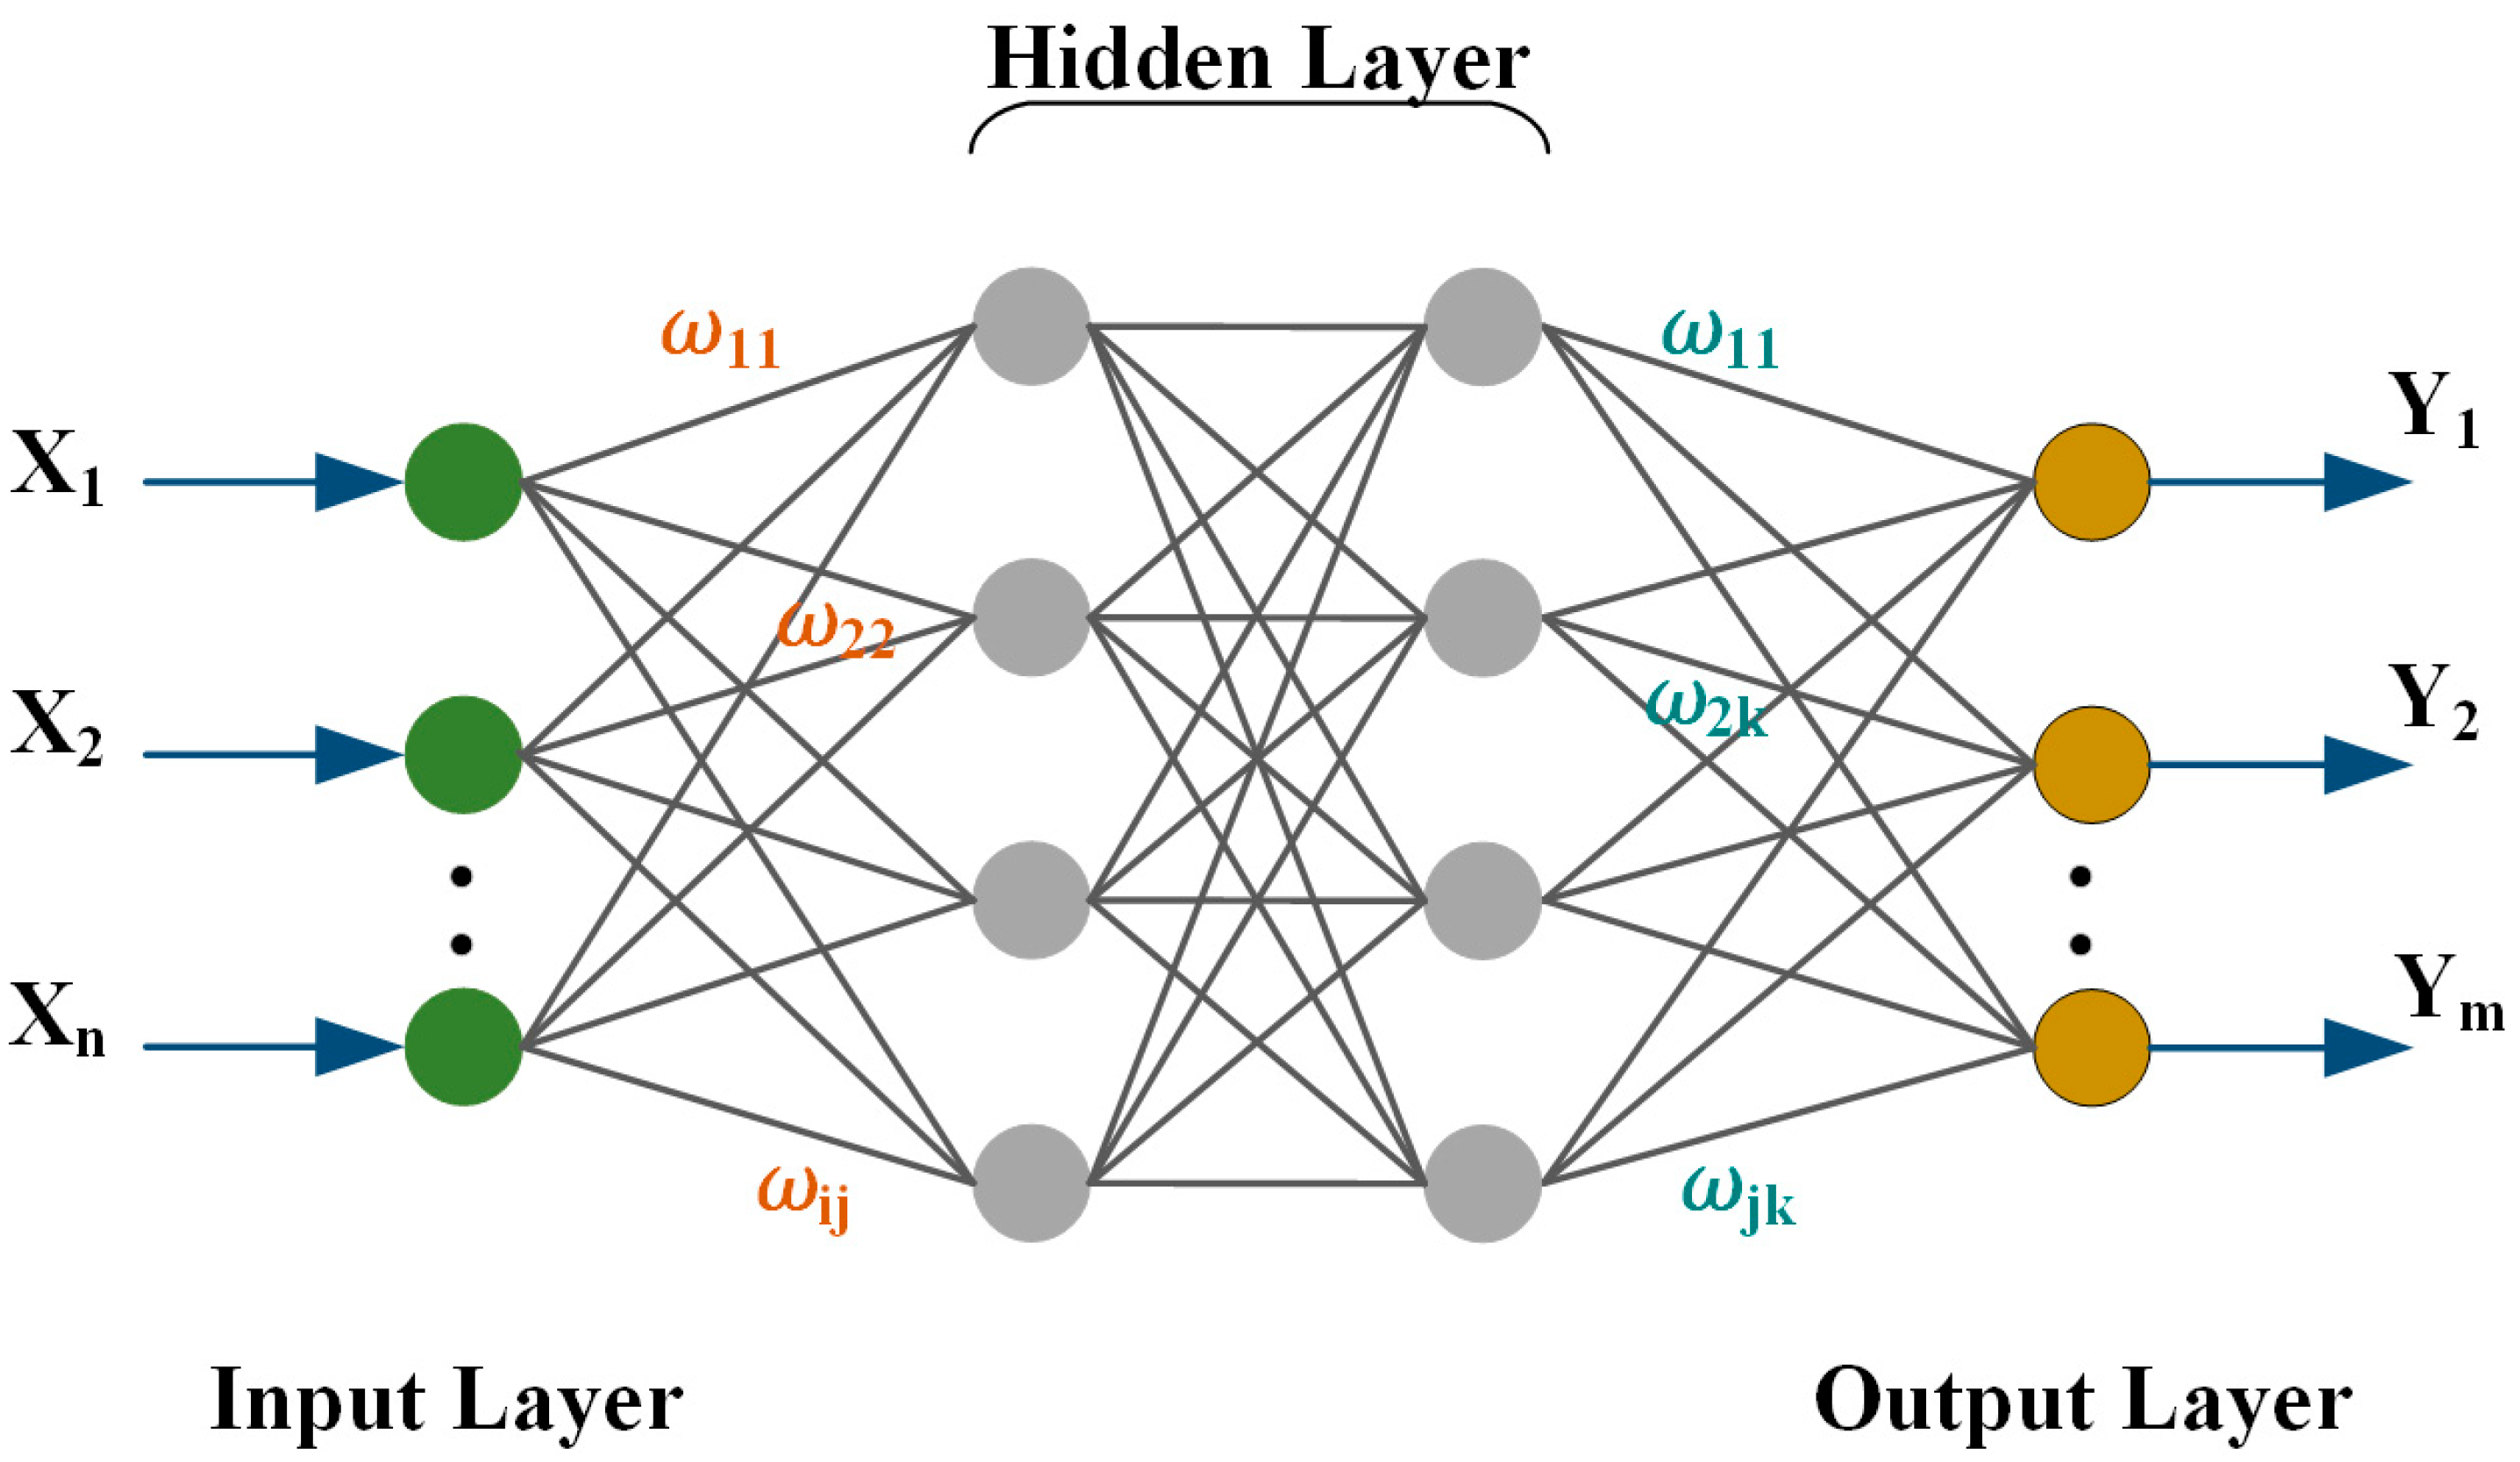
Figure 7.
Autoencoder (AE) basic idea and architecture.
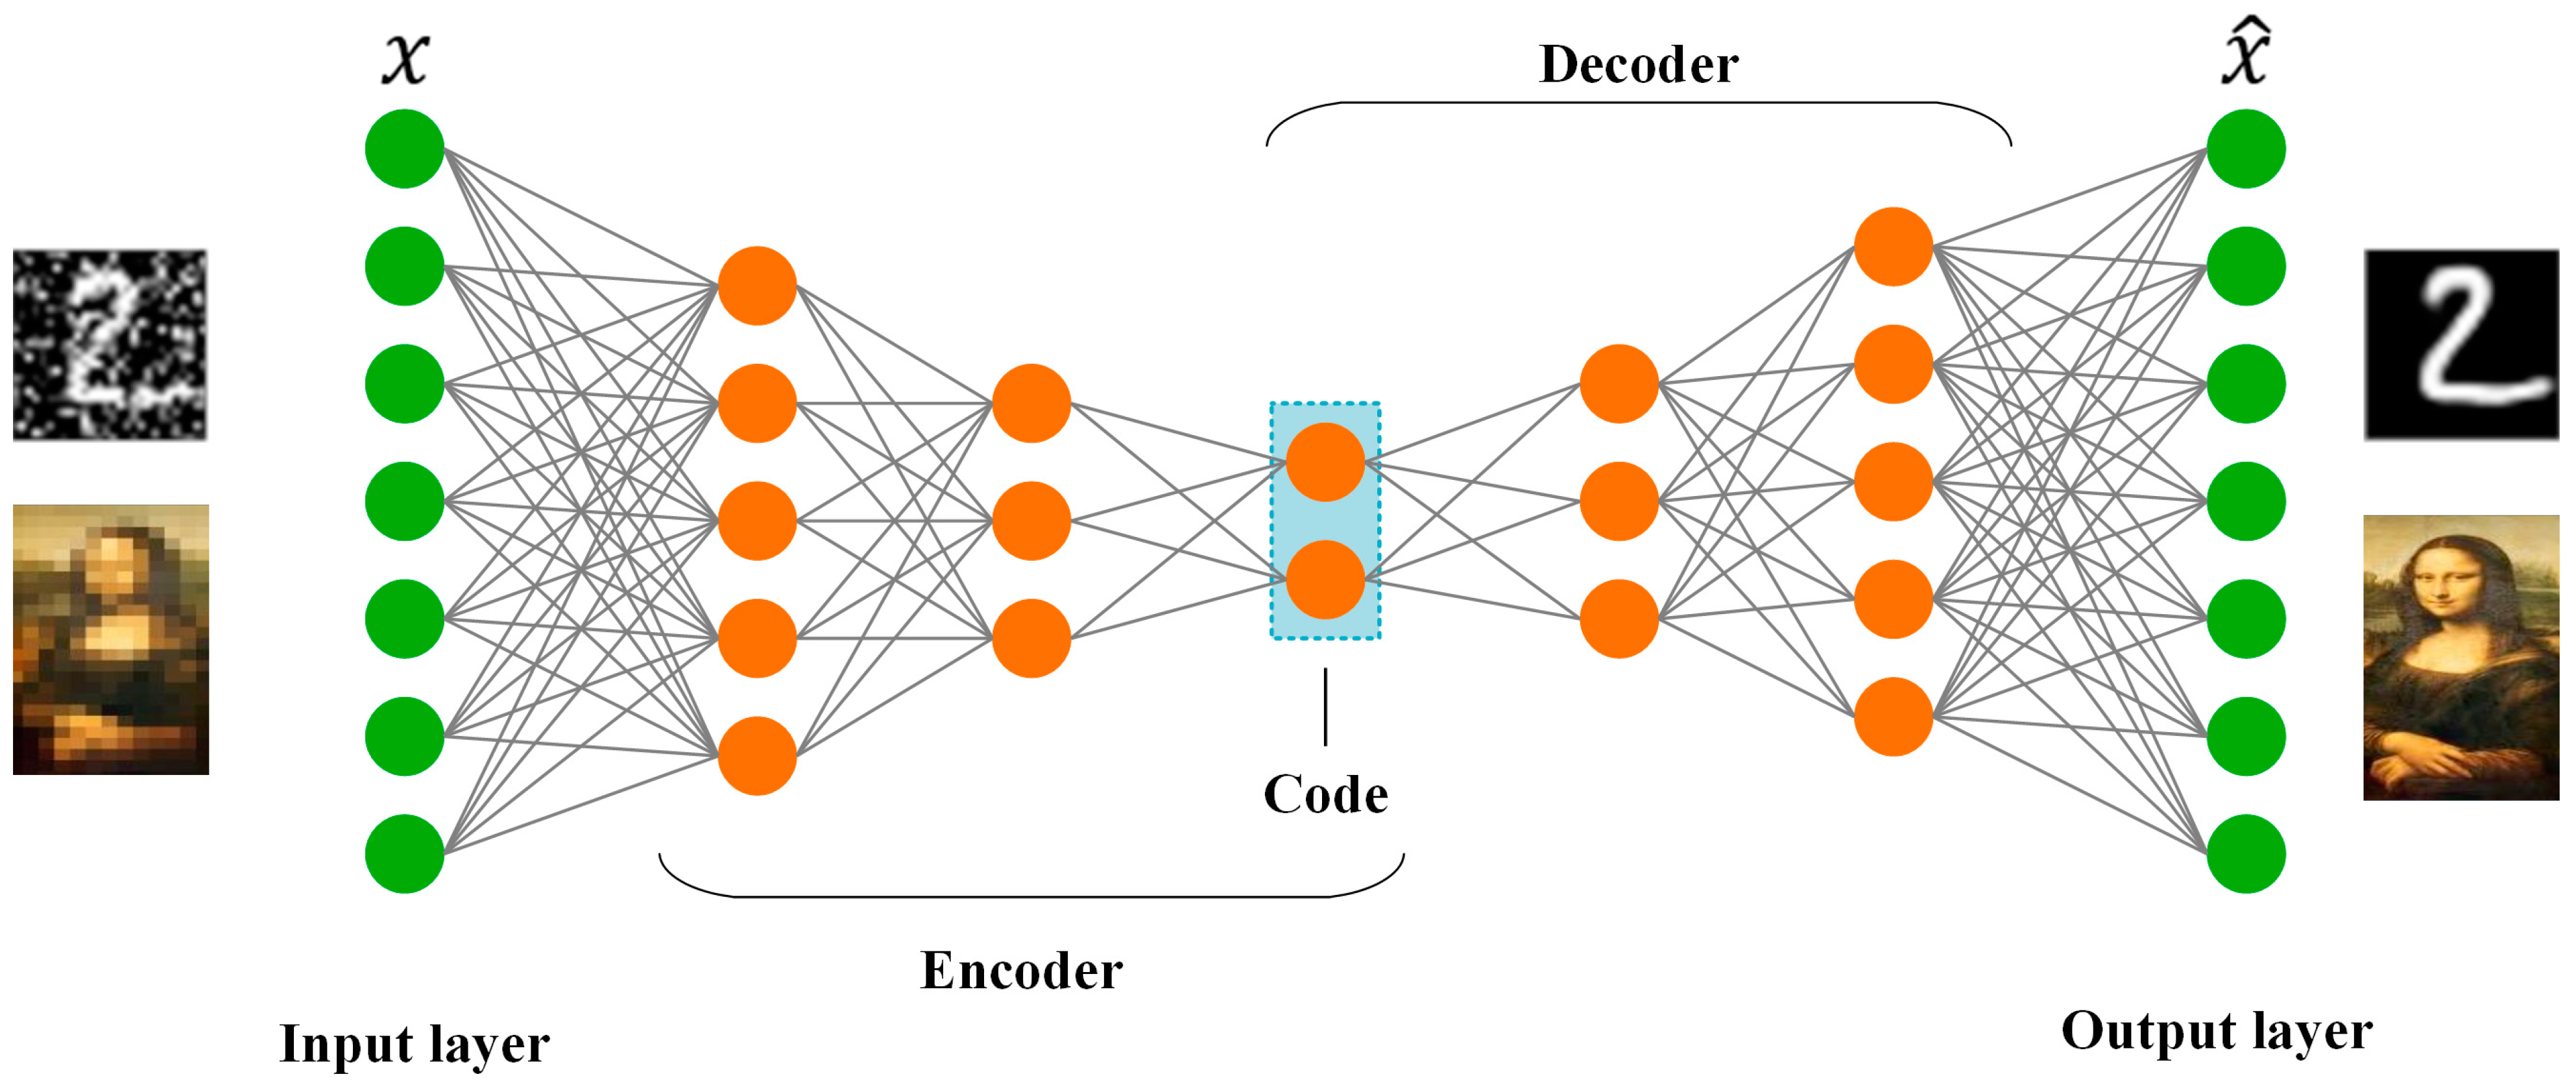
Figure 8.
Long short-term memory (LSTM) architecture.
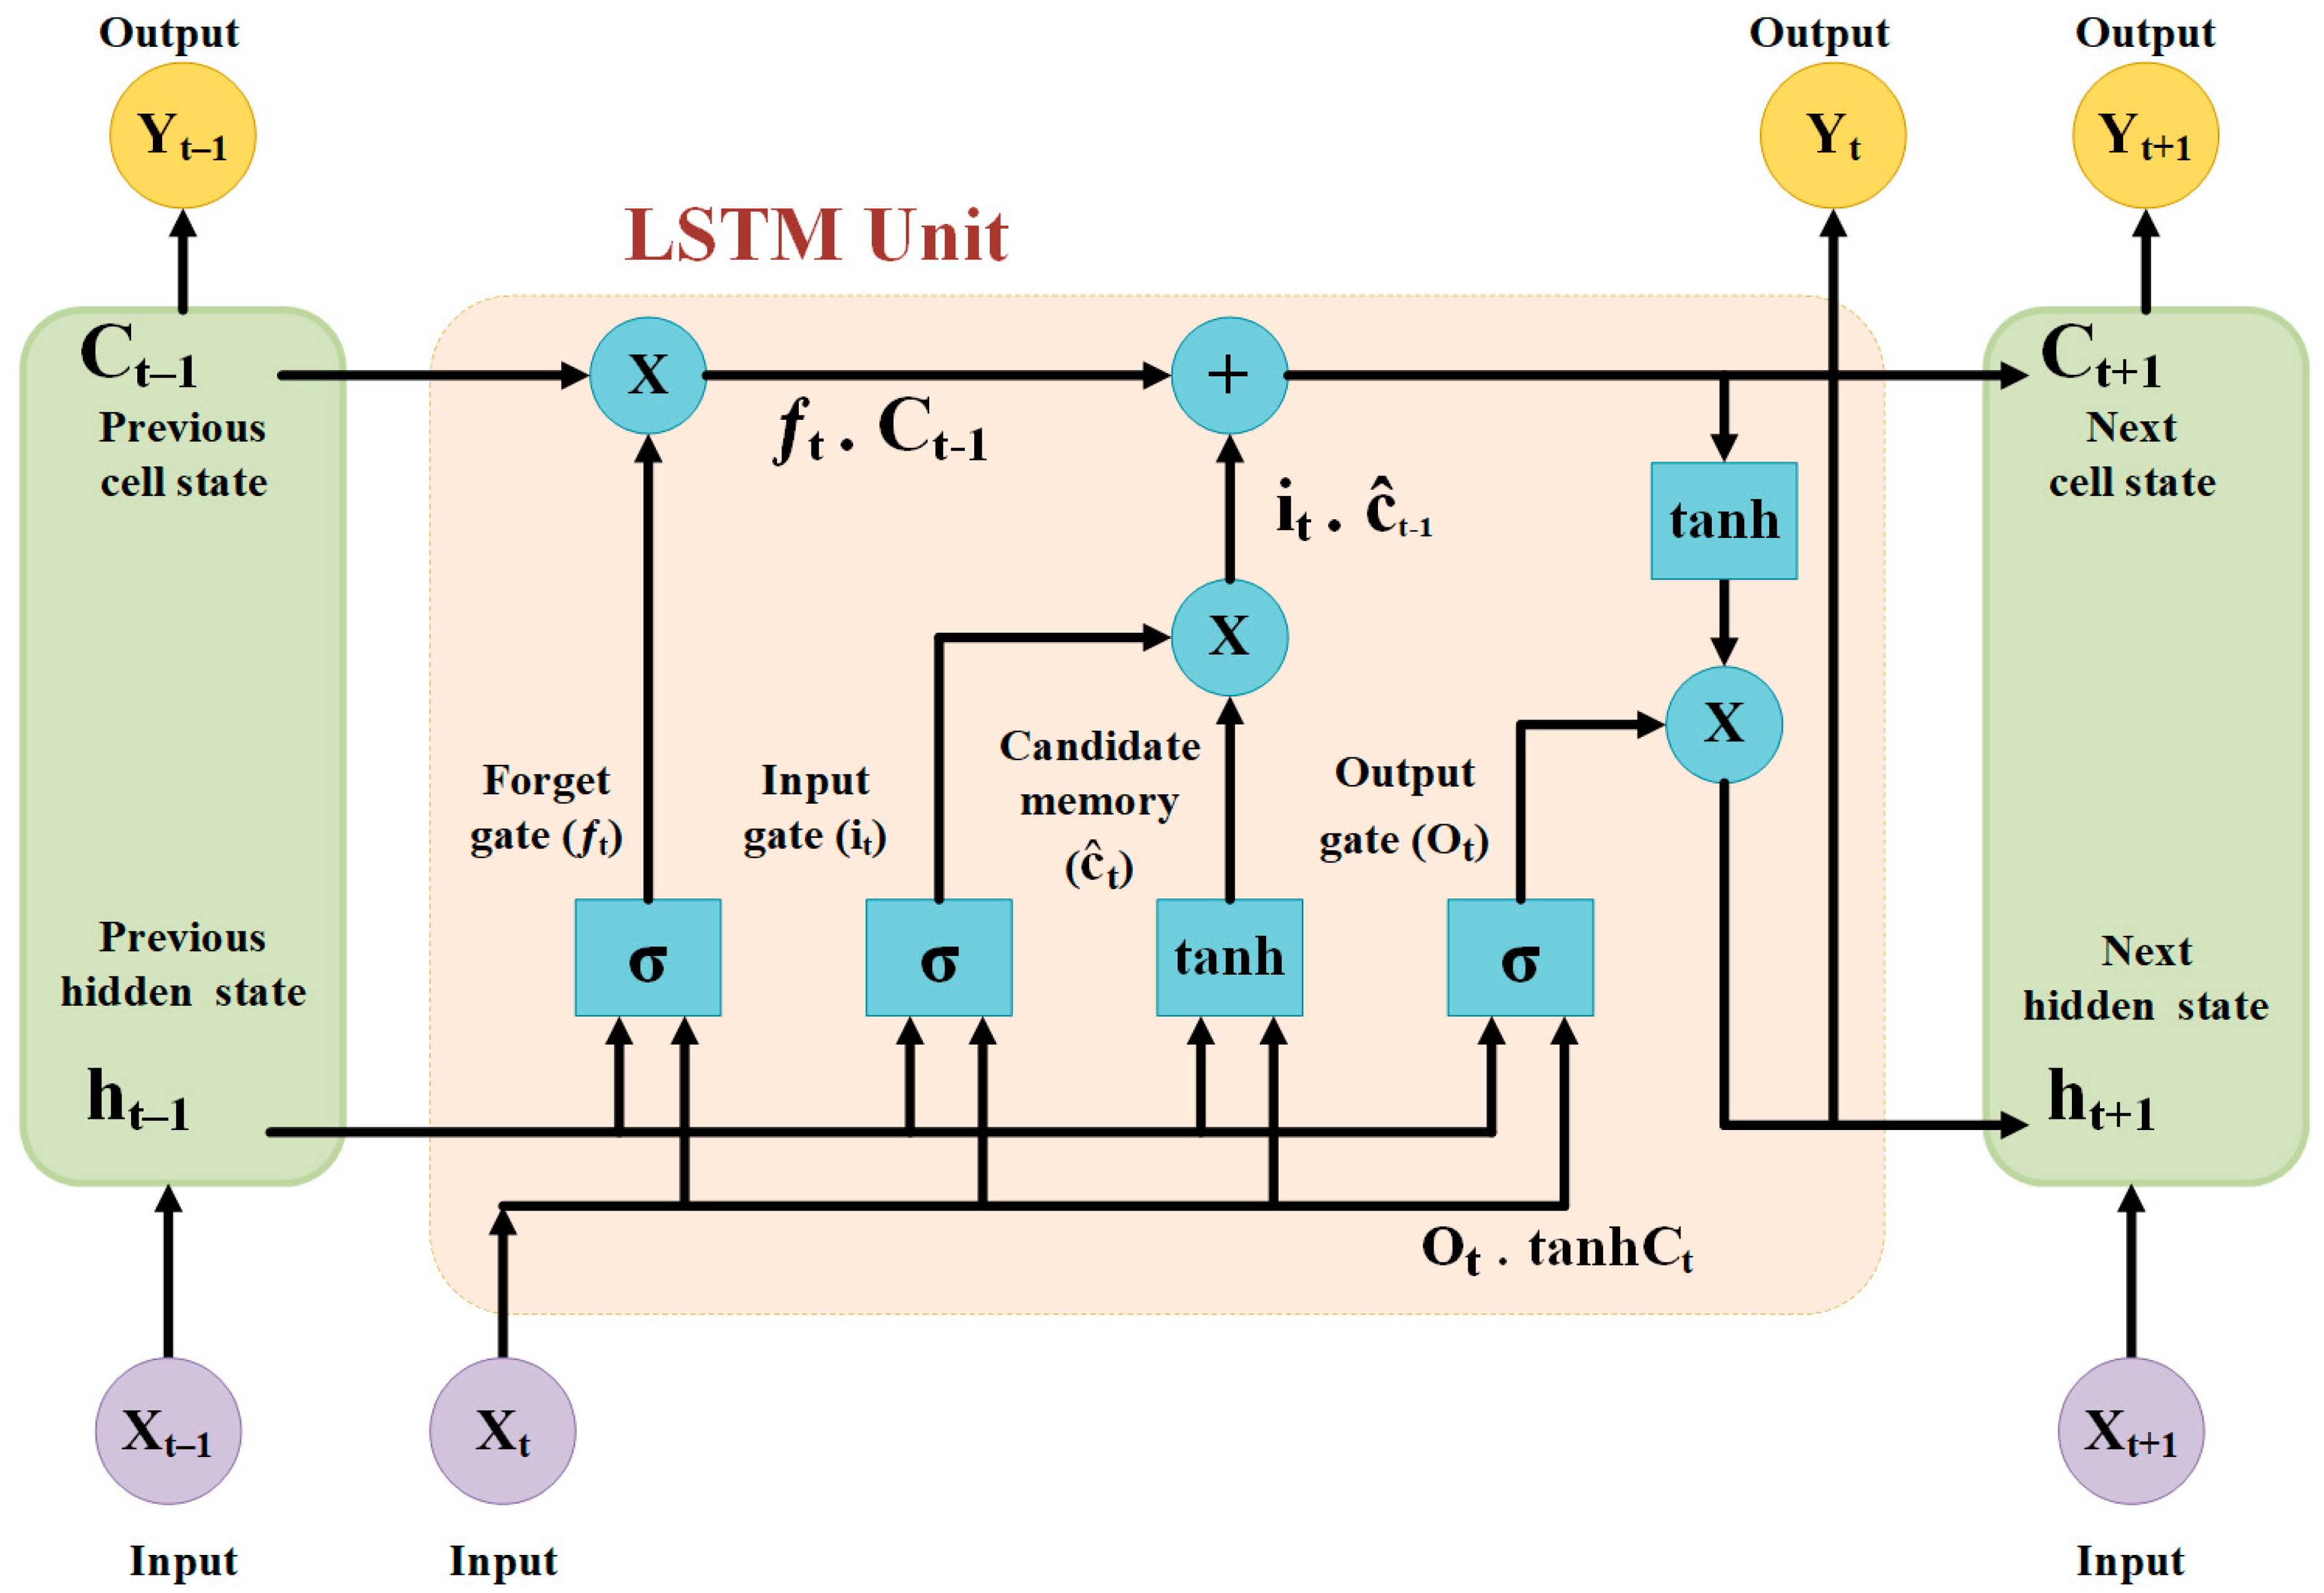
Figure 9.
Transformer model architecture [125].
Figure 9.
Transformer model architecture [125].
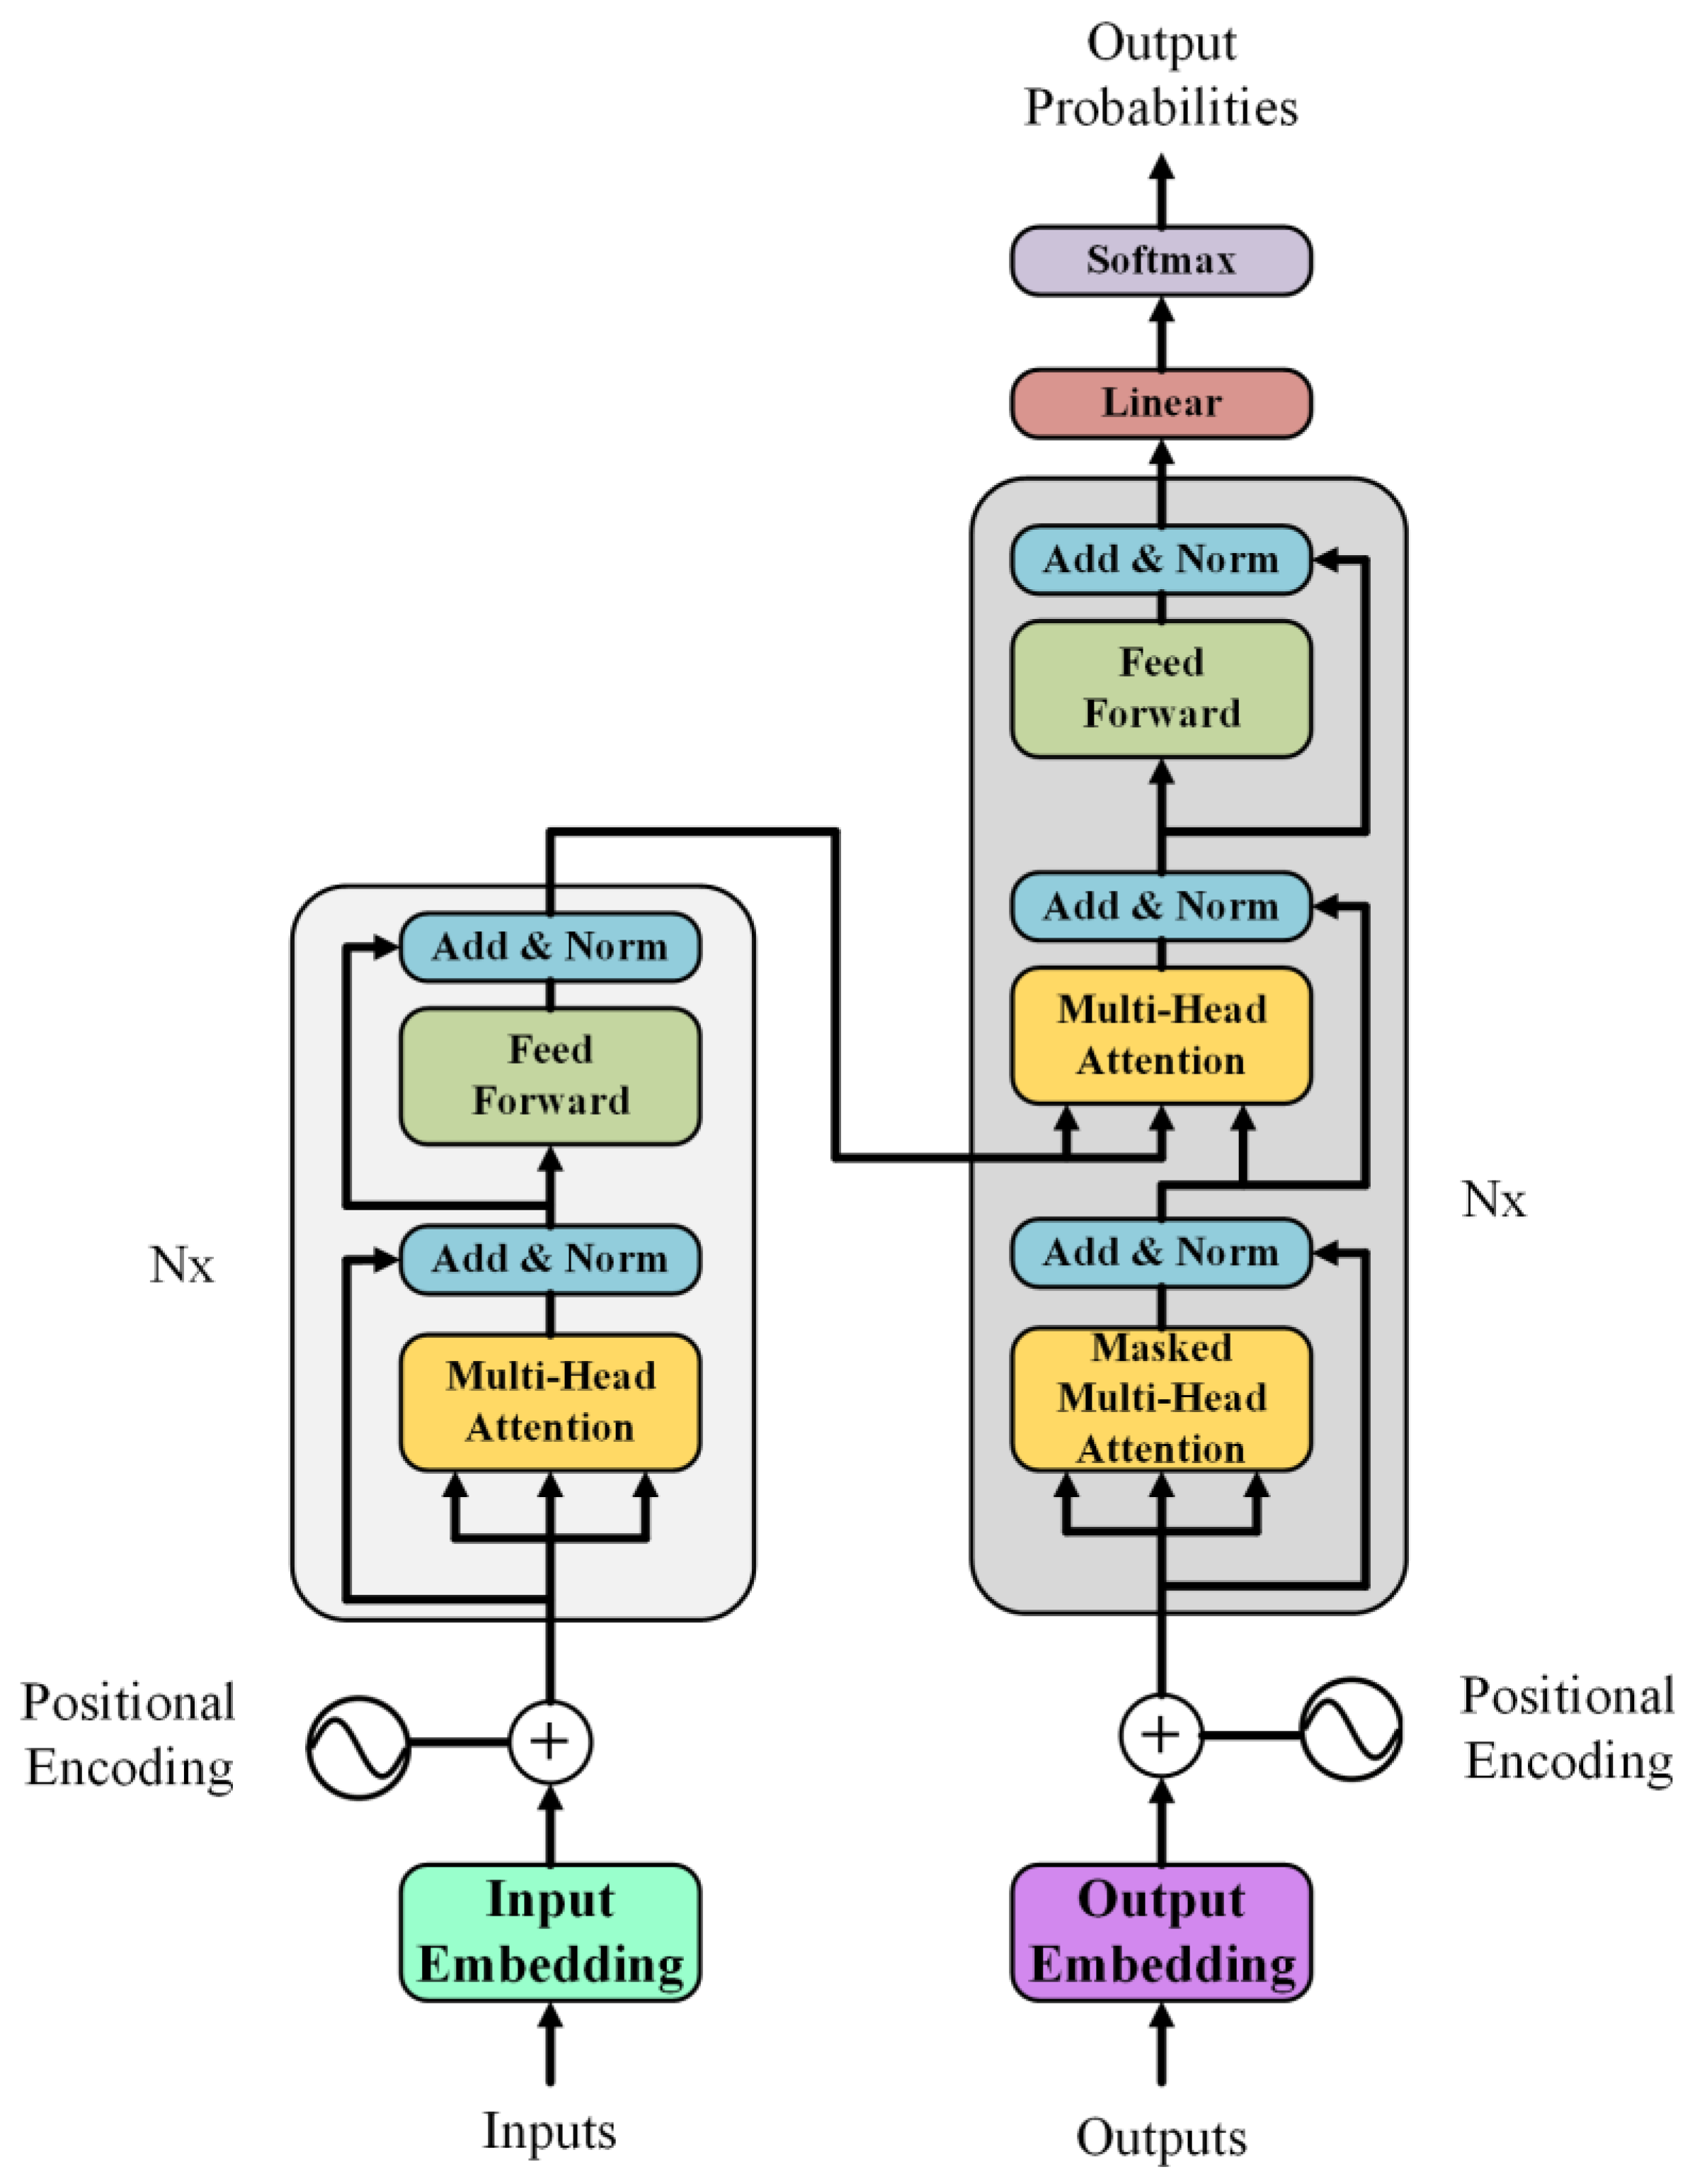
Figure 10.
Overall system structure, execution, and validation process.

Figure 11.
Pearson correlation heatmap for the collected data.
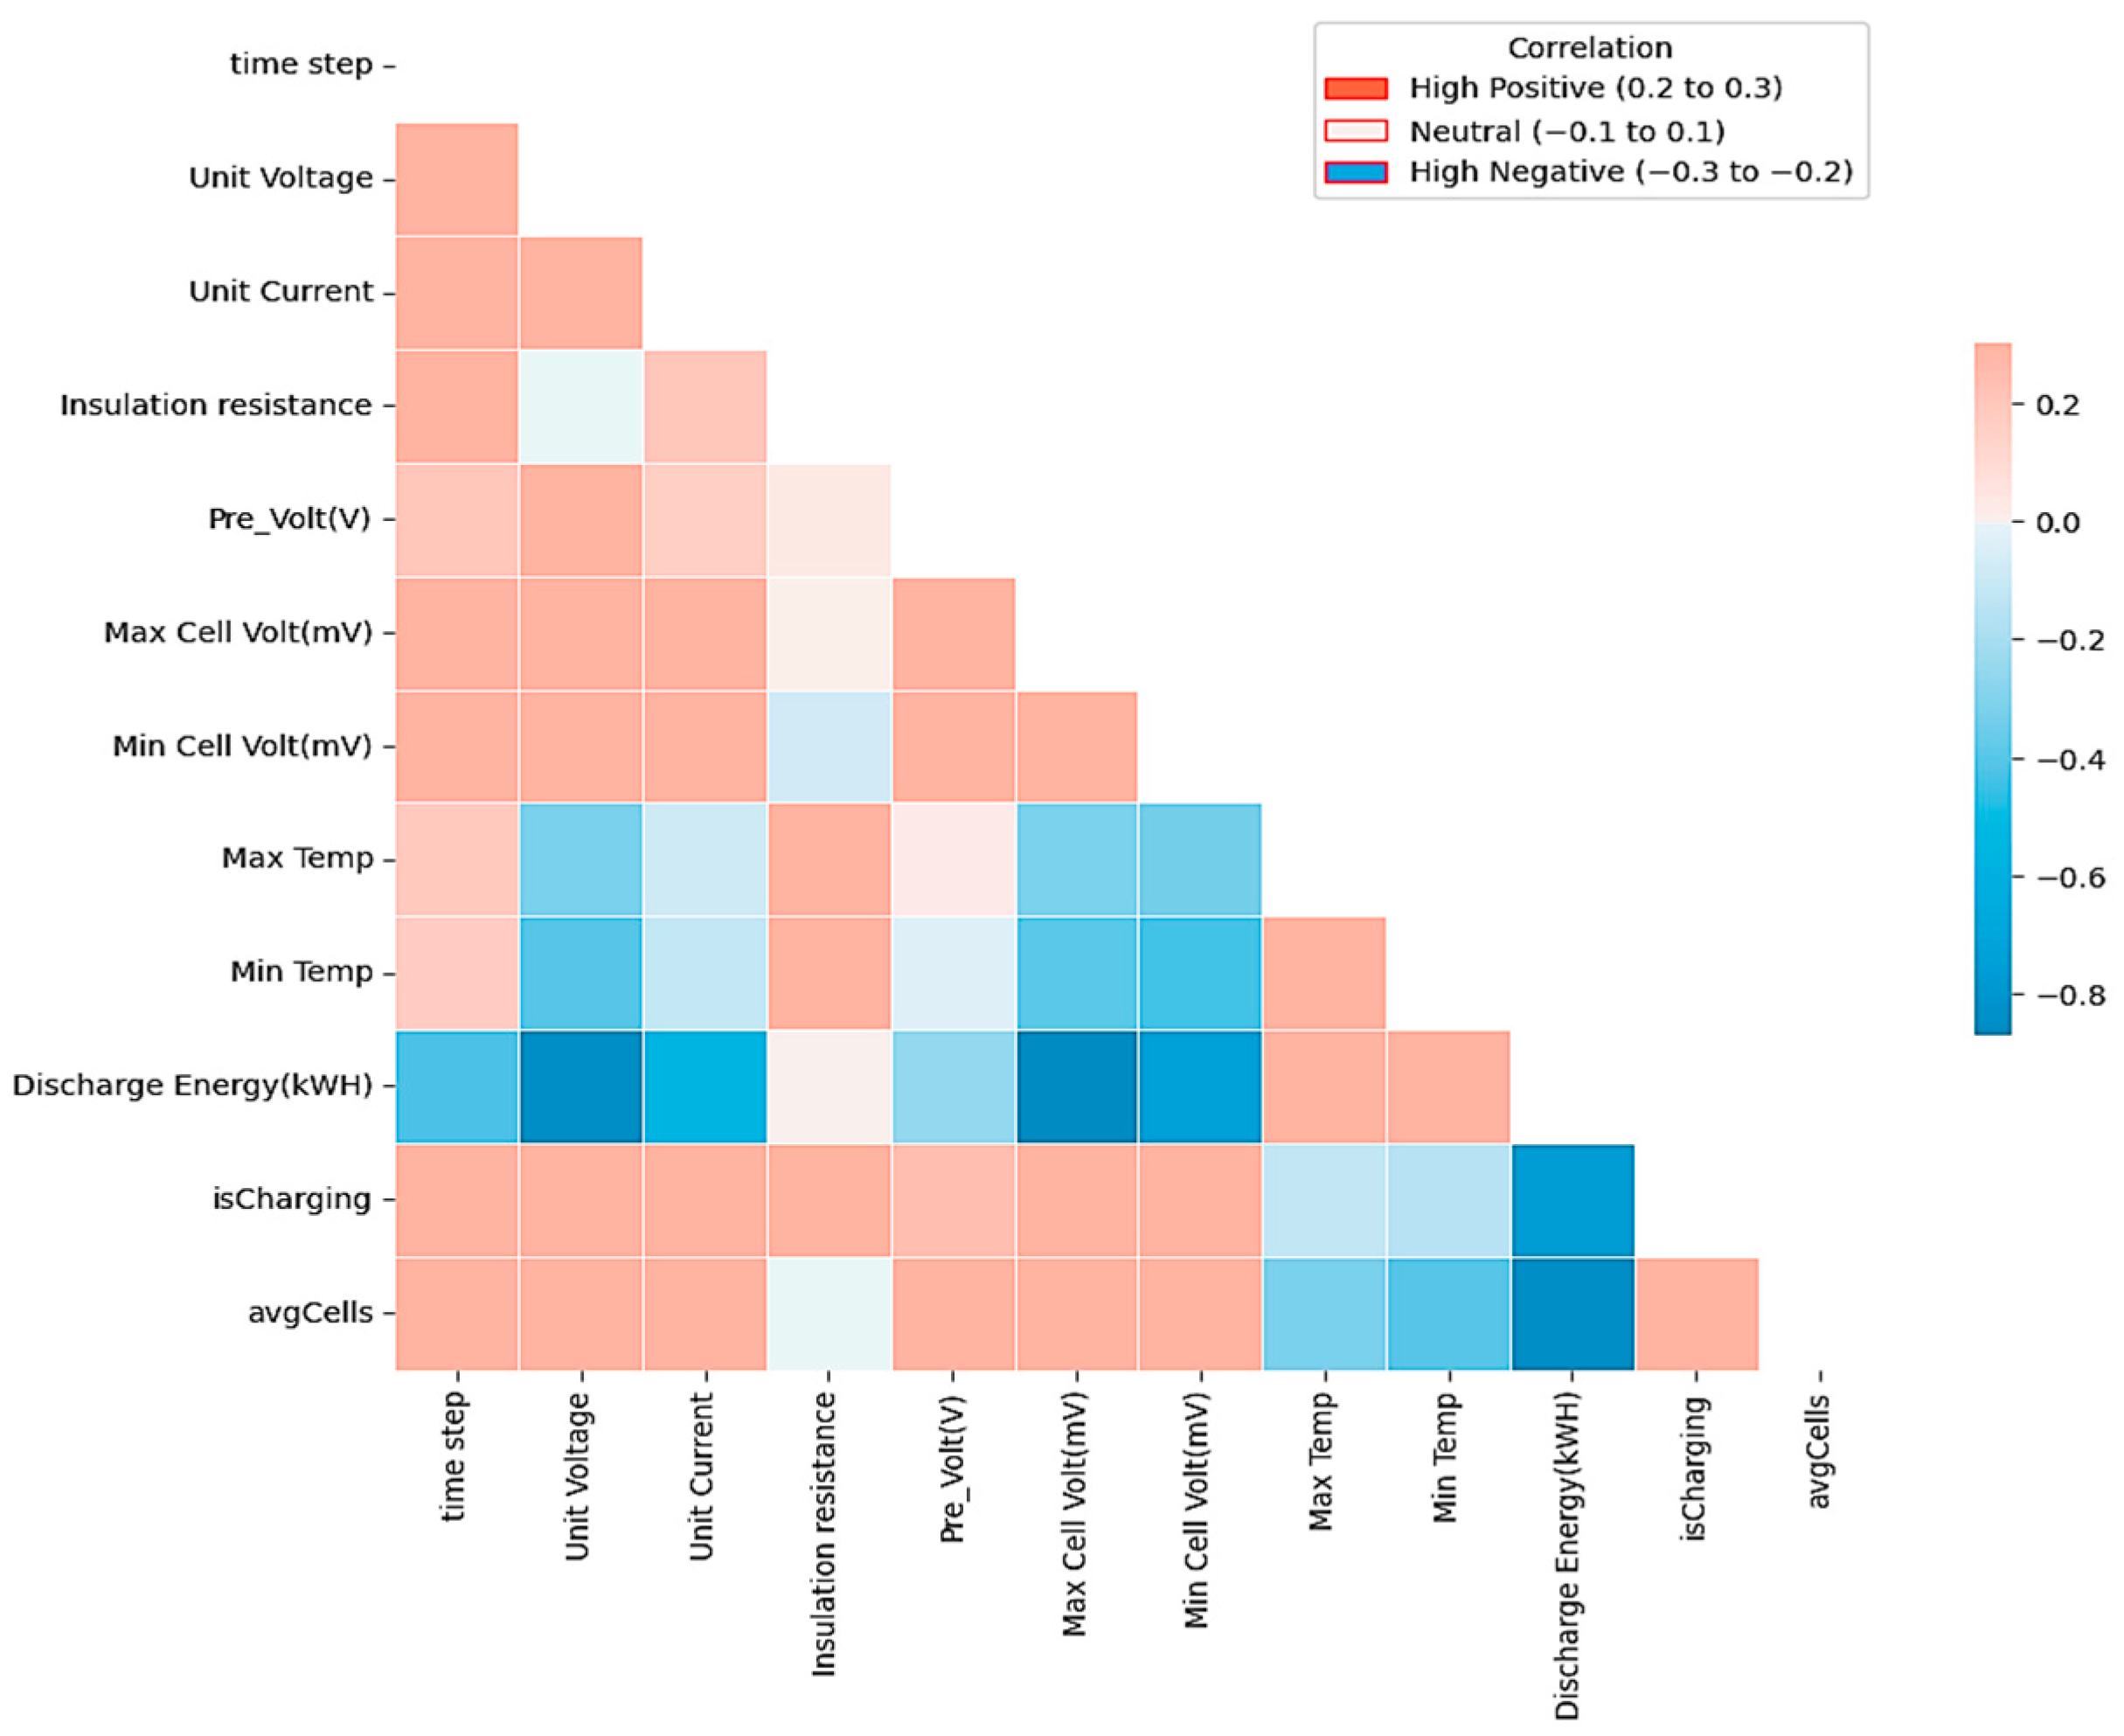
Figure 12.
Data preprocessing workflow.

Figure 13.
Neural network structure used in this paper for the SoC application.
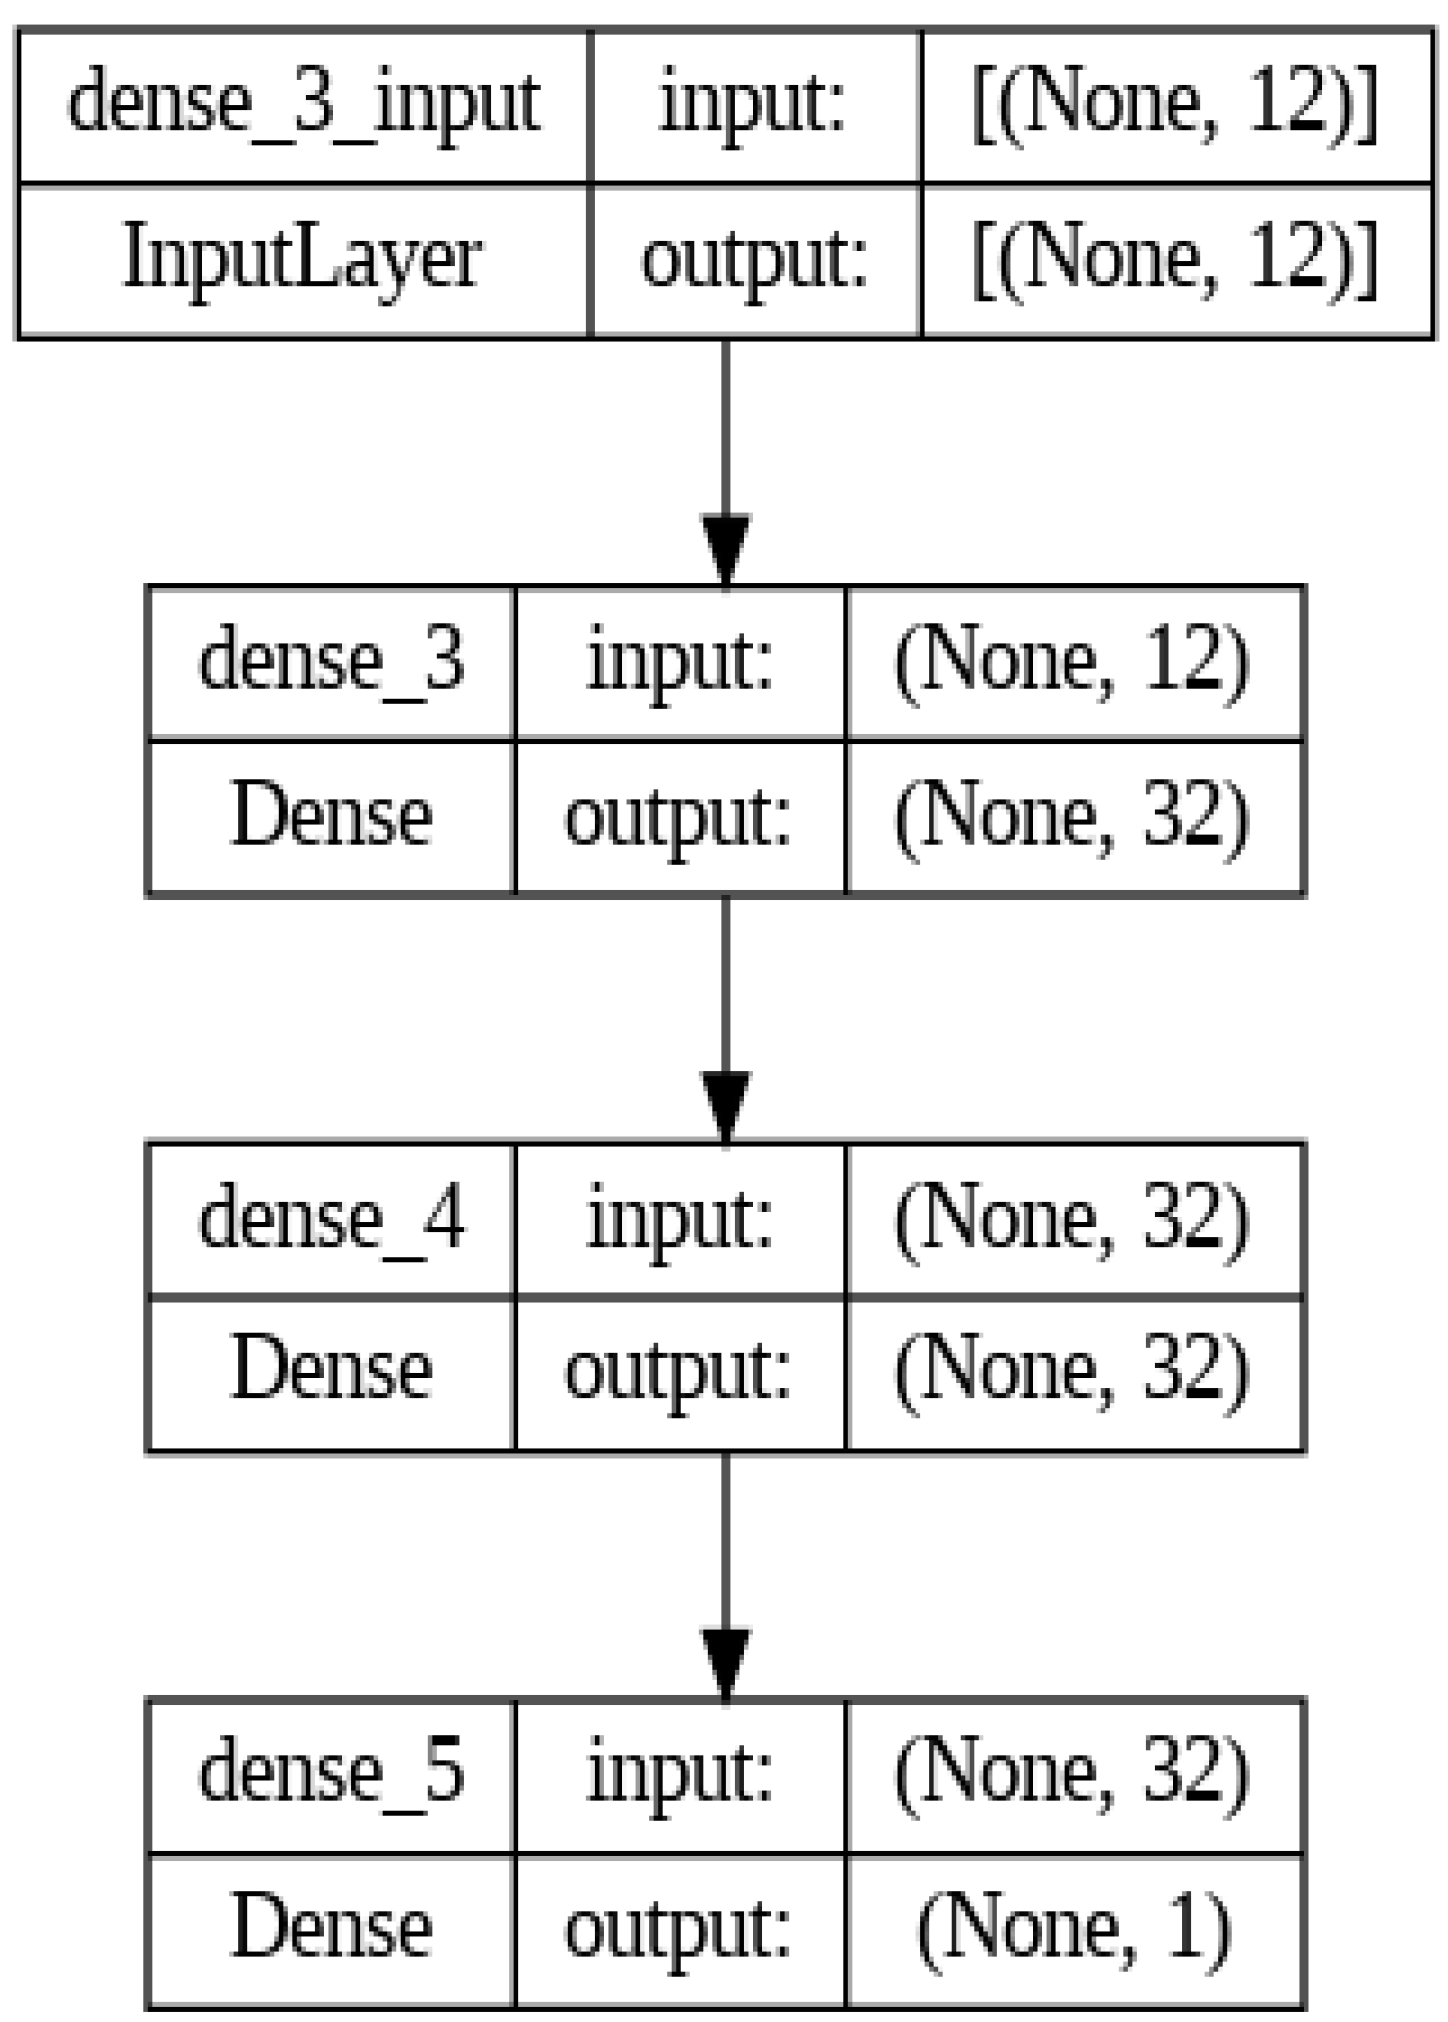
Figure 14.
Autoencoder structure used in this paper for the SoC application.
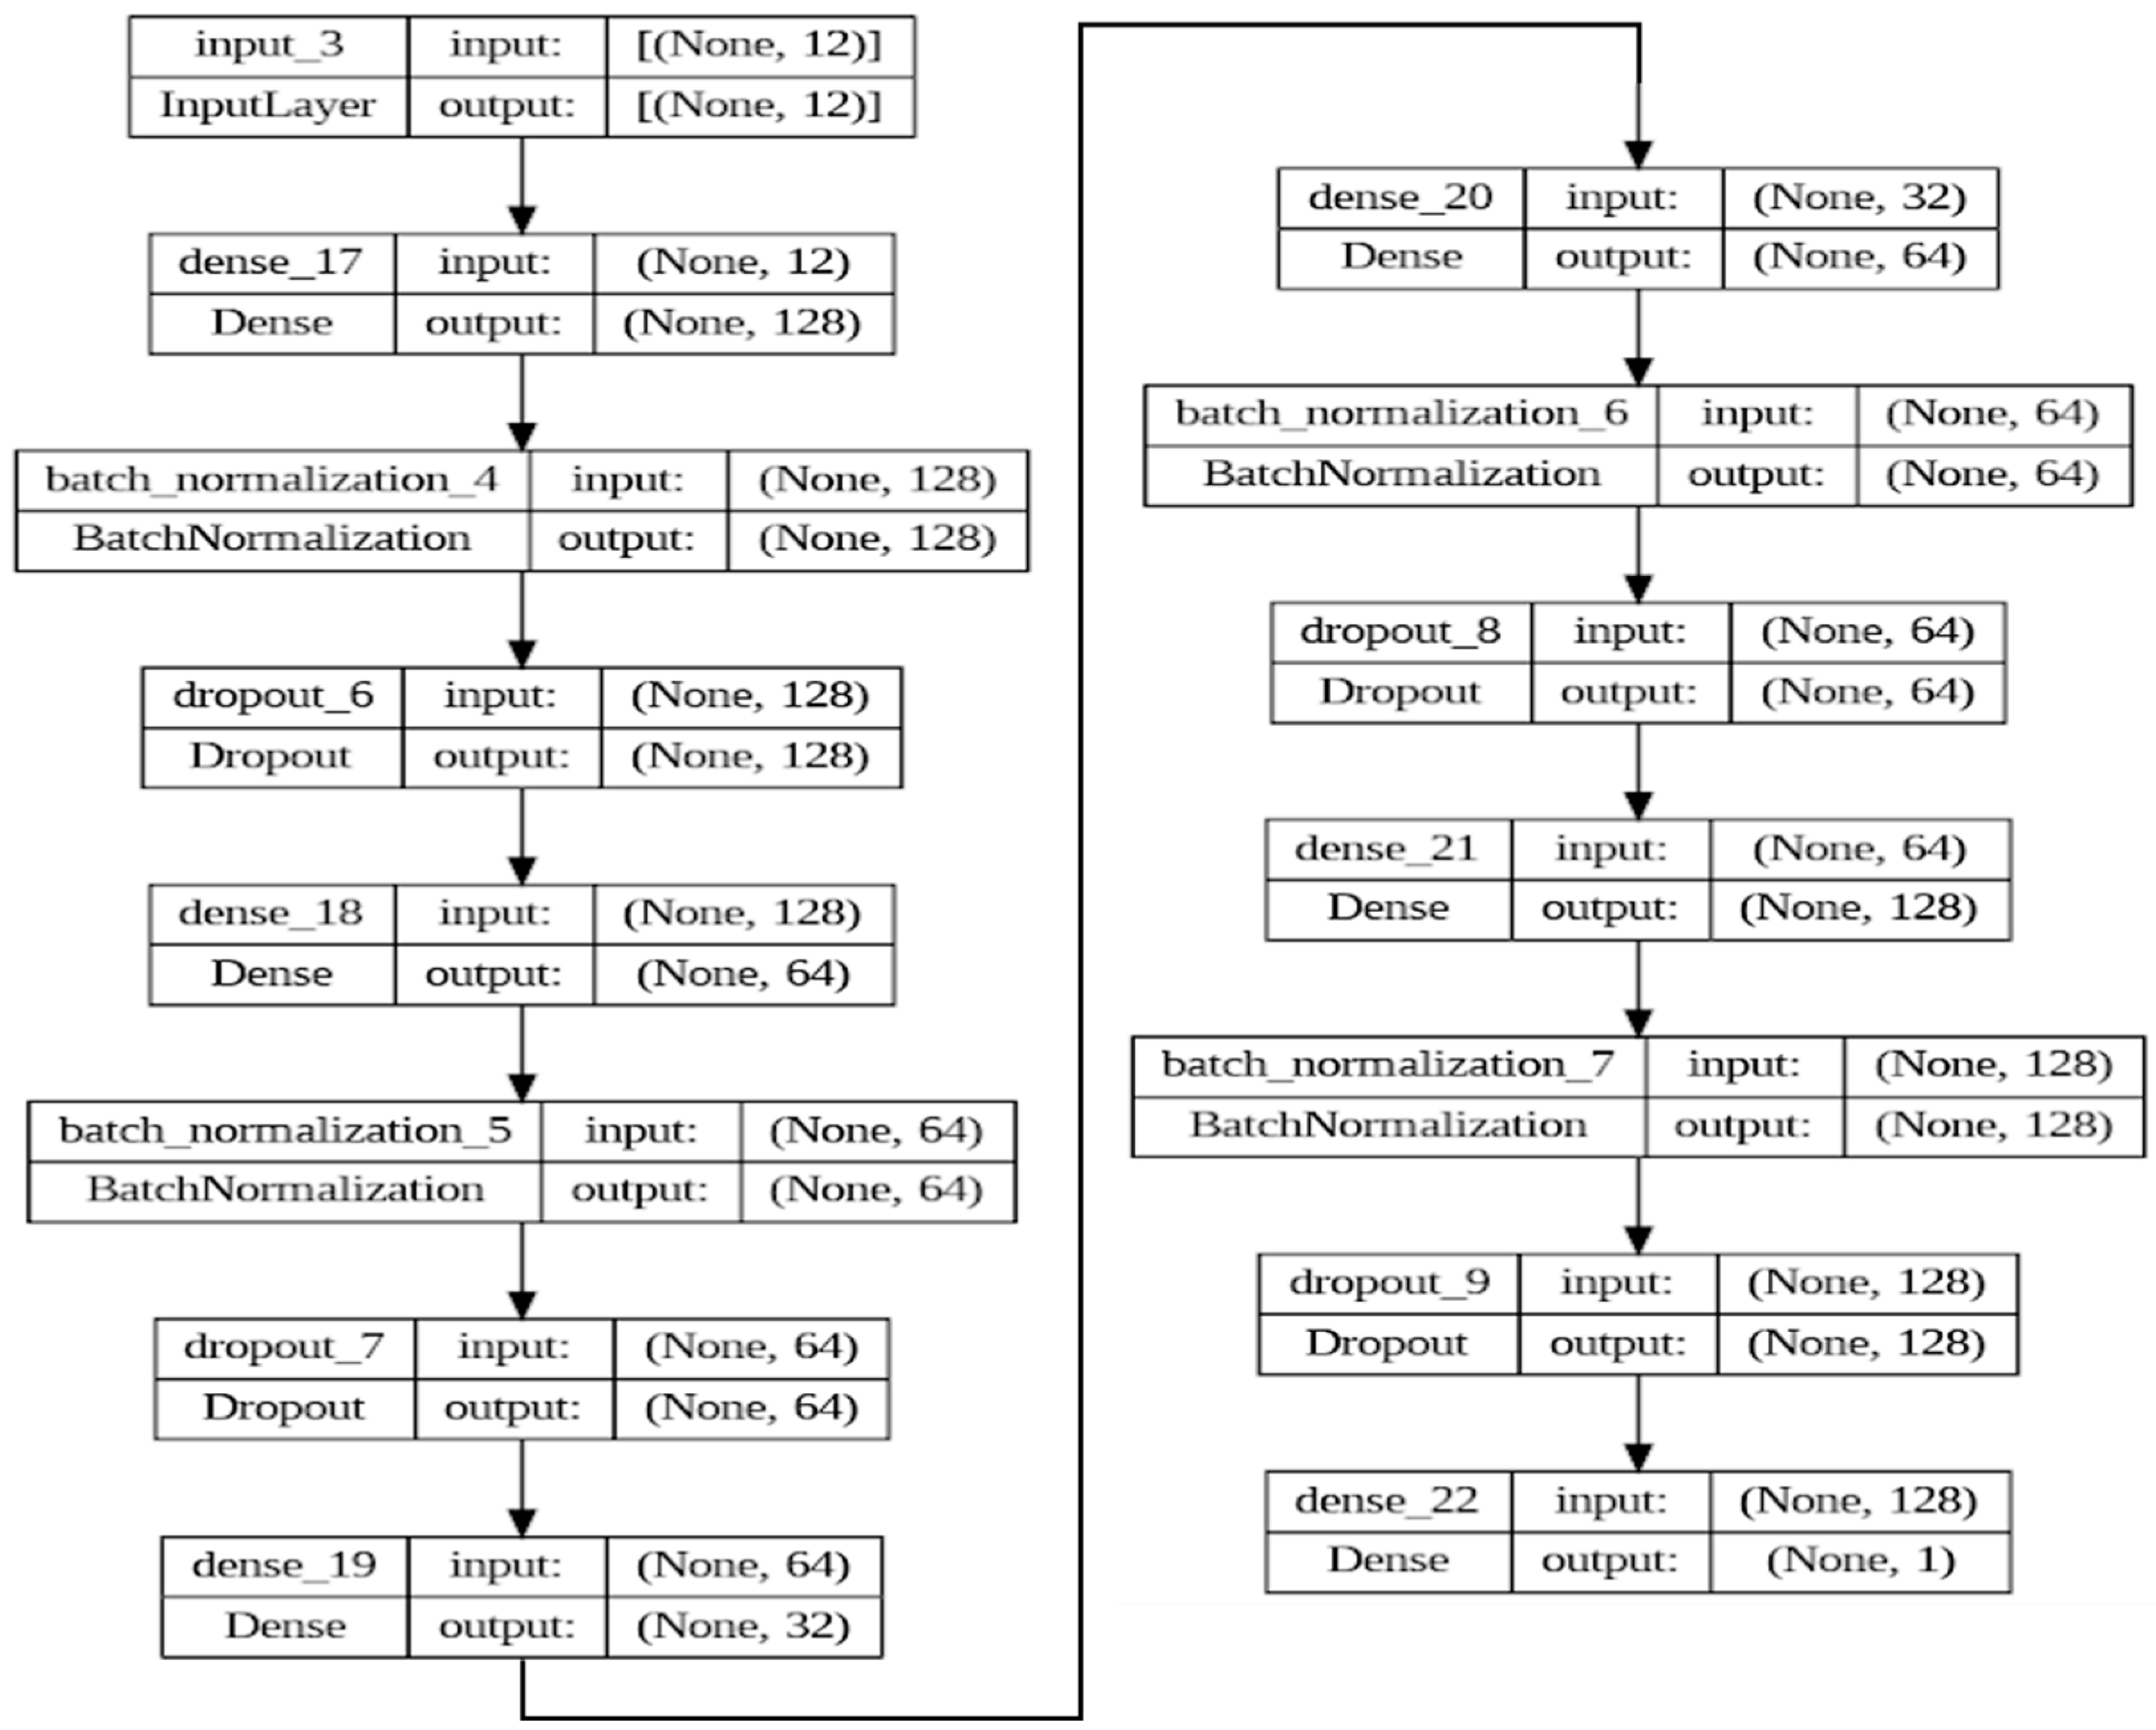
Figure 15.
LSTM structure used in this paper for the SOC application.
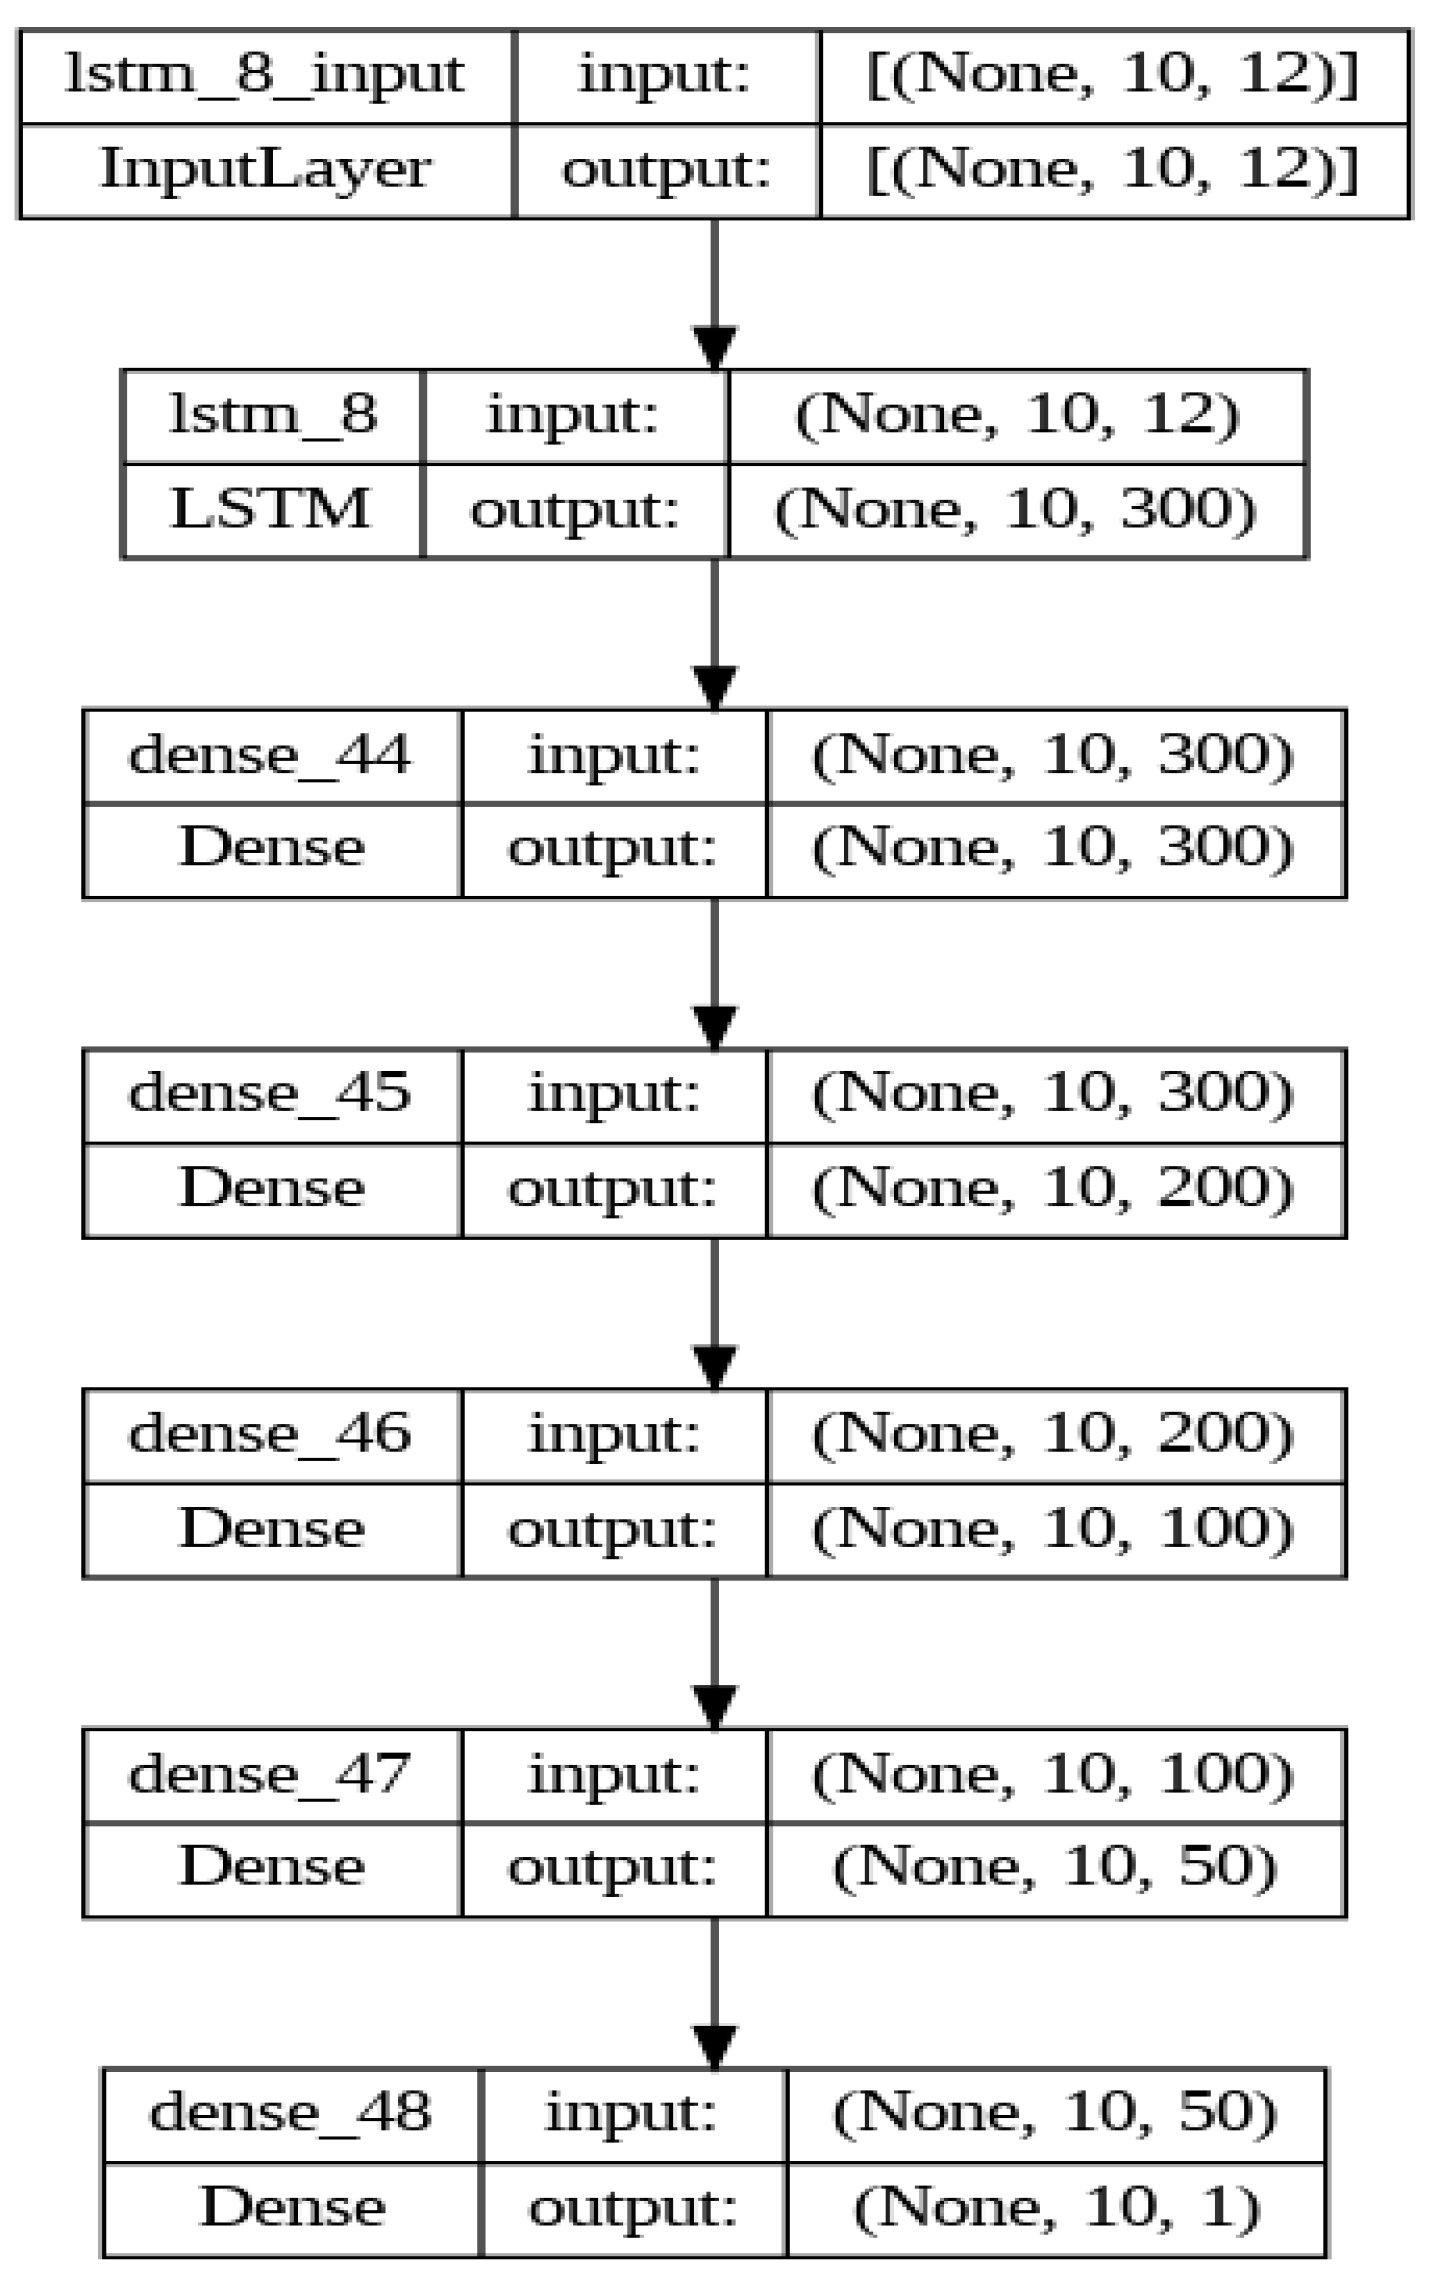
Figure 16.
Transformer structure used in this paper for the SOC application.
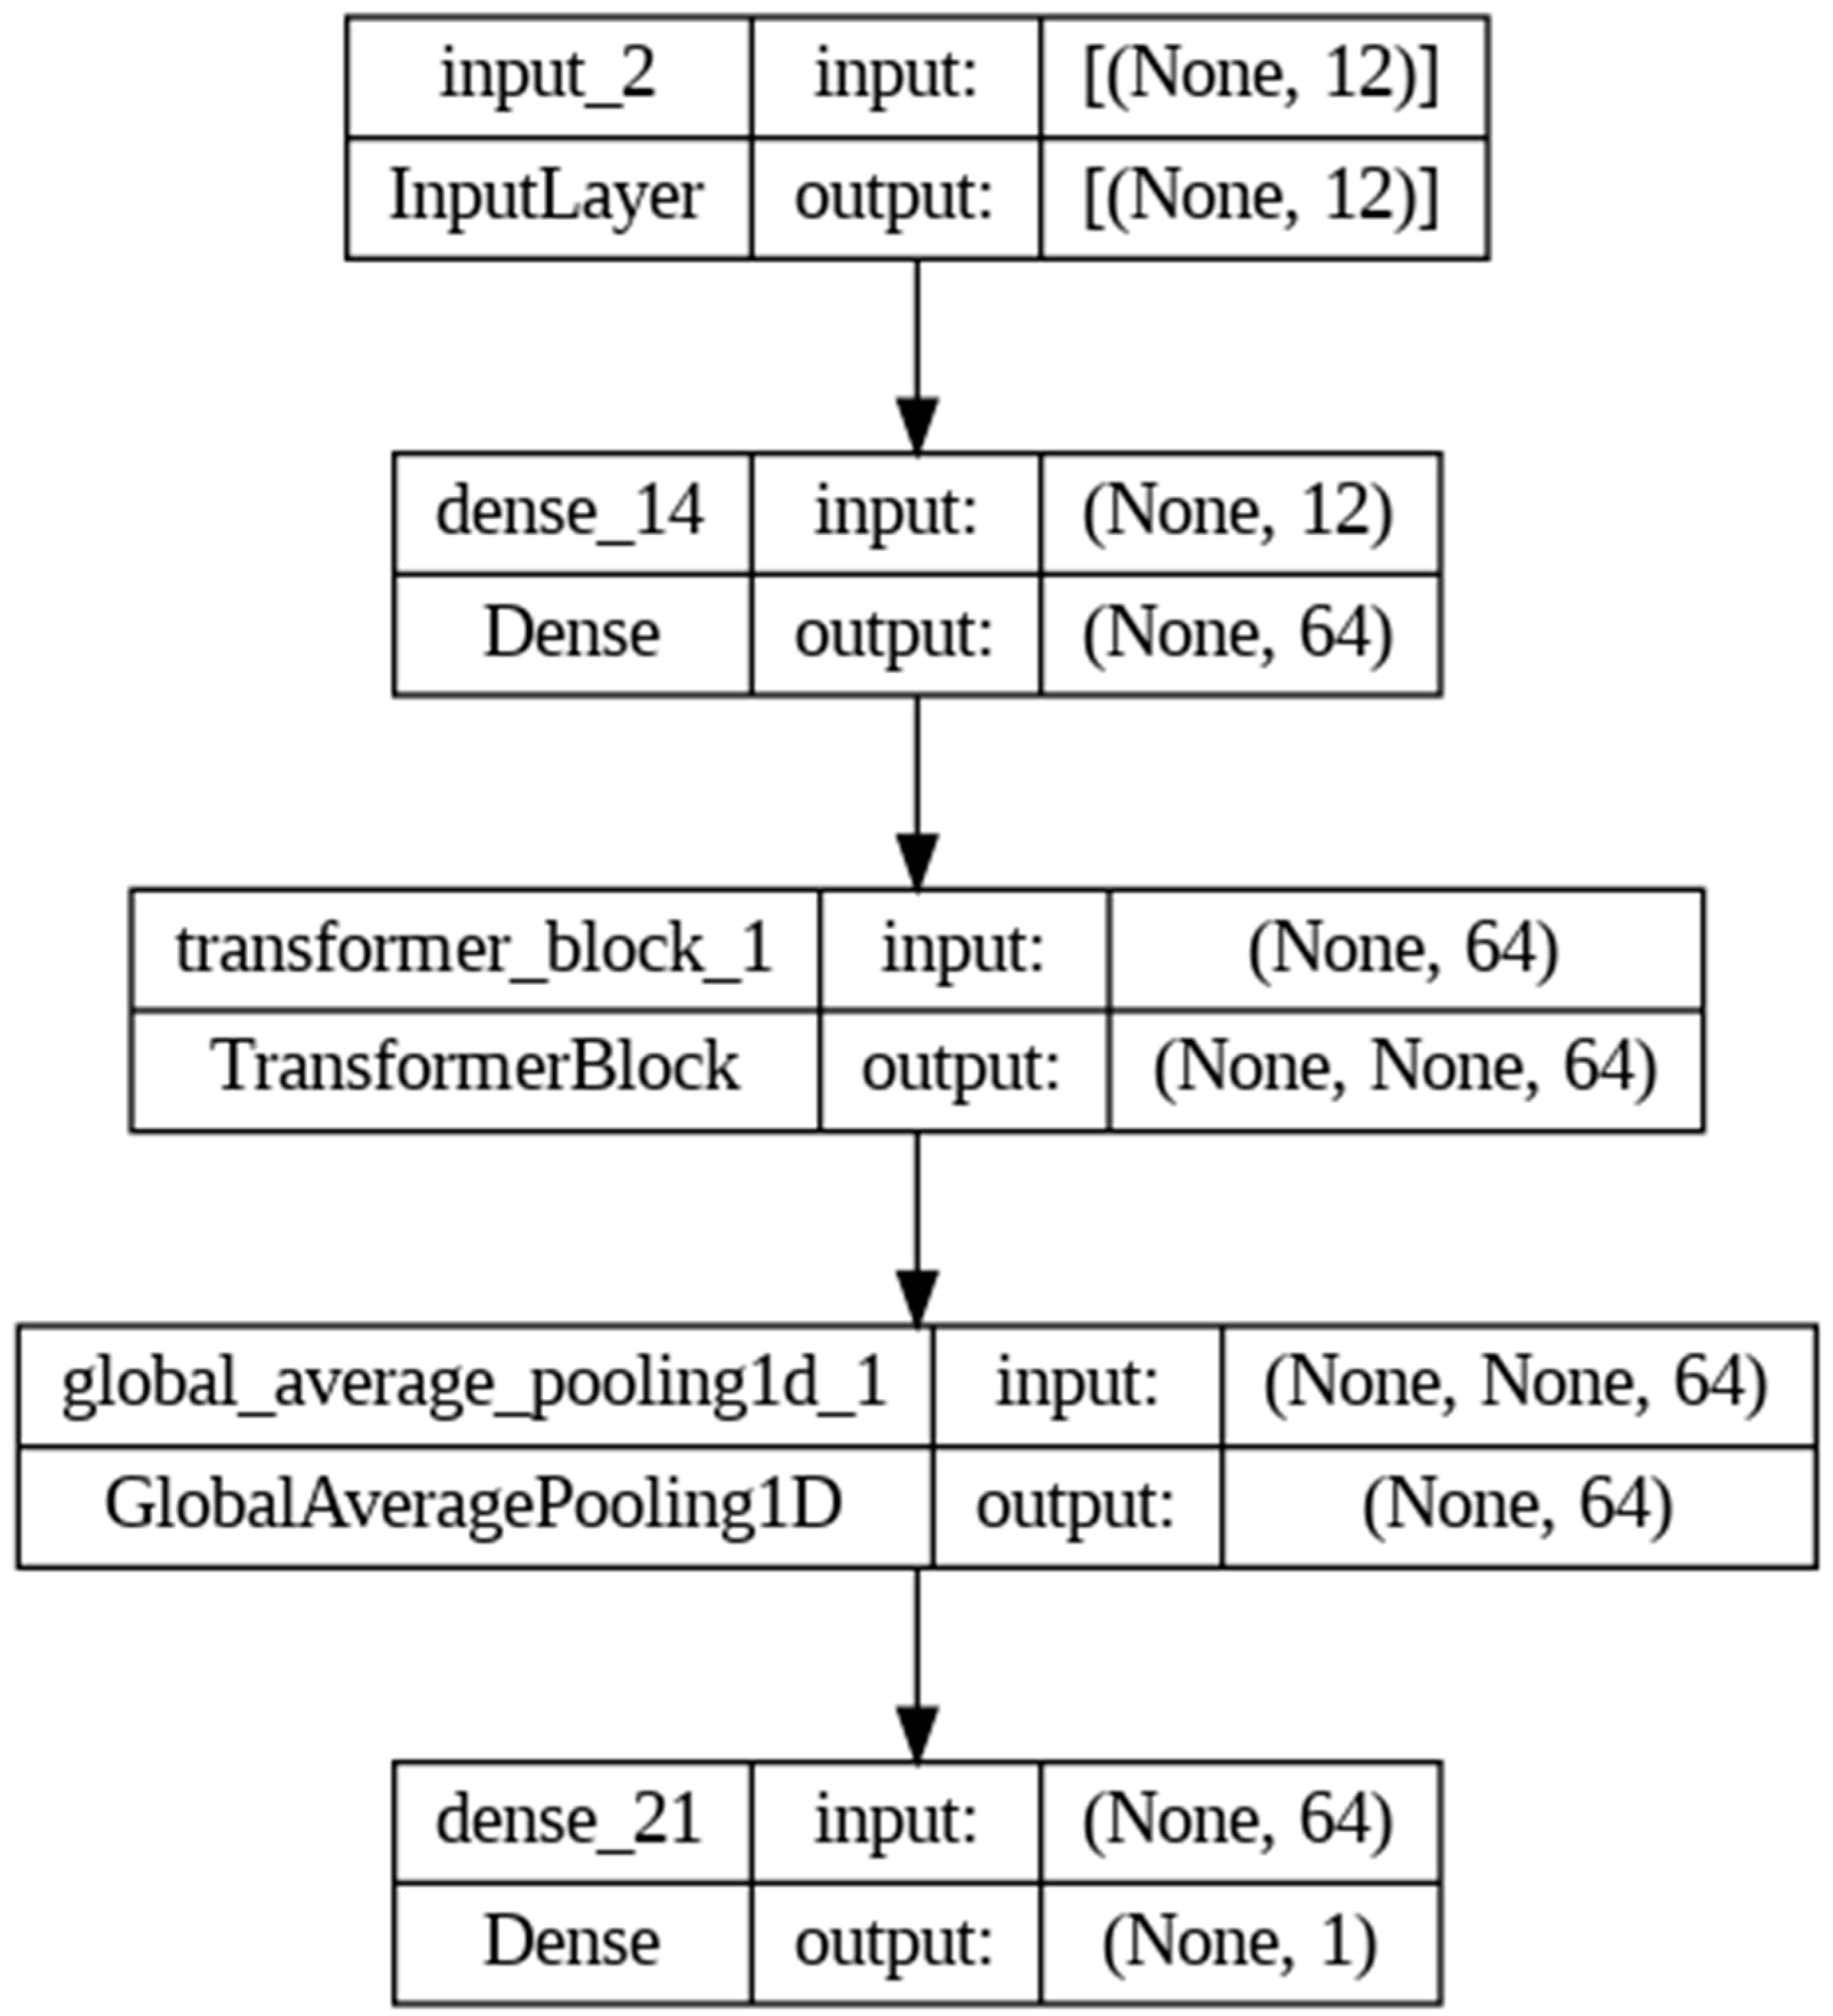
Figure 17.
SoC estimation results for the proposed models: (a) LR; (b) NN; (c) AE; (d) transformer; (e) LSTM; (f) RFR.
Figure 17.
SoC estimation results for the proposed models: (a) LR; (b) NN; (c) AE; (d) transformer; (e) LSTM; (f) RFR.
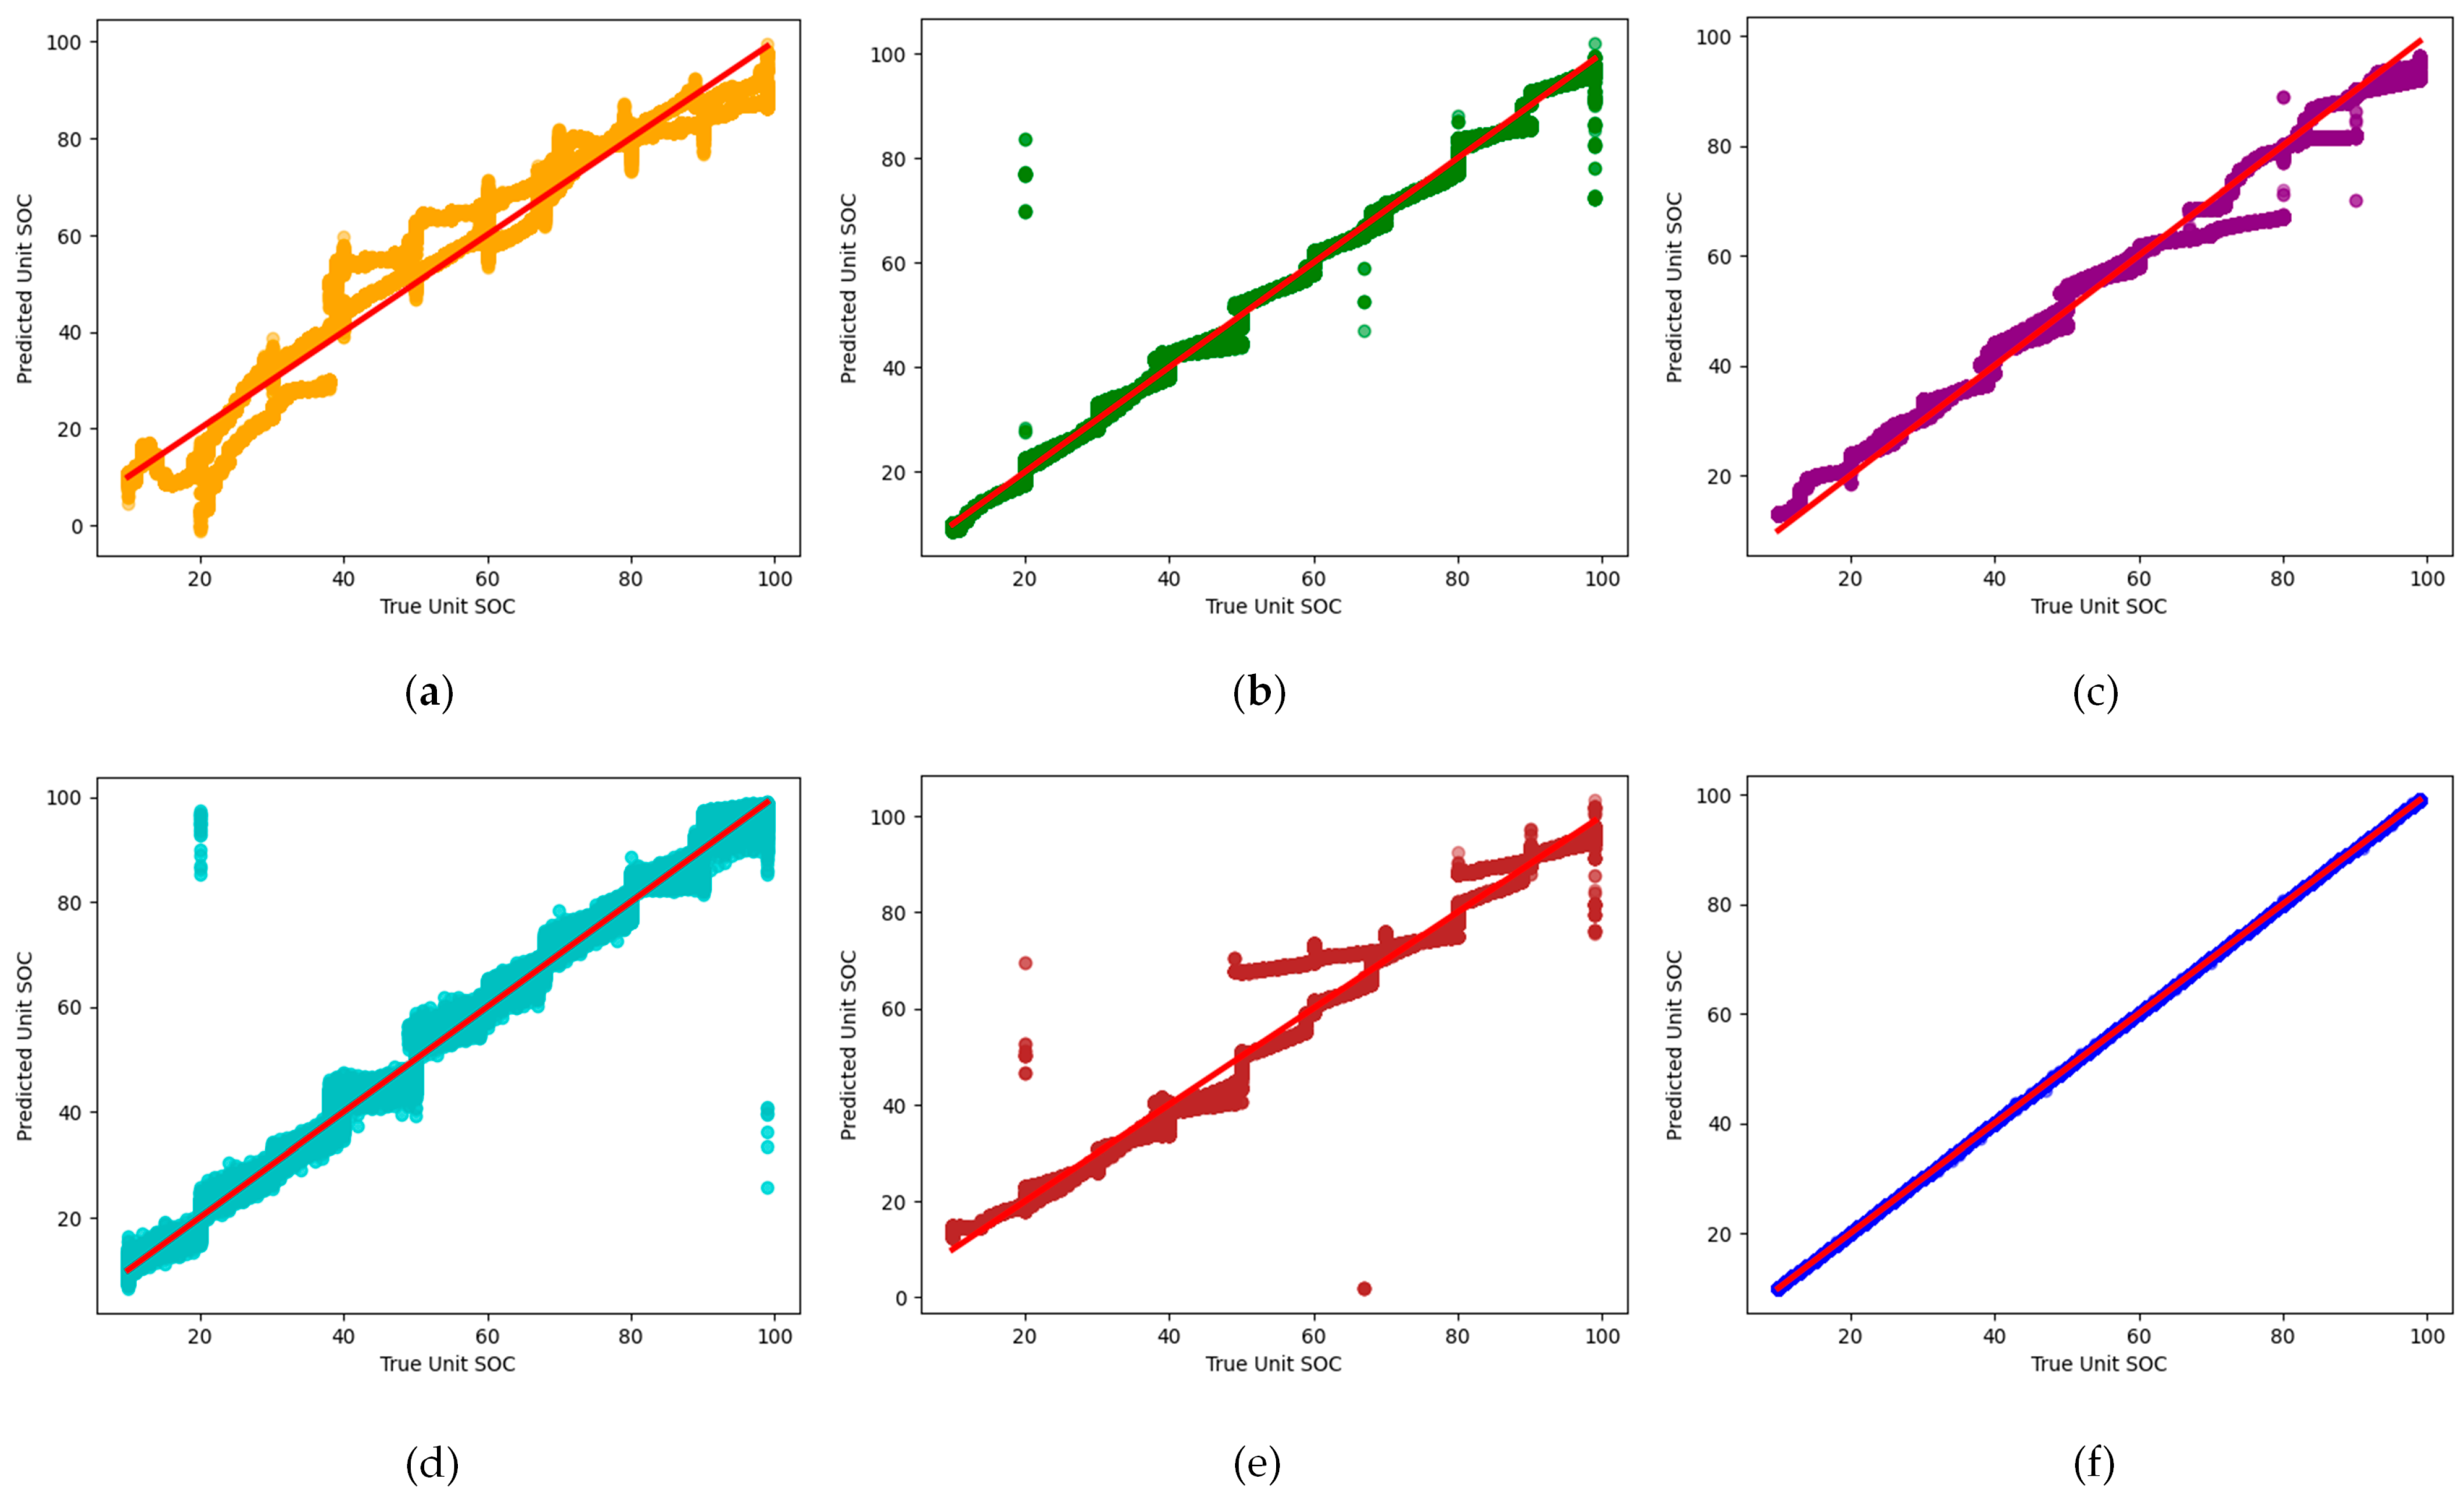

Table 1.
Detailed structure of the proposed data-driven models.
| LR | RFR | NN | AE | LSTM | TR | |
|---|---|---|---|---|---|---|
| Layer types | N/A | Decision trees | Dense | Dense, input, dropout, batch normalization | LSTM | MultiHeadAttention |
| Number of layers | N/A | N/A | 2 dense layers | Multiple (encoder, decoder, dropout, normalization) | Multiple with sequential model | Custom layers in transformer |
| Neurons per layer | N/A | N/A | 32 neurons each | Varies per layer | Varies per layer | - |
| Core parameters | - | N estimation = 100 | Dense layers with 32 neurons each | Input, dense, dropout, batch normalization layers | LSTM layer | D_model. Num_heads in MultiHeadAttention |
| Activation functions | - | - | ReLU | ReLU | Sigmoid | Not used |
| Regularization | - | - | - | Dropout, batch normalization | - | - |
| Learning rate optimizer | - | - | Adam | rmsprop | - | |
| Loss function | - | - | MSE | MSE | MSE | MSE |
| Dropout/batch normalization | N/A | N/A | Both used | N/A | N/A | |
| Hyperparameter tunability | Limited (mostly data preprocessing) | High (number of trees, depth, etc.) | High (layer types, number of neurons, activations) | High (layer types, encoding, decoding, activations) | High (number of units, return sequences, etc.) | High (attention heads, model size, etc.) |
| Model size (memory) | Amall | Large (due to multiple trees) | Varies (depends on the number of layers and neurons) | Varies (complex architecture) | Varies (depends on sequence length and complexity) | Large (due to complex architecture) |
Table 2.
Performance comparison.
| LR | NN | AE | TR | LSTM | RFR | |
|---|---|---|---|---|---|---|
| MSE | 33.7637442 | 19.1336108 | 13.328750 | 4.4526869 | 3.5021456 | 0.0002765 |
| MAE | 4.5823155 | 2.63253629 | 2.1715623 | 1.1486983 | 0.0139719 | 0.0007379 |
| R-squared | 0.9491749 | 0.97119789 | 0.9833935 | 0.9931919 | 0.9989747 | 0.9999996 |
Disclaimer/Publisher’s Note: The statements, opinions and data contained in all publications are solely those of the individual author(s) and contributor(s) and not of MDPI and/or the editor(s). MDPI and/or the editor(s) disclaim responsibility for any injury to people or property resulting from any ideas, methods, instructions or products referred to in the content. |
© 2024 by the authors. Licensee MDPI, Basel, Switzerland. This article is an open access article distributed under the terms and conditions of the Creative Commons Attribution (CC BY) license (https://creativecommons.org/licenses/by/4.0/).
Share and Cite
MDPI and ACS Style
Hussein, H.M.; Esoofally, M.; Donekal, A.; Rafin, S.M.S.H.; Mohammed, O. Comparative Study-Based Data-Driven Models for Lithium-Ion Battery State-of-Charge Estimation. Batteries 2024, 10, 89. https://doi.org/10.3390/batteries10030089
AMA Style
Hussein HM, Esoofally M, Donekal A, Rafin SMSH, Mohammed O. Comparative Study-Based Data-Driven Models for Lithium-Ion Battery State-of-Charge Estimation. Batteries. 2024; 10(3):89. https://doi.org/10.3390/batteries10030089
Chicago/Turabian StyleHussein, Hossam M., Mustafa Esoofally, Abhishek Donekal, S M Sajjad Hossain Rafin, and Osama Mohammed. 2024. "Comparative Study-Based Data-Driven Models for Lithium-Ion Battery State-of-Charge Estimation" Batteries 10, no. 3: 89. https://doi.org/10.3390/batteries10030089
Note that from the first issue of 2016, this journal uses article numbers instead of page numbers. See further details here.