Article

Thermal Performance Analysis of a Prismatic Lithium-Ion Battery Module under Overheating Conditions

1
Hubei Research Center for New Energy & Intelligent Connected Vehicle, School of Automotive Engineering, Wuhan University of Technology, Wuhan 430070, China
2
Chongqing Research Institute, Wuhan University of Technology, Chongqing 401135, China
3
School of Mechanical and Automotive Engineering, Shanghai University of Engineering Science, Shanghai 201620, China
4
Hydrogen Research Institute, Université du Québec à Trois-Rivières, Trois-Rivières, QC G8Z 4M3, Canada
*
Authors to whom correspondence should be addressed.
Batteries 2024, 10(3), 86; https://doi.org/10.3390/batteries10030086
Submission received: 30 December 2023 / Revised: 11 February 2024 / Accepted: 27 February 2024 / Published: 2 March 2024
(This article belongs to the Section Battery Modelling, Simulation, Management and Application)

Abstract

:
Thermal runaway (TR) of lithium-ion batteries has always been a topic of concern, and the safety of batteries is closely related to the operating temperature. An overheated battery can significantly impact the surrounding batteries, increasing the risk of fire and explosion. To improve the safety of battery modules and prevent TR, we focus on the characteristics of temperature distribution and thermal spread of battery modules under overheating conditions. The heat transfer characteristics of battery modules under different battery thermal management systems (BTMSs) are assessed. In addition, the effects of abnormal heat generation rate, abnormal heat generation location, and ambient temperature on the temperature distribution and thermal spread of battery modules are also studied. The results indicate that the BTMS consisting of flat heat pipes (FHPs) and bottom and side liquid cooling plates can effectively suppress thermal spread and improve the safety of the battery module.

1. Introduction

Rechargeable lithium-ion batteries are the most suitable energy storage device for battery electric vehicles, whose lifespan, safety, and performance are sensitive to changes in temperature [1]. Low-temperature environments will lead to capacity decay [2,3,4], while high-temperature environments will lead to thermal safety issues such as thermal runaway [5,6,7]. Therefore, it is necessary to establish an efficient BTMS that controls the battery temperature within the proper operating temperature range. Moreover, the battery thermal management system reported in this paper is universal for both lithium-ion batteries and supercapacitors [8]. Thermal runaway of a certain battery may spread to adjacent batteries, causing serious thermal spread hazards and safety accidents to electric vehicles [9,10]. Therefore, studying the temperature characteristics and TR propagation of batteries is of great significance [11].
The cooling methods of the BTMS include air cooling, liquid cooling, heat pipe cooling, and phase change material cooling. Air cooling, as the most traditional and direct heat dissipation method, is characterized by simple structure and low cost. The aerothermal management system is mainly suitable for small electric vehicles like the Roewe Marvel X and BAIC New Energy EU5 [12]. Akinlabi [13] conducted detailed parameter research and analysis on BTMSs using air cooling and compared the characteristics of each air-cooling structure. The research showed that this cooling method cannot provide sufficient heat dissipation capacity for high-energy-density battery modules. Compared to air cooling, liquid cooling has specific heat capacity, thermal conductivity, and higher density, which can quickly remove surface heat from objects. Therefore, liquid-based BTMSs have been widely employed in the Tesla Model S, Chevrolet Volt, Audi Q7, BMW i3 and i8 [14]. They are also used in an all-electric Berlingo from Peugeot Citroën in France and the Ni/MH power system for hybrid electric vehicles made by Cobasys [15]. Wei et al. [16] established a prismatic battery electrothermal coupling model using liquid cooling and analyzed the key parameters, including the flow rate of the coolant, the number of batteries between adjacent liquid cooling plates, and the thickness of the liquid cooling plates. The results showed that increasing the thickness of the liquid-cooled plate and the liquid flow rate could enhance the cooling effect. A cooling structure with three curved contact surfaces and a longitudinal arrangement of liquid cooling pipes was proposed [17]. The results showed that the optimal structure can control the maximum temperature and temperature uniformity of the battery within the required range at high-discharge-rate conditions of 5C. Xin et al. [18] designed a hybrid BTMS consisting of composite phase change material and liquid cooling. The BTMS has good cooling performance even at a 5C discharge rate, effectively improving battery safety.
Heat pipes (HPs) have excellent thermal conductivity and have been widely used in the fields of electronic component cooling and spacecraft. Zhao et al. [19] developed a BTMS that combined heat pipe and wet cooling. The system consisted of four prismatic batteries sandwiched with three FHPs, which were in complete contact with the surface of the batteries. They found that the temperature variation range of the battery module was relatively small. A simplified heat transfer model [20,21,22,23] is employed to simplify the heat pipe into a 4 mm flat plate, with the length and height consistent with the battery at 148 mm and 92 mm, respectively. The thermal conductivity is equivalent to the actual HP and remains constant. The heat transfer mode is heat conduction, ignoring the complex internal mass transfer, heat transfer, momentum transfer and gas–liquid flow; the heat pipe material is set as copper [24].
FHP has the advantages of thinness, regular shape, light weight, a large contact area with the heat source, and slight impact on the energy density of the battery module, so it matches well with the liquid-cooled BTMS for a prismatic lithium-ion battery. Zeng et al. [25] proposed a novel hybrid battery thermal management system based on liquid cooling and a micro heat pipe array. The results show that the hybrid battery module can effectively reduce the battery temperature and temperature difference compared to the module without micro heat pipes. Xin et al. [26] proposed a BTMS for high-capacity prismatic lithium-ion batteries combining liquid cooling, FHP, and composite phase change material. The BTMS can effectively control the maximum temperature and temperature difference of the battery under a 2C discharge rate and 37 °C high-temperature environments. Ye et al. [27] found that the optimized BTMS is feasible and effective for the fast charging of a lithium-ion battery by cooling the battery module through HPs combined with liquid cooling. Wang et al. [28] designed a BTMS based on L-shaped HPs and liquid cooling and found that the BTMS can meet the cooling and heating needs of the battery in high- and low-temperature environments, respectively. From the above literature, combining FHP with liquid cooling is feasible for improving the temperature uniformity and reducing the maximum temperature of the battery module.
TR is the primary safety issue for lithium-ion batteries. The causes of TR of batteries can be divided into mechanical abuse, electrical abuse, and thermal abuse. Mechanical abuse is generally caused by mechanical deformation of a battery or battery pack by force. The specific performance is vehicle collision and the consequent crush and penetration of the battery pack [11]. Yamauchi [29] found that the degree of TR during the needling process is determined by the resistive heat generated by the large short-circuit current after the needle is inserted into the battery. Zavalis et al. [30] developed a 2D coupled electrochemical–thermal model to predict the temperature increase within the battery and explain the temperature increase mechanism. Electrical abuse is generally caused by overcharging and discharging or external short circuits [11]. Wang [31] studied the behavior of cathode and anode materials for ternary lithium-ion batteries under overcharge conditions. It is believed that the cathode material may be the main factor affecting the overcharging process of lithium-ion batteries. Maleki [32] found that after over-discharge, the battery is charged and discharged again, which may lead to internal short circuits and even TR. Thermal abuse is the most common factor in TR, and overheating is the most typical case of thermal abuse [5]. For large-capacity prismatic batteries, the research showed that the heating effect of TR batteries on adjacent batteries was the most critical factor leading to the spread of TR [33]. Feng et al. [34] investigated self-generated overheating caused by side reactions. From the beginning of self-generated heat at T1 (the self-generating heat temperature) to the beginning of TR at T2 (the triggering temperature of TR), the separator maintains its integrity at low temperatures without melting, and the solid electrolyte interface (SEI) begins to decompose, accompanied by a small amount of SEI regeneration. The exothermic reaction before TR is mainly due to the decomposition and regeneration of anode SEI. They found that SEI may begin to decompose above 70 °C. Jin et al. [35] further discovered that T1 = 99 °C and T2 = 132.7 °C for a nickel–cobalt–manganese prismatic lithium-ion battery, and the heat produced by the side reaction is negligible when the temperature is less than T1.
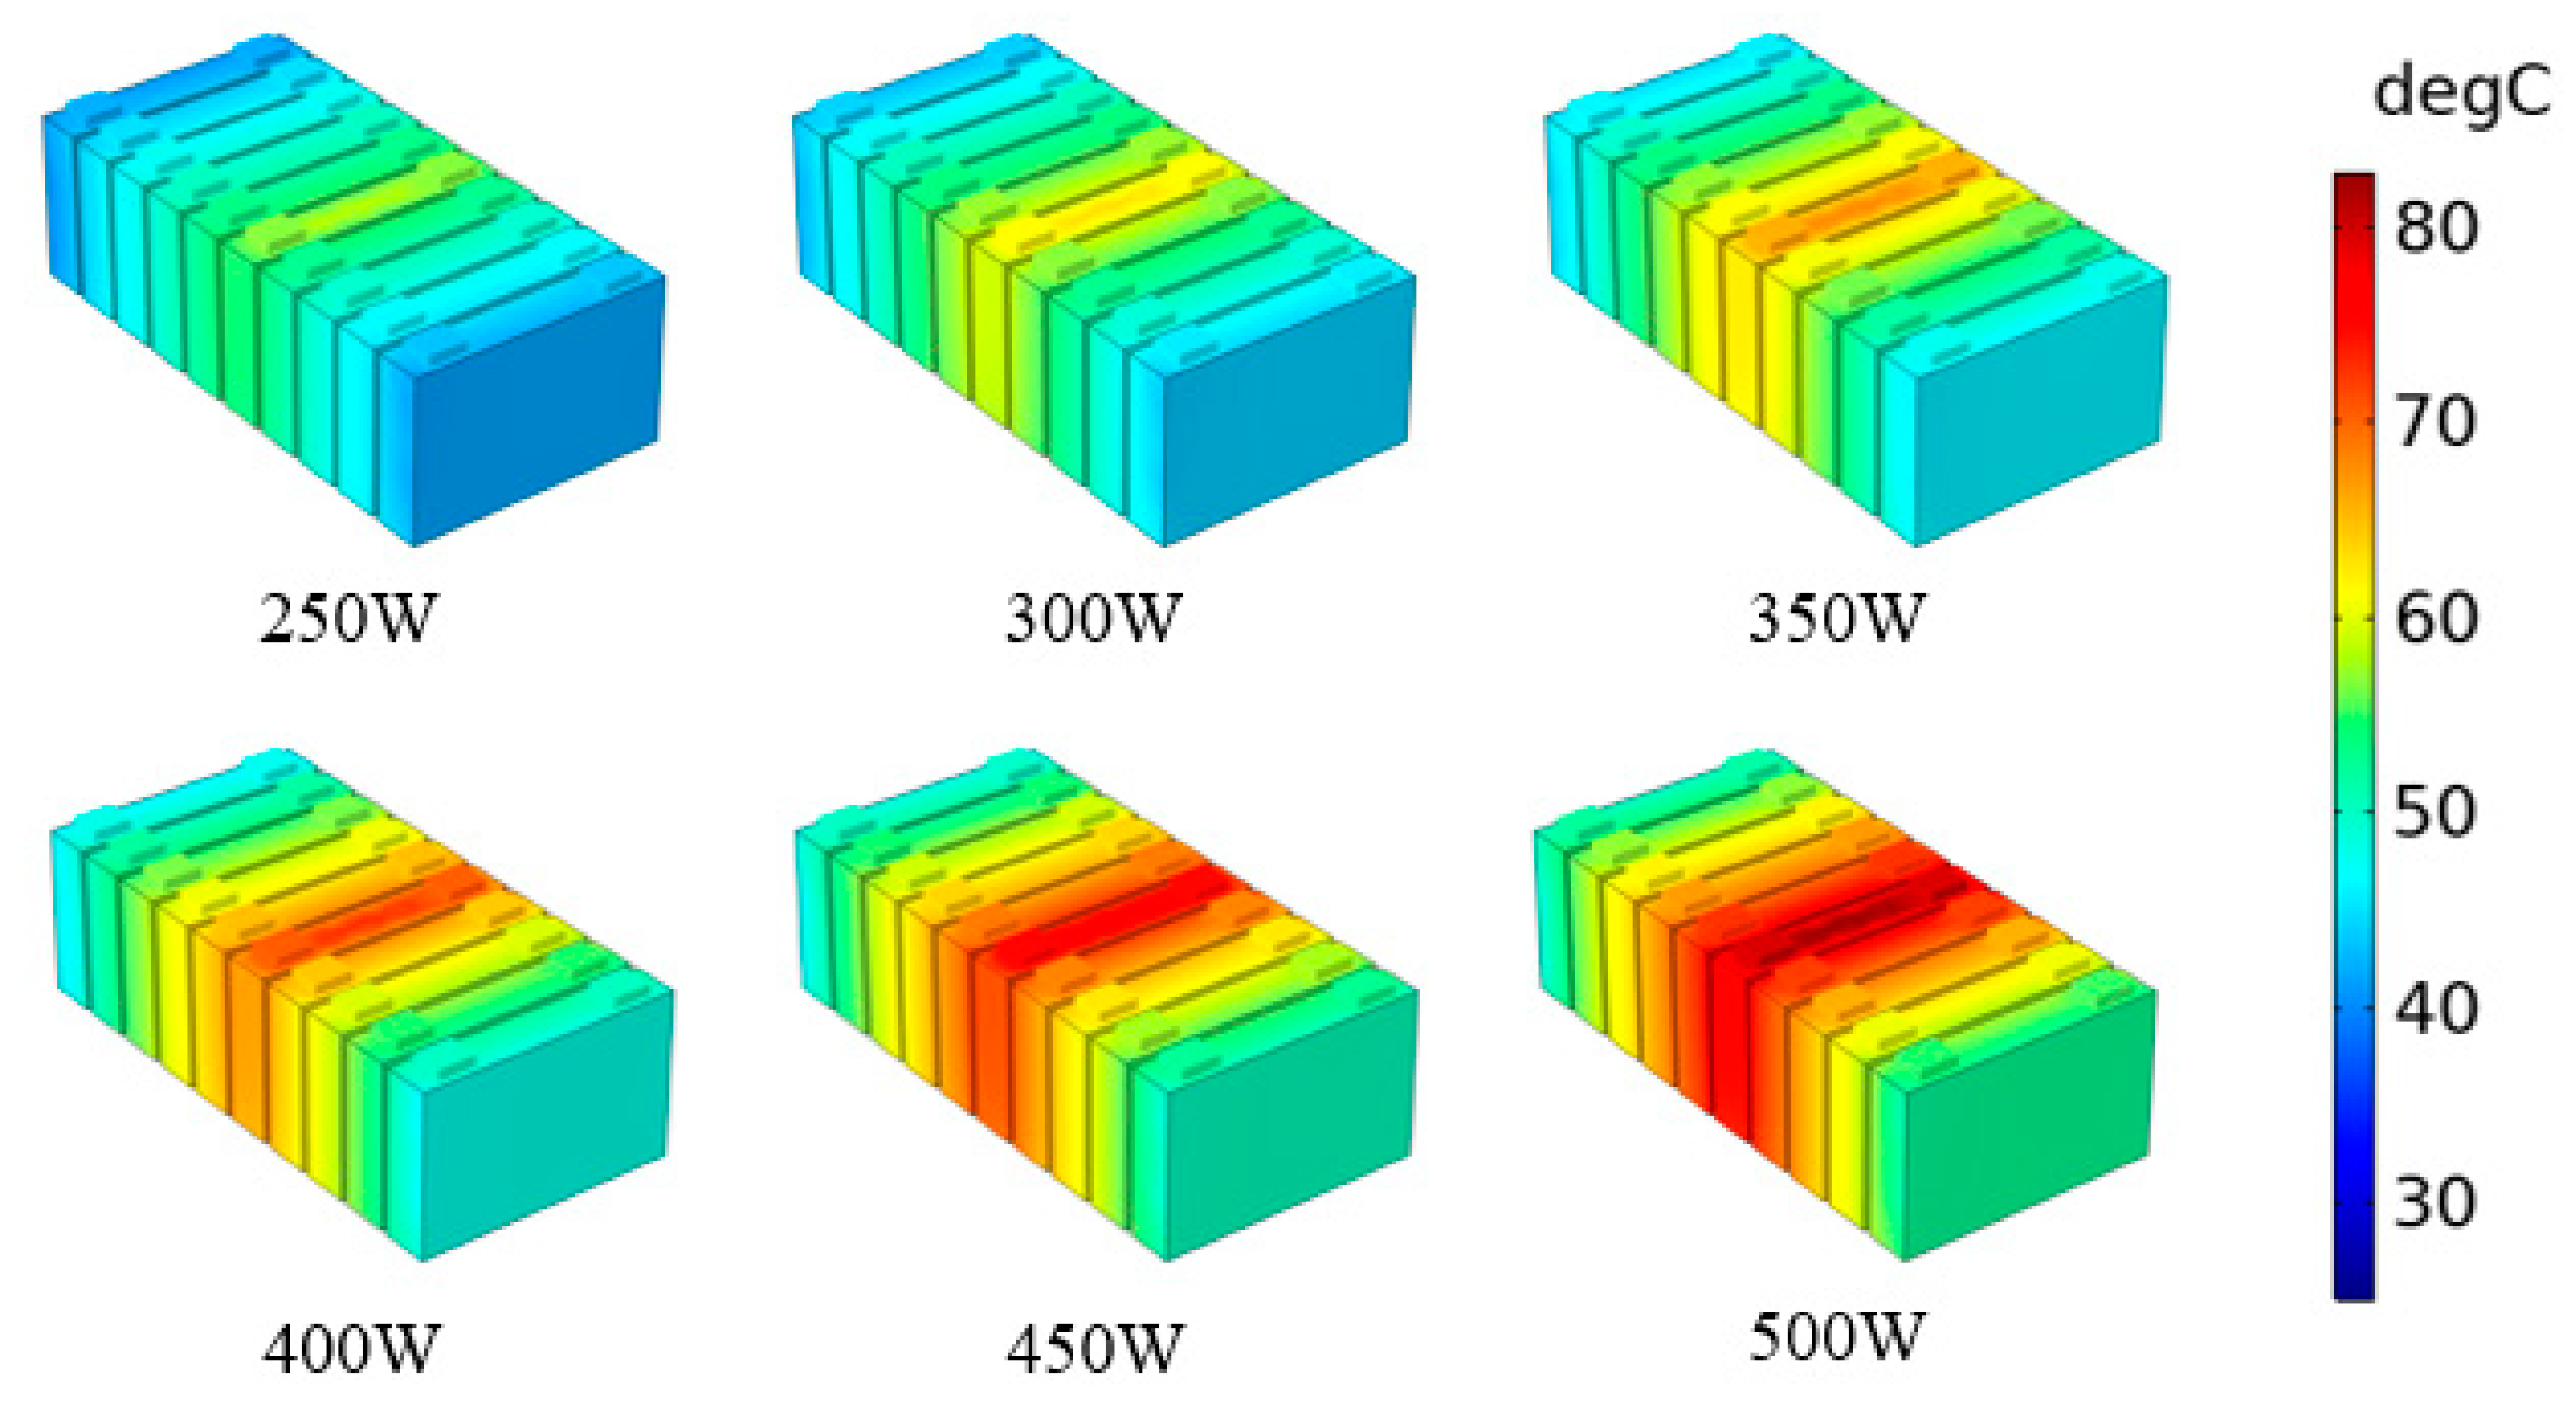
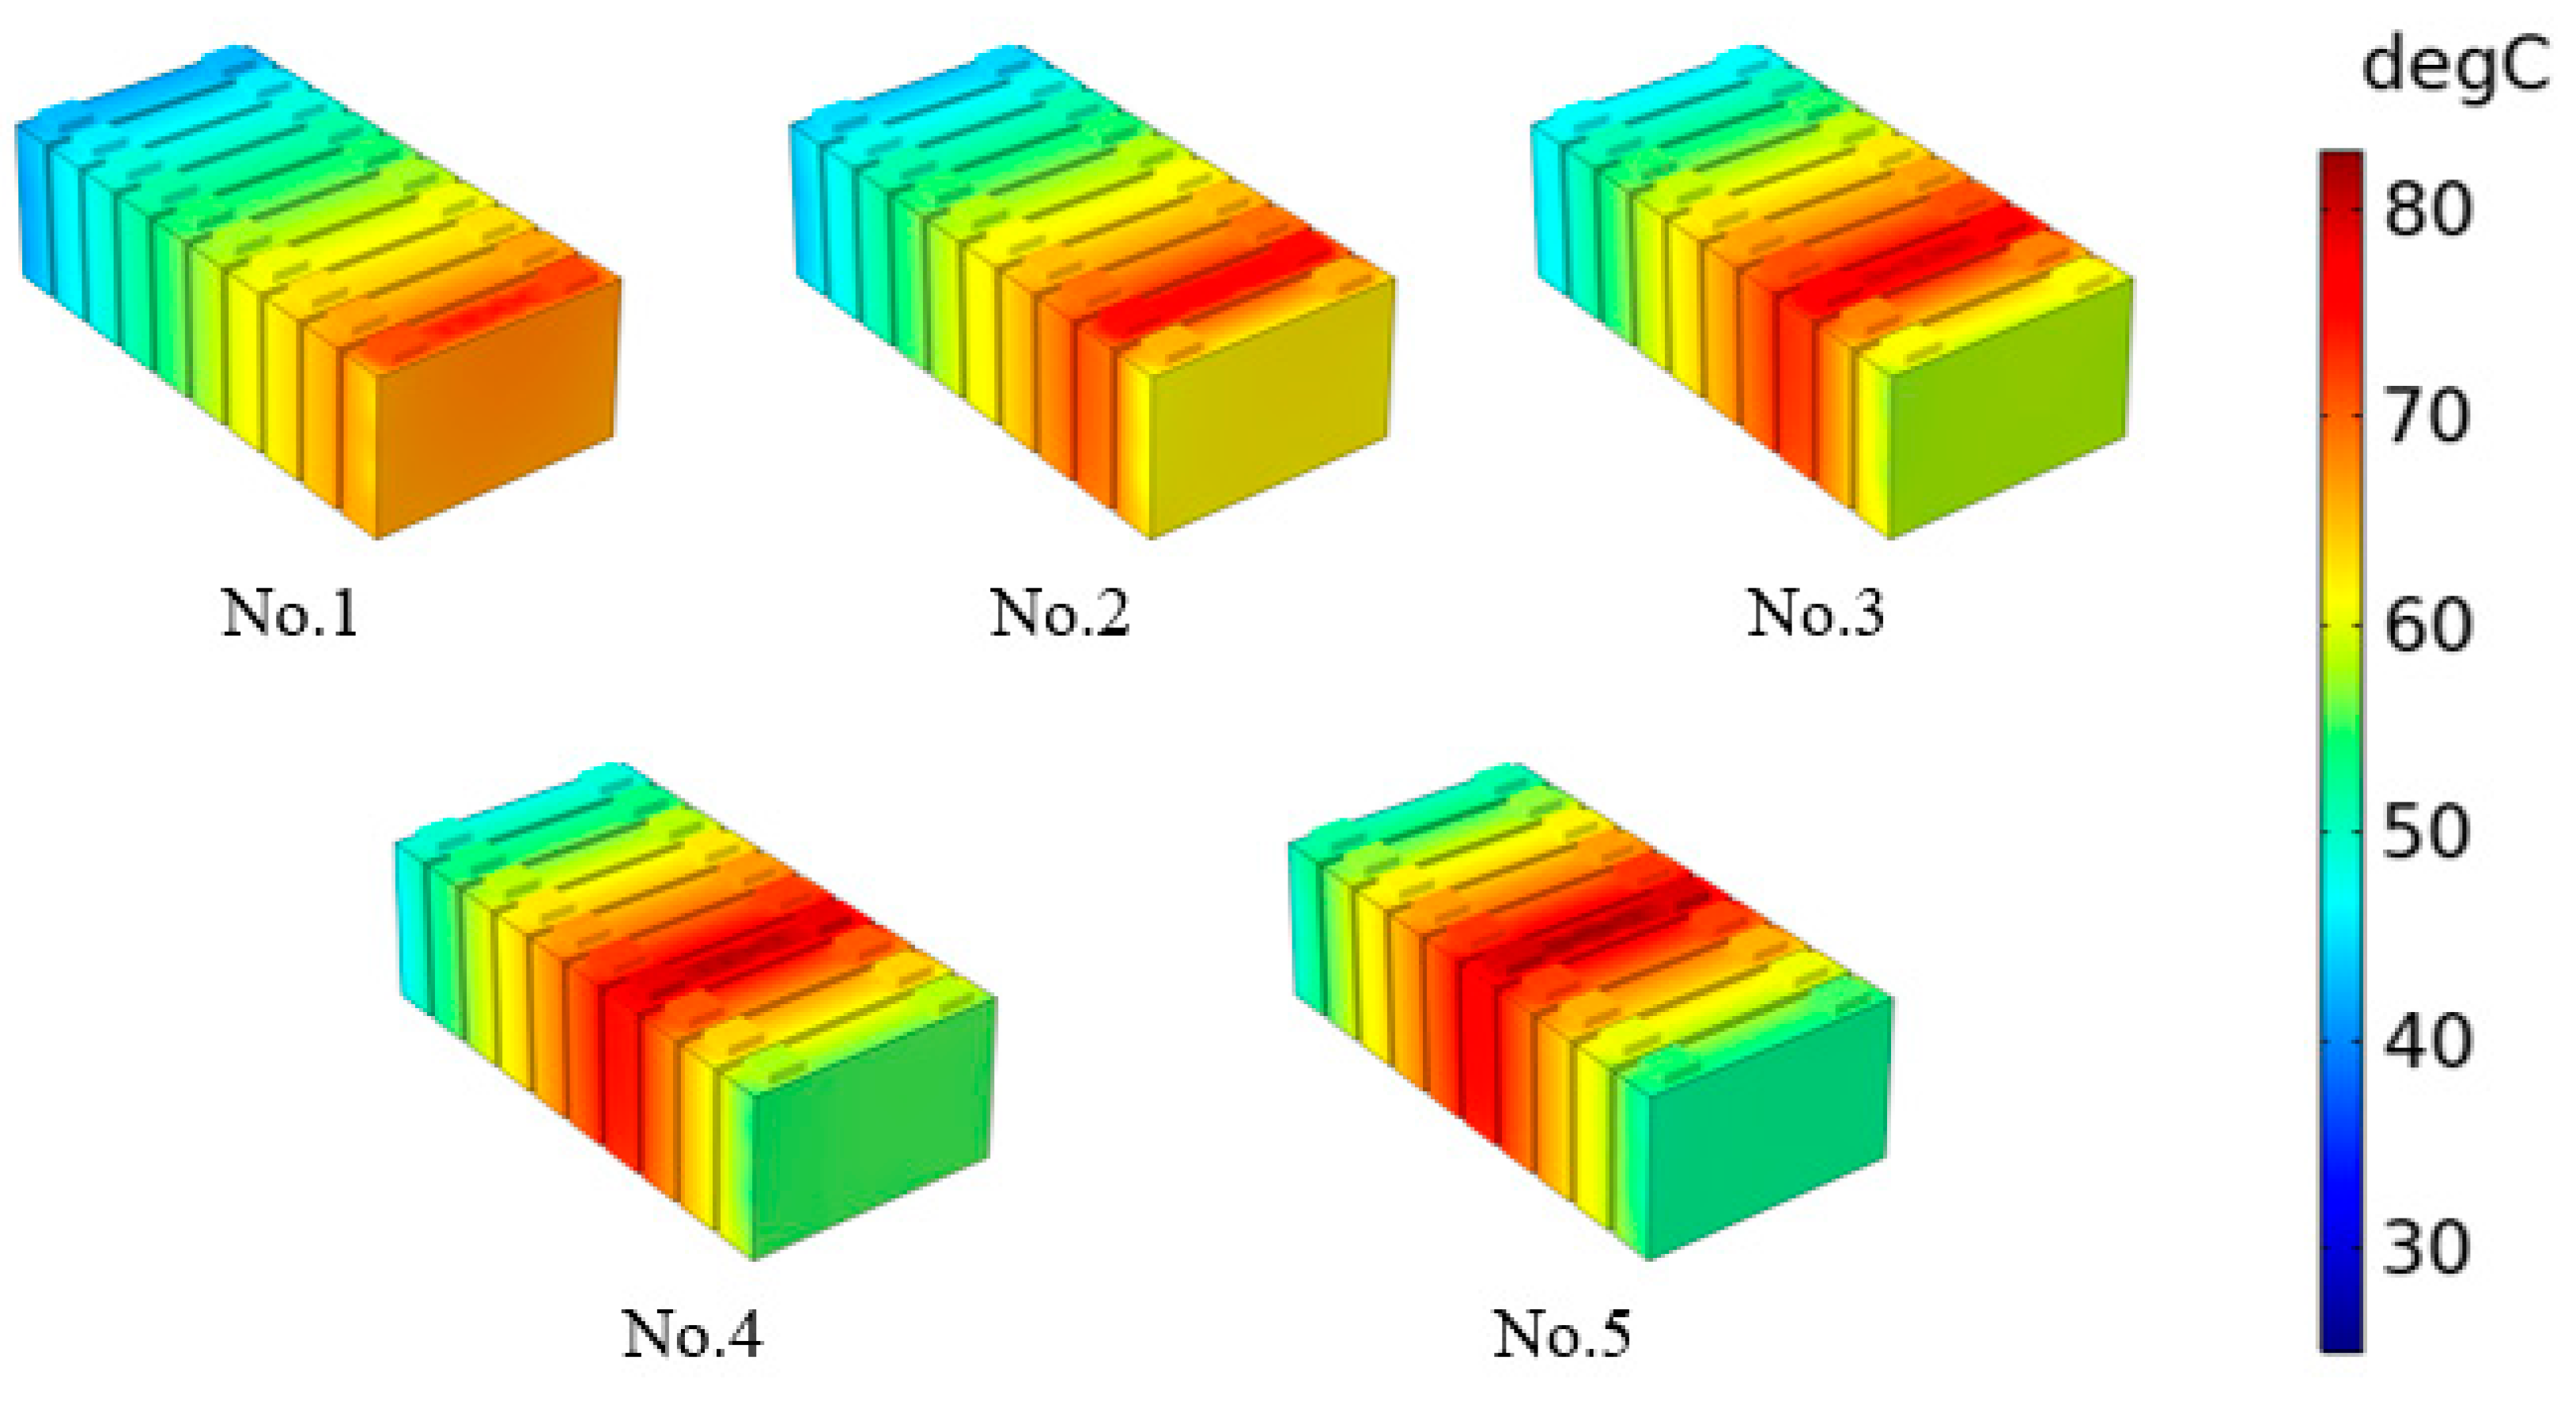
Abnormal heat generation in the battery can lead to TR, so it is necessary to analyze the thermal behavior of the battery during abnormal heat generation. The main purpose of this paper is to control the maximum temperature of the battery module at less than 70 °C and the maximum temperature difference of the battery at less than 5 °C. Currently, liquid BTMS is mainstream solution for BTMS for pure electric vehicles, while research into heat pipe technology is developing steadily, and the development of heat pipe technology presents good application prospects for the thermal management of power batteries. Therefore, by combining liquid cooling and heat pipes, five BTMSs are established to analyze the temperature distribution and thermal spread of battery modules under different conditions of abnormal heat generation. Firstly, the analysis models of the battery modules with different BTMSs were established using COMSOL Multiphysics software (version 5.4). Secondly, the impact of different design schemes of BTMS on the heat dissipation performance of the battery module is compared. Then, the influence of abnormal heat generation rate, abnormal heat generation location, and ambient temperature on the temperature distribution and thermal spread characteristics of the battery module is explored. Finally, the temperature and thermal spread characteristics of the battery module are compared using five BTMS schemes, and the optimal design scheme of BTMS is obtained.

2. Numerical Model

2.1. Geometric Models

The main cooling methods currently used in prismatic lithium-ion batteries are liquid cooling and FHPs. Liquid cooling can effectively control the maximum temperature of the battery module, while FHPs can effectively reduce the temperature difference of the battery due to its temperature uniformity. To ensure the safe operation of the battery module and to combine the advantages of liquid cooling and FHP, five schemes of BTMSs are proposed using a combination of liquid cooling and FHPs to study the thermal performance of the battery module. Scheme 1 is only FHPs cooling; Scheme 2 is a combination of the FHPs and a bottom liquid cooling plate; Scheme 3 is a combination of the FHPs and side liquid cooling plates; Scheme 4 is a combination of the bottom and side liquid cooling plates; Scheme 5 is a combination of the FHPs and bottom and side liquid cooling plates, as shown in Figure 1a–e, respectively.
The battery used in this paper is a nickel–cobalt–manganese prismatic lithium-ion battery whose width, depth, and height are 148 mm, 27 mm and 92 mm, respectively. There are 10 prismatic batteries connected in series, and 11 FHPs with a width of 4 mm are used to separate the batteries in Scheme 1. A liquid cooling plate with a width, depth and height of 148 mm, 314 mm, and 16 mm is arranged at the bottom of the battery module, and four parallel flow paths with a radius of 3 mm are arranged in the cooling plates in Scheme 2 based on Scheme 1. In Scheme 3, liquid cooling plates with a width, depth and height of 16 mm, 314 mm, and 92 mm are arranged on both sides of the battery module based on Scheme 1, and eight parallel flow paths with a radius of 3 mm are arranged in the liquid cooling plate. Scheme 5 combines Schemes 2 and 3 to arrange the liquid cooling plates at the bottom and side of the battery module. While Scheme 4 removes the FHPs based on Scheme 5. There are 12 parallel flow paths arranged in the liquid cooling plates. Coolants flow in adjacent paths in opposite direction. Water is chosen as the coolant. The cooling methods of the five schemes are shown in Table 1. In addition, the material properties of each component are shown in Table 2 [26].

2.2. Governing Equations

Before establishing the model, the following assumptions are made for lithium-ion batteries:
  • The inside material of the battery is uniform.
  • The specific heat capacity and thermal conductivity of the battery are constant.
  • The simulation environment is conducted under adiabatic conditions.
The energy conservation equations involved in the solid heat transfer of the BTMS involving batteries, liquid cooling plates (AL plates), and FHPs are as follows:
ρ b C p , b T t = · k b T b + Q V O L
ρ A L C p , A L T A L t = · k A L T A L
ρ F H P C p , F H P T F H P t = · k F H P T F H P
where ρ b , ρ A L , and ρ F H P represent the density of the lithium battery, liquid cooling plates, and FHPs, respectively; C p , b , C p , A L and C p , F H P represent the specific heat capacity of the lithium battery, liquid cooling plates, and FHPs at constant pressure, respectively; k b , k A L and k F H P represent the thermal conductivity of the lithium battery, liquid cooling plates, and FHPs, respectively; and Q V O L represents the heat generation rate of the battery. In this paper, the average heat generation rates of the battery were calculated using experimental data measured by calibrated calorimetry and served as a heat source for the battery.
The flow and heat transfer process of the fluid in the cooling pipe are assumed as follows:
  • The fluid flow is assumed to be steady, incompressible, and laminar.
  • The coolant fluid is Newton fluid with constant thermal properties.
  • The influence of gravity, thermal radiation, and other factors is not considered; the effect of entry is not considered.
The governing equations related to liquid cooling, namely mass conservation, momentum conservation, and energy conservation, are shown as follows:
ρ c t + · ρ b u = 0
ρ c u t + ρ c u · u = p + μ u + u T
ρ c C p , c T t + · ρ c C p , b u T = · λ c T
where ρ c , C p , c , and λ c represent the density, specific heat capacity, and thermal conductivity of coolant; u , p and μ represent the vector velocity, static pressure, and dynamic viscosity of coolant. The cooling medium of the liquid cooling is water, which has incompressibility.

2.3. Boundary and Initial Conditions

COMSOL Multiphysics software is used to set the boundary and interface conditions of battery modules. The boundary conditions of battery and FHP; battery and liquid cooling plate; FHP and liquid cooling plate; and liquid cooling plate and liquid-cooled pipe are set as follows:
k b T b n b = k F H P T F H P n F H P
k b T b n b = k A L T A L n A L
k F H P T F H P n F H P = k A L T A L n A L
k A L T A L n A L = h c ( T A L T c )
where k b , k F H P , and k A L indicate the thermal conductivity of the battery, the thermal conductivity of the FHP, and the thermal conductivity of the liquid cooling plate, respectively. h c is the convective heat transfer coefficient between the coolant and liquid cooling plate. T b , T F H P , T A L , and T c are the temperatures of the battery, FHP, liquid cooling plate, and coolant, respectively. T n is the temperature gradient of each material along the normal direction of the outer surface.
Additionally, the initial condition is set to T = T 0 , v = v 0 , where T 0 is the ambient temperature, and v 0 is set as the inlet speed of 0.1 m/s. The inlet temperature of the coolant is consistent with the ambient temperature. The inlet boundary of the cooling pipe is set as velocity, and the outlet boundary condition is set as pressure.

2.4. Model Validation

In this section, a single battery model was used for model validation. COMSOL Multiphysics software is employed for simulation, model validation, and grid independence analysis. The geometric model and mesh of the single nickel–cobalt–manganese prismatic lithium-ion battery are shown in Figure 2. The geometric parameters of the battery are shown in Table 3. We measured the heat generation rate for a prismatic single battery [36]. The dynamic heat generation rates of the battery were obtained using the calibrated calorimetry method according to the curve of the battery temperature change for the heat generation test during heat loss calibration. At ambient temperatures of 25 °C and 40 °C, the average heat generation rates of the battery at 2C discharge rate were 42,352 W/m3 and 33,430 W/m3, respectively, which were calculated using experimental data of dynamic heat generation rates. The rising temperature trend of the battery obtained by the simulation was compared with the corresponding experimental results. Figure 3a shows the single battery model validation under a discharge rate of 2C and an ambient temperature of 25 °C and 40 °C. The simulation results are consistent with the experimental results [36].
COMSOL Multiphysics software is used to mesh the battery module, as shown in Figure 1f. The grid independence analysis is carried out on several grids, including 139,003, 298,225, 1,201,223, 1,329,822 and 2,313,930. As can be seen from Figure 3b, the maximum temperature gradually increases with the increase in the number of grids, and the trend in the maximum temperature is relatively stable after the number of grids reaches 1,329,822, with little temperature change. Therefore, a grid number of 1,329,822 is selected for the subsequent simulations of Scheme 5.

3. Result and Discussion

3.1. Comparison of Thermal Performance of BTMSs

In this section, a study on the thermal performance of different BTMSs under a 25 °C ambient temperature, a 2C discharge rate and normal battery heat generation is carried out. Figure 4a,b shows the maximum temperature and the maximum temperature difference of the battery module in five schemes. The maximum temperature difference of the battery is obtained by comparing the maximum temperature difference of each battery. Figure 4c shows the maximum temperature and the maximum temperature difference of the battery module in five schemes at the end of discharge (1800s). It is found that Scheme 5, in combining the FHPs with bottom and side liquid cooling, has the best heat dissipation performance, showing the lowest maximum temperature and the second lowest maximum temperature difference. The main reason is that the heat generated by the battery is timely transferred to the coolant through the heat pipe, which has strong thermal conductivity, and is then quickly transferred to the external environment. Therefore, Scheme 5 is adopted to study the effects of abnormal heat generation rate, abnormal heat generation location, and ambient temperature on the temperature distribution and thermal spread of the battery module when a certain battery is under conditions of abnormal heat generation.

3.2. Effect of Abnormal Heat Generation Rate

The solid electrolyte interface (SEI) may begin to decompose at temperatures exceeding 70 °C [35], leading to a decrease in battery performance. Therefore, this article takes 70 °C as the critical temperature for the battery to operate normally. Reference [35] conducted extensive TR tests for prismatic batteries and obtained characteristic temperatures of T1, the self-generating heat temperature, and T2, the triggering temperature of TR. For the temperature rising from T1 to T2, the self-generating heat power before TR ranges from about 16 W to 800 W for the present prismatic battery. The abnormal heat generation rate (250 W, 300 W, 350 W, 400 W, 450 W, 500 W) in between is thus taken to examine the effectiveness of the present thermal design. In general, the middle battery in a BTMS has the worst heat dissipation, so the No. 5 battery is set as an abnormal heat generation battery for the following analysis. The serial number of batteries in the battery module is shown in Figure 5.
Figure 6a,b shows the maximum temperature and the maximum temperature difference of the battery module with different abnormal heat generation rates during the 2C discharge process. The maximum temperature of the battery shows a gradual upward trend, while the maximum temperature difference tends to flatten out after 300 s. Figure 6c shows the effect of abnormal heat generation rate on the maximum temperature and the maximum temperature difference of the battery at the end of discharge. The maximum temperature and the maximum temperature difference of the battery increase with the abnormal heat generation rate increase. When the abnormal heat generation rate is no more than 350 W, the maximum temperature of the battery module does not exceed 70 °C, at which point the decomposition of SEI is unlikely to occur. When the abnormal heat generation rate is 500 W, the maximum temperature and the maximum temperature difference of the battery are 82.8 °C and 9.3 °C, respectively.
At the end of discharge, the temperature distribution of the battery module with different abnormal heat generation rates and 25 °C ambient temperature is shown in Figure 7. It can be seen that as the abnormal heat generation rate increases, the range of thermal spread expands, and the influence on the maximum temperature of other normal batteries increases. When the abnormal heat generation rate is 500 W, the highest temperature of three batteries exceeds 70 °C.

3.3. Effect of Abnormal Heat Generation Location

To study the impact of abnormal heat generation location on the heat transfer characteristics and thermal safety of the battery module, considering the symmetry of the model and boundary conditions, we analyze the temperature distribution and thermal spread of the battery module when abnormal heat generation occurs in battery No. 1, No. 2, No. 3, No. 4, and No. 5, respectively.
Figure 8 shows the maximum temperature of the battery module with different abnormal heat generation locations and abnormal heat generation rates at the end of discharge when the ambient temperature is 25 °C. The abnormal heat generation location affects the maximum temperature of the battery module. At the same abnormal heat generation rate, the closer the abnormal heat generation location is to the middle of the battery module, the higher the maximum temperature of the battery module. The battery in the middle position of the module can easily accumulate a large amount of heat, resulting in the highest temperature. When the abnormal heat generation rate is 500 W, the maximum temperatures of the module during abnormal heat generation in the No. 1 battery and No. 5 battery are 74.9 °C and 82.8 °C, respectively.
Figure 9 shows the effect of abnormal heat generation location on the temperature distribution of the battery module. One can observe the number of batteries with a maximum temperature exceeding 70 °C at an abnormal heat generation rate of 500 W and different abnormal heat generation locations. When abnormal heat generation occurs in the battery No. 1, the maximum temperature of only one battery exceeds 70 °C. When abnormal heat generation occurs at other locations, there are three batteries with a maximum temperature exceeding 70 °C. The number of batteries with a maximum temperature exceeding 70 °C with different abnormal heat generation locations and with abnormal heat generation rates is summarized in Table 4.
Table 4 shows the number of batteries with a maximum temperature exceeding 70 °C with different abnormal heat generation locations and abnormal heat generation rates when the ambient temperature is 25 °C. When abnormal heat generation is in the center of the battery module and the heat generation rate is high, more batteries are affected by thermal spread, and more batteries have a maximum temperature exceeding 70 °C in the battery module.
Figure 10 shows the maximum temperature difference of the battery with different abnormal heat generation locations and abnormal heat generation rates at the end of discharge when the ambient temperature is 25 °C. It can be seen that when the abnormal heat generation battery is No. 3, No. 4, or No. 5, compared to the situation where the abnormal heat generation battery is No. 1 or No. 2, the difference in maximum temperature difference is small. Because the battery with a maximum temperature difference when abnormal heat generation occurs in the No. 2 battery is not the No. 2 battery, and the battery with a maximum temperature difference when abnormal heat generation occurs in other batteries is the abnormal heat generation battery itself, the temperature difference curve of the No. 2 battery in the figure is different from in other situations. It is worth noting that when the abnormal heat generation battery is No. 1 or No. 2, the maximum temperature difference of the battery is significantly higher than in other situations.
Generally, the performance and lifespan of the battery will be affected if the temperature difference inside the battery exceeds 5 °C. Table 5 shows the number of batteries with a maximum temperature difference exceeding 5 °C with different abnormal heat generation locations and abnormal heat generation rates when the ambient temperature is 25 °C.
As shown in Table 5, when the abnormal heat generation location is closer to the center of the battery module and the abnormal heat generation rate is greater, the number of batteries with a maximum temperature difference exceeding 5 °C will increase. When abnormal heat generation occurs in batteries No. 1 and No. 2, the number of batteries with a maximum temperature difference exceeding 5 °C remains basically unchanged, and the abnormal heat generation rate has little effect on it. At higher power levels (450 W or 500 W), when abnormal heat generation occurs in battery No. 5, the number of batteries with a maximum temperature difference exceeding 5 °C is the highest.

3.4. Effect of Ambient Temperature

Based on studying the influence of abnormal heat generation location, the influence of ambient temperature on the temperature distribution and thermal spread of battery modules is also explored. Figure 11 shows the maximum temperature of the battery considering the influence of abnormal heat generation rate and abnormal heat generation location at the end of discharge when the ambient temperature is 40 °C.
Figure 11 shows that when abnormal heat generation occurs in batteries No. 3, No. 4, and No. 5, the maximum temperature of the battery has already exceeded 70 °C at a heat generation rate of 250 W. When abnormal heat generation occurs in battery No. 5, the maximum temperature of the module is 96.1 °C at an abnormal heat generation rate of 500 W, which does not reach T1 (99 °C). The temperature distribution of the battery module with different abnormal heat generation locations with a 500 W abnormal heat generation rate is shown in Figure 12.
Obviously, in high-temperature environments, batteries with abnormal heat generation have a significant impact on battery modules. The number of batteries with a maximum temperature exceeding 70 °C in each case is summarized in Table 6.
It can be seen from Table 6 that at an ambient temperature of 40 °C, the number of batteries with a maximum temperature exceeding 70 °C is significantly higher than that at an ambient temperature of 25 °C. When abnormal heat generation occurs in batteries No. 4 and No. 5, and the abnormal heat generation rate is 250 W, the maximum temperature of some batteries exceeds 70 °C. When the abnormal heat generation rate is 500 W, if there is abnormal heat generation in the battery, half of the batteries will have a maximum temperature exceeding 70 °C.
Figure 13 shows the maximum temperature difference of the battery with different abnormal heat generation locations and abnormal heat generation rates at the end of discharge when the ambient temperature is 40 °C. It is observed that at high ambient temperatures, the maximum temperature difference of the battery is also the highest when abnormal heat generation occurs in battery No. 1. When abnormal heat generation occurs in batteries No. 3, No. 4, and No. 5, the difference in the maximum temperature difference of the battery between the three conditions is very small.
Table 7 shows the number of batteries with a maximum temperature difference exceeding 5 °C with different abnormal heat generation locations and abnormal heat generation rates. It can be found that at 40 °C, the number of batteries with a maximum temperature difference exceeding 5 °C is roughly the same as at 25 °C. It can be inferred from this that high ambient temperatures are unlikely to affect the number of batteries with the maximum temperature difference.

3.5. The Thermal Spread Characteristics of Different Schemes

At an ambient temperature of 40 °C, battery No. 5 exhibits the maximum temperature under conditions of abnormal heat generation, and the number of batteries with a maximum temperature exceeding 70 °C is also the highest. Therefore, we focus on the temperature and thermal spread characteristics of the battery module using five BTMS schemes when abnormal heat generation occurs in battery No. 5.
Figure 14 shows the maximum temperature of the battery module among the five BTMS schemes at different abnormal heat generation rates at the end of discharge. Figure 15 shows the maximum temperature difference of the battery among the five BTMS schemes at different abnormal heat generation rates at the end of discharge. Table 8 shows the number of batteries with a maximum temperature exceeding 70 °C among the five BTMS schemes at different abnormal heat generation rates when battery No. 5 is in a condition of abnormal heat generation. Table 9 shows the number of batteries with a maximum temperature difference exceeding 5 °C among the five BTMS schemes under the same conditions. These data help evaluate the effectiveness of each BTMS in preventing battery overheating and controlling temperature differences.
It can be seen by comparing the data from different figures that when considering the number of batteries with a maximum temperature exceeding 70 °C, Schemes 1 and 2 have 9 or 10 batteries with a maximum temperature exceeding 70 °C at each power. In Scheme 5, when the abnormal heat generation rate is 500 W, there is only one battery with a maximum temperature of no more than 70 °C. Therefore, Schemes 1 and 2 are inferior to Scheme 5. When considering the number of batteries with a maximum temperature difference exceeding 5 °C, Scheme 3 only has one battery with a maximum temperature difference exceeding 5 °C when the abnormal heat generation rate is 250 W. Under other conditions, the number of batteries exceeds half, and even the maximum temperature difference of 10 batteries exceeds 5 °C when the abnormal heat generation rate is above 350 W. Scheme 4 has a maximum temperature difference of over 5 °C for ten batteries at each abnormal heat generation rate. Scheme 5 effectively reduces the number of batteries with a maximum temperature difference of more than 5 °C. Therefore, Schemes 3 and 4 are inferior to Scheme 5. Even in the case of an abnormal heat generation rate of 350 W, Scheme 5 can still maintain the maximum temperature of half of the batteries, which does not exceed 70 °C. It can be seen from Figure 14 that the maximum temperature of the battery module with Scheme 5 was controlled at 96.1 °C and did not exceed the self-generating heat temperature of T1 (99 °C), in which case the heat produced by the side reaction is negligible [36]. The maximum temperature of the battery module with Schemes 1–4 mostly exceeded T1 or even T2 (132.7 °C), in which case the battery has a relatively violent side reaction, resulting in the simulated maximum temperature of the battery module being less than the actual value. This reinforces the advantages of Scheme 5 in controlling the maximum temperature of the battery. Scheme 5, which is the focus of this paper, can effectively suppress the thermal spread from the abnormal battery to the normal batteries and prevent the occurrence of TR.

4. Conclusions

The thermal performance of five thermal management schemes is compared in this paper. Then, an optimal thermal management scheme is selected for thermal performance analysis under conditions of overheating. The results are as follows:
  • Scheme 5, combining the FHPs with bottom and side liquid cooling plates, has good heat dissipation performance. At a 25 °C ambient temperature with a 2C discharge rate and battery normal heat generation, the lowest maximum temperature of 35.1 °C and the second lowest maximum temperature difference of 1.5 °C were obtained.
  • As the heat generation rate increases, the range of thermal spread expands, and the influence on the maximum temperature of other normal batteries increases, resulting in the maximum temperature of the surrounding batteries exceeding the critical temperature, which reduces the safety of the battery.
  • The closer the abnormal heat generation location is to the center of the module, the greater the maximum temperature of the battery module, and the more batteries will be affected.
  • The effect of different abnormal heat generation locations and abnormal heat generation rates on the maximum temperature difference at high ambient temperatures is about the same as that at low ambient temperatures. However, due to the increase in ambient temperature, the number of batteries with a maximum temperature exceeding 70 °C increases, thereby reducing the safety and stability of the batteries and making accidents more likely to occur.
  • Scheme 5, combining the FHPs with bottom and side liquid cooling plates, can effectively suppress thermal spread from the abnormal battery to the normal batteries and prevent the occurrence of thermal runaway.

Author Contributions

Conceptualization, J.X. and T.Y.; methodology, Q.X. and H.Z.; software, T.Y. and Q.X.; validation, Q.X.; formal analysis, T.Y. and J.L.; investigation, J.L.; resources, J.X. and J.Z.; data curation, J.L. and C.D.; writing—original draft preparation, T.Y. and J.L.; writing review and editing, J.X., Q.X. and H.Z.; visualization, K.A.; supervision, C.D.; project administration, J.Z. and K.A.; funding acquisition, J.X. and H.Z. All authors have read and agreed to the published version of the manuscript.

Funding

This research was funded by the Research Project of Wuhan University of Technology Chongqing Research Institute (YF 2021-08), the National Natural Science Foundation of China (51876113), the 111 Project of China (B17034), and the Innovative Research Team Development Program of the Ministry of Education of China (IRT_17R83).

Data Availability Statement

The original contributions presented in the study are included in the article, further inquiries can be directed to the corresponding authors.

Conflicts of Interest

The authors declare no conflicts of interest.

References

  1. Liu, K.; Liu, Y.; Lin, D.; Pei, A.; Cui, Y. Materials for lithium-ion battery safety. Sci. Adv. 2018, 4, eaas9820. [Google Scholar] [CrossRef]
  2. Peng, X.; Chen, S.; Garg, A.; Bao, N.; Panda, B. A review of the estimation and heating methods for lithium-ion batteries packed in the cold environment. Energy Sci. Eng. 2019, 7, 645–662. [Google Scholar] [CrossRef]
  3. Han, X.; Lu, L.; Zheng, Y.; Feng, X.; Li, Z.; Li, J.; Ouyang, M. A review on the key issues of the lithium ion battery degradation among the whole life cycle. eTransportation 2019, 1, 100005. [Google Scholar] [CrossRef]
  4. Ren, D.; Hsu, H.; Li, R.; Feng, X.; Guo, D.; Han, X.; Lu, L.; He, X.; Gao, S.; Hou, J.; et al. A comparative investigation of aging effects on thermal runaway behavior of lithium-ion batterie. eTransportation 2019, 2, 100034. [Google Scholar] [CrossRef]
  5. Jin, C.; Sun, Y.; Wang, H.; Lai, X.; Wang, S.; Chen, S.; Rui, X.; Zheng, Y.; Feng, X.; Wang, H.; et al. Model and experiments to investigate thermal runaway characterization of lithium-ion batteries induced by external heating method. Power Sources 2021, 504, 230065. [Google Scholar] [CrossRef]
  6. Wang, H.; Wang, S.; Feng, X.; Zhang, X.; Dai, K.; Sheng, J.; Zhao, Z.; Du, Z.; Zhang, Z.; Shen, K.; et al. An experimental study on the thermal characteristics of the Cell-To-Pack system. Energy 2021, 22, 120338. [Google Scholar] [CrossRef]
  7. Zhang, Y.; Wang, H.; Li, W.; Li, C. Quantitative identification of emissions from abused prismatic Ni-rich lithium-ion batteries. eTransportation 2019, 2, 100031. [Google Scholar] [CrossRef]
  8. Zhao, W.; Liu, Z.; Chen, W.; Sun, X.; Luo, M.; Zhang, X.; Li, C.; An, Y.; Song, S.; Wang, K.; et al. A Review on Thermal Behaviors and Thermal Management Systems for Supercapacitors. Batteries 2023, 9, 128. [Google Scholar] [CrossRef]
  9. Li, Q.; Yang, C.; Santhanagopalan, S.; Smith, K.; Lamb, J.; Steele, L.; Torres-Castro, L. Numerical investigation of thermal runaway mitigation through a passive thermal management system. J. Power Sources 2019, 429, 80–88. [Google Scholar] [CrossRef]
  10. Zhang, H.; Zhang, J. An overview of modification strategies to improve LiNi0.8Co0.1Mn0.1O2 (NCM811) cathode performance for automotive lithium-ion batteries. eTransportation 2021, 7, 100105. [Google Scholar] [CrossRef]
  11. Feng, X.; Ouyang, M.; Liu, X.; Lu, L.; Xia, Y.; He, X. Thermal runaway mechanism of lithium ion battery for electric vehicles: A review. Energy Storage Mater. 2018, 10, 246–267. [Google Scholar] [CrossRef]
  12. Cao, J. Performance Investigation on Liquid Cooling and Phase Change Material Coupled Battery Thermal Management System. Ph.D. Thesis, South China University of Technology, Guangzhou, China, 2022. [Google Scholar]
  13. Akinlabi, A.; Solyali, D. Configuration, design, and optimization of air-cooled battery thermal management system for electric vehicles: A review. Renew. Sustain. Energy Rev. 2020, 125, 109815. [Google Scholar] [CrossRef]
  14. Shen, Z.; Chen, S.; Liu, X.; Chen, B. A review on thermal management performance enhancement of phase change materials for vehicle lithium-ion batteries. Renew. Sust. Energ. Rev. 2021, 148, 111301. [Google Scholar] [CrossRef]
  15. Zhang, J. Study and Optimization of Heat Dissipation Characteristics of Square Power Lithium Battery. Master’s Thesis, Hunan University, Hunan, China, 2017. [Google Scholar]
  16. Tong, W.; Somasundaram, K.; Birgersson, E.; Mujumdar, A.S.; Yap, C. Numerical investigation of water cooling for a lithium-ion bipolar battery pack. Int. J. Therm. Sci. 2015, 94, 259–269. [Google Scholar] [CrossRef]
  17. Lai, Y.; Wu, W.; Chen, K.; Wang, S.; Xin, C. A compact and lightweight liquid-cooled thermal management solution for cylindrical lithium-ion power battery pack. Int. J. Heat Mass Transfer 2019, 144, 118581. [Google Scholar] [CrossRef]
  18. Xin, Q.; Xiao, J.; Yang, T.; Zhang, H.; Long, X. Thermal management of lithium-ion batteries under high ambient temperature and rapid discharging using composite PCM and liquid cooling. Appl. Therm. Eng 2022, 210, 118230. [Google Scholar] [CrossRef]
  19. Zhao, R.; Gu, J.; Liu, J. An experimental study of heat pipe thermal management system with wet cooling method for lithium ion batteries. J. Power Sources 2015, 273, 1089–1097. [Google Scholar] [CrossRef]
  20. Yuan, Q.; Xu, X.; Tong, G.; Ding, H. Effect of coupling phase change materials and heat pipe on performance enhancement of Li-ion battery thermal management system. Int. J. Energy Res. 2020, 45, 5399–5411. [Google Scholar] [CrossRef]
  21. Elnaggar, M.; Abdullah, M.; Munusamy, S. Experimental and numerical studies of finned L-shape heat pipe for notebook PC cooling. IEEE Trans. Compon. Packag. Manuf. Technol. 2013, 3, 978–988. [Google Scholar] [CrossRef]
  22. Chen, W. Research on Heat Control System for Vehicular Power Battery Pack Based on Heat Pipe Technology. Master’s Thesis, South China University of Technology, Guangzhou, China, 2014. [Google Scholar]
  23. Wei, K. Structure Design and Thermal Analysis of Power Battery Thermal Management Based on Flat Heat Pipes. Master’s Thesis, Beijing Jiaotong University, Beijing, China, 2019. [Google Scholar]
  24. Li, R. Study on the Heat Dissipation Performance of Power Battery Liquid Cooling Thermal Management System of Electric Vehicle Based on Flat Heat Pipe. Master’s Thesis, Jiangsu University, Zhenjiang, China, 2019. [Google Scholar]
  25. Zeng, W.; Niu, Y.; Li, S.; Hu, S.; Mao, B.; Zhang, Y. Cooling performance and optimization of a new hybrid thermal management system of cylindrical battery. Appl. Therm. Eng 2022, 217, 119171. [Google Scholar] [CrossRef]
  26. Xin, Q.; Yang, T.; Zhang, H.; Zeng, J.; Xiao, J. Simulation and Optimization of Lithium-Ion Battery Thermal Management System Integrating Composite Phase Change Material, Flat Heat Pipe and Liquid Cooling. Batteries 2023, 9, 334. [Google Scholar] [CrossRef]
  27. Ye, Y.; Shi, Y.; Saw, L.H.; Tay, A.O. Performance assessment and optimization of a heat pipe thermal management system for fast charging lithium ion battery packs. Int. J. Heat Mass Transfer 2016, 92, 893–903. [Google Scholar] [CrossRef]
  28. Wang, Q.; Jiang, B.; Xue, Q.; Sun, H.; Li, B.; Zou, H.; Yan, Y. Experimental investigation on EV battery cooling and heating by heat pipes. Appl. Therm. Eng. 2015, 88, 54–60. [Google Scholar] [CrossRef]
  29. Yamauchi, T.; Mizushima, K.; Satoh, Y.; Yamada, S. Development of a simulator for both property and safety of a lithium secondary battery. J. Power Sources 2004, 136, 99–107. [Google Scholar] [CrossRef]
  30. Zavalis, T.; Behm, M.; Lindbergh, G. Investigation of short-circuit scenarios in a lithium-ion battery cell. J. Electrochem. Soc. 2012, 159, A848. [Google Scholar] [CrossRef]
  31. Wang, H.; Tang, A.; Wang, K. Thermal behavior investigation of Li Ni1 /3Co 1/3Mn 1/3O 2-based Li-ion battery under overcharge test. Chin. J. Chem 2011, 29, 27–32. [Google Scholar] [CrossRef]
  32. Maleki, H.; Howard, J.N. Effects of overdischarge on performance and thermal stability of a Li-ion cell. J. Power Sources 2006, 160, 1395–1402. [Google Scholar] [CrossRef]
  33. Feng, X.; Sun, J.; Ouyang, M.; Wang, F.; He, X.; Lu, L.; Peng, H. Characterization of penetration induced thermal runaway propagation process within a large format lithium ion battery module. J. Power Sources 2015, 275, 261–273. [Google Scholar] [CrossRef]
  34. Feng, X.; Zheng, S.; Ren, D.; He, X.; Wang, L.; Cui, H.; Liu, X.; Jin, C.; Zhang, F.; Xu, C.; et al. Investigating the thermal runaway mechanisms of lithium-ion batteries based on thermal analysis database. Appl. Energy 2019, 246, 53–64. [Google Scholar] [CrossRef]
  35. Jin, C.; Sun, Y.; Wang, H.; Zheng, Y.; Wang, S.; Rui, X.; Xu, C.; Feng, X.; Wang, H.; Ouyang, M. Heating power and heating energy effect on the thermal runaway propagation characteristics of lithium-ion battery module: Experiments and modeling. Appl. Energy 2022, 312, 118760. [Google Scholar] [CrossRef]
  36. Xin, Q.; Yang, T.; Zhang, H.; Yang, J.; Zeng, J.; Xiao, J. Experimental and numerical study of lithium-ion battery thermal management system using composite phase change material and liquid cooling. J. Energy Storage 2023, 71, 108003. [Google Scholar] [CrossRef]
Figure 1. Five schemes of battery module structures: Scheme 1 with FHPs (a); Scheme 2 with FHPs and a bottom liquid cooling plate (b); Scheme 3 with FHPs and side liquid cooling plates (c); Scheme 4 with bottom and side liquid cooling plates (d); Scheme 5 with FHPs and bottom and side liquid cooling plates (e); and the mesh of Scheme 5 (f).
Batteries 10 00086 g001
Figure 2. Single battery model (a) and mesh (b).
Batteries 10 00086 g002
Figure 3. Model validation of single battery under a 2C discharge rate and an ambient temperature of 25 °C and 40 °C (a) [36]; grid independence analysis of Scheme 5 (b).
Batteries 10 00086 g003
Figure 4. The maximum temperature (a) and the maximum temperature difference (b) of the five schemes and a control group without a cooling method at the end of discharge (c).
Batteries 10 00086 g004
Figure 5. The serial number of batteries in the battery module.
Batteries 10 00086 g005
Figure 6. The maximum temperature (a) and the maximum temperature difference (b) with different abnormal heat generation rates; the maximum temperature and maximum temperature difference of the battery module at the end of discharge (c).
Batteries 10 00086 g006
Figure 7. The temperature distribution of the battery module with different abnormal heat generation rates and 25 °C ambient temperature at the end of discharge.
Batteries 10 00086 g007
Figure 8. The effect of abnormal heat generation location and abnormal heat generation rate on the maximum temperature of the battery module at the end of discharge (ambient temperature = 25 °C).
Batteries 10 00086 g008
Figure 9. The temperature distribution of the battery module with different abnormal heat generation locations with a 500 W abnormal heat generation rate and 25 °C ambient temperature.
Batteries 10 00086 g009
Figure 10. The effect of abnormal heat generation location and abnormal heat generation rate on the maximum temperature difference of the battery at the end of discharge (ambient temperature = 25 °C).
Batteries 10 00086 g010
Figure 11. The effect of abnormal heat generation location and abnormal heat generation rate on the maximum temperature of the battery module at the end of discharge (ambient temperature = 40 °C).
Batteries 10 00086 g011
Figure 12. The temperature distribution of the battery module with different abnormal heat generation locations with 500 W abnormal heat generation rate and 40 °C ambient temperature.
Batteries 10 00086 g012
Figure 13. The effect of abnormal heat generation location and abnormal heat generation rate on the maximum temperature difference of the battery at the end of discharge (ambient temperature = 40 °C).
Batteries 10 00086 g013
Figure 14. The effect of the BTMS design scheme and abnormal heat generation rate on the maximum temperature of the battery module at the end of discharge.
Batteries 10 00086 g014
Figure 15. The effect of BTMS design scheme and abnormal heat generation rate on the maximum temperature difference of batteries at the end of discharge.
Batteries 10 00086 g015
Table 1. Comparison of cooling methods of the five schemes.
Design SchemesCooling Methods
Scheme 1 FHPs
Scheme 2 FHPs and bottom liquid cooling plate
Scheme 3 FHPs and side liquid cooling plates
Scheme 4 bottom and side liquid cooling plates
Scheme 5 FHPs and bottom and side liquid cooling plates
Table 2. Material properties of components in the battery module.
MaterialsDensity (kg/m3)Specific Heat Capacity (J/(kg·K))Thermal Conductivity (W/(m·K))
Battery2300107218.5, 18.5, 1.5
Aluminum2719871202.4
Water998.241280.6
Heat pipe89783816000
Table 3. Geometric parameters of prismatic lithium-ion battery.
Geometric ParametersData
Width148 mm
Depth27 mm
Height92 mm
Width of electrodes22 mm
Depth of electrodes19 mm
Height of electrodes6 mm
Table 4. The number of batteries with a maximum temperature exceeding 70 °C with different abnormal heat generation locations and abnormal heat generation rates (ambient temperature = 25 °C).
Abnormal Heat Generation LocationAbnormal Heat Generation Rates
250 W300 W350 W400 W450 W500 W
No. 1000011
No. 2000013
No. 3000123
No. 4000133
No. 5000133
Table 5. The number of batteries with a maximum temperature difference exceeding 5 °C with different abnormal heat generation locations and abnormal heat generation rates (ambient temperature = 25 °C).
Abnormal Heat Generation LocationAbnormal Heat Generation Rates
250 W300 W350 W400 W450 W500 W
No. 1111111
No. 2222223
No. 3033344
No. 4023556
No. 50124710
Table 6. The number of batteries with a maximum temperature exceeding 70 °C with different abnormal heat generation locations and abnormal heat generation rates (ambient temperature = 40 °C).
Abnormal Heat Generation LocationAbnormal Heat Generation Rates
250 W300 W350 W400 W450 W500 W
No. 1012345
No. 2014566
No. 3034677
No. 4135688
No. 5135789
Table 7. The number of batteries with a maximum temperature difference exceeding 5 °C with different abnormal heat generation locations and abnormal heat generation rates (ambient temperature = 40 °C).
Abnormal Heat Generation LocationAbnormal Heat Generation Rates
250 W300 W350 W400 W450 W500 W
No. 1111111
No. 2112223
No. 3023344
No. 4013556
No. 5012479
Table 8. The number of batteries with a maximum temperature exceeding 70 °C under different design schemes and abnormal heat generation rates.
Design SchemesAbnormal Heat Generation Rates
250 W300 W350 W400 W450 W500 W
Scheme 1 101010101010
Scheme 2 91010101010
Scheme 3 579101010
Scheme 4 7910101010
Scheme 5 135789
Table 9. The number of batteries with a maximum temperature difference exceeding 5 °C with different design schemes and abnormal heat generation rates.
Design SchemesAbnormal Heat Generation Rates
250 W300 W350 W400 W450 W500 W
Scheme 1 567888
Scheme 2 279101010
Scheme 3 1610101010
Scheme 4 101010101010
Scheme 5 012479
Disclaimer/Publisher’s Note: The statements, opinions and data contained in all publications are solely those of the individual author(s) and contributor(s) and not of MDPI and/or the editor(s). MDPI and/or the editor(s) disclaim responsibility for any injury to people or property resulting from any ideas, methods, instructions or products referred to in the content.

