
Battery Temperature Prediction Using an Adaptive Neuro-Fuzzy Inference System

1
School of Aerospace, Transport and Manufacturing, Cranfield University, Bedfordshire MK43 0AL, UK
2
Delta Cosworth, Unit 9, Silverstone Technology Park, Silverstone Circuit, Northamptonshire NN12 8GX, UK
*
Author to whom correspondence should be addressed.
Batteries 2024, 10(3), 85; https://doi.org/10.3390/batteries10030085
Submission received: 6 January 2024
/
Revised: 20 February 2024
/
Accepted: 26 February 2024
/
Published: 1 March 2024
(This article belongs to the Section Battery Modelling, Simulation, Management and Application)
Abstract
:Maintaining batteries within a specific temperature range is vital for safety and efficiency, as extreme temperatures can degrade a battery’s performance and lifespan. In addition, battery temperature is the key parameter in battery safety regulations. Battery thermal management systems (BTMSs) are pivotal in regulating battery temperature. While current BTMSs offer real-time temperature monitoring, their lack of predictive capability poses a limitation. This study introduces a novel hybrid system that combines a machine learning-based battery temperature prediction model with an online battery parameter identification unit. The identification unit continuously updates the battery’s electrical parameters in real time, enhancing the prediction model’s accuracy. The prediction model employs an Adaptive Neuro-Fuzzy Inference System (ANFIS) and considers various input parameters, such as ambient temperature, the battery’s current temperature, internal resistance, and open-circuit voltage. The model accurately predicts the battery’s future temperature in a finite time horizon by dynamically adjusting thermal and electrical parameters based on real-time data. Experimental tests are conducted on Li-ion (NCA and LFP) cylindrical cells across a range of ambient temperatures to validate the system’s accuracy under varying conditions, including state of charge and a dynamic load current. The proposed models prioritise simplicity to ensure real-time industrial applicability.
1. Introduction
Considering the drastic development of Li-ion battery technology in recent decades, energy density and safety have been two major topics of Li-ion batteries in various applications such as electric vehicles, mobile devices, power plants, etc. Batteries generate massive heat while discharging, particularly under high C-rates. Consequently, the heat causes the battery temperature to rise. Lithium-ion battery performance is susceptible to temperature [1,2]. The battery’s electrochemical characteristics dynamically shift following temperature change [3]. A high-density battery pack consisting of a large number of cells creates a massive quantity of heat that accumulates inside, which causes the temperature to rise inside the battery. High temperatures can lead to a decline in battery performance, shorten the battery life span, and even cause a thermal runaway with critical safety issues [4,5]. Hence, heat generation must not be overlooked [6]. Failure to manage the battery’s thermal characteristics causes a risk of performing safely as well as adversely affecting the battery’s lifetime with degradation of power and capacity [7,8,9]. At low temperatures, the battery electrochemical characteristics tend to decrease the ionic conduction rate of the electrolyte and slow the chemical reaction at the anode and cathode [10], which causes battery capacity loss and efficiency drop in both charge and discharge [11,12]. Therefore, battery thermal management is a crucial issue that requires extensive research and development.
Thermal management of batteries is also critical in achieving the desired performance in a wide range of temperature environments and ensuring the battery’s safe operation, particularly in high-temperature environments. Due to the physical characteristics of the conventional lithium-ion battery, heat dissipation starts with internal heat diffusing to the battery shell surface [13], which means that any temperature data captured by sensors on the battery surface will have a data lag before the temperature rise or drop is reflected.
As a result, it is essential to predict the temperature change in the battery well in advance to ensure the efficiency of the cooling/heating system. A battery cooling system is critical for battery safety, mainly to prevent the battery thermal runaway [14]. In addition, keeping the battery working under a temperature threshold can prolong its lifetime [12,15]. On the other hand, lithium-ion batteries suffer from capacity loss when they work at low ambient temperatures. Battery preheating is a common way to help the battery avoid such capacity loss. Due to the structure of the conventional lithium-ion cells, the difference between the battery’s inner temperature and its surface temperature could reach around 5 °C [16] or even more when the battery experiences over-discharge [17]. By considering the heat conduction mechanism inside a cylindrical battery, we better understand the time lag between the heat generation inside the battery and its surface temperature. Hence, a battery temperature prediction unit can help BTMSs maintain battery safety at high temperatures by preventing the battery temperature from going beyond the thresholds. Meanwhile, it can also help improve the preheating process when the battery might face capacity loss at low temperatures. Machine learning models are a promising solution to address this problem. The system can predict the battery’s temperature change in a finite prediction horizon by identifying and using proper input information. This research aims to design and validate such a system using experimental data.
Surprisingly, there are few studies in the literature in which the problem mentioned above has been addressed. Feng Fei [18] proposes an electrochemical–thermal neural network (ETNN) model for battery state estimation. It combines simplified sub-models for predicting core temperature and approximate terminal voltage with a neural network to enhance their performance. The ETNN model accurately estimates battery voltage and core temperature under a wide range of ambient temperatures and discharge rates. An unscented Kalman filter (UKF) is integrated with the ETNN to achieve reliable co-estimation of state of charge (SOC) and state of temperature (SOT), and experimental results demonstrate satisfactory co-estimation performance. Marui Li et al. [19] applied a sophisticated algorithm involving multi-sequential neural networks and deep learning for battery state estimation. Andreas et al. [20] adopted a Convolutional Neural Network (CNN) model for battery temperature prediction, which is trained with cross-domain data from the simulation, vehicle fleet, and weather stations. They considered the battery cooling thresholds, practical data, and battery heat generation. Seho Park et al. [21] developed a technique to predict the battery temperature change trend based on the driving pattern and adopted the UDDC driving cycle and the cooling effects with empirical function. Mengyi Wang et al. [22] applied a CNN model for a battery pack’s internal temperature prediction with good visual analysis and soft sensor technology with big data size that counts the thermal convection rate and thermal dissipation rate. Kaizheng Fang et al. [23] developed an ANN model to predict the surface temperature of a Ni-MH battery during charging under different ambient temperatures. The model was trained using data from charging an 8Ah cylindrical Ni-MH battery under different current rates and ambient temperatures.
Currently, the main function of Battery Thermal Management Systems (BTMSs) is to monitor the battery state (particularly the temperature) at the present time and take any necessary action. What the existing BTMSs lack is the ability to predict the battery temperature in the near future. Such a battery temperature prediction unit can help the battery cooling system to prepare for the battery temperature rising in the next few minutes, for instance, due to a high charge/discharge rate at the present time. This research aims to develop an AI-based battery temperature prediction method to contribute to the robust and efficient use of battery systems, particularly in an EV application. For that purpose, an Adaptive Neuro-Fuzzy Inference System (ANFIS) is trained to predict the battery’s surface temperature within a finite time horizon using the history data of the battery’s charge/discharge and the battery’s internal parameters. A system identification technique is also used along with the ANFIS model to update the battery parameters continuously. As a result, the proposed hybrid method is able to deal with any sudden changes in the battery’s state, which distinguishes it from all other existing methods in the literature.
2. An Overview of the Proposed Concept
The primary objective of the proposed model in this study is to accurately forecast the surface temperature of a battery in a finite time horizon (for example, 30 s ahead) by using updated values of battery-related parameters in real time. This must be achieved despite the limitations of measurement tools as well as the uncertainties around the ambient temperature and fluctuations of the load current over the entire battery lifetime.
To tackle the complexity of the problem mentioned above, it is imperative to incorporate several critical variables into the problem formulation. However, the parameters that can be directly measured from a battery during its operation are limited and only include the load current, terminal voltage, and surface temperature. This is insufficient to gain a comprehensive understanding of the battery’s performance and its characteristics. For instance, identifying the surface temperature of a battery solely based on terminal voltage and current is not feasible. One approach is to create a mathematical representation of the battery’s electrical and thermal behaviours. Battery modelling enables us to obtain additional battery parameters beyond the direct measurements, including the SOC, state of health (SOH), internal resistance, and open-circuit voltage. Adding these factors makes it possible to predict the battery’s surface temperature using the existing direct measurements.
An analysis of the battery parameters obtained from battery modelling enables us to find the relationship between the battery’s surface temperature and internal parameters. This opens up new possibilities for understanding the behaviour of batteries and optimising their performance. However, there is currently no established method that can directly demonstrate the correlation between the battery parameters and the battery’s surface temperature. This has posed a significant challenge to researchers seeking to fully comprehend the underlying physics of battery operation. Fortunately, advances in machine learning techniques offer a promising avenue for tackling this complex problem. Machine learning can identify the relationship between various physical parameters by analysing historical experimental data [24,25]. By training a machine learning model using a dataset containing both battery parameters and corresponding surface temperature readings, it will be possible to develop a predictive model that can accurately forecast the battery’s surface temperature based on its electrical and thermal parameters.
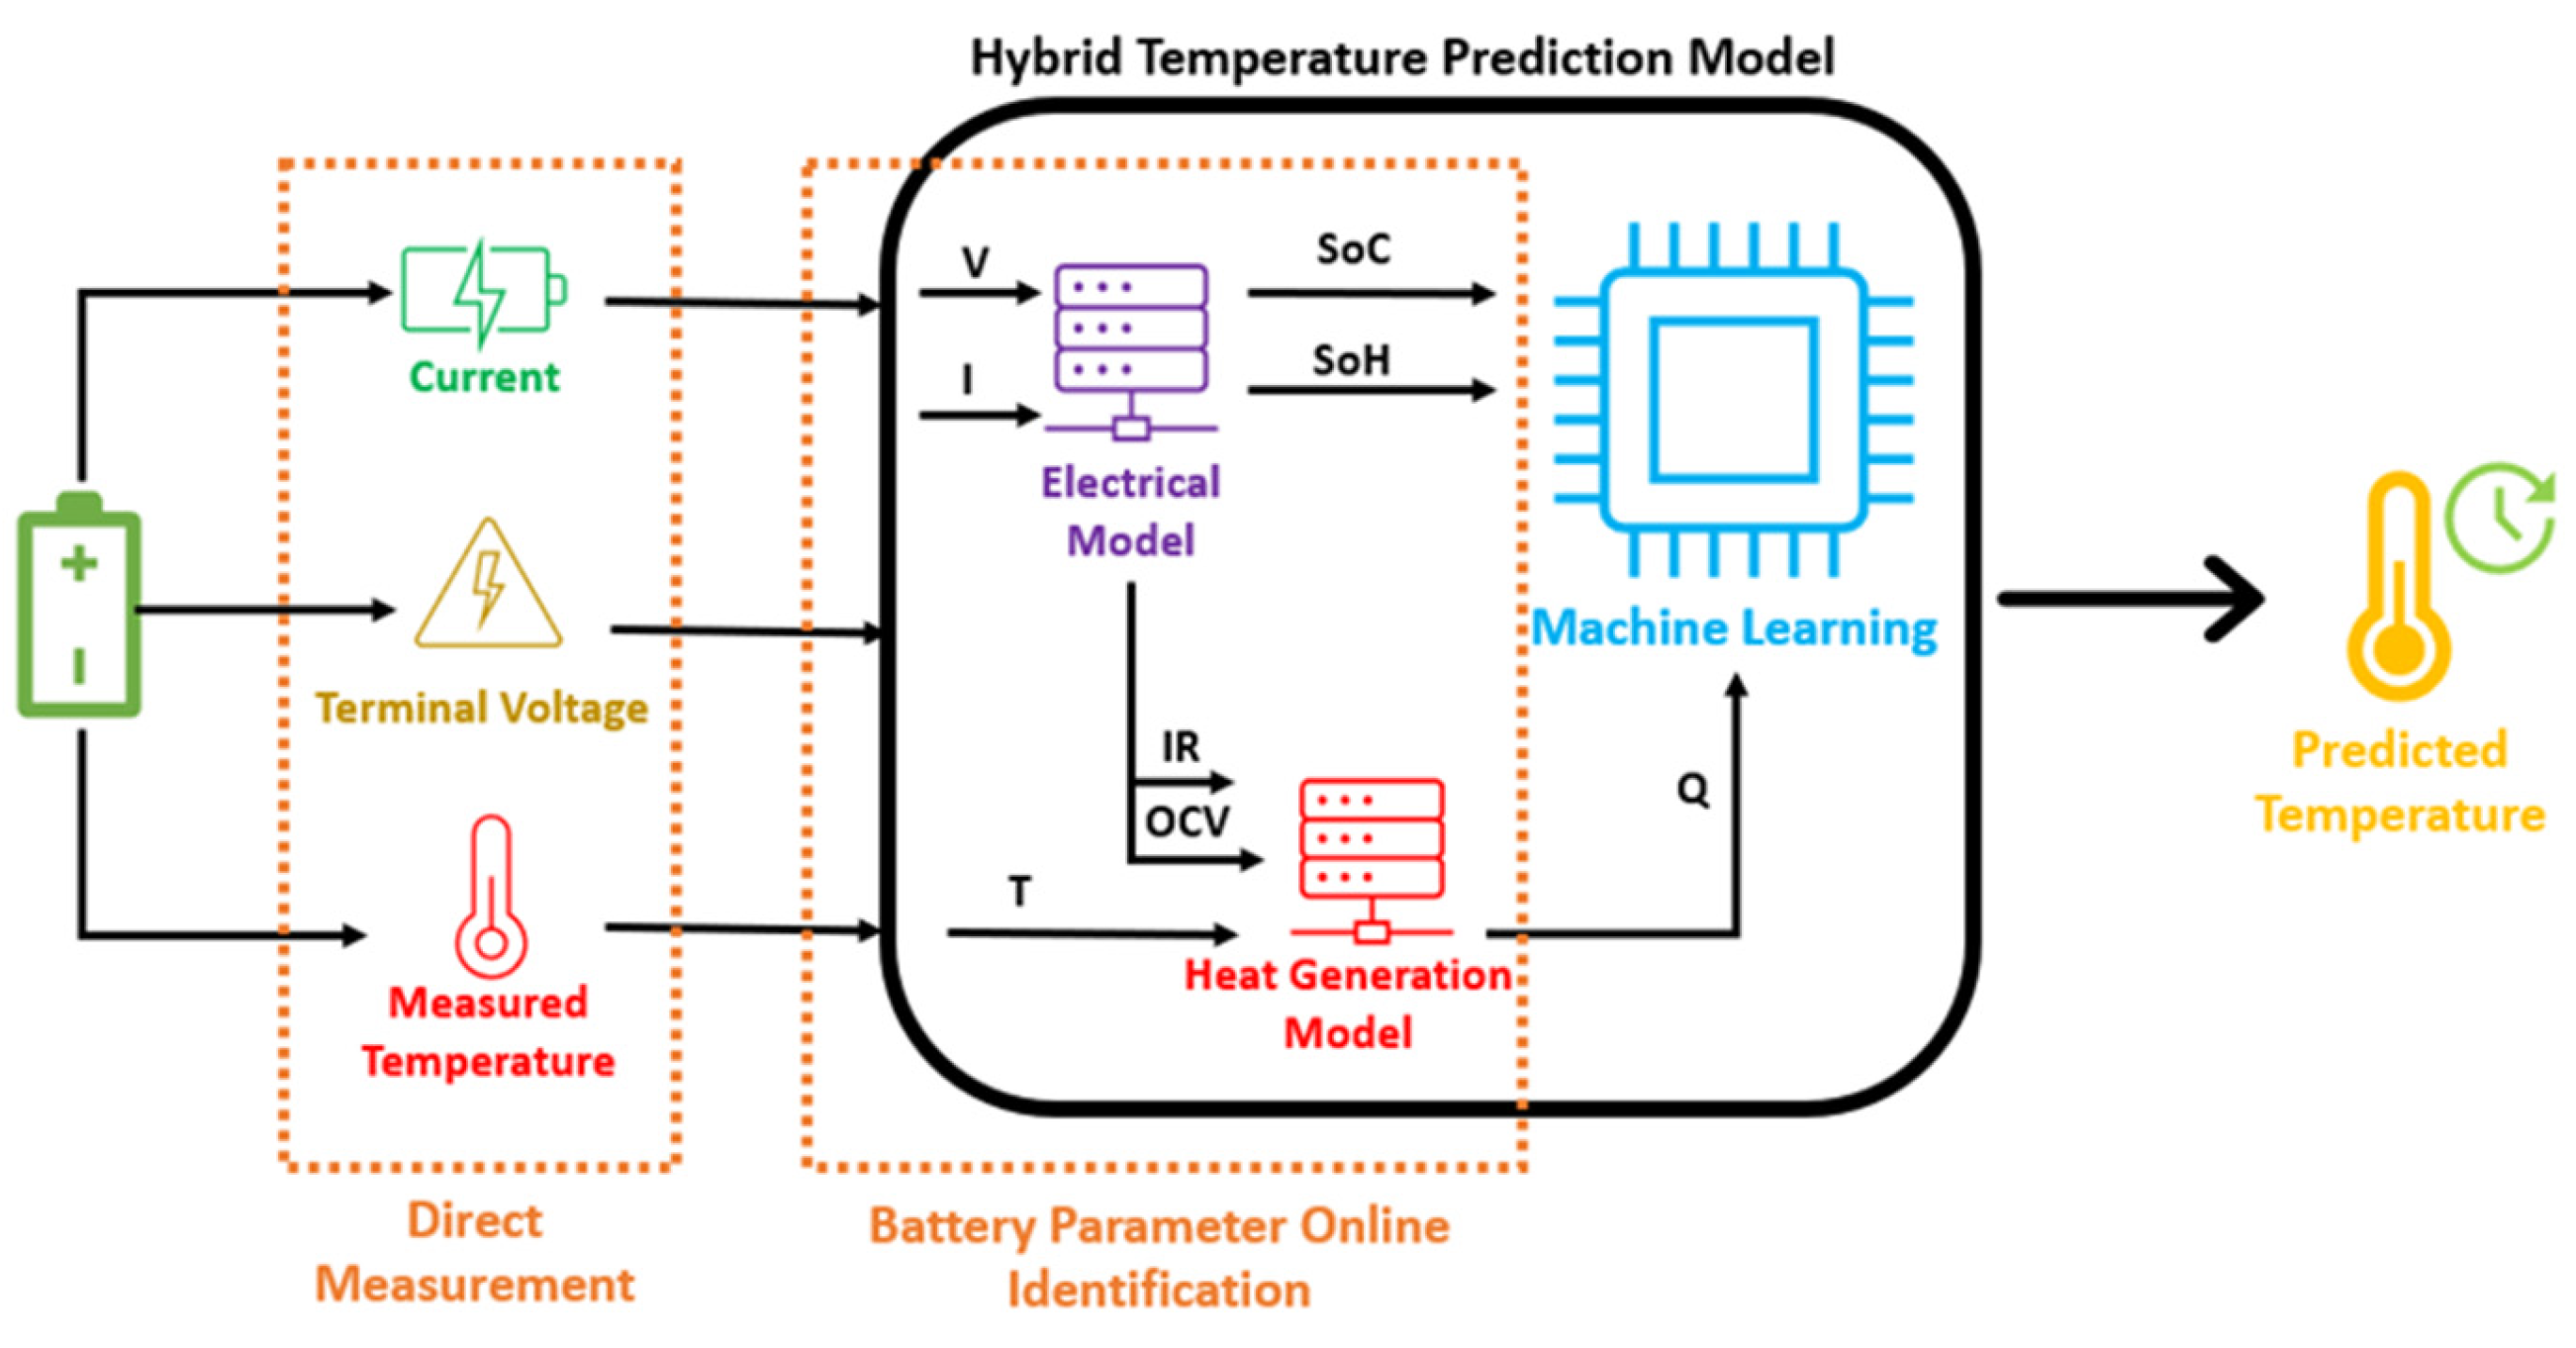
In this study, an innovative and highly effective system is developed for predicting battery surface temperature based on a hybrid approach. The proposed system, shown in Figure 1, includes an online identification unit that enables real-time monitoring of battery internal parameters, allowing for more accurate and precise temperature prediction. To ensure the system’s effectiveness and reliability, real-world usage simulation test data are used.
The hybrid approach developed in this study combines analytical and empirical models, using the strengths of each to provide the most accurate and reliable predictions possible. The analytical model is based on fundamental principles of battery operation, such as the electrochemical heat generation equation. In contrast, the empirical model is developed using historical data and machine learning techniques. This approach allows for identifying and integrating a wide range of physical and environmental factors that can impact battery performance and temperature. Using this hybrid battery surface temperature prediction system, we can understand the complex interplay between the battery’s electrical and thermal parameters. By accurately predicting battery surface temperature, the system can support the development of more effective and efficient battery management strategies, leading to longer battery life and overall performance improvement.
From Figure 1, the data splits into two groups: directed measured data (i.e. voltage, V, current, I, and temperature, T) and the data coming from the battery parameter identification unit (battery resistance, R, open-circuit-voltage, OCV, state of charge, SoC, state of health, SoH, and generated heat, Q). The direct measurements are provided by the battery sensors, which are current, terminal voltage, and surface temperature. The online identification unit processes the measured data and obtains the required parameters, such as internal resistance and open-circuit voltage, which are used for the calculation of the battery heat generation rate, and then estimation of the expected change in the battery temperature within the prediction horizon.
3. Battery Temperature Prediction Methodology
As mentioned earlier, the battery surface temperature prediction system requires battery test data to build electrical and thermal models and train the ANFIS. So, the proposed methodology includes (1) the battery experimental setup and test procedures; (2) the battery modelling; (3) the ANFIS model; and (4) the prediction model performance evaluation. In the following, these parts are discussed for every detail of the whole concept shown in Figure 2. Then, the battery temperature prediction results are demonstrated and discussed.
3.1. Battery Experimental Setup and Test Procedures
3.1.1. NCA Battery
The first battery used in this study is a Lithium Nickel Cobalt Aluminium Oxide (), commonly known as an NCA battery. NCA batteries are known for their high specific energy and long lifespan, making them an ideal candidate for EV powertrains. This commercial product is widely applied in EVs and significantly advances in battery manufacturing [26]. Figure 2 displays five NCA cells used in the experiments conducted in this research. Table 1 contains the detailed specification of the NCA cells. The specifications include critical information such as the battery’s capacity, voltage limits, and charge/discharge rates. Understanding the cell’s technical specifications is essential to evaluate its performance and reliability.
3.1.2. LFP Battery
The Lithium Iron Phosphate (LFP) battery has recently obtained a notable ascendancy in the EV market [26]. The material of an LFP battery is made of lithium-ion phosphate (). LFP batteries are also known as lithium ferro-phosphate or phosphate batteries. Compared with other types of lithium-ion batteries, LFP batteries offer several advantages including a long cycle life and outstanding thermal stability ensuring excellent safety. LFP batteries are less likely to experience thermal runaway or catch fire, making them a popular choice for EVs. Although LFP batteries have a lower potential, electrical, and ionic conductivity compared with ternary lithium-ion batteries, they have excellent performance in terms of lifespan and SOH consistency, maintaining their capacity over numerous charge and discharge cycles. These reliable and cost-effective characteristics make LFP batteries a widely used option for energy storage systems. In this study, additional tests are conducted on the RS Pro lithium-ion iron phosphate cells shown in Figure 3. The cell model is LIFePO4-26650 with a capacity of 3399 mAh, and other specifications are presented in Table 2.
3.1.3. Experimental Setup
To meet the demands of our battery testing objectives, we have developed a comprehensive battery testing system. Figure 4 shows the configuration of the battery testing system, which consists of several key components that work together to achieve our experimental goals. The central component of the system is a personal computer (PC), which serves as the terminal control centre. The PC is equipped with the necessary software, i.e. MATLAB/Simulink 2020b, and communication cables, which allow it to communicate with the other components of the system, such as the power supply and the thermocouple data logger. The PC sends charge/discharge commands to the power supply, which then applies the required load current to the battery. The battery is inside a thermal chamber to control the ambient temperature during all tests. The battery fixture is connected to the power supply via wires and is designed to hold the battery in place during the testing process. To monitor the battery’s performance during the test, the power supply measures the battery voltage and current every second. This information is sent back to the terminal control centre for recording and monitoring purposes, allowing us to track the performance of the battery over time. In addition to measuring the battery voltage and current, temperature signals are collected during the testing process. Thermocouples are attached to the surface of the battery, allowing us to monitor the temperature of the battery during each test. The thermocouples are connected to a data logger, which sends the temperature signal back to the PC for recording and analysis. In general, the battery testing system is designed to collect accurate and reliable data related to the performance of the test batteries during the experiments.
3.1.4. Experimental Test Procedures
To successfully apply battery research, it is important to conduct performance tests and identify the characteristics of the battery being developed. This helps to ensure that the battery performs as intended and meets the requirements for its intended use. The battery testing plan is typically divided into four stages mentioned below, each serving a specific purpose in assessing the battery’s performance and identifying any potential issues.
- The battery undergoes constant current discharge and mixed pulse discharge tests to assess its performance.
- The battery experiences the WLTP test to evaluate its performance under a realistic driving condition.
The Worldwide Harmonised Light Vehicles Test Procedure (WLTP) [27] is a globally recognised standard for testing the fuel economy and emissions of light-duty vehicles. This standard defines a driving cycle that consists of four segments: low-speed urban driving, medium urban driving, highway cruising, and extra-high speed [28], as illustrated in Figure 5. The simulated WLTP battery load current profile, shown in Figure 6, is obtained after the simulation of a typical EV over the driving cycle. In this profile, a negative current value indicates that battery discharge occurs during vehicle acceleration. The magnitude of the current value corresponds to the rate of acceleration. Conversely, a positive current value indicates that battery charging occurs during energy regeneration. This process is known as regenerative braking, which captures the energy generated during braking and stores it in the battery for later use.
The WLTP test used in this research is intended to provide a more accurate picture of real-world EV applications and consequently contribute to the development of a more practical temperature prediction model for such an industrial application. As the tests were performed on single cells, the current requirement was scaled down to match the capabilities of each cell. Each WLTP test was conducted for repeated cycles until the battery was depleted.
To further simulate real-life usage, the tests are carried out at various ambient temperatures ranging from −10 °C to 40 °C. This helps to identify the impact of the ambient temperature on battery performance. The results from these tests can be used to optimise the design and performance of batteries, especially for the EV application.
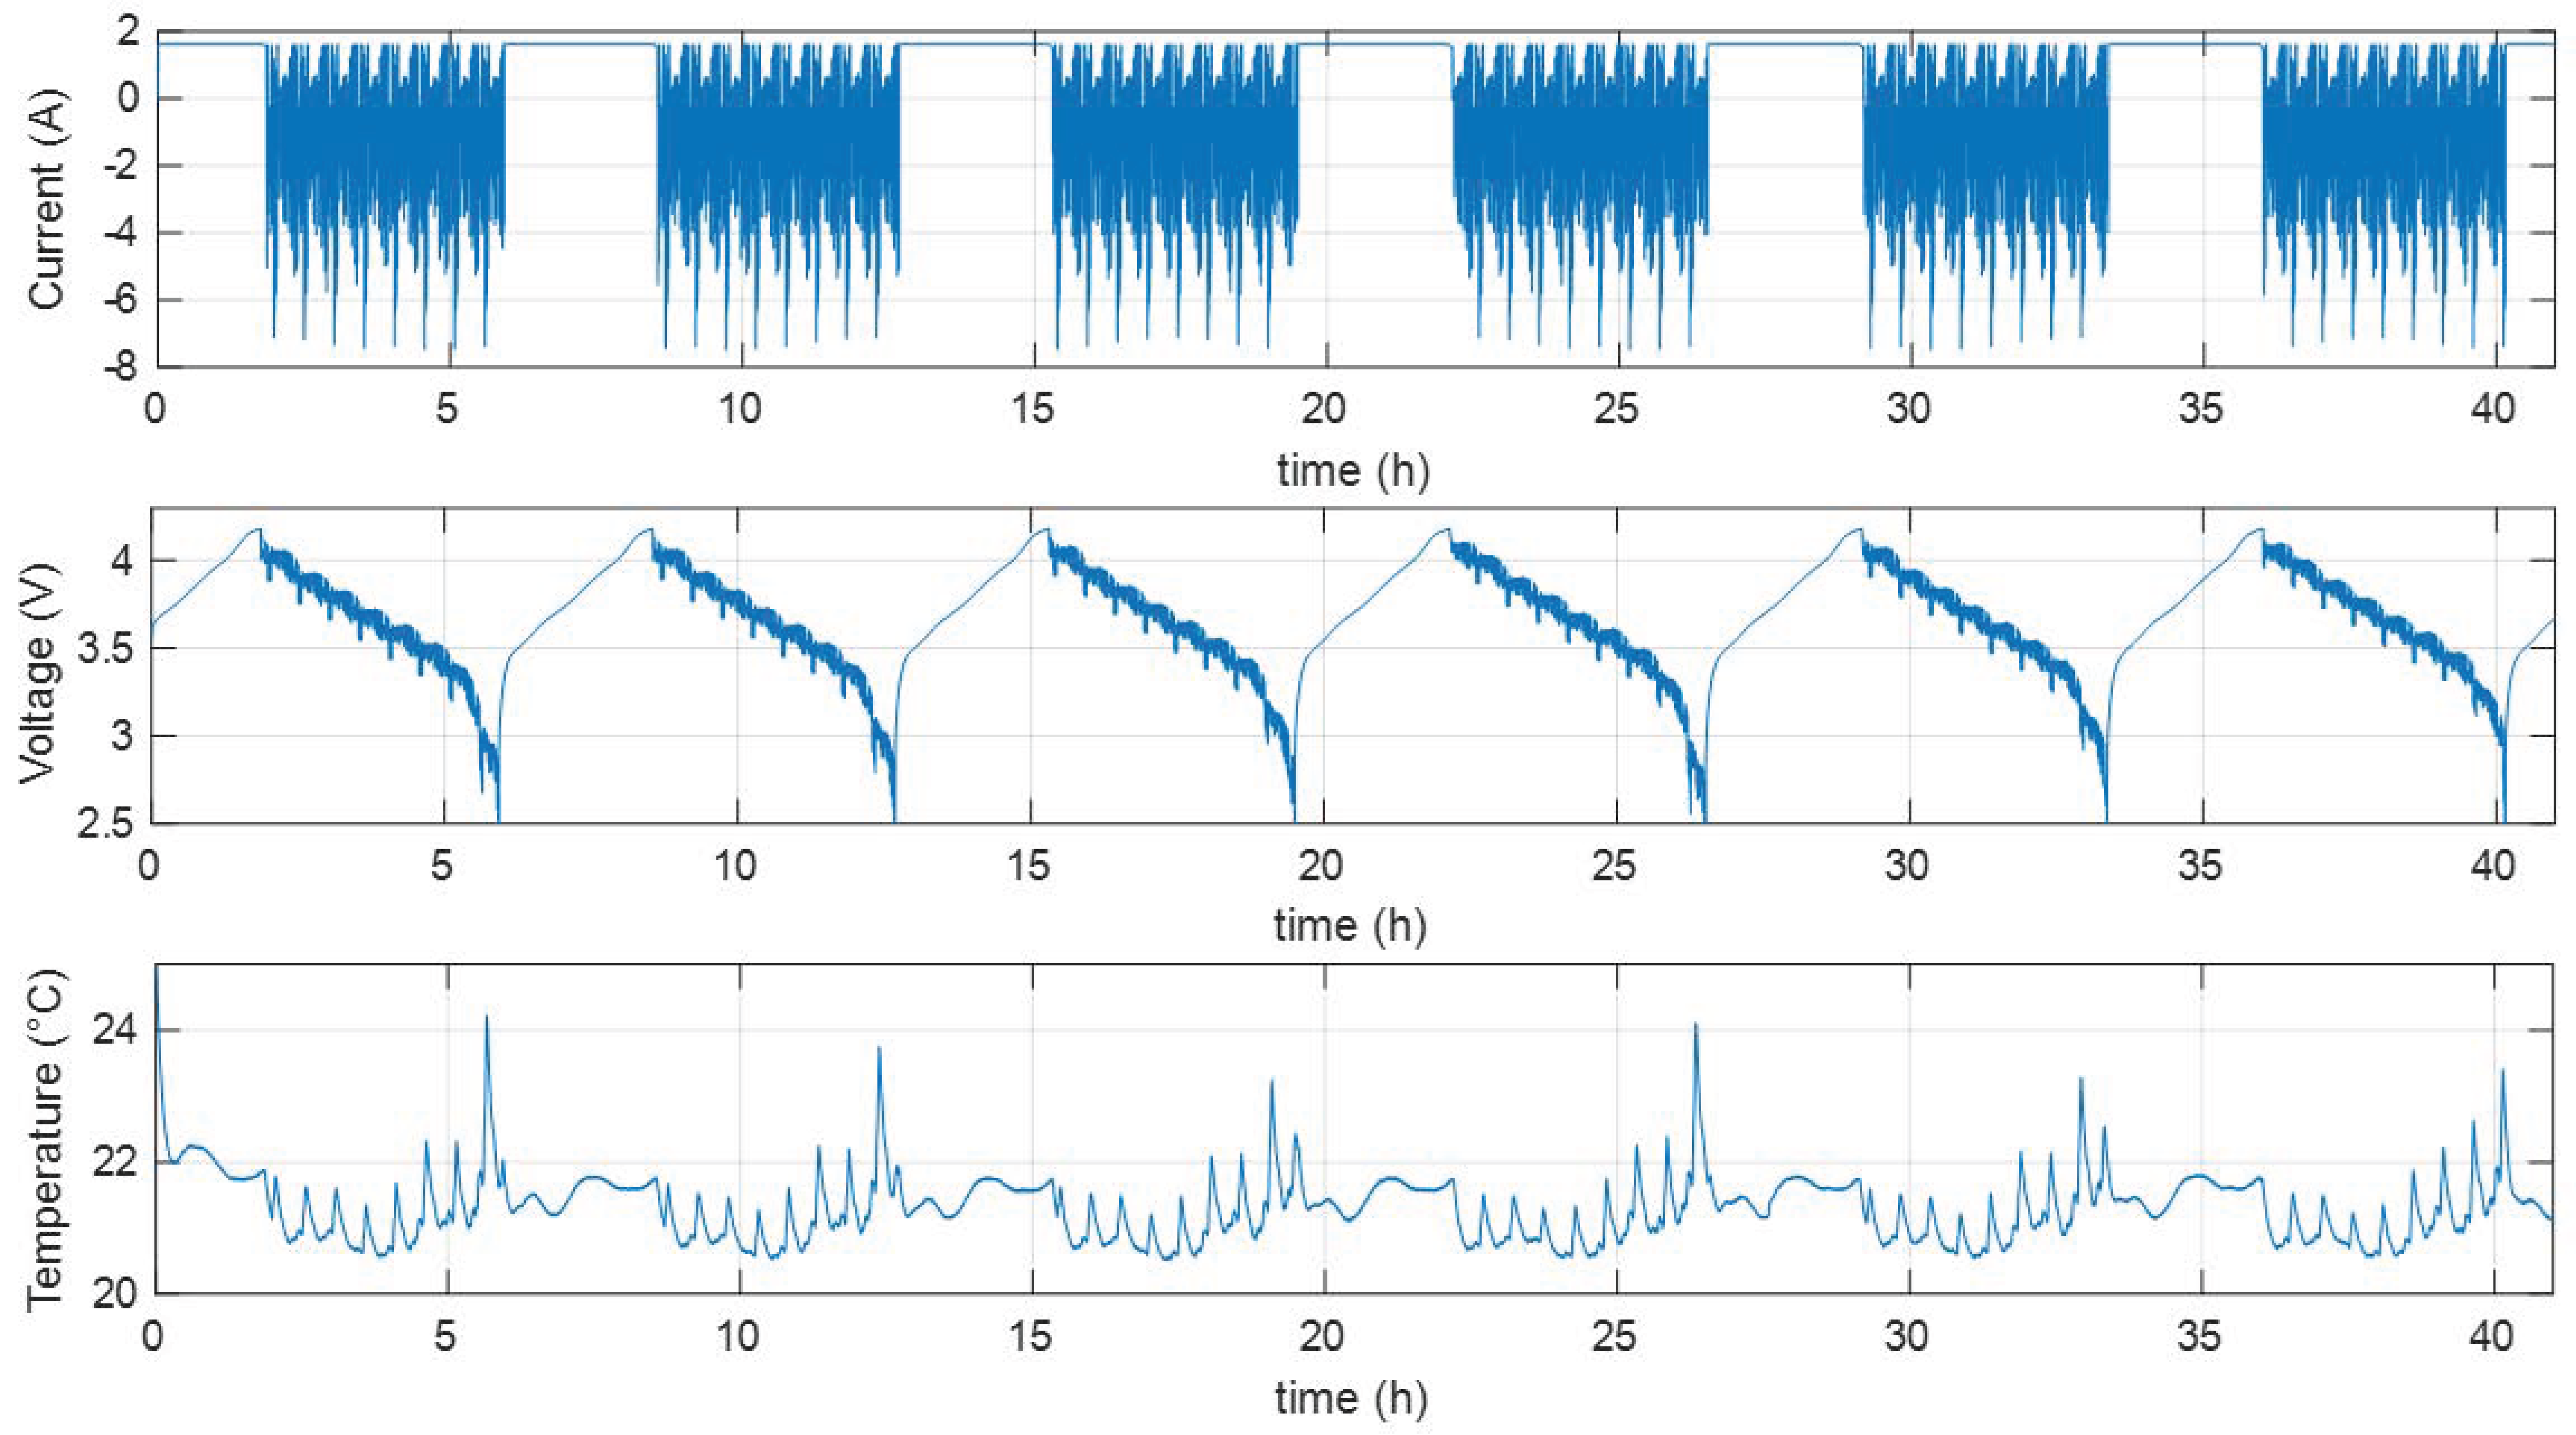
As mentioned earlier, the battery test is primarily controlled using a MATLAB code, which sends the pre-programmed commands to the power supply, monitors the battery voltage, and controls the charge and discharge current during each test. An example WLTP test is shown in Figure 7. In that figure, the cell is fully charged before starting the WLTP discharge profile and the whole charge/discharge cycle is repeated several times in this case. As mentioned above, the required data for battery temperature prediction consists of two parts. The first part is provided by direct measurements, the data recorded by the power supply and the thermocouples. These data include the battery terminal voltage, the load current, and the battery surface temperature. The thermocouples connect with the temperature data logger, which converts the voltage signal from the thermocouple to the digital temperature data and sends it to the PC for recording. All measurements are recorded in the form of time series with a sampling rate of 1 Hz for both the power supply and the temperature data logger.
3.2. Battery Modelling for Temperature Prediction
3.2.1. Battery Electrical Modelling
In this study, we focused on battery-equivalent circuit models due to their compatibility with the online identification process used in this research. An equivalent circuit model comprises a network of resistors and capacitors that represent the electrical properties of the battery. By analysing the voltage and current measurements of the battery, the equivalent circuit model can accurately predict the battery’s performance. Although the electrochemical models are not used in this study for their complexity, it is important to acknowledge their accuracy, which makes them more suitable for offline applications. A battery electrochemical model takes into account the internal chemical processes of the battery, providing a more detailed analysis of its behaviour. However, due to the need for light computational effort in the online identification process used in this study, the equivalent circuit modelling approach sounds like a more practical and effective option.
After a detailed analysis of the battery test data, it was found that there is no direct correlation between the battery surface temperature and the terminal voltage and/or the load current signals. The mission of this study is to build a battery electrical model to obtain additional battery parameters, which can help us to better understand the battery’s performance and, specifically, the heat generation inside it. According to the literature, the two primary parameters of interest are the internal resistance and the open-circuit voltage (OCV). These parameters cannot be measured directly using sensors during the tests. However, they can be calculated from the measured current (I) and terminal voltage (V). The internal resistance represents the battery’s resistance to the flow of current, while the OCV represents the voltage of the battery when it is not connected to any load. These parameters are critical in evaluating the battery’s performance and predicting its behaviour under different conditions.
The Rint model, shown in Figure 8, is a widely used mathematical model for rechargeable batteries that has proven to be an effective tool for optimising battery performance [29]. The Rint battery model has only two parameters: an ideal voltage to characterise the open-circuit voltage and one resistance [30], as shown in Figure 8. The variable is the load current, whereas the parameter represents the battery’s terminal voltage.
Polarisation is a special effect observed in batteries, especially during discharge, which can affect the accuracy of the battery’s electrical parameters [31]. Adding one RC model to the Rint model can improve it by considering the effect of polarisation and this model is called the Thevenin model [29], which is illustrated in Figure 9. In this figure, is the battery terminal voltage, represents the battery open-circuit voltage, is the charge/discharge load current, is the ohmic resistance, and and stand for equivalent polarisation resistance and capacitance, respectively [32]. In several studies, the Thevenin model is used for battery electrical parameter analysis because of its acceptable level of accuracy [33,34]. In this study, the Thevenin model is only used for offline battery parameter identification to generate a reference benchmark. The mathematical presentation of this model is as follows [35]:
One of the most critical aspects of the Rint model is its ability to predict battery performance under a dynamic load profile accurately. When a battery is subjected to a dynamic load, it experiences quick voltage drops and jumps due to its ohmic resistance. The Rint model can incorporate such voltage drops/jumps into its calculation. By incorporating the effect of ageing on the Rint model’s internal resistance, it can easily consider the battery degradation as well.
For the proposed battery temperature prediction methodology, the battery characteristic data are crucial for the heat generation model, where the battery parameter identification unit plays a key role. In this study, a 90 s time window is considered as battery usage history to perform the parameter identification process in real time. Longer timeframes (5 min or more) do not make sense because very old data are almost irrelevant in this case. On the other hand, very short time windows (a few seconds) might also face some issues such as not being able to identify the battery model due to lack of information. Therefore, something in between was needed. Our suggestion is a time window between 1 and 3 min. In a dynamic high C-rate current profile such as the WLTP driving cycle scenario, the identification results might show higher errors. However, it is still acceptable after applying an averaging filter as shown in Figure 10. The figure illustrates identified values for the NCA cell’s internal resistance during a WLTP test, from a fully charged state until depletion. The resistance values are averaged over a short time window (i.e., 90 s in this case). According to the result, the resistance remains almost constant between 30% and 100% SOC and it gradually increases at lower SOCs.
In the following two subsections, the internal resistance and the open-circuit voltage are explored with the two different battery electrical models, and then the outcomes are compared and analysed. While there are some differences between the two models in terms of their electrical parameters, that difference is not significant enough to affect the subsequent stages of the battery temperature prediction system. However, given the complexity of the system and the computational requirements, the algorithm used for this analysis must be able to perform the necessary calculations quickly and respond promptly. After careful consideration and online identification, the Rint model was selected as the primary algorithm for battery electrical parameter analysis. This model satisfies the criteria of the hybrid battery temperature prediction system by providing fast and accurate responses to changes in the battery’s electrical parameters. Therefore, the Rint model is used throughout the remainder of this paper for the online identification unit.
For a dynamic load profile such as the WLTP current profile, the battery OCV is not easy to identify. Similar to the battery resistance identification, a 90 s historical time window is considered, and an averaging filter is applied to obtain the OCV in real time during a dynamic load profile. In the laboratory environment, pulse tests can be applied to identify the correct values of the battery model’s parameters called offline identification. The mixed pulse discharge test and constant discharge test are used in the offline identification process. Then, battery characterisation is performed by analysing the battery data to determine the internal resistance, polarisation effect, and open-circuit voltage. The offline identification results can also be used as a reference to validate the online identification outcomes. It should be noted that the offline identification method is not feasible in real-time applications.
Figure 11 and Figure 12 show a comparison of the OCV values between the online and offline identification obtained at three different temperatures. The online identification curves have more fluctuations due to the variations in the WLTP current profile. Both test data are collected in the same battery status and the same ambient temperature. Generally speaking, the two curves have the same trends and the exact start and end values, which can verify the online identification results to be used later for the battery temperature prediction.
For battery heat generation calculation, the battery internal resistance is a vital parameter to consider in addition to the current and voltage. Also, battery internal resistance changes with the ambient temperature and charge/discharge current, especially under the WLTP test. The battery resistance changes as the discharge current fluctuates. In addition, considering the battery ageing effects, the battery heat generation model cannot use a fixed resistance value. A fixed internal resistance might work for heat generation calculation in a standard situation like normal ambient temperature and a non-dynamic load current profile. However, it cannot handle extreme temperatures as well as dynamic load current profiles, which have remarkable impacts on battery internal resistance. The online identification unit can solve that issue by regularly updating the resistance value to be used more precisely for the heat generation calculation.
The battery’s thermal behaviour varies at different SOC levels impacting the battery’s surface temperature prediction. It is crucial to highlight that an estimated SOC is not employed as an input for the battery surface temperature prediction in this study. Although adding a SOC estimator to the proposed temperature prediction system is possible, it is not essential because the system can identify the battery model’s parameters automatically. The proposed system is designed to work in a way that is independent of any state estimator. This is an advantage because no additional error will be added to the system due to the state estimation accuracy limitations. It should be noted that despite excluding SOC estimation from the temperature prediction system, the proposed system considers the impacts of any changes in the battery’s states by continuously identifying its parameters in real time. This includes the changes in battery SOC and the battery’s state of health, which are discussed in the next section.
3.2.2. Battery Thermal Modelling
We should consider the time required for the heat transfer from the battery’s core to its surface for battery temperature prediction. The heat generation inside a lithium-ion battery contains three main parts: (i) reaction heat ; (ii) polarisation heat ; and (iii) Joule heat [36]. So, there is always a lag in temperature change on the cell’s surface compared with its core temperature. Considering this potential impact on the battery’s temperature prediction, we need the battery thermal model to calculate the heat generation to be used for surface temperature prediction. Two battery heat generation models have been applied and tested in this research.
Battery heat generation is a complicated process with many discrete phases involving the battery energy content. The battery heat generation process can be assumed to combine these processes: chemical reactions, phase changes, mixing processes, electrical work, and heat transfer with the ambient air.
Bernardi electro-chemical heat generation is a type of heat generation that occurs in batteries during the charge and discharge processes. This type of heat generation is down to the internal resistance of the cells and the resistance of the connecting wires, as well as the chemical reactions that take place during charge and discharge. Bernardi heat generation depends on the load current through the battery, the battery SOC, and the power consumption. It can be calculated by measuring the cell’s voltage and current during both charge and discharge. Regarding the battery heat generation theory, presented in reference [36], in typical circumstances, the factors influencing thermal generation can be broken down into four elements:
- Heat value due to entropy changes from electrochemical reactions;
- Polarisation heat value ;
- Battery side reactions, self-discharge, and such due to electrolyte decomposition, which are named ;
- Joule heat value , which is caused by the ions shift between the anode and the cathode through the electrolyte with resistance called battery internal equivalent resistance, is also overpotential.
Therefore, the total generated heat could be written as follows:
In short, in the scenario of a Li-ion battery, the is necessarily zero. During the charging phase, if the charge current rate is very low, the polarisation heat becomes relatively small, and the battery is in a heat absorption condition at the beginning of the charge, which could be kept at a low temperature. But when the charge rate increases, both the and will elevate at the same time. In the discharge process, the battery temperature will rise with a non-linear trend.
Generally, the heat generation rate of a single cell during discharge can be divided into two groups, reversible heat and irreversible heat, as defined by the researcher Bernardi [37]:
where parameter is the irreversible heat generation caused by the losses, which happen in the current collectors as well as the active materials. On the other hand, is the reversible heat generation, which happens because of a change in entropy during the intercalation and deintercalation of the lithium ions. The parameter U is the terminal voltage in volt (V), T is the core temperature in Kelvin (K), and is the entropy coefficient (V/K), which depends on the SOC and has a significant influence on the temperature behaviour of the model [38].
3.3. ANFIS Model
Based on the whole concept presented in Figure 1, the hybrid battery temperature prediction system needs machine learning techniques to identify the relationship between the battery’s future temperature and its current state. Figure 13 presents a schematic of the machine learning model required in the hybrid battery temperature prediction system. As shown in the figure, three inputs are considered here: (A) the ambient temperature, (B) battery’s surface temperature at the present time, and (C) the amount of heat generated inside the battery. The only output is shown by T, which is the battery temperature predicted within a finite time horizon. This study uses an Adaptive Neuro Fuzzy Inference System (ANFIS) to achieve this goal.
ANFIS is a powerful and flexible tool that can be used to model and predict complex systems with several input and output variables and unknown relationships between them. It combines the advantages of fuzzy logic and neural networks to build a hybrid system that can handle crisp and fuzzy data. ANFIS was born in 1993 based on the first-order Takagi–Sugeno fuzzy model proposed by Jang [40]. After several years of development, ANFIS is now a well-known artificial intelligence technique used in a wide range of applications [41]. Generally, ANFIS uses either backpropagation or a combination of least-squares estimation and backpropagation for membership function parameter estimation [42]. Fuzzy logic is a mathematical technique that deals with uncertainty and imprecision in data. Using linguistic variables and fuzzy sets allows for approximate reasoning and inference. On the other hand, the neural network is a machine learning algorithm that can learn complex patterns and relationships in the data. ANFIS combines these two techniques by using fuzzy if–then rules to represent the input–output relationships and neural networks to learn the parameters of the rules. For example:
- Rule 1: if x is A1 and y is B1, then f1 = p1 x + q1 y + r1.
- Rule 2: if x is A2 and y is B2, then f2 = p2 x + q2 y + r2.
Each rule consists of a set of antecedent and consequent parts, where the antecedent part represents the input variables x and y. The consequent part f represents the output variable. The antecedent part is usually a fuzzy set, and the consequent part is a linear or nonlinear function of the input variables.
The learning algorithm ANFIS focuses on adjusting the parameters of the fuzzy if–then rules to minimise the error between the predicted and the actual outputs. This is carried out using a combination of gradient descent optimisation and the least-squares method. The gradient descent algorithm adjusts the parameters of the network in the direction of the negative gradient of the error function. At the same time, the least-squares method finds the optimal values of the parameters that minimise the sum of the squared errors [43].
In this study, as shown in Figure 13, three main inputs are used by the ANFIS model. The first one is the ambient temperature, a directly measurable variable. The second input is the battery’s temperature at present. This is also directly measurable in real time. The third input, which is the most complicated one, estimates the heat generated inside the battery within a predefined historical window. Both the electrical and thermal models, discussed in the previous section, are used to estimate the heat generation in real time according to the state of the battery as well as the history of charge/discharge. Having all the inputs, the ANFIS model is trained to learn how to predict the temperature change within the prediction horizon.
For the training of the ANFIS model, it is crucial to separate the data into training and testing sets to evaluate the algorithm’s performance on new unseen data. Figure 14 shows an example of data division into the following three groups: training, checking, and testing. Several tests were performed at different ambient temperatures and then a training dataset was built using all of them. Around 50% of the whole data were used for training and checking to design and prepare the ANFIS model. As a result, the ANFIS model could have access to a wide range of test data recorded at various ambient temperatures. For testing, we used the remaining data case by case as presented in the following sections.
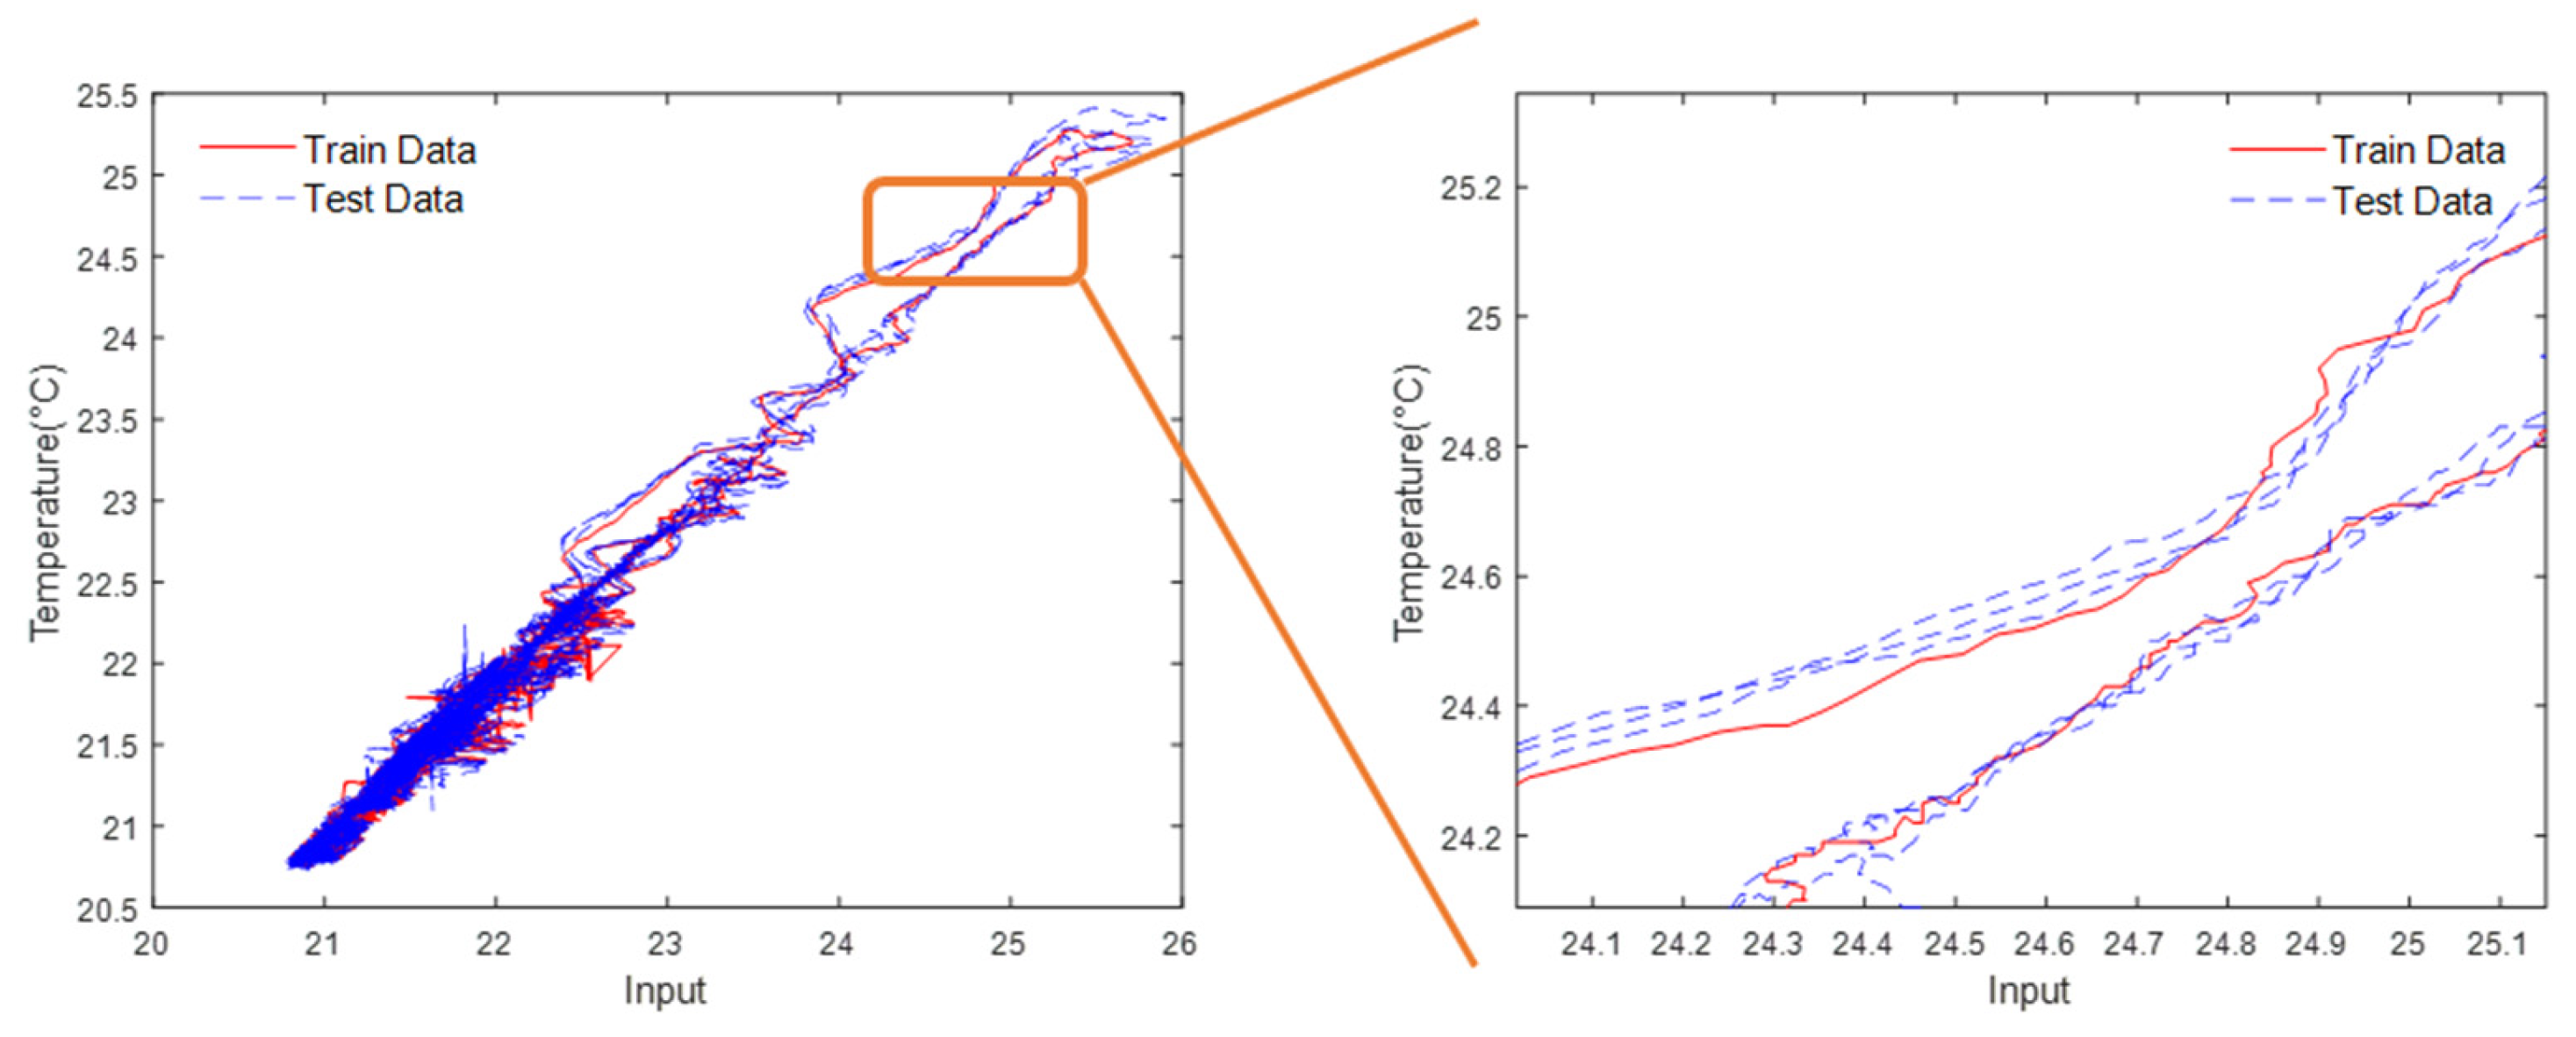
Figure 15 demonstrates the training and testing data in one place to highlight their similarities and differences. All datasets are independent and entirely different from each other, ensuring that the model is unbiased towards the training data. During the training phase, ANFIS learns the patterns and relationships in the training data to make the predictions later. However, it is essential to evaluate the model’s performance on new unseen data to determine its generalisation ability under any unique situation. Performing rigorous testing and evaluation on this diverse dataset can ensure the accuracy and reliability of the ANFIS model for predicting the battery temperature, as discussed in Section 4.
3.4. Model Performance Evaluation, Test Reliability, and Consistency Assessment
The battery temperature prediction topic does not have any standard for accuracy. It is vital to demonstrate a proper way of processing test data and propose a performance evaluation method for the proposed battery temperature prediction system. First, the system’s performance is evaluated using the test data collected at various ambient temperatures ranging from 10 °C to 30 °C for a fresh cell under the WLTP test profile.
Standard statistical measures are used to evaluate the accuracy and reliability of the proposed battery temperature prediction system, such as mean absolute error (MAE), maximum error, and root-mean-square error (RMSE). The MAE provides an average absolute difference between the predicted and the actual temperature values, which can be used to determine how well the model performs overall. The maximum error provides the highest absolute difference between the predicted and the actual temperatures, which can help to identify any potential outliers or errors in the predictions. In addition, RMSE provides a more comprehensive picture of the model’s accuracy by taking into account the squared differences between the predicted and the actual temperature values, which can help identify any biases in the predictions. The MAE and RMSE formulations are presented below:
By evaluating the performance of the ANFIS model using these statistical methods, it is possible to identify any areas where the model is underperforming and make improvements to increase its accuracy and reliability. This can involve adjusting the parameters of the fuzzy if–then rules, collecting more data to improve the training of the model, or using different input variables to capture the underlying patterns in the data better.
Test Uncertainty Analysis (TUA) is a crucial process used to estimate and evaluate any uncertainty’s potential sources and magnitudes in a measurement or testing process. In this research, the accuracy of the test data is essential, as the data will be used in the machine learning model for training and testing, which highly depends on the quality of the data. TUA identifies and qualifies the sources of uncertainty that can arise and affect the accuracy of the measurements.
In battery testing, potential sources of uncertainty can be attributed to various factors, including the accuracy of the measurement devices, environmental conditions like changes in the ambient temperature, sample variability due to the noise, and inevitable operator errors. Once the uncertainty sources have been identified, the potential impact on measured data can be estimated and analysed using statistical methods. TUA aims to provide a comprehensive understanding of the uncertainties associated with the battery test measurement process and provide a robust characteristic for the battery temperature prediction model in this research.
This analysis makes every effort to control the sources of uncertainty. The test operation procedure is refined, and the test rig is calibrated to ensure the accuracy of the measurements. An analysis of all the uncertainty sources and their solutions is provided below:
- Data measurement accuracy: the power supply is calibrated before the test to ensure it provides accurate power to the battery. Multi-thermocouples are attached to the battery surface to avoid thermocouple failure or inconsistencies in quality. To minimise computational effort, the average temperature data value is taken from all thermocouples, with a temperature difference threshold of Δ ≤ 0.2 °C between them. This approach helped to reduce computational complexity while still providing accurate temperature data. Furthermore, all data acquisition equipment is synchronised at a 1 Hz sampling rate, ensuring that the data collection is consistent and precise.
- Noise reduction: the battery and the rack are kept in the thermal chamber with a metal shell to reduce electromagnetic interference. To minimise the impact of vibration from the thermal chamber during testing, fire-resistant foam is added under the battery rack to absorb any potential vibration. Maintaining a consistent ambient temperature during testing is essential for obtaining accurate and reliable data. Keeping the battery in the thermal chamber allows it to control the ambient temperature and minimise the impact of external factors on the battery’s performance.
- Improved environmental conditions: while the thermal chamber can precisely control the ambient temperature with a quick response, the battery temperature may not shift as efficiently as expected. To ensure accurate temperature measurements, the battery is left in the thermal chamber for at least two hours before each test to allow the battery temperature to reach the same level as the ambient temperature. One factor that could not be controlled is the humidity level inside the chamber. However, the thermal chamber is equipped with a ventilation system to maintain relatively dry conditions inside the chamber.
Test repeatability is essential to ensure consistency and reproducibility in the test results obtained from multiple measurements or trials of the same item or system under the same test condition. In this research, test repeatability is crucial as the test data are applied for a machine learning-based model to avoid the model being trained explicitly for a single cell.
To ensure test repeatability, two identical NCA cells are tested under the same test conditions, including the same current profile, ambient temperature, and test equipment. Figure 16 compares the voltage responses between two identical cells under the same test profile. Figure 17 shows a similar comparison of the two cells’ temperatures under the same test. According to the results, both figures demonstrate significant overlaps between the curves. Statistical methods are used for repeatability evaluation, and the comparison results are presented in Table 3 as a percentage of values. By analysing the repeatability of the test results, it is possible to ensure the consistency and reliability of the data used in the machine learning-based models. The test repeatability analysis is not only essential to ensure the consistency and reproducibility of the test results but also to prove the robustness of the hybrid battery temperature prediction model. If the prediction result accuracy remains high level despite various battery characteristics, it indicates that the model is robust and reliable in real-world applications. As battery cell consistency is a frequent issue in battery pack applications, it is crucial to have a robust temperature prediction model that can handle various battery characteristics.
4. Battery Temperature Prediction Results
To evaluate the proposed battery temperature prediction system, experimental tests were conducted at different ambient temperatures. Each test consisted of several cycles from fully charged to fully discharged states. The WLTP current profile was utilised during the discharge stage to mimic the battery’s real-world usage. To better see the results obtained from the tests, only one cycle is shown in each figure. It should be noted that each discharge cycle might include several repeats of the WLTP profile until the battery is fully depleted. The following sections present and discuss the prediction results for both cases of the NCA cells and the LFP cells separately.
An important point here is that the ANFIS model is not retrained each time when switching between different ambient temperatures. The model is trained once for each cell chemistry (i.e., NCA and LFP), and then it is validated under different scenarios.
4.1. NCA Battery Temperature Prediction Results
The first set of validation results comprises a comparison between the NCA battery’s predicted temperature and the reference temperature 30 s ahead at an ambient temperature of 10 °C. As shown in Figure 18, there is a high degree of overlap between the predicted and the reference temperatures. Furthermore, Table 4 presents statistical measures obtained in this case. The MAE, which measures the average magnitude of the errors, confirms the overall accuracy of the prediction model, while the max error and RMSE provide insights into the degree of deviation between the predicted and actual temperatures. Notably, the RMSE indicates that the temperature prediction closely follows the real battery surface change with no significant outliers.
The second validation case contains the same results at 20 °C. As depicted in Figure 19, the predicted and the reference temperatures exhibit a high degree of overlap, indicating the accuracy of the prediction model. The statistical measures, presented in Table 4, further reinforce this finding under this ambient temperature too.
The third validation case similarly shows the effectiveness of the proposed model at 30 °C. The results are demonstrated in Figure 20 and Table 4.
The prediction results obtained from the three above-mentioned validation cases demonstrate that the proposed battery surface temperature prediction system is highly effective for a fresh NCA cell under various ambient temperatures. All the results were related to a 30 s prediction horizon. Although the 30 s time window is sufficient for the EV application safety concerns because this study is readily applicable to other applications such as aerospace, further validation case studies were conducted to challenge the proposed prediction model with longer prediction horizons. Table 5 includes the prediction errors for the cases of 60 s and 90 s prediction horizons. Looking at the results, although the errors are slightly higher than in the case of the 30 s prediction horizon, they are still deficient in terms of system reliability. The MAE is around 0.12 °C even at 90 s ahead.
4.2. LFP Battery Temperature Prediction Results
To check if the proposed battery temperature system works for any battery, the same analysis was performed here on the LFP cells introduced in Section 3.1. It should be noted that the ANFIS model is trained again for the LFP cell; however, it was performed only once, which means we did not need to retrain it when switching between different ambient temperatures or various duty cycles, etc.
The first validation test on the LFP cells was performed at 0 °C, where the goal was to predict the cell’s surface temperature 30 s ahead. According to the results presented in Figure 21, there is a good agreement between the predicted temperature and the reference temperature in this case. Some points slightly deviate from the reference value around the highest temperature area and the outcome is very similar to the previous instances of the NCA cell temperature prediction. Upon conducting statistical analysis, presented in Table 6, it was found that both MAE and RMSE measures show an excellent level of accuracy on average whereas the maximum error reaches 2.47 °C in this case. Therefore, these findings prove that the proposed temperature prediction method is generally reliable even for other types of cells if it has already been trained with the relevant data.
The second and third validation cases of the LFP cell’s surface temperature prediction under the WLTP test were performed at 10 °C and 20 °C, respectively. Figure 22 and Figure 23 show the predicted temperature versus the reference temperature values in the two cases, which again demonstrates an excellent match between the two curves. According to Table 6, the maximum error is less than 1 °C in both cases, which is much better than in the previous case. These comparative results are also similar to what was already observed for the NCA cells.
5. Conclusions
A new battery temperature prediction methodology was developed by combining an online battery model identification technique with an ANFIS model. Temperature prediction results were compared against experimental data obtained from the NCA and LFP cells. The validation tests were repeated at different ambient temperatures to ensure the system worked under various conditions. In addition, the prediction horizon was changed from 30 s to 90 s to measure the sensitivity of the method to that factor. As is the case for all types of predictors, a longer prediction horizon leads to an increase in the prediction errors; however, according to the results, the prediction accuracy remained relatively low (i.e., MAE = 0.12 °C) even at 90 s ahead. Another observation for both the NCA and LFP cells was that the prediction errors were higher at lower ambient temperatures. This is a good result because the risk of high battery temperatures usually becomes more critical when the ambient temperature is also high. According to the results, the proposed method showed its best performance at the highest temperatures.
Overall, the proposed battery temperature prediction system has proven to be a highly practical and versatile tool. It not only performs exceptionally well for a particular cell but also maintains a consistently high level of accuracy across other battery types. This is a crucial feature, as batteries come in various shapes and sizes, and their thermal behaviour can differ significantly depending on their composition and environmental conditions. Therefore, the proposed system’s potential to significantly improve the performance and safety of the batteries was demonstrated, making it an up-and-coming tool for future research and development in the field of energy storage and advanced battery management systems. Accurate temperature prediction is essential for battery safety and effective battery operation in various industries, such as electric vehicles, renewable energy storage, and consumer electronics. The proposed methodology, which includes a combination of battery model identification and an ANFIS model, provides a robust and efficient way of predicting battery temperature in real-world applications. Although the effectiveness of the proposed system was demonstrated for an automotive application, the method is expected to work in other applications, too. The findings of this study have potential implications in all industries that rely on battery thermal management systems. By accurately predicting battery temperature, the proposed system could enhance the safety and functionality of a battery system, ensuring that it operates within its safe temperature range to reduce the risk of thermal runaway.
Author Contributions
H.Z. and A.F.; Methodology, A.F.; Software, H.Z.; Validation, H.Z.; Formal analysis, H.Z. and A.F.; Investigation, H.Z.; Resources, M.L.; Data curation, M.L.; Writing—original draft, H.Z.; Writing—review & editing, A.F. and D.J.A.; Visualization, H.Z.; Supervision, A.F.; Funding acquisition, A.F. and D.J.A. All authors have read and agreed to the published version of the manuscript.
Funding
This work was funded by the UKRI Faraday Battery Challenge project called Next Generation LFP Cathode Material (NEXLFP). In addition, Abbas Fotouhi acknowledges funding from the Faraday Institution (Industrial Fellowships FIIF-003 and FIIF-014).
Data Availability Statement
The data presented in this study will be available on request from the corresponding author and from CORD at https://doi.org/10.17862/cranfield.rd.25334458, after an embargo period (i.e., 1 February 2029).
Conflicts of Interest
Author Matt Lowe was employed by the company Delta Cosworth. The remaining authors declare that the research was conducted in the absence of any commercial or financial relationships that could be construed as a potential conflict of interest.
References
- Ma, S.; Jiang, M.; Tao, P.; Song, C.; Wu, J.; Wang, J.; Deng, T.; Shang, W. Temperature effect and thermal impact in lithium-ion batteries: A review. Prog. Nat. Sci. Mater. Int. 2018, 28, 653–666. [Google Scholar] [CrossRef]
- Lu, Z.; Yu, X.L.; Wei, L.C.; Cao, F.; Zhang, L.Y.; Meng, X.Z.; Jin, L.W. A comprehensive experimental study on temperature-dependent performance of lithium-ion battery. Appl. Therm. Eng. 2019, 158, 113800. [Google Scholar] [CrossRef]
- Yi, F.; Jiaqiang, E.; Zhang, B.; Zuo, H.; Wei, K.; Chen, J.; Zhu, H.; Zhu, H.; Deng, Y. Effects analysis on heat dissipation characteristics of lithium-ion battery thermal management system under the synergism of phase change material and liquid cooling method. Renew. Energy 2022, 181, 472–489. [Google Scholar] [CrossRef]
- Xu, C.; Feng, X.; Huang, W.; Duan, Y.; Chen, T.; Gao, S.; Lu, L.; Jiang, F.; Ouyang, M. Internal temperature detection of thermal runaway in lithium-ion cells tested by extended-volume accelerating rate calorimetry. J. Energy Storage 2020, 31, 101670. [Google Scholar] [CrossRef]
- Zhang, X.; Li, Z.; Luo, L.; Fan, Y.; Du, Z. A review on thermal management of lithium-ion batteries for electric vehicles. Energy 2022, 238, 121652. [Google Scholar] [CrossRef]
- Pesaran, A.A.; Vlahinos, A.; Burch, S.D. Thermal Performance of EV and HEV Battery Modules and Packs; National Renewable Energy Laboratory: Golden, CO, USA, 1997.
- Motloch, C.G.; Christophersen, J.P.; Belt, J.R.; Wright, R.B.; Hunt, G.L.; Sutula, R.A.; Duong, T.; Tartamella, T.J.; Haskins, H.J.; Miller, T.J. High-Power Battery Testing Procedures and Analytical Methodologies for HEV’s; SAE Technical Paper; SAE International: Warrendale, PA, USA, 2002. [Google Scholar]
- Zhao, R.; Zhang, S.; Liu, J.; Gu, J. A review of thermal performance improving methods of lithium ion battery: Electrode modification and thermal management system. J. Power Sources 2015, 299, 557–577. [Google Scholar] [CrossRef]
- Bandhauer, T.M.; Garimella, S.; Fuller, T.F. A Critical Review of Thermal Issues in Lithium-Ion Batteries. J. Electrochem. Soc. 2011, 158, R1. [Google Scholar] [CrossRef]
- Wu, W.; Ma, R.; Liu, J.; Liu, M.; Wang, W.; Wang, Q. Impact of low temperature and charge profile on the aging of lithium-ion battery: Non-invasive and post-mortem analysis. Int. J. Heat Mass Transf. 2021, 170, 121024. [Google Scholar] [CrossRef]
- Na, Y.; Sun, X.; Fan, A.; Cai, S.; Zheng, C. Methods for enhancing the capacity of electrode materials in low-temperature lithium-ion batteries. Chin. Chem. Lett. 2021, 32, 973–982. [Google Scholar] [CrossRef]
- Jaguemont, J.; Boulon, L.; Dubé, Y. A comprehensive review of lithium-ion batteries used in hybrid and electric vehicles at cold temperatures. Appl. Energy 2016, 164, 99–114. [Google Scholar] [CrossRef]
- Zhang, Z.; Yu, W.; Li, H.; Wan, W.; Zhang, W.; Zhuo, W.; Liu, Q. Heat transfer characteristics and low-temperature performance of a lithium-ion battery with an inner cooling/heating structure. Appl. Therm. Eng. 2023, 219, 119352. [Google Scholar] [CrossRef]
- Shahid, S.; Chaab, M.A. A review of thermal runaway prevention and mitigation strategies for lithium-ion batteries. Energy Convers. Manag. X 2022, 16, 100310. [Google Scholar] [CrossRef]
- Rao, Z.; Wang, S. A review of power battery thermal energy management. Renew. Sustain. Energy Rev. 2011, 15, 4554–4571. [Google Scholar] [CrossRef]
- Ludwig, S.; Steinhardt, M.; Jossen, A. Determination of Internal Temperature Differences for Various Cylindrical Lithium-Ion Batteries Using a Pulse Resistance Approach. Batteries 2022, 8, 60. [Google Scholar] [CrossRef]
- Leising, R.A.; Palazzo, M.J.; Takeuchi, E.S.; Takeuchi, K.J. A study of the overcharge reaction of lithium-ion batteries. J. Power Sources 2001, 97–98, 681–683. [Google Scholar] [CrossRef]
- Feng, F.; Teng, S.; Liu, K.; Xie, J.; Xie, Y.; Liu, B.; Li, K. Co-estimation of lithium-ion battery state of charge and state of temperature based on a hybrid electrochemical-thermal-neural-network model. J. Power Sources 2020, 455, 227935. [Google Scholar] [CrossRef]
- Li, M.; Dong, C.; Li, X.; Dong, X.; Mu, Y.; Jia, H. A Sequential Network-model Alliance Module for Lithium-ion Battery Temperature Prediction. In Proceedings of the 2022 IEEE Energy Conversion Congress and Exposition (ECCE), Detroit, MI, USA, 9–13 October 2022. [Google Scholar]
- Billert, A.M.; Frey, M.; Gauterin, F. A Method of Developing Quantile Convolutional Neural Networks for Electric Vehicle Battery Temperature Prediction Trained on Cross-Domain Data. IEEE Open J. Intell. Transp. Syst. 2022, 3, 411–425. [Google Scholar] [CrossRef]
- Park, S.; Ahn, C. Stochastic Model Predictive Controller for Battery Thermal Management of Electric Vehicles. In Proceedings of the 2019 IEEE Vehicle Power and Propulsion Conference (VPPC), Hanoi, Vietnam, 14–17 October 2019. [Google Scholar]
- Wang, M.; Hu, W.; Jiang, Y.; Su, F.; Fang, Z. Internal temperature prediction of ternary polymer lithium-ion battery pack based on CNN and virtual thermal sensor technology. Int. J. Energy Res. 2021, 45, 13681–13691. [Google Scholar] [CrossRef]
- Fang, K.; Mu, D.; Chen, S.; Wu, B.; Wu, F. A prediction model based on artificial neural network for surface temperature simulation of nickel–metal hydride battery during charging. J. Power Sources 2012, 208, 378–382. [Google Scholar] [CrossRef]
- Willard, J.; Jia, X.; Xu, S.; Steinbach, M.; Kumar, V. Integrating Scientific Knowledge with Machine Learning for Engineering and Environmental Systems. ACM Comput. Surv. 2022, 55, 66. [Google Scholar] [CrossRef]
- Wu, B.; Zhang, B.; Deng, C.; Lu, W. Physics-encoded deep learning in identifying battery parameters without direct knowledge of ground truth. Appl. Energy 2022, 321, 119390. [Google Scholar] [CrossRef]
- E. Board. EV Markets Reports. August 2023. Available online: https://evmarketsreports.com/lfp-batteries-transforming-ev-market-dynamics-globally/ (accessed on 22 November 2023).
- EUR-Lex. Worldwide Harmonised Light-Duty Vehicles Test Procedure (WLTP) and Real Driving Emissions (RDE). 1 September 2023. Available online: https://eur-lex.europa.eu/EN/legal-content/summary/worldwide-harmonised-light-duty-vehicles-test-procedure-wltp-and-real-driving-emissions-rde.html (accessed on 1 December 2023).
- Pavlovic, J.; Marotta, A.; Ciuffo, B. CO2 emissions and energy demands of vehicles tested under the NEDC and the new WLTP type approval test procedures. Appl. Energy 2016, 177, 661–670. [Google Scholar] [CrossRef]
- Johnson, V.H. Battery performance models in ADVISOR. J. Power Sources 2002, 110, 321–329. [Google Scholar] [CrossRef]
- Fotouhi, A.; Auger, D.J.; Propp, K.; Longo, S. A Study on Battery Model Parametrisation Problem—Application-Oriented Trade-offs between Accuracy and Simplicity. IFAC PapersOnLine 2016, 49, 48–53. [Google Scholar] [CrossRef]
- Fotouhi, A.; Auger, D.J.; Propp, K.; Longo, S.; Wild, M. A review on electric vehicle battery modelling: From Lithium-ion toward Lithium–Sulphur. Renew. Sustain. Energy Rev. 2016, 56, 1008–1021. [Google Scholar] [CrossRef]
- Shateri, N.; Auger, D.J.; Fotouhi, A.; Brighton, J. An Experimental Study on Prototype Lithium–Sulfur Cells for Aging Analysis and State-of-Health Estimation. IEEE Trans. Transp. Electrif. 2021, 7, 1324–1338. [Google Scholar] [CrossRef]
- Fotouhi, A.; Auger, D.J.; Propp, K.; Longo, S. Accuracy Versus Simplicity in Online Battery Model Identification. IEEE Trans. Syst. Man Cybern. Syst. 2018, 48, 195–206. [Google Scholar] [CrossRef]
- Shateri, N.; Shi, Z.; Auger, D.J.; Fotouhi, A. Lithium-Sulfur Cell State of Charge Estimation Using a Classification Technique. IEEE Trans. Veh. Technol. 2021, 70, 212–224. [Google Scholar] [CrossRef]
- Shateri, N.; Auger, D.J.; Fotouhi, A.; Brighton, J.; Du, W. Investigation of the Effect of Temperature on Lithium-Sulfur Cell Cycle Life Performance Using System Identification and X-ray Tomography. Batter. Supercaps 2022, 5, e202200035. [Google Scholar] [CrossRef]
- Sato, N. Thermal behavior analysis of lithium-ion batteries for electric and hybrid vehicles. J. Power Sources 2001, 99, 70–77. [Google Scholar] [CrossRef]
- Bernardi, D.; Pawlikowski, E.; Newman, J. A General Energy Balance for Battery Systems. J. Electrochem. Soc. 1985, 132, 5. [Google Scholar] [CrossRef]
- Schuster, E.; Ziebert, C.; Melcher, A.; Rohde, M.; Seifert, H.J. Thermal behavior and electrochemical heat generation in a commercial 40 Ah lithium ion pouch cell. J. Power Sources 2015, 286, 580–589. [Google Scholar] [CrossRef]
- Bai, Y.; Li, L.; Li, Y.; Chen, G.; Zhao, H. Reversible and irreversible heat generation of NCA/Si–C pouch cell during electrochemical energy-storage process. J. Energy Chem. 2019, 29, 95–102. [Google Scholar] [CrossRef]
- Jang, J.S. ANFIS: Adaptive-network-based fuzzy inference system. IEEE Trans. Syst. Man Cybern. 1993, 23, 665–685. [Google Scholar] [CrossRef]
- Keller, J.M.; Krishnapuram, R.; Rhee, F.H. Evidence aggregation networks for fuzzy logic inference. IEEE Trans. Neural Netw. 1992, 3, 761–769. [Google Scholar] [CrossRef] [PubMed]
- Jang, J.S.R.; Sun, C.T.; Mizutani, E. Neuro-Fuzzy and Soft Computing-A Computational Approach to Learning and Machine Intelligence [Book Review]. IEEE Trans. Autom. Control 1997, 42, 1482–1484. [Google Scholar] [CrossRef]
- Şişman Yilmaz, N.A. A Temporal Neuro-Fuzzy Approach for Time-Series Analysis. Master’s Thesis, Middle East Technical University, Ankara, Turkey, 2003. [Google Scholar]
Figure 1.
The proposed concept of battery temperature prediction using direct measurements and real-time system identification.
Figure 1.
The proposed concept of battery temperature prediction using direct measurements and real-time system identification.

Figure 2.
Samsung NCA cylindrical cells.

Figure 3.
RS Pro LFP cells.

Figure 4.
Configuration of the battery test setup.

Figure 5.
WLTP driving cycle.

Figure 6.
Simulated WLTP battery load current profile.

Figure 7.
Battery load current, terminal voltage, and temperature signals recorded during a WLTP test.
Figure 7.
Battery load current, terminal voltage, and temperature signals recorded during a WLTP test.

Figure 8.
Rint model.

Figure 9.
Thevenin model.

Figure 10.
The internal resistance of the NCA cell identified during the WLTP test.

Figure 11.
OCV online identification results at various temperatures.

Figure 12.
OCV offline identification results at various temperatures.

Figure 13.
Machine learning input/output configuration for battery temperature prediction.

Figure 14.
An example division of the data into the three groups of training, checking, and testing.
Figure 14.
An example division of the data into the three groups of training, checking, and testing.

Figure 15.
Investigation of the training and testing data used for ANFIS training and validation.

Figure 16.
Voltage comparison between two identical NCA cells under the same test.

Figure 17.
Temperature comparison between two identical NCA cells under the same test.

Figure 18.
The NCA battery temperature prediction validation 30 s ahead during the WLTP test at 10 °C.
Figure 18.
The NCA battery temperature prediction validation 30 s ahead during the WLTP test at 10 °C.

Figure 19.
The NCA battery temperature prediction validation 30 s ahead during the WLTP test at 20 °C.
Figure 19.
The NCA battery temperature prediction validation 30 s ahead during the WLTP test at 20 °C.

Figure 20.
The NCA battery temperature prediction validation 30 s ahead during the WLTP test at 30 °C.
Figure 20.
The NCA battery temperature prediction validation 30 s ahead during the WLTP test at 30 °C.

Figure 21.
The LFP cell’s temperature prediction 30 s ahead during the WLTP test at 0 °C.

Figure 22.
The LFP cell’s temperature prediction 30 s ahead during the WLTP test at 10 °C.
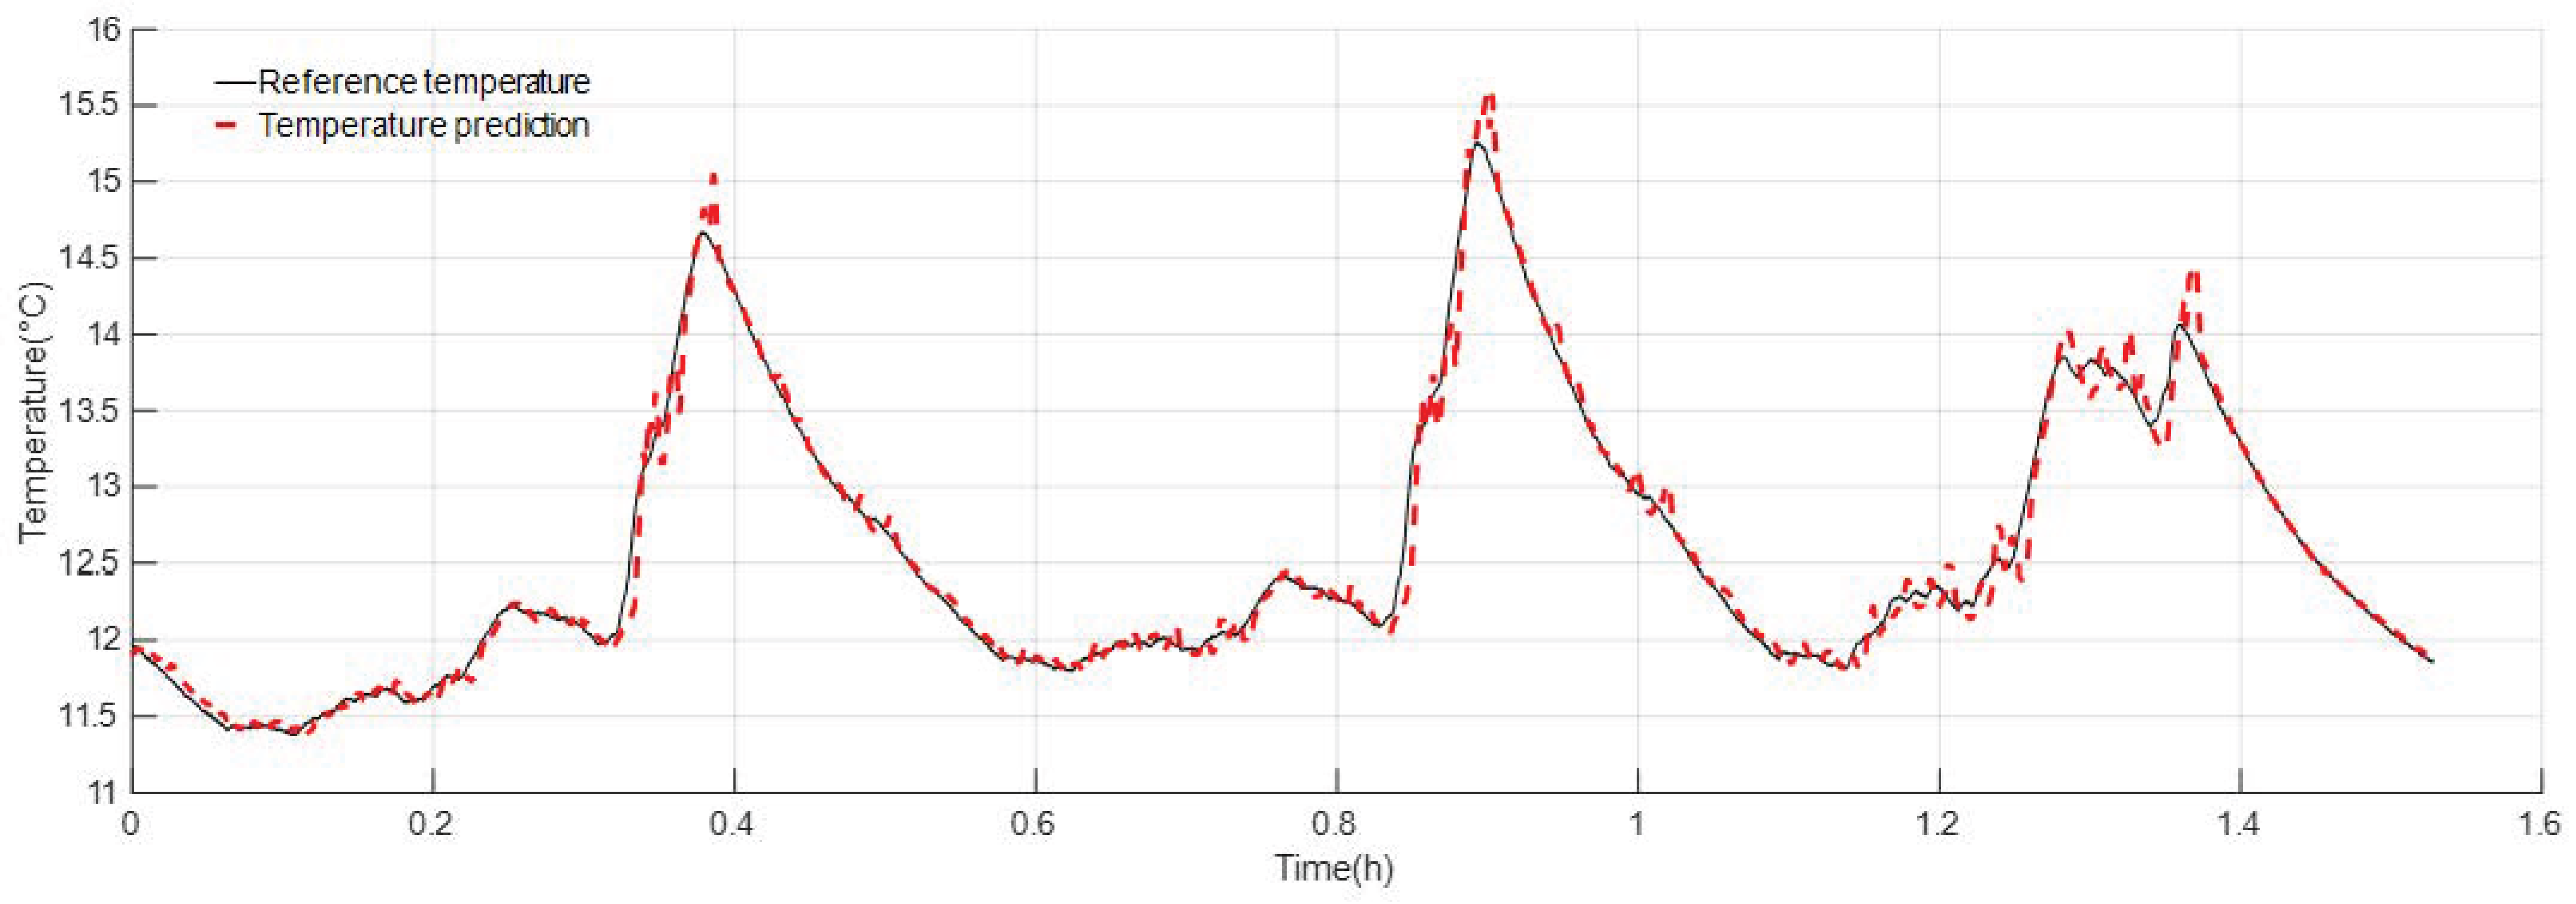
Figure 23.
The LFP cell’s temperature prediction 30 s ahead during the WLTP test at 20 °C.


Table 1.
Specifications of the NCA cell.
| Parameter | Value |
|---|---|
| Rated capacity (mAh) | 4800 mAh |
| Nominal voltage (V) | 3.62 V |
| Max charging voltage (V) | 4.2 V |
| Cut-off voltage | 2.5 V |
| Operating temperature (surface) (°C) | Charge: 0 to 45 Discharge: −30 to 60 |
| Standard discharging current | 0.2 C |
| Standard charging current | C/3 |
| Maximum discharge rate | 2 C |
| Maximum charge rate | 1 C |
| Peak discharging current (30 s, 10 s) @ SOC 50% | 42 A, 54 A |
Table 2.
RS Pro LFP cell specifications.
| Item | Value | Note | |
|---|---|---|---|
| Standard capacity | 3200 mAh | 0.5 C (current value of 3200 mAh at 1 C) | |
| Capacity range | 3100~3300 mAh | 0.5 C | |
| Standard voltage | 3.2 V | ||
| Alternating internal resistance | ≤30 mΩ | With PTC | |
| Charge conditions | Cut-off voltage | 3.65 ± 0.05 V | Constant current charge to 3.65 V at 0.5 C Constant voltage charge to stop until 0.01 C mA |
| Cut-off current | 0.01 C | ||
| Discharge cut-off voltage | 2.5 V | ||
| Cycle characteristic | 2000 times | 100% DOD, the residual capacity is no less than 80% of rated capacity at 1 C-rate | |
| Max. continuous discharge current | 9.6 A | ||
| Pulse discharge current | 15 A, 10 s | ||
| Working temperature | Charge: 0~55 °C Discharge: −20~60 °C | ||
| Storage temperature | −20–45 °C | ||
| Battery weight | 86 g (approx.) | ||
Table 3.
Statistical evaluation of the voltage and temperature signals recorded from two identical NCA cells under the same test.
Table 3.
Statistical evaluation of the voltage and temperature signals recorded from two identical NCA cells under the same test.
| Cell Group | Current Profile | RMSE of Voltage | RMSE of Temperature |
|---|---|---|---|
| Cell 1 and Cell 2 | WLTP | 0.0599 | 0.2651 |
Table 4.
Statistical evaluation of the NCA battery temperature prediction errors 30 s ahead during the WLTP test at various temperatures.
Table 4.
Statistical evaluation of the NCA battery temperature prediction errors 30 s ahead during the WLTP test at various temperatures.
| Test Scenario | MAE | Maximum Error | RMSE |
|---|---|---|---|
| WLTP at 10 °C | 0.0369 | 0.7708 | 0.0655 |
| WLTP at 20 °C | 0.0374 | 0.5729 | 0.0862 |
| WLTP at 30 °C | 0.0488 | 0.6390 | 0.0922 |
Table 5.
Statistical evaluation of the NCA battery temperature prediction errors 60 and 90 s ahead during the WLTP test 20 °C.
Table 5.
Statistical evaluation of the NCA battery temperature prediction errors 60 and 90 s ahead during the WLTP test 20 °C.
| Test Scenario | MAE | Maximum Error | RMSE |
|---|---|---|---|
| 20 °C, 60 s ahead | 0.0765 | 1.1115 | 0.1203 |
| 20 °C, 90 s ahead | 0.1275 | 1.1812 | 0.1954 |
Table 6.
Statistical evaluation of the LFP cell’s temperature prediction errors 30 s ahead during the WLTP test at various temperatures.
Table 6.
Statistical evaluation of the LFP cell’s temperature prediction errors 30 s ahead during the WLTP test at various temperatures.
| Test Scenario | Average Error | Maximum Error | RMSE |
|---|---|---|---|
| WLTP at 0 °C | 0.1327 | 2.4744 | 0.2947 |
| WLTP at 10 °C | 0.0686 | 0.6954 | 0.1137 |
| WLTP at 20 °C | 0.0559 | 0.6266 | 0.0904 |
Disclaimer/Publisher’s Note: The statements, opinions and data contained in all publications are solely those of the individual author(s) and contributor(s) and not of MDPI and/or the editor(s). MDPI and/or the editor(s) disclaim responsibility for any injury to people or property resulting from any ideas, methods, instructions or products referred to in the content. |
© 2024 by the authors. Licensee MDPI, Basel, Switzerland. This article is an open access article distributed under the terms and conditions of the Creative Commons Attribution (CC BY) license (https://creativecommons.org/licenses/by/4.0/).
Share and Cite
MDPI and ACS Style
Zhang, H.; Fotouhi, A.; Auger, D.J.; Lowe, M. Battery Temperature Prediction Using an Adaptive Neuro-Fuzzy Inference System. Batteries 2024, 10, 85. https://doi.org/10.3390/batteries10030085
AMA Style
Zhang H, Fotouhi A, Auger DJ, Lowe M. Battery Temperature Prediction Using an Adaptive Neuro-Fuzzy Inference System. Batteries. 2024; 10(3):85. https://doi.org/10.3390/batteries10030085
Chicago/Turabian StyleZhang, Hanwen, Abbas Fotouhi, Daniel J. Auger, and Matt Lowe. 2024. "Battery Temperature Prediction Using an Adaptive Neuro-Fuzzy Inference System" Batteries 10, no. 3: 85. https://doi.org/10.3390/batteries10030085
Note that from the first issue of 2016, this journal uses article numbers instead of page numbers. See further details here.