
Effect of Aging Path on Degradation Characteristics of Lithium-Ion Batteries in Low-Temperature Environments

1
College of Mechanical and Energy Engineering, Beijing Laboratory of New Energy Vehicles and Key Laboratory of Regional Air Pollution Control, Beijing University of Technology, Beijing 100124, China
2
China Automotive Engineering Research Institute Co., Ltd., Chongqing 401122, China
*
Author to whom correspondence should be addressed.
Batteries 2024, 10(3), 107; https://doi.org/10.3390/batteries10030107
Submission received: 17 January 2024
/
Revised: 9 March 2024
/
Accepted: 14 March 2024
/
Published: 15 March 2024
(This article belongs to the Special Issue Battery Thermal Performance and Management: Advances and Challenges)
Abstract
:Typical usage scenarios for energy storage and electric vehicles (EVs) require lithium-ion batteries (LIBs) to operate under extreme conditions, including varying temperatures, high charge/discharge rates, and various depths of charge and discharge, while also fulfilling vehicle-to-grid (V2G) interaction requirements. This study empirically investigates the impact of ambient temperature, charge/discharge rate, and charge/discharge cut-off voltage on the capacity degradation rate and internal resistance growth of 18,650 commercial LIBs. The charge/discharge rate was found to have the most significant influence on these parameters, particularly the charging rate. These insights contribute to a better understanding of the risks associated with low-temperature aging and can aid in the prevention or mitigation of safety incidents.
1. Introduction
LIBs have widespread applications in various fields such as portable electronic devices, electric vehicles (EVs), stationary energy storage, and V2G interaction due to their high energy density, long lifecycle, high cycling stability, great flexibility [1], high operating voltage, lightweightedness, good environmental compatibility, and high power. They must charge and discharge efficiently under low-temperature and high-frequency conditions. The aging rate is minimal at 25 or 30 °C, but it increases tenfold below 20 °C [2]. The complex usage scenarios of EVs, stationary energy storage, and V2G interactions demand that they can handle high-rate charging and discharging in low-temperature environments. Furthermore, a timely understanding and prediction of their remaining useful life (RUL) [3], risk management for rapid charging and discharging, and prompt detection of battery failures [4] are essential. Therefore, it is crucial to study the effect of ambient temperature, charge/discharge rate, and charge/discharge cut-off voltage on their aging performance during cyclic aging [5].
The cathode and anode contribute to the formation of the primary and secondary solid electrolyte interface (SEI) layers, respectively, with the latter leading to a more significant decrease in battery capacity at low temperatures.
The degradation mechanism of LIBs varies with temperatures, with positive activation energy at high temperatures and negative activation energy at low temperatures. At high temperatures, the temperature influences the heat generation at the anode and the formation of an SEI film on the anode surface. Conversely, at low temperatures, it impacts the formation and capacity decay of secondary SEI films on the cathode surface. The number of LIBs inserted/de-inserted from the graphite layer decreases, and Li planting and dendrites become severe. Capacity degradation leads to reduced Coulombic efficiency, increased charge transfer resistance (Rct), larger polarization, partial deactivation of the graphite anode, and increased electrode resistance. The compatibility of the electrolyte with the separator and electrodes is compromised, thereby adversely impacting the formation of cathodic electrolyte interfaces (CEIs) and SEIs. Competitive “lithium plating” or “Li-ion deposition” reactions may occur due to the increased polarization of the graphite surface. Conventional electrolytes have a dendritic Li planting morphology, which is prone to side reactions and internal short circuits [6]. The loss of recyclable lithium due to Li planting is considered to be the key cause of battery degradation, and continuous Li planting may cause reversible capacity loss with partial capacity recovery [7]. In contrast, lithium depletion during the growth of the SEI layer due to Li planting is a major factor in the loss of reversible lithium reserves and active material [8], resulting in a rapid decrease in capacity. Lithium deposition on the anode not only leads to the aging of LIBs but also the deterioration of their thermal safety properties [9], which reduces the lifespan of the LIB [2].
Ohmic resistance dominates during normal temperature charge and discharge. At low temperatures, polarization resistance contributes the most to the increase in total resistance. The decrease in the voltage plateau may be due to the lower diffusivity of LIBs at low temperatures [10]. Charge/discharge time, internal resistance, and energy are non-homogeneous features reflecting the SOH of LIBs [1,11,12], but the mechanism of this capacity degradation and internal resistance growth is not well understood.
This study focuses on the aging characteristics of LIBs during cyclic aging at different ambient temperatures, charge/discharge rates, and charge/discharge cut-off voltages. We subjected LIBs to different ambient temperatures with high charge/discharge rates, varying charge/discharge rates, and cut-off voltages at low temperatures, and then analyzed their aging characteristics before and after aging.
2. Materials and Methods
The working routine of this paper is summarized in Figure 1. The LIB is a Sony cylindrical 18,650 commercial power LIB (Model: US18650VTC6, Singapore), and the experimental parameters are detailed in Table 1. After dismantling, it is observed that the anode material is identified as LiNi0.8Co0.15Al0.05O2, and the cathode is porous graphite. The battery is encased in a steel shell, and a pressure relief valve is installed at the anode to eliminate the gas generated inside.
The experimental device is shown in Figure 2, with a schematic overview provided in Figure 3. Initially, three charge/discharge cycles are executed at 25 °C to stabilize the initial capacity of the batteries prior to the deterioration study. Charging is conducted, employing the constant current–constant voltage (CC-CV) method, initially at a rate of 0.3 C, which then transitions to a constant voltage (CV) phase with a termination current set at 150 mA [2,13]. Discharging is carried out at a constant current (CC) of 0.3 C, with the process halted when the voltage reaches 2.5 V.
The HPPC curve is measured at 25 °C before and after deterioration (Table 2). The change in voltage during relaxation is recorded to determine the charging internal resistance [14].
Firstly, the LIBs undergo cyclic aging at −20, −10, 0, 10, and 25 °C for 150 cycles (charging strategy: CC-CV, charging of 3 C, cut-off voltage of 4.20 V, and cut-off current of 0.05 C; discharging strategy: CC, discharging of 3 C, and cut-off voltage of 2.50 V) (Table 3). Capacity tests and HPPC tests are conducted every 25 cycles during the deterioration study at 25 °C.
Subsequently, the LIBs are subjected to aging at an ambient temperature of −20 °C, charged at various constant current and voltage rates (0.25, 0.33, 0.50, 0.66, 1.00, 1.50, and 3.00 C), and discharged at a constant current rate of 3.00 C for 150 cycles to investigate the effect of different charging rates on the aging characteristics of LIBs and the effect of different charging rates on the aging characteristics of LIBs. Similarly, constant-current discharge at different discharge rates (0.33, 0.50, 0.66, 1.00, 1.50, and 3.00 C), constant-current/constant-voltage charging at a 3.00 C charge rate, and cyclic aging for 150 cycles are used to explore the effects of different discharge rates on the aging characteristics of LIBs (Table 4). During the deterioration study, capacity tests and HPPC tests of the batteries are measured at 25 °C after every 25 cycles.
Finally, the LIBs are charged at the ambient temperature of −20 °C with a 1.00 C constant current and at various charging cut-off voltages (3.80, 4.00, 4.10, and 4.20 V), and discharged at the same discharging cut-off voltage of 2.50 V with a 1.00 C constant current for 150 cycles to investigate the effects of different charging cut-off voltages on the aging characteristics of the LIBs. Conversely, different discharge cut-off voltages (2.50, 3.00, 3.20, and 3.40 V) are used while charging at a constant current (1.00 C) and voltage at a cut-off voltage of 4.20 V and cycled 150 times to examine the impact of different discharge cut-off voltages on the aging characteristics of the LIBs (Table 5). During the deterioration study, capacity tests and HPPC tests of the batteries are measured at 25 °C after every 25 cycles.
All charging and discharging processes are conducted using a battery tester (CT-ZWJ4’S-T-1U, CT-4008-5V12A-DB and CA-4008-1U-VT, NEWARE, Shenzhen, China), a low-temperature test chamber (DW-40, YUEQIA, Shanghai, China), and a constant temperature and humidity box (ETH-1000, JOOWRY, Suzhou, China). Three samples are operated simultaneously under identical conditions to ensure reproducibility.
3. Results and Discussion
3.1. Capacity Degradation Rate
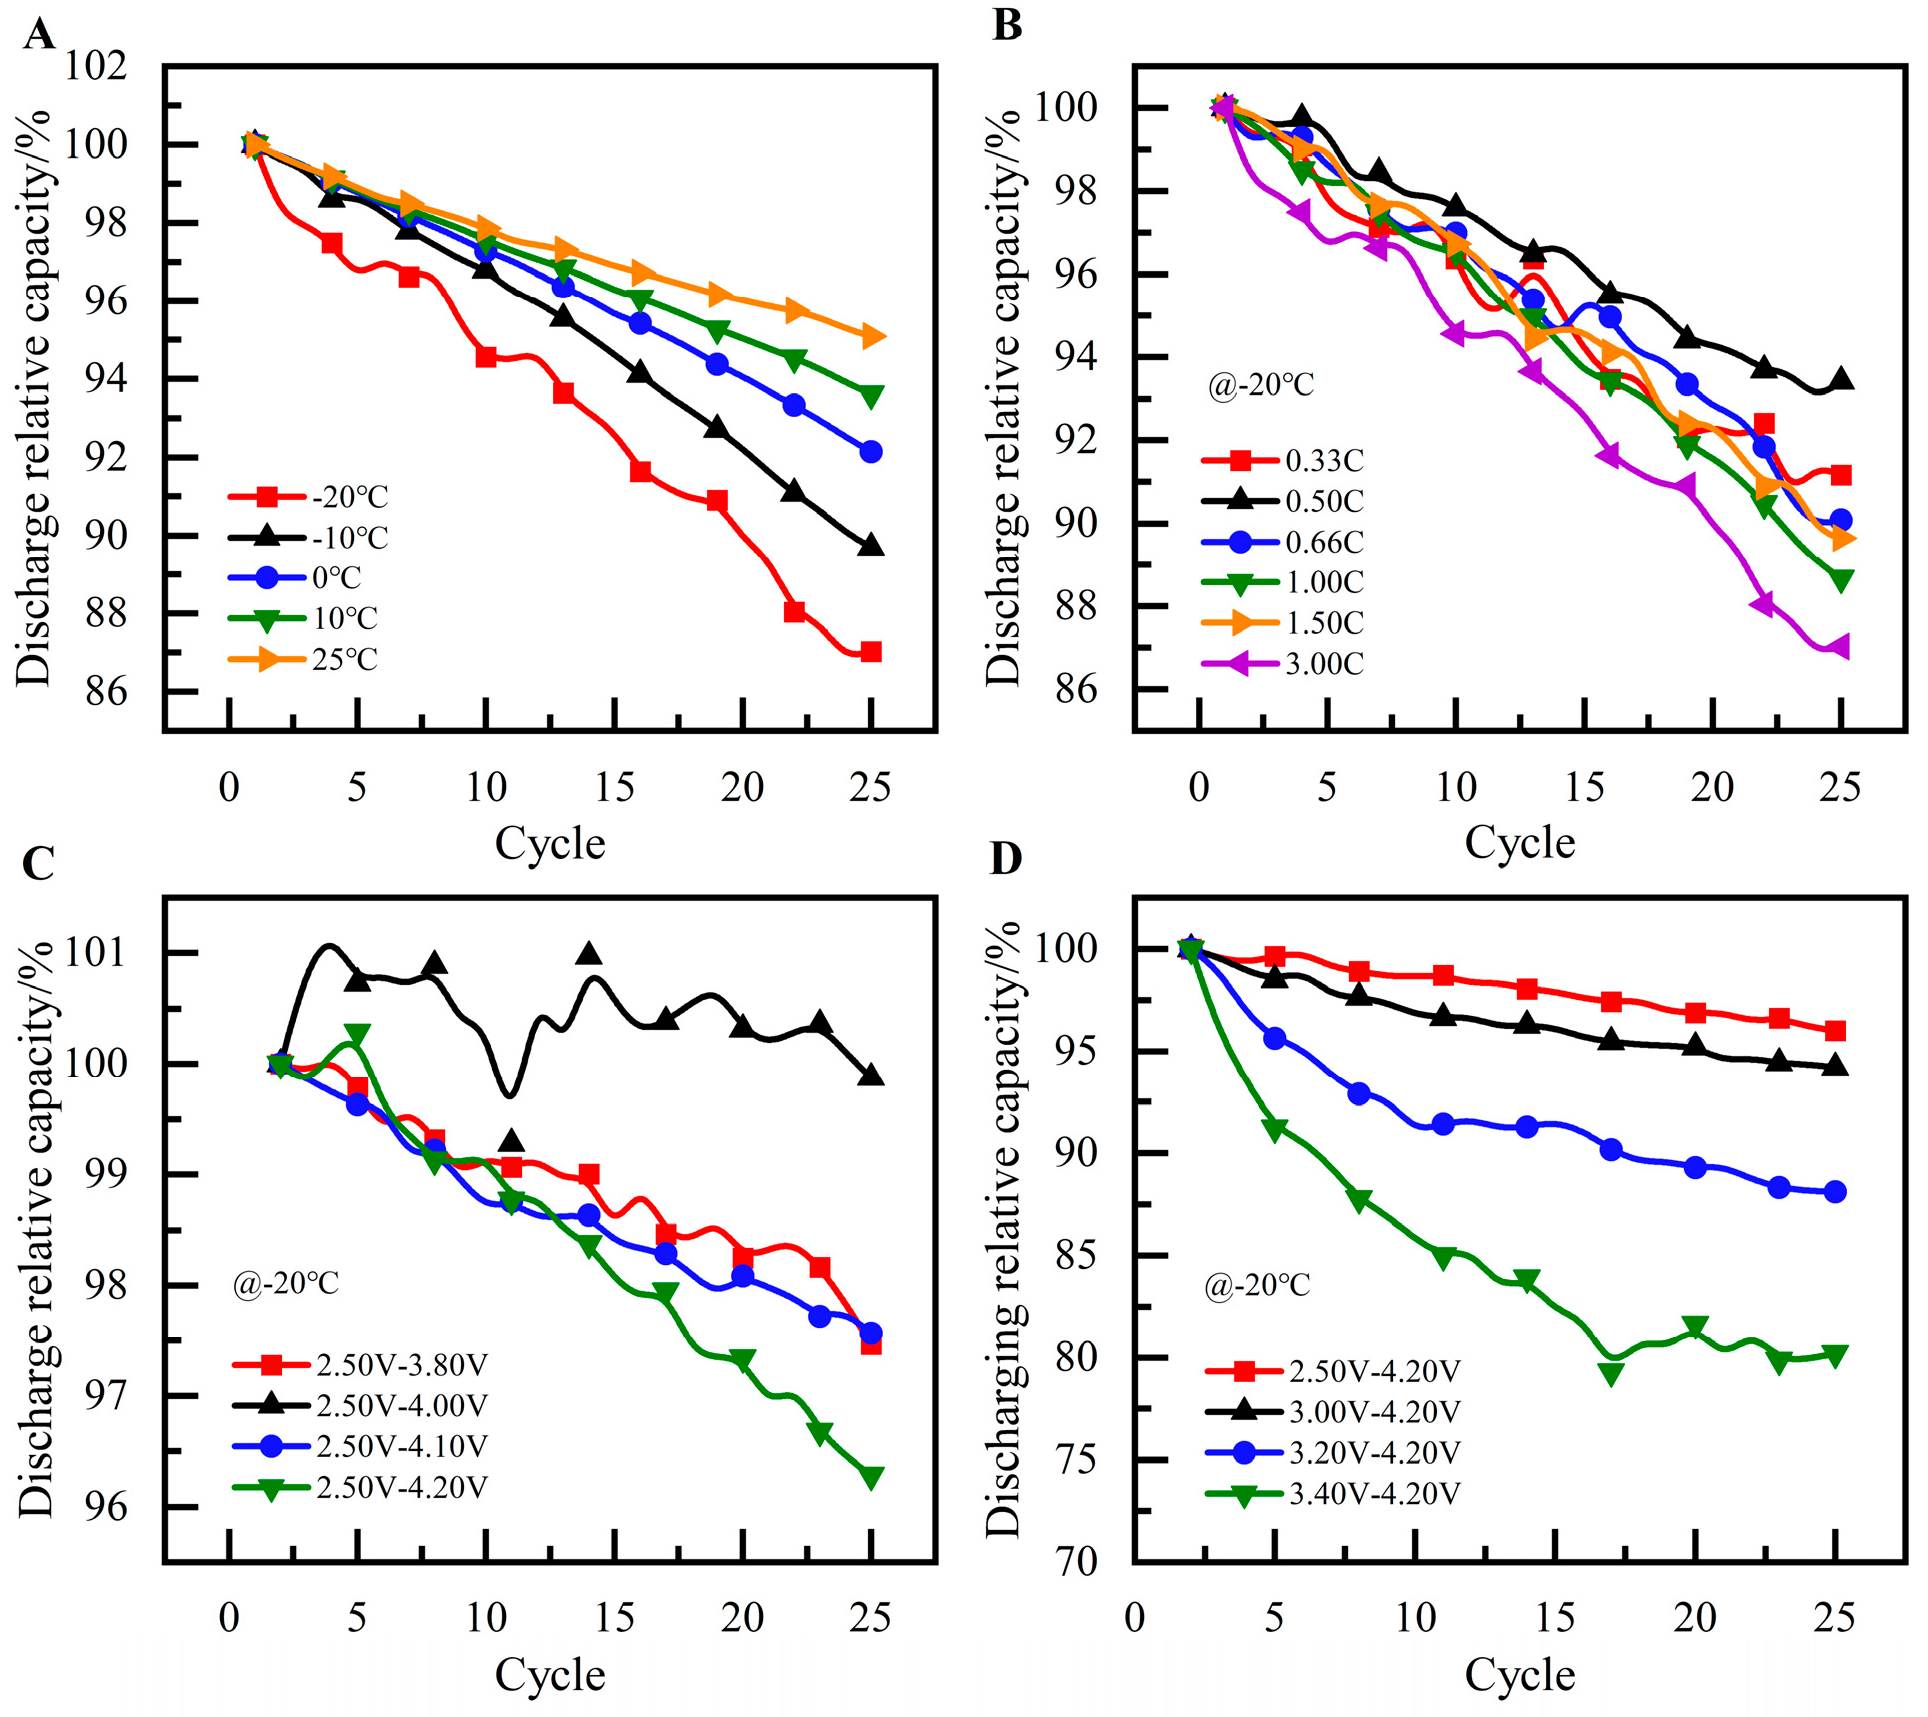
Before the experiment, the samples are discharged at 25 °C/0.3 C down to 2.50 V. Given the pronounced polarization at low temperatures, the initial charge capacity of the LIBs is elevated. Consequently, the second capacity measurement is utilized as a baseline for analyzing the degradation of charge/discharge capacity across various ambient temperatures (refer to Figure 4A and Figure 5A). The initial charge/discharge capacity of LIBs at −20 °C, under various rates and cut-off voltages, is deemed normal and serves as a benchmark for subsequent degradation analysis. Moreover, the charge/discharge capacity of LIBs at −20 °C exhibits a significant instability, likely due to severe polarization. The LIBs reach the charge/discharge cut-off voltage swiftly, resulting in a time-independent capacity. The accumulation of uncharged or undischarged capacity leads to a marginal increase in the subsequent charge/discharge capacity. Over time, the charge/discharge capacity at low temperatures declines with the progression of aging, as illustrated in Figure 4 and Figure 5.
When charging at high rates below room temperature (25 °C), lithium coating on the battery graphite anode is significant. The precipitation of lithium on the graphite surface impedes lithium insertion into the graphite layer, leading to rapid capacity degradation after low-temperature charging and discharging [15]. In contrast, lithium metal accumulated on the graphite surface partially dissipates during the relaxation process post-charging or post-discharging, resulting in a slight recovery of battery capacity [16,17]. Despite minimal formation of the SEI on the electrode surface during degradation, it is not assumed to be the primary cause of capacity loss due to mechanical changes. However, the exact cause of irreversible capacity degradation remains unclear, with the main contributors being partial deactivation of the graphite anode and increased electrode resistance. The formation of a secondary SEI layer on the anode during high-speed charging at low temperatures reduces the lithium insertion/de-insertion within the anode during charge/discharge cycling, thus diminishing battery capacity [2]. Aging below 25 °C is attributed to lithium deposition at the negative electrode, consuming available lithium by reacting with the electrolyte, while degradation above 25 °C is due to cathode degradation [18]. Since 3.00 C at −20 °C represents the power pole for energy storage devices [11], the maximum charge/discharge rate examined in this study is 3.00 C.
Lithium anode planting is a significant side reaction in LIBs, greatly impacting battery capacity and safety. The loss of recyclable lithium due to lithium planting is considered to be a primary cause of battery degradation [7]. Furthermore, the lower the temperature, the faster the capacity degradation [13].
The lithium deposition rate is non-linearly correlated with the charging rate, and the reversible conversion rate of deposited lithium back into LIBs is independent of the amount deposited (Table 6, Figure 4A and Figure 5A) [11,13,19]. At a charging rate of 0.25 C to 0.66 C at −20 °C, the relative capacity decreases more rapidly with an increasing rate. This is because rapid charging at low temperatures reduces lithium embedding in the anode, leading to lithium metal precipitation and rapid capacity degradation. The larger the charging rate, the quicker the capacity decline. When the charging rate is between 1.00 and 1.50 C, the substantial charging current generates significant internal heat, thinning the electrolyte and enhancing battery activity, which slows down capacity degradation. It is even lower than the charging rate under 0.33 C. After 25 cycles of aging at a 3.00 C rate, the LIBs could only achieve a charge of 2396.9 mAh, approximately 85.7% of the initial capacity. This is primarily due to the low ambient temperature and the excessive charging current, both of which severely degrade LIBs performance at low temperatures. Irreversible side reactions between LIBs and the electrolyte during charging and discharging lead to rapid capacity degradation and performance deterioration (Figure 4B).
Du et al. [2] observed that at −20 °C, a battery with a 1.3 C charge rate could not be charged due to lithium–ion interaction reactions caused by excessively fast charging rates. They also found that at lower temperatures, charging at rates of 0.7 and 1.0 C was challenging. In a −20 °C environment, with a discharge rate of 0.33~0.50 C, the larger the rate, the slower the relative capacity degradation. This phenomenon may be due to enhanced battery activity from internal heat generation when charging at a low rate. When the discharge rate exceeds 0.50 C, the relative capacity decreases more rapidly with increasing rate (Figure 5B).
At −20 °C, the relative capacity for charging and discharging decreases more quickly with higher charging cut-off voltages, aligning with the principle that deeper charging and discharging lead to faster capacity degradation during cyclic aging (Table 7). Notably, the relative capacity of LIBs aged within a voltage range of 2.50~4.00 V does not depend on the cycle count (Figure 4C and Figure 5C). This could be attributed to severe polarization in the low-temperature environment, causing unstable changes in LIB charging and discharging capacity, with less obvious patterns of change.
Compared with the changes in cyclic charge/discharge capacity under various charge cut-off voltages at −20 °C, the changes under different discharge cut-off voltages exhibit greater stability and a clearer pattern. As the cycle count increases, the relative capacity of LIBs at low temperatures progressively diminishes. A smaller voltage range correlates with a more rapid decline in relative capacity at low temperatures (refer to Table 8 and Table 9, Figure 4D and Figure 5D). This suggests that the discharge cut-off voltage exerts a more pronounced influence on the charging relative capacity of LIBs.
Capacity degradation at low temperatures is slower during deep charging and discharging, significantly affecting LIB performance. The internal resistance is high, and substantial heat is generated inside the battery to activate its performance during low-temperature charging and discharging. Limited heat generation during shallow charging and discharging results in slower capacity degradation at −20 °C. However, this does not imply that the residual capacity of LIBs aged in deep charge/discharge cycles degrades more slowly.
Figure 5 indicates that the capacity degradation after 150 cycles of aging at 25 °C/0.3 C is equivalent to the change after 40 cycles at −20 °C/0.3 C, suggesting that low-temperature environments accelerate LIB capacity degradation (Figure 6A).
Figure 6B indicates that temperature is crucial for LIB capacity degradation, and charging and discharging should be avoided at low temperatures. Under a discharge rate of 0.33~1.00 C, the larger the rate, the slower the capacity degradation. For discharge rates of 0.33~0.66 C, the degradation rate is similar. At a 1.50 C discharge rate, the large current increases internal heat production and battery activity. The capacity degradation speed is about 1.5 times the discharge rate, and the capacity degradation speed is about 2 times the capacity degradation. When applying the 1.50 C discharge rate, the internal heat generation of the battery increases due to the large discharge current, and the battery activity increases. The capacity degradation rate is lower than the 1.00 C discharge rate. When applying a 3.00 C discharge rate, the excessive current exacerbates battery polarization, leading to rapid capacity degradation (Figure 6C).
At −20 °C, higher charging cut-off voltages accelerate capacity degradation, while lower discharge cut-off voltages have the same effect. The capacity degradation after 150 cycles of aging in a 2.50~3.80 V range is equivalent to about 20 cycles in a 2.50~4.20 V range, indicating that deep charging accelerates LIB capacity degradation (Figure 6D).
The capacity of LIBs aged for 150 cycles at 1.00 C within a 3.40~4.20 V range is 87.0% of the initial capacity, equivalent to the capacity change after approximately 70 cycles in a 2.50~4.20 V range. This also suggests that deep discharging accelerates capacity degradation. It is noteworthy that the capacity degradation rates for LIBs aged in 3.00~4.20 V and 3.20~4.20 V ranges are nearly identical. However, at −20 °C, the capacity of LIBs with a 3.00 cut-off voltage is about 70 times that of 3.20 V. The charging capacity with a 3.00 cut-off voltage is 1.25 times that of 3.20 V, and the discharging capacity with a 3.00 cut-off voltage is 1.29 times that of 3.20 V (Figure 6D,E).
In a low-temperature environment, excessively high discharge cut-off voltages and excessively low charge cut-off voltages can prevent LIBs from constant-current charging. This not only reduces charging and discharging capacity but also accelerates capacity degradation. Therefore, it is recommended that the charging cut-off voltage for LIBs should not exceed 4.00 V, and the discharging cut-off voltage can be set at 3.00 V. The polarization phenomenon primarily influences the relative charging and discharging capacity degradation rate, with charging and discharging cut-off voltages having the most significant impact.
3.2. Charge/Discharge Curves
The capacity of batteries diminishes more significantly at low temperatures compared with at room temperature conditions [2]. The stripping of lithium metal results in a shoulder in the discharge curve (Figure 7), suggesting a potential correlation between this shoulder and lithium deposition during charging. The persistence of the shoulder may be attributed to an increased occurrence of lithium planting during charging [17,20]. Furthermore, the extension of the discharge voltage plateau may be related to the formation of lithium dendrites.
In low-temperature environments, the lithium-ion battery (LIB) displays severe polarization when charged at 3.00 C. During the initial charging at −20 °C, the battery voltage rapidly reaches the 4.20 V constant voltage stage. As the charging proceeds, substantial heat is generated within the LIB, resulting in a rise in temperature and improved internal activity. The voltage is reduced and enters the constant current charging stage, and eventually returns to the constant voltage charging stage as the charging capacity continues to increase.
In the range of −20~25 °C, as the ambient temperature decreases, the higher the charging voltage plateau, the more obvious the polarization phenomenon becomes. Less capacity can be charged during the constant current charging stage, and the total charging capacity decreases. At the 25th charging in the −20 °C environment, the voltage plateau changes significantly, and the battery can only be charged at a constant voltage. At the 150th charging cycle, the charging voltage plateau of the LIB increases overall, indicating that the polarization phenomenon in the aging battery is more obvious, and the batteries cycling under −10 and −20 °C can only be charged at a constant voltage. The batteries cycling under 0 °C can only be charged at a constant current for a short period, with a charging stage capacity of only 340 mAh. The constant voltage charging capacity is only 16.9% of the total charging capacity. The voltage plateau of the batteries cyclically aged under 10 °C and 25 °C increases significantly, and the chargeable battery capacity decreases significantly (Figure 7A–C).
During rapid discharge at a 3 C rate in low-temperature conditions, the initial voltage reduction of the battery becomes increasingly noticeable with increased aging. Due to this significant voltage drop, if the voltage falls below 2.50 V, the battery struggles to complete the discharge. Additionally, the maximum voltage recovery for the 1st and 150th discharges of batteries aged at −20 °C are 3.59 V and 3.26 V, respectively (refer to Figure 8A–C). This also suggests that aged batteries are unsuitable for high-rate charging and discharging at this temperature.
The voltage drop during the initial discharge stage becomes more pronounced as the ambient temperature decreases. In a low-temperature environment, the battery’s internal polarization resistance is higher, leading to a large amount of heat generation during high-rate discharge, which enhances the battery’s internal activity and causes the voltage to rise. However, the amount of power that can be discharged in a low-temperature environment is reduced.
In the −20 °C low-temperature environment, a higher charging rate results in a higher voltage plateau and more intense polarization. At −20 °C, the initial charge at a 3.00 C rate shows a larger charging capacity during the first charge, reaching 2797.4 mAh. This could be attributed to the increased internal resistance due to battery polarization in the low-temperature environment. The high charging current leads to greater heat production, enhancing activity and allowing for more energy to be charged. However, the capacity of LIBs under high charging rates also degrades more rapidly. After 25 cycles, the capacity under a 3.00 C high rate is less than that under a 1.50 C rate. In the 25th cycle, the voltage of LIBs at the beginning of the charging stage gradually stabilizes, which may be because new batteries have not yet formed a stable SEI layer, leading to unstable performance. As the cycle count increases, the voltage plateau during charging rises significantly, and the capacity available during the constant-current charging stage decreases gradually (refer to Figure 7D–F).
Similarly, the first discharge at a 3.00 C discharge rate exhibits the highest capacity due to improved internal battery activity from internal heat generation. As the discharge progresses, the recoverable discharge voltage amplitude also increases. With increased aging, the recoverable voltage amplitude at high discharge rates becomes more pronounced, and the polarization phenomenon during discharge becomes increasingly evident (refer to Figure 8D–F).
LIBs that undergo aging cycles between 2.5 and 3.8 V are primarily constrained to constant voltage charging due to the significant polarization that occurs under low-temperature conditions. This polarization leads to a rapid rise in charging voltage to the cut-off voltage at the beginning of the charging process. However, when the charging cut-off voltage is set at 4.0 V or higher, the polarization is somewhat mitigated by the heat generated within the batteries, enabling them to charge at a higher capacity during the constant current phase. As the charging cut-off voltage is raised, the capacity charged during the constant current phase also increases, resulting in a higher total charging capacity (refer to Table 10, Figure 7G–I).
During low-temperature discharge, LIBs exhibit a substantial polarization phenomenon, characterized by a significant voltage drop. The LIB exhibits a large polarization phenomenon with a significant voltage plunge, and more capacity is discharged at high charge cut-off voltages due to the higher charging capacity (refer to Table 10, Figure 8G–I).
When the discharge cut-off voltage is set below 3.20 V, the internal activity of the battery, enhanced by the temperature rise, is boosted. This can help to reduce polarization to a certain extent, allowing for an extended constant-current charging process, particularly before the 25th charge cycle. However, as aging progresses and polarization worsens, the heat-induced activity enhancement is insufficient to lower the battery’s voltage. Despite this, maintaining a cyclic discharge cut-off voltage below 3.20 V allows the battery to still experience a period of constant-current charging (refer to Table 11, Figure 7J–L).
The discharge capacity of LIBs diminishes as the discharge cut-off voltage is raised, due to reduced charging efficiency. As aging progresses, the difference in discharge curves for LIBs with different discharge cut-off voltages becomes more pronounced, with polarization effects playing a more significant role at the same starting voltage (refer to Table 11, Figure 8J–L).
3.3. Growth Rate of Internal Resistance
When LIBs are charged and discharged in a low-temperature environment, the increase in electrolyte viscosity leads to a gradual decrease in conductivity and the decomposition of the electrolyte, resulting in increased impedance of the solid electrolyte interphase (SEI) layer formed on the graphite negative electrode. If the LIBs are charged at this condition, a large number of lithium precipitation phenomena will occur. Lithium in and out of the deposit will be irreversibly stripped, forming a large amount of dead lithium. This phenomenon ultimately reduces the capacity of the battery or even results in the failure of the battery. At the same time, if the formed lithium dendrites puncture the diaphragm, it may bring serious safety hazards [9,21,22].
The average internal resistance is selected as the mean value of ohmic internal resistance, polarization internal resistance, and total internal resistance of LIBs obtained after 25 cycles of different aging paths relative to new batteries in the commonly used interval of 20–80% SOC. In the temperature range of 0–25 °C, the ohmic internal resistance of the LIBs increases significantly with decreasing temperature (Figure 9A). This increase may be attributed to the severe lithium precipitation from the graphite surface of LIBs at low temperatures. The precipitated lithium reacts with the electrolyte, leading to the deposition of its products and formation of the solid electrolyte interface.
The deposition of these products leads to an increase in the thickness of SEI. The lower the temperature, the more obvious the increase in the thickness of the SEI layer, resulting in a significant rise in ohmic internal resistance. At the low temperature, the large internal polarization resistance of the battery results in a large amount of heat generated inside the battery. The activity of the battery is enhanced, and the conductivity of the electrolyte increases, which slows down the growth of the ohmic internal resistance [7].
The cyclic charge/discharge rate significantly impacts the internal resistance of LIB at low temperatures. Since severe lithium precipitation occurs on the anode surface of LIBs in the low-temperature environment, the precipitated lithium reacts with the electrolyte. The product deposition results in SEI thickness and the ohmic internal resistance increases. When the charging rate increases to 0.66 C, the increased heat generation within the battery enhances battery activity and improves conductivity of the electrolyte, leading to a slower increase in ohmic internal resistance. As the charging rate increases further, despite the high charging rates, the internal activity of the battery is significantly enhanced. The rapid charging at low temperatures results in thickening of the SEI layer, leading to a more rapid increase in internal resistance (Figure 9B).
Under the low-temperature environment of −20 °C, the polarization internal resistance grows faster with the increase in charging rate in the range of 0.25 to 0.66 C. The growth rate of the polarization internal resistance exceeds two times the growth rate of the ohmic internal resistance in this charging rate range (Figure 10B), indicating a severe polarization phenomenon in the lithium-ion battery (LIB) after low-temperature cycling aging.
In the charging range of 0.25~0.50 C, the larger the charging, the faster the growth of the total internal resistance. Specifically, the total internal resistance increases by 6.0% and 9.1%, respectively. After undergoing 150 cycles of aging at 0.25 and 0.50 C, a pattern similar to that of the ohmic internal resistance emerges, with a slight decrease in the growth rate of the total internal resistance observed at a charging rate of 0.66 C. The growth rate of total internal resistance at 1.00 and 1.50 C is similar to that at 0.50 C, both increasing by about 9.1% (Figure 11B).
Under the low-temperature environment of −20 °C, under the discharge rate ranging from 0.33 to 0.66 C, it is observed that the ohmic internal resistance decreases as the discharge rate increases (Figure 9C). It may be attributed to the fact that the total internal resistance of LIBs is larger under a low-temperature of −20 °C. The higher discharge current generates more heat within the battery, thereby increasing battery activity and electrolyte conductivity, making the ohmic internal resistance growth slower.
Under the charging rate of 1.00~3.00 C, with the increase in the charging rate, the ohmic internal resistance gradually increases. The higher discharge rate significantly boosts the internal activity of the battery. As the discharge rate increases, the growth rate of polarization resistance and total resistance slows down, which may be attributed to the more pronounced polarization phenomenon occurring inside the rapidly discharged battery under low-temperature conditions. The growth rates of both polarized internal resistance and total internal resistance gradually accelerate when the discharge rate falls within the range of 1.00~3.00 C (Figure 10B,C and Figure 11B,C).
When the batteries are charged and discharged cyclically at different discharge rates in a low-temperature environment, higher charge currents result in more pronounced capacity degradation and internal resistance growth across different discharge rates. The effect of the charge rates on the capacity degradation and internal resistance growth of the LIBs is more pronounced compared with the discharge rates. Higher charging and discharging rates accelerate the aging process of LIBs, with the charging rate serving as the decisive factor in the degree of aging.
The ohmic internal resistance of lithium-ion batteries exhibits a pattern of initial decrease followed by an increase during cyclic aging in a low-temperature environment. After 25 cycles, the ohmic internal resistance of LIBs reaches its minimum value. As the aging process proceeds, the ohmic internal resistance of lithium-ion batteries decreases with the charging cut-off voltage in the ranges of 2.50~4.00 V, 2.50~4.10 V, and 2.50~4.20 V, and with the charging cut-off voltage decreasing. The growth rate of the ohmic internal resistance of the LIB gradually accelerates as the charging cut-off voltage decreases.
Nevertheless, due to the large decrease in the ohmic internal resistance after the initial 25 cycles of aging, in accordance with the law, the internal resistance gradually increases as the depth of charging and discharging continues to increase. However, in the case of LIBs aged within the voltage range of 2.50 to 3.80 V, due to the small charging and discharging voltage interval, the LIB can only be charged at the constant voltage in this voltage range. Similarly, in the voltage range of 2.50~4.00 V, 2.50~4.10 V, and 2.50~4.20 V, the polarization resistance of LIB increases with the deepening of the aging degree. The larger the charge/discharge interval, the more rapid the polarization resistance increases. For LIBs aged within the range of 2.50 to 3.80 V, severe polarization results in only a 5.4% increase in polarization resistance after 150 cycles of aging. After 150 cycles of cycle aging in the voltage range of 2.50–4.20 V, the total internal resistance of the LIB increases by nearly 13.8% compared with the minimum internal resistance observed after 25 cycles (Figure 9D and Figure 10D).
After 25 cycles of cyclic aging, the ohmic internal resistance decreases to its minimum value. Subsequently, after 150 cycles of cyclic aging, the ohmic internal resistance increases relative to this minimum value (Table 12).
The increase in the charging and discharging depths lead to the growth of the ohmic internal resistance of the LIBs (Table 13). However, the growth rate of the polarization internal resistance of the LIB aged between 3.40 and 4.20 V reaches 7.7%. This increase can be attributed to the small charge/discharge interval and the presence of significant polarization, which cannot be eliminated by the short shelving time, resulting in large polarization internal resistance (Figure 9E and Figure 10E).
In addition, the main reason for the difference in the aging characteristics of LIBs due to the depth of charge/discharge is the length of the charge/discharge time and the increase in the activity inside the battery caused by heat generation. On the one hand, the charging and discharging time is shorter at lower charging and discharging depths, and the polarization and particle surface stresses caused by the charging and discharging currents are smaller. Moreover, only part of the lithium ions is repeatedly de-embedded between the positive and negative electrode materials during each charge/discharge cycle. The loss of active lithium is small. On the other hand, the larger internal resistance of polarization in LIBs during charging and discharging in low-temperature environments leads to the generation of significant heat when applying high currents, which leads to an increase in electrolyte conductivity and the enhancement of battery activity (Figure 11).
4. Conclusions
This study presents a comprehensive analysis of the capacity degradation and internal resistance increase in lithium-ion batteries (LIBs) undergoing cyclic aging at low temperatures, taking into account various factors such as ambient temperature, charge/discharge rates, and charge/discharge cut-off voltages. The key conclusions are summarized as follows:
- (1)
- The rate of capacity degradation and the growth rate of internal resistance are pivotal indicators for evaluating the cyclic aging performance of LIBs.
- (2)
- A reduction in ambient temperature, in conjunction with elevated charge/discharge rates and higher charge/discharge cut-off voltages, significantly accelerates the decline in relative charge/discharge capacity and the increase in internal resistance.
- (3)
- Among the factors examined, charge and discharge rates have the most significant influence on the rates of capacity degradation and internal resistance growth, with the charging rate exerting a more pronounced impact than the discharging rate.
Author Contributions
Conceptualization and methodology, C.J. and Y.L.; investigation, Y.W. and B.W.; writing—original draft preparation, Z.Z.; writing—review and editing, Z.Z. and D.L. All authors have read and agreed to the published version of the manuscript.
Funding
This work was financially supported by the National Natural Science Foundation of China (No. 52276097) and the “JBGS” Project of Inner Mongolia Autonomous Region, China (No. 2022JBGS0008).
Data Availability Statement
The data presented in this study are available on request from the corresponding author. The data are not publicly available due to that all individuals involved in this study have signed confidentiality agreements, prohibiting casual dissemination.
Conflicts of Interest
Author Bing Wang is employed by the China Automotive Engineering Research Institute Co., Ltd. The remaining authors declare that the research was conducted in the absence of any commercial or financial relationships that could be construed as a potential conflict of interest.
References
- Yang, Z.; Zhao, X.; Zhang, H. A Health Assessment Method for Lithium-Ion Batteries Based on Evidence Reasoning Rules with Dynamic Reference Values. Batteries 2024, 10, 26. [Google Scholar] [CrossRef]
- Du, Y.; Shironita, S.; Hosono, E.; Asakura, D.; Sone, Y.; Umeda, M. Differences in the deterioration behaviors of fast-charged lithium-ion batteries at high and low temperatures. J. Power Sources 2023, 556, 232513. [Google Scholar] [CrossRef]
- Feng, J.; Cai, F.; Li, H.; Huang, K.; Yin, H. A data-driven prediction model for the remaining useful life prediction of lithium-ion batteries. Process Saf. Environ. Prot. 2023, 180, 601–615. [Google Scholar] [CrossRef]
- Ouyang, D.; Pang, Y.; Liu, B.; Wang, Z. An experimental investigation on thermal runaway features of lithium-ion cells under tunnel situations. Process Saf. Environ. Prot. 2024, 181, 26–32. [Google Scholar] [CrossRef]
- Azzam, M.; Endisch, C.; Lewerenz, M. Evaluating the Aging-Induced Voltage Slippery as Cause for Float Currents of Lithium-ion Cells. Batteries 2023, 10, 3. [Google Scholar] [CrossRef]
- Piao, N.; Gao, X.; Yang, H.; Guo, Z.; Hu, G.; Cheng, H.-M.; Li, F. Challenges and development of lithium-ion batteries for low temperature environments. eTransportation 2022, 11, 100145. [Google Scholar] [CrossRef]
- Zhang, G.; Wei, X.; Han, G.; Dai, H.; Zhu, J.; Wang, X.; Tang, X.; Ye, J. Lithium plating on the anode for lithium-ion batteries during long-term low temperature cycling. J. Power Sources 2021, 484, 229312. [Google Scholar] [CrossRef]
- Wu, W.; Ma, R.; Liu, J.; Liu, M.; Wang, W.; Wang, Q. Impact of low temperature and charge profile on the aging of lithium-ion battery: Non-invasive and post-mortem analysis. Int. J. Heat Mass Transf. 2021, 170, 121024. [Google Scholar] [CrossRef]
- Zhao, L.; Zheng, M.; Zhang, J.; Liu, H.; Li, W.; Chen, M. Numerical modeling of thermal runaway for low temperature cycling lithium-ion batteries. J. Energy Storage 2023, 63, 107053. [Google Scholar] [CrossRef]
- Wu, H.; Zhang, X.; Cao, R.; Yang, C. An investigation on electrical and thermal characteristics of cylindrical lithium-ion batteries at low temperatures. Energy 2021, 225, 120223. [Google Scholar] [CrossRef]
- Ji, Y.; Zhang, Y.; Wang, C.-Y. Li-Ion Cell Operation at Low Temperatures. J. Electrochem. Soc. 2013, 160, A636–A649. [Google Scholar] [CrossRef]
- Yang, Y.; Chen, S.; Chen, T.; Huang, L. State of Health Assessment of Lithium-ion Batteries Based on Deep Gaussian Process Regression Considering Heterogeneous Features. J. Energy Storage 2023, 61, 106797. [Google Scholar] [CrossRef]
- Landini, S.; O’Donovan, T.S. Experimental investigation of lithium-ion cells ageing under isothermal conditions for optimal lifetime performance. J. Energy Storage 2022, 48, 103680. [Google Scholar] [CrossRef]
- Białoń, T.; Niestrój, R.; Skarka, W.; Korski, W. HPPC Test Methodology Using LFP Battery Cell Identification Tests as an Example. Energies 2023, 16, 6239. [Google Scholar] [CrossRef]
- Li, Y.; Qian, K.; He, Y.-B.; Kaneti, Y.V.; Liu, D.; Luo, D.; Li, H.; Li, B.; Kang, F. Study on the reversible capacity loss of layered oxide cathode during low-temperature operation. J. Power Sources 2017, 342, 24–30. [Google Scholar] [CrossRef]
- Janakiraman, U.; Garrick, T.R.; Fortier, M.E. Review—Lithium Plating Detection Methods in Li-Ion Batteries. J. Electrochem. Soc. 2020, 167, 160552. [Google Scholar] [CrossRef]
- Yang, X.-G.; Ge, S.; Liu, T.; Leng, Y.; Wang, C.-Y. A look into the voltage plateau signal for detection and quantification of lithium plating in lithium-ion cells. J. Power Sources 2018, 395, 251–261. [Google Scholar] [CrossRef]
- Waldmann, T.; Wilka, M.; Kasper, M.; Fleischhammer, M.; Wohlfahrt-Mehrens, M. Temperature dependent ageing mechanisms in Lithium-ion batteries—A Post-Mortem study. J. Power Sources 2014, 262, 129–135. [Google Scholar] [CrossRef]
- von Lüders, C.; Zinth, V.; Erhard, S.V.; Osswald, P.J.; Hofmann, M.; Gilles, R.; Jossen, A. Lithium plating in lithium-ion batteries investigated by voltage relaxation and in situ neutron diffraction. J. Power Sources 2017, 342, 17–23. [Google Scholar] [CrossRef]
- Petzl, M.; Danzer, M.A. Nondestructive detection, characterization, and quantification of lithium plating in commercial lithium-ion batteries. J. Power Sources 2014, 254, 80–87. [Google Scholar] [CrossRef]
- Xia, Y.; Mathis, T.S.; Zhao, M.Q.; Anasori, B.; Dang, A.; Zhou, Z.; Cho, H.; Gogotsi, Y.; Yang, S. Thickness-independent capacitance of vertically aligned liquid-crystalline MXenes. Nature 2018, 557, 409–412. [Google Scholar] [CrossRef] [PubMed]
- Liu, X.M.; Arnold, C.B. Effects of Current Density on Defect-Induced Capacity Fade through Localized Plating in Lithium-Ion Batteries. J. Electrochem. Soc. 2020, 167, 130519. [Google Scholar] [CrossRef]
Figure 1.
Summary of the working routine.

Figure 2.
Experimental setup.

Figure 3.
Schematic profile of the experiment. Aging, capacity, and HPPC test.

Figure 4.
Variation in charge capacity over the initial 25 cycles at different (A) temperatures; (B) charge rates; (C) charge cut-off voltages; and (D) discharge cut-off voltages.
Figure 4.
Variation in charge capacity over the initial 25 cycles at different (A) temperatures; (B) charge rates; (C) charge cut-off voltages; and (D) discharge cut-off voltages.

Figure 5.
Variation in discharge capacity over the initial 25 cycles at different (A) temperatures; (B) discharge rates; (C) charge cut-off voltages; and (D) discharge cut-off voltages.
Figure 5.
Variation in discharge capacity over the initial 25 cycles at different (A) temperatures; (B) discharge rates; (C) charge cut-off voltages; and (D) discharge cut-off voltages.

Figure 6.
Capacity changes over the initial 150 cycles at different (A) temperatures; (B) charge rates; (C) discharge rates; (D) charge cut-off voltages; and (E) discharge cut-off voltages.
Figure 6.
Capacity changes over the initial 150 cycles at different (A) temperatures; (B) charge rates; (C) discharge rates; (D) charge cut-off voltages; and (E) discharge cut-off voltages.

Figure 7.
Capacity-voltage variation when charging at different (A–C) temperatures; (D–F) charge rates; (G–I) charge cut-off voltages; and (J–L) discharge cut-off voltages.
Figure 7.
Capacity-voltage variation when charging at different (A–C) temperatures; (D–F) charge rates; (G–I) charge cut-off voltages; and (J–L) discharge cut-off voltages.

Figure 8.
Capacity-voltage variation when discharging at different (A–C) temperatures; (D–F) charge rates; (G–I) charge cut-off voltages; and (J–L) discharge cut-off voltages.
Figure 8.
Capacity-voltage variation when discharging at different (A–C) temperatures; (D–F) charge rates; (G–I) charge cut-off voltages; and (J–L) discharge cut-off voltages.

Figure 9.
Effect of cyclic aging on ohmic internal resistance at different (A) temperatures; (B) charge rates; (C) discharge rates; (D) charge cut-off voltages; and (E) discharge cut-off voltages.
Figure 9.
Effect of cyclic aging on ohmic internal resistance at different (A) temperatures; (B) charge rates; (C) discharge rates; (D) charge cut-off voltages; and (E) discharge cut-off voltages.

Figure 10.
Effect of cyclic aging on polarization internal resistance at different (A) temperatures; (B) charge rates; (C) discharge rates; (D) charge cut-off voltages; and (E) discharge cut-off voltages.
Figure 10.
Effect of cyclic aging on polarization internal resistance at different (A) temperatures; (B) charge rates; (C) discharge rates; (D) charge cut-off voltages; and (E) discharge cut-off voltages.

Figure 11.
Effect of cyclic aging on total internal resistance at different (A) temperatures; (B) charge rates; (C) discharge rates; (D) charge cut-off voltages; and (E) discharge cut-off voltages.
Figure 11.
Effect of cyclic aging on total internal resistance at different (A) temperatures; (B) charge rates; (C) discharge rates; (D) charge cut-off voltages; and (E) discharge cut-off voltages.


Table 1.
Single-cell sample parameter information.
| Items | Descriptions |
|---|---|
| Positive/negative materials | NCA/Graphite |
| Diameter/height | 18 mm/65 mm |
| Weight | 45.1 ± 1.5 g |
| Rated capacity/voltage | 3060 ± 10 mAh/3.6 V |
| Upper limit of charging voltage | 4.20 ± 0.05 V |
| Discharge cut-off voltage | 2.5 V |
| Maximum discharge current | 30 A |
Table 2.
HPPC test procedure.
| Step Number | Work Step Description |
|---|---|
| 1 | Charge the battery to 100% SOC state at 25 °C using a 0.30 C constant current voltage method. |
| 2 | Allow the battery to rest for 1 h. |
| 3 | Discharge the battery at a 1.00 C constant current for 10 s. |
| 4 | Rest the battery for 40 s. |
| 5 | Charge the battery at a 0.75 C constant current for 10 s. |
| 6 | Discharge the battery to 90% SOC using a 1.00 C constant current. |
| 7 | Repeat Steps 2 to 6 until the battery SOC reaches 0%. |
Table 3.
Influence of charging and discharging temperature on aging characteristics.
| Strategy | Charge Rates/C | Discharge Rates/C | Depth of Charge and Discharge/% | Temperature/°C |
|---|---|---|---|---|
| 1 | 3.00 | 3.00 | 0–100 | −20 |
| 2 | 3.00 | 3.00 | 0–100 | −10 |
| 3 | 3.00 | 3.00 | 0–100 | 0 |
| 4 | 3.00 | 3.00 | 0–100 | 25 |
Table 4.
Influence of charge/discharge multiplier on aging characteristics.
| Strategy | Charge Rates/C | Discharge Rates/C | Depth of Charge and Discharge/% | Temperature/°C |
|---|---|---|---|---|
| 1 | 0.25 | 3.00 | 0–100 | −20 |
| 2 | 0.33 | 3.00 | 0–100 | −20 |
| 3 | 0.50 | 3.00 | 0–100 | −20 |
| 4 | 0.66 | 3.00 | 0–100 | −20 |
| 5 | 1 | 3.00 | 0–100 | −20 |
| 6 | 1.5 | 3.00 | 0–100 | −20 |
| 7 | 3 | 0.33 | 0–100 | −20 |
| 8 | 3 | 0.50 | 0–100 | −20 |
| 9 | 3 | 0.66 | 0–100 | −20 |
| 10 | 3 | 1 | 0–100 | −20 |
| 11 | 3 | 1.5 | 0–100 | −20 |
Table 5.
Influence of charging and discharging intervals on aging characteristics.
| Strategy | Charge Rates/C | Discharge Rates/C | Depth of Charge and Discharge/% | Temperature/°C |
|---|---|---|---|---|
| 1 | 1.00 | 1.00 | 2.50–3.80 | −20 |
| 2 | 1.00 | 1.00 | 2.50–4.00 | −20 |
| 3 | 1.00 | 1.00 | 2.50–4.10 | −20 |
| 4 | 1.00 | 1.00 | 2.50–4.20 | −20 |
| 5 | 1.00 | 1.00 | 3.00–4.20 | −20 |
| 6 | 1.00 | 1.00 | 3.20–4.20 | −20 |
| 7 | 1.00 | 1.00 | 3.40–4.20 | −20 |
Table 6.
Capacity degradation after 25 cycles at different temperature.
| Temperature (°C) | Charge (%) | Discharge (%) |
|---|---|---|
| −20 | 88.2 | 87.0 |
| 25 | 95.2 | 95.1 |
Table 7.
Relative capacity varies with the voltage range for the 2nd cycle.
| Voltage Range (V) | Charge | Discharge |
|---|---|---|
| 2.50~3.80 | 46.4% | 45.7% |
| 2.50~4.00 | 73.0% | 73.0% |
| 2.50~4.10 | 85.7% | 85.8% |
Table 8.
Relative capacity varies with the voltage range for the 25th cycle.
| Voltage (V) | Charge | Discharge |
|---|---|---|
| 3.00~4.20 | 92.0% | 91.4% |
| 3.20~4.20 | 73.5% | 71.1% |
| 3.40~4.20 | 48.6% | 44.6% |
Table 9.
Relative capacity varies with the discharge cut-off voltage for the 25th cycle.
| Voltage (V) | Charge | Discharge |
|---|---|---|
| 2.50 | 95.7% | 96.0% |
| 3.00 | 93.2% | 94.2% |
| 3.20 | 84.9% | 88.1% |
| 3.40 | 72.6% | 80.2% |
Table 10.
Charging and discharging capacities with charging cut-off voltages at the 150th cycle.
| Cut-Off Voltage (V) | 3.80 | 4.00 | 4.10 | 4.20 |
| Charge capacity (mAh) | 1096.8 | 1726.5 | 2027.4 | 2355.8 |
| Discharge capacity (mAh) | 1077.1 | 1709.3 | 2020.4 | |
| Degradation of charge capacity (%) | 2.1 | 5.9 | 13.5 | 17.5 |
| Degradation of discharge capacity (%) | 0.5 | 4.6 | 13.2 | 17.2 |
Table 11.
Charging and discharging capacities with discharge cut-off voltages at the 150th cycle.
| Cut-Off Voltage (V) | 2.50 | 3.00 | 3.20 | 3.40 |
| Charge capacity (mAh) | 1950.6 | 1810.9 | 1321.7 | 776.4 |
| Discharge capacity (mAh) | 2255.8 | 2154.3 | 1675.6 | 1051.2 |
| Degradation of charge capacity (%) | 17.5 | 16.8 | 23.9 | 33.3 |
| Degradation of discharge capacity (%) | 17.2 | 16.5 | 21.0 | 26.6 |
Table 12.
The Ohmic internal resistance growth rate after 150 cycles.
| Cut-off voltage (V) | 2.50 | 3.00 | 3.20 | 3.40 |
| Growth rate (%) | 10.3 | 8.2 | 6.5 | 3.5 |
Table 13.
The Polarization internal resistance growth rate after 150 cycles.
| Cut-off voltage (V) | 2.50 | 3.00 | 3.20 |
| Growth rate (%) | 7.5 | 7.0 | 4.3 |
Disclaimer/Publisher’s Note: The statements, opinions and data contained in all publications are solely those of the individual author(s) and contributor(s) and not of MDPI and/or the editor(s). MDPI and/or the editor(s) disclaim responsibility for any injury to people or property resulting from any ideas, methods, instructions or products referred to in the content. |
© 2024 by the authors. Licensee MDPI, Basel, Switzerland. This article is an open access article distributed under the terms and conditions of the Creative Commons Attribution (CC BY) license (https://creativecommons.org/licenses/by/4.0/).
Share and Cite
MDPI and ACS Style
Zhang, Z.; Ji, C.; Liu, Y.; Wang, Y.; Wang, B.; Liu, D. Effect of Aging Path on Degradation Characteristics of Lithium-Ion Batteries in Low-Temperature Environments. Batteries 2024, 10, 107. https://doi.org/10.3390/batteries10030107
AMA Style
Zhang Z, Ji C, Liu Y, Wang Y, Wang B, Liu D. Effect of Aging Path on Degradation Characteristics of Lithium-Ion Batteries in Low-Temperature Environments. Batteries. 2024; 10(3):107. https://doi.org/10.3390/batteries10030107
Chicago/Turabian StyleZhang, Zhizu, Changwei Ji, Yangyi Liu, Yanan Wang, Bing Wang, and Dianqing Liu. 2024. "Effect of Aging Path on Degradation Characteristics of Lithium-Ion Batteries in Low-Temperature Environments" Batteries 10, no. 3: 107. https://doi.org/10.3390/batteries10030107
Note that from the first issue of 2016, this journal uses article numbers instead of page numbers. See further details here.