3.1. The Contact Resistance in EIS on the Example of LMFP
At first, we wanted to identify and characterize the contact resistance contribution in EIS, using LMFP as an illustrative example. Accurately identifying the contact resistance in EIS is crucial for enabling meaningful comparisons with alternative measurement techniques explored later in this study. Additionally, the EIS investigation provides valuable insights into the behavior of contact resistance at varying SoCs and temperatures, settings that are challenging to modify and control in the other measurement techniques. To emphasize the characteristics of electronic resistance, we also analyzed the typical ionic charge-transfer resistance (Rct) as a comparison.
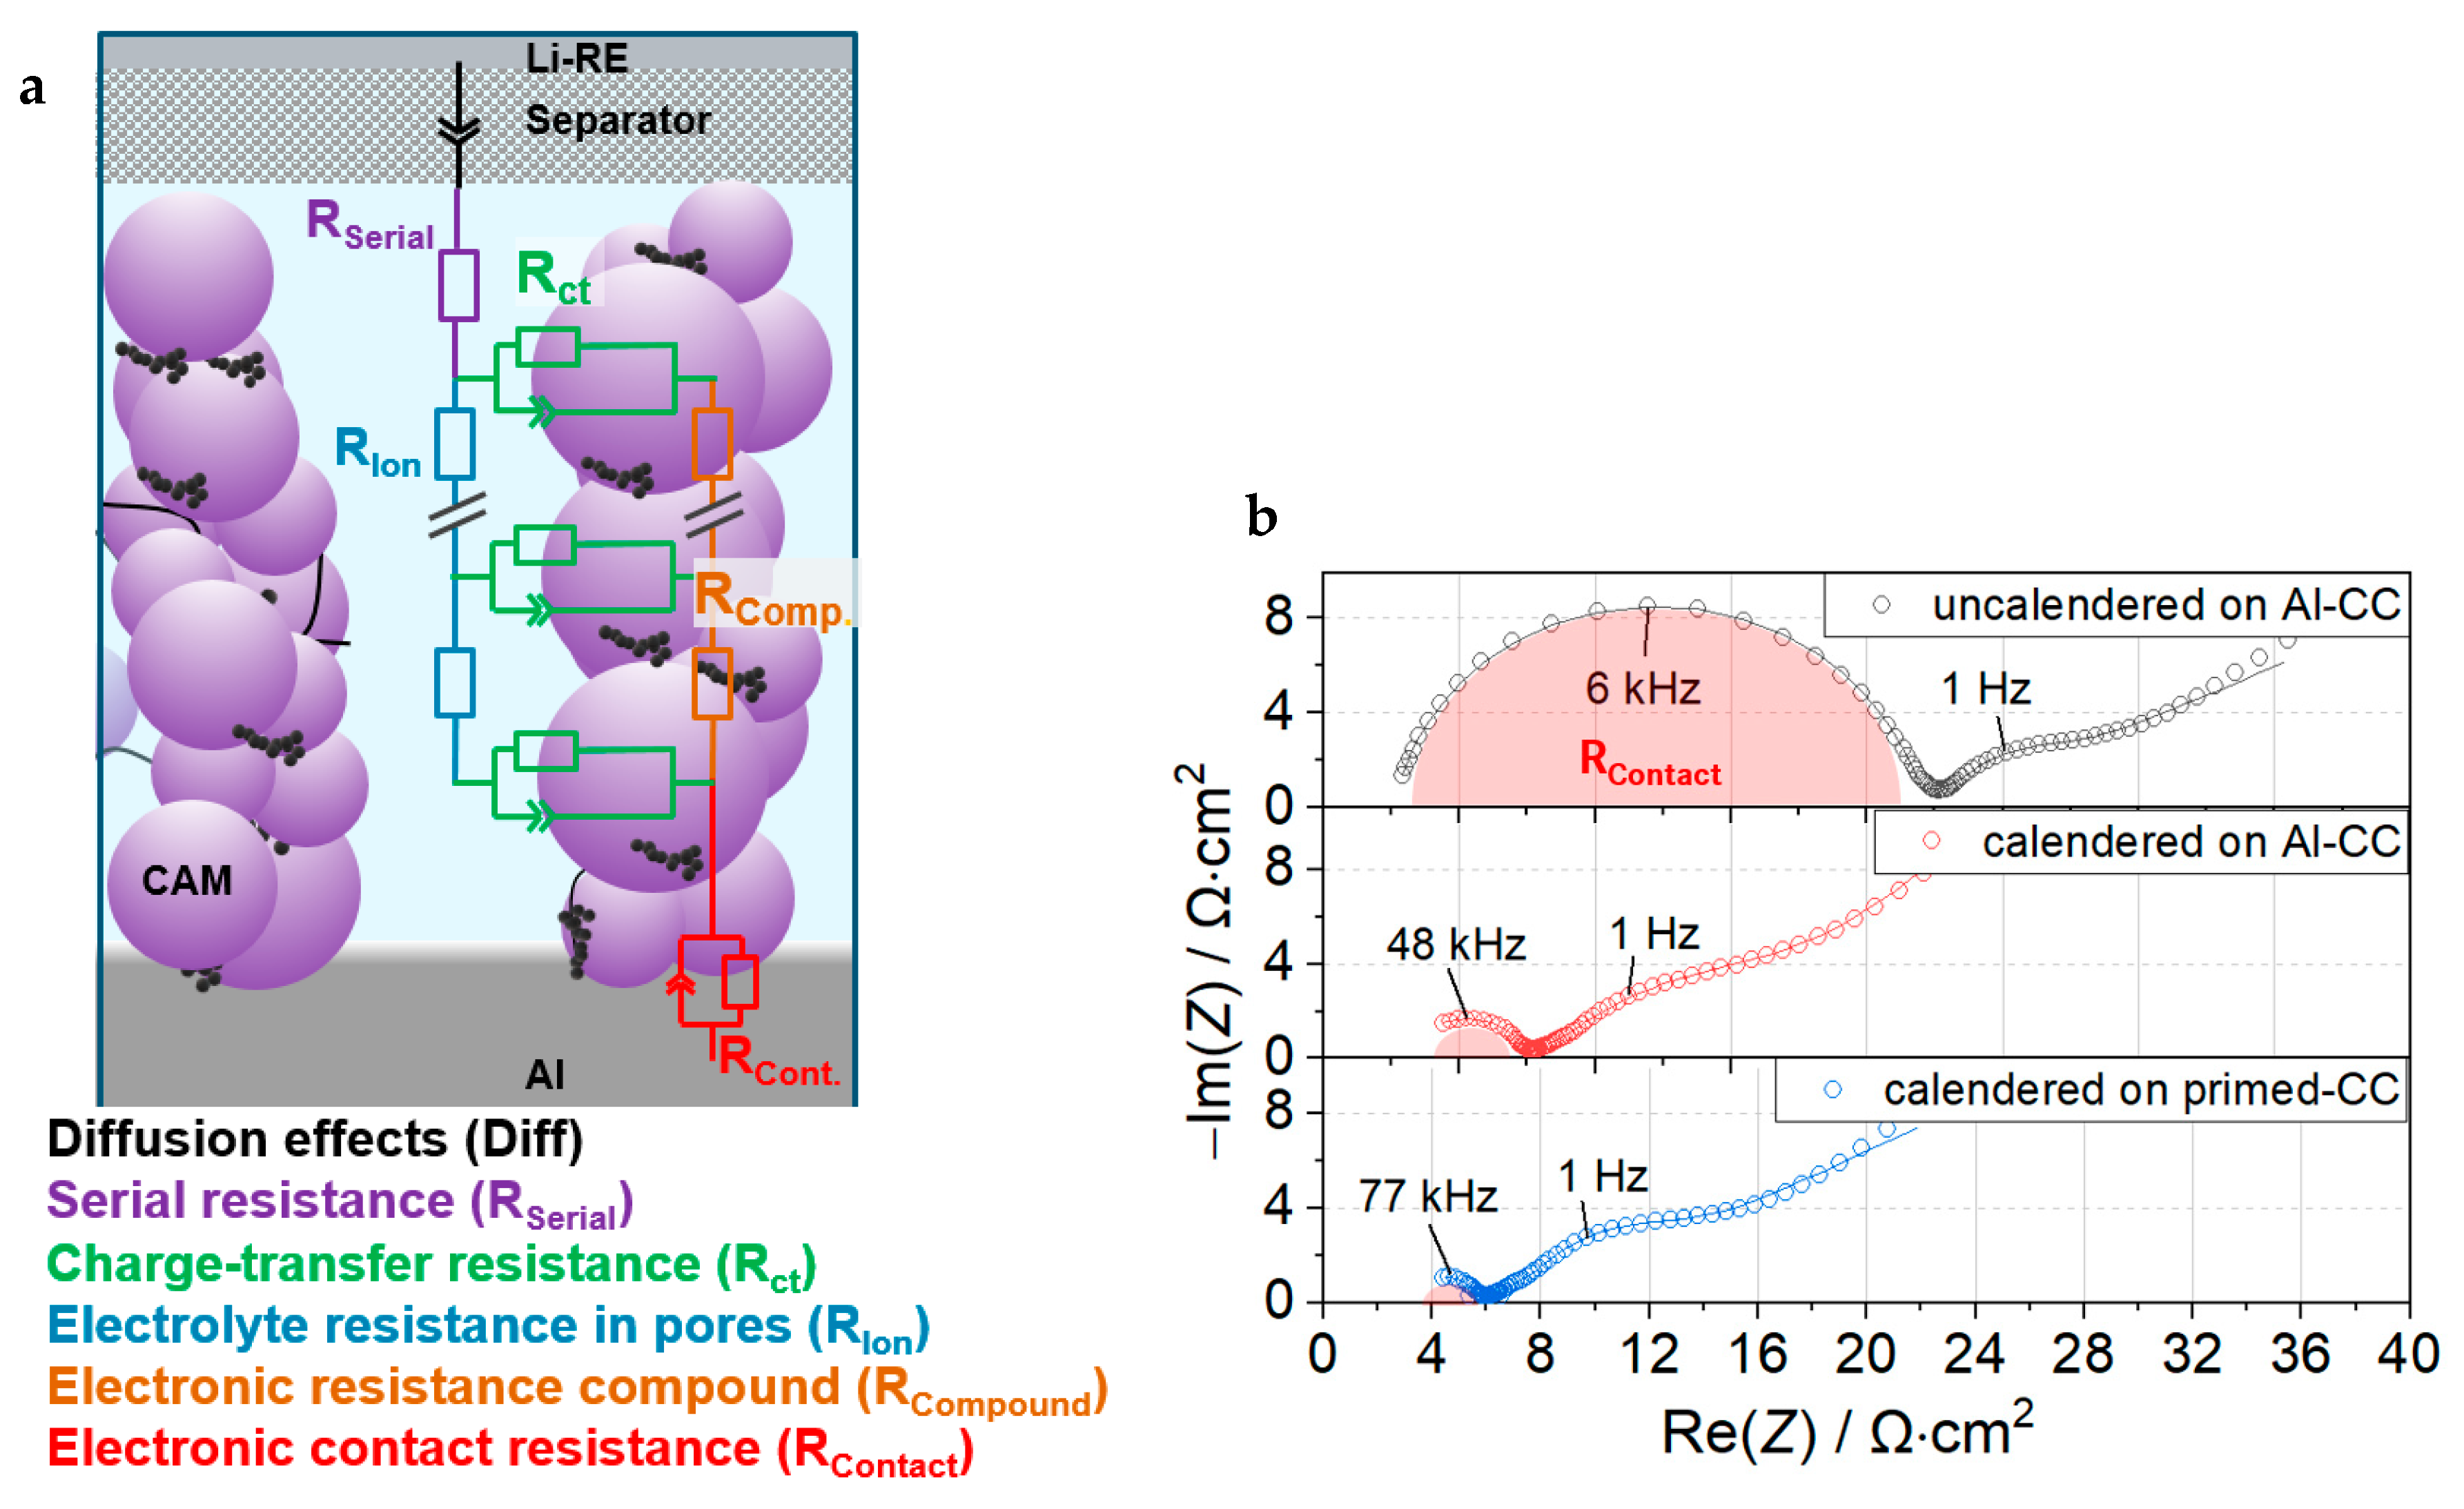
We conducted EIS studies on three-electrode PAT cells with LMFP cathodes coated on different current collectors with varying press densities to identify the contact resistance’s contribution. This helped us to quantify the impact of the respective measures. The EIS data were fitted to an equivalent circuit model (ECM), shown in
Figure 1a. The ECM takes into account the porous structure of the investigated electrode through the use of a transmission line model [
24,
28,
29]. A detailed description of the ECM and its respective parts is provided in
Section S4 of the Supplementary Information.
Figure 1b shows Nyquist plots of EIS measurements at 25 °C of the respective LMFP cathodes at 0% SoCs directly after formation. The measured resistance was normalized to the apparent electrode area for better comparability (2.545 cm
2 for Ø = 18 mm electrodes). In the following discussion, all resistances that were normalized to the apparent electrode area will be designated as areal specific resistance (ASR) with its physical origin as a subscript, as commonly agreed with in the literature. The high-frequency semi-circles, presumed to indicate R
Contact, show apex frequencies of 6 to 77 kHz. The electrical double layer capacities (DL-capacities) of the fitted R-CPE-element are in the range of 1 to 4 µF, which yield areal double layer capacities of 0.46 to 1.49 µF∙cm
−2Electrode when normalized to the area of the blank current collector of 2.545 cm
2. This value is in the expected range for interface DL-capacities [
19,
30]. Herein, we see a strong indication that a high-frequency semi-circle is not caused by a double layer effect having its origin in the surface area of the electrode active compound (CAM + CB), as this area is way higher than the area of a blank CC. In turn, the areal DL-capacities calculated including the electrode active compound would be far too low compared to a typical double layer capacitance. The DL-capacities were calculated from CPE values using the Hsu and Mansfeld formula (
Equation (S1)).
The mid-frequency semi-circle with apex frequencies of around 1 Hz is presumed to indicate the charge-transfer resistance (Rct). This is validated by the fact that it shows low sensitivity to the degree of calendering (cathode press density) and almost no dependence on the change in current collector. However, the mid-frequency semi-circle strongly depends on the SoC as will be shown and discussed later.
When comparing the magnitude of ASR
Contact in
Figure 1b, the uncalendered LMFP cathode on the Al-CC with a high porosity of 61% shows an ASR
Contact of ≈18 Ω∙cm
2. In soft calendering to a 50% porosity, the ASR
Contact already decreased to ≈4.2 Ω∙cm
2. ASR
Contact is reduced even further to ≈3 Ω∙cm
2 if the electrode coating is applied on a primed-CC and calendered to the same 50% porosity. The strong sensitivity of R
Contact to calendering and choice of CC is additional proof that this semi-circle has its physical origin on the interface between the CC and electrode coating. In further comparisons of EIS results, the fitting values derived from this semi-circle will be designated as R
Contact values. We will go into more detail about the impact of electrode porosity when discussing the 46-point probe results.
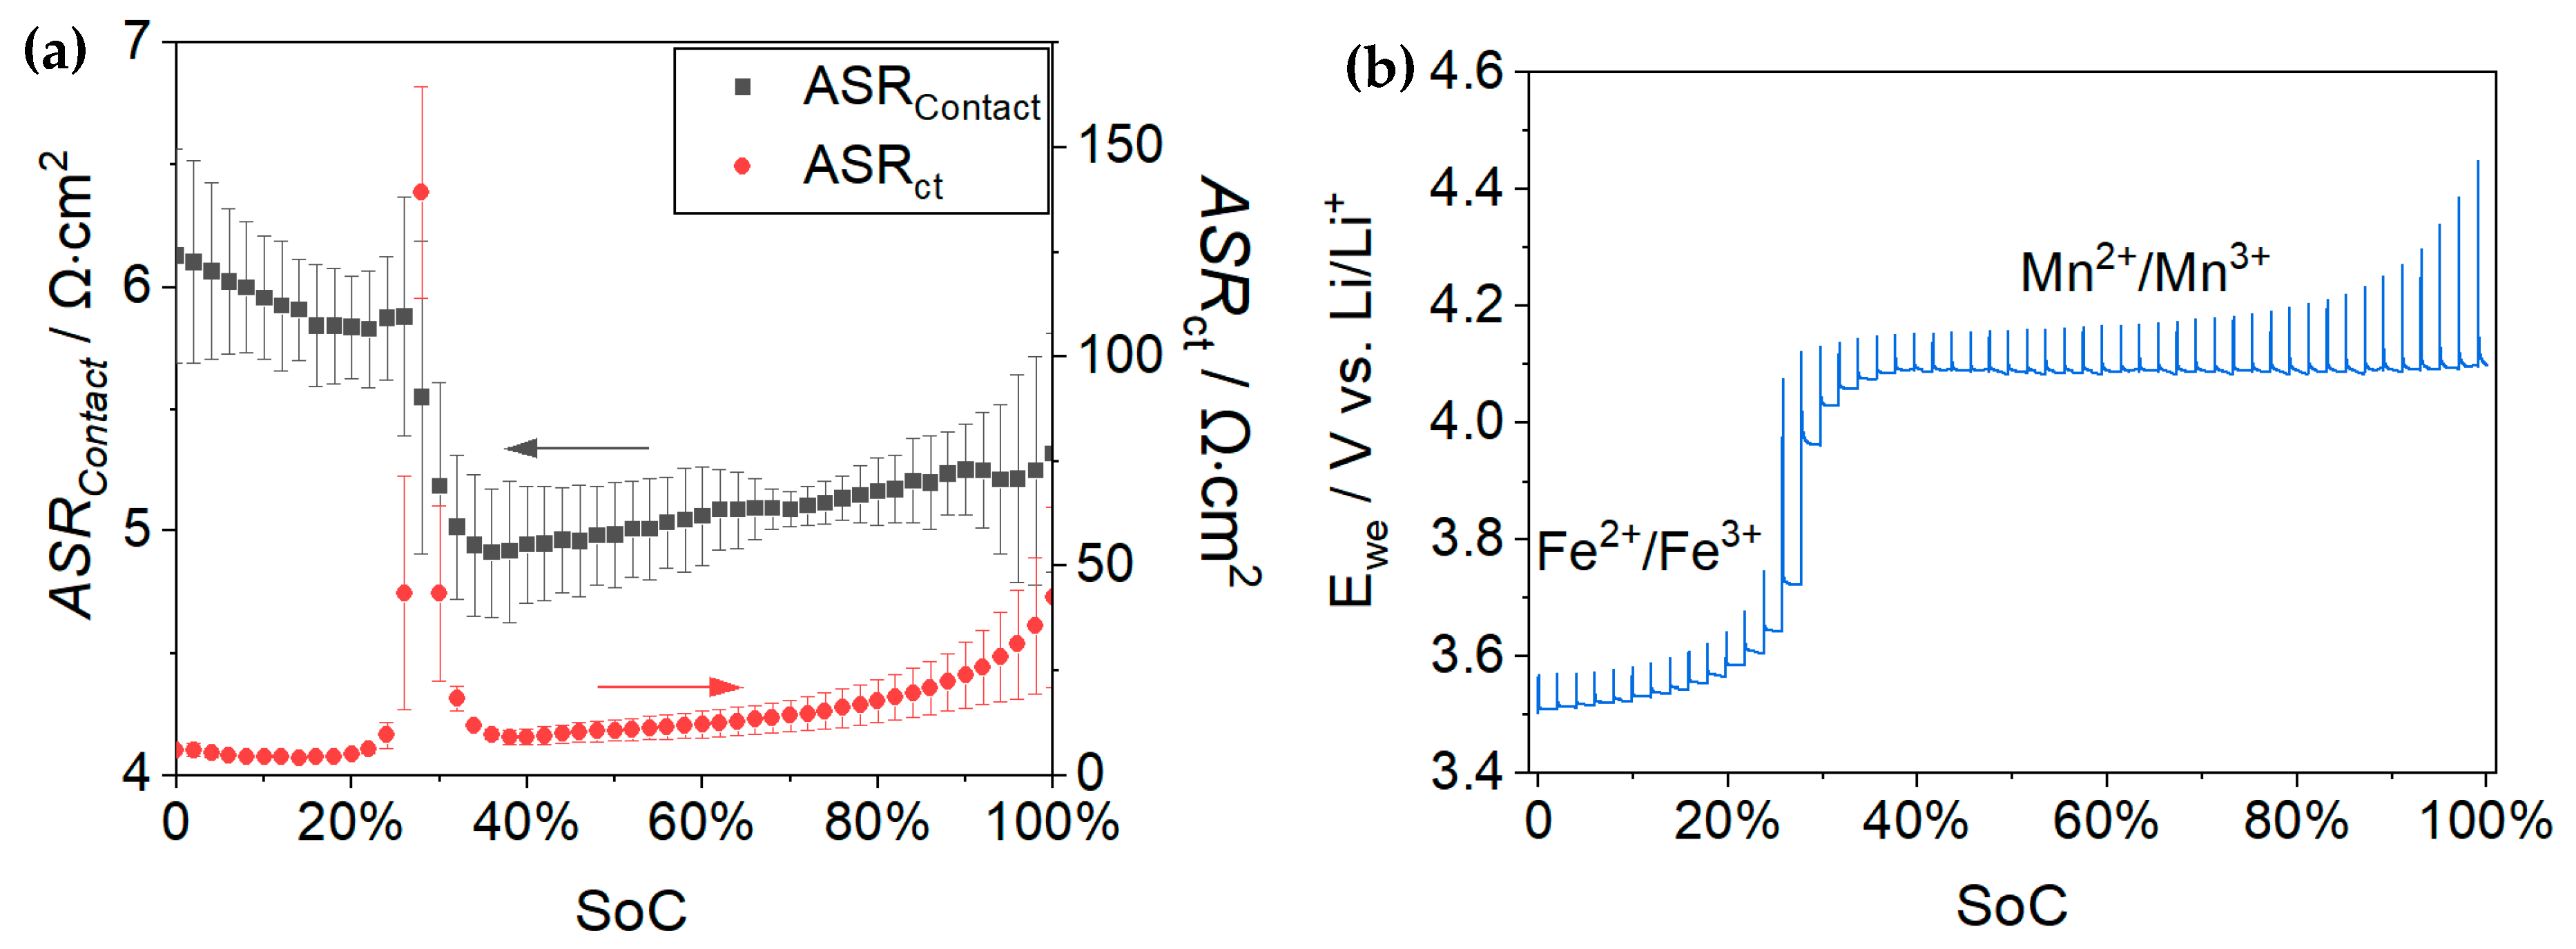
To investigate the dependence of R
Contact and R
ct on the SoC of the cathode, we conducted EIS measurements in 2% SoC steps and evaluated the results with the explained ECM. The measured resistances are shown in
Figure 2a, and the corresponding voltage curve of the LMFP cathode during the measurement procedure is shown in
Figure 2b. The R
ct exhibits a strong SoC-dependent behavior, which has—to the best of our knowledge—not been reported before in this detail. It is comparably low between a 0% and approx. 25% SoC, which is characteristic for the Fe
2+/Fe
3+ voltage plateau at ≈3.5 V vs. Li/Li
+. As soon as the Fe
2+/Fe
3+ redox reaction is completed, a very large R
ct peak is observed at around the 30% SoC, indicating the transition toward the Mn
2+/Mn
3+ redox reaction.
The large overpotential in this area is assumed to be caused by a solid solution reaction regime between the Fe
2+/Fe
3+ and Mn
2+/Mn
3+ redox reactions, which can lead to a sluggish Li
+ diffusivity within the crystal [
31,
32]. In parallel, the voltage profile shows a step increase in cell voltage. As the Mn
2+/Mn
3+ redox reaction takes over completely, R
ct drops back to a local minimum value around 35% to 40% SoC, which is in agreement with the beginning of the Mn
2+/Mn
3+ voltage plateau. Afterward, R
ct starts to steadily increase for SoC > 40%, a behavior that can be attributed to Li
+ transport hindrance due to lattice distortion caused by the Jahn–Teller active Mn
3+ [
31]. In contrast to R
ct, the R
Contact shows just minor dependence on the SoC point, which was expectable. These differences in the SoC dependencies of R
ct and R
Contact are a further validation of our allocations of resistance contributions in LMFP. We also observed a characteristic behavior that has not been described before: the R
Contact of the Fe
2+/Fe
3+ redox region is slightly higher compared to the R
Contact of the Mn
2+/Mn
3+ redox region. A possible explanation for this behavior might be a change in the electronic resistance of the LMFP. Explanations are discussed in more detail in
Section S5 in the Supplementary Information. Furthermore, the pulses shown in
Figure 2b were used to calculate resistances; the results are compared with EIS results and shown in
Supplementary Information Section S6.
When comparing the magnitudes of the different resistances, it can be seen that at 25 °C, at SoCs below 25%, the RContact is a dominant resistance contributor. This is further motivation for understanding and optimizing RContact in order to minimize overpotentials and enable faster charging.
We want to note that resistance effects that dominate the cell performance at high-current rates such as electrolyte salt gradients were not included in our consideration as they are not measurable with EIS and are, in general, difficult to characterize correctly.
The impact of temperature on resistance contributions was characterized by temperature-dependent EIS measurements.
Figure 3a shows the EIS spectra of a calendered LMFP cathode (porosity: 50%) on an Al-CC at a 50% SoC at application-relevant temperatures of 5 °C, 25 °C and 45 °C. For a better comparison, the respective R
Serial value (
Table S1) was subtracted from the
Z(Re) of each spectrum. It can be seen that the R
Contact (high-frequency semi-circle) is just slightly impacted by temperature, whereas R
ct has a strong temperature dependence.
In the 5 °C measurement, an additional semi-circle occurs with an apex frequency of ≈20 Hz, which is indicated in
Figure S6 in the Supporting Information. We could not unambiguously determine the physical origin of this effect. Considering its temperature dependence and frequency range, we presume it to be an effect of electrolyte diffusion in the fine pores of the electrode. The pore shape and pore size distributions can have significant influence on the EIS spectra in this frequency region [
33].
For an in-depth analysis, the temperature-dependent EIS data were fitted and afterward plotted according to Arrhenius law, as shown in
Figure 3b. The activation energy of the different processes was calculated from the slope of the linearized fit of data points. R
Contact and R
ct exhibited activation energies of −0.8 kJ∙mol
−1 (−0.01 eV) and 57.9 kJ∙mol
−1 (0.60 eV), respectively. The found negative activation energy value for R
Contact is slightly deviating from the values reported in the literature for other CAMs, which are typically 1–4 kJ∙mol
−1 [
20,
30,
34]. However, both values are close to zero and are therefore indicating a low dependence of R
Contact on temperature. As R
Contact involves electron transfer from the Al-CC to the cathode coating, it should also be noted that the electronic resistance of the Al is increasing with increasing temperature (temperature coefficient of ~0.004 K
−1) [
35] (p. 602). The part of Al conduction in the R
Contact may therefore be a reason for the negative activation energy.
The literature values for R
ct for other CAMS are 0.45 eV (43.4 kJ∙mol
−1) for LFP [
34], ≈53 kJ∙mol
−1 for LCO [
20] and 57.6 kJ mol
−1 for NCA [
4]. These values as well as the found 57.9 kJ∙mol
−1 are in a similar area and are indicating a strong temperature dependence of these effects. When optimizing a cell system, it is of crucial importance to understand that electronic resistances such as R
Contact become more and more important with increasing cell temperature as other contributions to total resistance shrink. As can be seen in
Figure 3b, R
Contact becomes the largest resistance contribution at a 50% SoC at 45 °C. This impact is even more pronounced for SoCs in the Fe
2+/Fe
3+ plateau region. For example, at 10% SoC, R
Contact already becomes the largest resistance contribution at around 15 °C (
Figure S7). We take this as a key learning: although adaptions with respect to electronic conductivity may not yield significant power improvements at room temperature, the electronic conductivity can become a dominating factor for the fast charge properties at elevated temperatures. Thus, it is worth it to investigate and understand the individual contributions to the electronic resistance, i.e., R
Contact and R
Compound, in a very detailed manner.
3.2. Comparison of Measurement Methods for Contact Resistance
After the distinct identification and quantification of RContact in EIS measurements, we can now compare the results to those of other types of electronic resistance measurement techniques. EIS has the advantage of being an in situ method but has the disadvantage that for each measurement, an electrochemical test cell must be built. This not only limits the sample throughput, but also requires considerable investment in high-quality impedance channels. Additionally, it is difficult to extract the electronic resistance of the electrode compound (RCompound) from the acquired EIS data.
The electronic resistance contributions within an electrode (RCompound and RContact) can also be tested in setups using the dry electrode coating applied on a CC. In this work, we investigated and compared the well-established 2-point probe method and the 46-point probe method recently commercialized by the company HIOKI. Hereby, our focus is their capability to measure electronic resistance data similar to EIS, using identical electrode samples. As no electrochemical test cell must be built, both methods have the advantages of being fast (≈1 min), easy to handle and implement and free of measurement artefacts originating from cell assembly or other components (e.g., quality variations in reference electrode, electrolyte system, etc.).
The 46-point probe device has the valuable ability to separate the electronic resistivity of the sample into its individual contributions: RCompound and RContact. This is possible due to a sophisticated measuring system checking the potential variations between the probes and solving the inverse problem through simulation within a computation unit. The input parameters for the simulation were the thickness of the electrode compound, thickness of the current collector and specific resistivity of the current collector material. All three parameters are easily accessible and/or can be measured with standard laboratory equipment at high precision.
With the much simpler two-point probe method, it is not possible to separate RCompound and RContact. In typical two-point probe measurements, the electrode is contacted with two metallic conductors of known area perpendicular to the coating surface. Subsequently, the resistance can be measured and normalized to the contact (measurement) area on both sides of the sample. The resulting value includes the combination of RCompound and RContact together with an additional resistance for the contact between metallic conductors and the electrode surface, which must be considered as a measurement artefact.
Figure 4 shows a comparison of R
Contact values determined using different measurement methods (2-point probe, 46-point probe, EIS study) for calendered LMFP cathodes (porosity: 50%) coated on a CC. Different stages of cell preparation were taken into consideration when analyzing data obtained using the 2-point probe (dry electrode), 46-point probe (dry electrode and DMC-wetted electrode) and EIS measurements (electrolyte-wetted electrode in cell). Please note that for the two-point probe, the results include R
Contact and R
Compound, as they are not separable with this method (but as shown below, R
Compound is assumed to be comparably low in these samples). The methods are compared for the LMFP electrode coating (porosity: 50%) on an Al-CC as well as for the LMFP electrode coating (porosity: 50%) on a primed-CC. In this way, we can not only compare the absolute values of each measurement, but also analyze if the relationship between data points for the two electrode types differs based on the method applied.
Firstly, we compare the absolute values of the different methods. The 2-point probe method yields resistance values of 2.30 Ω·cm2 (Al-CC) and 0.31 Ω·cm2 (primed-CC), which are around 2–4 times higher than those obtained from the 46-point probe measurements of 0.56 Ω·cm2 (Al-CC) and 0.14 Ω·cm2 (primed-CC). The higher values for the two-point method are presumably caused by additional contact resistances between the metal contact and electrode, which is a major reason why results from two-point methods are dependent on the pressure applied on the metal contact during measurement.
The electrode wetted with electrolyte can have a strong impact on the electric conductivity of electrodes as was shown by other authors [
21,
36]. Hence, we immersed the LMFP electrodes in dimethyl carbonate (DMC) as a representative electrolyte co-solvent for 20 min and measured the wetted electrodes with the 46-point probe system. We found that the measured R
Contact increased by +40% to 0.79 Ω·cm
2 (Al-CC) and by +100% to 0.28 Ω·cm
2 (primed-CC) after wetting with DMC. It is interesting to see that the relative impact of wetting is more pronounced for the LMFP coated on the primed-CC, whereas the absolute increase of +0.14 Ω·cm
2 is indeed smaller compared to the blank Al-CC with +0.23 Ω·cm
2. In our opinion, this highlights the superior properties of a carbon primer-modified current collector. Similar behaviors with even higher resistance increases (e.g., 250%) have been reported in the literature, although comparability is limited since the measurements were performed with another resistance probe [
36]. These findings give rise to the assumption that electron transport becomes restricted by structural changes and/or electrochemical or other processes that occur during the wetting of electrodes.
In the next step, electrodes were built into three-electrode PAT cells, wetted with electrolyte and measured directly with EIS (before formation). The determined RContact values of 3.85 Ω·cm2 (Al-CC) and 2.45 Ω·cm2 (primed-CC) are 7 times higher than the 46-point probe results for the identical cathode on an Al-CC and 17 times higher for the identical cathode on a primed-CC. These increases may be caused by more complex wetting effects driven by the compounds in the real electrolyte system interacting with the electrode components, such as the swelling of binder or surface reactions with CAM, CB or CC. All of these side effects will slow down the electron conduction or lead to passivation effects between the active electrode layer and the CC. As an artefact from sample preparation, additional resistance may be caused by defects from the punching of electrodes, which could impair the contact strength between the electrode compound and CC. In general, it has to be considered that the 46-point probe system measures on a very small area of 1 mm2, whereas in both the EIS and 2-point probe methods, the measurements require a sample area in the scale of several cm2. Accordingly, the 46-point probe system enables a more precise spatial resolution over the electrode, which can be used to, for example, check the homogeneity of electronic resistance.
The determination of RContact was also conducted after the formation and at the end of life (EOL) of the cells. For these cells, EOL was defined to be after the end of the measurement procedure, which involved EIS measurements at six different temperatures and 50 full cycles at 1 C/1 C.
While the formation procedure itself had a marginal impact on the measured R
Contact value, we observed a severe increase until the EOL according to the EIS data. This increase was about +100% for the electrode coated on an Al-CC sample to 8.27 Ω·cm
2 and +160% for the electrode coated on a primed-CC to 7.87 Ω·cm
2. Interestingly, we observed a narrowing of the R
Contact data for the blank vs. carbon primer-coated Al-CC throughout the measurement with strongest impact coming from cyclic ageing. Taking into consideration that the increase in R
Contact over cell lifetime is likely caused by delamination from the current collector and/or cracking inside the electrode active material layer, both of which are induced by the shrinking and swelling of the CAM during delithiation and lithiation, it must be concluded that the binding effect of the carbon primer coating cannot withstand such degradation processes. An increase in R
Contact over cycling has also been reported by other authors [
37] and should therefore be considered a highly relevant ageing factor.
After the EOL, a post-mortem analysis (PMA) of the PAT-cells was performed. Delamination at the edges of the electrodes was observed. The electrodes coated on a CC were thoroughly washed in DMC and, after drying, measured with the 46-point probe system. Surprisingly, the electrodes on an Al-CC yielded a RContact of 0.15 Ω·cm2, which is lower than before the cell build, even though with a large measurement error. The root cause for this behavior could not be clearly identified. However, it could be explained by the re-deposition of dissolved metal ions or the insufficient cleaning of the electrode before the 46-point probe measurement. For the electrode coating on a primed-CC extracted from the PMA, the 46-point probe method shows an increase in RContact of around +160% compared to the fresh, dry electrode, to a value of 0.37 Ω·cm2. This result is very similar to the data determined from EIS studies and therefore seems reasonable.
Another important message that can be derived from
Figure 4 is the ratio of R
Contact between the LMFP cathode on a Al-CC and a primed-CC. For the 2-point probe measurement, the factor is around 7 (meaning that the R
Contact on Al-CC is seven times higher than on a primed-CC), whereas for the 46-point probe on the dry electrode coating, the factor was determined to be 4. The EIS conducted before the formation even shows a factor as small as 1.5. The ratios differ considerably, which makes it difficult to rationally connect the data obtained from the 46-point method with the performance indicated via EIS. However, we have to consider that the observed variations between the factors may be caused by the specific properties of the primed-CC in dry and wet form. As the primer itself is a blend of highly conductive carbon and binder coated on the CC, it may be more prone to the resistance’s increasing effect of electrolyte wetting. Further research is needed to determine if the results from the 46-point probe method can be transferred directly into electrochemical behavior and the EIS of electrodes in active battery cells. This can be relevant, for example, in studies focused on conductive additive variations.
3.3. RContact and RCompound of Different CAMs
As explained above and schematically shown in
Figure 5, the 46-point probe method determines separate resistance values for the R
Compound and the R
Contact. R
Compound is given in the units of volume resistivity (Ω·cm, also referred to as material-specific electronic resistance), whereas R
Contact is given as ASR (Ω·cm
2). To be able to compare the two contributions, assumptions for the electron flow have to be made. In this work, we assumed that the electron flow occurs in the out-of-plane direction (perpendicular to the CC) and through the full coating thickness. Therefore, the volume resistivity value of the compound can be multiplied by the coating thickness to yield an ASR, making it comparable to R
Contact.
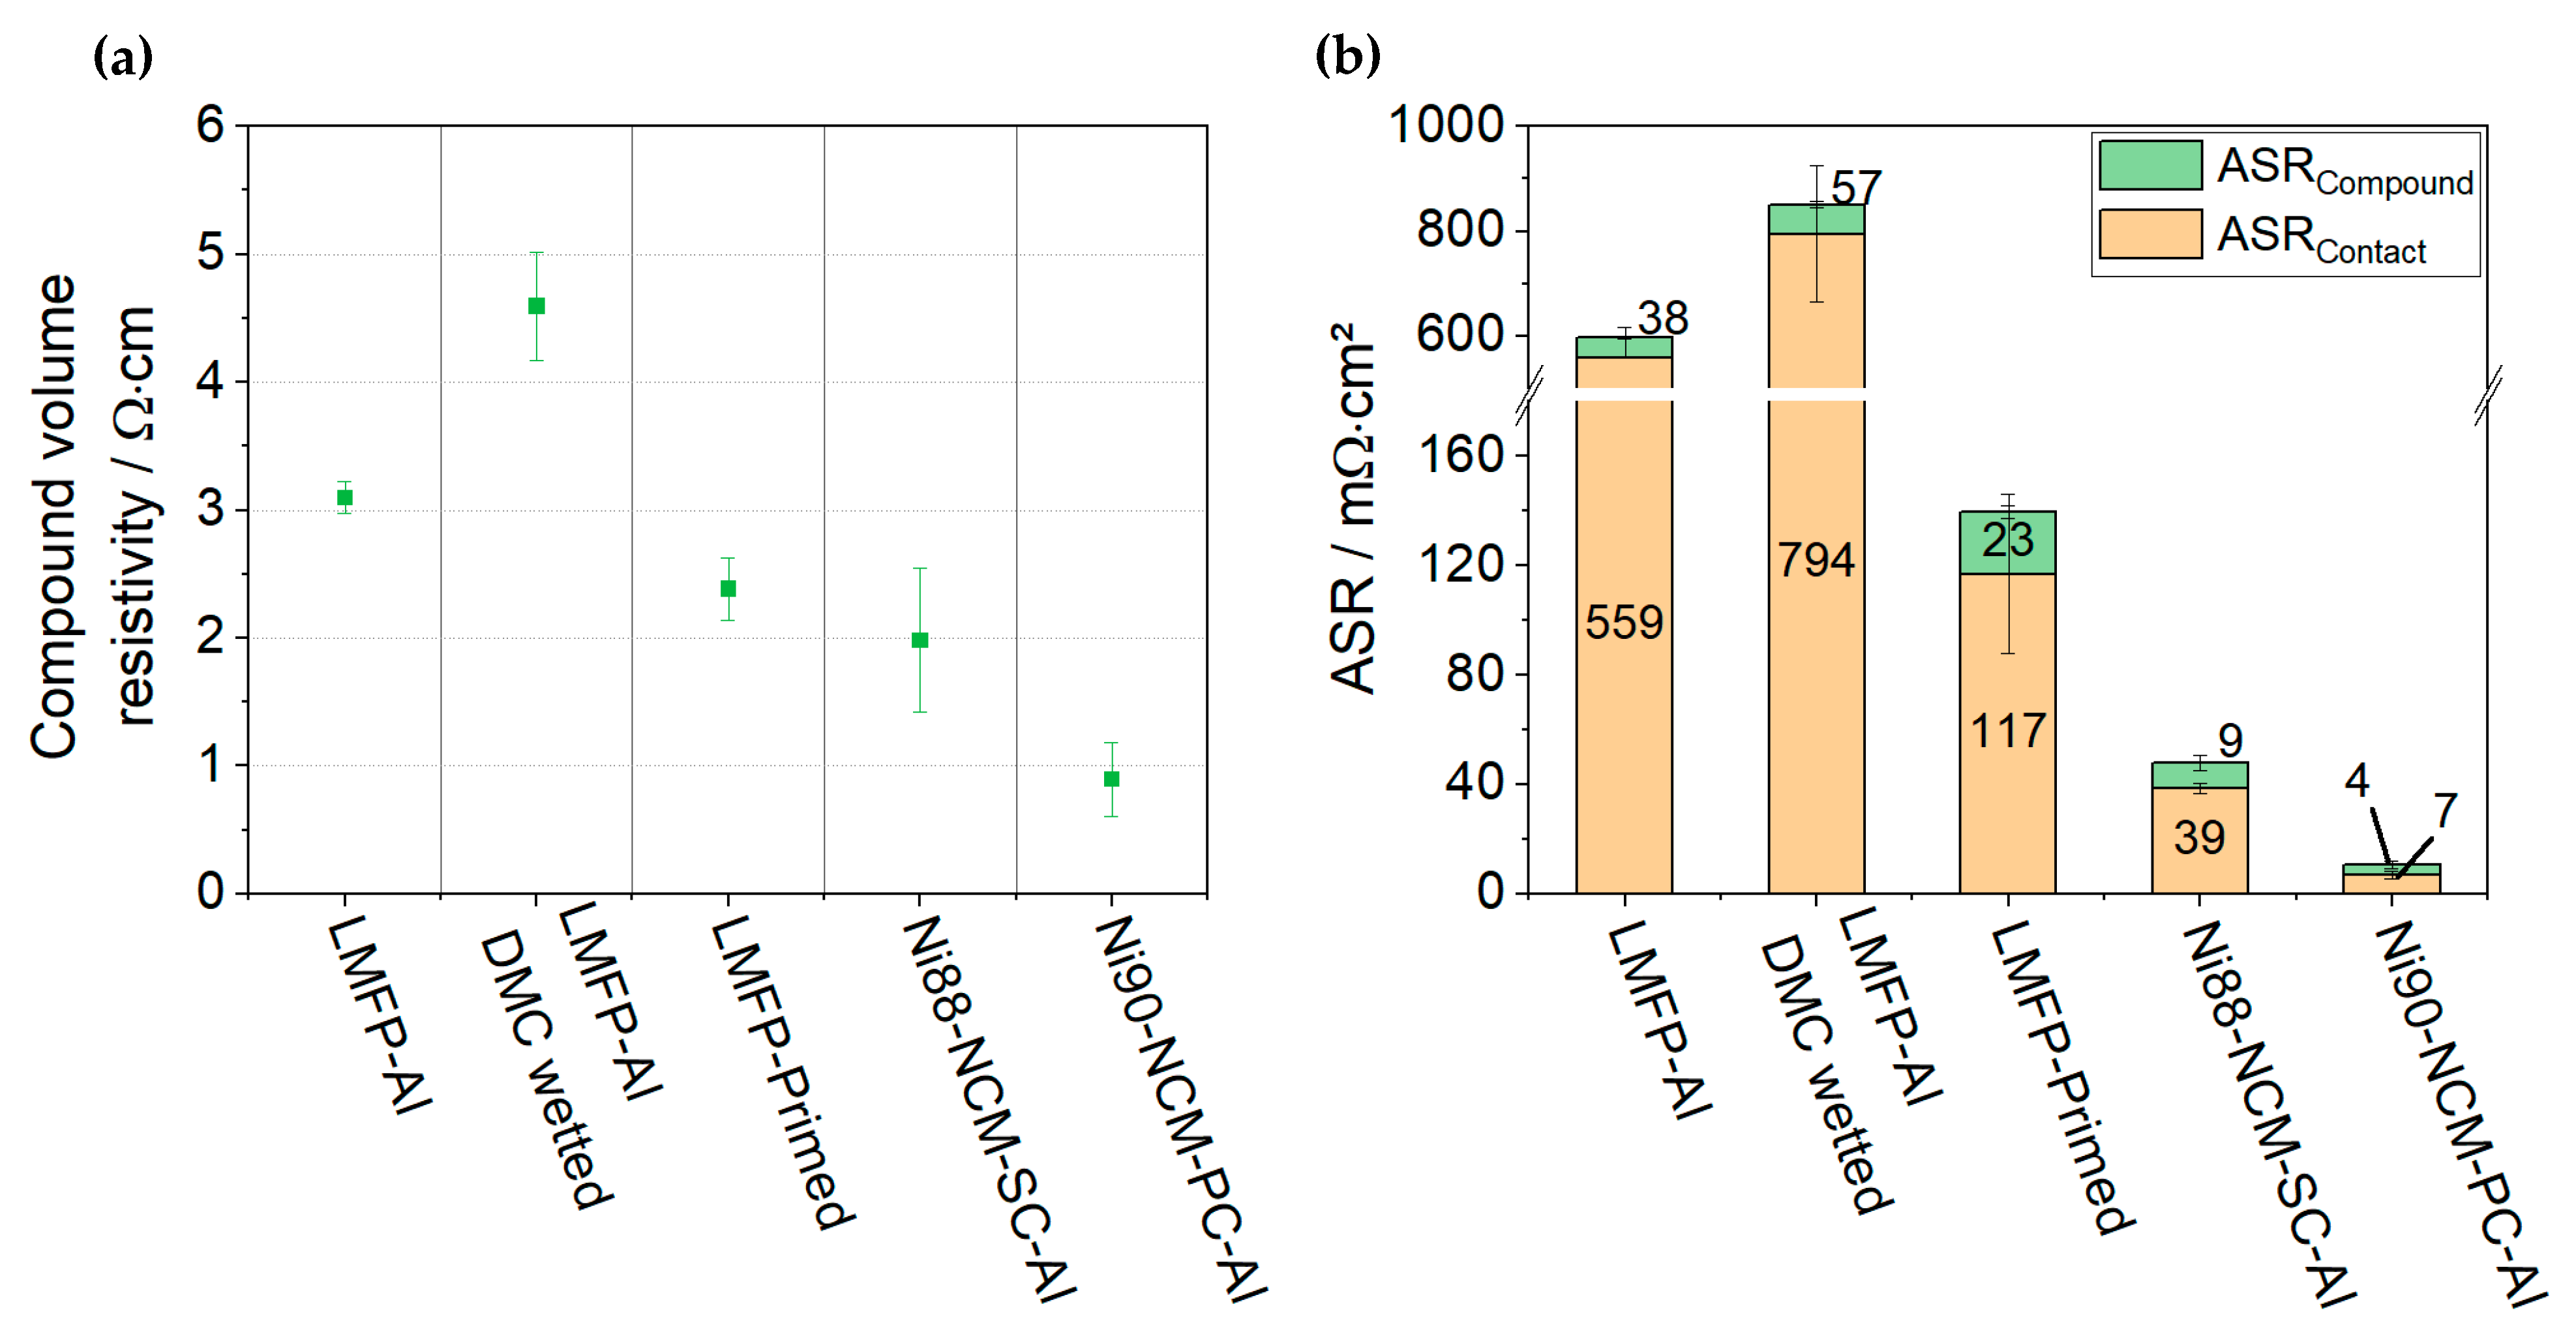
Figure 6a shows the results of the 46-point probe measurement for different combinations of cathode active materials (LMPF, Ni88-NCM-SC, Ni90-NCM-PC) and current collectors. The values for R
Compound are plotted in the unit of resistivity (Ω·cm). The compound resistivity R
Compound of the LMFP cathode coating on an Al-CC increased after DMC wetting from 3.1 Ω·cm to 4.6 Ω·cm. As the compound itself is the same for the LMFP cathode on an Al-CC and primed-CC (porosity of coating for both: 50%), it seems rational to assume that the compound resistance is identical. However, the measurement yields a somewhat lower resistivity for the coating on a primed-CC, with R
Compound being 2.4 Ω·cm. The results measured for Ni88-NCM-SC (2.0 Ω·cm) and Ni90-NCM-PC (1.0 Ω·cm) are provided as reference and for comparison.
As R
Contact is usually given as ASR, it can be difficult to compare it directly to compound resistivities, which are commonly given in Ω·cm. Therefore, the compound resistivity values were multiplied with their respective electrode thicknesses (yielding ASR
Compound) and plotted in combination with R
Contact in
Figure 6b. From the 46-point probe measurement, it becomes clearly visible that the ASR
Compound is just a small contributor to the total electronic resistance of the LMFP cathode compared to R
Contact. For the LMFP electrode coating on an Al-CC, the ASR
Compound accounts for only 6% of the overall electronic resistance. For the LMFP electrode on a primed-CC, the ASR
Compound share increases to 16%, as we observe a considerable reduction in R
Contact from 559 mΩ·cm
2 (Al-CC) to 117 mΩ·cm
2 (primed-CC) accompanied by a small, unexpected decrease in ASR
Compound from 38 mΩ·cm
2 to 23 mΩ·cm
2. In contrast, for Ni90-NCM-PC coated on a blank Al-CC, the ASR
Compound accounts for 36% of the total electronic resistance, which is a significant part. However, the total resistance itself is at a very low level of 11 mΩ·cm² (R
Contact: 7 mΩ·cm
2 and ASR
Compound: 4 mΩ·cm
2).
Please note that the porosities of the NCM cathodes versus LMFP cathodes can vary and that compaction shows a significantly different impact. The root cause can therefore be found in the morphology of the CAM particles. The primary crystallites of the NCMs are sintered at a high temperature to form very dense, spherical or potato-shaped particles with minimal intra-particle pores to avoid electrolyte contact (causing degradation). In clear contrast, the primary carbon-coated LMFP crystallites are agglomerated to spherical particles in a loose manner, leading to a high intra-particle porosity for improved electrolyte infiltration (mandatory for close LMPF–electrolyte contact and the shortest possible Li+ diffusion pathways inside the LMFP crystallites). Therefore, even after calendering with the same line force (kN∙mm−1) applied to the cathode surface, the LMFP electrodes still show significantly higher porosities compared to the NCM electrodes as intra-particle porosity remains. We still think a comparison of electronic resistance results is scientifically valid and reasonable as the line force applied for the compaction of all investigated electrodes was approximately the same. A more detailed discussion into the impact of porosities on the electronic resistance is provided in the next section.
It is noteworthy that the total electronic resistance of LMFP (porosity: 50%) on an Al-CC is about two orders of magnitude higher than that of Ni90-NCM-PC (porosity: 27%) on an Al-CC. The total electronic resistance of Ni88-NCM-SC (porosity: 27%) is approx. five times higher than that of Ni90-NCM-PC (porosity: 27%), both coated on a blank Al-CC.
The reason for these differences in electronic resistance are presumably two main factors:
It is rational to assume that materials with higher electronic conductivity in turn exhibit lower contact resistances. The importance of particle morphology can be derived from a CAM with identical crystal structure. As such, layered oxide Ni88-NCM-SC and Ni90-NCM-PC behave very similar in terms of cell chemistry. Still, the resistance measured for Ni88-NCM-SC is about five times higher, mainly caused by a significantly higher contribution of RContact, which is a side effect of the limited anchoring of small SC particles compared to big PC particles. This effect will be explained later.
In general, the resistance values determined using the 46-point probe method were surprisingly small. Through the simple use of Ohm’s law in combination with the measured resistance values, the corresponding overpotentials in electrochemical active battery cells can be predicted. The electrodes have a loading of 3 mAh∙cm−2. In assuming a high current of 10 C, the resulting overpotentials would be 0.2 mV, 1.2 mV and 18 mV for Ni90-NCM-PC, Ni88-NCM-SC, and LMFP, respectively, with all electrode coatings applied on a blank Al-CC. These overpotentials are negligibly small. However, as discussed in detail before, the electronic resistance becomes significantly larger than the value measured with the 46-point method the moment the dry electrode gets into contact with the electrolyte under the current load conditions inside the electrochemical cell. A significant increase over cell lifetime, which was not automatically captured using the 46-point method, was observed too.
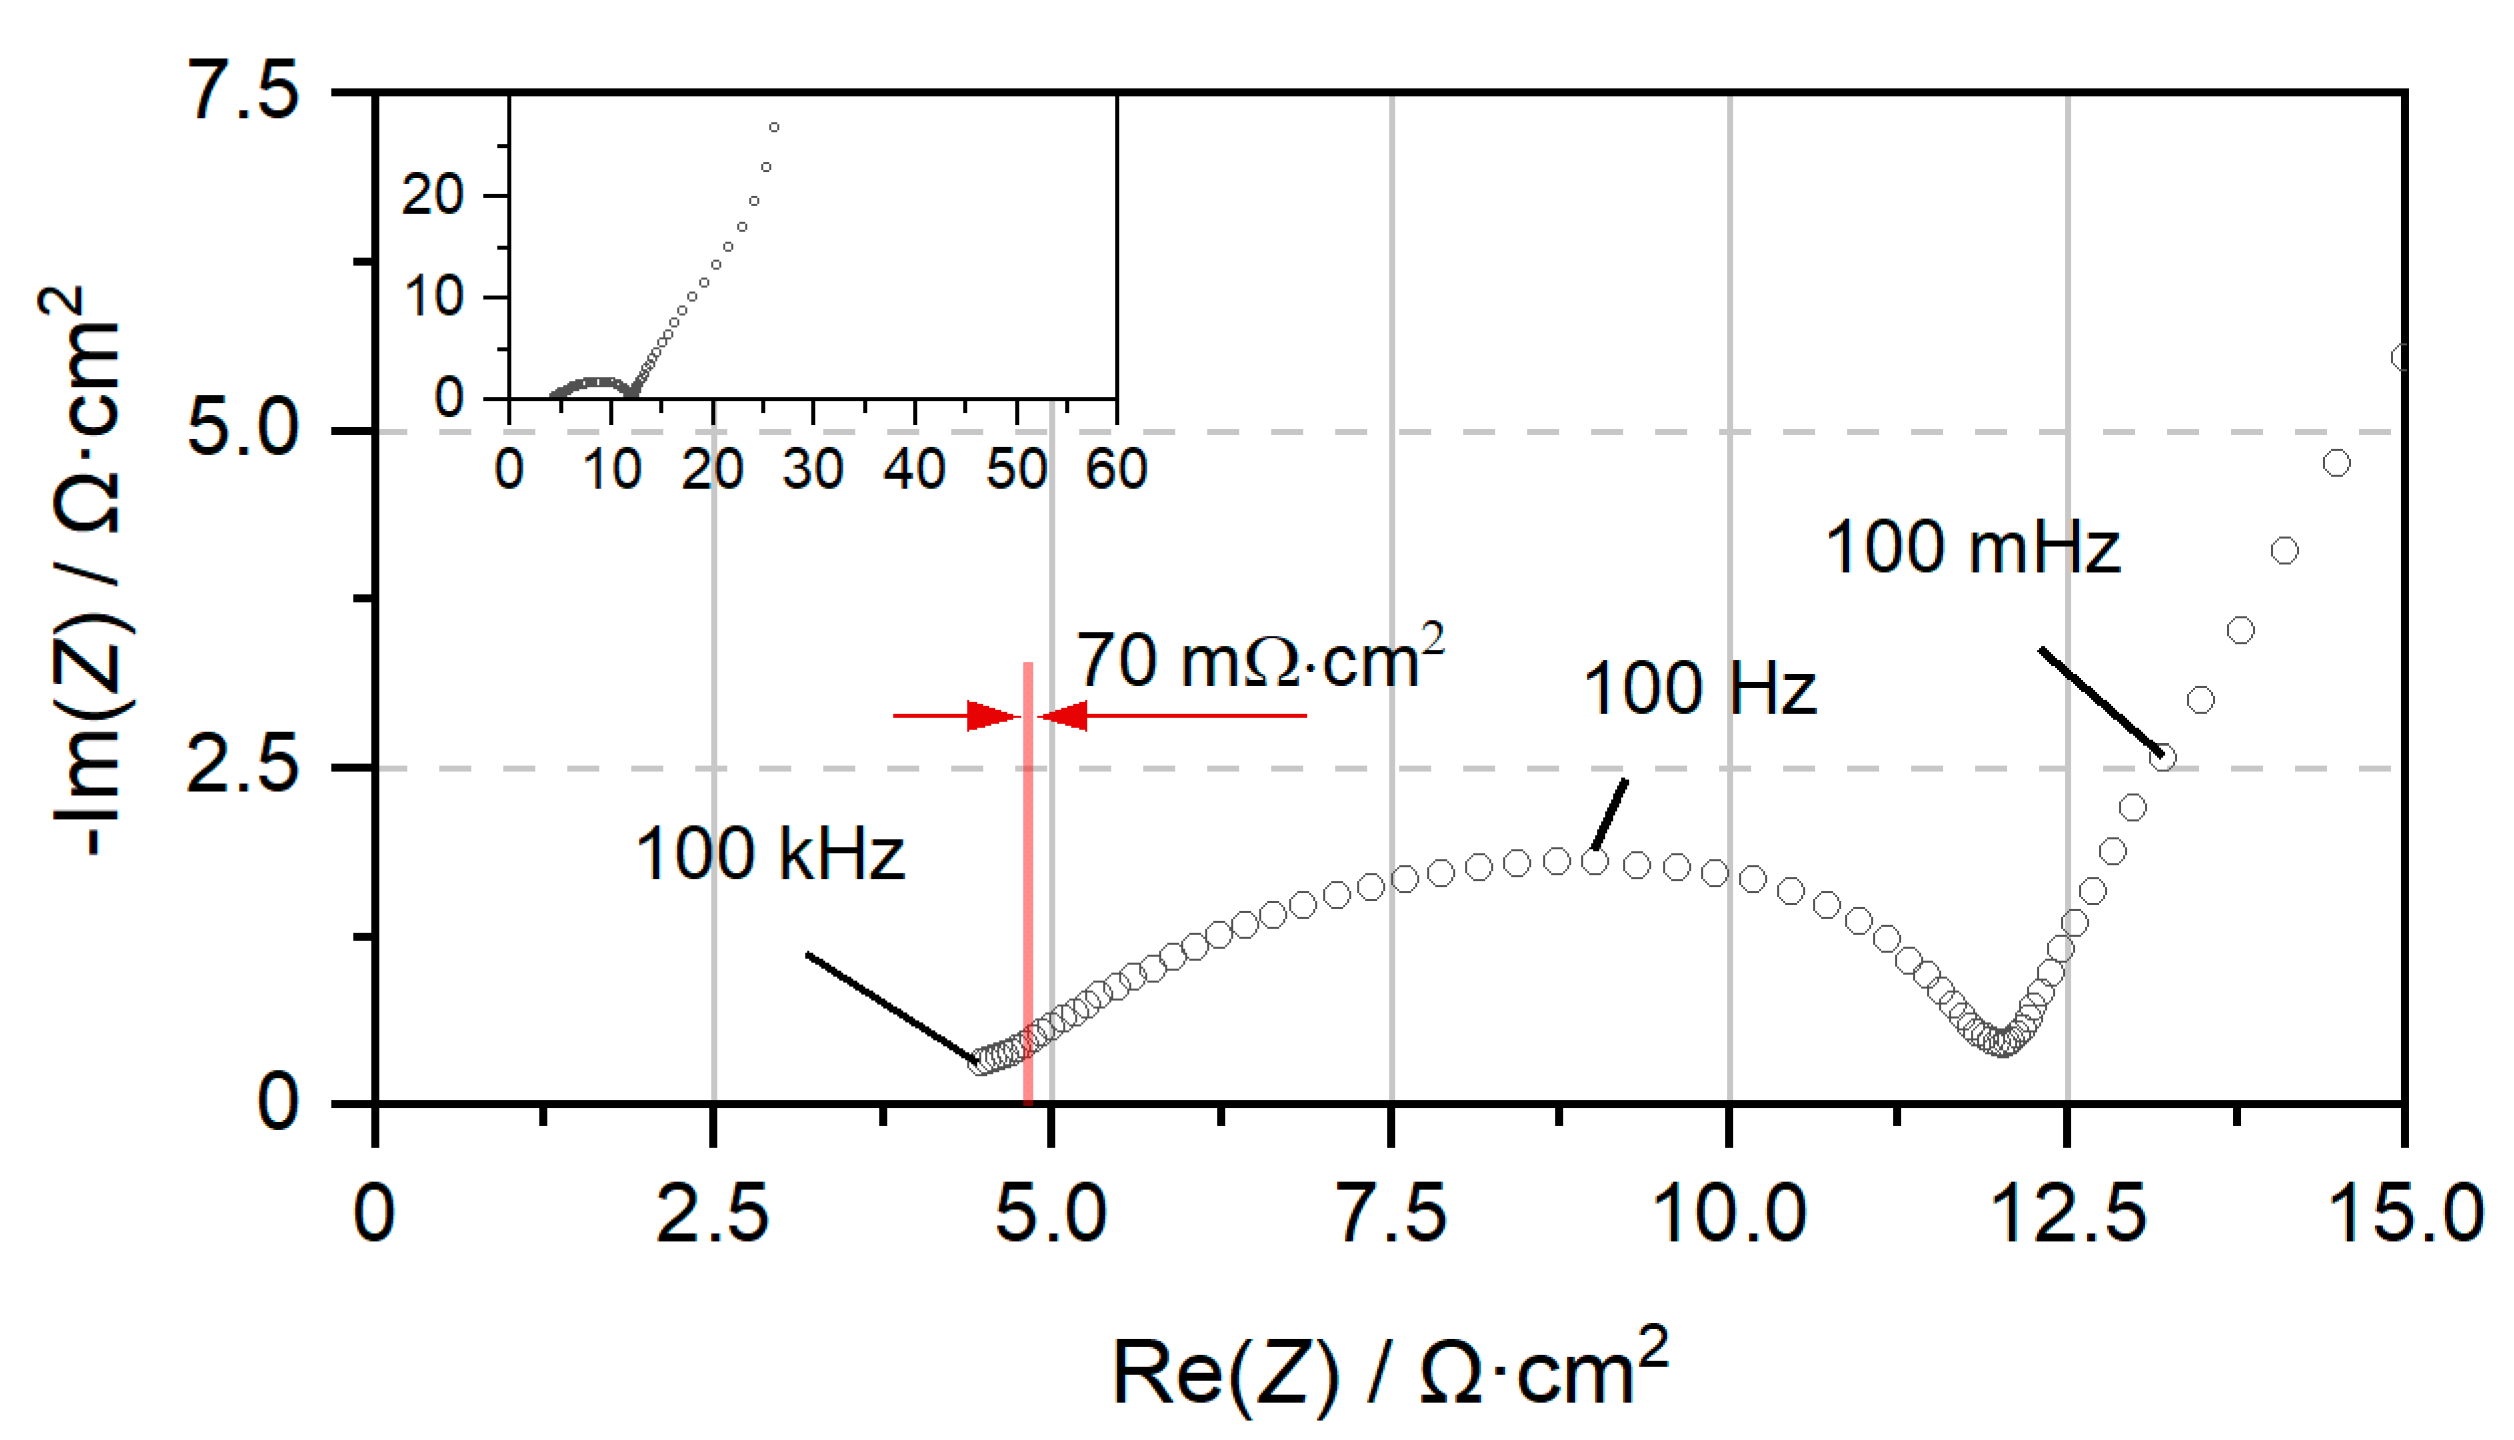
The very low R
Contact of Ni90-NCM-PC was also verified using the EIS spectra in
Figure 7. The spectra show no evidence of any R
Contact. Even if the magnitude of R
Contact would be 10 times larger in EIS than in the 46-point method (a value similar to that of Ni88-NCM-SC), its impact would still be negligible, as indicated by the thickness of the red line for a 70 mΩ∙cm
2 resistance contribution. These findings indicate that for Ni90-NCM-PC, a further decrease in conductive additive can be applied in the recipe without any loss in performance. In this case, the forecast based on 46-point probe data, namely that R
Contact will be insignificant in the case of Ni90-NCM-PC, proved to be correct. These findings highlight the great potential of the 46-point probe method when applied as a fast and easy predictor of electronic resistance for various electrodes and cell designs. It opens the opportunity for, e.g., fast iterations in electrode recipe optimization based on different active materials, conductive additives and current collector combinations without the need for testing in electrochemical cells. This aspect is currently under further investigation in our group and will be reported on in the near future.
3.4. Influence of Porosity on Electronic Resistances for Different CAMs
As addressed above and also shown in various published EIS studies, R
Contact usually exhibits a strong dependence on electrode porosity.
Figure 8a discloses the dependences of ASR
Contact and ASR
Compound derived from the 46-point probe measurement on electrode porosity for Ni90-NCM-PC, Ni88-NCM-SC and partly for LMFP. It should be noted that for Ni90-NCM-PC and Ni88-NCM-SC, a cathode coating with 50% porosity corresponds to the uncalendered state, whereas for LMFP, a 50% porosity can be reached only through significant calendering (≈62% porosity in uncalendered state). The following strong impacts of calendering are clearly visible for the NCM cathodes:
In the first calendering step from 50% to 35% porosity, the total electronic resistance decreases by a factor of about 10, in the case of the Ni90-NCM-PC, from 367 mΩ·cm2 to 21 mΩ·cm2 and for Ni88-NCM-SC, from 1330 mΩ·cm2 to 190 mΩ·cm2.
In the second step to 27% porosity, the resistance is again roughly halved to 11 mΩ·cm2 for Ni90-NCM-PC and to 48 mΩ·cm2 for Ni88-NCM-SC.
Starting from the next calendering steps to porosity ≤ 21%, a saturation point seems to be reached for both samples, and there is only a marginal further decrease in resistance.
Interestingly, in contrast to the behaviors of the NCM samples, the LMFP cathode shows no decrease in total electronic resistance when calendered from 50% to 35% porosity. However, the ratio between ASRContact and ASRCompound changes slightly.
In
Figure S8, the electronic resistances for Ni90-NCM-PC at two different loadings are shown. The electrode with high loading (4 mAh∙cm
−2) shows a similar dependence on electrode porosity as observed for the 3 mAh∙cm
−2. When examining R
Compound, we can assume that the compound resistivity (Ω∙cm) is equal for identical cathode recipes at different loadings. Considering the fact that at the same porosity, the thickness of the high-loading cathode (4 mAh∙cm
−2) is +33% higher than the low-loading cathode (3 mAh∙cm
−2), it is rational to conclude that the ASR
Compound increases by +33% as well. For the Ni90-NCM-PC cathodes in
Figure 8a, for example, at 21% porosity, the ASR
Compound is 3.4 mΩ·cm
2 (low loading) and 4.6 mΩ·cm
2 (high loading). The difference is +35%, which is very close to the predicted value. At other electrode porosities, the difference is in a similar range. The confirmation of these assumptions strongly indicates that the measured compound resistivity is a reliable value when normalized to electrode thickness (i.e., volume resistivity in Ω∙cm).
Figure 8b shows SEM pictures and a schematic representation of the electrodes. We observed that the hard Ni90-NCM-PC particles were strongly dented into the Al-CC during calendering, thereby making full-body contact with the CC. We call this effect “anchoring”. For the LMFP coating, in contrast, this anchoring does not happen. We presume that the secondary LMFP structure consisting of agglomerated, nanosized primary particles plus pores (for better electrolyte access) is partially crushed during alendaring. Due to this effect, the calendering force is homogeneously distributed within the active material layer itself, forming a very compact, dense layer of numerous small primary particles but no indentation of particles into the CC. The observed absence of particle anchoring results in insufficient electronic contact (measurably high R
Contact). The absence of particle anchoring also has an impact on the adhesion strengths of the coatings. The results of 90° peel strength tests are presented in
Figure S9. With higher degrees of particle anchoring, the peel strength is increasing. Therefore, it is possible, under certain limitations (same formulation, similar CAM), to use the peel strength as a rough proxy for the electronic resistance of a cathode [
38]. Even though there were significant differences in peel strength, all coatings had sufficient adhesion on the CC. These results emphasize the significant influence of porosity on the electronic resistance of electrodes and underline that porosity and particle morphology have to be carefully considered when evaluating or comparing published data.

 and
and 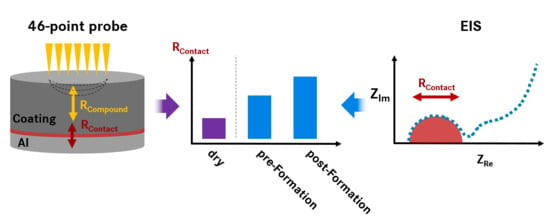


