
Facile Fabrication of PANI/Fe2.85Ni0.15O4 Nanocomposites and Their Application for the Effective Degradation of Rhodamine B Dye
 and
and
Abstract
:1. Introduction
2. Materials and Methods
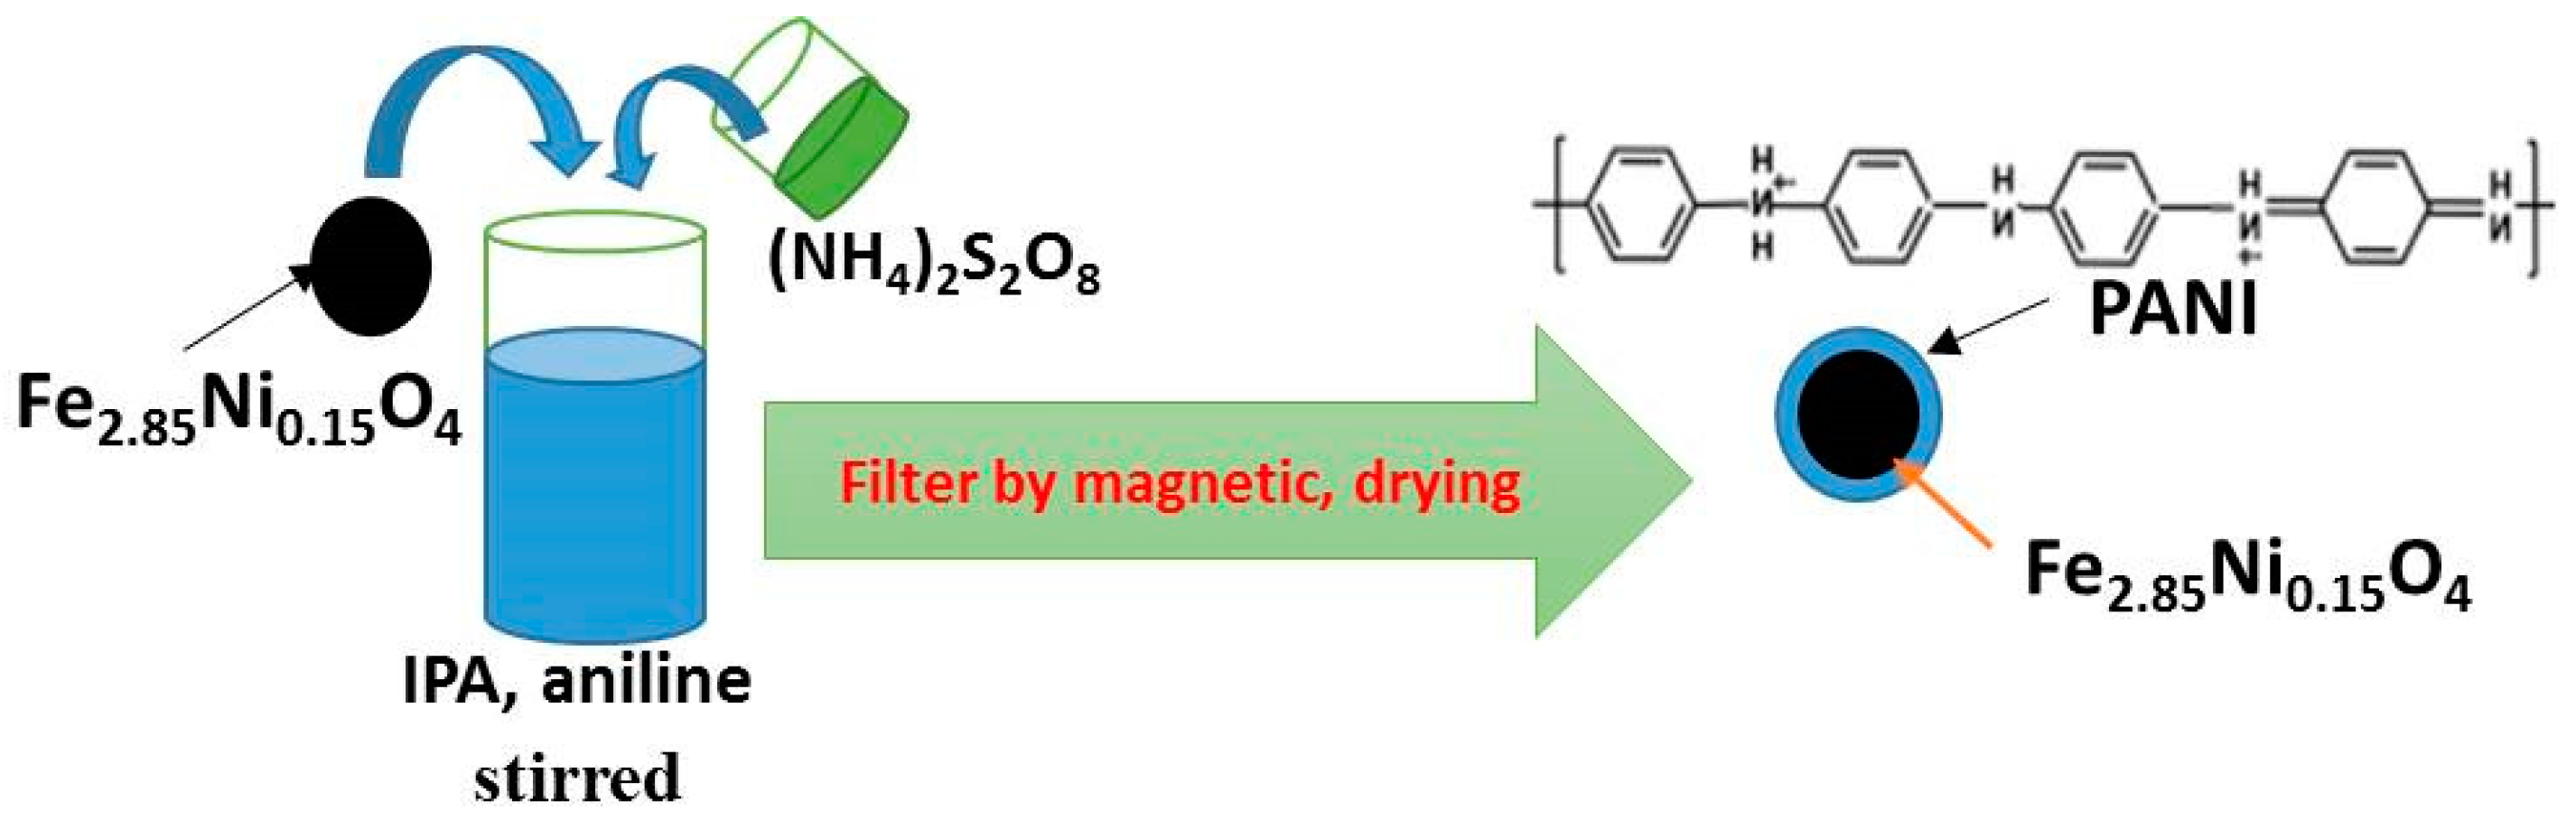
2.1. Sample Preparation
2.2. Characterization
- Photocatalytic Testing
3. Results and Discussion
3.1. X-ray Diffraction Analysis
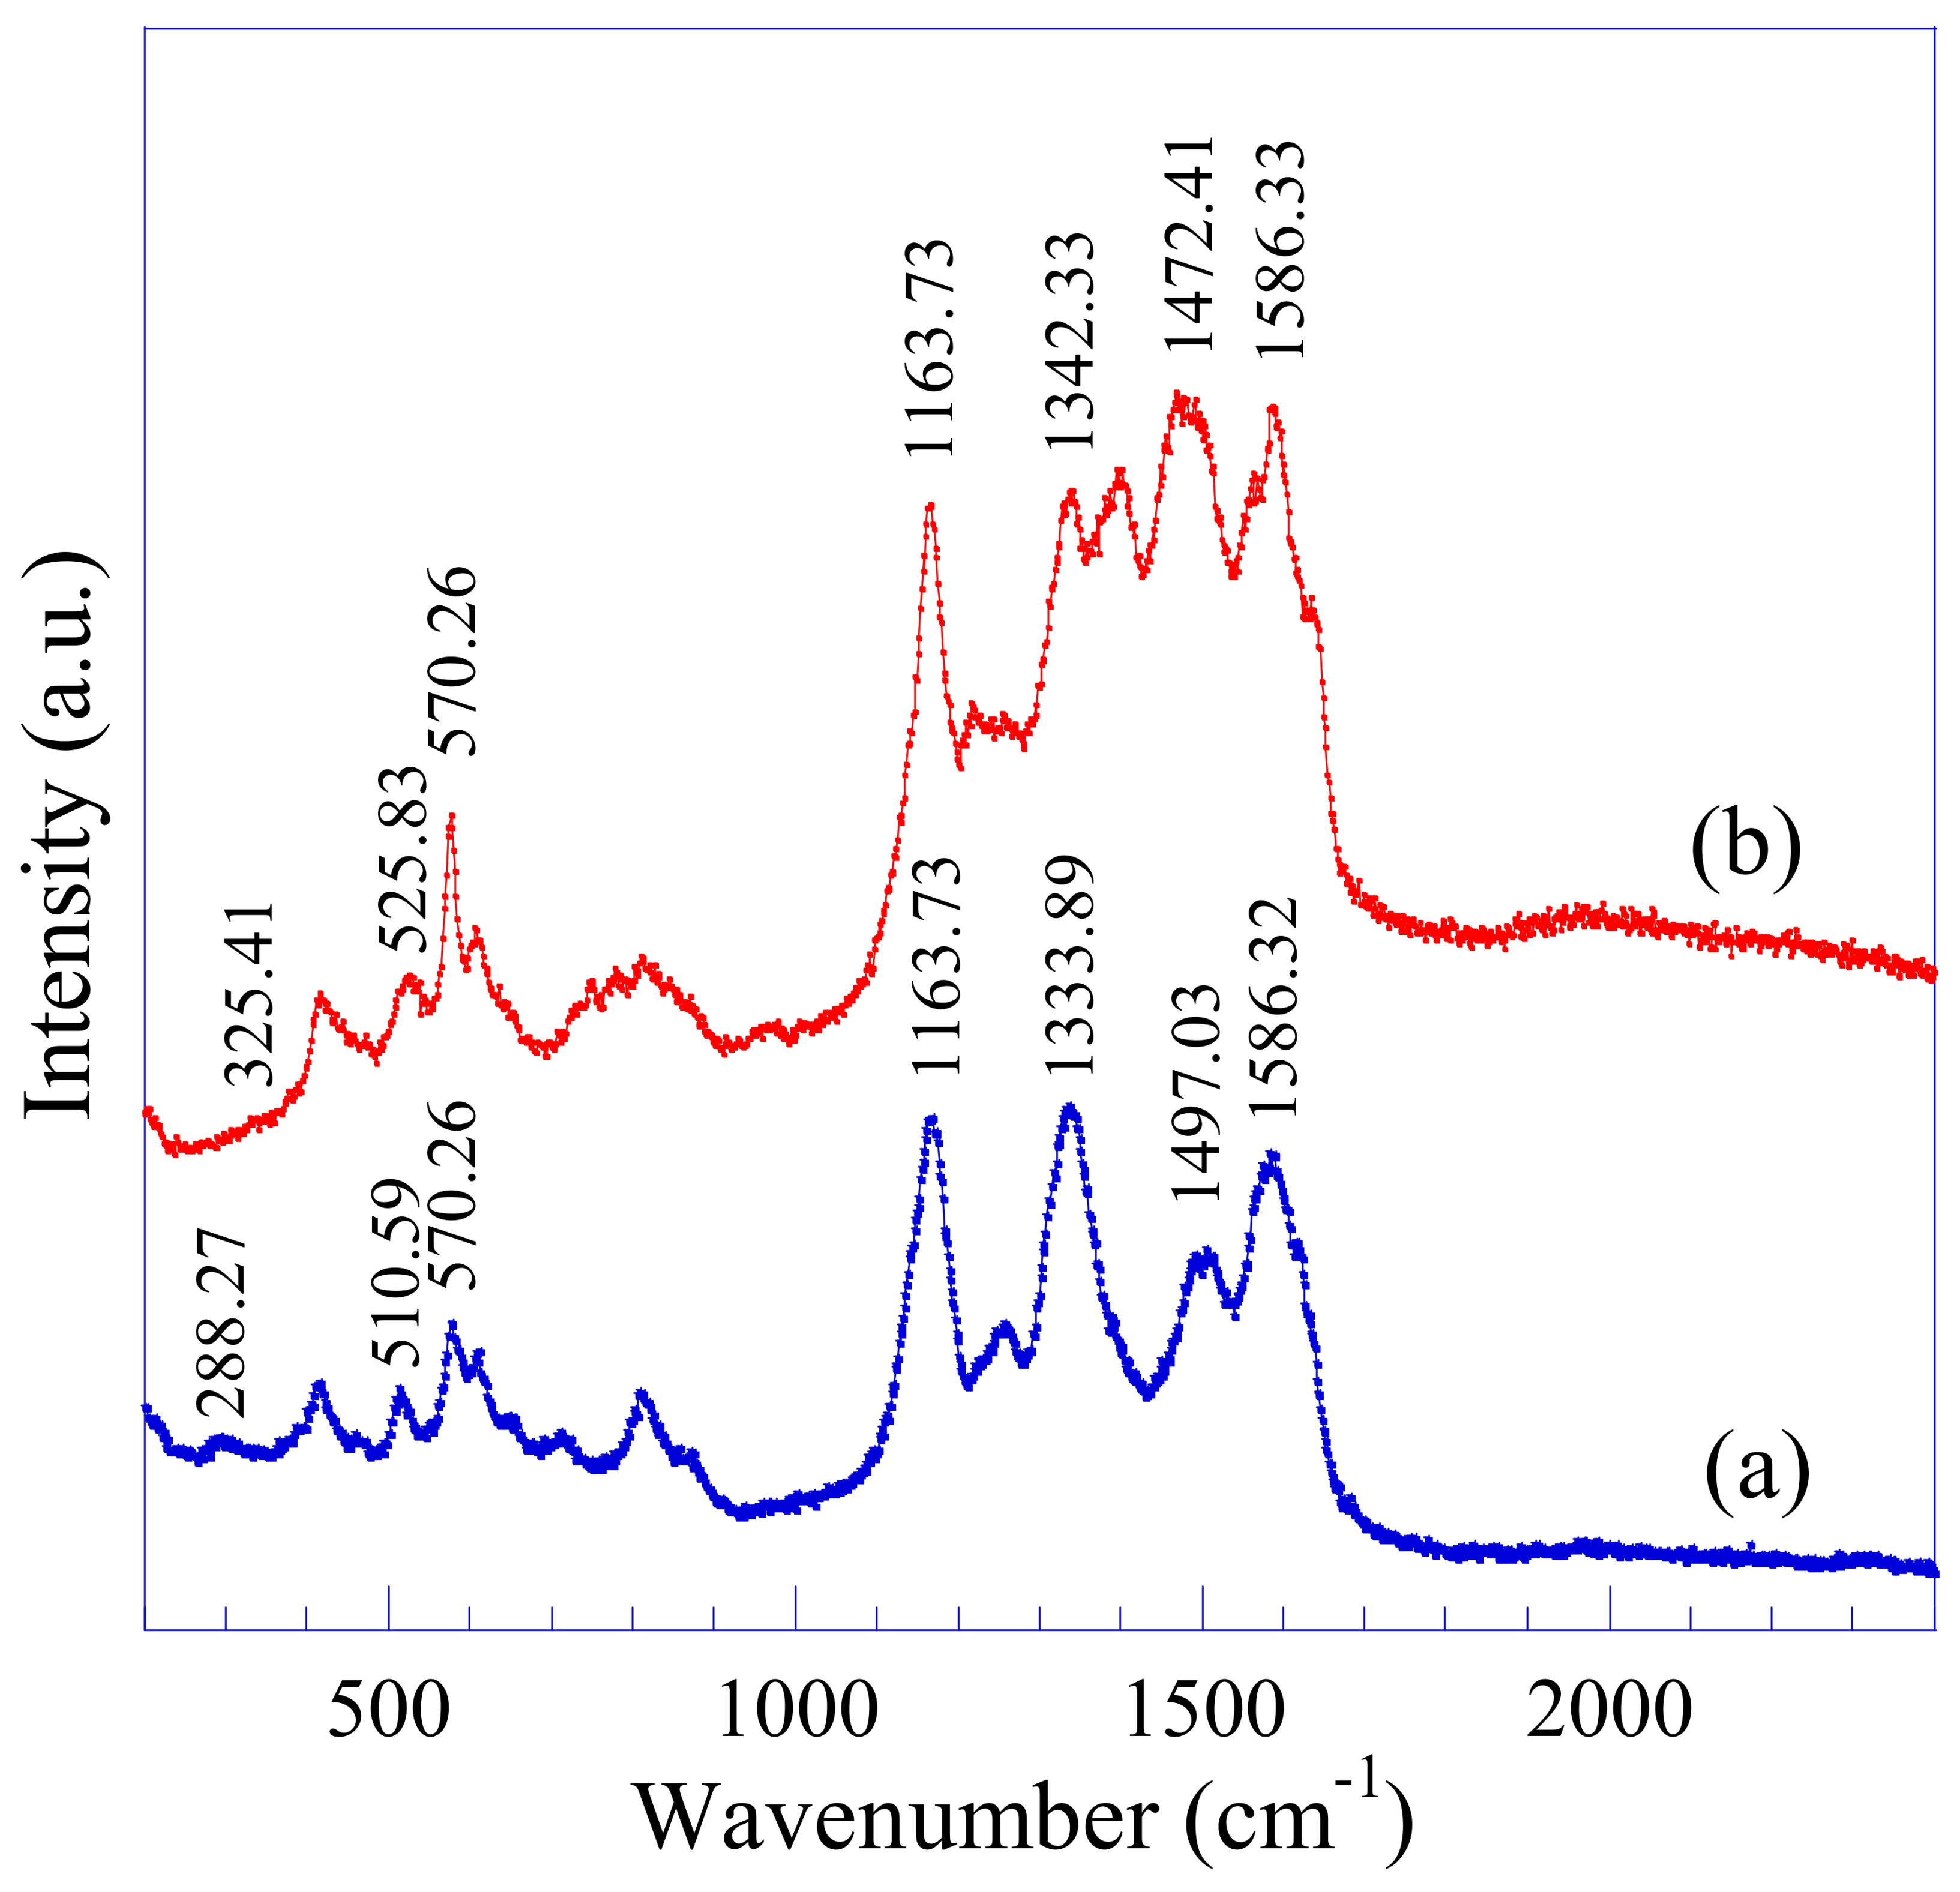
3.2. Raman Analysis
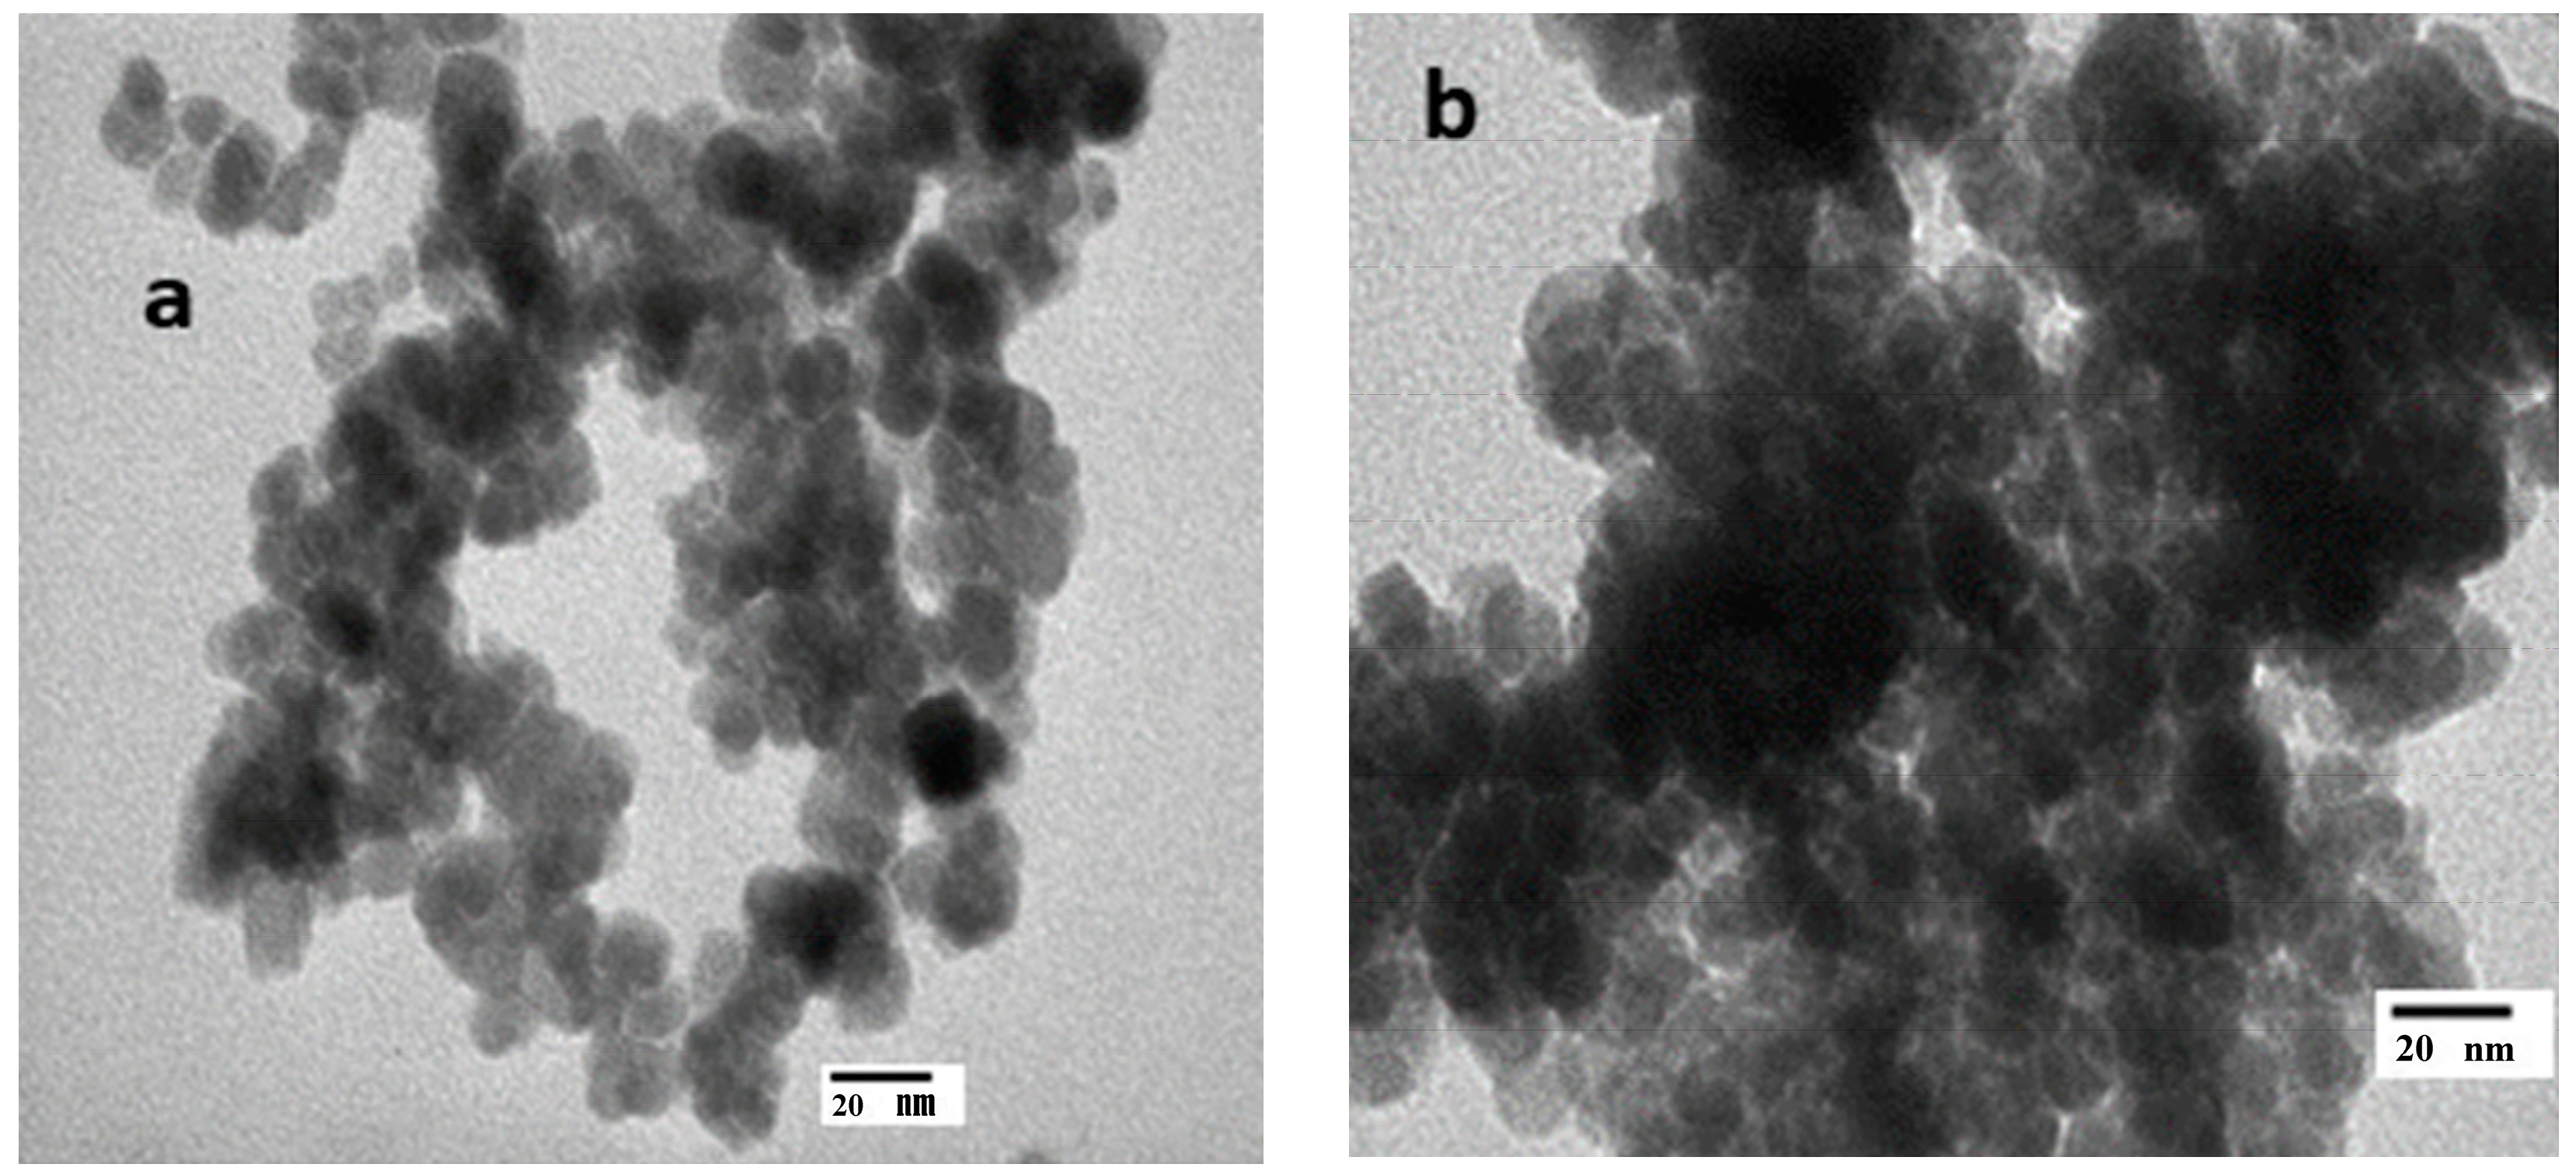
3.3. Morphology
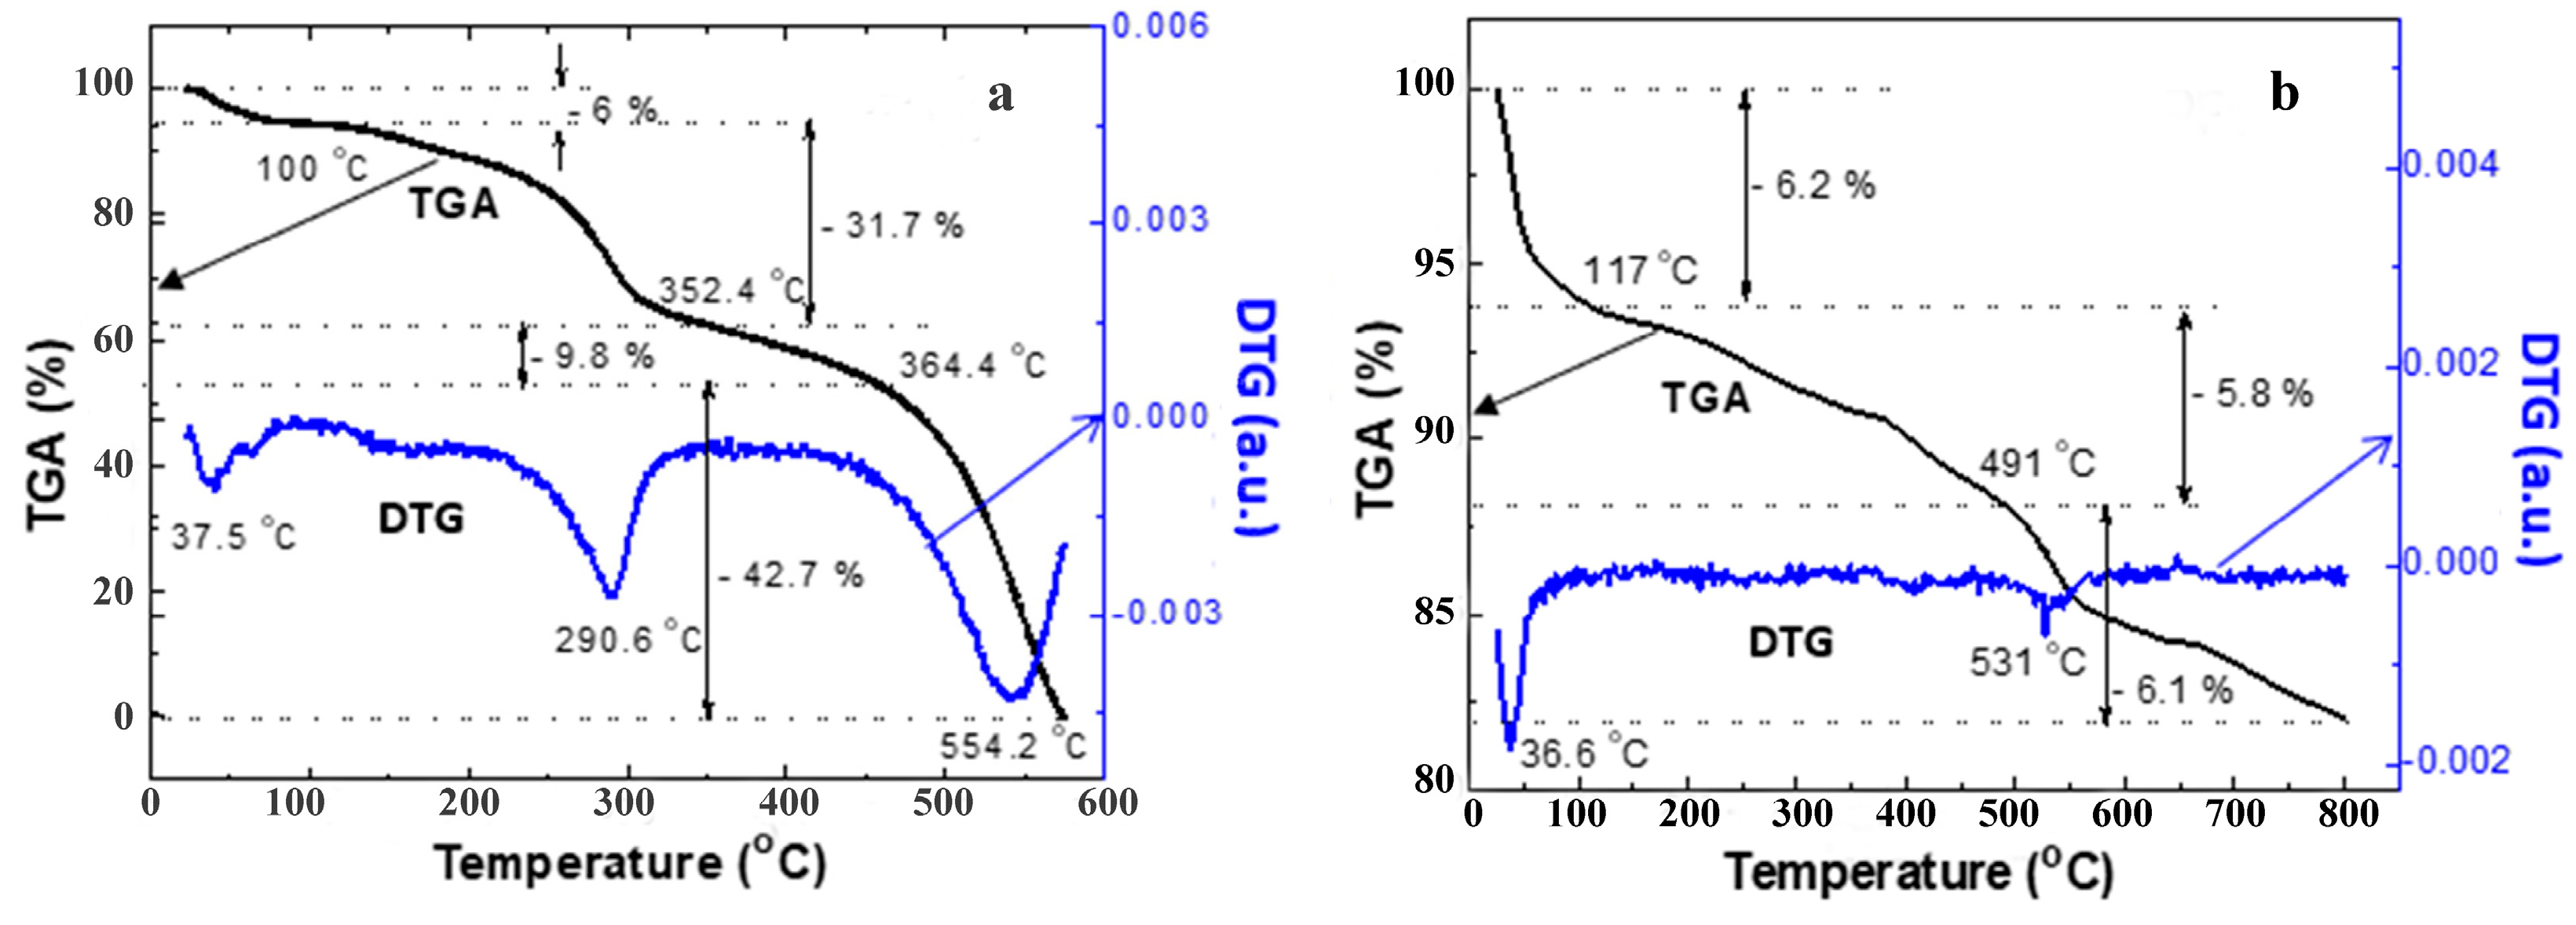
3.4. DTA-DTG Analysis
3.5. Magnetic Property Analysis
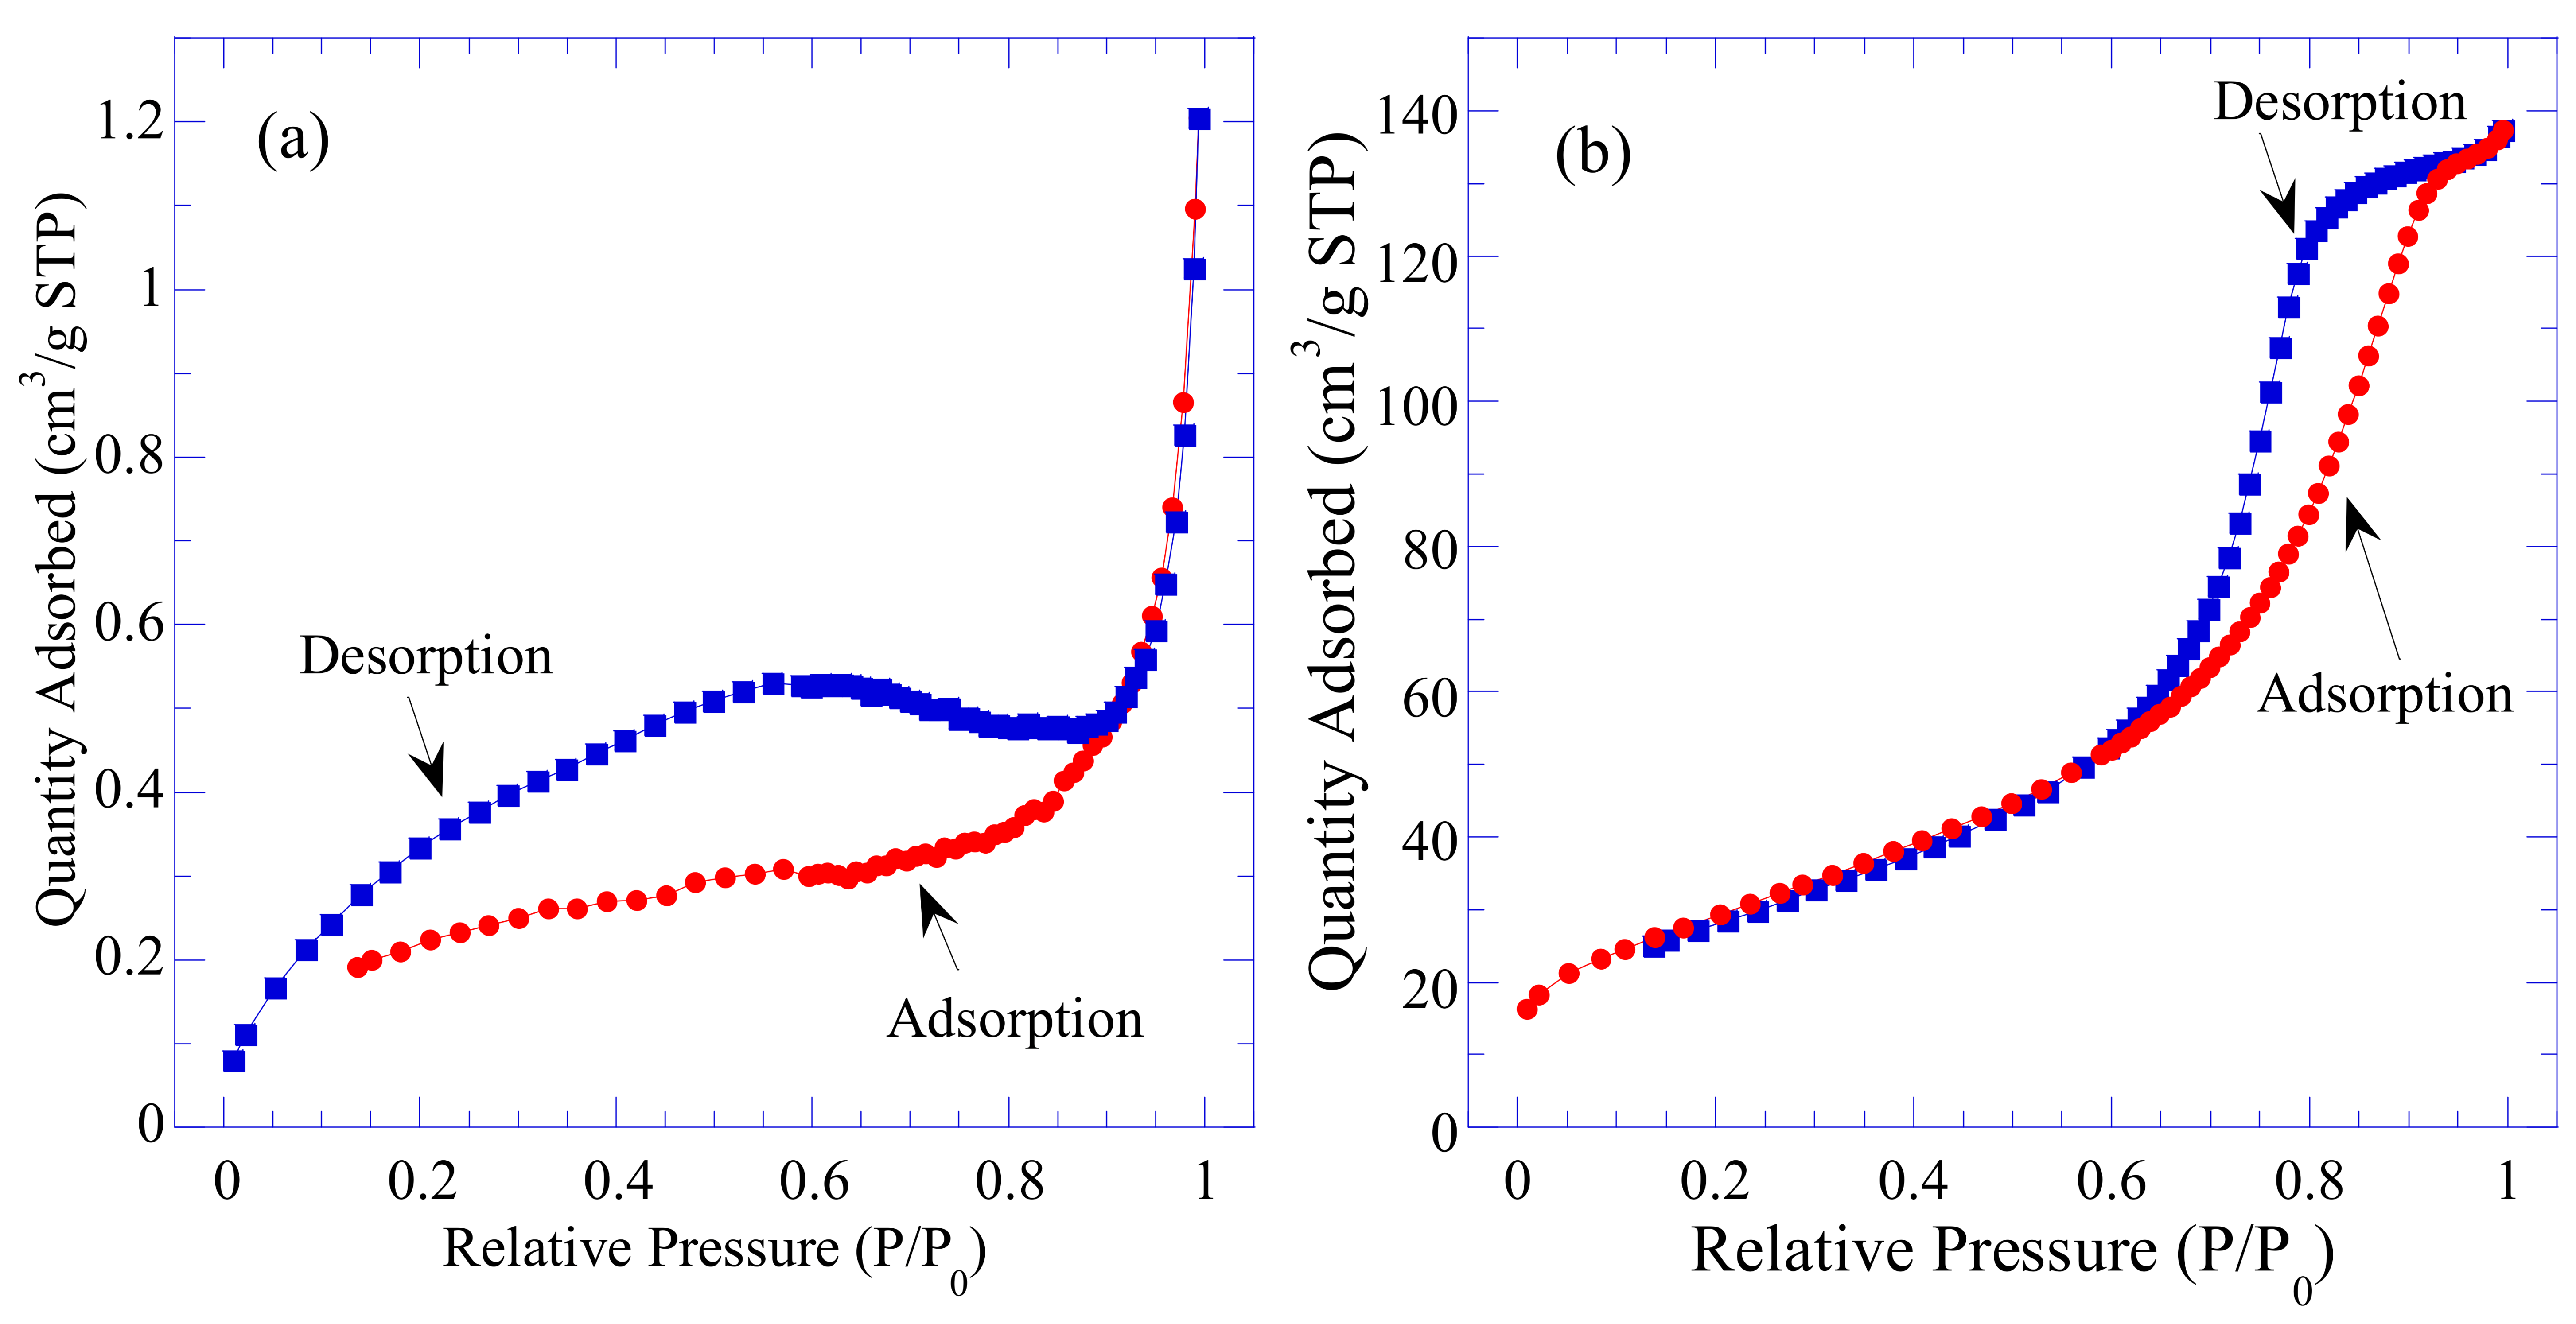
3.6. Specific Surface Area Analysis
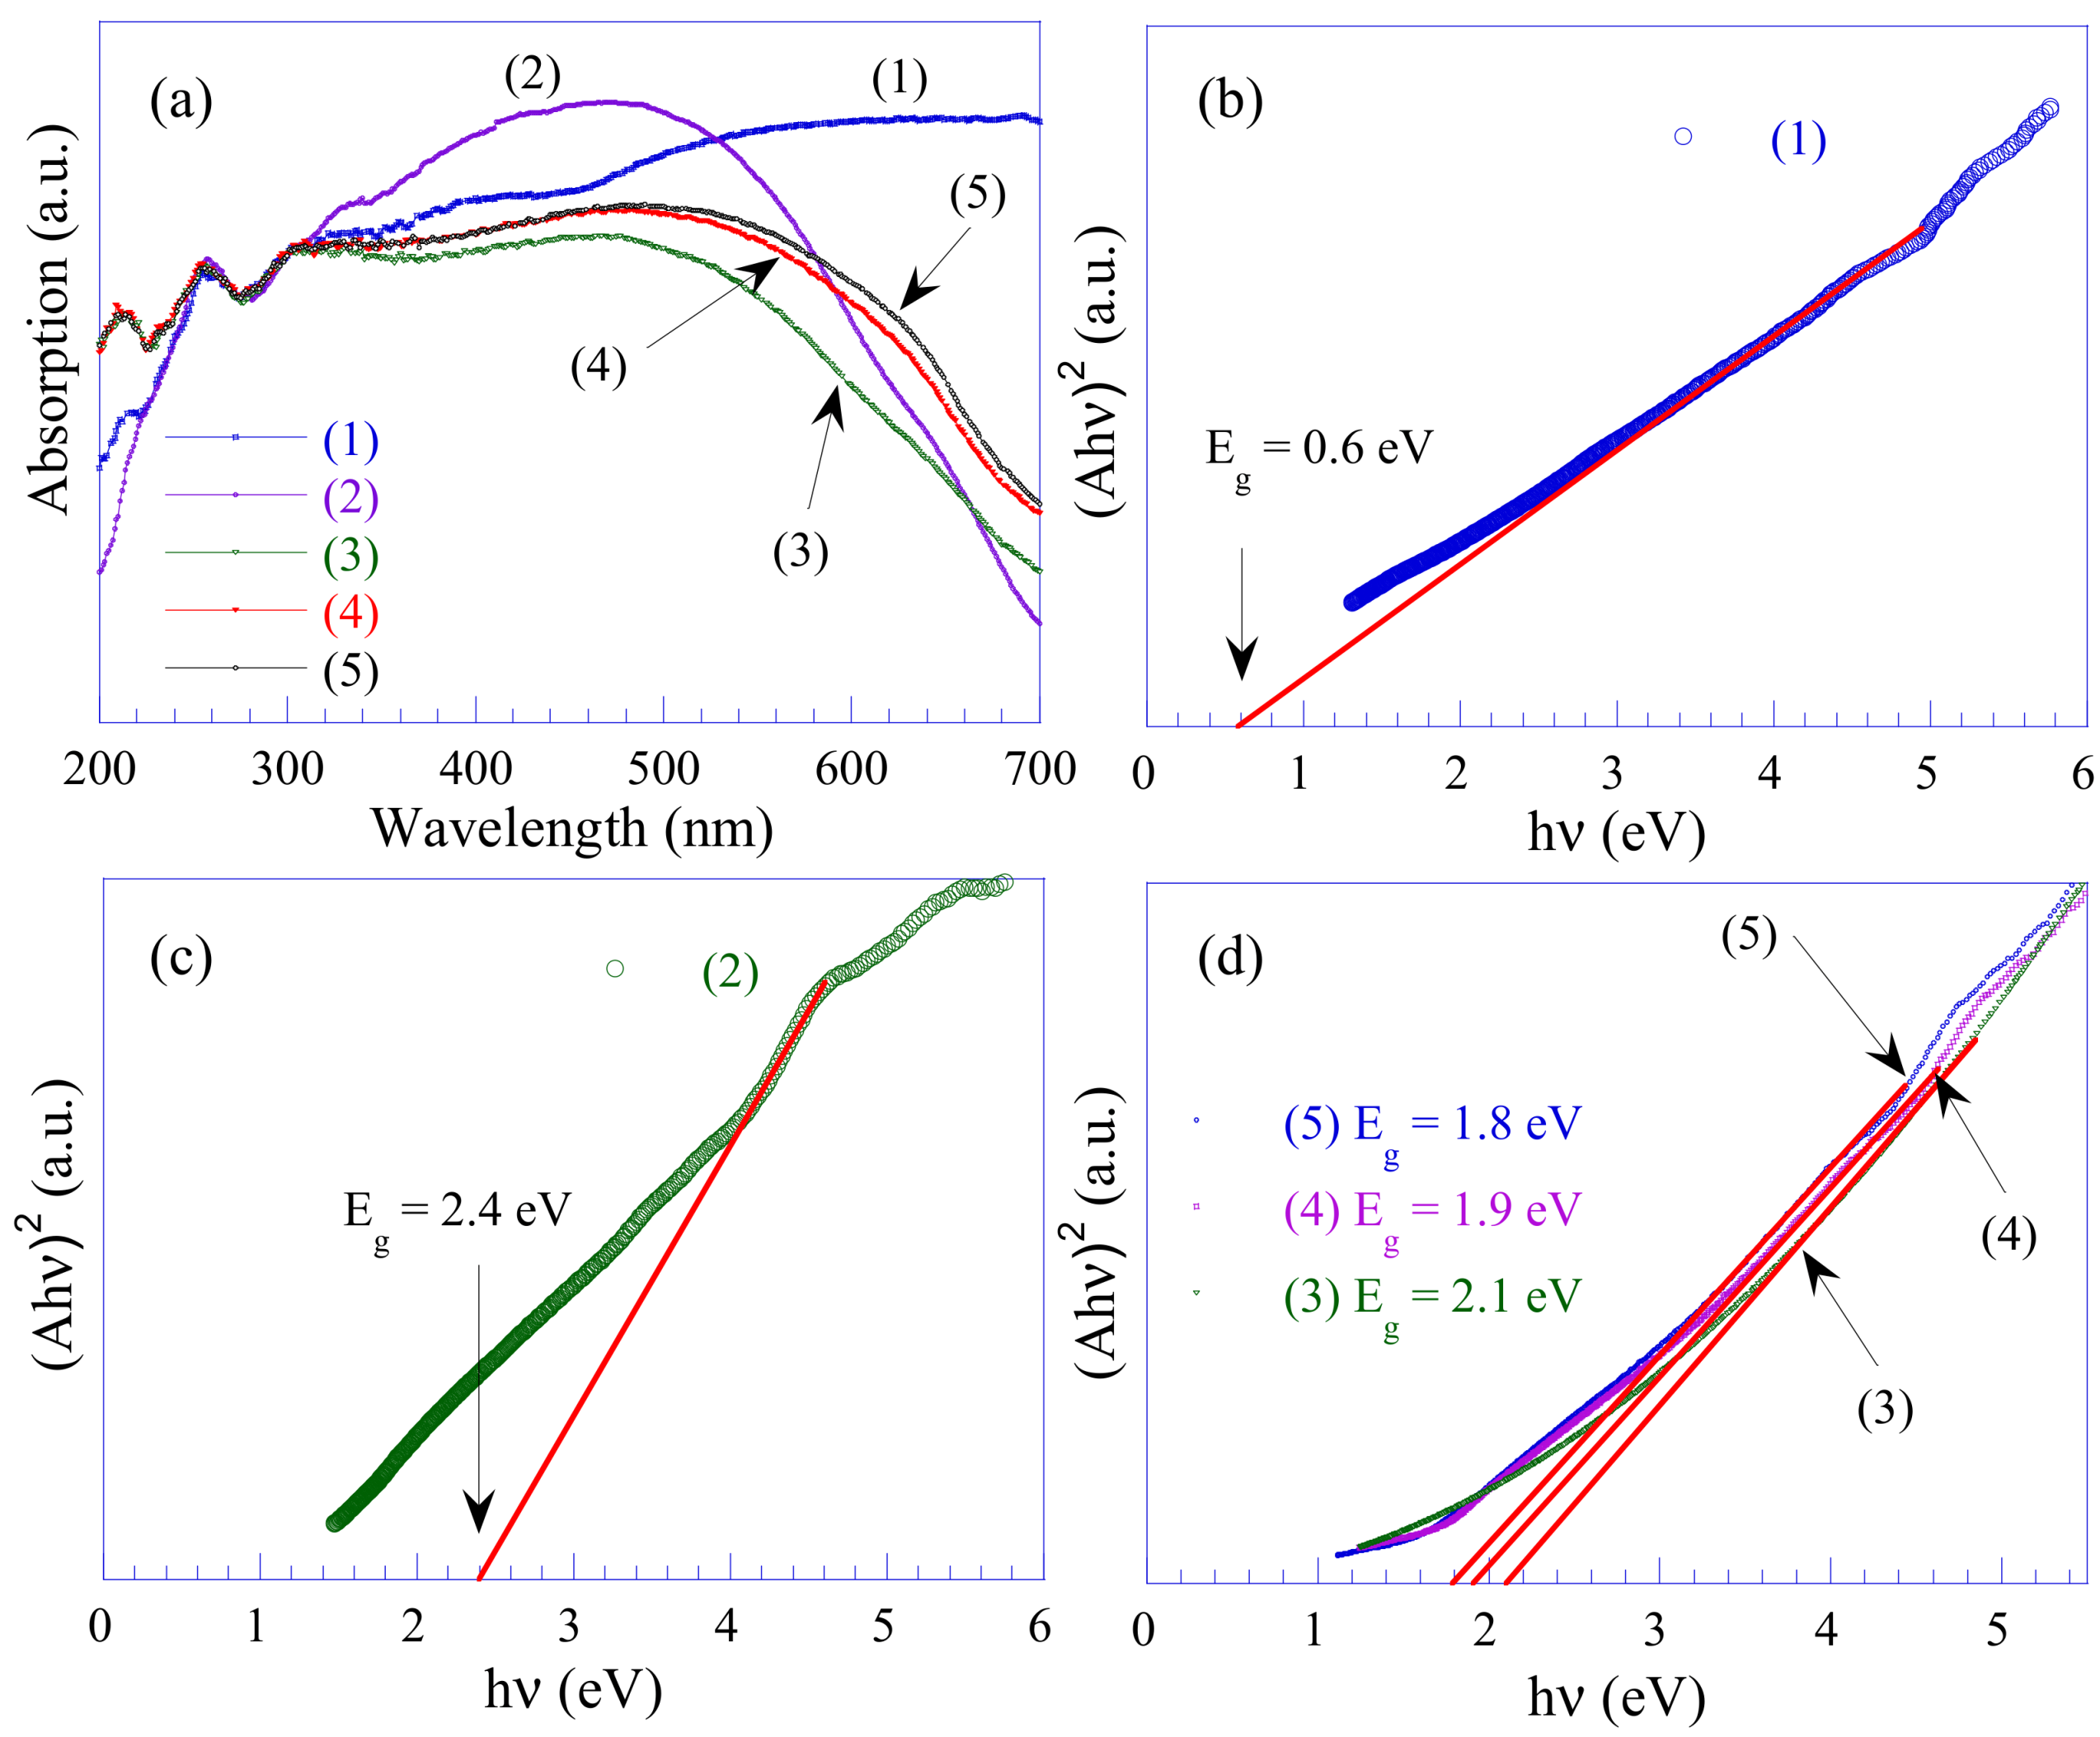
3.7. UV-Vis Analysis
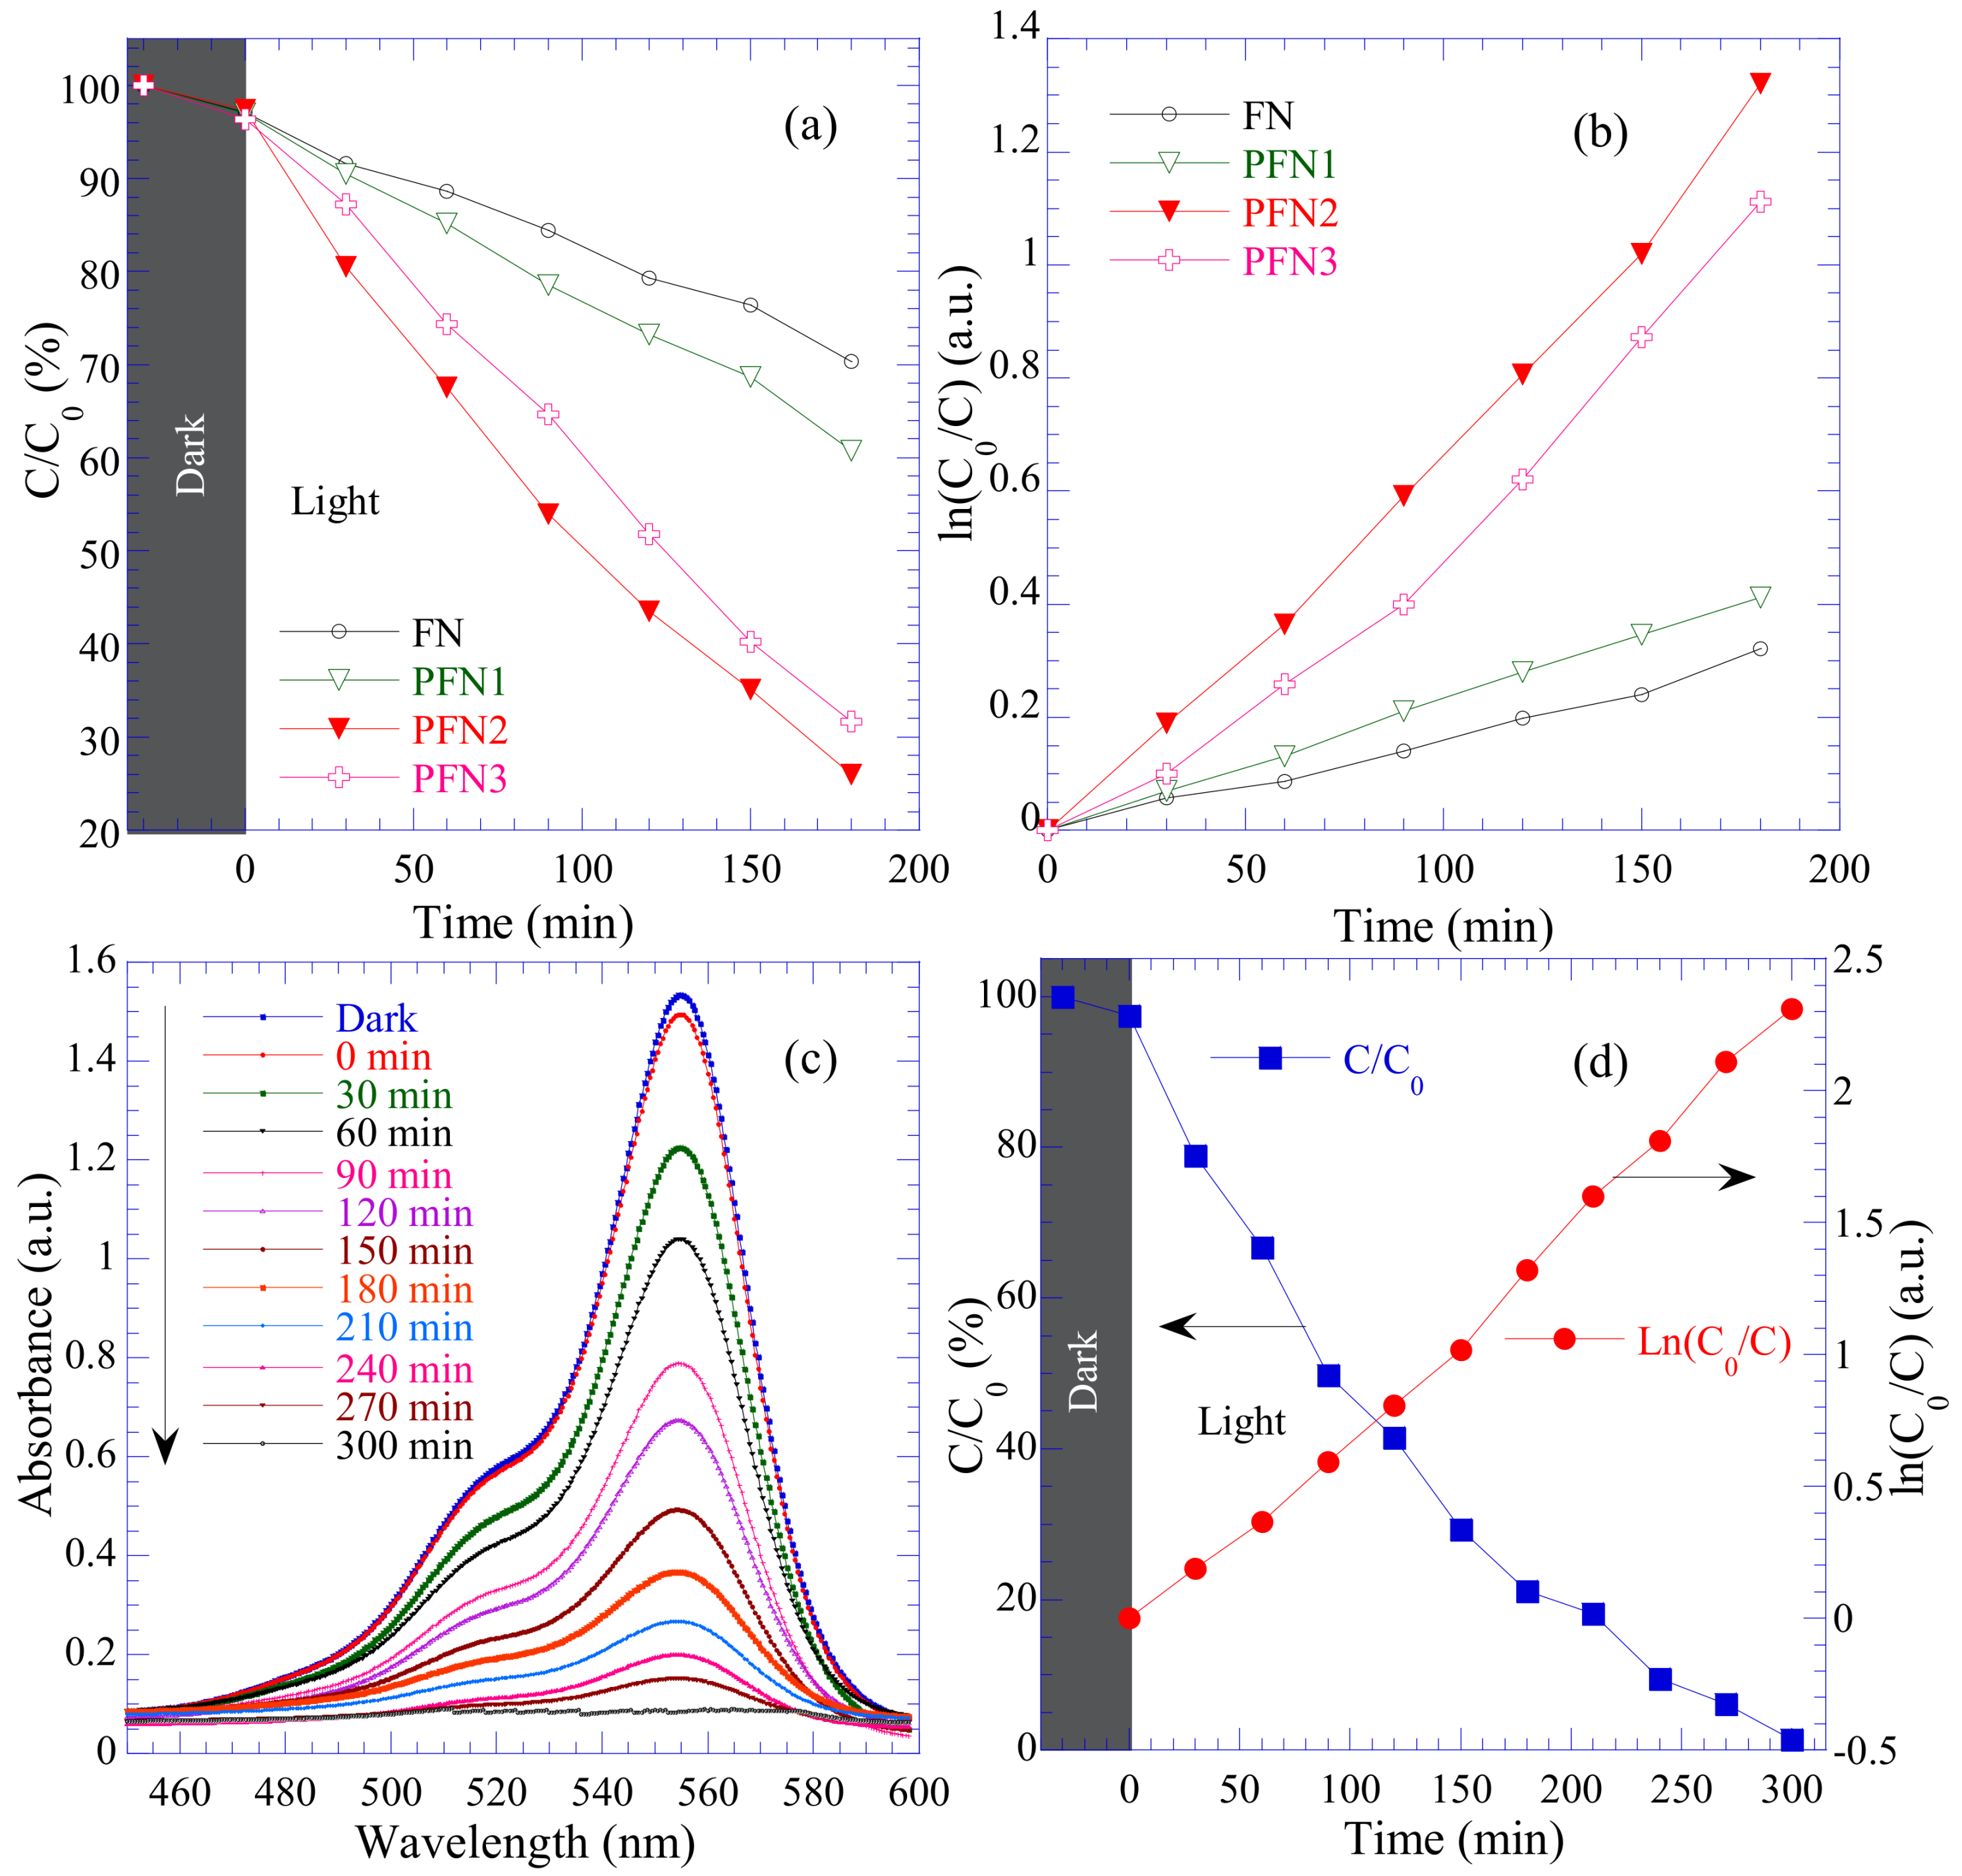
3.8. Photocatalytic Activity of PANI/FN Nanocomposites
3.9. Photodegradation Mechanism
4. Conclusions
Author Contributions
Funding
Institutional Review Board Statement
Informed Consent Statement
Data Availability Statement
Conflicts of Interest
References
- Sudarshan, S.; Bharti, V.S.; Harikrishnan, S.; Shukla, S.P.; Bhuvaneswari, G.R. Eco-toxicological effect of a commercial dye Rhodamine B on freshwater microalgae. Chlorella vulgaris. Arch. Microbiol. 2022, 204, 658. [Google Scholar] [CrossRef] [PubMed]
- Al-Gheethi, A.A.; Azhar, Q.M.; Kumar, P.S.; Yusuf, A.A.; Buriahi, A.K.; Mohamed, R.M.S.R.; Shaibani, M.M. Sustainable approaches for removing Rhodamine B dye using agricultural waste adsorbents: A review. Chemosphere 2022, 287, 132080. [Google Scholar] [CrossRef] [PubMed]
- Hamdaoui, O. Intensification of the sorption of Rhodamine B from aqueous phase by loquat seeds using ultrasound. Desalination 2011, 271, 279–286. [Google Scholar] [CrossRef]
- Bhat, S.A.; Rashid, N.; Rather, M.A.; Bhat, S.A.; Ingole, P.P.; Bhat, M.A. Highly efficient catalytic reductive degradation of Rhodamine-B over Palladium-reduced graphene oxide nanocomposite. Chem. Phys. Lett. 2020, 754, 137724. [Google Scholar] [CrossRef]
- Maji, N.; Dosanjh, H.S. Ferrite Nanoparticles as Catalysts in Organic Reactions: A Mini Review. Magnetochemistry 2023, 9, 156. [Google Scholar] [CrossRef]
- Shahabuddin, S.; Sarih, N.M.; Ismail, F.H.; Shahid, M.M.; Huang, N.M. Synthesis of chitosan grafted-polyaniline/Co3O4 nanocube nanocomposites and their photocatalytic activity toward methylene blue dye degradation. RSC Adv. 2015, 5, 83857–83867. [Google Scholar] [CrossRef]
- Zhou, M.; Han, D.; Liu, X.; Ma, C.; Wang, H.; Tang, Y.; Huo, P.; Shi, W.; Yan, Y.; Yang, J. Enhanced visible light photocatalytic activity of alkaline earth metal ions-doped CdSe/RGO photocatalysts synthesized by hydrothermal method. App. Catal. 2015, 172, 174–184. [Google Scholar] [CrossRef]
- Nam, Y.; Lim, J.H.; Ko, K.C.; Lee, J.Y. Photocatalytic activity of TiO2 nanoparticles: A theoretical aspect. J. Mater. Chem. A 2019, 7, 13833–13859. [Google Scholar] [CrossRef]
- Pawar, M.; Sendogdular, S.T.; Gouma, P.A. Brief Overview of TiO2 Photocatalyst for Organic Dye Remediation: Case Study of Reaction Mechanisms Involved in Ce-TiO2 Photocatalysts System. J. Nanomater. 2018, 2018, 5953609. [Google Scholar]
- Khokhra, R.; Bharti, B.; Lee, H.N.; Kumar, R. Visible and UV photo-detection in ZnO nanostructured thin films via simple tuning of solution method. Sci. Rep. 2017, 7, 15032. [Google Scholar] [CrossRef] [Green Version]
- Ong, C.B.; Ng, L.Y.; Mohammad, A.W. A review of ZnO nanoparticles as solar photocatalysts: Synthesis, mechanisms and applications. Renew. Sustain. Energy Rev. 2018, 81, 536–551. [Google Scholar] [CrossRef]
- Danish, M.S.S.; Estrella, L.L.; Alemaida, I.M.A.; Moiseev, L.N.; Ahmadi, M.; Nazari, M.; Wali, M.; Zaheb, H.; Senjyu, T. Photocatalytic Applications of Metal Oxides for Sustainable Environmental Remediation. Metals 2021, 11, 80. [Google Scholar] [CrossRef]
- Trukhanov, S.V.; Trukhanov, A.V.; Salem, M.M.; Trukhanova, E.L.; Panina, L.V.; Kostishyn, V.G.; Darwish, M.A.; Trukhanov, A.V.; Zubar, T.I.; Tishkevich, D.I.; et al. Preparation and investigation of structure, magnetic and dielectric properties of (BaFe11.9Al0.1O19)1-x-(BaTiO3)x bicomponent ceramics. Ceram. Int. 2018, 44, 21295–21302. [Google Scholar] [CrossRef]
- Wang, P.J.; Zhou, D.; Li, J.; Pang, L.X.; Liu, W.F.; Su, J.Z.; Singh, C.; Trukhanov, S.; Trukhanov, A. Significantly enhanced electrostatic energy storage performance of P (VDF-HFP)/BaTiO3-Bi(Li0.5Nb0.5)O3 nanocomposites. Nano Energy 2020, 78, 105247. [Google Scholar] [CrossRef]
- Karpinsky, D.V.; Silibin, M.V.; Trukhanov, S.V.; Trukhanov, A.V.; Zhaludkevich, A.L.; Latushka, S.I.; Zhaludkevich, D.V.; Khomchenko, V.A.; Alikin, D.O.; Abramov, A.S.; et al. Peculiarities of the crystal structure evolution of BiFeO3-BaTiO3 ceramics across structural phase transitions. Nanomaterials 2020, 10, 801. [Google Scholar] [CrossRef] [PubMed] [Green Version]
- Anbari, R.; Obaidy, A.; Abd, E. Photocatalytic activity of Fe3O4 under solar radiation. Mesop. Environ. J. 2016, 2, 41–53. [Google Scholar]
- Liu, M.; Ye, Y.; Ye, J.; Gao, T.; Wang, D.; Chen, G.; Song, Z. Recent Advances of Magnetite (Fe3O4)-Based Magnetic Materials in Catalytic Applications. Magnetochemistry 2023, 9, 110. [Google Scholar] [CrossRef]
- Rajput, S.; Pittman, C.U.; Mohan, D. Magnetic magnetite (Fe3O4) nanoparticle synthesis and applications for lead (Pb2+) and chromium (Cr6+) removal from water. J. Colloid Interface Sci. 2016, 468, 334–346. [Google Scholar] [CrossRef]
- Kore, R.; Sawant, A.D.; Rogers, R.D. Recyclable magnetic Fe3O4 nanoparticle-supported chloroaluminate ionic liquids for heterogeneous lewis acid catalysis. ACS Sustain. Chem. Eng. 2021, 9, 8797–8802. [Google Scholar] [CrossRef]
- Fatimah, I.; Pratiwi, E.Z.; Wicaksono, W.P. Synthesis of magnetic nanoparticles using Parkia speciosa Hassk pod extract and photocatalytic activity for Bromophenol blue degradation. Egypt. J. Aquat. Res. 2020, 46, 35–40. [Google Scholar] [CrossRef]
- Abbas, M.; Torati, S.R.; Rao, B.P.; Abdel-Hamed, M.O.; Kim, C. Size Controlled Sonochemical Synthesis of Highly Crystalline Superparamagnetic Mn-Zn Ferrite Nanoparticles in Aqueous Medium. J. Alloys Compd. 2015, 644, 774–782. [Google Scholar] [CrossRef]
- Cynthia, W.C.; Warner, L.; Mackie, E.K.; Neiner, D.; Saraf, V.L.; Addleman, S.R. Manganese Doping of Magnetic Iron Oxide Nanoparticles: Tailoring Surface Reactivity for a Regenerable Heavy Metal Sorbent. Langmuir 2012, 28, 3931–3937. [Google Scholar]
- Borhan, A.I.; Samoila, P.; Hulea, V.; Iordan, A.R.; Palamaru, M.N. Correlation between Structural, Magnetic and Electrical Properties of Nanocrystalline Al3+ Substituted Zinc Ferrite. J. Taiwan Inst. Chem. 2014, 45, 1655–1660. [Google Scholar] [CrossRef]
- Cao, Z.; Qin, M.; Gu, Y.; Jia, B.; Chen, P.; Qu, X. Synthesis and characterization of Sn-doped hematite as visible light photocatalyst. Mater. Res. Bull. 2016, 77, 41–47. [Google Scholar] [CrossRef]
- Rahmayeni; Wendari, T.P.; Atmoko, H.M.; Stiadi, Y.; Putri, Y.E.; Zulhadjri. CuFe2O4/activated carbon nanocomposite for efficient photocatalytic degradation of dye: Green synthesis approaches using the waste of oil palm empty bunches and bio-capping agent. Case Stud. Chem. Environ. Eng. 2023, 7, 100305. [Google Scholar] [CrossRef]
- Oktavia, S.H.; Cahyana, A.H.; Hapsari, M.; Yunarti, R.T.; Liandi, A.R. Synthesis and antimicrobial activity of spiro-oxindole-chromene derivative compounds based curcuminoid and chalcone. Rasayan J. Chem. 2021, 14, 1990–1997. [Google Scholar] [CrossRef]
- Lassoued, A.; Lassoued, M.S.; Granda, S.G.; Dkhil, B.; Ammar, S.; Gadri, A. Synthesis and characterization of Ni-doped α-Fe2O3 nanoparticles through co-precipitation method with enhanced photocatalytic activities. J. Mater. Sci. Mater. Electron. 2016, 29, 5726–5737. [Google Scholar] [CrossRef]
- Eskandari, E.; Kosari, M.; Farahani, M.H.D.A.; Khiavi, N.D.; Saeeidikhani, M.; Katal, R.; Zarinejad, M. A Review on Polyaniline-based Materials Applications in Heavy Metals Removal and Catalytic Processes. Sep. Purif. Technol. 2020, 231, 115901. [Google Scholar] [CrossRef]
- Karthik, R.; Meenakshi, S. Biosorption of Pb (II) and Cd (II) ions from aqueous solution using polyaniline/chitin composite. Sep. Sci. Technol. 2016, 51, 733–742. [Google Scholar] [CrossRef]
- Qiu, B.; Xu, C.; Sun, D.; Yi, H.; Guo, J.; Zhang, X.; Qu, H.; Guerrero, M.; Wang, X.; Noel, N. Polyaniline coated ethyl cellulose with improved hexavalent chromium removal. ACS Sustain. Chem. Eng. 2014, 2, 2070–2080. [Google Scholar] [CrossRef]
- Pandimurugan, R.; Thambidurai, S. Synthesis of seaweed-ZnO-PANI hybrid composite for adsorption of methylene blue dye. J. Environ. Chem. Eng. 2016, 4, 1332–1347. [Google Scholar] [CrossRef]
- Afshar, A.; Sadjadi, S.A.S.; Mollahosseini, A.; Eskandarian, M.R. Polypyrrole-polyaniline/Fe3O4 magnetic nanocomposite for the removal of Pb (II) from aqueous solution. Korean J. Chem. Eng. 2016, 33, 669–677. [Google Scholar] [CrossRef]
- Moosavian, M.A.; Moazezi, N. Removal of cadmium and zinc ions from industrial wastewater using nanocomposites of PANI/ZnO and PANI/CoHCF: A comparative study. Desalin. Water Treat. 2016, 57, 20817–20836. [Google Scholar]
- Han, J.; Wang, M.; Cao, S.; Fang, P.; Lu, S.; Chen, R.; Guo, R.J.J.M.C.A. Reactive template strategy for fabrication of MnO2/polyaniline coaxial nanocables and their catalytic application in the oxidative decolorization of rhodamine B. J. Mater. Chem. A 2013, 1, 13197–13202. [Google Scholar] [CrossRef]
- Zhang, B.; Zhao, B.; Huang, S.; Zhang, R.; Xu, P.; Wang, H.L. One-pot interfacial synthesis of Au nanoparticles and Au–polyaniline nanocomposites for catalytic applications. Cryst. Eng. Comm. 2012, 14, 1542–1544. [Google Scholar] [CrossRef]
- Lu, X.; Yu, Y.; Chen, L.; Mao, H.; Gao, H.; Wang, J.; Zhang, W.; Wei, Y. Aniline dimer–COOH assisted preparation of well-dispersed polyaniline–Fe3O4 nanoparticles. Nanotechnology 2005, 16, 1660. [Google Scholar] [CrossRef]
- Xuan, S.; Wang, Y.X.J.; Yu, J.C.; Leung, K.C.F. Preparation, characterization, and catalytic activity of core/shell Fe3O4@ polyaniline@ Au nanocomposites. Langmuir 2009, 25, 11835–11843. [Google Scholar] [CrossRef]
- Phong, L.T.H.; Manh, D.H.; Nam, P.H.; Lam, V.D.; Khuyen, B.X.; Tung, B.S.; Bach, T.N.; Tung, D.K.; Phuc, N.X.; Hung, T.V.; et al. The-Long Phan and Manh Huong Phan, Structural, magnetic and hyperthermia properties and their correlation in cobalt-doped magnetite nanoparticles. RSC Adv. 2022, 12, 698. [Google Scholar] [CrossRef]
- Gabal, M.A.; Al-Juaid, A.A.; El-Rashed, S.; Hussein, M.A.; Al-Angari, Y.M. Polyaniline/Co0.6Zn0.4Fe2O4 core-shell nano-composites, Synthesis, characterization and properties. J. Alloys Compd. 2018, 747, 83–90. [Google Scholar] [CrossRef]
- Gabal, M.A.; Hussein, M.A.; Hermas, A.A. Synthesis, Characterization and Electrical Conductivity of Polyaniline-Mn0.8Zn0.2Fe2O4 Nano-composites. Int. J. Electrochem. Sci. 2016, 11, 4526–4538. [Google Scholar] [CrossRef]
- Koli, P.B.; Kapadnis, K.H.; Deshpande, U.G. Transition metal decorated Ferrosoferric oxide (Fe3O4): An expeditious catalyst for photodegradation of Carbol Fuchsin in environmental remediation. J. Environ. Chem. Eng. 2019, 7, 103373. [Google Scholar] [CrossRef]
- Phong, P.T.; Oanh, V.T.K.; Lam, T.D.; Phuc, N.X.; Tung, L.D.; Thanh, N.T.K.; Manh, D.H. Iron Oxide Nanoparticles: Tunable Size Synthesis and Analysis in Terms of the Core–Shell Structure and Mixed Coercive Model. J. Elec. Mater. 2017, 46, 2533. [Google Scholar] [CrossRef]
- Larumbe, S.; Gómez-Polo, C.; Pérez-Landazábal, J.I.; García-Prieto, A.; Alonso, J.; Fdez-Gubieda, M.L.; Cordero, D.; Gómez, J. Ni Doped Fe3O4 Magnetic Nanoparticles. J. Nanosci. Nanotechnol. 2012, 12, 2652–2660. [Google Scholar] [CrossRef] [PubMed]
- Rajagopalan, B.; Hur, S.H.; Chung, J.S. Surfactant-treated graphene covered polyaniline nanowires for supercapacitor electrode. Nanoscale Res. Lett. 2015, 10, 183. [Google Scholar] [CrossRef] [Green Version]
- Brun, M.; Lallemand, A.; Quinson, J.-F.; Eyraud, C. A new method for the simultaneous determination of the size and the shape of pores: The Thermoporometry. Thermochim. Acta 1977, 88, 85122. [Google Scholar] [CrossRef]
- Guo, C.; Hu, Y.; Qian, H.; Ning, J.; Xu, S. Magnetite (Fe3O4) tetrakaidecahedral microcrystals: Synthesis, characterization, and micro-Raman study. Mater. Charact. 2011, 62, 148–151. [Google Scholar] [CrossRef]
- Yasemian, A.R.; Kashi, M.A.; Ramazani, A. Hyperthermia properties of NixFe3−xO4 nanoparticles: A first-order reversal curve investigation. J. Mater. Sci. Mater. Electron. 2019, 30, 21278–21287. [Google Scholar] [CrossRef]
- Manfei, L.; Yang, L.; Wang, X.; Cheng, X.; Song, Y.; Yin, Y.; Liu, H.; Han, Y.; Cao, K.; Ma, W.; et al. Visible-light photocatalytic capability and the mechanism investigation of a novel PANI/Sn3O4 p–n heterostructure. RSC Adv. 2019, 9, 40694. [Google Scholar]
- Zhang, H.; Zhu, Y. Significant Visible Photoactivity and Antiphotocorrosion Performance of CdS Photocatalysts after Monolayer Polyaniline Hybridization. J. Phys. Chem. C 2010, 114, 5822–5826. [Google Scholar] [CrossRef]
- Jadhav, S.A.; Somvanshi, S.B.; Khedkar, M.V.; Patade, S.R.; Jadhav, K.M. Magneto structural and photocatalytic behavior of mixed Ni–Zn nano spinel ferrites: Visible light enabled active photodegradation of rhodamine B. J. Mater. Sci. Mater. Electron. 2020, 31, 11352–11365. [Google Scholar] [CrossRef]
- Al-Musawi, T.J.; Mengelizadeh, N.; Al-Rawi, O.; Balarak, D. Capacity and Modeling of Acid Blue 113 Dye Adsorption onto Chitosan Magnetized by Fe2O3 Nanoparticles. J. Polym. Environ. 2021, 30, 344–359. [Google Scholar] [CrossRef]
- Enesca, A.; Cazan, C. Polymer Composite-Based Materials with Photocatalytic Applications in Wastewater Organic Pollutant Removal: A Mini Review. Polymers 2022, 14, 3291. [Google Scholar] [CrossRef] [PubMed]
- Matos, R.; Biernacka, I.K.; Rocha, M.; Belo, J.H.; Araújo, J.P.; Estrada, A.C.; Lopes, J.L.; Shah, T.; Korgel, B.A.; Pereira, C.; et al. Design and photo-Fenton performance of Graphene/CuS/Fe3O4 tertiary nanocomposites for Rhodamine B degradation. Catal. Today 2023, 418, 114132. [Google Scholar] [CrossRef]
- Tran, V.V.; Nu, T.T.V.; Jung, H.R.; Chang, M. Advanced Photocatalysts Based on Conducting Polymer/Metal Oxide Composites for Environmental Applications. Polymers 2021, 13, 3031. [Google Scholar] [CrossRef] [PubMed]
- Feng, J.; Hou, Y.; Wang, X.; Quan, W.; Zhang, J.; Wang, Y.; Li, L. In-depth study on adsorption and photocatalytic performance of novel reduced graphene oxide-ZnFe2O4-polyaniline composites. J. Alloys Compd. 2016, 681, 157–166. [Google Scholar] [CrossRef]


| Sample Name | Mass Ratio of PANI in Nanocomposites (%) | SSA (m2/g) | MS (emu/g) | Mr (emu/g) | Eg (eV) | k (×10−3 min−1) |
|---|---|---|---|---|---|---|
| FN | - | 89.05 | 66.5 | 0.27 | 2.4 | 1.74 |
| PFN1 | 5 | 98.25 | 57.6 | 0.18 | 2.1 | 2.27 |
| PFN2 | 10 | 106.87 | 50.0 | 0.33 | 1.9 | 7.31 |
| PFN3 | 15 | 98.88 | 39.5 | 0.19 | 1.8 | 6.17 |
Disclaimer/Publisher’s Note: The statements, opinions and data contained in all publications are solely those of the individual author(s) and contributor(s) and not of MDPI and/or the editor(s). MDPI and/or the editor(s) disclaim responsibility for any injury to people or property resulting from any ideas, methods, instructions or products referred to in the content. |
© 2023 by the authors. Licensee MDPI, Basel, Switzerland. This article is an open access article distributed under the terms and conditions of the Creative Commons Attribution (CC BY) license (https://creativecommons.org/licenses/by/4.0/).
Share and Cite
Manh, D.H.; Thi, T.M.; Anh, N.T.N.; Ky, V.H.; Nghia, N.M.; Thanh, T.D. Facile Fabrication of PANI/Fe2.85Ni0.15O4 Nanocomposites and Their Application for the Effective Degradation of Rhodamine B Dye. Magnetochemistry 2023, 9, 195. https://doi.org/10.3390/magnetochemistry9080195
Manh DH, Thi TM, Anh NTN, Ky VH, Nghia NM, Thanh TD. Facile Fabrication of PANI/Fe2.85Ni0.15O4 Nanocomposites and Their Application for the Effective Degradation of Rhodamine B Dye. Magnetochemistry. 2023; 9(8):195. https://doi.org/10.3390/magnetochemistry9080195
Chicago/Turabian StyleManh, Do Hung, Tran Minh Thi, Nguyen Thi Ngoc Anh, Vu Hong Ky, Nguyen Manh Nghia, and Tran Dang Thanh. 2023. "Facile Fabrication of PANI/Fe2.85Ni0.15O4 Nanocomposites and Their Application for the Effective Degradation of Rhodamine B Dye" Magnetochemistry 9, no. 8: 195. https://doi.org/10.3390/magnetochemistry9080195