
13C NMR Chemical Shifts of Saccharides in the Solid State: A Density Functional Theory Study

1
Department of Chemistry, University of Copenhagen, 2100 Copenhagen, Denmark
2
Department of Food Science, University of Copenhagen, 1958 Frederiksberg, Denmark
3
Department of Pharmacy, University of Copenhagen, 2100 Copenhagen, Denmark
*
Author to whom correspondence should be addressed.
†
Current address: Department of Physics, Technical University of Denmark, 2800 Kgs. Lyngby, Denmark.
‡
Current address: LEO Pharma A/S, Industriparken 55, 2750 Ballerup, Denmark.
Magnetochemistry 2023, 9(8), 192; https://doi.org/10.3390/magnetochemistry9080192
Submission received: 24 April 2023
/
Revised: 10 July 2023
/
Accepted: 19 July 2023
/
Published: 26 July 2023
(This article belongs to the Special Issue Computational Chemistry in Nuclear Magnetic Resonance)
Abstract
:In this work we present a systematic, theoretical investigation of the 13C NMR chemical shifts for several mono-, di- and trisaccharides in the solid state. The chemical shifts have been calculated using density functional theory (DFT) together with the gauge including the projector augmented wave (GIPAW) method as implemented in the CASTEP program. We studied the changes in the 13C NMR chemical shifts in particular due to the formation of one or two glycosidic linkages and due to crystal water. The largest changes, up to 14 ppm, are observed between the mono- and disaccharides and typically for the glycosidic linkage atoms, but not in all cases. An analysis of the bond angles at the glycosidic linkage and the observed changes in chemical shifts displays no direct correlation between them. Somewhat smaller changes in the range of 2 to 5 ppm are observed when single crystal water molecules are close to some of the atoms. Relating the changes in the chemical shifts of the carbon atoms closest to the crystal water to the distance between them does, however, not lead to a simple relation between them.
1. Introduction
Mono- and disaccharides are widely distributed in nature and can easily be obtained by decomposition of polysaccharides or isolation from various materials, e.g., milk and marine sources. Due to the accessibility of the saccharides, they are of great interest both for food and pharmaceutical industries. Lactose and maltose are for example used as excipients in tablets. For these applications it is important to characterize these compounds in the greatest possible detail in order to provide the strongest possible foundation for understanding their behavior in different industrial applications.
One of the special characteristics of many mono- and disaccharides is the ability to form glasses which are utilized extensively by food and pharmaceutical companies. However, the characterization of the molecular structure is a challenge due to the lack of crystallinity, which makes it difficult to prepare a glassy product. For this reason, the characterization of the saccharides in the transition between the glassy state and an aqueous solution is of great interest for the evaluation of structural changes during this transition.
Nuclear magnetic resonance (NMR) spectroscopy is the predestined technique to study such changes as the chemical shifts and indirect nuclear spin-spin coupling constants are very sensitive to the nuclear and electronic structure of a molecule. In combination with quantum chemical calculations of these parameters changes in an NMR spectrum can be assigned to changes in the structure of a molecule. In fact, such a study was carried out for some saccharides previously, where 13C chemical shifts of solution NMR spectra were calculated for mono- and disaccharides in order to study the impact of structural modifications on the chemical shifts [1]. The 1H and 13C chemical shifts of several monosaccharides in solution were also studied experimentally to determine the steric effects which give rise to the changes in the chemical shifts due the different conformations [2]. Or more recently, a DFT study of 13C chemical shifts of monosaccharides and sucrose was carried out in order to determine conformational equilibria [3]. In general, the literature on solution phase NMR spectra of carbohydrates is vast and was recently reviewed [4]. For saccharides in the solid state, on the other, one can mention the recent studies of the 13C chemical shifts tensors of solid state NMR spectra for some dissaccharides, i.e., maltose, sucrose and trehalose [5,6] or for -glucose and -glucose monohydrate [7]. However, we are not aware of other computational studies on the solid state NMR spectra of saccharides.
To fill this gap, in the present work we therefore carried out a systematic study of the 13C chemical shifts of the saccharides with known crystal structures but not necessarily known chemical shifts. The most important monosaccharides are -D-glucopyranose (α-glucose) and β-D-glucopyranose (β-glucose) [8,9,10], -D-galactopyranose (α-galactose) and -D-galactopyranose (β-galactose) [11,12] and -D-fructopyranose (β-fructose) [13], as seen in Figure 1. Furthermore, there are several important disaccharides, -D-fructofuranos yl-(2→1)--D-glucopyranoside (sucrose) [14,15], -D-glucopyranosyl-(1→4)--D-glucopyra noside (α-maltose) [16,17], -D-gluco-pyranosyl-(1→1)--D-glucopyranoside (trehalose) [18,19], -D-gluopyranosyl-(1→4)--D-glucopyranoside (β-cellobiose) [20] and -D-galactopyranosyl-(1→4)--D-glucopyranoside (α-lactose) and -D-galactopyranosyl-(1→4)--D-glucopyranoside (β-lactose) [21,22,23], as seen in Figure 2. Finally, we included also the two trisaccharides -D-glucopyranosyl-(1→3)--D-fructofuranosyl-(2→1)--D-glucopyranoside (melezitose) [24] and O--D-galacto-pyranosyl-(1→6)-O--D-fructofuranosyl-(2→1)--D-glucopyranoside (planteose) [25] shown in Figure 3. The focus of this study is on differences in the calculated 13C chemical shifts between the gas phase and solid state, between the saccharides with and without crystal water, between the equivalent carbon atoms in the different monosaccharides, and on the changes in the chemical shifts upon formation of di- and trisaccharides. The overall goal is to determine the impact of structural modifications on the 13C NMR chemical shifts and to provide data, which could support identification of modified functional characteristics of saccharides induced by structural modifications using solid-state 13C NMR spectroscopy.
2. Computational Details
2.1. CASTEP Geometry Optimization and NMR Calculation
Before computing the 13C chemical shifts for a given structure, the atomic coordinates and unit cell parameters were energy minimized at the DFT level with the Perdew–Burke– Ernzerhof exchange-correlation functional (PBE) [26] and the Grimme 2006 dispersion correction (PBE-D2) [27,28], the most widely employed functional for these type of calculations [29,30], using the CASTEP software package [31] following a previously developed and employed protocol [30,32]. As starting structures, experimental X-ray-structures were employed [8,9,10,11,12,13,14,15,16,17,18,19,20,21,22,23,24,25]. The optimization was performed in three steps. In step I, the optimization started with an energy cut-off of 520 eV where the atomic positions were allowed to vary with the unit-cell parameters fixed and the core-valence electron interactions were described by ultrasoft pseudo-potentials. Then, in step II, both the atomic positions and the unit cell were allowed to vary, with the same energy cut-off and pseudo-potentials. Finally, in step III, the norm-conserving pseudo-potentials were used with an energy cut-off of 1200 eV. Integrals taken over the Brillouin zone were performed using Monkhorst-Pack grid [33] with a maximum sample spacing of 0.07 Å for both steps I and II and 0.05 Å for step III, with at least two k-points along each direction. There were two crystals, melezitose and planteose, that could not be optimized with the settings above, so a low cut-off energy of 800 eV was used instead. These crystals have significantly larger molecules compared to the others.
For the calculation of chemical shielding tensor, CASTEP was also used, with the GIPAW method [29,34,35,36], i.e., the combination of the gauge-including atomic orbital (GIAO) method with the projected augmented-wave method, using ultrasoft pseudo-potentials generated on-the-fly, and a maximum plane-wave cut-off energy of 1200 eV, unless specified otherwise. For the integrals performed over the Brillouin zone a Monkhorst-Pack grid with a sample spacing of 0.05 Å was again employed [30].
2.2. Conversion to Chemical Shifts
In order to compare the results directly to experiment, the absolute chemical shieldings have to be converted to the chemical shifts on the appropriate scale. In order to do that, three different methods were investigated. The first and simplest approach was using a reference value from the literature. Here we employed a value of 168.1 ppm for 13C, which was obtained and used previously by Yates et al. [5] for the conversion to chemical shifts in saccharides. The next method was to use an internal reference from our calculations. For that, a plot of the experimental values of the chemical shifts versus the calculated shielding was made (see the Supplementary Information). From these we obtained the chemical shielding as the intercept of the linear regression line of the experimental shifts versus our calculated shielding constants.
This has been performed for six different saccharide crystals, -glucose [7], -glucose monohydrate [7], -maltose [5], -maltose monohydrate [5,6], sucrose [6], and trehalose [6], and the final reference value, 156 ppm, is the average of the intercept of these six graphs. Finally, we also took into account the slope of the linear regression lines as suggested by others [37,38]. For that we plotted all the experimental shifts of these six saccharides against our calculated shieldings and fitted them to a straight line as shown in Figure 4. This led to a conversion relation between the calculated absolute shielding and the chemical shift for 13C in saccharides:
In Figure 5 the correlation between the calculated chemical shifts obtained with these three methods and the experimental chemical shifts are shown. The value of 0.9932 is equally good for all three approaches. It is clear that method 1, i.e., taking the literature value 168.1 ppm for the conversion to chemical shifts, gives a better agreement with the experimental values than method 2, where we used an internal reference obtained as the average of the intercepts in the linear fits of the calculated shieldings versus the experimental chemical shifts. Method 2 thus leads to an average offset which is 10 ppm larger than with method 1. However, for both methods the slope of the correlation with the experimental values is not equal to 1 as it ought to be. Using, on the other hand, the full conversion relation in Equation (1), method 3, leads to an almost perfect correlation between the calculated and experimental chemical shifts. In the following we will therefore employ this approach, the linear regression approach, namely, method 3.
2.3. Comparison to Experimental Values
In Figure 6 the calculated chemical shifts obtained with the linear regression method are compared to the experimental chemical shifts [5,6,7] for the six molecules individually. The slope of the correlations is found to be between 0.95 and 1.02 and the offsets vary between −0.71 ppm and 2.18 ppm.
In previous studies by Salager et al. [39] and Widdifield et al. [40] the estimates of the root-mean-square deviations (RMSDs) between calculated and the experimental chemical shifts for 13C and 1H have been calculated to be 1.9 ppm and 0.3 ppm, respectively. The results were obtained based on two studies of 15 and 30 different organic compounds. The RMSDs between our calculated and the experimental chemical shifts for -glucose monohydrate, -glucose, trehalose, sucrose, -maltose monohydrate and -maltose anhydrate are 0.66, 1.17, 1.34, 1.51, 1.69 and 2.47, respectively. From that we can see that the RMSD between the calculated and the experimental chemical shift is lower than the expected deviation for all cases expect for -maltose anhydrate, indicating that our calculated chemical shifts are generally in close agreement with the experiment.
3. Results
Using our calculated values for the six monosaccharides, six disaccharides and two trisaccharides, in the following we will discuss the effect on the 13C chemical shifts in transitioning from the mono to the dimer and trimer structures, and the impact of the crystal water on the chemical shifts. The conversion from absolute shieldings to chemical shifts was carried out with Equation (1) for all the chemical shifts reported in the following.
3.1. The Difference in Chemical Shifts between Mono- and Disaccharides
As each disaccharide molecule contains two identical or different monosaccharide units, we investigated how the chemical shifts change when transitioning from the free monosaccharides to the monosaccharide unit in a disaccharide. In Table 1, Table 2 and Table 3 the changes in the chemical shifts of an -glucose, -glucose and -galactose unit are shown when they are incorporated in a disaccharide. In each case we take the chemical shifts of the monosaccharide (-glucose, -glucose or -galactose) as reference and compare with the corresponding monosaccharide unit in the disaccharide by computing the RMSD between the two. The RMSD is calculated as
where i is the index of the atom, N is the number of atoms in the monosaccharide and and are the chemical shifts for the i-th monosaccharide unit and the reference (isolated) monosaccharide atoms, respectively. These are shown in the last column in the tables. As there are two monosaccharide units in the disaccharides they are distinguished by unprimed (Unit 1) and primed (Unit 2) indices on Figure 2. In addition, we considered two polymorph structures of both sucrose and lactose. These are referred to as Structure 1 and Structure 2.
In Table 1 we present our analysis of the 13C chemical shifts of the -glucose unit in the disaccharides presented in Figure 2. For the -glucose units in both sucrose polymorph structures, the RMSD between the chemical shifts in sucrose and in the free -glucose is 3.3 ppm. The deviations between the chemical shifts of the individual atoms C, C and C in free -glucose and -glucose in sucrose are in the range 3.96–4.57 ppm which are significant and indicate that the -glucose in sucrose is affected by the presence of the second unit.
The second disaccharide, trehalose consists of two units of -glucose, each attached via C. The RMSD of the changes in the glucose chemical shifts is similar for both rings in trehalose. For instance, the deviation of an individual carbon atom is large for C, C and C for the first unit. These are actually the same atoms for which the largest changes were observed in both sucrose structures. However, the changes are smaller in trehalose than in sucrose both for these atoms as well as the other ones, thus also resulting in a smaller RMSD than for sucrose. Interestingly, for both disaccharides, it is not the atom that makes the glycosidic linkage, i.e., C, for which the largest change in chemical shift is observed. For the second -glucose unit in trehalose, the changes are large for C, C and C and thus also for the atom involved in the glycosidic linkage.
For the -glucose in the first -maltose unit, the RMSD is larger than for glucose in both sucrose and trehalose. This is mostly due to the significantly larger change in the chemical shift, 8.68 ppm, of the C atom which forms the glycosidic linkage. In contrast to the smaller changes in sucrose and trehalose unit 2, in -maltose the C atom is deshielded in comparison to -glucose. In the second -glucose unit in -maltose the largest change is observed for C, i.e., again for the carbon atom involved in the glycosidic linkage.
Finally, we will look at -lactose. The unit cell of -lactose contains two molecules forming a triclinic crystal system. This means that these two -lactose in the unit cell have different chemical shift values for the same atom. For that we will look at RMSD between the free monosaccharide and the two different -lactose, which are called structure 1 and structure 2 in the table. As the two -glucose units in -lactose do not have the same chemical shift for the same atoms, the RMSD for these two rings compared to the free -glucose will not be the same, as seen in Table 1. The RMSD is very high for one of them and is smaller for the other, which means it is difficult to compare triclinic crystals with other crystals. The two -glucose units in -lactose have in common that the largest deviation is for the C glycosidic linkage atom, which is 11.10 and 14.69 ppm, respectively.
We can deduce so far from the comparison of these calculations that the second unit has an impact on glucose in various disaccharides. When we have a disaccharide with two identical monomers linked via the same atom (trehalose), the effect is the smallest, while the effect increases for sucrose molecules. For compounds with 1–4 glycoside linkages, such as maltose and lactose, the disparity is the greatest. Furthermore, the most significant deviation does not always originate from the atom that forms the glycosidic bond, as seen for sucrose and the two trehalose units. For both maltose units and -lactose, however, the most significant divergence occurs from the glycosidic linkage atom.
Table 2 presents the calculated chemical shifts of -glucose monosaccharide and -glucose in the two disaccharides: cellobiose and -lactose. The RMSD for the first unit in cellobiose is lower than the RMSD for the second unit, which are 3.54 ppm and 6.03 ppm, respectively. Looking at the individual atoms, we see that the largest changes in the chemical shifts of individual carbon atoms in the first unit of cellobiose are 7.38 and 3.68 ppm for C and C, i.e., for the glycosidic linkage atom, C, and its neighbour. For the second -glucose in cellobiose unit the largest deviation of individual carbon atoms is 14.17 and 3.62 ppm (C and C), which are again the glycosidic linkage atom, C, and its neighbour atom C. This demonstrates that the RMSD is smaller when a monosaccharide is connected to another ring via the initial atom (C) than when it is bonded by another atomic number, i.e., C, as we have seen already in Table 1 for -glucose. The RMSD for -glucose in -lactose is 4.77 ppm, with the highest deviation being 9.64 ppm for C. We can deduce from these calculations that glycosidic linkage atoms have the biggest variations in all of these units.
In Table 3, we compared -galactose monosaccharide with -galactose units in the two lactose polymorphs. For both -lactose the RMSD is 1.76 and for the two polymorphs of -lactose the RMSD are 3.47 and 3.39 ppm. The largest deviation between -galactose monosaccharide and -galactose in both -lactose and -lactose are for C, being the glycosidic linkage atom, which are 2.67, 7.33 and 5.92 ppm, respectively.
Based on all the calculations so far, we can conclude that moving from monosaccharides to disaccharides affects the chemical shift in a specific way for all studied disaccharides. While for most disaccharides the chemical shifts of the two carbon atoms involved in the glycosidic linkage were mostly changed, in the case of sucrose and trehalose other atoms were influenced more than glycosidic linkage atoms. Trehalose differs from the other disaccharides because it has two identical monomers with the same glycosidic linkage atom in both. When transitioning from mono- to di-saccharides, the difference in chemical shift can reach up to 15 ppm.
One might ask whether the changes in the chemical shifts of the glycosidic linkage carbon atoms are correlated with the bond angles at the glycosidic linkage and in particular the angles and , which are illustrated in Figure 7 for maltose. The values for these angles, along with the changes in the chemical shift of the corresponding linkage atoms, are presented in Table 4. Our analysis reveals a remarkable diversity in the observed angles across different disaccharides. Furthermore, upon comparing these angles with the changes in the chemical shift for the linkage atoms, we found no apparent overall correlation between the variations in chemical shift and the aforementioned angles. While for trehalose, with both angles between 60 and 61 degress the changes in chemical shift are quite small, 0.23 ppm and −3.17 ppm, for sucrose the change in chemical shift is also small with −1.12 ppm but the angles are vastly different, i.e., and . On the other hand, for -cellobiose and -lactose, is roughly around −70 and above 105 leading to a negative change in the chemical shift of unit 1 roughly around −5 ppm and around −12 ppm for unit 2, i.e., meaning similar changes for similar angles. In the same way, the similar angles in the two -lactose structures lead to similar changes in the chemical shifts. Therefore, it is evident that the observed variation in the chemical shifts cannot be attributed solely to these angles.
3.2. The Difference in Chemical Shifts between Di- and Tri-Saccharides
In this section we will examine the extent to which the chemical shift is affected on transitioning from di- to tri-saccharides, as seen in Table 5. Both melezitose and planteose molecules, Figure 3, contain a sucrose unit, where the additional glycosidic linkage is from the -D-fructofuranosyl part of sucrose. Melezitose has a smaller RMSD than planteose when compared to -glucose in sucrose; the same is true for fructose in melezitose and planteose. For sucrose in melezitose and planteose the deviation is greatest for C and C, respectively. When we compare free -glucose with -glucose in sucrose, melezitose, and planteose, these two atoms are among the most affected. The changes in chemical shift for fructose in melezitose are largest for C followed by C, where C is the new glycosidic linkage atom. Similarly, for planteose, the largest deviation is for C and C, even though C is the new linkage atom. This demonstrates again that the glycosidic linkage atoms do not have to be the most significant difference.
Water molecules are present in the crystals of both melezitose (monohydrate) and planteose (dihydrate), which affects the nuclear shifts of the atoms. We may, therefore, have obtained a good understanding of what happens with the chemical shift on transitioning from the free monosaccharide to disaccharides as no water molecules would interfere with the chemical shifts. However, because both trisaccharides contain water molecules, we actually examine not only the effect of size but also the effect of water. To see how much the chemical shift will truly alter due to the additional unit, one should find some trisaccharides that do not contain water molecules. In the following section we will therefore also study the effect of crystal water on the chemical shifts.
3.3. The Impact of Water Molecules on Chemical Shifts in Mono- and Di-Saccharides
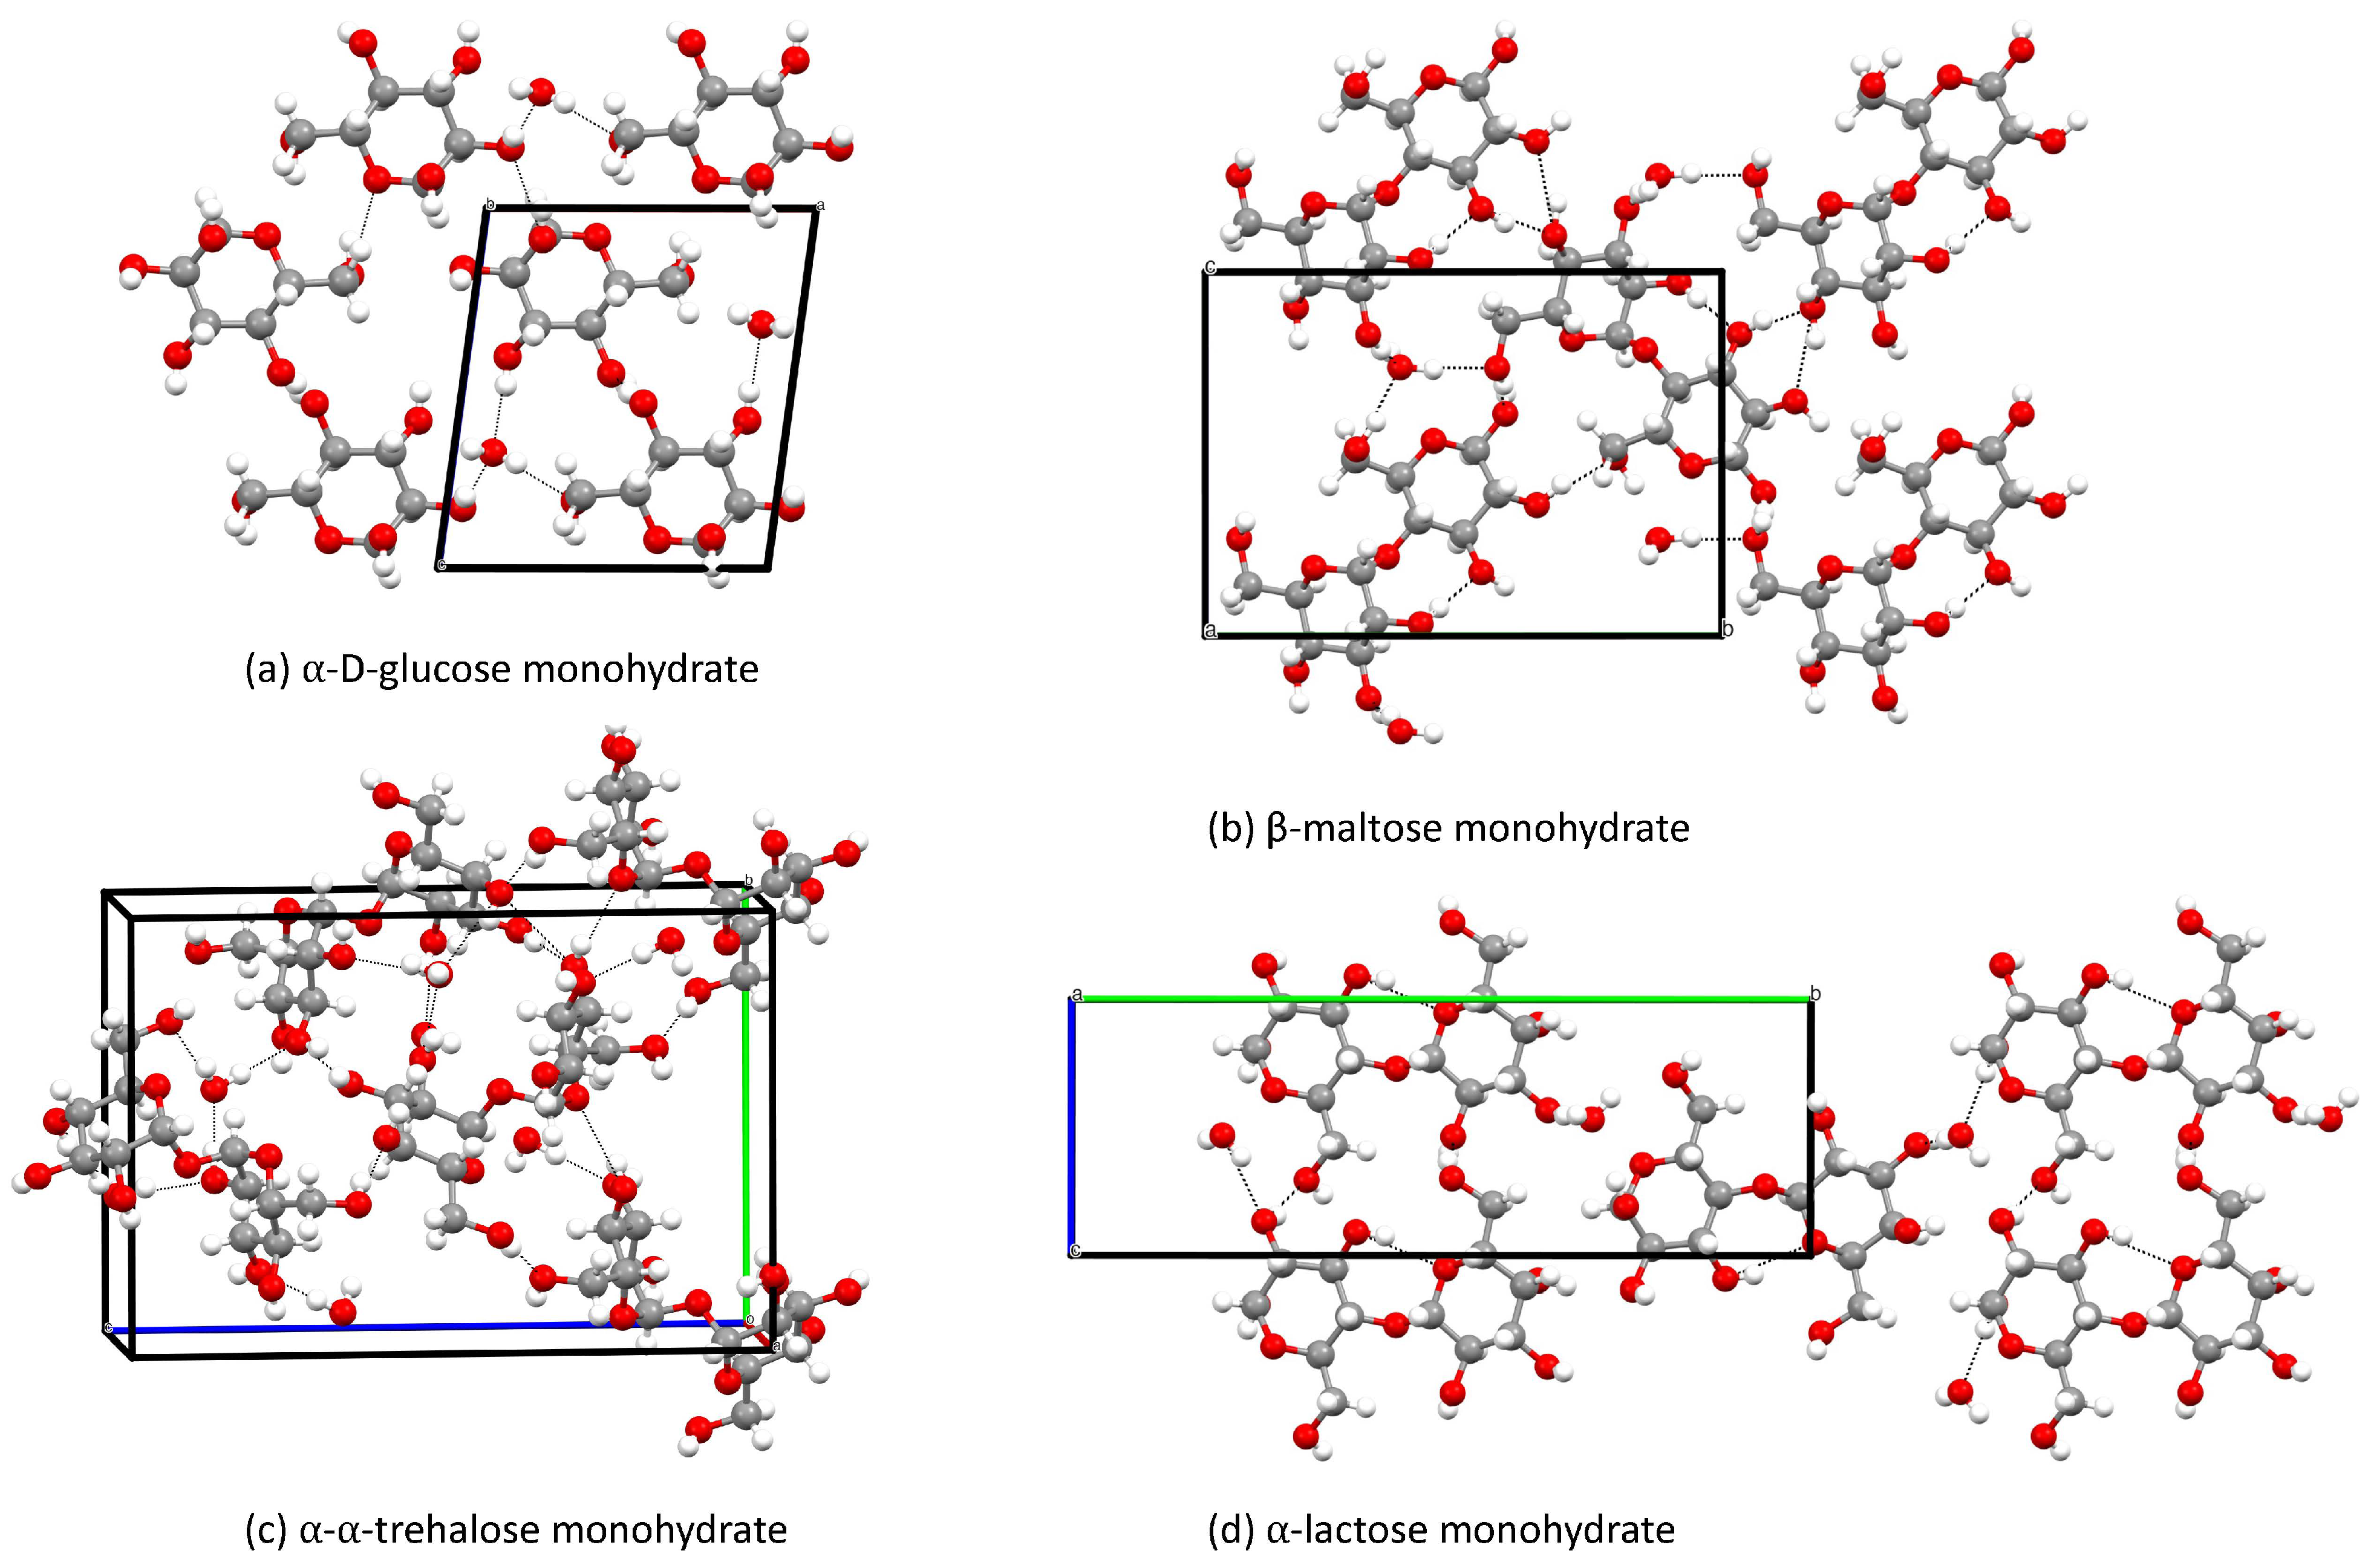
Some of the crystals, for which the crystal structures have been determined, contain water in the unit cell. These crystals are -glucose, -maltose [17], trehalose [19] and -lactose [23]. All of these crystals also have an anhydrate crystal structure. We will therefore compare the monohydrate crystals with the anhydrate to see the impact of water molecules on the chemical shifts in mono- and disaccharides. The anhydrate is always the reference component in our comparisons. We start by looking at -glucose in Table 6. The RMSD of the chemical shifts between -glucose with and without water is 1.80 ppm. The largest change is 3.24 ppm for C followed by C, since water molecules are close to these atoms as can be seen in Figure 8.
According to these calculations, the chemical shift is influenced by the water molecule. The atoms nearest to the water molecules are the ones who suffer the most. The influence of the water molecule ranges between 2 and 5 ppm, which is smaller than the effect of the difference between mono-, di-, and trisaccharides, as well as the effect of various disaccharides with each other.
In Table 7 we present the results for maltose anhydrate and monohydrate. One should note that the maltose monohydrate is a -maltose anhydrate, meaning that the second unit is a -D-glucopyranoside and not an -D-glucopyranoside as in -maltose. The differences in the chemical shifts of the second unit between the anhydrate and monohydrate are thus not solely due to the water molecules. However, we chose to include these numbers anyway. The RMSDs for the two units of maltose with and without water are 2.22 and 3.61 ppm, respectively. The largest deviation is 3.18 ppm (C) in the first ring, since the water molecule is closer to that atom. For the second ring one observes also a change in the chemical shift of C due to a neighbouring water molecule (4.81 ppm). Furthermore, there is also a significant change of 5.70 ppm for C, which has nothing to do with water molecules and must therefore arise from the difference in crystal structure and the atoms around it, as seen in Figure 8.
For the trehalose, the largest deviation between the anhydrate and the monohydrate trehalose is 1.96 ppm (C) for the first ring ase well as 2.19 and 2.42 ppm (C and C) for the second ring, as seen in Table 8. These changes are due to the influence of water molecules, which are between C and C in the first ring and C in the second ring which then affect the C and C, as seen in Figure 8.
Table 9 presents the results for different -lactose crystals. The lactose anhydrate is triclinic, which means there are two distinct -lactose anhydrate molecules involved. Starting with the galactose ring in lactose, the water molecules are close to C and C when the structure is treated as a crystal rather than simply a unit cell. The difference in chemical shift between the galactose in -lactose anhydrate and monohydrate is considerable for C in both molecules and C in the second molecule. On the other hand, the highest difference between the -glucose in -lactose anhydrate and monohydrate is for C in the first molecule and C in the second. This deviation occurs because a water molecule is close to the oxygen atom between C and C, and another water molecule is close to C, which impacts C in the second, as seen in Figure 8.
To investigate the potential correlation between the distance of the carbon atoms to the oxygen atom in the closest water molecule and the corresponding change in chemical shift, we have collected these date in Table 10. We observe three ranges of distances. The shortest are roughly around 3.5 Å, the intermediate around 4 Å and the largest distances are around roughly around 4.5 Å. For the shortest distances the changes in chemical shift range from −0.5 ppm all to 3.6 ppm, while for the distances around 4 Å the changes in chemical shift are between −4.8 ppm and 2.6 ppm. Finally for the largest distances the changes are in the range from −2.4 ppm to −1.6 ppm, which implies that there is no simple direct correlation between the change in chemical shift and the distance to the nearest water molecule.
4. Conclusions
In this study we investigated how the C NMR isotropic chemical shifts of the monosaccharides, glucose, galactose and fructose change on forming di- and trisaccharides via solid state DFT calculations as well as how crystal water molecules influence the chemical shifts.
For that purpose we optimized experimental crystal structures from the literature in a three-step procedure and afterwards calculated the absolute shielding constants. In order to convert them to chemical shifts we employed a linear correlation between calculated shieldings and experimental chemical shifts for a few systems with known NMR spectra.
The largest changes in the chemical shifts on transitioning from monosaccharides to disaccharides are typically observed for the atoms involved in the glycosidic linkage, inducing changes in the isotropic C NMR chemical shift of up to 14 ppm. Notable exceptions to this are sucrose and trehalose, where the changes in the chemical shifts of the glycosidic linkage atoms are smaller than for the other atoms. Attempting to correlate the changes in the chemical shifts of the glycosidic linkage atoms to the two angles at the glycosdic linkage did not lead to a simple correlation.
The changes in the chemical shifts on transitioning from the disaccharides to the trisaccharides are somewhat smaller.
For crystals containing crystal water molecules, one clearly observes changes in the C NMR isotropic chemical shifts of the atoms closest to the crystal water molecules. These changes are in then range of 2 to 5 ppm and thus somewhat smaller than the changes on forming larger saccharides. Relating the changes in the chemical shifts of these carbon atoms to their distance from the crystal water does not lead to a simple relation, which must imply that the crystal water probably leads to larger changes in the crystal structure and thus more complex changes in the chemical shifts.
In future work one could extend this work by studying also the corresponding changes in the spin-spin coupling constants.
Supplementary Materials
The following supporting information can be downloaded at: https://www.mdpi.com/article/10.3390/magnetochemistry9080192/s1, Table S1: Calculated chemical shifts for monosaccharides, using a reference value of 168.1 ppm, Table S2: Calculated chemical shifts for monosaccharides using a reference value of 156 ppm, Table S3: Calculated chemical shifts for monosaccharides, using the linear regression technique.
Author Contributions
Conceptualization, F.H.L., A.Ø.M. and S.P.A.S.; methodology, S.P.A.S.; validation, H.M.; formal analysis, H.M.; investigation, H.M.; data curation, H.M.; writing—original draft preparation, H.M.; writing—review and editing, H.M., F.H.L., A.Ø.M. and S.P.A.S.; visualization, H.M.; supervision, F.H.L., A.Ø.M. and S.P.A.S.; project administration, S.P.A.S. All authors have read and agreed to the published version of the manuscript.
Funding
This research received no external funding.
Institutional Review Board Statement
Not applicable.
Informed Consent Statement
Not applicable.
Data Availability Statement
The data that support the findings of this study are available within the article and the Supporting Information. Further data are available from the corresponding author upon reasonable request.
Conflicts of Interest
The authors declare no conflict of interest.
Abbreviations
The following abbreviations are used in this manuscript:
| DFT | Density Functional Theory |
| GIPAW | Gauge including projector augmented wave |
| NMR | Nuclear magnetic resonance |
| PBE | Perdew–Burke–Ernzerhof exchange correlation functional |
| RMSD | Root-mean-square deviation |
| TMS | Tetramethylsilane |
References
- Pfeffer, P.E.; Valentine, K.M.; Parrish, F.W. Deuterium-induced differential isotope shift carbon-13 NMR. 1. Resonance reassignments of mono- and disaccharides. J. Am. Chem. Soc. 1979, 101, 1265–1274. [Google Scholar] [CrossRef]
- Hobley, P.; Howarth, O.; Ibbett, R.N. 1H and 13C NMR Shifts for Aldopyranose and Aldofuranose Monosaccharides: Conformational Analysis and Solvent Dependence. Magn. Reson. Chem. 1996, 34, 755–760. [Google Scholar] [CrossRef]
- Abraham, R.J.; Cooper, M.A.; Reid, M. The use of MM/QM calculations of 13C chemical shifts in the conformational analysis of some monosaccharides and sucrose. New J. Chem. 2021, 45, 2001–2009. [Google Scholar] [CrossRef]
- Krivdin, L.B. Computational NMR of Carbohydrates: Theoretical Background, Applications and Perspectives. Molecules 2021, 26, 2450. [Google Scholar] [CrossRef]
- Yates, J.R.; Pham, T.N.; Pickard, C.J.; Mauri, F.; Amado, A.M.; Gil, A.M.; Brown, S.P. An investigation of weak CH⋯O hydrogen bonds in maltose anomers by a combination of calculation and experimental solid-state NMR spectroscopy. J. Am. Chem. Soc. 2005, 127, 10216–10220. [Google Scholar] [CrossRef]
- Shao, L.; Yates, J.R.; Titman, J.J. Carbon-13 chemical shift tensors of disaccharides: Measurement, computation and assignment. J. Phys. Chem. A 2007, 111, 13126–13132. [Google Scholar] [CrossRef]
- Brouwer, D.H.; Langendoen, K.P.; Ferrant, Q. Measurement and calculation of 13C chemical shift tensors in α-glucose and α-glucose monohydrate. Can. J. Chem. 2011, 89, 737–744. [Google Scholar] [CrossRef]
- Mostad, A. X-ray Crystallographic Study of alpha-Glucose at 140 K. Acta Chem. Scand. 1994, 48, 276–278. [Google Scholar] [CrossRef]
- Ferrier, W.G. The crystal and molecular structure of β-D-glucose. Acta Crystallogr. 1963, 16, 1023–1031. [Google Scholar] [CrossRef]
- Patyk, E.; Katrusiak, A. Transformable H-bonds and conformation in compressed glucose. Chem. Sci. 2015, 6, 1991–1995. [Google Scholar] [CrossRef] [Green Version]
- Ohanessian, J.; Gillier-Pandraud, H. Structure cristalline de l’α-D-galactose. Acta Crystallogr. Sect. B Struct. Crystallogr. Cryst. Chem. 1976, 32, 2810–2813. [Google Scholar] [CrossRef]
- Sheldrick, B. The crystal structures of the α- and β-anomers of D-galactose. Acta Crystallogr. Sect. B Struct. Crystallogr. Cryst. Chem. 1976, 32, 1016–1020. [Google Scholar] [CrossRef]
- Kanters, J.A.; Roelofsen, G.; Alblas, B.P.; Meinders, I. The crystal and molecular structure of β-D-fructose, with emphasis on anomeric effect and hydrogen-bond interactions. Acta Crystallogr. Sect. B Struct. Crystallogr. Cryst. Chem. 1977, 33, 665–672. [Google Scholar] [CrossRef]
- Jaradat, D.M.; Mebs, S.; Chȩcińska, L.; Luger, P. Experimental charge density of sucrose at 20K: Bond topological, atomic, and intermolecular quantitative properties. Carbohydr. Res. 2007, 342, 1480–1489. [Google Scholar] [CrossRef]
- Brown, G.M.; Levy, H.A. Further refinement of the structure of sucrose based on neutron-diffraction data. Acta Crystallogr. Sect. B Struct. Crystallogr. Cryst. Chem. 1973, 29, 790–797. [Google Scholar] [CrossRef]
- Takusagawa, F.; Jacobson, R.A. The crystal and molecular structure of α-maltose. Acta Crystallogr. Sect. B 1978, 34, 213–218. [Google Scholar] [CrossRef]
- Gres, S.M.E.; Jeffrey, G.A. A neutron diffraction refinement of the crystal structure of β-maltose monohydrate. Acta Crystallogr. Sect. B Struct. Crystallogr. Cryst. Chem. 1977, 33, 2490–2495. [Google Scholar] [CrossRef] [Green Version]
- Jeffrey, G.A.; Nanni, R. The crystal structure of anhydrous α,α-trehalose at −150°. Carbohydr. Res. 1985, 137, 21–30. [Google Scholar] [CrossRef]
- Nagase, H.; Ogawa, N.; Endo, T.; Shiro, M.; Ueda, H.; Sakurai, M. Crystal structure of an anhydrous form of trehalose: Structure of water channels of trehalose polymorphism. J. Phys. Chem. B 2008, 112, 9105–9111. [Google Scholar] [CrossRef]
- Chu, S.S.C.; Jeffrey, G.A. The refinement of the crystal structures of β-D-glucose and cellobiose. Acta Crystallogr. Sect. B Struct. Crystallogr. Cryst. Chem. 1968, 24, 830–838. [Google Scholar] [CrossRef]
- Guiry, K.P.; Coles, S.J.; Moynihan, H.A.; Lawrence, S.E. Effect of 1-deoxy-D-lactose upon the crystallization of D-lactose. Cryst. Growth Des. 2008, 8, 3927–3934. [Google Scholar] [CrossRef]
- Hirotsu, K.; Shimada, A. The Crystal and Molecular Structure of β-Lactose. Bull. Chem. Soc. Jpn. 1974, 47, 1872–1879. [Google Scholar] [CrossRef] [Green Version]
- Smith, J.H.; Dann, S.E.; Elsegood, M.R.J.; Dale, S.H.; Blatchford, C.G. α-Lactose monohydrate: A redetermination at 150 K. Acta Crystallogr. Sect. E Struct. Reports Online 2005, 61, o2499–o2501. [Google Scholar] [CrossRef] [Green Version]
- Becquart, J.; Neuman, A.; Gillier-Pandraud, H. Structure cristalline d’une deuxième forme de mélézitose monohydrate. Effet de l’environnement sur la géométrie d’un oligosaccharide. Carbohydr. Res. 1982, 111, 9–21. [Google Scholar] [CrossRef]
- Rohrer, D.C. The crystal and molecular structure of planteose dihydrate. Acta Crystallogr. Sect. B 1972, 28, 425–433. [Google Scholar] [CrossRef]
- Perdew, J.P.; Burke, K.; Ernzerhof, M. Generalized Gradient Approximation Made Simple. Phys. Rev. Lett. 1996, 77, 3865–3868. [Google Scholar] [CrossRef] [Green Version]
- Grimme, S. Semiempirical GGA-type density functional constructed with a long-range dispersion correction. J. Comput. Chem. 2006, 27, 1787–1799. [Google Scholar] [CrossRef]
- McNellis, E.R.; Meyer, J.; Reuter, K. Azobenzene at coinage metal surfaces: Role of dispersive van der Waals interactions. Phys. Rev. B 2009, 80, 205414. [Google Scholar] [CrossRef] [Green Version]
- Bonhomme, C.; Gervais, C.; Babonneau, F.; Coelho, C.; Pourpoint, F.; Azaïs, T.; Ashbrook, S.E.; Griffin, J.M.; Yates, J.R.; Mauri, F.; et al. First-principles calculation of NMR parameters using the gauge including projector augmented wave method: A chemists point of view. Chem. Rev. 2012, 112, 5733–5779. [Google Scholar] [CrossRef]
- Li, X.; Tapmeyer, L.; Bolte, M.; van de Streek, J. Crystallographic and Dynamic Aspects of Solid-State NMR Calibration Compounds: Towards ab Initio NMR Crystallography. ChemPhysChem 2016, 17, 2496–2502. [Google Scholar] [CrossRef] [Green Version]
- Clark, S.J.; Segall, M.D.; Pickard, C.J.; Hasnip, P.J.; Probert, M.I.J.; Refson, K.; Payne, M.C. First principles methods using CASTEP. Zeitschrift Krist. Cryst. Mater. 2005, 220, 567–570. [Google Scholar] [CrossRef] [Green Version]
- Larsen, A.S.; Olsen, M.A.; Moustafa, H.; Larsen, F.H.; Sauer, S.P.A.; Rantanen, J.; Madsen, A. Determining short-lived solid forms during phase transformations using molecular dynamics. CrystEngComm 2019, 21, 4020–4024. [Google Scholar] [CrossRef]
- Monkhorst, H.J.; Pack, J.D. Special points for Brillouin-zone integrations. Phys. Rev. B 1976, 13, 5188–5192. [Google Scholar] [CrossRef]
- Pickard, C.J.; Mauri, F. All-electron magnetic response with pseudopotentials: NMR chemical shifts. Phys. Rev. B 2001, 63, 245101. [Google Scholar] [CrossRef] [Green Version]
- Yates, J.R.; Pickard, C.J.; Mauri, F. Calculation of NMR chemical shifts for extended systems using ultrasoft pseudopotentials. Phys. Rev. B-Condens. Matter Mater. Phys. 2007, 76, 1–11. [Google Scholar] [CrossRef]
- Yates, J.R.; Pickard, C.J.; Payne, M.C.; Mauri, F. Relativistic nuclear magnetic resonance chemical shifts of heavy nuclei with pseudopotentials and the zeroth-order regular approximation. J. Chem. Phys. 2003, 118, 5746–5753. [Google Scholar] [CrossRef] [Green Version]
- Lodewyk, M.W.; Siebert, M.R.; Tantillo, D.J. Computational Prediction of 1H and 13C Chemical Shifts: A Useful Tool for Natural Product, Mechanistic, and Synthetic Organic Chemistry. Chem. Rev. 2012, 112, 1839–1862. [Google Scholar] [CrossRef] [PubMed]
- Lacerda, E.G.; Kamounah, F.S.; Coutinho, K.; Sauer, S.P.A.; Hansen, P.E.; Hammerich, O. Computational Prediction of 1H and 13C NMR Chemical Shifts for Protonated Alkylpyrroles: Electron Correlation and Not Solvation is the Salvation. ChemPhysChem 2019, 20, 78–91. [Google Scholar] [PubMed] [Green Version]
- Salager, E.; Day, G.M.; Stein, R.S.; Pickard, C.J.; Elena, B.; Emsley, L. Powder Crystallography by Combined Crystal Structure Prediction and High-Resolution 1H Solid-State NMR Spectroscopy. J. Am. Chem. Soc. 2010, 132, 2564–2566. [Google Scholar] [CrossRef] [PubMed]
- Widdifield, C.M.; Robson, H.; Hodgkinson, P. Furosemide’s one little hydrogen atom: NMR crystallography structure verification of powdered molecular organics. Chem. Commun. 2016, 52, 6685–6688. [Google Scholar] [CrossRef] [Green Version]
Figure 1.
Monosaccharides studied in this work.

Figure 2.
Disaccharides studied in this work.
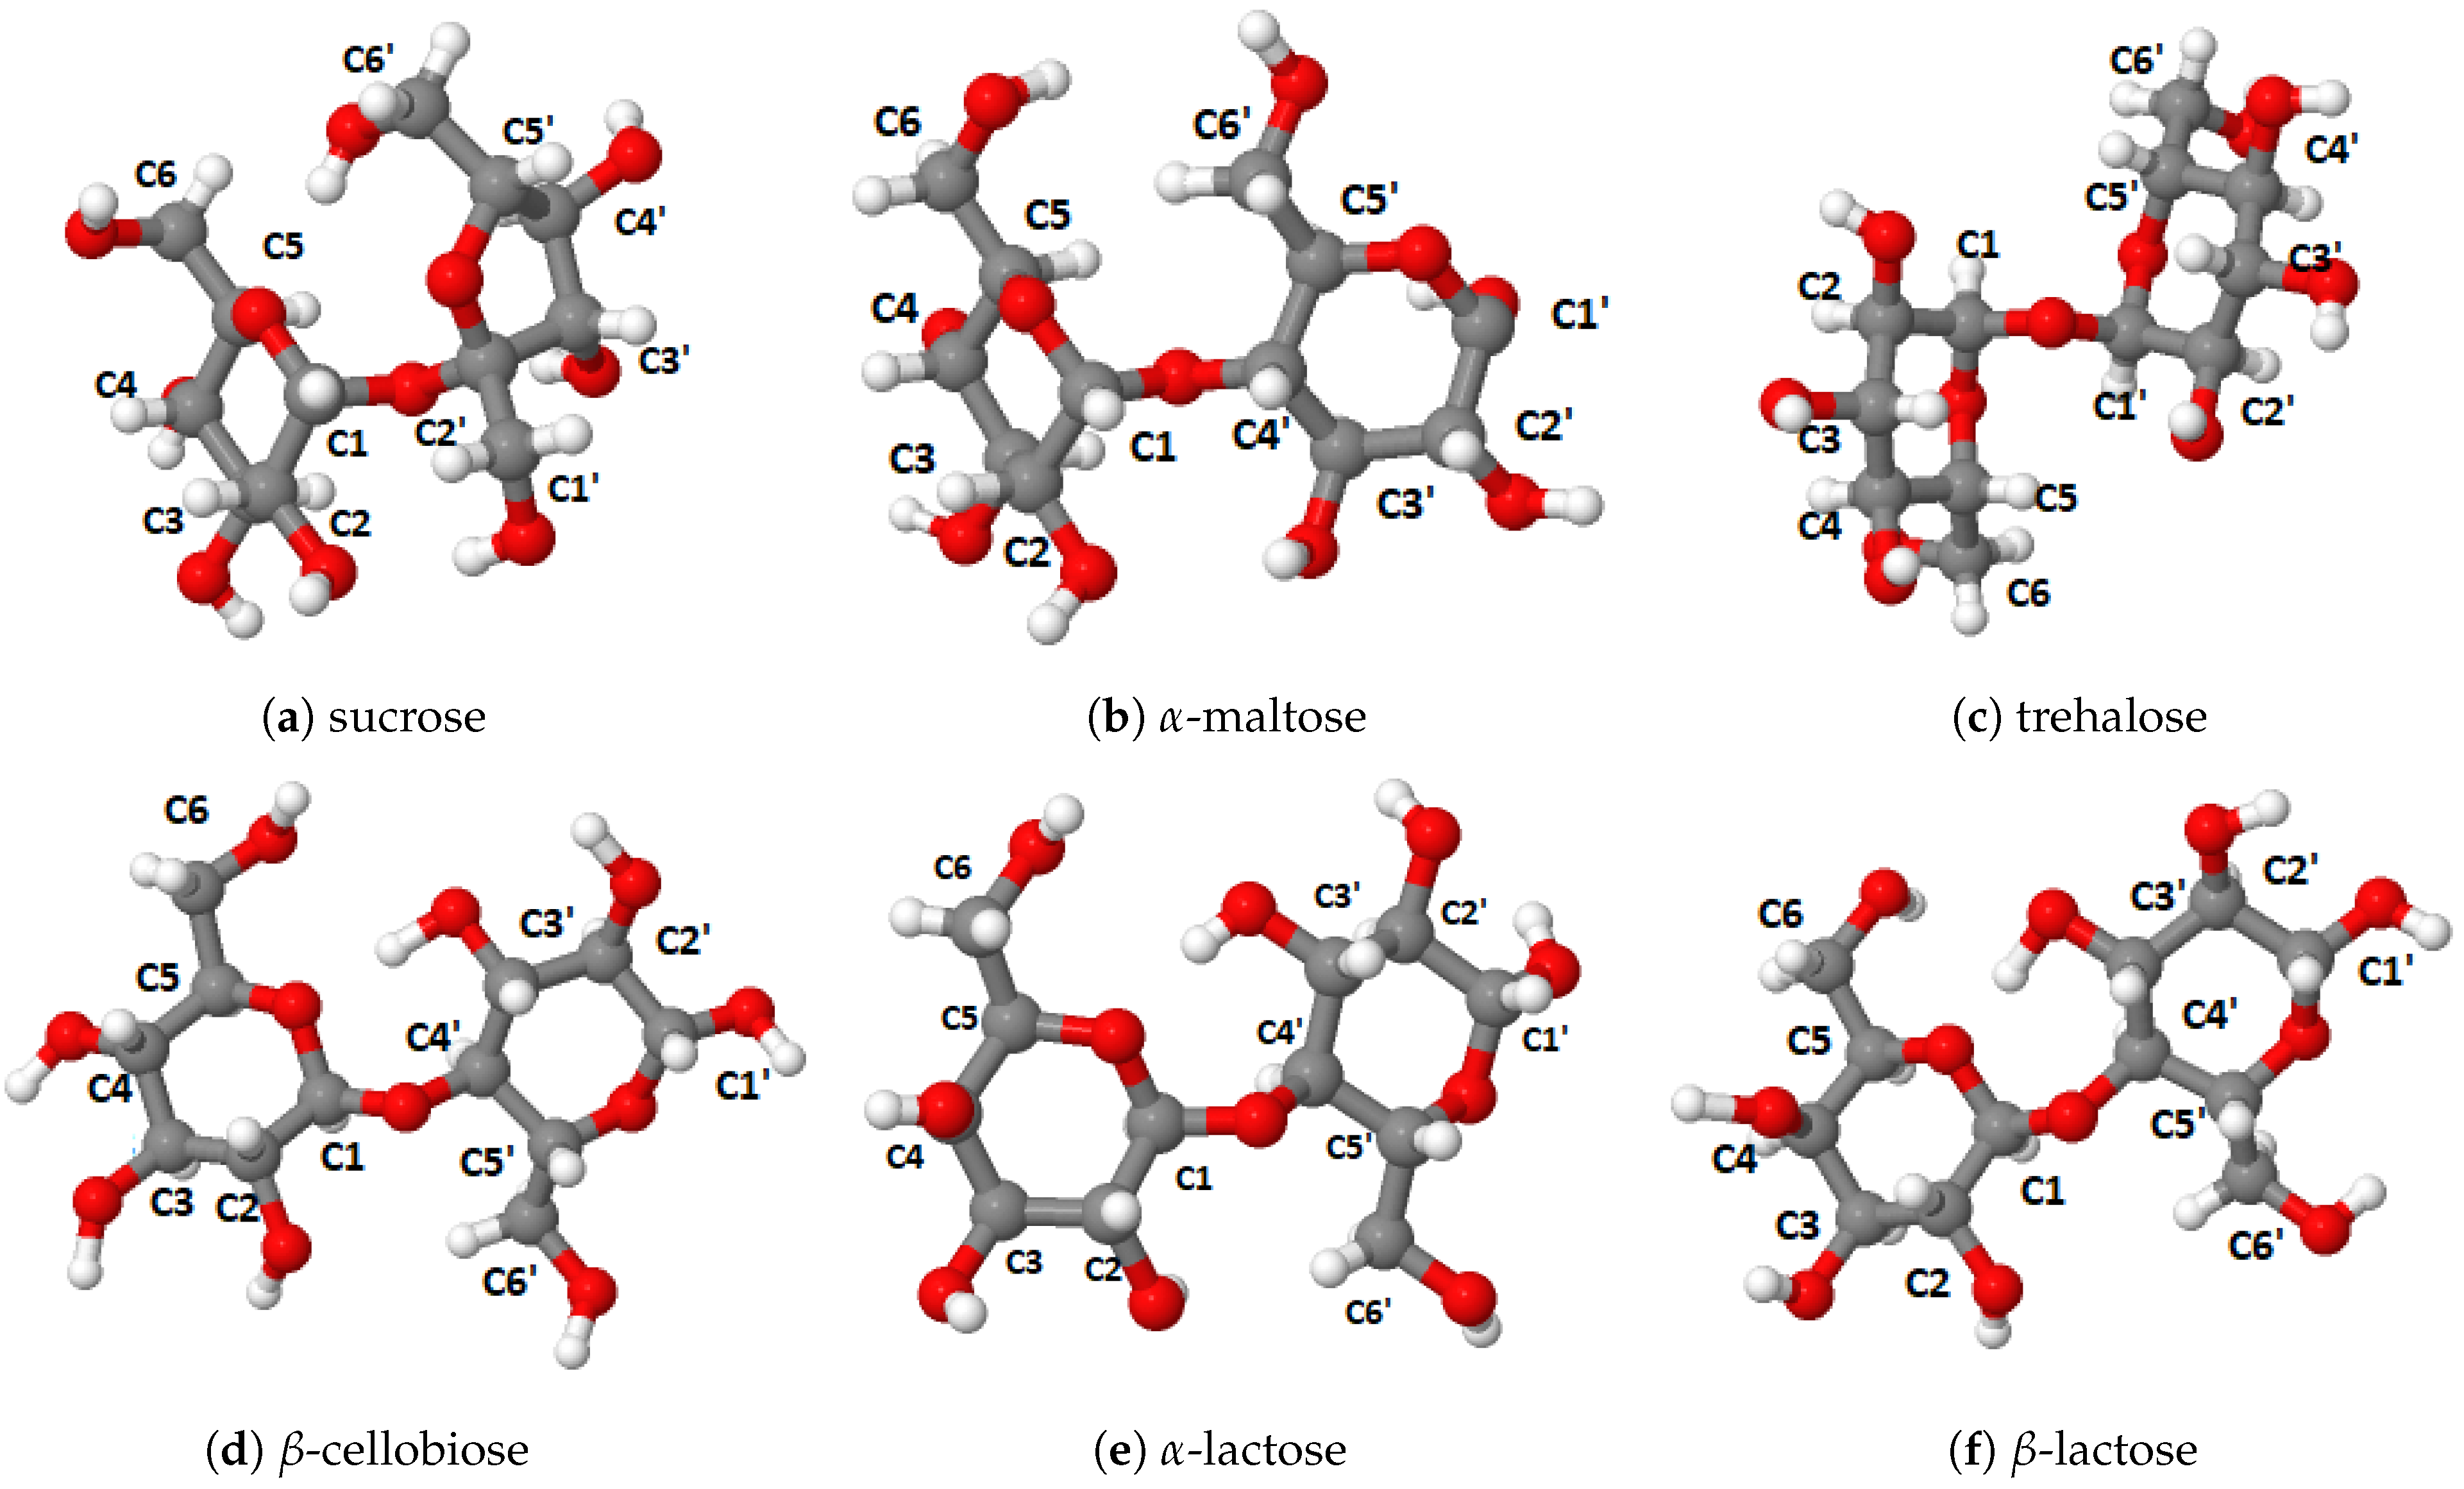
Figure 3.
Trisaccharides studied in this work.
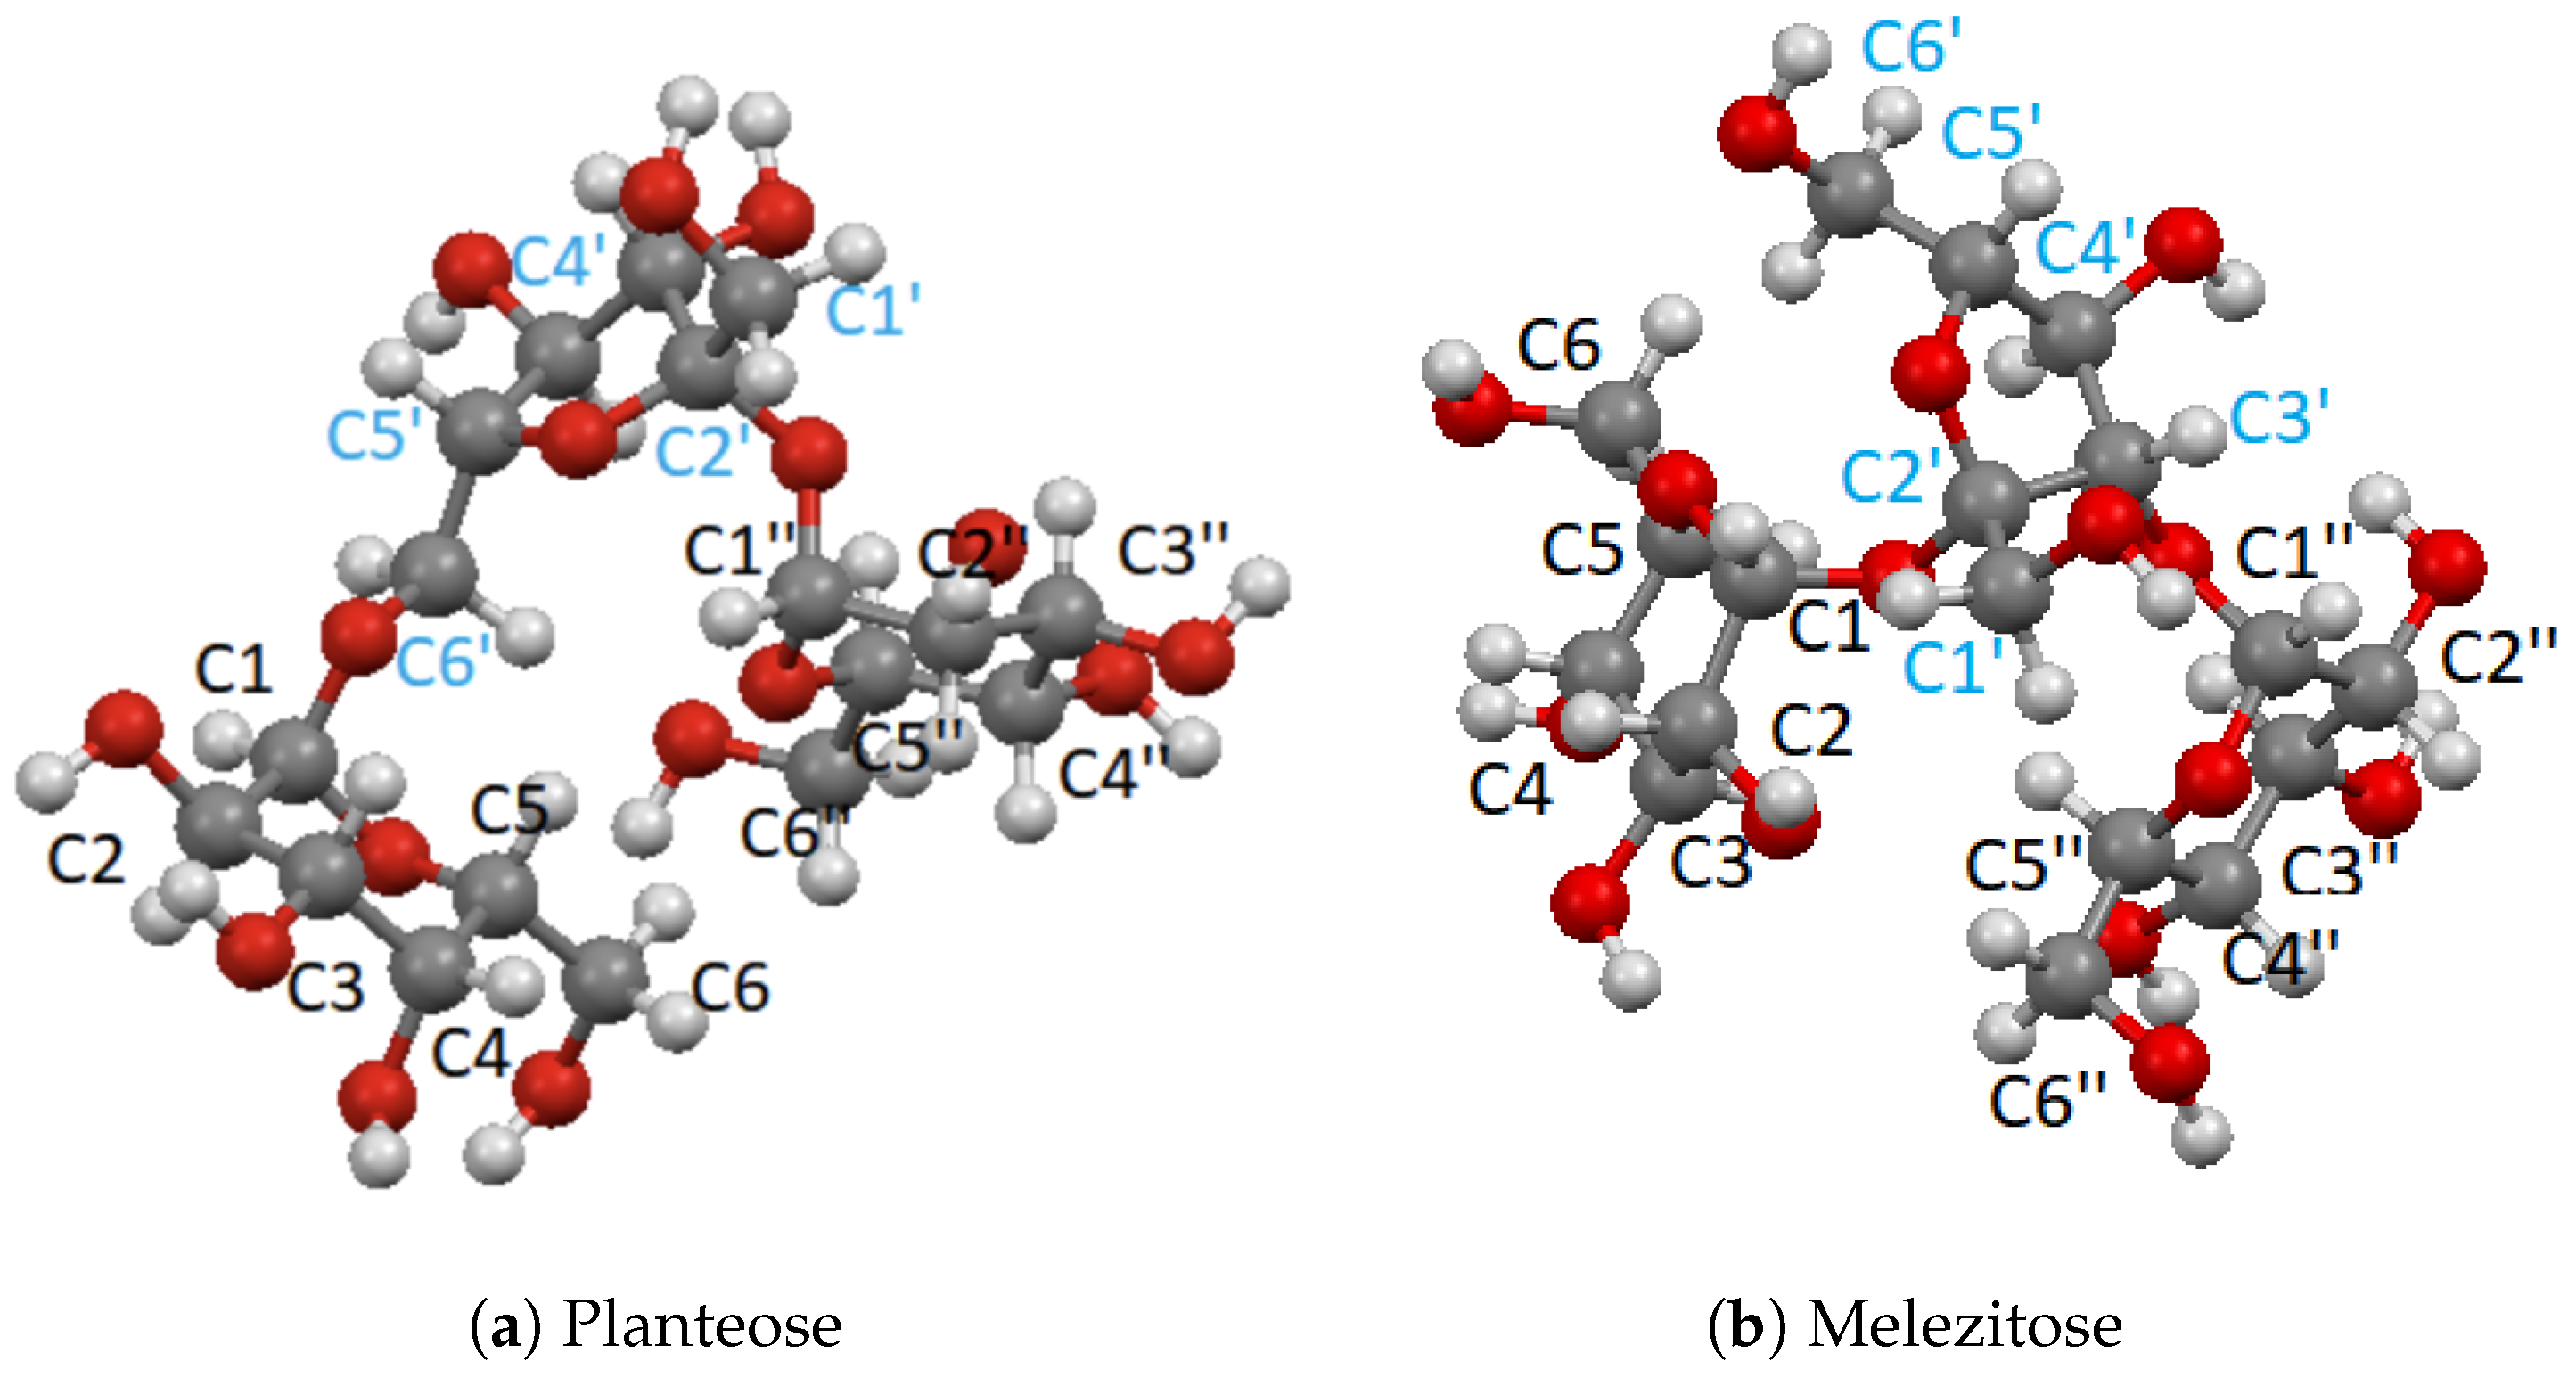
Figure 4.
Linear regression of experimental 13C isotropic chemical shifts versus calculated isotropic shieldings for the six saccharides: -glucose, -glucose monohydrate, -maltose, -maltose monohydrate, sucrose, and trehalose.
Figure 4.
Linear regression of experimental 13C isotropic chemical shifts versus calculated isotropic shieldings for the six saccharides: -glucose, -glucose monohydrate, -maltose, -maltose monohydrate, sucrose, and trehalose.
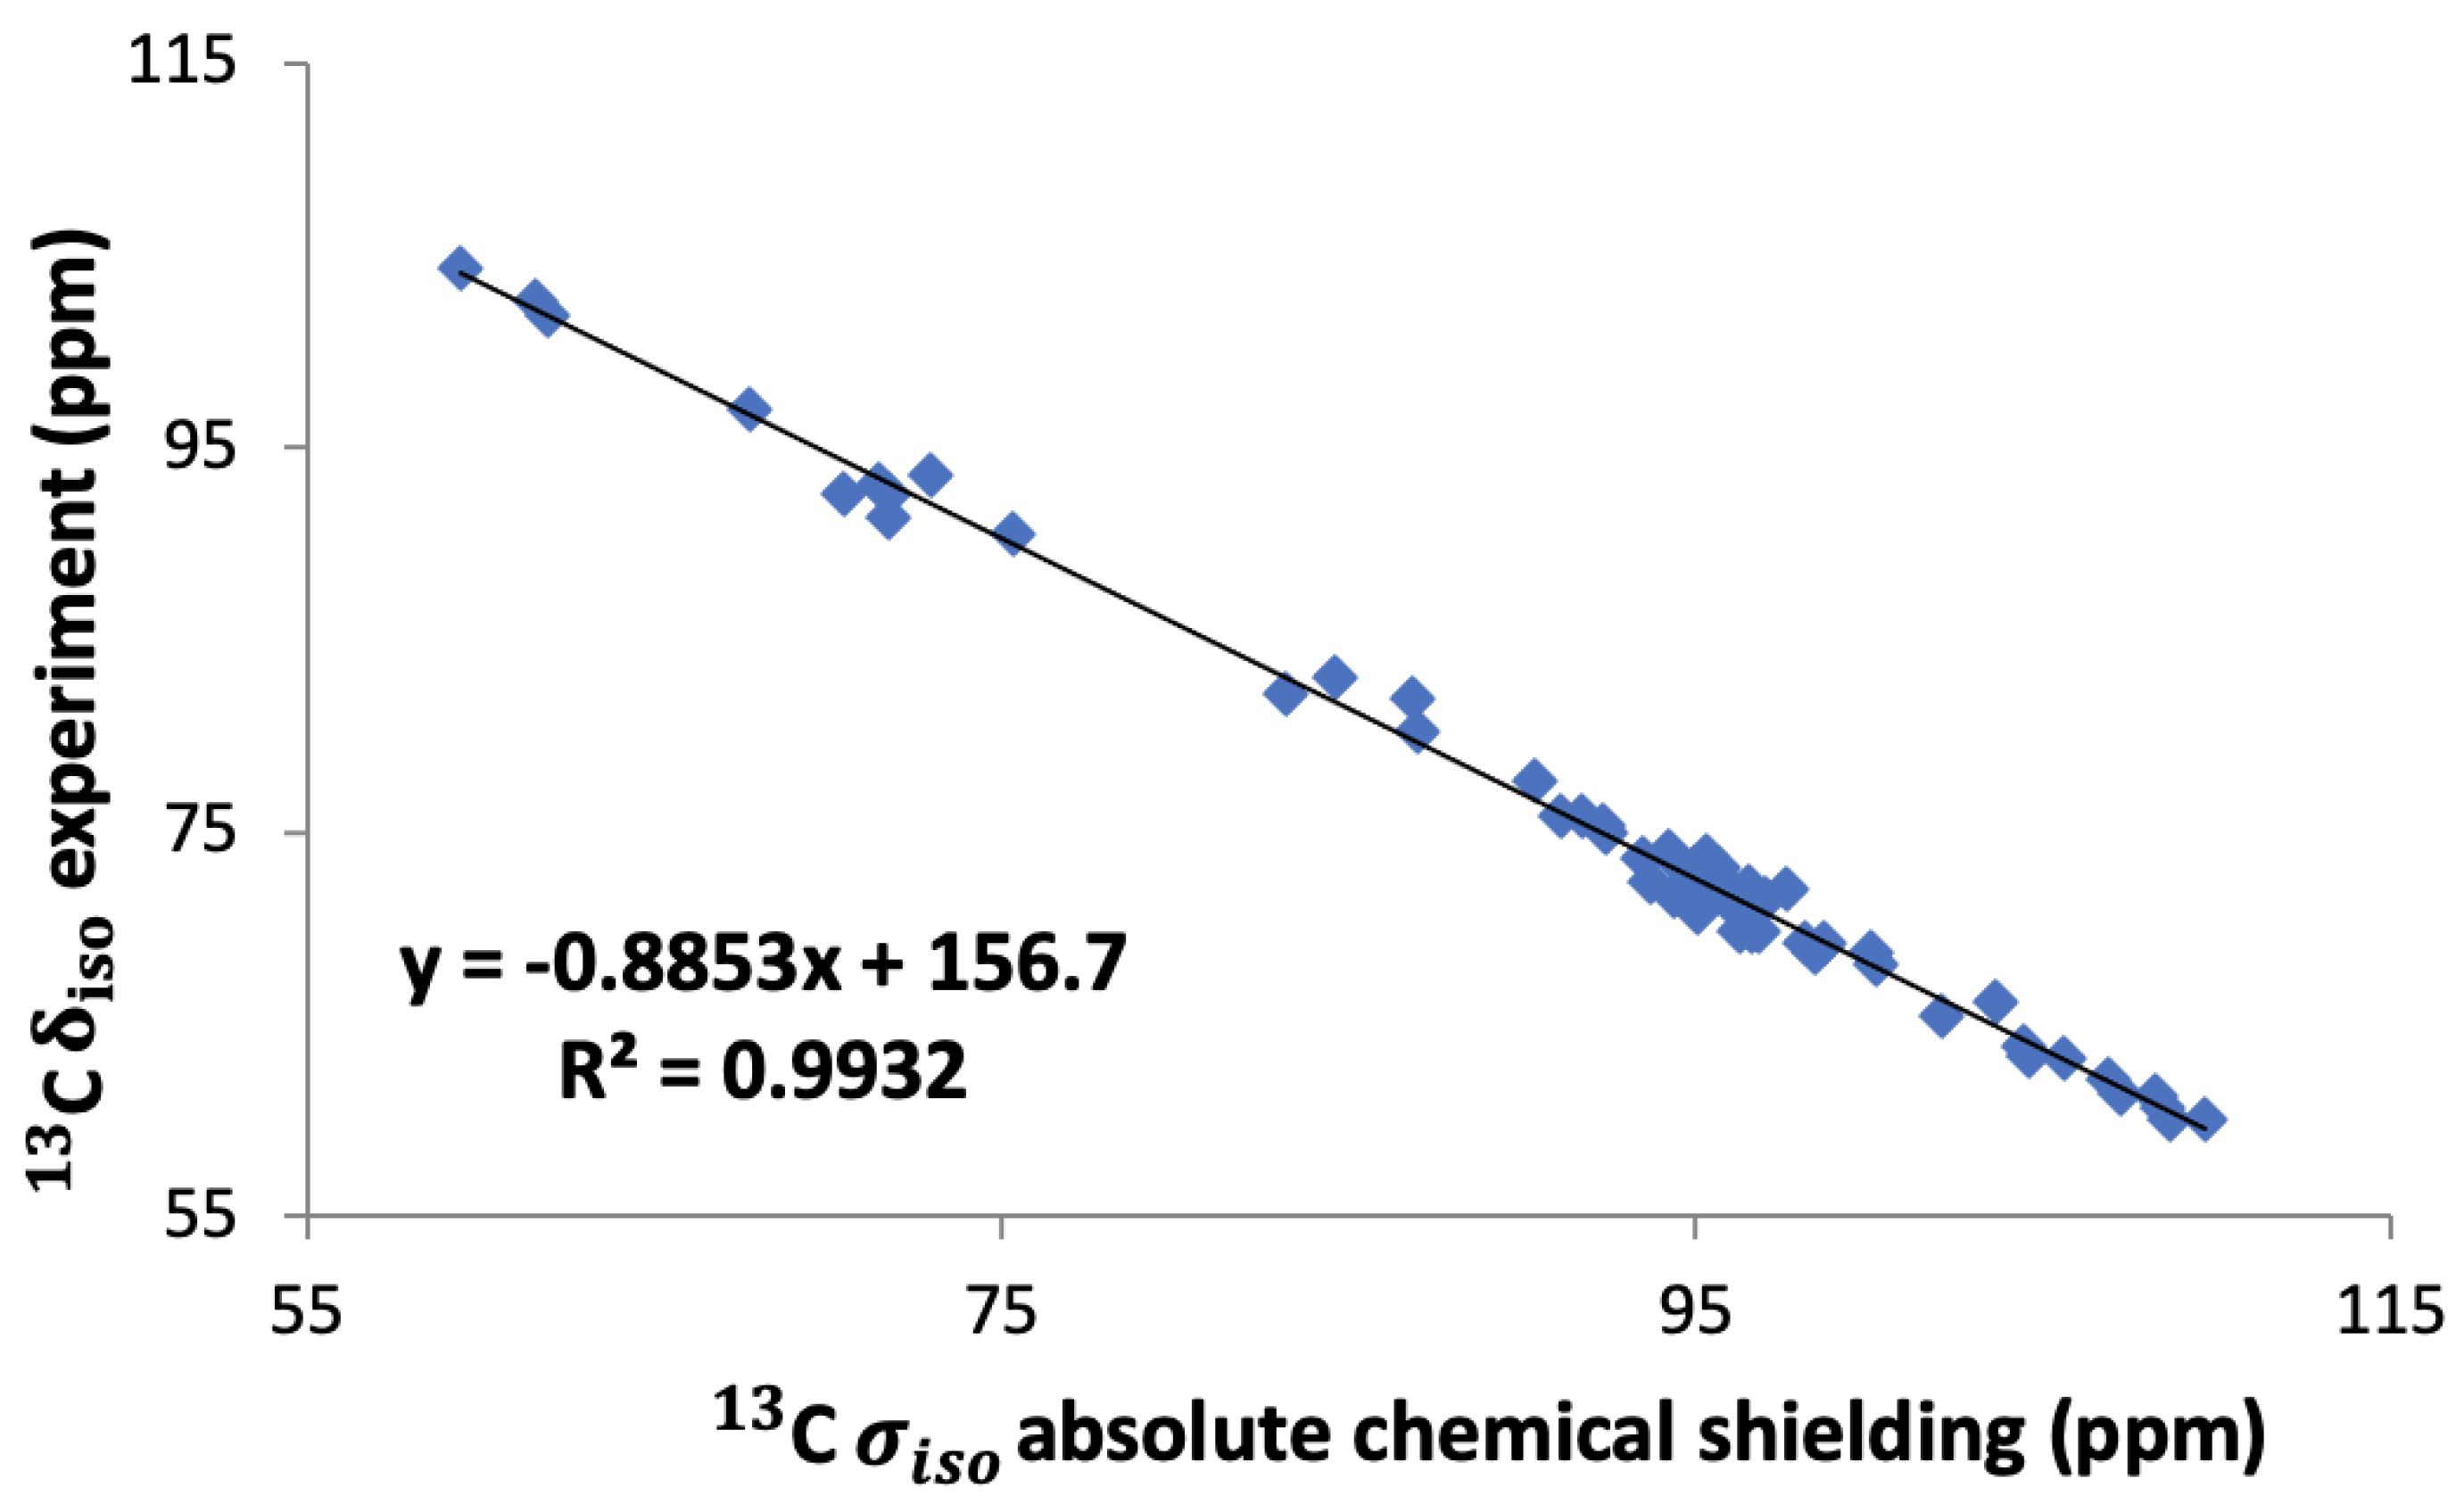
Figure 5.
Experimental versus calculated 13C isotropic chemical shift obtained with methods 1 (top left), 2 (top right) and 3 (bottom) for the six saccharides: -glucose, -glucose monohydrate, -maltose, -maltose monohydrate, sucrose, and trehalose. The lines are all linear fits.
Figure 5.
Experimental versus calculated 13C isotropic chemical shift obtained with methods 1 (top left), 2 (top right) and 3 (bottom) for the six saccharides: -glucose, -glucose monohydrate, -maltose, -maltose monohydrate, sucrose, and trehalose. The lines are all linear fits.
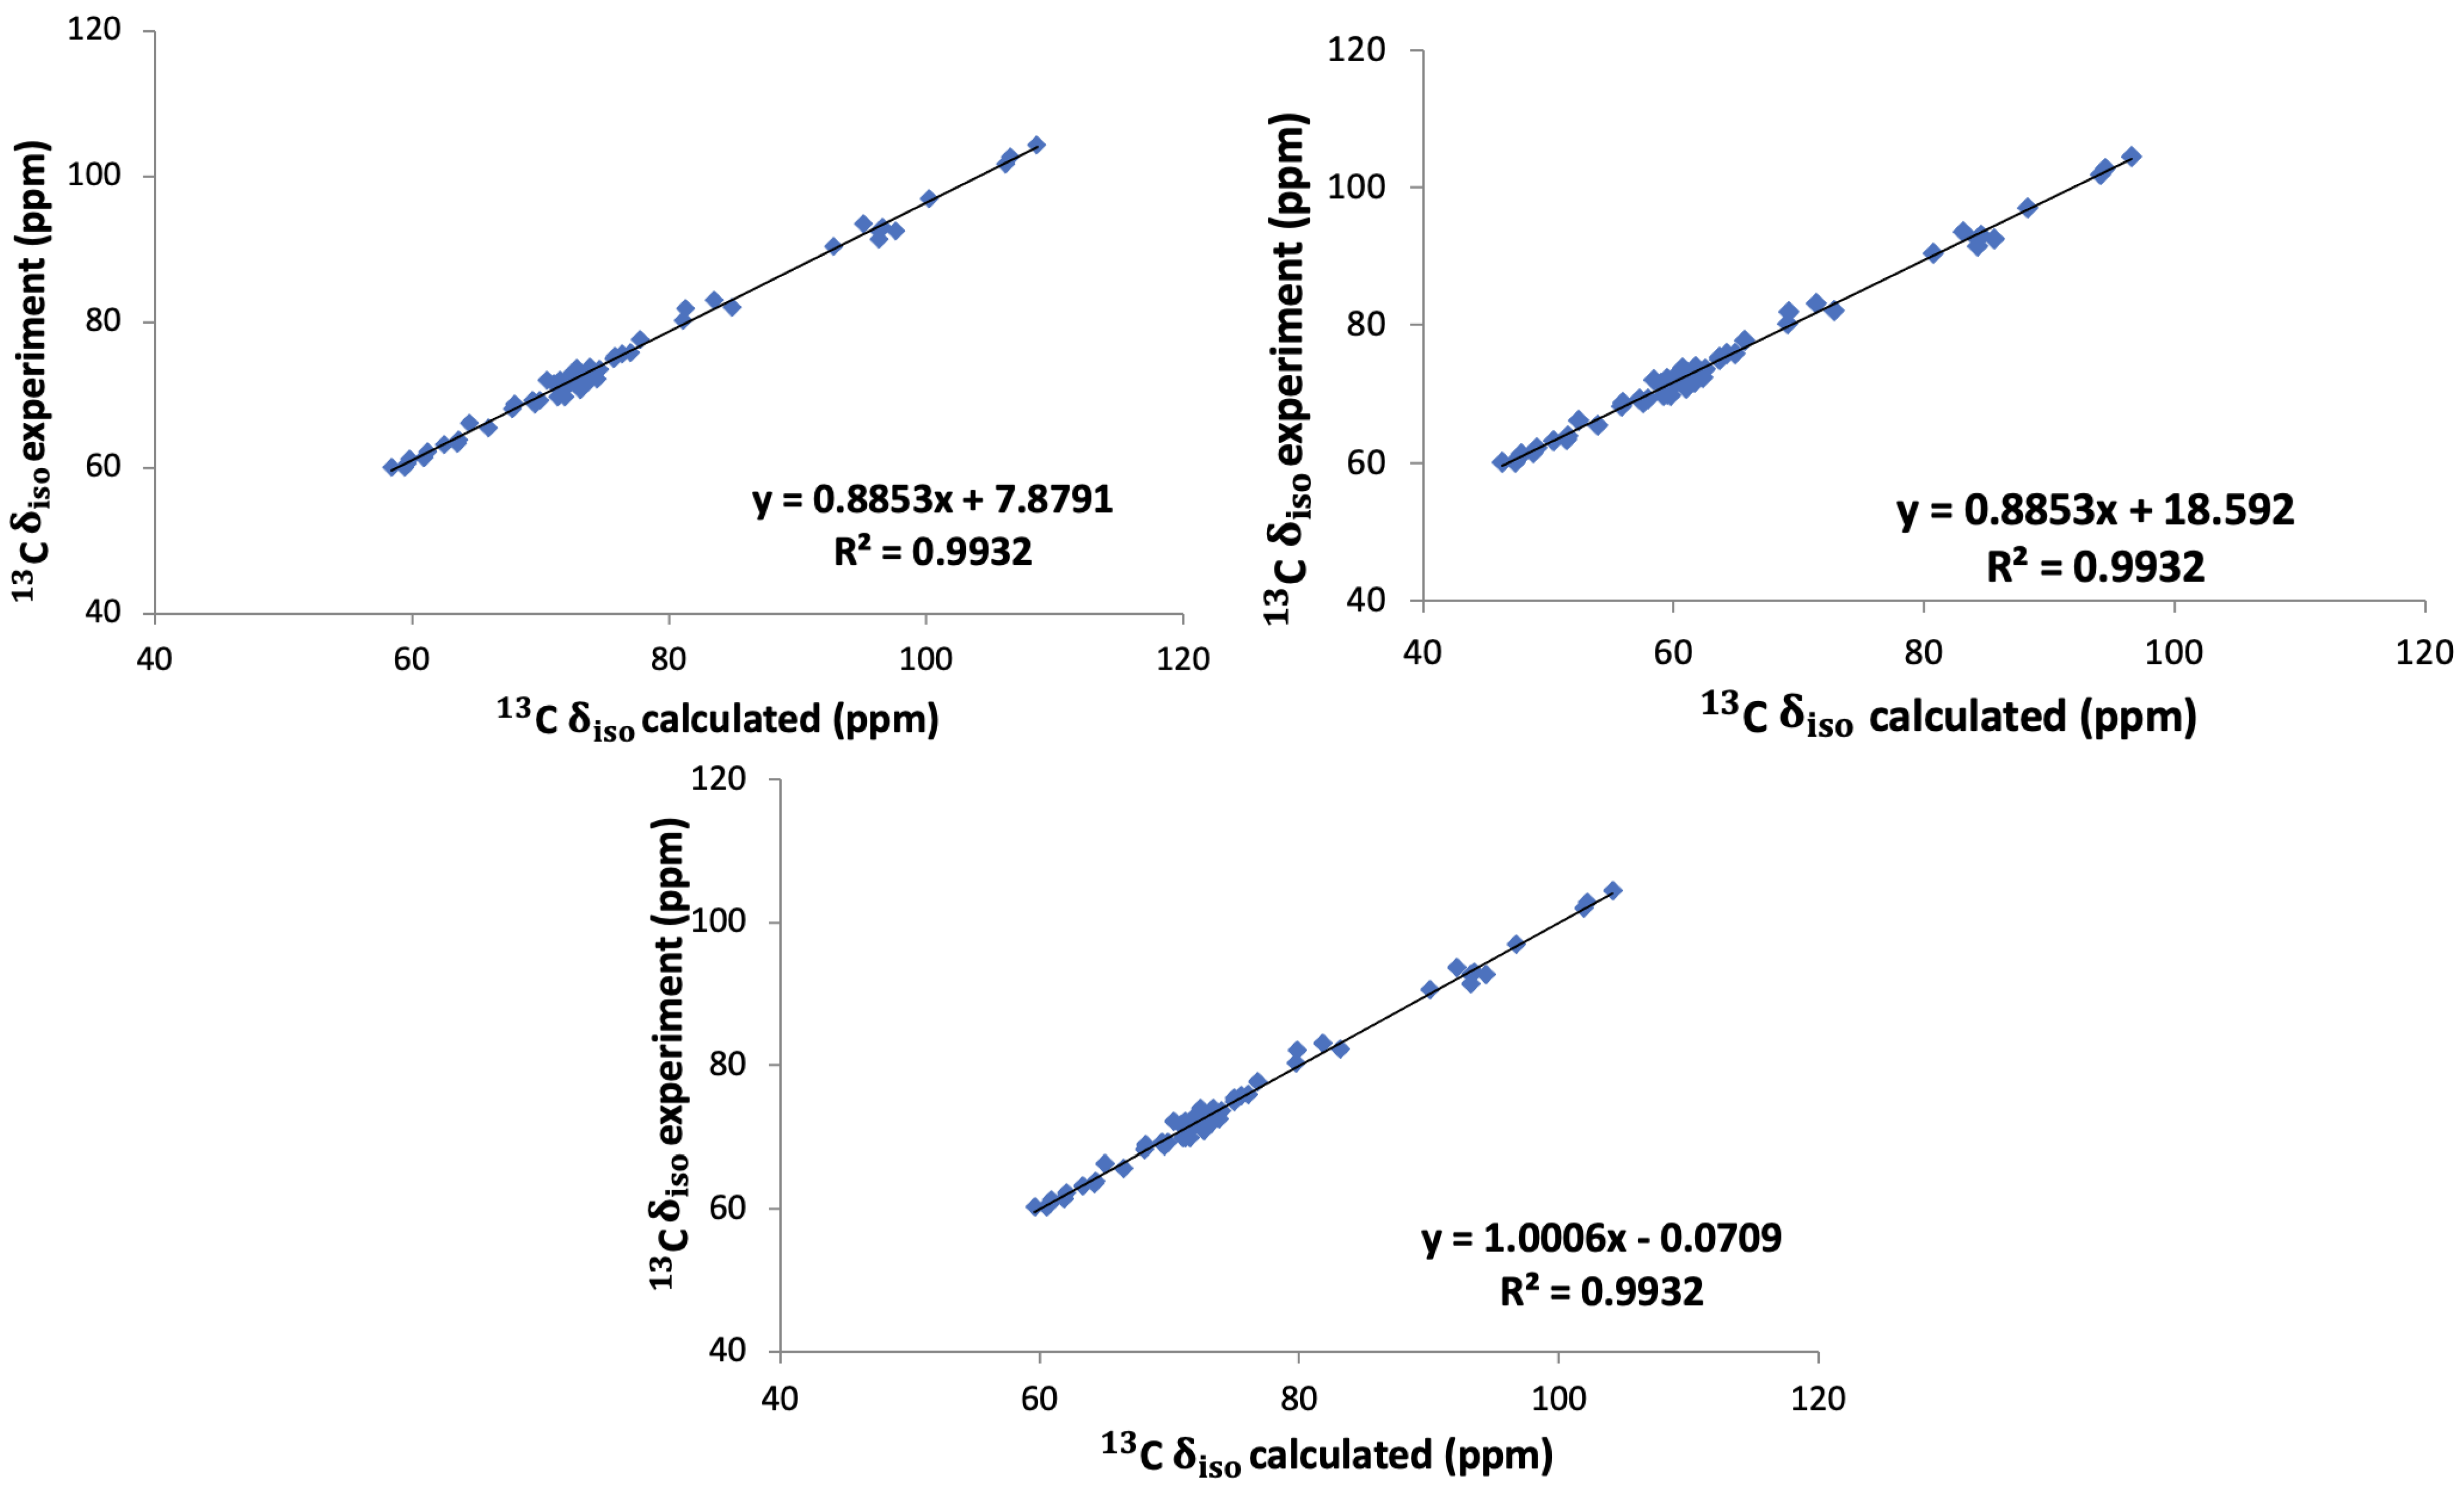
Figure 6.
Experimental versus calculated C isotropic chemical shift (using Equation (1)) for the six molecules employed in the generating the linear regression between experimental chemical shifts and calculated absolute shieldings. The lines are all linear fits.
Figure 6.
Experimental versus calculated C isotropic chemical shift (using Equation (1)) for the six molecules employed in the generating the linear regression between experimental chemical shifts and calculated absolute shieldings. The lines are all linear fits.
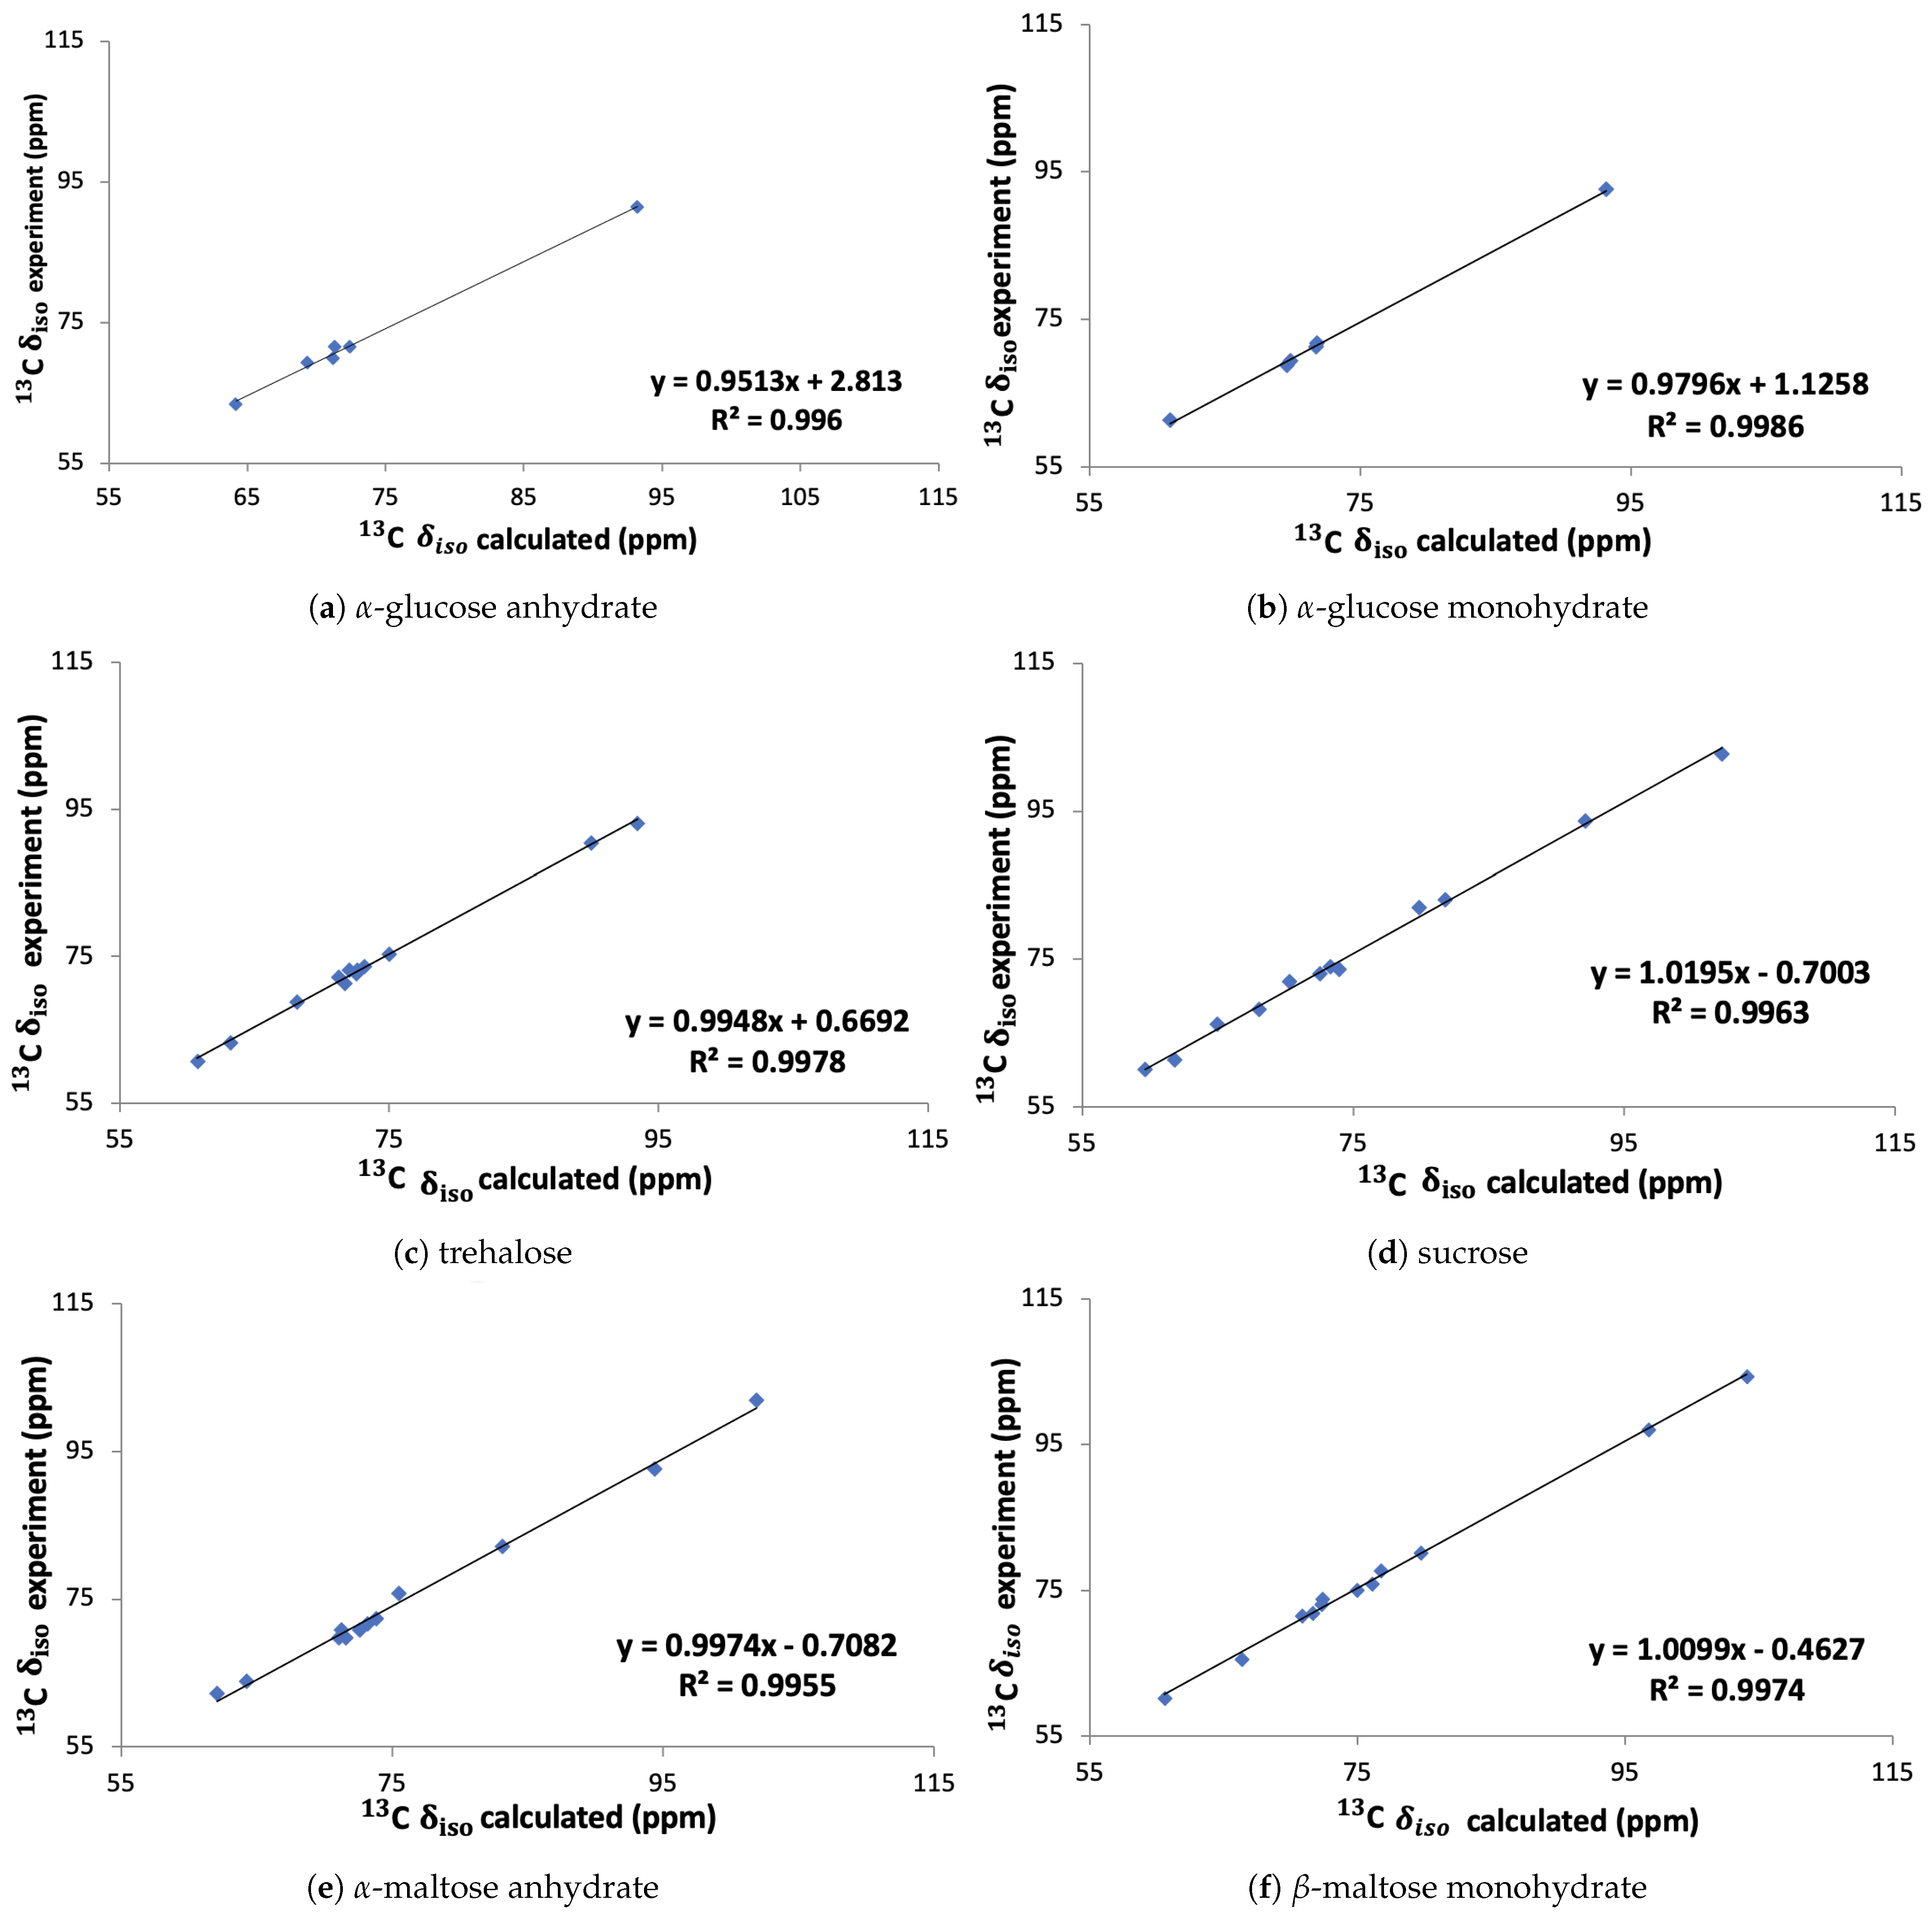
Figure 7.
Definition of the angles and at the glycosidic linkage.
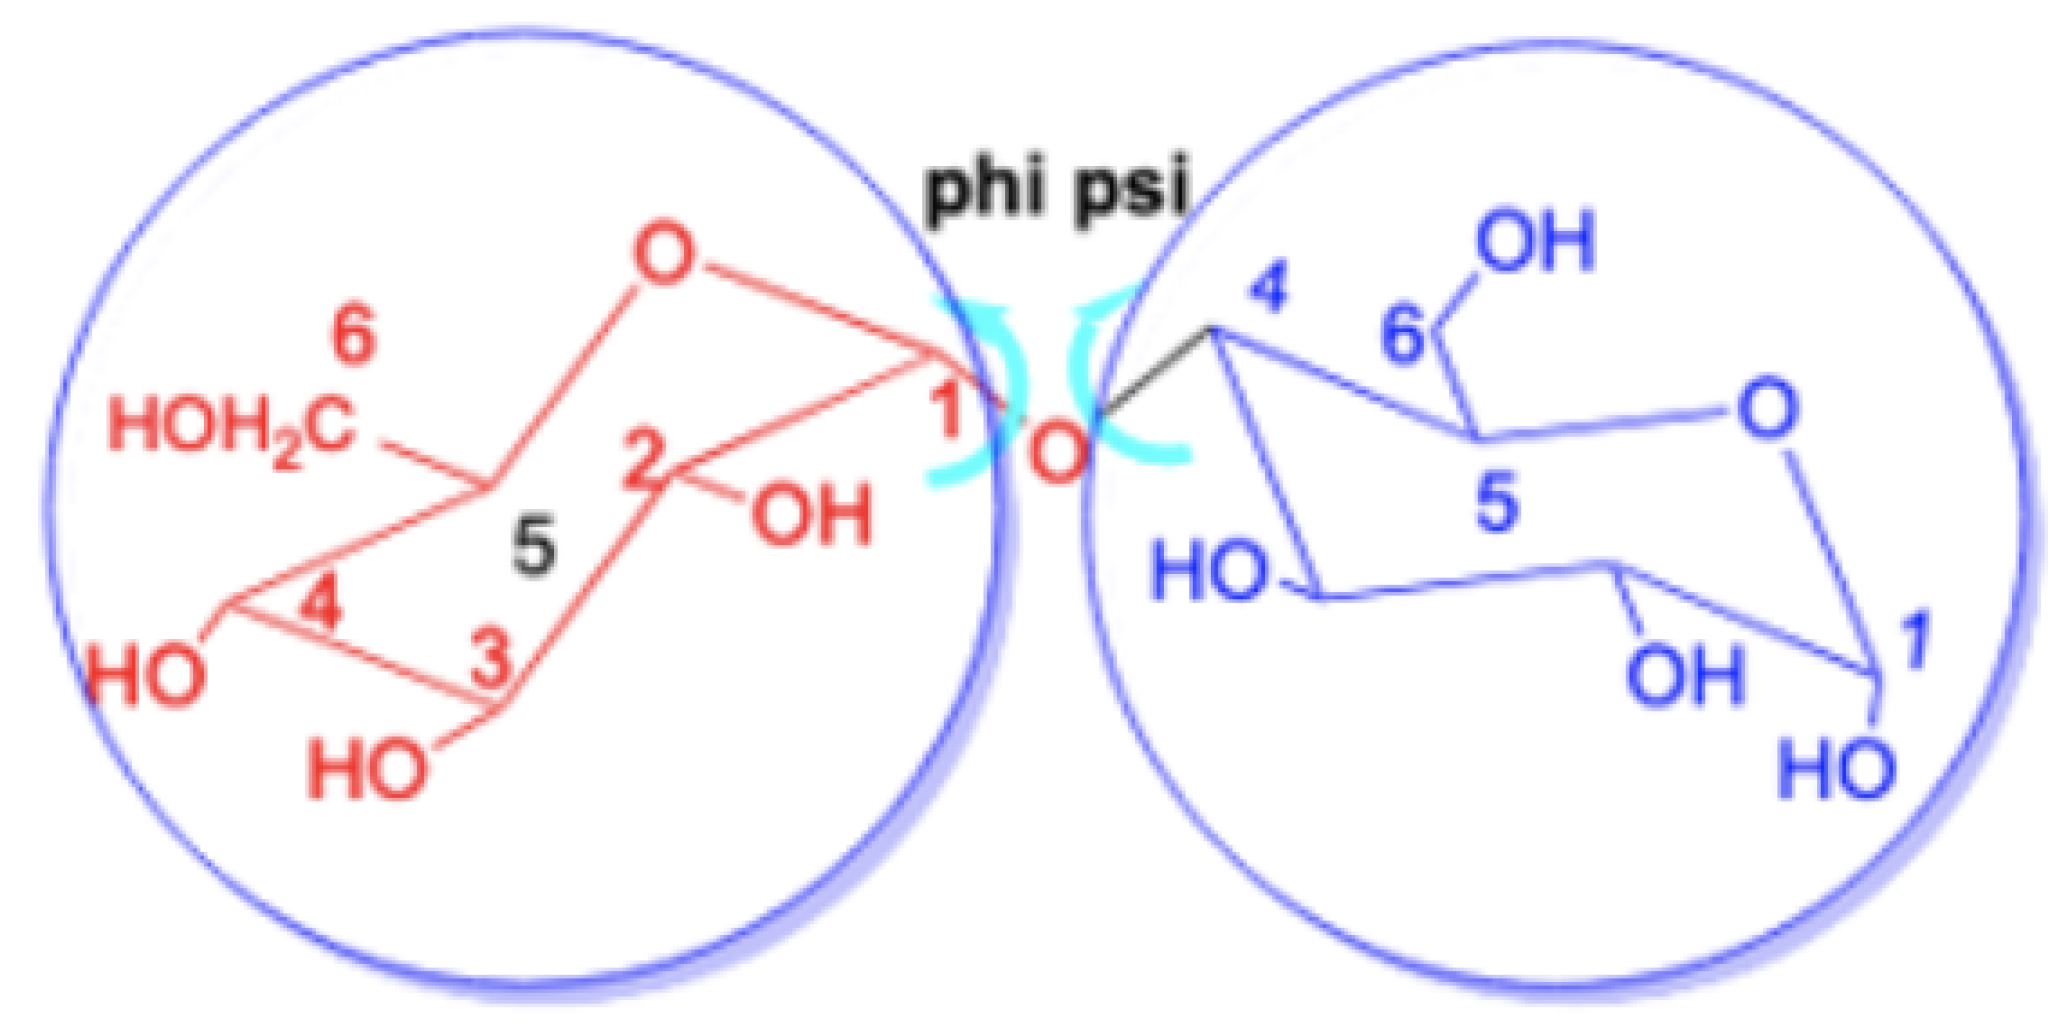
Figure 8.
Monohydrate crystal structures studied in this work.

Table 1.
Calculated 13C isotropic chemical shifts of -glucose and different disaccharides. The values in parentheses are the changes in the chemical shifts relative to -glucose and the chemical shifts of the glycosidic linkage atoms are shown in bold.
Table 1.
Calculated 13C isotropic chemical shifts of -glucose and different disaccharides. The values in parentheses are the changes in the chemical shifts relative to -glucose and the chemical shifts of the glycosidic linkage atoms are shown in bold.
| Name/Site | C | C | C | C | C | C | RMSD | ||||||
|---|---|---|---|---|---|---|---|---|---|---|---|---|---|
| -glucose [8] | 93.22 | 69.36 | 71.32 | 72.45 | 71.23 | 64.17 | |||||||
| sucrose unit 1 structure 1 [14] | 92.10 | (−1.12) | 73.39 | (4.03) | 72.66 | (1.34) | 68.04 | (−4.41) | 73.77 | (2.54) | 59.60 | (−4.57) | 3.32 |
| sucrose unit 1 structure 2 [15] | 92.15 | (−1.07) | 73.32 | (3.96) | 72.57 | (1.25) | 68.04 | (−4.41) | 73.98 | (2.75) | 59.64 | (−4.53) | 3.31 |
| trehalose unit 1 [18] | 93.45 | (0.23) | 72.69 | (3.33) | 71.26 | (−0.06) | 68.17 | (−4.28) | 71.71 | (0.48) | 60.77 | (−3.40) | 2.62 |
| trehalose unit 2 [18] | 90.05 | (−3.17) | 72.60 | (3.24) | 75.01 | (3.69) | 73.20 | (0.75) | 72.08 | (0.85) | 63.26 | (−0.91) | 2.46 |
| -maltose unit 1 [16] | 101.90 | (8.68) | 73.81 | (4.45) | 75.52 | (4.20) | 71.55 | (−0.90) | 72.62 | (1.39) | 64.28 | (0.11) | 4.39 |
| -maltose unit 2 [16] | 94.36 | (1.14) | 71.04 | (1.68) | 73.19 | (1.87) | 83.11 | (10.66) | 71.27 | (0.04) | 62.10 | (−2.07) | 4.57 |
| -lactose unit 2 structure 1 [21] | 93.74 | (0.52) | 69.68 | (0.32) | 71.23 | (−0.09) | 83.55 | (11.10) | 72.07 | (0.84) | 60.06 | (−4.11) | 4.85 |
| -lactose unit 2 structure 2 [21] | 94.05 | (0.83) | 74.81 | (5.45) | 71.97 | (0.65) | 87.14 | (14.69) | 74.08 | (2.85) | 63.31 | (−0.86) | 6.53 |
Table 2.
Calculated 13C isotropic chemical shifts of -glucose and different disaccharide models, using linear regression technique. The values in parentheses are the changes in the chemical shifts relative to -glucose and the chemical shifts of the glycosidic linkage atoms are shown in bold.
Table 2.
Calculated 13C isotropic chemical shifts of -glucose and different disaccharide models, using linear regression technique. The values in parentheses are the changes in the chemical shifts relative to -glucose and the chemical shifts of the glycosidic linkage atoms are shown in bold.
| Name/Site | C | C | C | C | C | C | RMSD | ||||||
|---|---|---|---|---|---|---|---|---|---|---|---|---|---|
| -glucose [9] | 95.48 | 75.53 | 73.90 | 70.10 | 73.91 | 62.26 | |||||||
| -cellobiose unit 1 [20] | 102.86 | (−7.38) | 71.85 | (3.68) | 73.74 | (0.16) | 72.31 | (−2.20) | 75.22 | (−1.31) | 62.93 | (−0.66) | 3.54 |
| -cellobiose unit 2 [20] | 96.94 | (−1.46) | 74.50 | (1.04) | 74.23 | (−0.34) | 84.28 | (−14.17) | 77.53 | (−3.62) | 63.09 | (−0.83) | 6.03 |
| -lactose unit 2 [22] | 98.90 | (−3.42) | 72.81 | (2.73) | 75.48 | (−1.58) | 79.74 | (−9.64) | 78.61 | (−4.70) | 62.18 | (0.08) | 4.77 |
Table 3.
Calculated 13C isotropic chemical shifts of -galactose and different disaccharide models, using linear regression technique. The values in parentheses are the changes in the chemical shifts relative to -galactose and the chemical shifts of the glycosidic linkage atoms are shown in bold.
Table 3.
Calculated 13C isotropic chemical shifts of -galactose and different disaccharide models, using linear regression technique. The values in parentheses are the changes in the chemical shifts relative to -galactose and the chemical shifts of the glycosidic linkage atoms are shown in bold.
| Name/Site | C | C | C | C | C | C | RMSD | ||||||
|---|---|---|---|---|---|---|---|---|---|---|---|---|---|
| -galactose [12] | 98.21 | 69.87 | 74.02 | 68.63 | 73.75 | 61.18 | |||||||
| -lactose unit 1 [22] | 100.88 | (−2.67) | 71.81 | (−1.94) | 72.71 | (1.31) | 68.08 | (0.55) | 75.74 | (−1.99) | 59.87 | (1.32) | 1.76 |
| -lactose unit 1 structure 1 [21] | 105.54 | (−7.33) | 70.10 | (−0.23) | 74.32 | (−0.30) | 71.50 | (−2.87) | 76.91 | (−3.16) | 61.78 | (−0.59) | 3.47 |
| -lactose unit 1 structure 2 [21] | 104.13 | (−5.92) | 70.42 | (−0.55) | 73.46 | (0.57) | 68.26 | (0.37) | 78.84 | (−5.09) | 63.87 | (−2.69) | 3.39 |
Table 4.
Measured values of and , along with the change in the computed chemical shifts Δ (in ppm) of the glycosidic linkage atoms.
Table 4.
Measured values of and , along with the change in the computed chemical shifts Δ (in ppm) of the glycosidic linkage atoms.
| Disaccharides | Unit 1 | Unit 2 | ||
|---|---|---|---|---|
| Sucrose | 108.34 | −44.67 | −1.12 | |
| Trehalose | 60.83 | 60.11 | 0.23 | −3.17 |
| -maltose | 116.10 | −117.00 | 8.68 | 10.66 |
| -cellobiose | −76.29 | 106.39 | −7.38 | −14.17 |
| -lactose structure 1 | −93.15 | 96.48 | −7.33 | 11.10 |
| -lactose structure 2 | −67.62 | 91.27 | −5.92 | 14.69 |
| -lactose | −69.28 | 107.67 | −2.67 | −9.64 |
Table 5.
Calculated 13C isotropic chemical shifts of sucrose and different trisaccharide models, using linear regression technique. The values in parentheses are the changes in the chemical shifts relative to -glucose in sucrose or fructose in sucrose, respectively, and the chemical shifts of the glycosidic linkage atoms are shown in bold.
| Name/Site | C | C | C | C | C | C | RMSD | ||||||
|---|---|---|---|---|---|---|---|---|---|---|---|---|---|
| -glucose in sucrose [15] | 92.15 | 73.32 | 72.57 | 68.04 | 73.98 | 59.64 | |||||||
| melezitose unit 1 [24] | 92.63 | (−0.48) | 73.76 | (−0.44) | 74.04 | (−1.47) | 68.35 | (−0.31) | 72.42 | (1.56) | 61.94 | (−2.30) | 1.32 |
| planteose unit 3 [25] | 91.38 | (0.77) | 68.40 | (4.92) | 74.16 | (−1.59) | 69.49 | (−1.45) | 71.35 | (2.63) | 63.55 | (−3.91) | 2.93 |
| fructose in sucrose [15] | 65.01 | 102.2 | 81.81 | 70.31 | 79.85 | 61.85 | |||||||
| melezitose unit 2 [24] | 60.59 | (4.42) | 105.53 | (−3.33) | 86.99 | (−5.18) | 73.48 | (−3.17) | 78.61 | (1.24) | 64.14 | (−2.29) | 3.52 |
| planteose unit 2 [25] | 59.52 | (5.49) | 104.49 | (−2.29) | 73.78 | (8.03) | 74.75 | (−4.44) | 82.36 | (−2.51) | 66.11 | (−4.26) | 4.90 |
Table 6.
Calculated 13C isotropic chemical shifts of -glucose anhydrate [8] and monohydrate [10] models, using linear regression technique. The values in parentheses are the changes in the chemical shifts relative to -glucose.
| Name/Site | C | C | C | C | C | C | RMSD | ||||||
|---|---|---|---|---|---|---|---|---|---|---|---|---|---|
| -glucose | 93.22 | 69.36 | 71.32 | 72.45 | 71.23 | 64.17 | |||||||
| -glucose monohydrate | 93.21 | (0.01) | 69.87 | (−0.51) | 71.82 | (−0.50) | 69.58 | (2.87) | 71.76 | (−0.53) | 60.93 | (3.24) | 1.80 |
Table 7.
Calculated 13C isotropic chemical shifts of maltose anhydrate [16] and monohydrate [17] models, using linear regression technique. The values in parentheses are the changes in the chemical shifts relative to -maltose anhydrate unit 1 and unit 2, respectively.
| Name/Site | C | C | C | C | C | C | RMSD | ||||||
|---|---|---|---|---|---|---|---|---|---|---|---|---|---|
| -maltose anhydrate unit 1 | 101.90 | 73.81 | 75.52 | 71.55 | 72.62 | 64.28 | |||||||
| -maltose anhydrate unit 2 | 94.36 | 71.04 | 73.19 | 83.11 | 71.27 | 62.10 | |||||||
| -maltose monohydrate unit 1 | 104.12 | (−2.22) | 70.87 | (2.94) | 72.34 | (3.18) | 72.39 | (−0.83) | 71.69 | (0.92) | 66.40 | (−2.11) | 2.22 |
| -maltose monohydrate unit 2 | 96.73 | (−2.36) | 76.74 | (−5.70) | 74.97 | (−1.78) | 79.75 | (3.36) | 76.08 | (−4.81) | 60.57 | (1.53) | 3.61 |
Table 8.
Calculated 13C isotropic chemical shifts of trehalose anhydrate [18] and monohydrate [19] models, using linear regression technique. The values in parentheses are the changes in the chemical shifts relative to trehalose anhydrate unit 1 and unit 2, respectively.
| Name/Site | C | C | C | C | C | C | RMSD | ||||||
|---|---|---|---|---|---|---|---|---|---|---|---|---|---|
| trehalose anhydrate unit 1 | 93.45 | 72.69 | 71.26 | 68.17 | 71.71 | 60.77 | |||||||
| trehalose anhydrate unit 2 | 90.05 | 72.60 | 75.01 | 73.20 | 72.08 | 63.26 | |||||||
| trehalose monohydrate unit 1 | 91.99 | (1.46) | 73.50 | (−0.81) | 73.01 | (−1.75) | 68.95 | (−0.78) | 73.68 | (−1.96) | 62.03 | (−1.27) | 1.41 |
| trehalose monohydrate unit 2 | 92.24 | (−2.19) | 71.09 | (1.50) | 72.59 | (2.42) | 72.95 | (0.25) | 73.29 | (−1.20) | 62.86 | (0.40) | 1.56 |
Table 9.
Calculated 13C isotropic chemical shifts (in ppm) of -lactose anhydrate [21] and monohydrate [23] models, using linear regression technique.
| Name/Site | C | C | C | C | C | C | RMSD | ||||||
|---|---|---|---|---|---|---|---|---|---|---|---|---|---|
| -lactose anhydrate unit 1 (nr 1) | 105.54 | (−0.98) | 70.10 | (−1.96) | 74.32 | (0.91) | 71.50 | (2.62) | 76.91 | (3.20) | 61.78 | (1.10) | 3.25 |
| -lactose anhydrate unit 1 (nr 2) | 104.13 | (−0.42) | 70.42 | (−1.64) | 73.46 | (0.04) | 68.26 | (−0.62) | 78.84 | (5.13) | 63.87 | (3.19) | 2.57 |
| -lactose monohydrate unit 1 | 104.56 | 72.06 | 73.41 | 68.88 | 73.70 | 60.68 | |||||||
| -lactose anhydrate unit 2 (nr 1) | 93.74 | (−0.04) | 69.68 | (−0.16) | 71.23 | (−1.12) | 83.55 | (−1.58) | 72.07 | (0.04) | 60.06 | (−2.20) | 1.20 |
| -lactose anhydrate unit 2 (nr 2) | 94.05 | (0.27) | 74.81 | (4.97) | 71.97 | (−0.38) | 87.14 | (2.01) | 74.08 | (2.05) | 63.31 | (1.04) | 2.39 |
| -lactose monohydrate unit 2 | 93.79 | 69.84 | 72.35 | 85.14 | 72.02 | 62.26 | |||||||
Table 10.
Changes in the chemical shifts Δ (in ppm) and the distance to the oxygen atom in the closest water molecule R (in Å).
Table 10.
Changes in the chemical shifts Δ (in ppm) and the distance to the oxygen atom in the closest water molecule R (in Å).
| Disaccharide | Atom | R | Atom | R | Atom | R | |||
|---|---|---|---|---|---|---|---|---|---|
| -glucose | 3.63 | −0.50 | 3.40 | −0.51 | |||||
| -maltose | 4.30 | −2.36 | 3.93 | −4.81 | 3.46 | 3.61 | |||
| Trehalose | 3.72 | 1.46 | 3.53 | −0.81 | |||||
| -lactose vs. nr 1 | 4.64 | −1.96 | 4.02 | 2.62 | 3.31 | 0.91 | |||
| -lactose vs nr. 2 | 4.64 | −1.64 | 4.02 | −0.62 | 3.31 | 0.04 |
Disclaimer/Publisher’s Note: The statements, opinions and data contained in all publications are solely those of the individual author(s) and contributor(s) and not of MDPI and/or the editor(s). MDPI and/or the editor(s) disclaim responsibility for any injury to people or property resulting from any ideas, methods, instructions or products referred to in the content. |
© 2023 by the authors. Licensee MDPI, Basel, Switzerland. This article is an open access article distributed under the terms and conditions of the Creative Commons Attribution (CC BY) license (https://creativecommons.org/licenses/by/4.0/).
Share and Cite
MDPI and ACS Style
Moustafa, H.; Larsen, F.H.; Madsen, A.Ø.; Sauer, S.P.A. 13C NMR Chemical Shifts of Saccharides in the Solid State: A Density Functional Theory Study. Magnetochemistry 2023, 9, 192. https://doi.org/10.3390/magnetochemistry9080192
AMA Style
Moustafa H, Larsen FH, Madsen AØ, Sauer SPA. 13C NMR Chemical Shifts of Saccharides in the Solid State: A Density Functional Theory Study. Magnetochemistry. 2023; 9(8):192. https://doi.org/10.3390/magnetochemistry9080192
Chicago/Turabian StyleMoustafa, Hadeel, Flemming H. Larsen, Anders Ø. Madsen, and Stephan P. A. Sauer. 2023. "13C NMR Chemical Shifts of Saccharides in the Solid State: A Density Functional Theory Study" Magnetochemistry 9, no. 8: 192. https://doi.org/10.3390/magnetochemistry9080192
Note that from the first issue of 2016, this journal uses article numbers instead of page numbers. See further details here.