
Nanomaterial Endocytosis: Quantification of Adsorption and Ingestion Mechanisms
by
 , ,
, ,
Abhinav Sannidhi
1,*,
Chen Zhou
1,
Young Suk Choi
1,
Allan E. David
1,
Paul W. Todd
2 and
Thomas R. Hanley
1 1
Department of Chemical Engineering, Auburn University, Auburn, AL 36849, USA
2
Magnaquant LLC, 209 Quality Avenue Ste 4, New Albany, IN 47150, USA
*
Author to whom correspondence should be addressed.
Magnetochemistry 2023, 9(2), 37; https://doi.org/10.3390/magnetochemistry9020037
Submission received: 28 December 2022
/
Revised: 15 January 2023
/
Accepted: 16 January 2023
/
Published: 19 January 2023
(This article belongs to the Special Issue Magnetic Nanoparticles for Biomedicine 2022)
Abstract
:The widespread use of nanomaterials in vaccines, therapeutics, and industrial applications creates an increasing demand for understanding their ingestion by living cells. Researchers in the field have called for a more robust understanding of physical/chemical particle–cell interactions and a means to determine the particles ingested per cell. Using superparamagnetic nanobeads, we measured the beads per cell and quantified the kinetics of the receptor-independent endocytosis of particles having seven surface chemistries. Poly(ethylene glycol) (PEG)-coated nanoparticles were ingested less effectively by cultured Chinese hamster ovary (CHO-K1) cells and more effectively by aminated nanoparticles than starch-coated particles. The cells ingested 2 to 4 × 10⁵ of the most attractive particles. The interplay between Van der Waals and coulombic potentials was quantified on the basis of Derjaguin–Landau–Verwey–Overbeek (DLVO) theory modified to include hydration repulsion using physical parameters of the seven surface chemistries. Using dose–response curves for inhibitors of clathrin- or caveolae-dependent ingestion, we quantified how particle surface chemistry determines which endocytic pathway is used by the cell. Such characterization can be useful in predicting nanomaterial uptake in medical and toxicological applications and in the selection of particle surface chemistries for receptor-dependent endocytosis.

1. Introduction
Nanomaterials—synthetic particles, liposomes, viroids, gene-transfer vectors, exosomes, etc.—are widely used in cell biology research, in vivo diagnostics, theranostics, and drug delivery to target cells [1,2], and some are also disease vectors (viruses) and signal-transduction vectors [3]. More recently, mRNA vaccine carriers [4] and in situ RNA probes [5] have become conspicuous applications of nanomaterials. A recent critical review has brought attention to the need for a robust understanding of the particle–cell surface interactions of mRNA vaccine particles specifically and of delivery vectors in general [4], proposing “an iterative characterization strategy for the preclinical assessment of the quality, efficacy and safety of nanovaccines (NVs) based on the measurements of physical, chemical and stability properties, in vitro and in vivo immunogenicity and toxicity”. The uptake of nanoparticles (NPs) by target and nontarget cells is known to be relevant to nanomaterial toxicity [6,7,8], and its enhancement or avoidance can be adjusted by tuning surface chemistries [7,9,10,11,12]. Pathways for the cellular uptake of nanoparticles (NPs) include receptor-dependent and receptor-independent pathways. Various mechanistic models have been proposed to explain and therefore control the extent of NP endocytosis [13,14,15,16], but appropriate data sets are needed for the evaluation of such models. According to a recent comprehensive review [17], studies to date on quantifying NP uptake are still only semiquantitative, and there is a need for methods that provide quantitative counts of NPs per cell. Even flow cytometric methods provide relative fluorescence intensities but do not enumerate beads per cell [18]. In this study, NPs with magnetic cores (MNPs) and magnetophoretic mobility measurements [19] were used to rapidly enumerate beads per cell to directly quantify NP uptake by mammalian cells in monolayer culture, a popular model for such studies [13,14,18,20]. This technology makes it possible to obtain large quantities of numerical data required for the mathematical quantification of adsorption and ingestion processes. The results reported here quantify, in real numbers, the roles of surface charge, Van der Waals, and hydration repulsion forces in the adsorption step and the relative roles of caveolae-dependent, clathrin-dependent, and clathrin- and caveolae-independent endocytosis pathways [21,22] in a single in vitro cell type, thereby enabling quantified guidance in the selection of nanomaterials for optimum intracellular delivery or the avoidance thereof.
Our assumptions were that (1) it is possible to enumerate beads per cell using an absolute measurement [19,23,24,25]; (2) the endocytosis process requires two steps, adsorption and ingestion [26,27,28], illustrated in Figure 1a,b; and (3) both steps depend on the surface properties of the nanomaterial [13,21]. Based on these assumptions, we (1) quantified the effect of the culture medium on nanobeads with various coatings; (2) validated magnetophoresis as a direct means to enumerate beads per cell; (3) quantified the rate and equilibrium features of the adsorption step in terms of the particle surface composition, Langmuir isotherm constants, and Derjaguin–Landau–Verwey–Overbeek (DLVO) colloid stability theory; (4) quantified the dependence of two mechanisms of ingestion on particle surface properties using specific inhibitors; and (5) considered a paradigm for bead surface tuning for categories of applications. The experiment designs were based on holding the cell type and bead size constant and varying only the bead surface composition. This paradigm could, of course, be applied to other cell types, particle sizes, and chemistries to receptor-dependent uptake.
Earlier approaches to these goals have revealed the following: (1) Most NPs with polar surfaces, when in a culture medium or in vivo, adsorb a coat of serum albumin known as a “protein corona” [17,29,30,31], but those fully coated with poly(ethylene glycol) (PEG) do not [14,32,33]. (2) Approximate measurements of beads per cell have utilized magnetophoretic mobility [19,23,24] without application to kinetic analysis, flow cytometry [26] with specific application to Metal Organic Frameworks, and transmission electron microscopy [25,34] with specific application to gold NPs but with limited statistics and arduous procedures, and there is a demand for this need to be met [17]. (3) Determining the kinetic features of the adsorption process requires large data sets of particles/cell vs. time and concentration, and studies where quantification by fluorescence methods are possible have provided some of this [26,29], and there are precedents for the application of Langmuir adsorption theory [28] and DLVO treatment [35]. (4) Mechanisms of ingestion have been identified on the basis of inhibition of pathways [17,18,21,22,26,30,36] although partitioning among pathways is seldom quantified on the basis of beads per cell per pathway, which is relevant to the delivery of cargo via caveolae and avoiding endosomal degradation. (5) Nanoparticle surface properties can be “tuned” to optimize protein corona formation, to avoid undesired uptake, and to select pathways of ingestion [2,4,9,10,11,17,20,21,26,30], and a basic understanding of the underlying physical mechanisms can guide the tuning process.
2. Materials and Methods
2.1. Instrumentation
A Zetasizer Nano ZSTM (Malvern Panalytical Inc., Westborough, MA, USA) was used to estimate the hydrodynamic diameter (backscattering angle = 173°) and zeta potential (Smoluchowski model) of the nanoparticles in distilled water and a cell culture medium (CM) by dynamic light scattering. Magnetophoretic mobilities were measured using a HyperfluxTM magnetic particle-tracking velocimeter (Magnaquant, Louisville, KY, USA) with the threshold intensity set at 130 gray-scale units [19]. This instrument records the velocities of individual cells in an isodynamic magnetic field and calculates the magnetophoretic mobility, which we express in units of picoRembaum. One picoRembaum (pRm) = 10−12 m3T−1A−1s−1, the SI unit of magnetophoretic mobility.
2.2. Materials
Nanoparticles with starch coating (FluidMAG-D) and dextran sulfate coating (FluidMAG-DXS) were procured from Chemicell GmbH (Berlin, Germany). Starch and dextran sulfate (DXS) coatings were cross-linked and modified to yield aminated starch and aminated DXS beads using the methods described in detail by Cole et al. and Anani et al. [9,37]. Aminated starch-coated beads were further coated with PEG with a molecular weight of 2, 5, and 20 kDa using the method of Hanot et al. at a PEG coverage of 56, 23, and 0.7 nmoles/mg of iron in beads, respectively, as given in Figure 1c and Table 1 [7]. The significant variable for these studies is the amount of coverage of PEG per bead (grafting density) [7,33]. Genistein and Chlorpromazine hydrochloride were purchased from VWR, Radnor, PA, USA.
2.3. Cell Culture
Chinese hamster ovary (CHO-K1) cells (catalogue no: ATCC CCL-61) were obtained from the American Type Culture Collection (Manassas, VA, USA) and subcultured every 48 h by first discarding the cell culture medium, which was 89% Ham’s F-K12+10% fetal bovine serum and 1% Antibiotic solution (VWR Life Science Seradigm, Radnor, PA, USA). The cell monolayer in its 75 mL flask was rinsed with 10 mL of Hanks’ Balanced Salts Solution (HBSS), and 1 mL of TripLE solution (ThermoFisher Scientific, Waltham, MA, USA) was added and incubated for 5 min at 37 °C to detach the cells. After adding 10 mL of HBSS, the cell suspension was transferred to a 50 mL tube and centrifuged at 1500 rpm for 5 min. After discarding the supernatant, the cells were resuspended in 5 mL of new culture medium. A portion, about one eighth, was then added to a new flask with 14 mL of culture medium for continued incubation at 37 °C.
2.4. Experiment Procedure
Cells were seeded in 24-well plates (VWR Life Science) at 2.6 × 10⁴ cells/mL and were allowed to grow in 2 mL of complete medium for 48 h. MNPs were prepared at specified concentrations (μg Fe/mL) in the culture medium with different coatings as designated in Table 1. After specified incubation times, the culture medium was removed and the cell monolayer was washed five times using 2 mL of HBSS, and then it was incubated for three minutes. Then, 0.5 mL of TripLE (ThermoFisher Scientific, Waltham, MA, USA) were added to the monolayers, and they were incubated for 5 to 10 min. Collected cell suspensions in 50 mL tubes were centrifuged at 1500 rpm for 5 min and resuspended in 4 mL of Phosphate Buffered Saline for analysis in the Hyperflux magnetic velocimeter (Figure 2a) [19]. Average mobilities were calculated using the Hyperflux list-mode variable “tAverageMobility” for all cells with mobility > 0 and intensity threshold setting of 130 (on a 0–255 grey scale). An example of the experimental data is given in Figure 2a, which shows the mobility of the CHO cells increasing versus exposure time when incubated with 124 nm starch-coated beads at a concentration of 100 μg Fe/mL. In most cases, >80% of the cells were viable after one day of exposure to 100 μg of Fe/mL as assessed by staining criteria.
The statistical accuracy of magnetic measurements was validated in five triplicate experiments in which the average standard deviation was found to be 7.8% of the mean. Thus, every uptake measurement, in beads per cell, had this level of error, which is small compared to differences among values and is included in the graphics as error bars.
2.5. Beads per Cell
The iron concentration was converted to beads/mL based on vendor data using 11.1 × 10⁻⁶ pg Fe per 100 nm bead. Knowing the Fe/bead, magnetophoretic mobility converts directly to beads/cell based on 0.117 × 10⁵ beads/cell per pRm. This conversion factor was determined from a linear calibration curve, given in Figure 2b, in which the independently measured beads/cell (abscissa) was based on the measurement of pg Fe/cell, using the Ferrozine assay [9,19,38], in CHO-K1 cells exposed to starch-coated beads having the five surface compositions (Figure 1c). Since the ferrozine assay was used to determine Fe/bead and Fe/cell and therefore beads/cell, it serves as the “ground truth” for this calibration curve.
2.6. Adsorption Isotherms
Adsorption equations were fit to 24 h uptake data using a Marquardt–Levenberg algorithm to obtain fitted values and standard deviations of the constants K and S. For weakly binding particles, linear fits with KS as the slope were used, as saturation could not be demonstrated.
2.7. DLVO Analysis
Numerical versions of the DLVO relationships were calculated by using the defined constant values as follows: = 8.85 × 10⁻¹² C2J−1m−1, the permeability of free space; = 77.6, the dielectric constant of the DMEM/10FCS culture medium [39]; = 1.8 × ZP of the NPs given in Table 1, the surface potential derived from compressed ionic double-layer theory [40] using an approximation Ψ/ZP = exp(κd) = 1.8 where κ = 1.24 nm−1 is the Debye–Hückel constant estimated for the culture medium (inverse Debye length) and d = 0.47 nm is the Stern layer depth at high ionic strength (hydrated sodium ion radius); = 1.8 × (−12.4) = −22.3, mV the negative surface potential of the Chinese hamster cell [38] in the monolayer [41]; and k = 1.38 × 10²³ J K−1, Boltzmann’s constant, T = 300 °K. The Hamaker constant is taken as 6 zJ for BSA coated beads [42,43] and 1 zJ for PEGylated beads [44] interacting with cells. For PEG repulsion, values of ρ were calculated from the nmole of PEG per mg of Fe numbers in Table 1. PEG hydrodynamic radii, r, are literature values [45]. The contact area between bead and cell required for Equation (3) was calculated as the area of a cap of a 100 nm diameter sphere that is within 1 nm (where all forces are appreciable, approximately κ−1) of the cell’s assumed flat surface, which is 316 nm2. Born repulsion is omitted for convenience, and gravitational potential is neglected (<10−4 zJ).
2.8. Inhibition Experiments
Concentrations of inhibitors were chosen to be within the known inhibitory ranges [21,22,36] and so that cell viability always remained above 75% as measured by trypan dye exclusion and fluorescence. Inhibitors at the stated concentrations were present throughout the 24 h incubation of monolayer cells with beads at 37 °C. The standard deviations of the percent pathway for each bead type are the standard deviations of the values of A fitted to each toxicity curve. The control uptake levels for starch, aminated starch, DXS, and aminated DXS beads were 0.67, 2.29, 0.51, and 0.49 × 10⁵ beads/cell, respectively.
3. Results and Discussion
We quantified the influence of the culture medium (CM) on bead physical properties. Nanomaterials with a high positive zeta potential (ZP) in pure water became far less charged (in most cases slightly negative) when placed in the CM or body fluids and hence tended to aggregate [46], especially if the final ZP was close to zero. Table 1 summarizes the properties of MNPs with varied surface chemistries. The TEM micrographs of aminated and pegylated beads can be found in the work conducted by Cole et al. [9]. Aminated beads had a strong positive ZP in water as expected. The size data showed little evidence for aggregation, but considerable change in the ZP occurred upon the transfer of beads to CM. None of the samples were positively charged in the CM. The ZP decreased systematically with increasing surface concentrations of poly (ethylene glycol) (PEG), as did the tendency of particles to aggregate. The PEG coating always resulted in an increased negative ZP at a neutral pH, likely due to hydrated anion adsorption, hydroxyl dissociation, or both [47]. It was shown, using model surfaces, that aminated and hydroxylated surfaces become completely coated with serum albumin in a serum-containing medium while oligo(ethylene glycol) surfaces resist protein adsorption [48] with repulsive forces reaching out to 4 nm from the model surface [32]. The principal surface component and major contributor of Van der Waals potential in all but the heavily PEGylated beads is considered to be bovine serum albumin (BSA), which forms the well-known “protein corona” on beads with such surfaces [17,29,30,31].
We quantified the beads per cell via magnetic cytometry using a HyperfluxTM particle-tracking velocimeter [19], which displays magnetophoretic mobility histograms (Figure 2a) in units of 10−12 m3T−1A−1s−1 or picoRembaum (pRm), honoring magnetic particle pioneer Alan Rembaum [49], and the calibration curve (Figure 2b). The unlabeled cells had zero mobility. Thus, magnetophoretic mobility is a measure of MNP uptake [19,23,28,50].
We quantified the role of particle surface chemistry in the adsorption step. Aminated starch beads and aminated starch beads with only 0.7 nmole PEG/mg Fe were taken up rapidly while starch-coated beads were taken up with a delay (Figure 2c), and beads with significant PEG coverage were barely ingested in 24 h (Figure 3a,b). The equilibrium data (Figure 3a) suggest an upper limit of 2 to 4 × 10⁵ endocytosis-related adsorption sites per CHO cell, as seen numerically in Table 2. A site model is consistent with a Langmuir adsorption isotherm (beads adsorbed versus concentration) so that other adsorption isotherms (BET, Freundlich) are less likely to apply. The adsorption equations are given in Figure 3a, and these are shown as solid lines fitted to the equilibrium data for the seven bead types. The parameter K indicates reactivity, the variable S indicates sites per cell, and the product KS is the initial slope. The similar upper three curves show the strong adsorption of the starch and aminated starch-coated beads, including the aminated beads with the lowest PEG content, while similar concentrations of the weaker adsorbing beads (low K) did not reach saturation (including DXS-coated beads based on data at a single concentration). The DXS-coated bead samples had lower affinity than the starch-coated beads. The highly PEGylated beads did not adsorb, and the systematic dependence of the product KS on PEG content is shown in Figure 3b, decreasing KS with the increase in the PEG surface density.
The amination of the starch coat led to a slight increase in the association constant, suggesting that, in addition to the adsorbed albumin, the highly polar starch layer plays a role in interacting with the cell’s glycocalyx while the decreased negative ZP reduced the Coulombic repulsion by the −12.4 mV ZP of the cell [51]. The ZP affected the initial rates of uptake during the first eight hours of exposure; the aminated beads were taken up immediately, and the untreated starch beads were taken up with a delay (Figure 2c). Thus, in the adsorption mechanisms, there is an important interplay between coulombic and Van der Waals interactions, which is usually quantified using DLVO theory.
We analyzed the adsorption process in terms of potential energy diagrams (DLVO theory) assuming a spherical nanobead approaching a planar cell surface, where the total potential WT is the sum of the coulombic potential Wc, the Van der Waals potential Wv, and a hydration repulsion potential Wp. The energy potentials as a function of distance x between the bead and cell are given by Bhattacharjee et al. [52] as
PEG coatings are used to prevent unwanted interactions of surfaces with proteins and cells. PEG’s polyether oxygens engage both hydrogen atoms of the water molecule in a strong (ca. 22 kT) hydrogen-bonded structure. This complex is essentially water and results in a barrier known as “hydration repulsion” that applies to all PEG-coated beads and may be estimated by [42]
Numerical versions of these relationships are given in Figure 4h using values of the constants defined therein and given in the DLVO analysis (Section 2.7). Energy units are in zeptoJoules (zJ, 10−21 J). Bead parameters and their values are represented in Figure 4a–g, which displays DLVO plots for the seven surface chemistries. The dashed line represents the total net potential energy in each case. The plots revealed the conspicuous effect of the repulsion term due to PEG hydration. For the high surface density PEGylated beads, 56PEG2k (Figure 4e), there were no negative (attractive) values of the total potential, and for the medium surface density PEGylated beads, 23PEG5k (Figure 4d), the total potential was repulsive out to at least 2 nm, as noted in the AFM measurements [32], and in both cases the exceeded the coulombic repulsion. Since all zeta potentials were negative, there was no coulombic attraction in any of these cases.
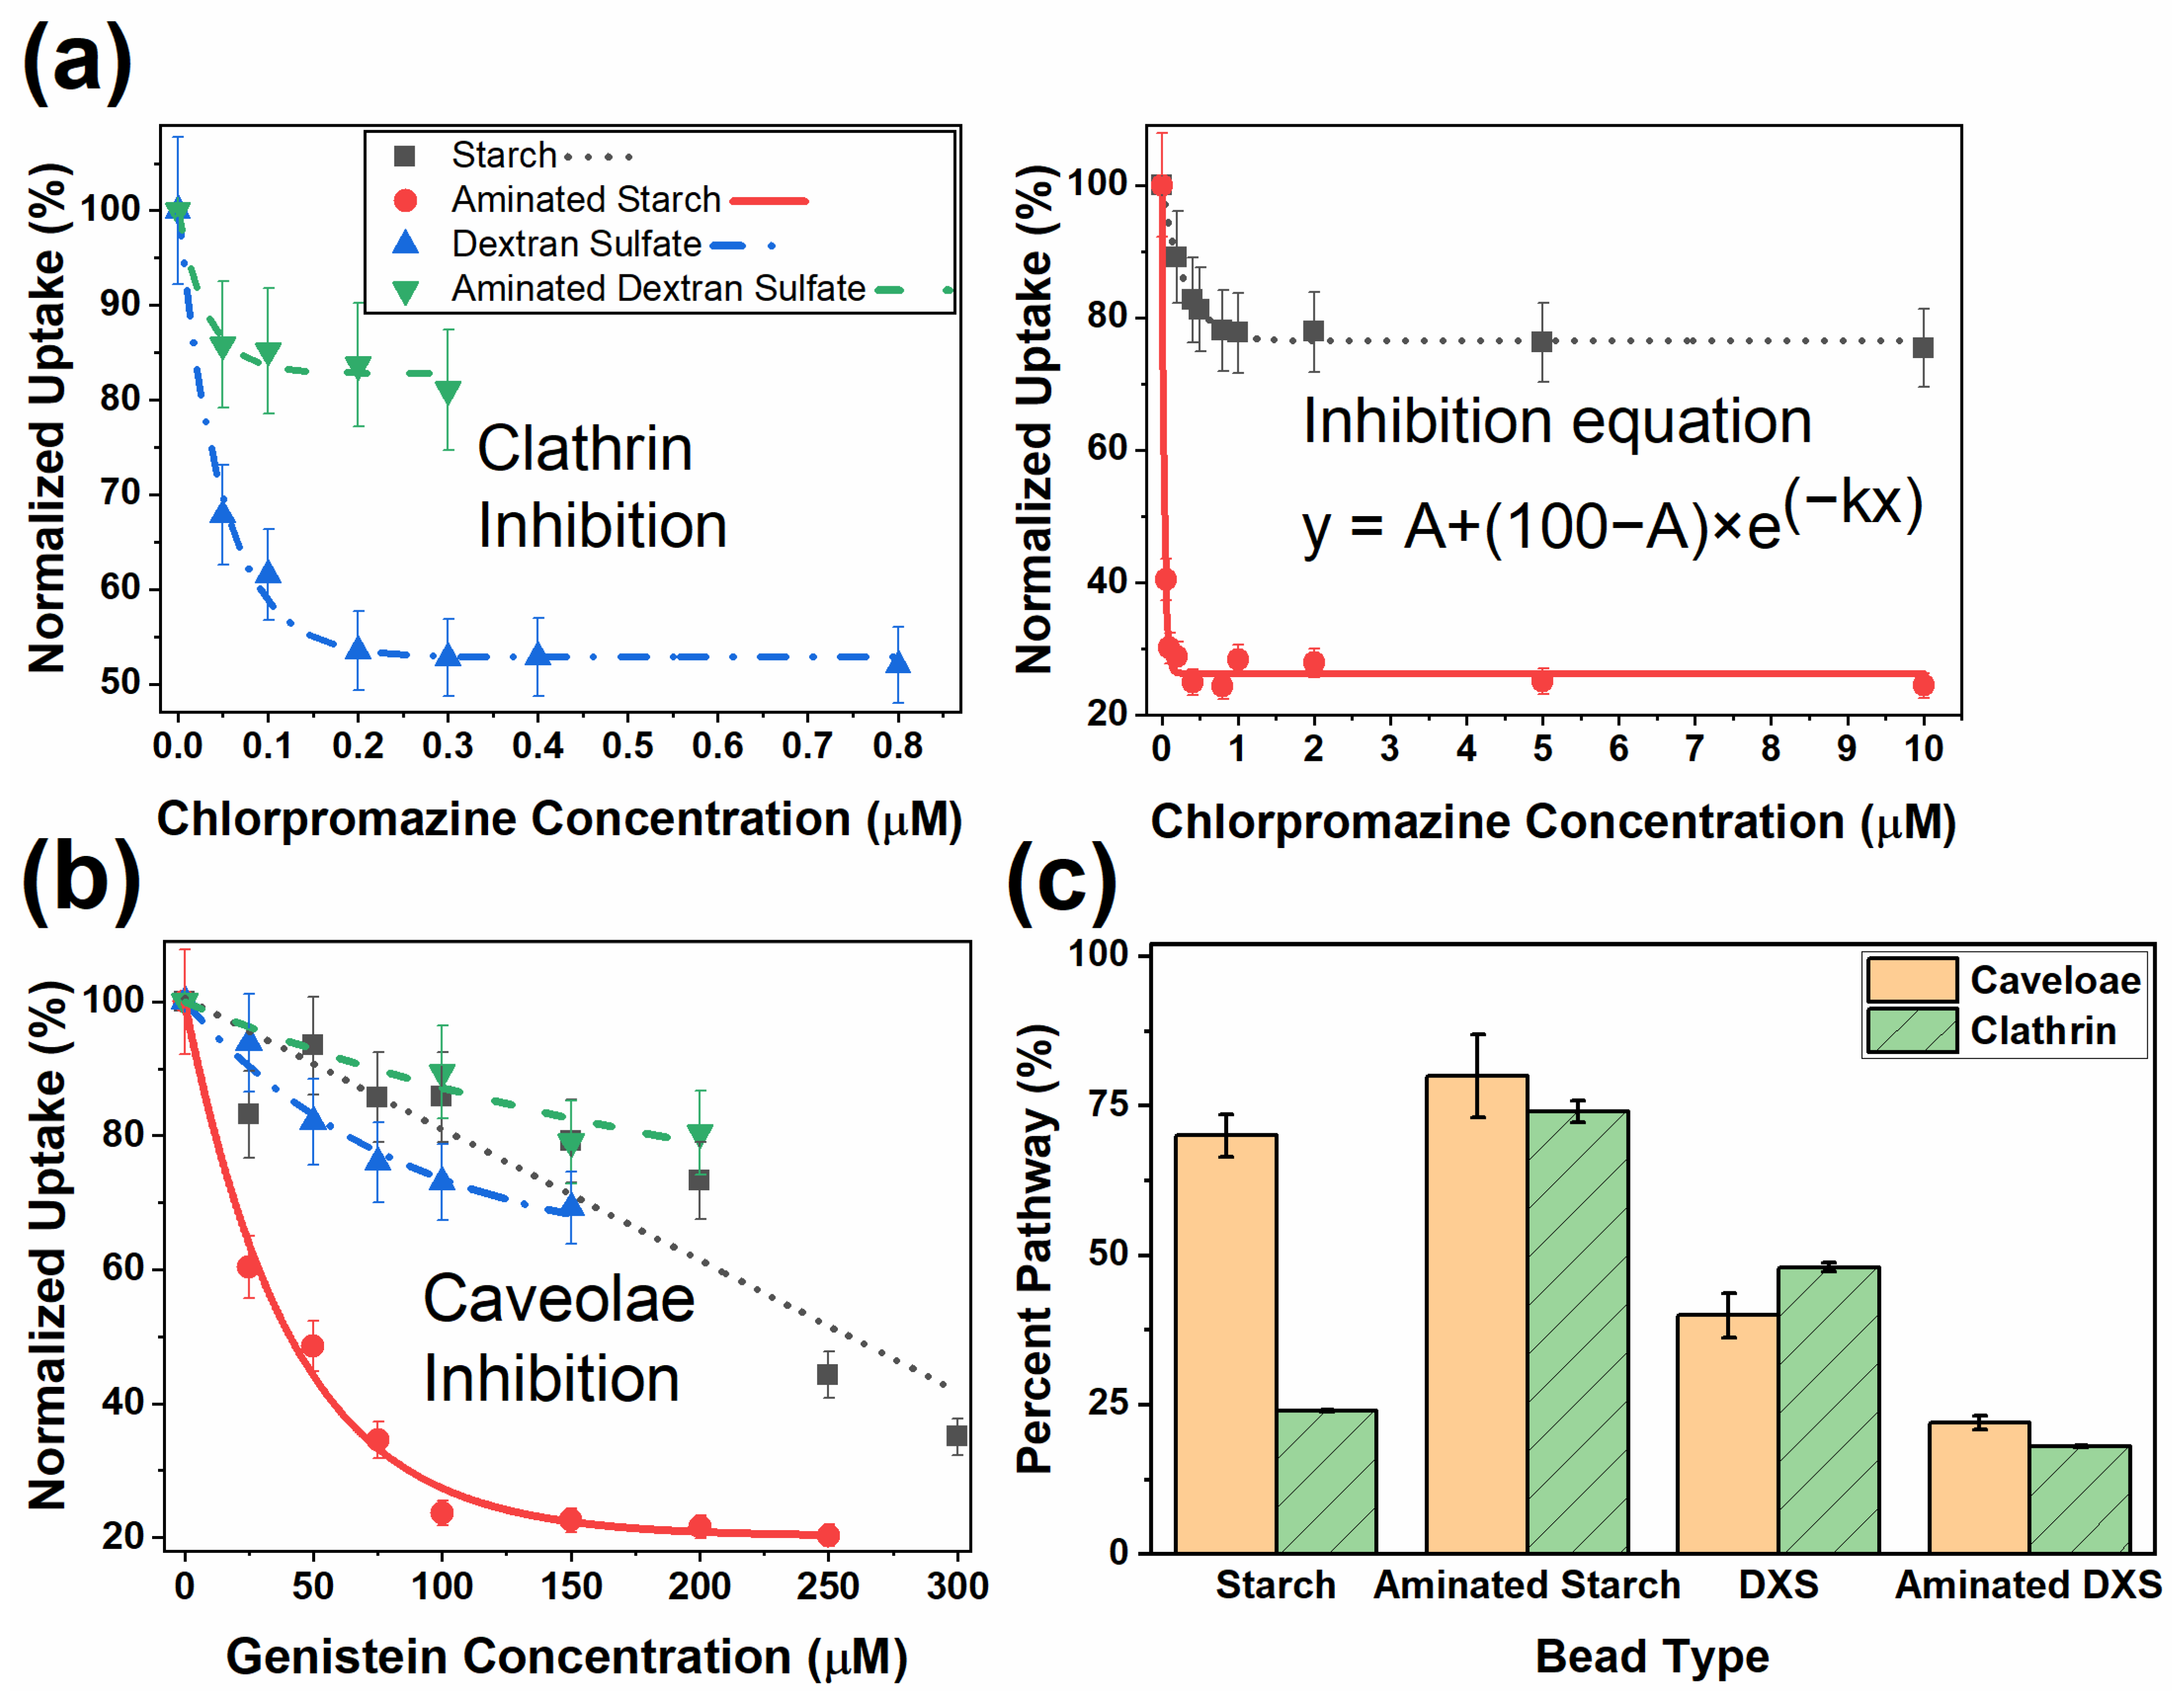
We quantified the ingestion step in terms of the pathways of transmembrane transport (Figure 1b) for NPs with four different surface compositions. While the size of the nanomaterial is considered an important determinant of the transport mechanism [30,31], we held size approximately constant and studied only the effects of the bead surface chemistries. We inhibited transport via caveolae using Genistein (also long known as a tyrosine kinase inhibitor [53]) and transport via clathrin-coated pits using Chlorpromazine [36] and assumed that these inhibitors do not act on the adsorption step. Ingestion not inhibited by either of these is considered clathrin and caveolae independent [17], and caveolar transport may at least sometimes avoid lysosomal degradation (Figure 1b) [17,18,21,22,26]. A dose-ranging study was first performed guided by the known inhibitory ranges of both drugs [36,54,55], and then detailed dose–response curves were determined. Figure 5a,b are the resulting toxicity curves—percent uptake (y) versus inhibitor concentration (x). The zero slopes at high doses indicate the portion A of transport that is not inhibited and therefore due to mechanisms other than the inhibited one.
Referring to the zeta potentials in Table 1, there was no systematic dependence of the ingestion pathways on the ZP of the beads in the culture medium, unlike the adsorption step. Despite the albumin coating of the particles, the caveolar pathway appeared to distinguish between the starch and DXS coatings (uncharged and charged polysaccharides), for example, and thus starch would be the coating of choice to force vectors to follow the caveolar pathway “which may be superior for medical applications [18]”. Some 75% of aminated DXS beads are ingested by clathrin- and caveolae-independent pathways (Figure 5c), such as lipid rafts and micropinocytosis [56]. Aminated starch beads are readily ingested by both mechanisms, with the uninhibited portions summing to over 100% (Figure 5c), indicating considerable specificity overlap. In other words, when one pathway is closed, aminated beads may enter at least as well through another.
4. Conclusions
By exploiting the power of magnetophoretic analysis, this work provides the underlying rationale for the otherwise empirical selection of nanomaterial coatings in medical applications and may be a source of predictive rules for future studies. Quantifying beads per cell has allowed for the quantitative application of classical adsorption theory, colloid stability (DLVO) theory, and precise inhibition kinetics, which has deepened our understanding of nanomaterial adsorption and ingestion mechanisms. This study indicates that an important key to the successful intracellular delivery of particles is the penetration of the Stern layer (fixed double layer) of the cell surface (Figure 1a), given that cells have a negative zeta potential and the Debye length is of the order of one nanometer. For receptor-dependent-specific drug delivery, nanoparticles should have a slightly negative ZP to interact with the negatively charged cell surface in a manner that is appropriate for receptor ligand binding. Starch beads showed both high adsorption (Figure 2c and Figure 3a) and likely high intracellular survival based on processing via caveolae (Figure 1c and Figure 5), making them suitable for the delivery of cargo, including mRNA [4], in situ RNA probes [5], and antioxidant activity [57], to cytoplasmic sites including mitochondria [58] and the NF-κB pathway [59]. For long life in the blood in the case of passive targeting, PEGylation causes beads to resist protein adsorption and thereby prevents unwanted uptake by cells on the way to the target site. Thus, this work is relevant to receptor-dependent endocytosis [60], which typically follows the clathrin-dependent route. Simulations and experiments have indicated that NPs with a high PEG grafting density with targeting moieties attached to the PEG provide effective targeted intracellular delivery [14] while avoiding receptor-independent uptake. By revealing the magnitude of the hydration repulsion potential, this study indicates why this should be so. PEG-coated beads with receptor ligands should improve the specificity of receptor-dependent endocytosis [61]. Additionally, NPs coated with PEG are considered “stealth” NPs in vivo due to their ability to escape uptake by the reticuloendothelial system [62,63]. Thus, in the data of Figure 3a and in the analyses of Figure 4, we observed two categories of particles, “stealth” beads (heavily PEGylated) and “protein corona” beads (starch and aminated starch) with the latter being modulated by zeta potential as in the case of DXS-coated beads. The wide variety of coatings (and sizes) of beads selected by various users [8,17] can be subjected to similar analyses to aid in the prediction of particle fate in medical and toxicological applications.
Author Contributions
Conceptualization, P.W.T. and T.R.H.; methodology, A.S., C.Z., P.W.T., Y.S.C. and A.E.D.; investigation, A.S., C.Z. and P.W.T.; visualization, A.S. and C.Z.; funding acquisition and project administration, T.R.H.; supervision, T.R.H., P.W.T. and A.E.D.; writing—original draft, A.S. and C.Z.; writing—review and editing, P.W.T., T.R.H., A.E.D., A.S. and Y.S.C. All authors have read and agreed to the published version of the manuscript.
Funding
This research was supported by Auburn University.
Institutional Review Board Statement
Not applicable.
Informed Consent Statement
Not applicable.
Data Availability Statement
The authors declare that all the relevant data supporting the findings of this study are available within the paper.
Acknowledgments
The generous sharing of facilities, materials, data, and skills by Tareq Anani and Camille Hanot is gratefully acknowledged.
Conflicts of Interest
The authors declare no conflict of interest. In terms of disclosure, Paul W. Todd and Thomas R. Hanley are partners in Magnaquant, whose technical and financial objectives are not in conflict with the project described in this article.
References
- Chung, E.J.; Leon, L.; Rinaldi, C. Nanoparticles for Biomedical Applications: Fundamental Concepts, Biological Interactions and Clinical Applications; Elsevier: Amsterdam, Netherlands, 2019; ISBN 0128166630. Available online: https://www.elsevier.com/books/nanoparticles-for-biomedical-applications/chung/978-0-12-816662-8 (accessed on 1 March 2020).
- Donovan, R. (Ed.) Applications of Nanotechnology in Drug Delivery; Scitus Academics LLC: Wilmington, Delaware, 2016; ISBN 9781681172385. Available online: https://books.google.com/books/about/Application_of_Nanotechnology_in_Drug_De.html?id=jzPjjwEACAAJ (accessed on 15 April 2019).
- Steinmetz, N.F.; Manchester, M. Viral Nanoparticles: Tools for Material Science and Biomedicine; Pan Stanford Publishing: Singapore, 2011; ISBN 9814267457. [Google Scholar] [CrossRef]
- Guerrini, G.; Magrì, D.; Gioria, S.; Medaglini, D.; Calzolai, L. Characterization of Nanoparticles-Based Vaccines for COVID-19. Nat. Nanotechnol. 2022, 17, 570–576. [Google Scholar] [CrossRef] [PubMed]
- Liu, X.; Wang, Y.; Effah, C.Y.; Wu, L.; Yu, F.; Wei, J.; Mao, G.; Xiong, Y.; He, L. Endocytosis and Intracellular RNAs Imaging of Nanomaterials-Based Fluorescence Probes. Talanta 2022, 243, 123377. [Google Scholar] [CrossRef] [PubMed]
- Webster, T.J. (Ed.) Safety of Nanoparticles: From Manufacturing to Medical Applications, 1st ed.; Springer: New York, NY, USA, 2008; ISBN 978-0-387-78608-7. [Google Scholar] [CrossRef]
- Hanot, C.C.; Choi, Y.S.; Anani, T.B.; Soundarrajan, D.; David, A.E. Effects of Iron-Oxide Nanoparticle Surface Chemistry on Uptake Kinetics and Cytotoxicity in CHO-K1 Cells. Int. J. Mol. Sci. 2015, 17, 54. [Google Scholar] [CrossRef] [PubMed] [Green Version]
- Leary, J.F. Fundamentals of Nanomedicine; Cambridge University Press: Cambridge, UK, 2022; ISBN 1009258311. Available online: https://www.cambridge.org/us/academic/subjects/engineering/biomedical-engineering/fundamentals-nanomedicine (accessed on 1 September 2022).
- Cole, A.J.; David, A.E.; Wang, J.; Galbán, C.J.; Hill, H.L.; Yang, V.C. Polyethylene Glycol Modified, Cross-Linked Starch-Coated Iron Oxide Nanoparticles for Enhanced Magnetic Tumor Targeting. Biomaterials 2011, 32, 2183–2193. [Google Scholar] [CrossRef] [PubMed] [Green Version]
- Gazeau, F.; Lévy, M.; Wilhelm, C. Optimizing Magnetic Nanoparticle Design for Nanothermotherapy. Nanomedicine 2008, 3, 831–844. [Google Scholar] [CrossRef] [PubMed]
- Maurizi, L.; Papa, A.-L.; Dumont, L.; Bouyer, F.; Walker, P.; Vandroux, D.; Millot, N. Influence of Surface Charge and Polymer Coating on Internalization and Biodistribution of Polyethylene Glycol-Modified Iron Oxide Nanoparticles. J. Biomed. Nanotechnol. 2015, 11, 126–136. [Google Scholar] [CrossRef] [PubMed]
- Zhao, J.; Stenzel, M.H. Entry of Nanoparticles into Cells: The Importance of Nanoparticle Properties. Polym. Chem. 2018, 9, 259–272. [Google Scholar] [CrossRef]
- David, A.E.; Cole, A.J.; Chertok, B.; Park, Y.S.; Yang, V.C. A Combined Theoretical and in Vitro Modeling Approach for Predicting the Magnetic Capture and Retention of Magnetic Nanoparticles In Vivo. J. Control. Release 2011, 152, 67–75. [Google Scholar] [CrossRef]
- Li, Y.; Kröger, M.; Liu, W.K. Endocytosis of PEGylated Nanoparticles Accompanied by Structural and Free Energy Changes of the Grafted Polyethylene Glycol. Biomaterials 2014, 35, 8467–8478. [Google Scholar] [CrossRef] [Green Version]
- Ohshima, H.; Makino, K. Colloid and Interface Science in Pharmaceutical Research and Development; Elsevier: Amsterdam, The Netherlands, 2014; ISBN 0444626085. [Google Scholar] [CrossRef]
- Raghavan, S.R.; Hou, J.; Baker, G.L.; Khan, S.A. Colloidal Interactions between Particles with Tethered Nonpolar Chains Dispersed in Polar Media: Direct Correlation between Dynamic Rheology and Interaction Parameters. Langmuir 2000, 16, 1066–1077. [Google Scholar] [CrossRef]
- de Almeida, M.S.; Susnik, E.; Drasler, B.; Taladriz-Blanco, P.; Petri-Fink, A.; Rothen-Rutishauser, B. Understanding Nanoparticle Endocytosis to Improve Targeting Strategies in Nanomedicine. Chem. Soc. Rev. 2021, 50, 5397–5434. [Google Scholar] [CrossRef] [PubMed]
- Hsiao, I.-L.; Gramatke, A.M.; Joksimovic, R.; Sokolowski, M.; Gradzielski, M.; Haase, A. Size and Cell Type Dependent Uptake of Silica Nanoparticles. J. Nanomed. Nanotechnol. 2014, 5, 1. [Google Scholar] [CrossRef]
- Zhou, C.; Choi, Y.S.; David, A.E.; Todd, P.W.; Hanley, T.R. Nanomaterial Endocytosis: Estimation of Particles per Cell by Magnetic Measurement. IEEE Magn. Lett. 2018, 9, 7–11. [Google Scholar] [CrossRef]
- Pisciotti, M.L.M.; Lima, E., Jr.; Mansilla, M.V.; Tognoli, V.E.; Troiani, H.E.; Pasa, A.A.; Creczynski-Pasa, T.B.; Silva, A.H.; Gurman, P.; Colombo, L.; et al. In Vitro and in Vivo Experiments with Iron Oxide Nanoparticles Functionalized with DEXTRAN or Polyethylene Glycol for Medical Applications: Magnetic Targeting. J. Biomed. Mater. Res. Part B Appl. Biomater. 2014, 102, 860–868. [Google Scholar] [CrossRef] [PubMed]
- Kiss, A.L.; Botos, E. Endocytosis via Caveolae: Alternative Pathway with Distinct Cellular Compartments to Avoid Lysosomal Degradation? J. Cell. Mol. Med. 2009, 13, 1228–1237. [Google Scholar] [CrossRef] [Green Version]
- Oh, N.; Park, J.-H. Endocytosis and Exocytosis of Nanoparticles in Mammalian Cells. Int. J. Nanomed. 2014, 9, 51. [Google Scholar] [CrossRef] [Green Version]
- Jing, Y.; Mal, N.; Williams, P.S.; Mayorga, M.; Penn, M.S.; Chalmers, J.J.; Zborowski, M. Quantitative Intracellular Magnetic Nanoparticle Uptake Measured by Live Cell Magnetophoresis. FASEB J. 2008, 22, 4239–4247. [Google Scholar] [CrossRef]
- Robert, D.; Pamme, N.; Conjeaud, H.; Gazeau, F.; Iles, A.; Wilhelm, C. Cell Sorting by Endocytotic Capacity in a Microfluidic Magnetophoresis Device. Lab Chip 2011, 11, 1902–1910. [Google Scholar] [CrossRef]
- Chithrani, B.D.; Ghazani, A.A.; Chan, W.C.W. Determining the Size and Shape Dependence of Gold Nanoparticle Uptake into Mammalian Cells. Nano. Lett. 2006, 6, 662–668. [Google Scholar] [CrossRef]
- Orellana-Tavra, C.; Haddad, S.; Marshall, R.J.; Lázaro, I.A.; Boix, G.; Imaz, I.; Maspoch, D.; Forgan, R.S.; Fairen-Jimenez, D. Tuning the Endocytosis Mechanism of Zr-Based Metal–Organic Frameworks through Linker Functionalization. ACS Appl. Mater. Interfaces 2017, 9, 35516–35525. [Google Scholar] [CrossRef]
- Wilhelm, C.; Billotey, C.; Roger, J.; Pons, J.N.; Bacri, J.-C.; Gazeau, F. Intracellular Uptake of Anionic Superparamagnetic Nanoparticles as a Function of Their Surface Coating. Biomaterials 2003, 24, 1001–1011. [Google Scholar] [CrossRef] [PubMed]
- Wilhelm, C.; Gazeau, F.; Roger, J.; Pons, J.N.; Bacri, J.-C. Interaction of Anionic Superparamagnetic Nanoparticles with Cells: Kinetic Analyses of Membrane Adsorption and Subsequent Internalization. Langmuir 2002, 18, 8148–8155. [Google Scholar] [CrossRef]
- Liang, L.; Everest-Dass, A.V.; Kostyuk, A.B.; Khabir, Z.; Zhang, R.; Trushina, D.B.; Zvyagin, A.V. The Surface Charge of Polymer-Coated Upconversion Nanoparticles Determines Protein Corona Properties and Cell Recognition in Serum Solutions. Cells 2022, 11, 3644. [Google Scholar] [CrossRef] [PubMed]
- Ho, Y.T.; Kamm, R.D.; Kah, J.C.Y. Influence of Protein Corona and Caveolae-Mediated Endocytosis on Nanoparticle Uptake and Transcytosis. Nanoscale 2018, 10, 12386–12397. [Google Scholar] [CrossRef] [PubMed]
- Cheng, X.; Tian, X.; Wu, A.; Li, J.; Tian, J.; Chong, Y.; Chai, Z.; Zhao, Y.; Chen, C.; Ge, C. Protein Corona Influences Cellular Uptake of Gold Nanoparticles by Phagocytic and Nonphagocytic Cells in a Size-Dependent Manner. ACS Appl. Mater. Interfaces 2015, 7, 20568–20575. [Google Scholar] [CrossRef] [PubMed]
- Hayashi, T.; Tanaka, Y.; Koide, Y.; Tanaka, M.; Hara, M. Mechanism Underlying Bioinertness of Self-Assembled Monolayers of Oligo (Ethyleneglycol)-Terminated Alkanethiols on Gold: Protein Adsorption, Platelet Adhesion, and Surface Forces. Phys. Chem. Chem. Phys. 2012, 14, 10196–10206. [Google Scholar] [CrossRef]
- Walkey, C.D.; Olsen, J.B.; Guo, H.; Emili, A.; Chan, W.C.W. Nanoparticle Size and Surface Chemistry Determine Serum Protein Adsorption and Macrophage Uptake. J. Am. Chem. Soc. 2012, 134, 2139–2147. [Google Scholar] [CrossRef]
- Wang, S.-H.; Lee, C.-W.; Chiou, A.; Wei, P.-K. Size-Dependent Endocytosis of Gold Nanoparticles Studied by Three-Dimensional Mapping of Plasmonic Scattering Images. J. Nanobiotechnology 2010, 8, 33. [Google Scholar] [CrossRef] [Green Version]
- Guo, D.; Xie, G.; Luo, J. Mechanical Properties of Nanoparticles: Basics and Applications. J. Phys. D. Appl. Phys. 2013, 47, 13001. [Google Scholar] [CrossRef] [Green Version]
- Vercauteren, D.; Vandenbroucke, R.E.; Jones, A.T.; Rejman, J.; Demeester, J.; Smedt, S.C.D.; Sanders, N.N.; Braeckmans, K. The Use of Inhibitors to Study Endocytic Pathways of Gene Carriers: Optimization and Pitfalls. Mol. Ther. 2010, 18, 561–569. [Google Scholar] [CrossRef] [Green Version]
- Anani, T. Matrix Metalloproteinase-Responsive Superparamagnetic Iron Oxide Nanoparticles (SPIONs) to Distinguish between Aggressive and Indolent Cancer. Master’s Thesis, Auburn University, Auburn, AL, USA, 2018. Available online: http://hdl.handle.net/10415/6167 (accessed on 1 January 2019).
- Riemer, J.; Hoepken, H.H.; Czerwinska, H.; Robinson, S.R.; Dringen, R. Colorimetric Ferrozine-Based Assay for the Quantitation of Iron in Cultured Cells. Anal. Biochem. 2004, 331, 370–375. [Google Scholar] [CrossRef] [PubMed]
- Semisch, A.; Ohle, J.; Witt, B.; Hartwig, A. Cytotoxicity and Genotoxicity of Nano-and Microparticulate Copper Oxide: Role of Solubility and Intracellular Bioavailability. Part. Fibre Toxicol. 2014, 11, 10. [Google Scholar] [CrossRef] [PubMed] [Green Version]
- Fuerstenau, D.W. Zeta Potentials in the Flotation of Oxide and Silicate Minerals. Adv. Colloid Interface Sci. 2005, 114, 9–26. [Google Scholar] [CrossRef] [PubMed]
- Fike, R.M.; Van Oss, C.J. Zeta-Potentials of Intact Cell Monolayers Determined by Electro-Osmosis. In Vitro 1976, 12, 428–435. [Google Scholar] [CrossRef]
- Bruinsma, R.; Behrisch, A.; Sackmann, E. Adhesive Switching of Membranes: Experiment and Theory. Phys. Rev. E 2000, 61, 4253. [Google Scholar] [CrossRef]
- Roth, C.M.; Neal, B.L.; Lenhoff, A.M. Van Der Waals Interactions Involving Proteins. Biophys. J. 1996, 70, 977–987. [Google Scholar] [CrossRef] [Green Version]
- Shutava, T.G.; Livanovich, K.S. Colloidal Stability of Silver Nanoparticles with Layer-by-Layer Shell of Chitosan Copolymers. J. Nanoparticle Res. 2020, 22, 154. [Google Scholar] [CrossRef]
- Dong, X.; Al-Jumaily, A.; Escobar, I.C. Investigation of the Use of a Bio-Derived Solvent for Non-Solvent-Induced Phase Separation (NIPS) Fabrication of Polysulfone Membranes. Membranes 2018, 8, 23. [Google Scholar] [CrossRef] [Green Version]
- Calatayud, M.P.; Sanz, B.; Raffa, V.; Riggio, C.; Ibarra, M.R.; Goya, G.F. The Effect of Surface Charge of Functionalized Fe3O4 Nanoparticles on Protein Adsorption and Cell Uptake. Biomaterials 2014, 35, 6389–6399. [Google Scholar] [CrossRef] [Green Version]
- Ehi-Eromosele, C.O. The Effect of Polyethylene Glycol (PEG) Coating on the Magneto-Structural Properties and Colloidal Stability of Co0.8Mg0.2Fe2O4 Nanoparticles for Potential Biomedical Applications. Dig. J. Nanomater. Biostructures 2016, 11, 7–14. Available online: http://eprints.covenantuniversity.edu.ng/id/eprint/5968 (accessed on 1 March 2019).
- Hirohara, M.; Maekawa, T.; Mondarte, E.A.Q.; Nyu, T.; Mizushita, Y.; Hayashi, T. Proteomic Analysis of Biomaterial Surfaces after Contacting with Body Fluids by MALDI-ToF Mass Spectroscopy. Coatings 2020, 10, 12. [Google Scholar] [CrossRef] [Green Version]
- Molday, R.S.; Yen, S.P.S.; Rembaum, A. Application of Magnetic Microspheres in Labelling and Separation of Cells. Nature 1977, 268, 437. [Google Scholar] [CrossRef] [PubMed]
- Bertorelle, F.; Wilhelm, C.; Roger, J.; Gazeau, F.; Ménager, C.; Cabuil, V. Fluorescence-Modified Superparamagnetic Nanoparticles: Intracellular Uptake and Use in Cellular Imaging. Langmuir 2006, 22, 5385–5391. [Google Scholar] [CrossRef] [PubMed]
- Streibel, M.J. Electrophoretic and Microelectrode Studies of the Electrical Surface of Cultured Mammalian Cells; Penn State University: State College, PA, USA, 1972. [Google Scholar]
- Bhattacharjee, S.; Chen, J.Y.; Elimelech, M. DLVO Interaction Energy between Spheroidal Particles and a Flat Surface. Colloids Surfaces A Physicochem. Eng. Asp. 2000, 165, 143–156. [Google Scholar] [CrossRef]
- Yang, E.-B.; Wang, D.-F.; Mack, P.; Cheng, L.-Y. Genistein, a Tyrosine Kinase Inhibitor, Reduces EGF-Induced EGF Receptor Internalization and Degradation in Human Hepatoma HepG2 Cells. Biochem. Biophys. Res. Commun. 1996, 224, 309–317. [Google Scholar] [CrossRef]
- De Wilde, A.H.; Jochmans, D.; Posthuma, C.C.; Zevenhoven-Dobbe, J.C.; Van Nieuwkoop, S.; Bestebroer, T.M.; Van Den Hoogen, B.G.; Neyts, J.; Snijder, E.J. Screening of an FDA-Approved Compound Library Identifies Four Small-Molecule Inhibitors of Middle East Respiratory Syndrome Coronavirus Replication in Cell Culture. Antimicrob. Agents Chemother. 2014, 58, 4875–4884. [Google Scholar] [CrossRef] [Green Version]
- Otręba, M.; Kośmider, L.; Rzepecka-Stojko, A. Antiviral Activity of Chlorpromazine, Fluphenazine, Perphenazine, Prochlorperazine, and Thioridazine towards RNA-Viruses. A Review. Eur. J. Pharmacol. 2020, 173553. [Google Scholar] [CrossRef]
- Zhang, L.W.; Monteiro-Riviere, N.A. Mechanisms of Quantum Dot Nanoparticle Cellular Uptake. Toxicol. Sci. 2009, 110, 138–155. [Google Scholar] [CrossRef]
- Khalil, I.; Yehye, W.A.; Etxeberria, A.E.; Alhadi, A.A.; Dezfooli, S.M.; Julkapli, N.B.M.; Basirun, W.J.; Seyfoddin, A. Nanoantioxidants: Recent Trends in Antioxidant Delivery Applications. Antioxidants 2019, 9, 24. [Google Scholar] [CrossRef] [Green Version]
- Pathak, R.K.; Kolishetti, N.; Dhar, S. Targeted Nanoparticles in Mitochondrial Medicine. WIREs Nanomed. Nanobiotechnology 2015, 7, 315–329. [Google Scholar] [CrossRef] [Green Version]
- Müller, E.K.; Białas, N.; Epple, M.; Hilger, I. Nanoparticles Carrying NF-ΚB P65-Specific SiRNA Alleviate Colitis in Mice by Attenuating NF-ΚB-Related Protein Expression and Pro-Inflammatory Cellular Mediator Secretion. Pharmaceutics 2022, 14, 419. [Google Scholar] [CrossRef] [PubMed]
- Decuzzi, P.; Ferrari, M. The Role of Specific and Non-Specific Interactions in Receptor-Mediated Endocytosis of Nanoparticles. Biomaterials 2007, 28, 2915–2922. [Google Scholar] [CrossRef] [PubMed]
- Liu, Y.; Shipton, M.K.; Ryan, J.; Kaufman, E.D.; Franzen, S.; Feldheim, D.L. Synthesis, Stability, and Cellular Internalization of Gold Nanoparticles Containing Mixed Peptide− Poly (Ethylene Glycol) Monolayers. Anal. Chem. 2007, 79, 2221–2229. [Google Scholar] [CrossRef] [PubMed]
- Guerrini, L.; Alvarez-Puebla, R.A.; Pazos-Perez, N. Surface Modifications of Nanoparticles for Stability in Biological Fluids. Materials 2018, 11, 1154. [Google Scholar] [CrossRef] [PubMed] [Green Version]
- Harris, J.M.; Chess, R.B. Effect of Pegylation on Pharmaceuticals. Nat. Rev. Drug Discov. 2003, 2, 214–221. [Google Scholar] [CrossRef]
Figure 1.
Steps of endocytosis and coatings of nanoparticles. (a) The adsorptions step depends on the interactions of the ionic double layers and adhesive molecules on the particle and cell surfaces. The depth of the (repulsive) diffuse double layer is reduced by increased ionic strength, allowing adhesive molecules to interact by Van Der Waals attraction. The zeta potential (ZP) is the coulombic potential at the surface of hydrodynamic shear and is used to estimate the surface potential Ψ. (b) Diagram of the ingestion pathways quantified in this study. (c) Nanoparticles with starch coating and dextran sulfate (DXS) coatings modified to yield aminated starch and aminated DXS beads [9]. Aminated starch-coated beads were further coated with PEG of 2, 5, or 20 kDa molecular weight and analyzed for nmole of PEG per mg Fe [7] as specified in Table 1.
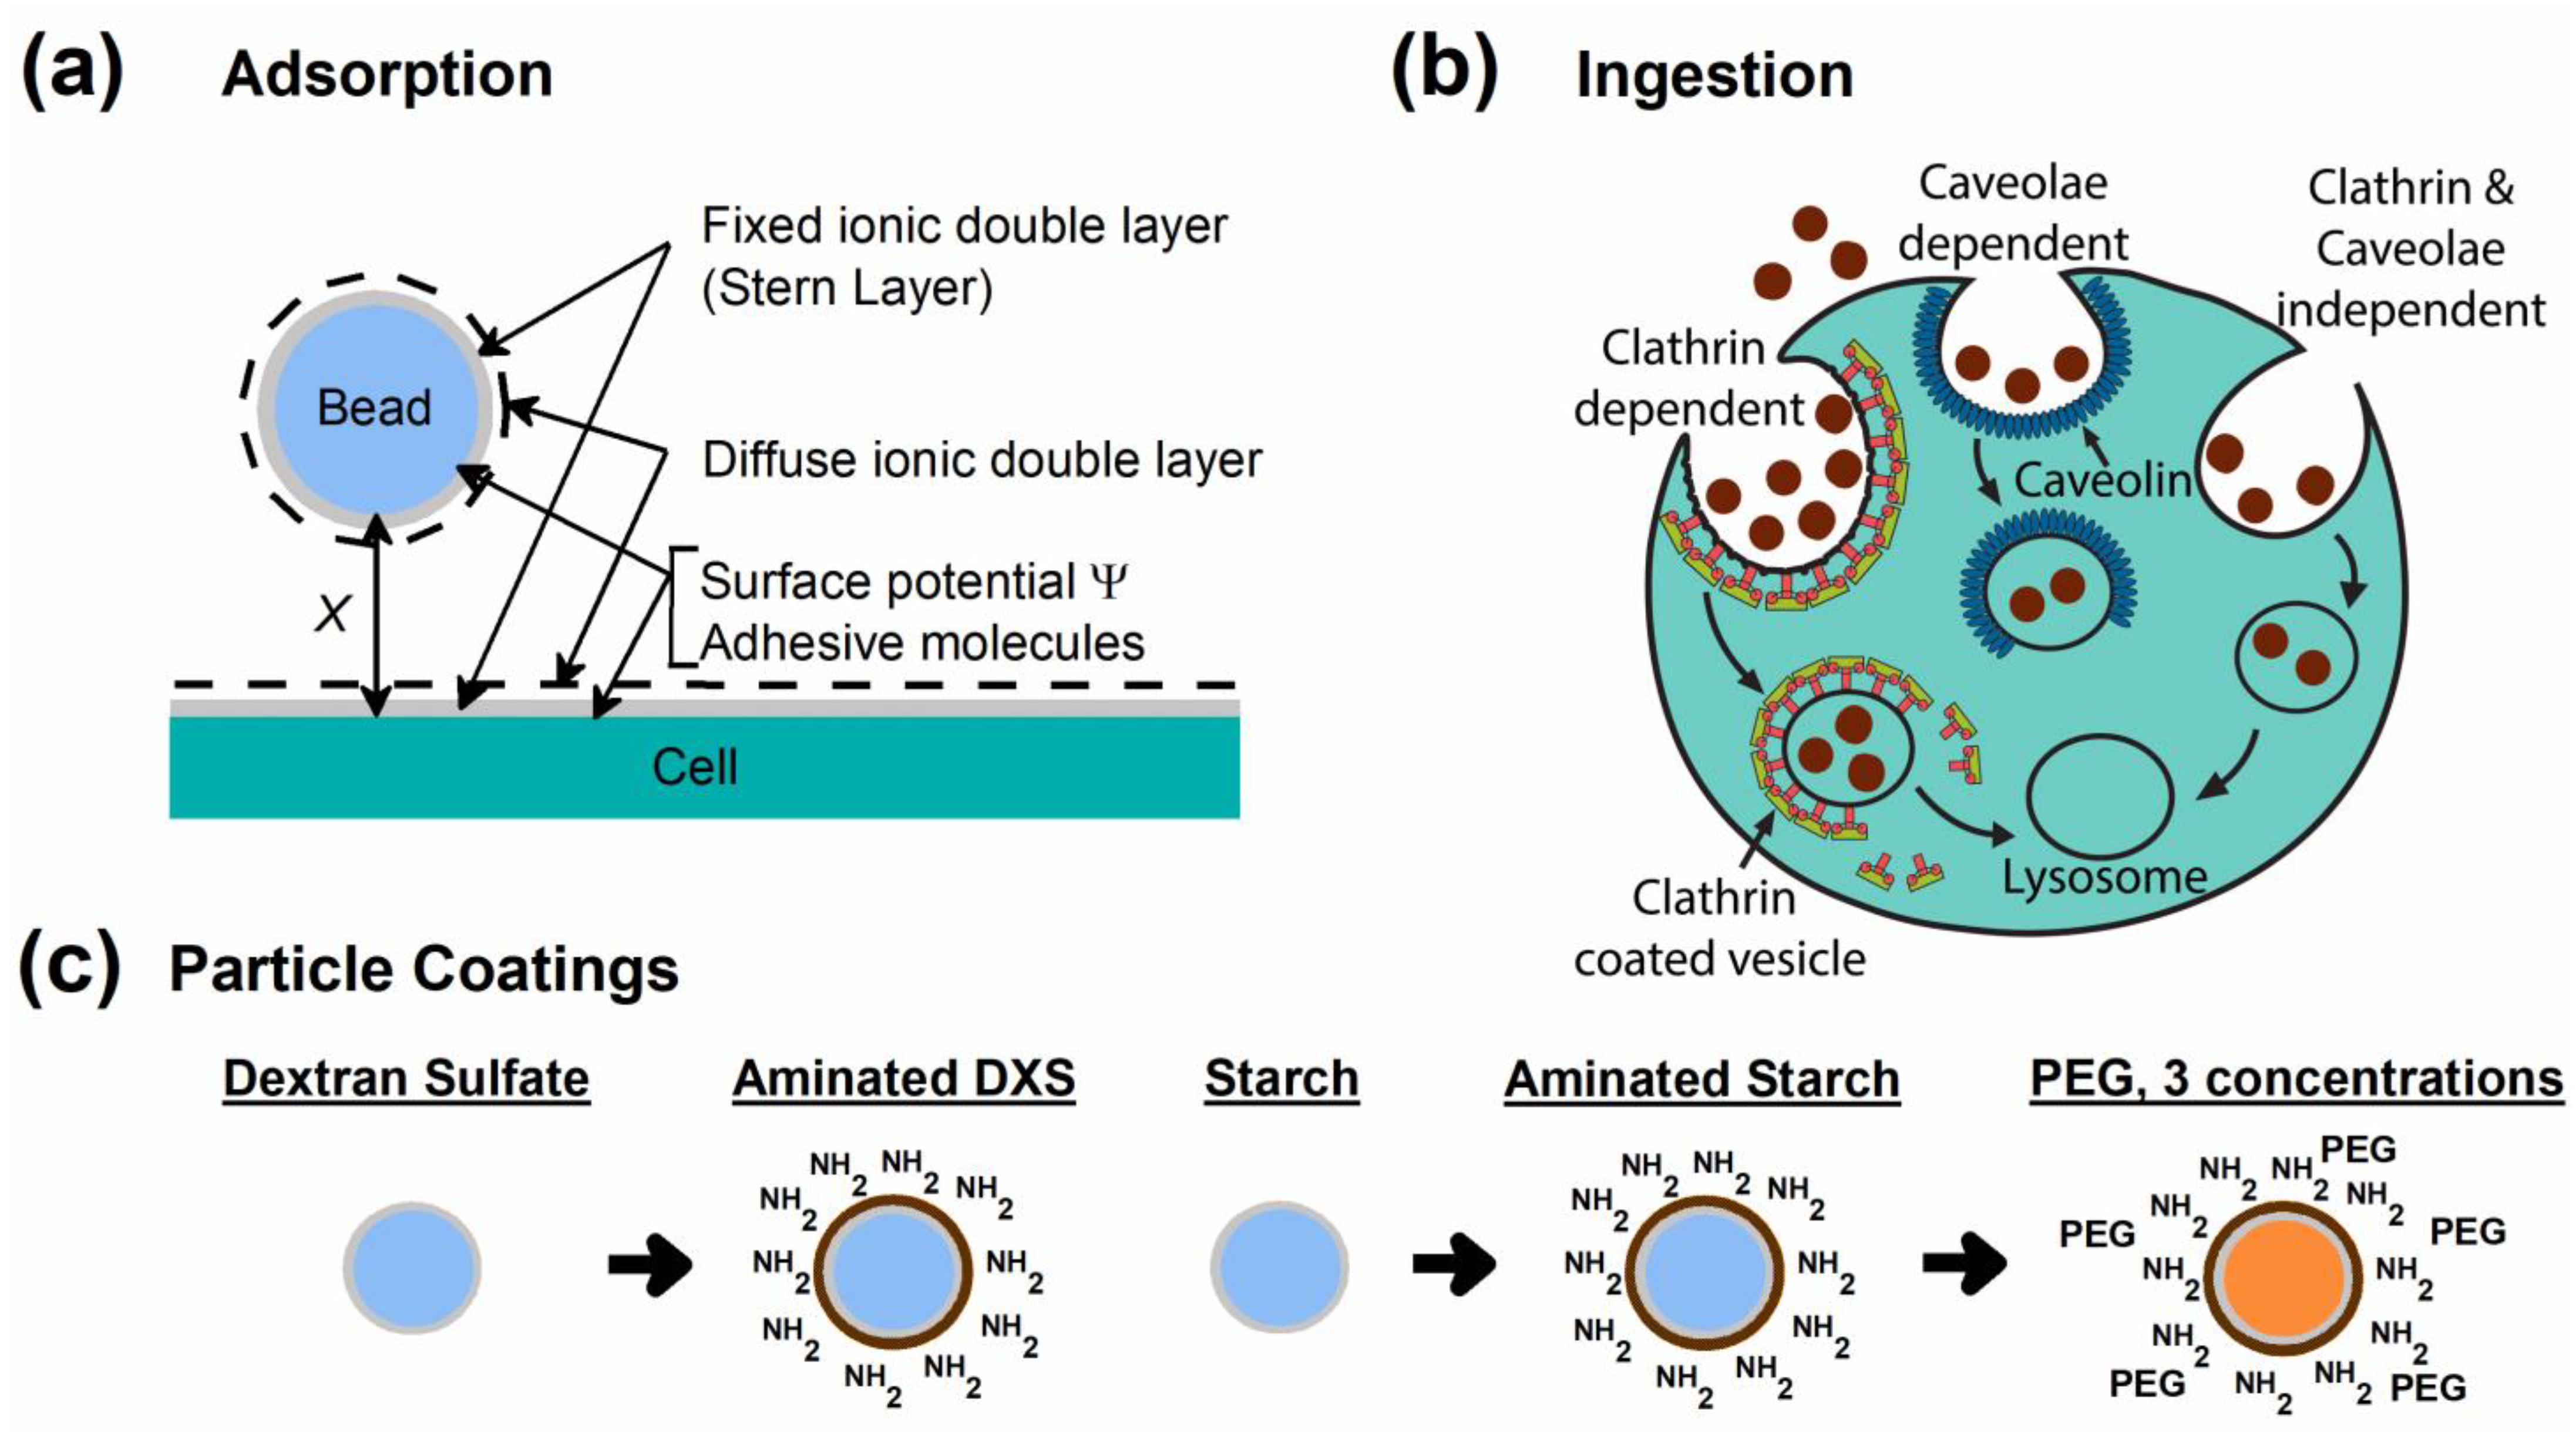
Figure 2.
Magnetophoretic mobility and bead uptake. (a) Example of mobility histograms versus time of exposure of CHO-K1 cells in monolayer culture to 124 nm starch-coated MNPs at 37 °C in CM. (b) Calibration graph based on mobility versus beads per cell [9,19,38]. Each one pRm mobility increase corresponds to 0.117 × 10⁵ beads per cell. (c) Beads per cell versus time of incubation with 100 μg Fe/mL of the beads described in Figure 1c and Table 1.
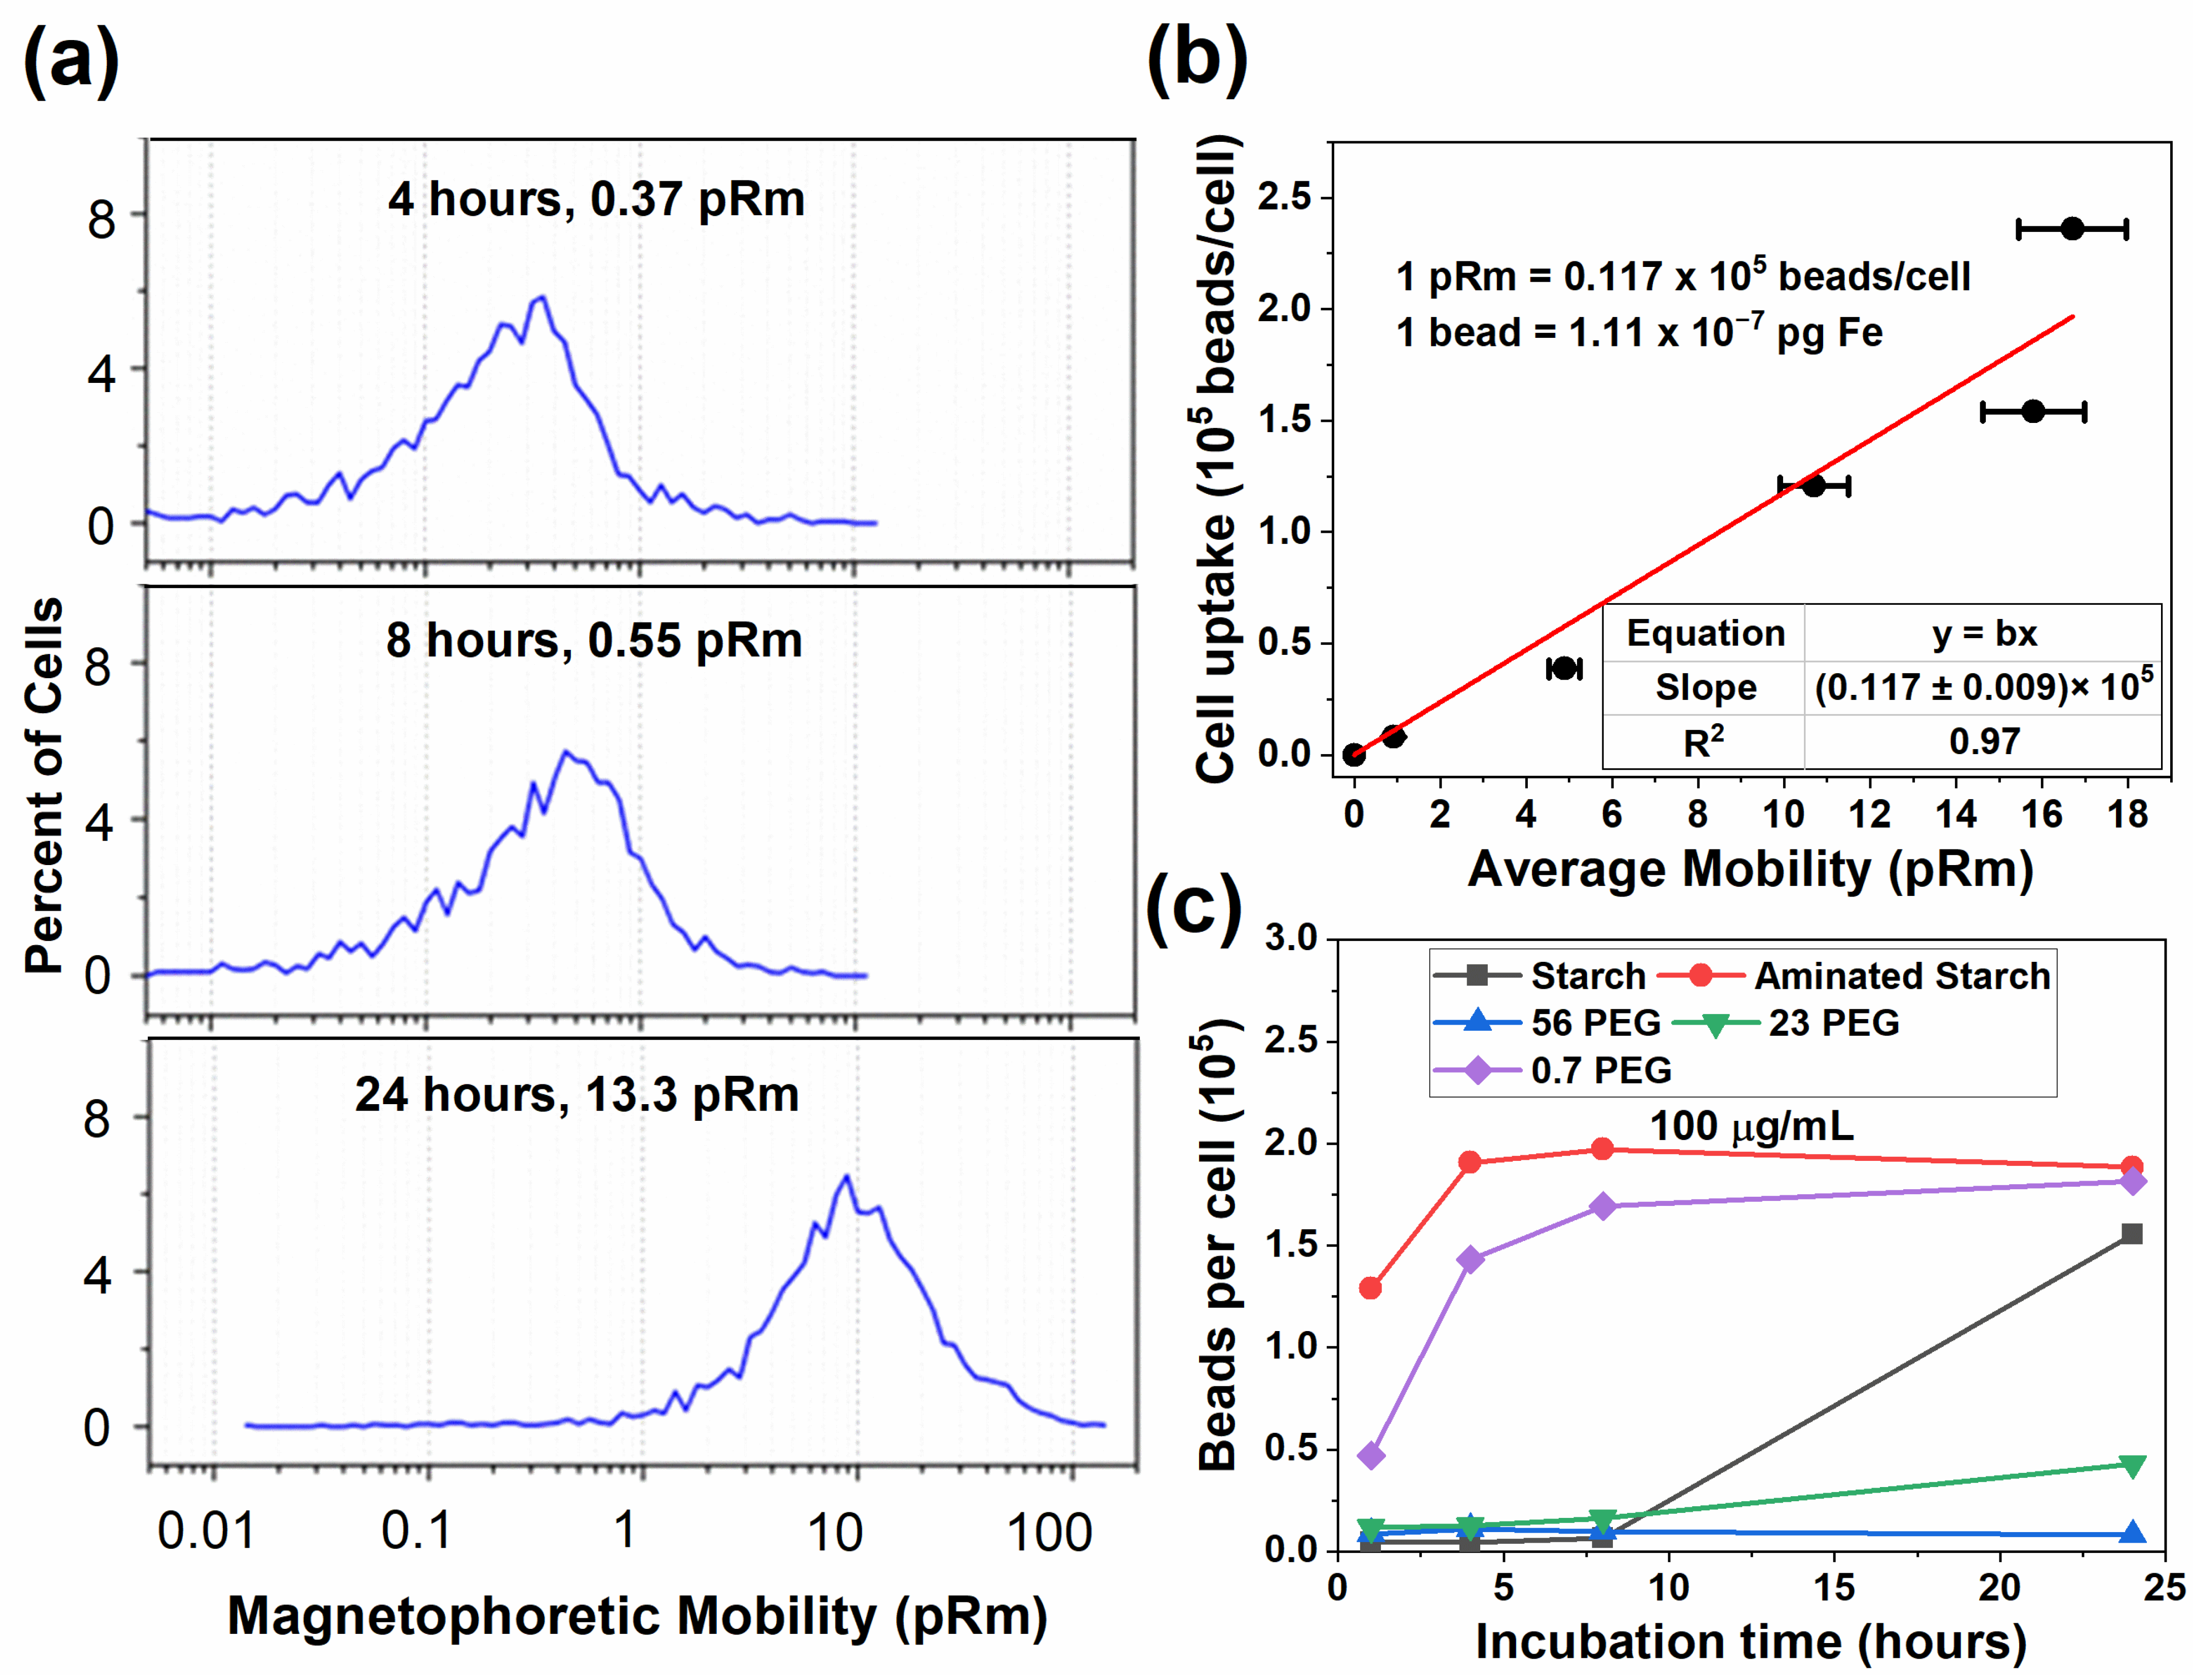
Figure 3.
Beads per cell (y) after 24 h versus bead concentration (x). (a) Langmuir adsorption isotherms (equation shown) were fitted, and K and S values are listed in Table 2 for beads with different surfaces. KS represents initial slope. (b) KS versus PEG surface coating illustrating the 99.5% reduction in binding due to 56 nmole/mg Fe PEG coverage.
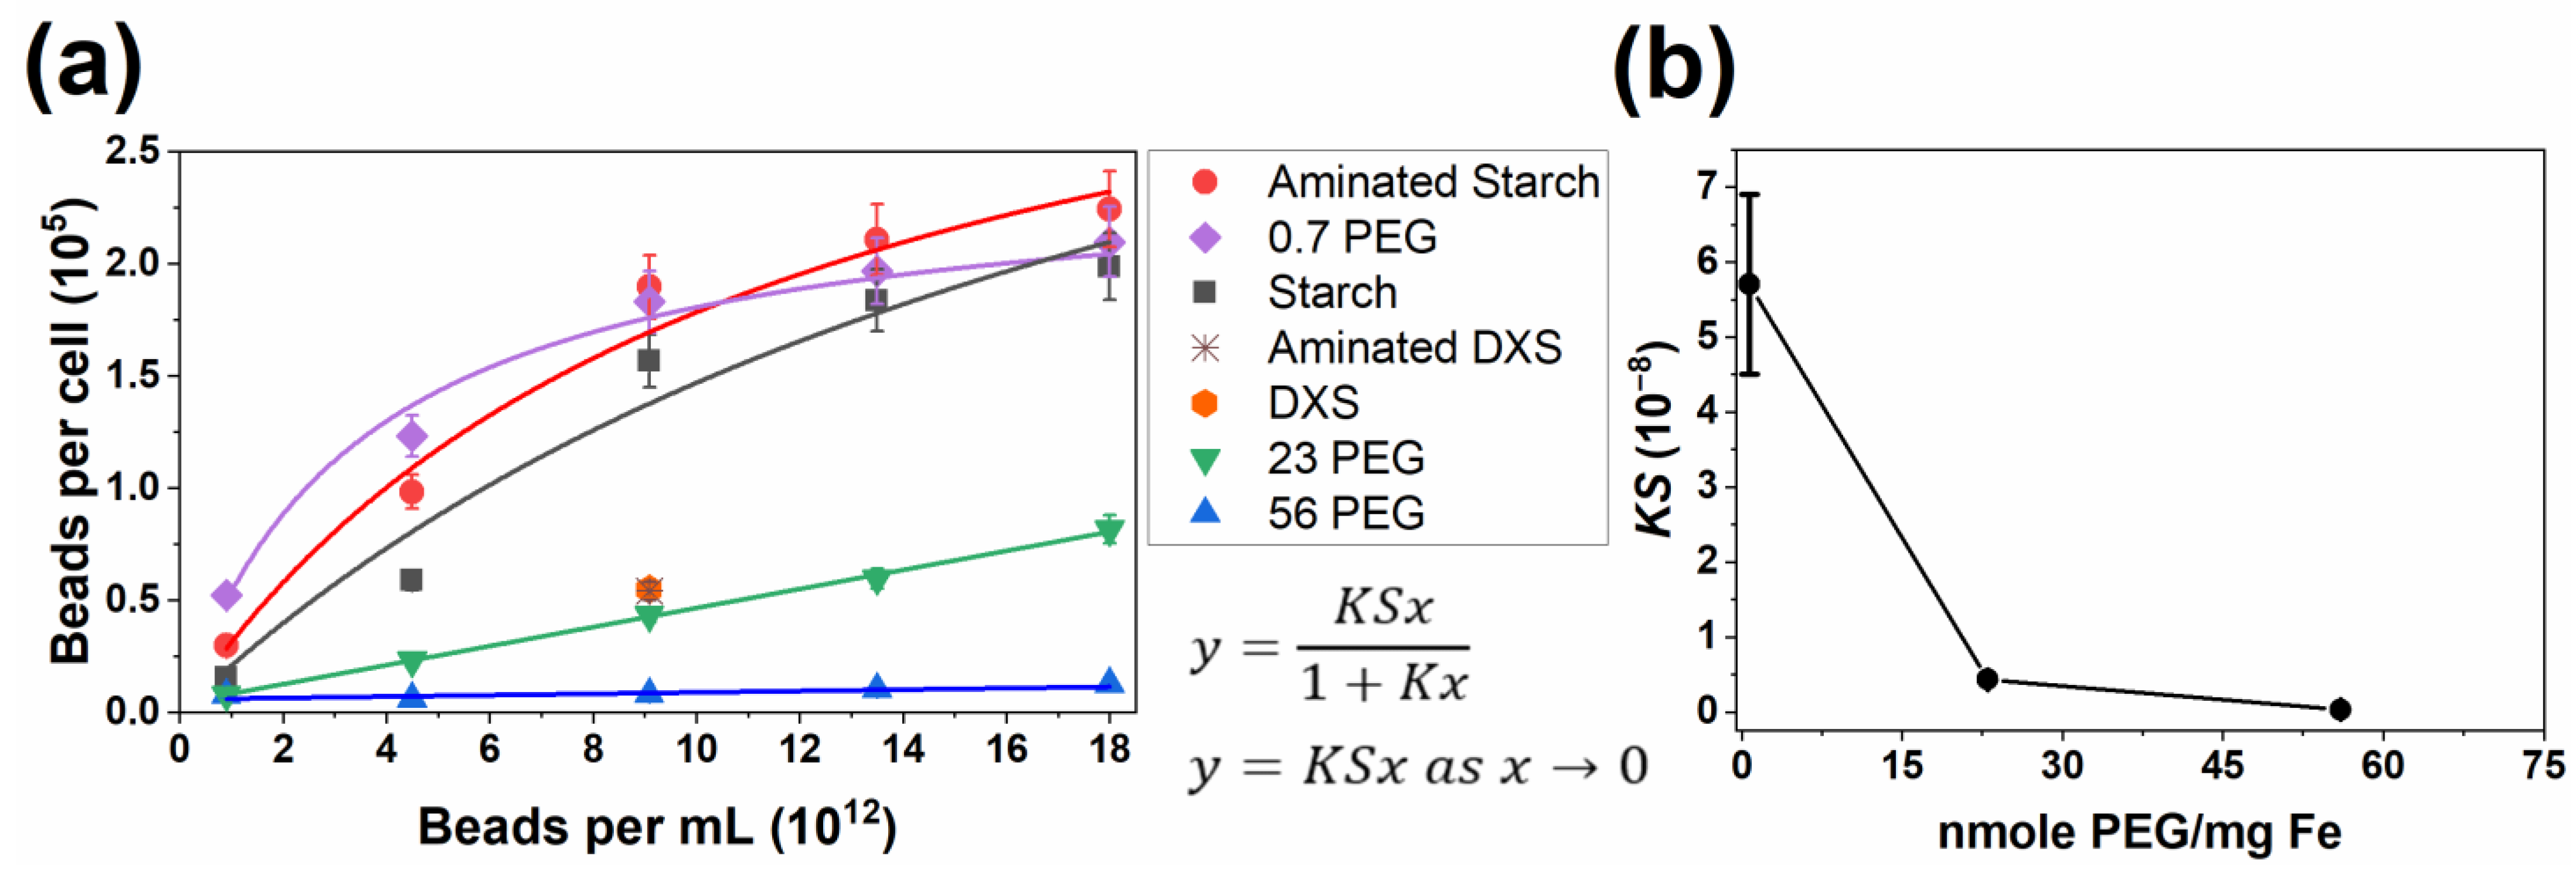
Figure 4.
DLVO analysis of adsorption of the seven bead types to the surface of CHO cells in monolayer. (a–g) Potential energy diagrams, ordinate in zJ (10–21 Joules). Dashed lines represent total potential. Note changes in ordinate scales. (h) Numerical versions of the potential energy formulae and values and definitions of independent variables for each combination. Values of a and Z are from Table 1. The repulsion term Wp only applies to PEGylated beads. See DLVO analysis (Section 2.7) for details.
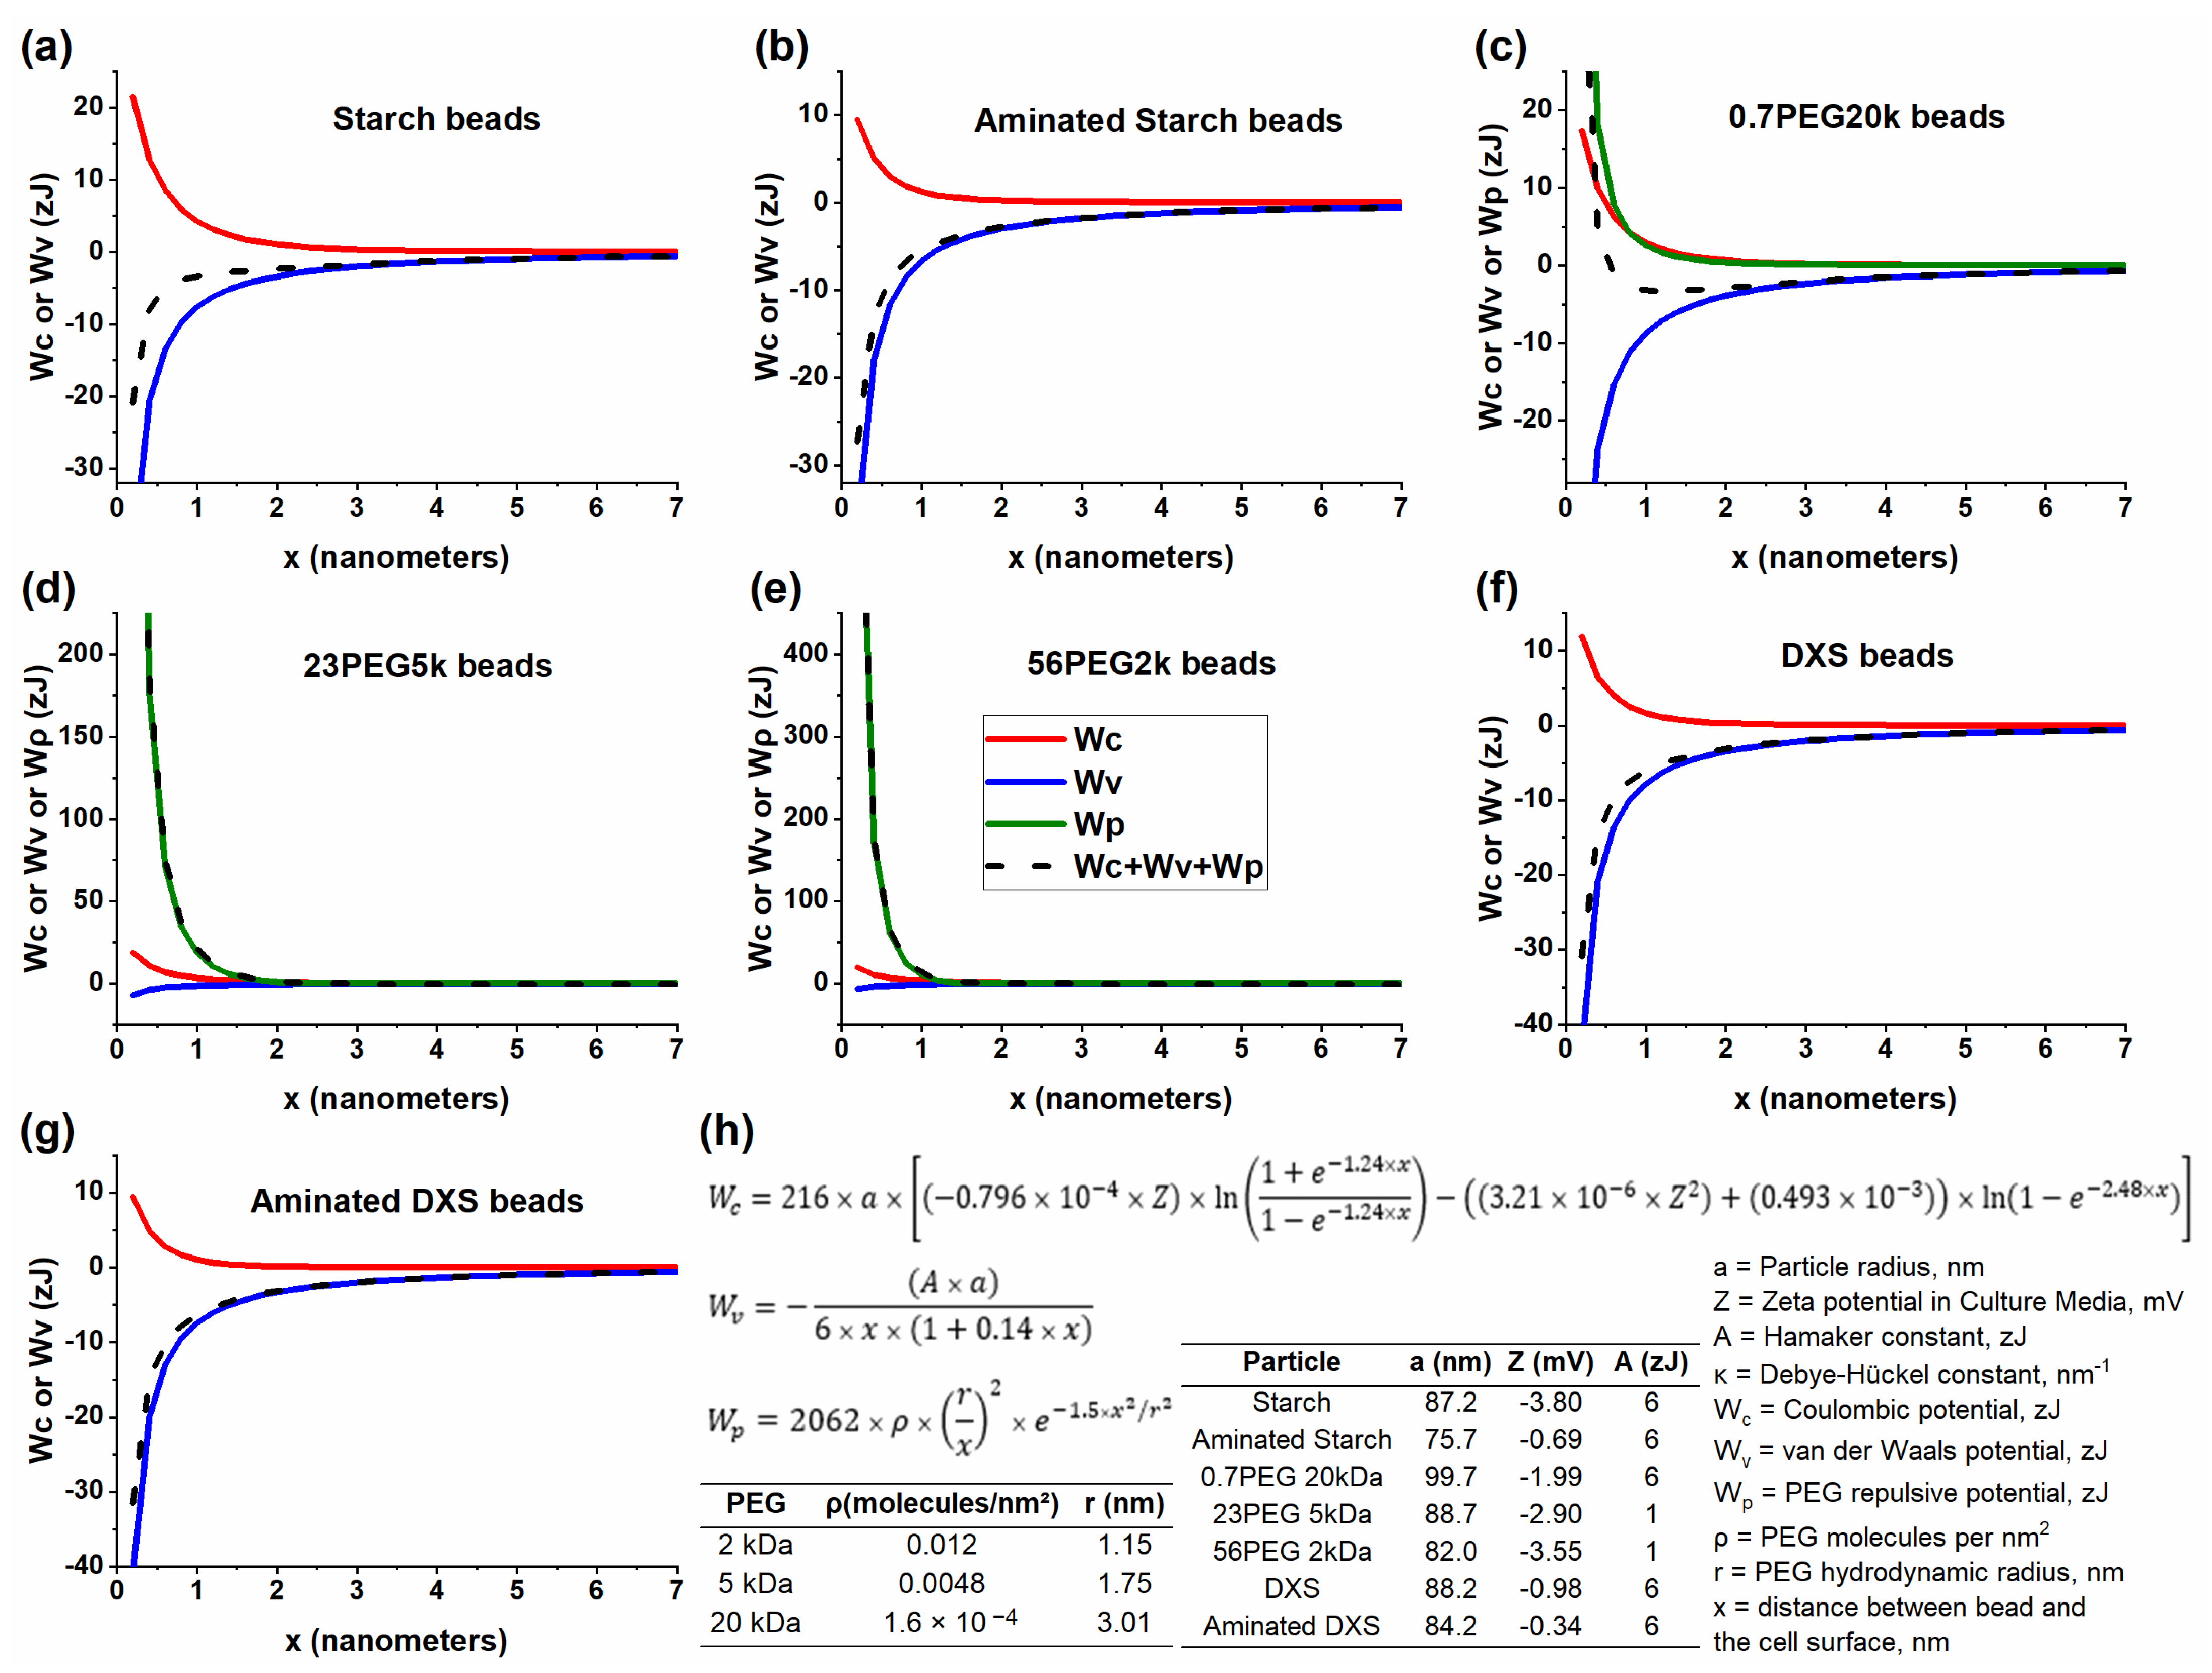
Figure 5.
Pathways of ingestion. (a) Normalized uptake (beads ingested per cell expressed as percent of control) versus inhibitor concentration with Genistein to inhibit caveolae-dependent ingestion and (b) Chlorpromazine hydrochloride to inhibit clathrin-dependent ingestion of nanoparticles coated with starch, aminated starch, DXS, and aminated DXS. Standard deviation of all points is 7.8% of the mean (see Section 2.4). Data were fitted with the inhibition equation y = A + ((100 − A)exp(−kx)) except for starch beads with Genistein, which were fitted with a linear equation. k is toxicity (μM−1) and A is the plateau value, representing the uninhibited fraction of endocytosis events. (c) Percent uptake that is dependent on each pathway defined as (100 − A) for each bead coating.

Table 1.
Physical properties of the seven nanoparticle surface chemistries. The diameters and zeta potentials of each bead type were determined by dynamic light scattering. CM = complete cell culture medium (including serum and antibiotics).
Table 1.
Physical properties of the seven nanoparticle surface chemistries. The diameters and zeta potentials of each bead type were determined by dynamic light scattering. CM = complete cell culture medium (including serum and antibiotics).
| Designation | Diameter in H2O (nm) | Diameter in CM (nm) | ZP in H2O (mV) | ZP in CM (mV) |
|---|---|---|---|---|
| Starch | 123.9 ± 22.1 | 174.4 ± 26.2 | −8.99 ± 6.38 | −3.78 ± 0.60 |
| Aminated Starch | 169.6 ± 32.6 | 151.4 ± 28.7 | +39.6 ± 5.94 | −0.69 ± 0.20 |
| * 0.7 PEG 20 kDa | 220.1 ± 45.3 | 199.5 ± 38.4 | +18.8 ± 4.1 | −1.99 ± 0.31 |
| * 23 PEG 5 kDa | 171.9 ± 29.9 | 177.5 ± 36.9 | +16.2 ± 5.9 | −2.90 ± 0.08 |
| * 56 PEG 2 kDa | 157.2 ± 29.3 | 164 ± 36.2 | +5.6 ± 5.1 | −3.55 ± 0.31 |
| DXS | 153.8 ± 28.2 | 176.5 ± 18.8 | −52.9 ± 7.62 | −0.98 ± 0.05 |
| Aminated DXS | 192.7 ± 38.2 | 168.4 ± 19.6 | −33.4 ± 5.73 | −0.34 ± 0.13 |
Table 2.
Langmuir adsorption isotherm constants for seven bead compositions. The product of K and S represents the initial slope, which could be determined directly for the low-adsorbing PEG-coated beads using y = KSx as x → 0.
Table 2.
Langmuir adsorption isotherm constants for seven bead compositions. The product of K and S represents the initial slope, which could be determined directly for the low-adsorbing PEG-coated beads using y = KSx as x → 0.
| Bead | K (10−13 mL/Bead) | S (105 Beads/Cell) | KS (10−8) | R2 |
|---|---|---|---|---|
| Aminated Starch | 1.0 ± 0.4 | 3.6 ± 0.6 | 3.6 ± 1.4 | 0.98 |
| 0.7 PEG | 2.2 ± 0.4 | 2.6 ± 0.15 | 5.7 ± 1.2 | 0.99 |
| Starch | 0.48 ± 0.33 | 4.5 ± 1.8 | 2.2 ± 1.3 | 0.96 |
| DXS | 0.55 ± 0.06 * | N/A | ||
| Aminated DXS | 0.54 ± 0.05 * | N/A | ||
| 23 PEG | 0.43 ± 0.01 ** | 0.99 | ||
| 56 PEG | 0.03 ± 0.01 ** | 0.78 |
* Estimated at a single concentration. ** Fitted initial slope of isotherm equation (K and S could not be determined independently).
Disclaimer/Publisher’s Note: The statements, opinions and data contained in all publications are solely those of the individual author(s) and contributor(s) and not of MDPI and/or the editor(s). MDPI and/or the editor(s) disclaim responsibility for any injury to people or property resulting from any ideas, methods, instructions or products referred to in the content. |
© 2023 by the authors. Licensee MDPI, Basel, Switzerland. This article is an open access article distributed under the terms and conditions of the Creative Commons Attribution (CC BY) license (https://creativecommons.org/licenses/by/4.0/).
Share and Cite
MDPI and ACS Style
Sannidhi, A.; Zhou, C.; Choi, Y.S.; David, A.E.; Todd, P.W.; Hanley, T.R. Nanomaterial Endocytosis: Quantification of Adsorption and Ingestion Mechanisms. Magnetochemistry 2023, 9, 37. https://doi.org/10.3390/magnetochemistry9020037
AMA Style
Sannidhi A, Zhou C, Choi YS, David AE, Todd PW, Hanley TR. Nanomaterial Endocytosis: Quantification of Adsorption and Ingestion Mechanisms. Magnetochemistry. 2023; 9(2):37. https://doi.org/10.3390/magnetochemistry9020037
Chicago/Turabian StyleSannidhi, Abhinav, Chen Zhou, Young Suk Choi, Allan E. David, Paul W. Todd, and Thomas R. Hanley. 2023. "Nanomaterial Endocytosis: Quantification of Adsorption and Ingestion Mechanisms" Magnetochemistry 9, no. 2: 37. https://doi.org/10.3390/magnetochemistry9020037
Note that from the first issue of 2016, this journal uses article numbers instead of page numbers. See further details here.