Article

Slow Methyl Axes Motions in Perdeuterated Villin Headpiece Subdomain Probed by Cross-Correlated NMR Relaxation Measurements

1
Department of Chemistry, University of Colorado at Denver, Denver, CO 80204, USA
2
Department of Biochemistry and Molecular Genetics, School of Medicine, University of Colorado, Anschutz Medical Campus, Aurora, CO 80045, USA
3
Department of Mathematics, University of Colorado at Denver, Denver, CO 80204, USA
4
Department of Pharmacology, Physiology and Biophysics, Boston University Chobanian and Avedisian School of Medicine, Boston, MA 02118, USA
*
Author to whom correspondence should be addressed.
Magnetochemistry 2023, 9(1), 33; https://doi.org/10.3390/magnetochemistry9010033
Submission received: 21 December 2022 / Revised: 10 January 2023 / Accepted: 12 January 2023 / Published: 14 January 2023
(This article belongs to the Special Issue NMR Spectroscopy and Imaging in Biological Chemistry and Medicine)

Abstract

:
Protein methyl groups can participate in multiple motional modes on different time scales. Sub-nanosecond to nano-second time scale motions of methyl axes are particularly challenging to detect for small proteins in solutions. In this work we employ NMR relaxation interference between the methyl H-H/H-C dipole-dipole interactions to characterize methyl axes motions as a function of temperature in a small model protein villin headpiece subdomain (HP36), in which all non-exchangeable protons are deuterated with the exception of methyl groups of leucine and valine residues. The data points to the existence of slow motional modes of methyl axes on sub-nanosecond to nanosecond time scales. Further, at high temperatures for which the overall tumbling of the protein is on the order of 2 ns, we observe a coupling between the slow internal motion and the overall molecular tumbling, based on the anomalous order parameters and their temperature-dependent trends. The addition of 28% (w/w) glycerol-d8 increases the viscosity of the solvent and separates the timescales of internal and overall tumbling, thus permitting for another view of the necessity of the coupling assumption for these sites at high temperatures.

1. Introduction

Methyl groups in protein are used as important probes of intermolecular interactions and internal dynamics [1,2]. A suite of NMR relaxation measurements focused on 13C, 2H, and 1H nuclei have been developed, each of them requiring a different labeling pattern and different extent of protein perdeuteration [2,3,4,5]. These measurements yield amplitude and often rate constants for the motions of methyl axis. Among those, the experiments based on deuterium probes are often most precise due to employment of multiple relaxation rates simultaneously in the fitting procedures [6].
Sub-nanosecond time scales of methyl axes are especially difficult to detect for small proteins in solution, for which the overall molecular tumbling times are below about 10 ns. Sun and Tugarinov [7] suggested a technique that is particularly suited for smaller-size proteins with the molecular tumbling times approaching 5 ns. It is focused on relaxation interference between the Hi-Hj and Hi-C dipole-dipole interactions and differentiates the rates of the fast-relaxing proton single-quantum transitions. depending on the state of 13C spins.
Probing the temperature dependence of the dynamics provides a means of interrogating the thermodynamic potential which governs the changes in the dynamics. In this work we focus on chicken villin headpiece (HP36) protein to probe the temperature dependence of methyl axes order parameters in the perdeuterated system. Perdeuteration in this case refers to all non-exchangeable protons, with the exception of the leucine and valine methyl groups which are protonated. HP36 is a 36-residue helical thermostable protein [8] (Figure 1), which has been studied extensively by numerous biophysical techniques including solution and solid-state NMR spectroscopy at the methyl sites and molecular dynamics simulations [9,10,11,12,13]. The numbering of the residues starts with 41 and continues through 76 to retain numbering as it is found in the full-length villin headpiece. The hydrophobic core of HP36 is defined by three phenylalanine residues and there are three methyl-bearing side chains (V50, L61, and L69) in relative proximity to the rings. The side-chains of L75 and L63 are more solvent-exposed, while the L42 residue is located at the N-terminus. We apply the H-H/C-H dipolar interference method for the perdeuterated/LV protonated HP36 protein for temperatures ranging from 2 to 32 °C to obtain the temperature dependence of the methyl axes order parameters. In this temperature range the protein is at least 99% folded [8].
The analysis of the results in the macromolecular approximation reveals anomalies in the fitted order parameters, which can be removed if one postulates sub-nanosecond timescale motions of the methyl axes. Inclusion of these time scales into the fitting procedure of the experimental cross-correlated relaxation rates removes the anomalies and reconciles the temperature dependence of the order parameters with prior data [14] using 2H based NMR relaxation applied to 13CDH2 isotopomers at 65% deuteration level.
For larger proteins with overall molecular tumbling times above about 10 ns and fast internal motions on the order of tens of picoseconds, it is often adequate to assume that the two types of motions are independent of each other. However, in cases when the time scales approach each other, it is no longer clear if the decoupling assumption implicit in the commonly used model-free approach [15] is valid. One of the possible descriptions of such processes can be achieved using slowly relaxing local structure formalism [16,17]. Another possibility is to treat the situation phenomenologically by using the correlation function that implies coupling of the internal and overall motions. We have previously described possible phenomenological models and their corresponding spectral densities for this situation [18].
For HP36 with the shortest tumbling time of 2 ns at 32 °C, the commonly employed assumption of the decoupling between the overall and internal motions may fail for the sites displaying the anomalous order parameters, and we, thus, employ the phenomenological approach that involves the explicit coupling between the two time scales for several sites. Further, in order to separate the time scales of the overall and internal motions, we also perform the measurements in the presence of glycerol, which increases the viscosity of solution to slow down the overall tumbling.

2. Materials and Methods

2.1. Sample Preparation

HP36 protein was expressed in BL21 (DE3) E. coli cells (New England BioLabs) as part of the fusion construct NTL9-FXa-HP36 [19]. An adaptive growth protocol was used to grow cells and induce expression in 100% D2O minimal media. For the LV protonation, the minimal media was supplemented with 2-keto-3[D]-[13CH3, 13CH3]-isovalerate that labels the methyl groups of leucine and valine. Two-step purification with the cleavage of factor Xa before the second step was performed as described in a prior publication [20].
For incorporation of 99% deuterated glycerol-d8 (Cambridge isotope laboratories) was added directly to the samples. The initial sample volume was determined by weight. The sample was weighed before and after each addition of glycerol to determine the exact amount of glycerol added.

2.2. NMR Spectroscopy

The NMR measurements were performed on a triple-resonance Bruker 500 MHz NMR spectrometer equipped with a TCI cryo-probe (Boston University School of Medicine). For the ηHH/CH measurements, an in-phase and an anti-phase spectrum (with respect to 13C), both selecting the L1 transitions [7,21], were recorded by setting the φ6 phase of the 90° pulse on 13C prior to acquisition to 45° and 225°, respectively, for each relaxation delay T. 350 and 1024 points complex data points were recorded in the indirect 13C and the direct 1H dimensions, the spectral widths were 1429 Hz (13C) and 6510 Hz (1H), and the number of scans was 64. The interscan delay was 1.5–2.0 s. The FIDs were processed with the NmrPipe/NmrDraw/NlinLS package [22]. Each dimension was apodized by a 90° phase-shifted squared sine-bell window function and zero-filled once. Finally, the in-phase and anti-phase spectra were added and subtracted to separate the two 13C-doublet components into two spectra. We used multiples of 1/(1JHC) = 8 ms for the relaxation delays such as 8, 16, 24, 32 and 40 ms. For data at 4.5 °C and 28 °C four relaxation delays were collected. The rate ηHH/CH was obtained from exponential fits of the ratio of intensities of the two components.
The molecular tumbling times, τc, were determined from 15N R1 and R1ρ relaxation experiments [23] at the same temperature range as the cross-correlated relaxation measurements were conducted using the 15N labeled perdeuterated sample. DOSY measurements [24] were performed focusing on the intensities of the residual protons in deuterated glycerol, using a stimulated echo sequence with bipolar gradients [25,26]. In particular, the standard Bruker pulse sequence “stebpgp1s19” was used, which utilizes water-gate water suppression [27]. The full stimulated echo time was 0.1 s, the total gradient time 1.6 to 2.2 ms, and the delay between the bipolar gradients was 0.4 ms.
The temperature was calibrated using perdeuterated methanol [28]. Each temperature point was equilibrated for 20–30 min before the start of the experiment, The temperature was controlled within at least 0.2 °C precision with the BSVT Variable Temperature controler and BCU-1 pre-colling accessory. Each spectrum in the relaxation or diffusion series measurements utilized 16 to 32 dummy scans and the orders of the relaxation delays and diffusion times were randomized.

3. Results and Discussion

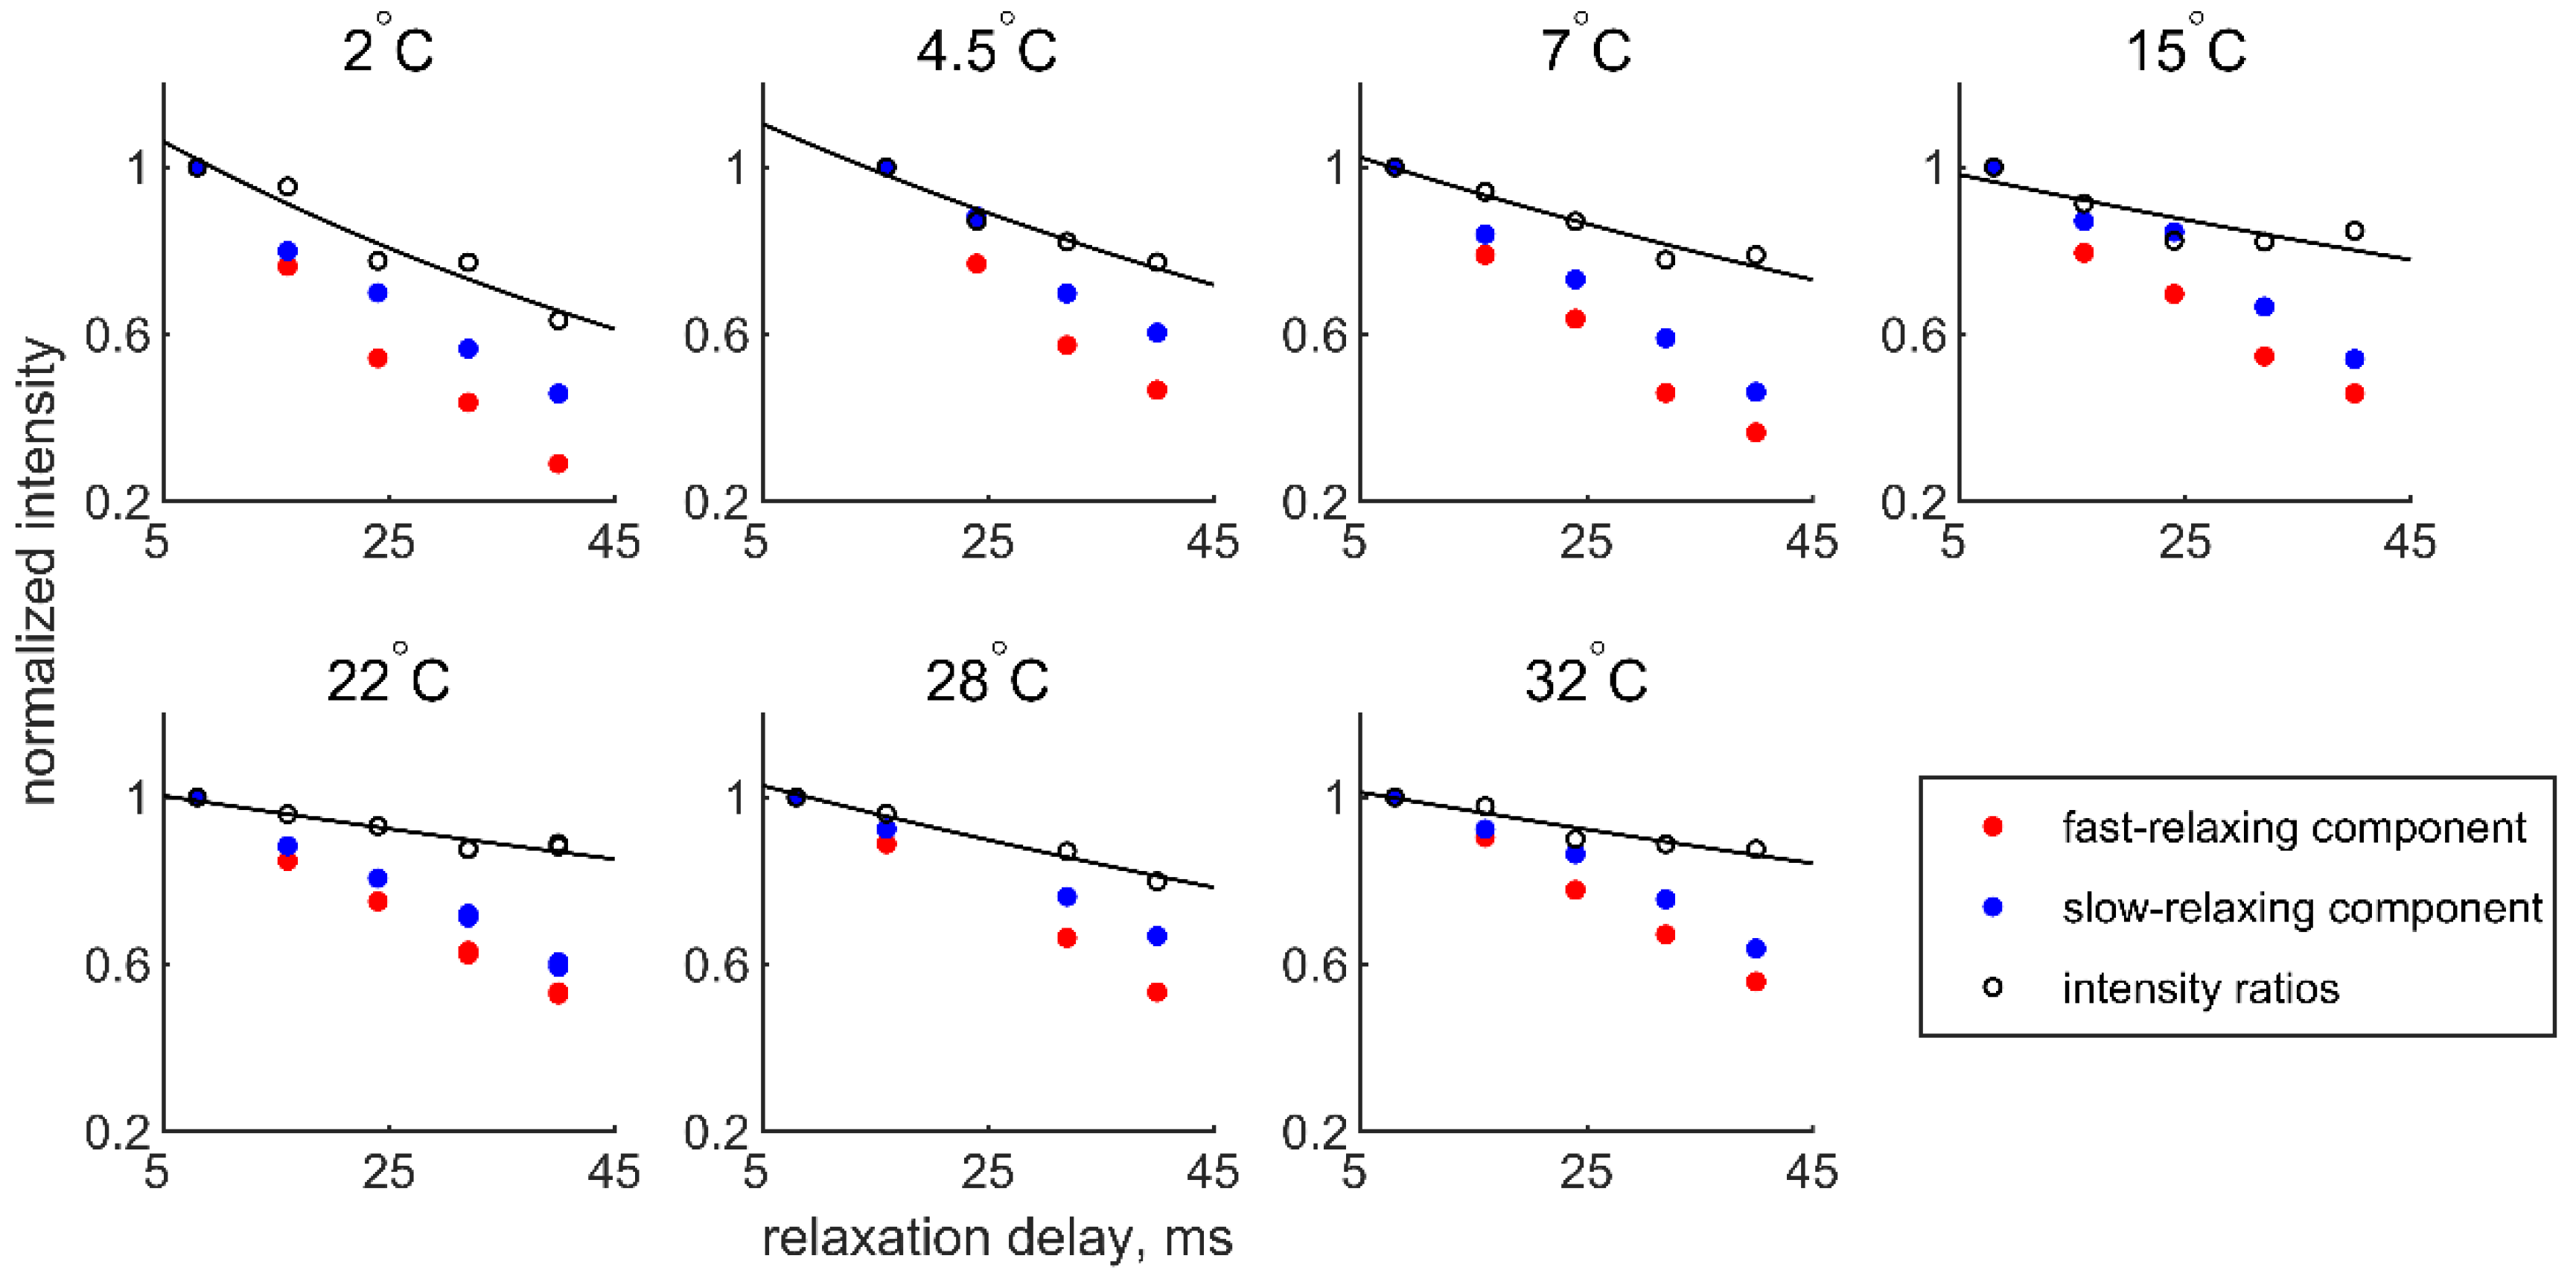
3.1. Summary of the Experimental Approach for Determination of Methyl Order Parameters

The approach of Tugarinov et al. is based on the interference between the Hi-Hj and Hk-C dipole-dipole interactions with i = k or j = k (but can be easily extended for the case where all 3 indices i, j, k are different), and has been designed to be used with perdeuterated methyl reprotonated proteins.
The experiment is designed to measure the differences between the two 13C spin-state associated relaxation rates of fast-relaxing 1H single-quantum transitions. In macromolecules, the relaxation rates of all 1H single-quantum transitions in isolated methyl groups are mono-exponential and adopt only one of two possible values. Here, we focus on the faster relaxing components, which span the spin-3/2 manifold. The corresponding relaxation rate, R2,F, is further modified by the presence of the 13C atom [21]. Depending on the specific 1H transitions, the α or the β spin state of 13C increases the rates by the cross-correlated relaxation rate ηHH/CH (R2,Ff), while the other one decreases the rate by ηHH/CH (R2,Fs). ηHH/CH can be extracted as (R2,FfR2,Fs)/2.
The pulse sequence is based on a 2D [13C,1H]-HMQC experiment [7]. In the indirect evolution period, the slow-relaxing [13C,1H] multiple-quantum coherences are evolved. Part of these coherences are converted into the fast-relaxing single-quantum coherences, which are selected and relaxed during a relaxation period T. Finally, we detect on 1H the L1-1H transition, which can be either in α or β state with respect to 13C and relax with R2,Ff and R2,Fs, respectively. The two doublet components of L1 are sequestered into two spectra by Inphase-Antiphase (IPAP) selection [7]. The tumbling times have to be determined independently, which we acquired through 15N R1 and R1ρ relaxation experiments [23]. The cross-correlated relaxation rates ηHH/CH are obtained from the exponential fits of the ratios of intensities of the two components of the two 13C-doublets. This experiment is more tolerant to proteins with low tumbling times in comparison to techniques based on the difference of the auto-relaxation relaxation rates of the two 13C-doublet components individually [29]. The “tolerance” was judged from the correlation of methyl axis order parameters derived from the 2H methods [3,6] versus the proton-based cross-correlated relaxation techniques. The agreement was more difficult to achieve for ubiquitin at high temperatures at which tC values fell below 3.6 ns.

3.2. Summary of the Theoretical Expressions

The general expression for the cross-relaxation η HH / CH rate is given by [7]:
η HH / CH = 6 ( μ 0 4 π ) 2   γ H 3 γ C 2   r HH 3 r CH 3 ( J ( 0 ) + 3 2 J ( ω H ) )
where μ0 is the permeability of free space, γX is the gyromagnetic ratio of spin X, ħ is Planck’s constant divided by 2π, rHH and rCH are known interatomic distances [21], and τC is the overall tumbling time of the molecule, considered isotropic in this case. J ( ω H ) is the spectral density of the Hi-Hj and Hk-C interactions at the Larmor frequency of the proton, which includes the terms where i = k or j = k as well as when all 3 indices i, j, k are different and include contributions from all protons belonging to the same methyl group as well as minor contributions from external protons. The latter were estimated to be on the order of 2% or less [7]. The expression also assumes negligible contributions from the slow-relaxing 1H transitions into the η HH / CH rate.
Taking into account three types of motions: the overall molecular tumbling, methyl rotations, and the motions of the methyl axis, the expression for J ( ω ) under the assumption of the model-free is [15,30]:
J ( ω ) = 1 5 ( P 2 ( cos θ a x i s ,   HH ) P 2 ( cos θ a x i s ,   CH ) S a x i s 2 τ C 1 + ( ω τ C ) 2 + [ < P 2 ( cos θ CH ,   HH ) > P 2 ( cos θ a x i s ,   HH ) P 2 ( cos θ a x i s ,   CH ) S a x i s 2 ] τ e 1 + ( ω τ e ) 2 )
where 1 τ e = 1 τ f + 1 τ C , θ a x i s ,   HH is the angle between the methyl three-fold axis and a vector that connects a pair of methyl 1H nuclei, and θ a x i s ,   CH is the angle between the methyl three-fold axis and a vector that connects 13C and 1H nuclei. Assuming the ideal tetrahedral geometry, P 2 ( cos θ a x i s ,   HH ) = 1 / 2 and P 2 ( cos θ a x i s ,   CH ) = 1 / 3 . S a x i s 2 is the order parameter for motions of the methyl three-fold axis. The value of < P 2 ( cos θ CH ,   HH ) > depends on the relative time scales of motions of the methyl three-fold axis and the methyl rotations. If the two time scales are similar, as reflected in the single value of τ f , then the magnitude of the H-H and C-H interactions are not averaged by the methyl jumps and therefore < P 2 ( cos θ CH ,   HH ) > reflects the instantaneous angle between H-H and C-H bonds. The H-H/C-H interactions without a shared proton within the same methyl group do not contribute to J ( 0 ) . Thus, < P 2 ( cos θ CH ,   HH ) >   = 1 / 2 . However, averaging over the cases of shared and non-shared protons within the same methyl group must be carried out to calculate the average contribution to J ( ω H ) . After the averaging, < P 2 ( cos θ CH ,   HH ) >   = 1 / 6 . Thus, in this case we have
J ( ω H ) = 1 30 ( S a x i s 2 τ C 1 + ( ω H τ C ) 2 + [ 1 S a x i s 2 ] τ e 1 + ( ω H τ e ) 2 ) J ( 0 ) = 1 30 ( S a x i s 2 τ C + [ 3 S a x i s 2 ] τ e )
In the case when methyl rotations are much faster than the methyl axis motions, we assume that the only effect of methyl rotations is the averaging of the interactions, while τ f reflects only the time scale of the methyl axis motions. In this case < P 2 ( cos θ CH ,   HH ) > = P 2 ( cos θ a x i s ,   HH ) P 2 ( cos θ a x i s ,   CH ) = 1 / 6 . The spectral density expressions are then simplified to:
J ( ω H ) = 1 30   ( S a x i s 2 τ C 1 + ( ω H τ C ) 2 + [ 1 S a x i s 2 ] τ e 1 + ( ω H τ e ) 2 ) J ( 0 ) = 1 30   ( S a x i s 2 τ C + [ 1 S a x i s 2 ] τ e   )
While in both Equations (3) and (4) the main contributions are due to J ( 0 ) terms and thus are field-independent, their dependence of J ( ω H ) on proton Larmor frequency suggests a potential value of analyzing field-dependence of the experimental data.
Under the assumption of the macromolecular limit, the expression for η HH / CH is given by:
η HH / CH = 1 5 ( μ 0 4 π ) 2 S a x i s 2 γ H 3 γ C 2 τ C r HH 3 r CH 3
For small-sized proteins, the deviations from the macromolecular limit can be significant and will be elaborated below.
When the time scales of methyl axes motions and overall tumbling approach each other, i.e., the condition τ C 5 τ f no longer holds, the assumption of the model-free model for the decoupling approximation between the internal and global motions of the macromolecule can break down. One of the ways to account for the effect of coupling between the overall and internal motion is to rewrite the model-free correlation function without the assumption of the direct decoupling, assuming that the interaction vector first reaches a quasi-equilibrium orientation with respect to the local environment and the molecular tumbling has an indirect effect through the orienting potential for the local director axis [18]. This is in concept similar to the slowly relaxing local structure formalism [16,17]. In this scenario the order parameters are overestimated if treated within the decoupled model-free formalism. The corresponding spectral density function describes synchronous variations in the average orientation of the bond vector and the molecular orientation induced through the geometrical constraints imposed by a rigid bond environment.
The spectral density in this model is obtained from the corresponding model-free expressions by the following substitutions: replace τ e with τ f , replace S a x i s 2 with S ˜ a x i s 2 = S a x i s 2 τ C τ C τ f . With the assumption of separation of time scales of methyl rotations and methyl axes motions (i.e., same assumption as in Equation (4)) the spectral density function is given by:
J ( ω ) = 1 30 ( S ˜ a x i s 2 τ C 1 + ( ω τ C ) 2 + [ 1 S ˜ a x i s 2 ] τ e 1 + ( ω τ f ) 2 )
For smaller-sized proteins with τ C values under about 5 ns the assumption of the macromolecular limit may not be adequate, especially for cases when methyl axes motions become relatively slow. The comparison is given in Figure 2, in which the y-axis represents the relative error in the order parameter for calculations in the macromolecular limit (given by S a p p 2 ) versus either the full formula of Equation (4) or only its J ( 0 ) contribution. S a x i s 2 represent the input order parameter used in calculations of Equation (4). When the spectral density function of Equation (6) is used, which explicitly takes into account the coupling between the overall and internal motions, the corrections are amplified. The relative correction, as expected, is larger for small values of τ C and small values of the methyl axis order parameters. For example, for τ C   = 2 ns and S a x i s 2 = 0.5, the relative correction using the model-free formula of Equation (4) with the full spectral density is 35%. Note, that if the macromolecular limit and the model-free assumptions are employed in situations when they are not applicable, it is possible to obtain the apparent order parameter exceeding 1.

3.3. Summary of Samples, Experimental Conditions, Chemical Shift Perturbation Analysis, and Typical Spectra

The temperature dependence of the methyl order parameters was measured using the perdeuterated/LeuVal-protonated HP36 sample at 1.2 mM concentration and the temperature range of 2 to 32 °C. The perdeuteration in our case refers to non-exchangeable protons only. The protonated methyl groups are shown in Figure 1. The upper limit of the temperature range was defined by the temperature at which this thermostable protein remains at least 99% folded [8]. To measure the tumbling times at each temperature, a separate sample which was homogeneously labeled at 15N sites and fully perdeuterated was employed at the same 1.2 mM concentration.
As will be described below, the cross-correlated H-H/C-H dipole-dipole and 15N amide backbone relaxation measurements have also been performed in the presence of deuterated glycerol in the solvent with a composition of 28% by weight. Matching of the glycerol content for the perdeuterated/LV protonated and the 15N labeled samples was achieved using DOSY measurements [24] focused on the residual proton signal of 99% deuterated glycerol (Table S1, Figure S1). Addition of glycerol (described in the Section 2.1) decreased the protein concentration proportional to the weight percentage.
Chemical shift perturbation (CSP) analysis was performed on the backbone amide and methyl sites. Figure 3 shows weighted CSPs at the different temperatures for the backbone sites, based on the 15N R1 spectra with the smallest relaxation delay of 1 ms, while Figure 4 displays CSPs for the methyl sites extracted from the cross-correlated relaxation spectra for the 8 ms relaxation delay. The changes in chemical shifts are very modest and suggest no dramatic structural changes. Additional data at individual temperatures with 0 and 28% glycerol content (Figure 5 and Figure S2) demonstrates very minor chemical shift changes upon incorporation of glycerol. No regularity was observed in regard to correlations with secondary structure features or solvent exposure.

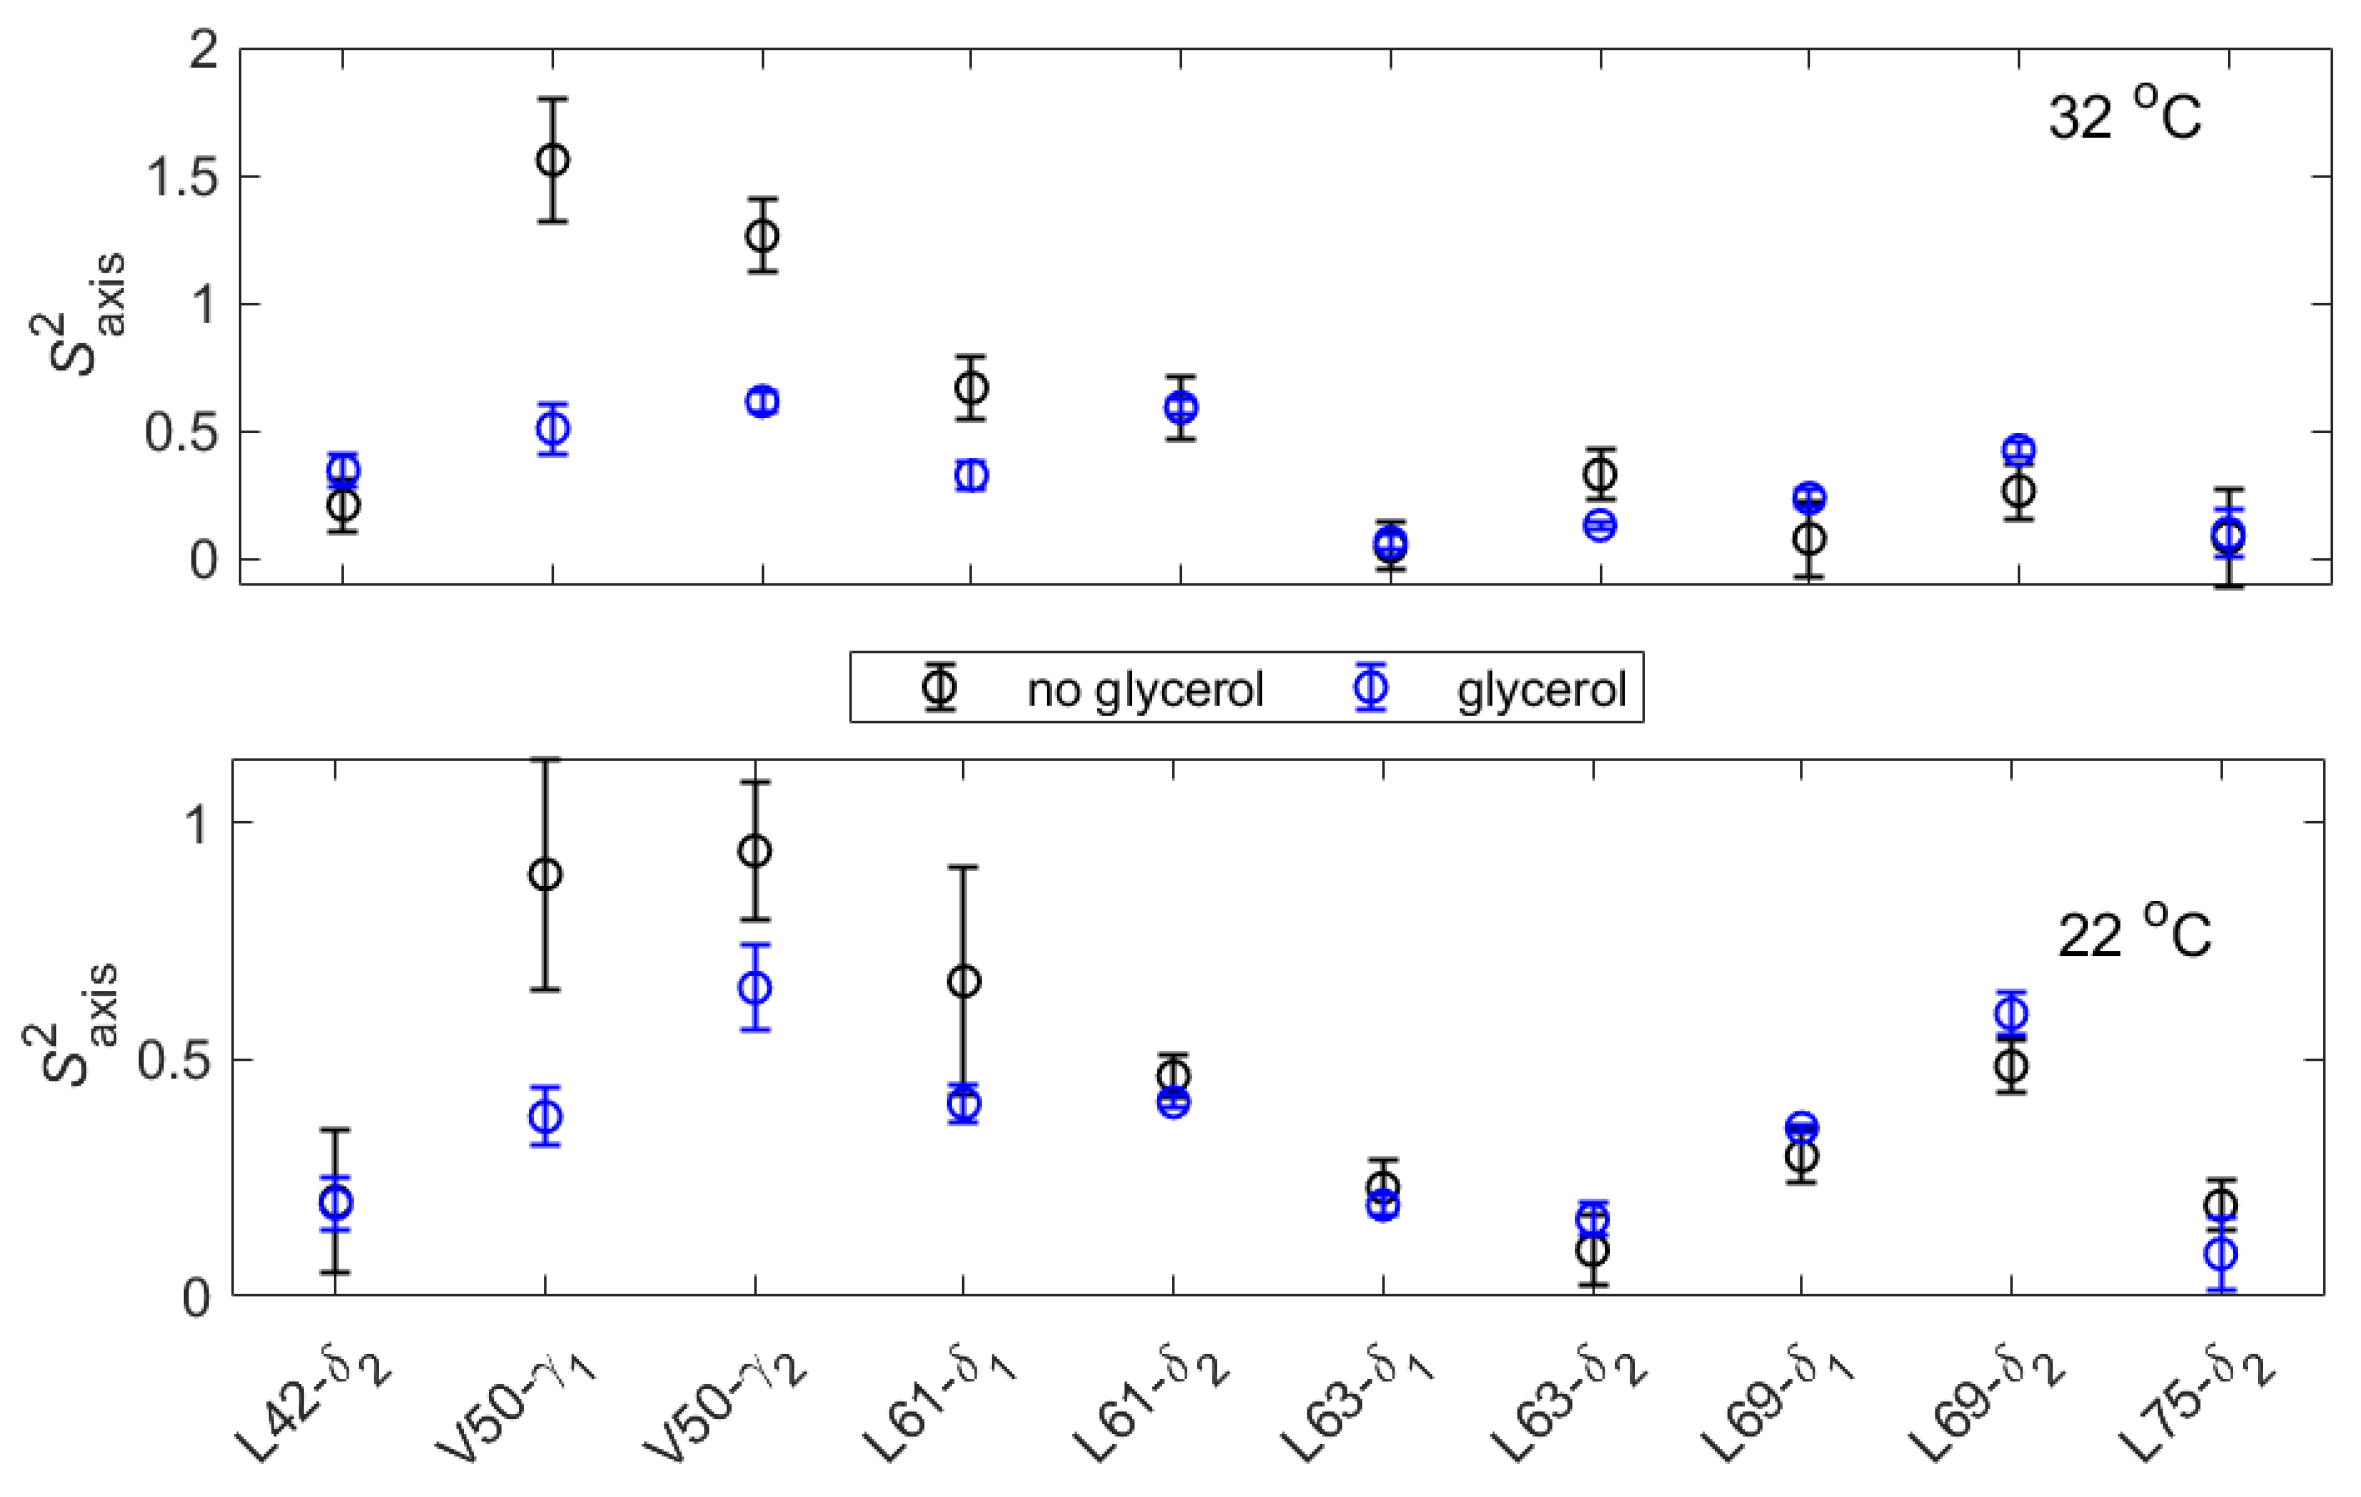
3.4. Overall Tumbling Times and the Effect of Glycerol

The overall diffusion tensor for HP36 was previously found to be isotropic in the entire temperature range of 2–32 °C for the protonated protein [32]. The tumbling times for the perdeuterated 15N-labeled protein have been obtained at 2, 7, 15, 22 and 32 °C from the residue-averaged 15N R1ρ/R1 ratios (Table S2) [23]. These tumbling times scale linearly with viscosity/temperature ŋ/T, (Figure 6, black circles), in similarity to what has been observed for the protonated protein, which has been shown to have an isotropic diffusion tensor across the entire temperature range. [32] in the presence of glycerol, as expected, marked changes in the viscosity are observed causing tumbling times to increase (Figure 6, blue line). However, the linear dependence of τc on ŋ/T strongly suggests that the symmetry of the diffusion tensor remains unchanged with temperature. The viscosities in the presence of glycerol were calculated using the approach of Cheng [33] with modifications by Volk and Kähler [34]. At 32 °C we have also conducted measurements of τc for different glycerol content to further confirm the linearly with ŋ/T (Figure S3). Further, the translational diffusion coefficients obtained using DOSY for the 15N-labeled protein with the 28% glycerol content scale linearly with the inverse of the tumbling times (Figure S4). The DOSY are focused on the residual proton signal of 99% deuterated glycerol, as explained above.
We are thus in a good position to apply the isotropic limit for all cases. It is of note that simulations of diffusion tensors for various glycerol content has been previously performed for ribonuclease barnase and corresponded well to those determined from 15N R2/R1 ratios [35].

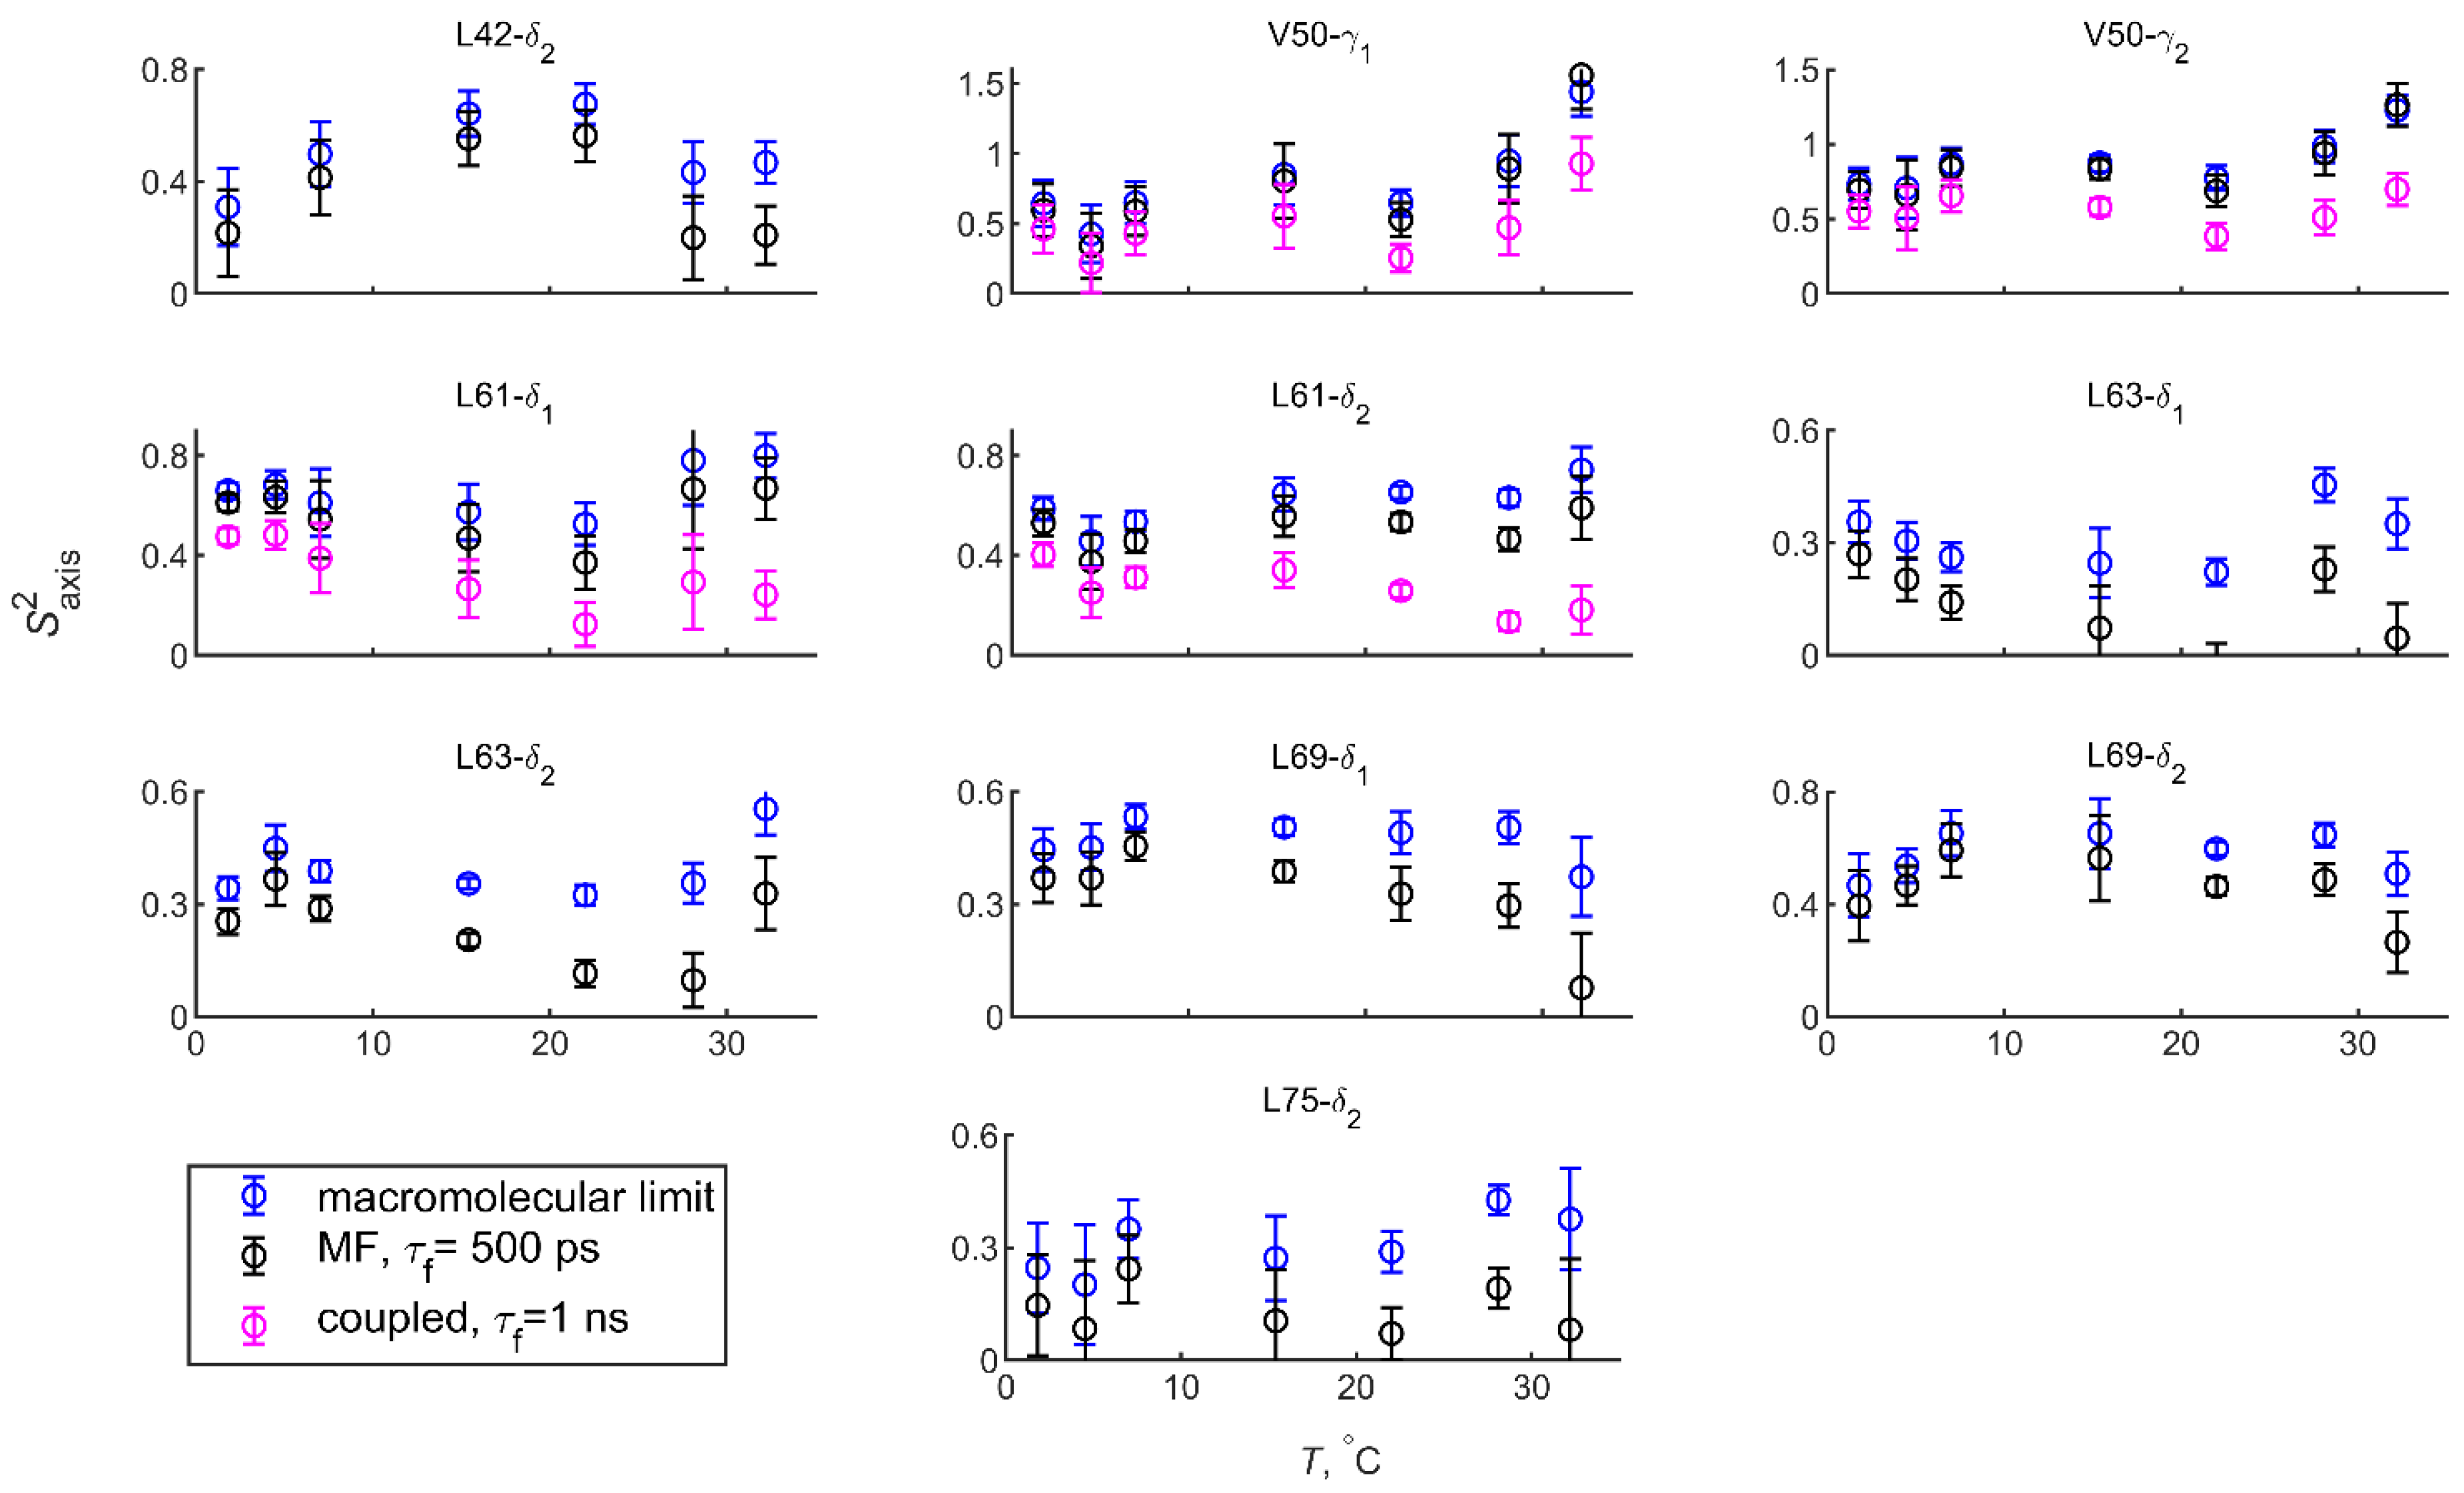
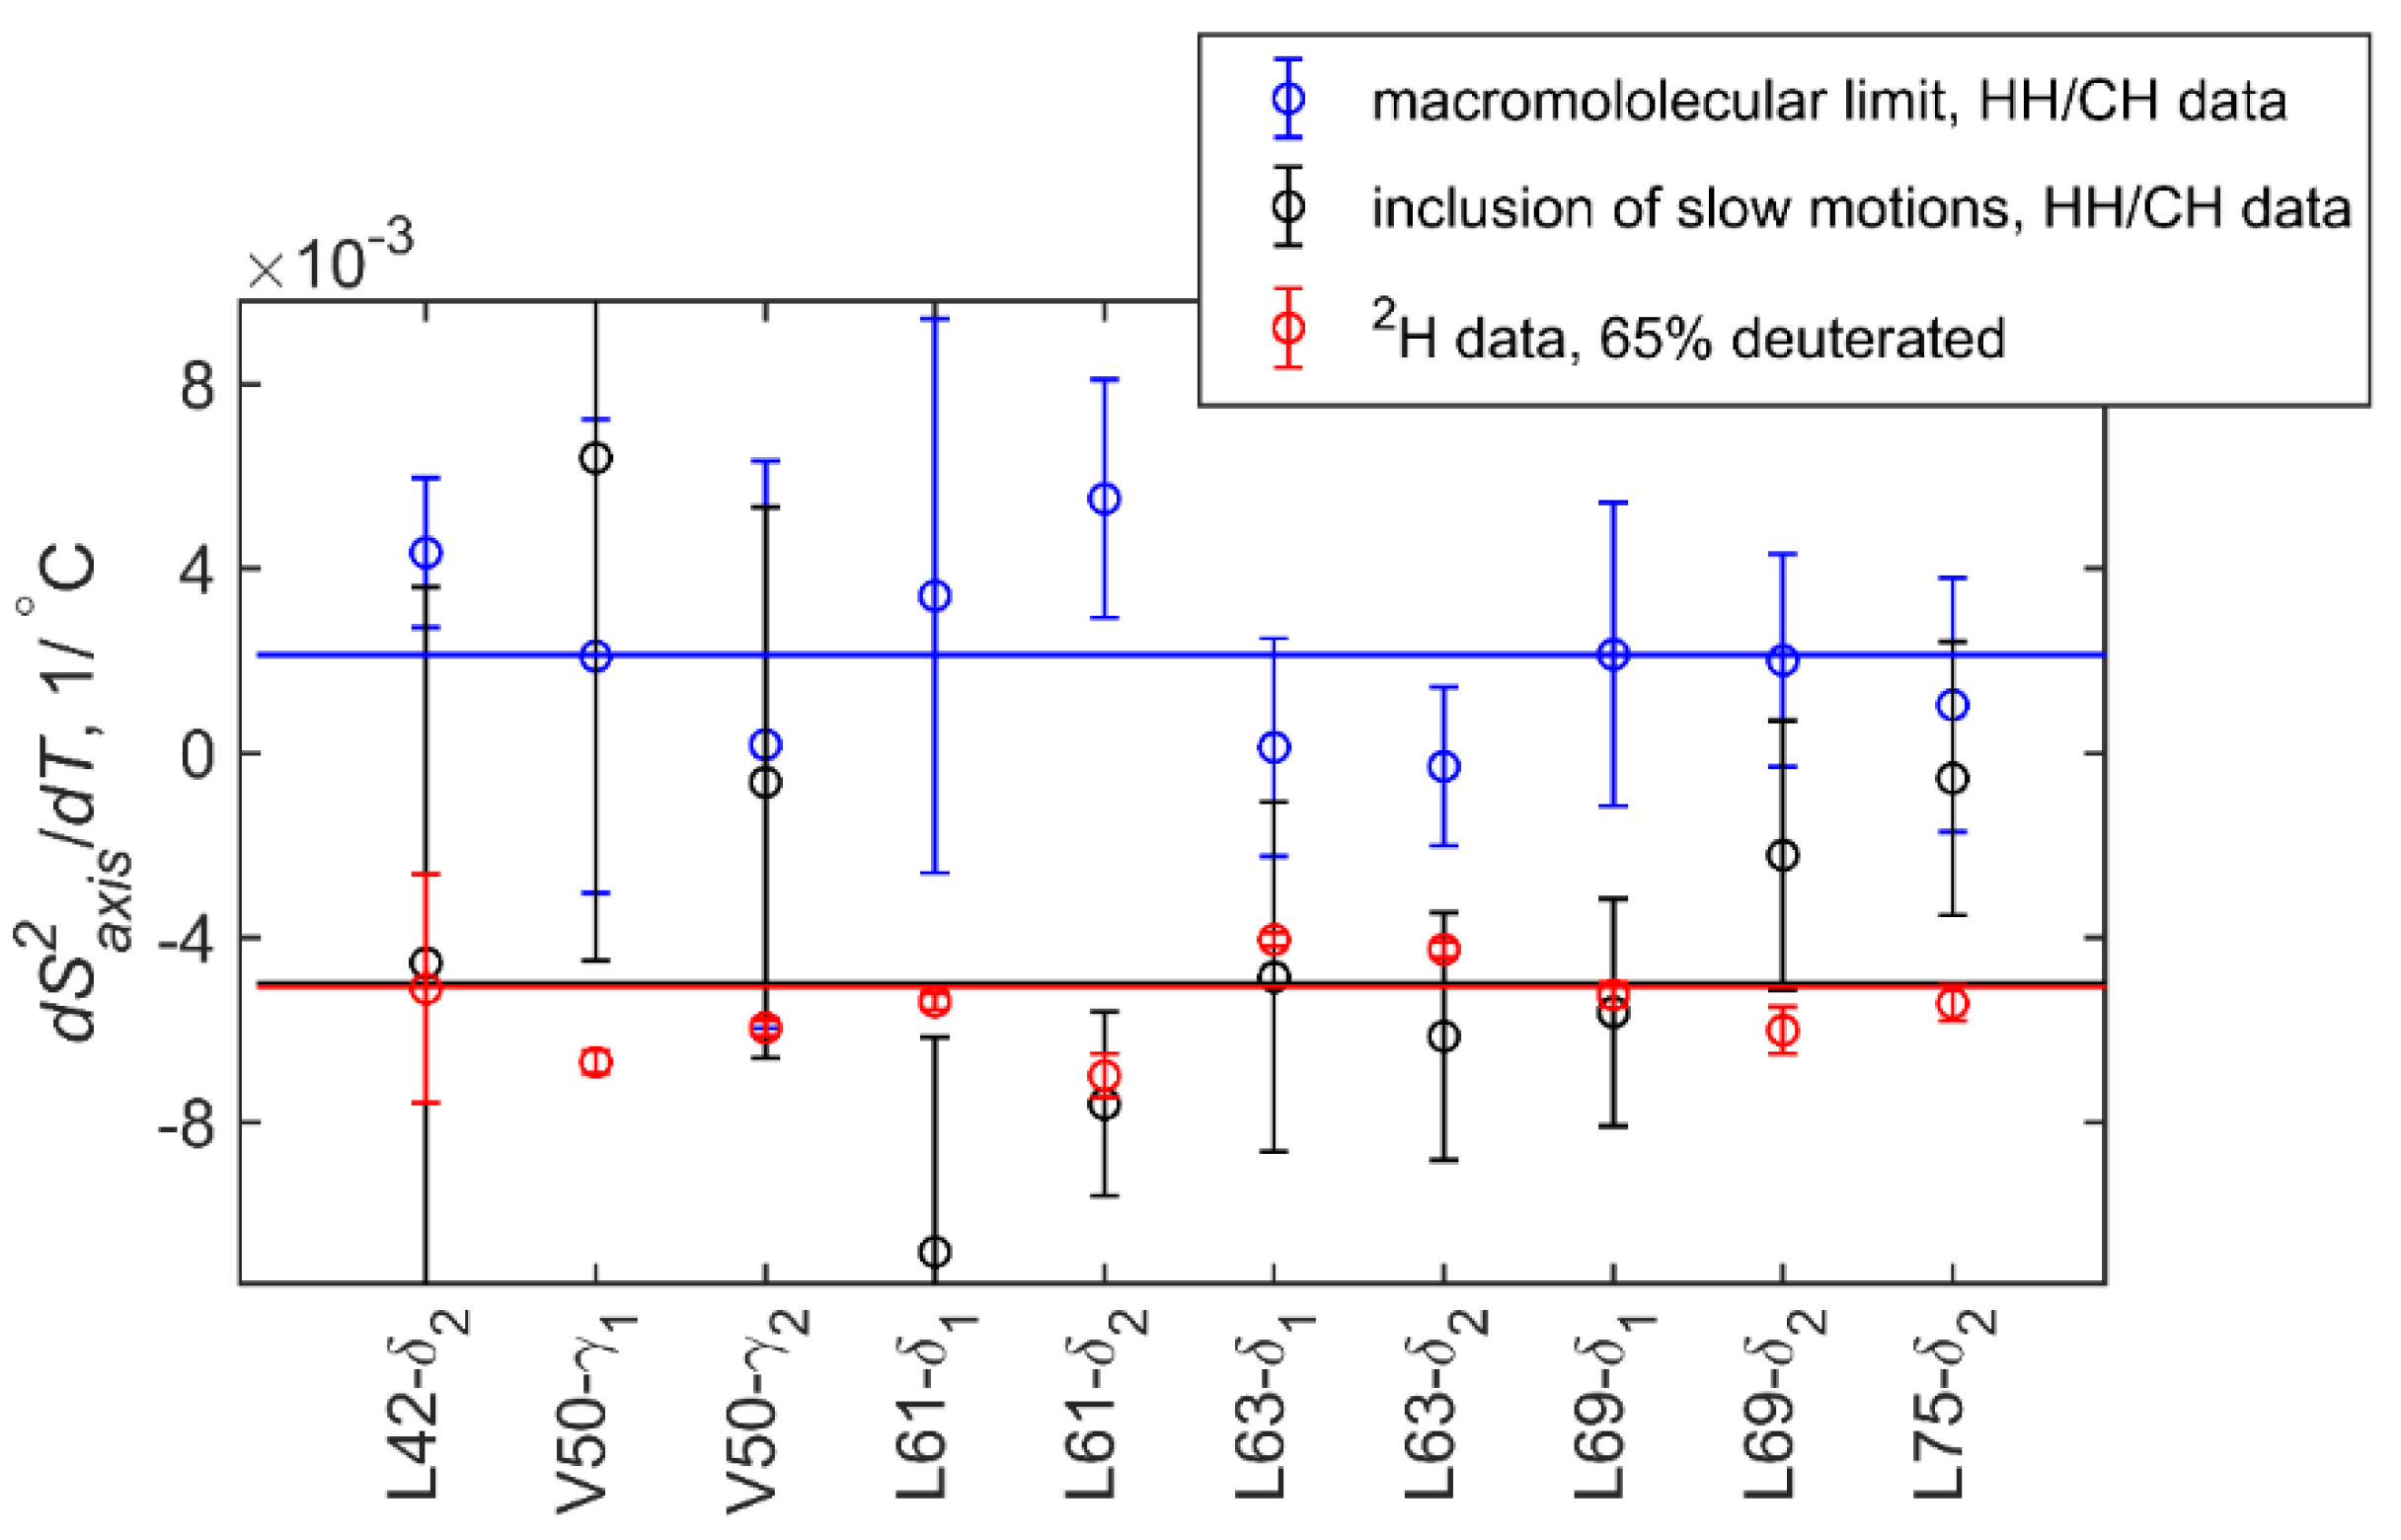
3.5. Methyl Order Parameters and Their Temperature Dependence

Sample decay curves obtained as described in Section 3.1 are shown in Figure 7 and experimental rates are listed in Table 1 and Table 2. Overlapped peaks from the methyl sites of L42-δ1 and L75-δ1 were excluded. The tumbling times for 4.5 and 28 °C data were not measured directly and were taken from the linear fits of Figure 6.
We first apply the simplest approximation of the macromolecular limit in the model-free approach of Equation (5) to obtain the methyl axes order parameters. The order parameters and their temperature dependence for this case are shown in Figure 8 in blue circles. For almost all sites there is no regular temperature dependence and for several sites the trend of the temperature dependence is counter-intuitive, with the values of S a x i s 2 increasing with temperature. This is especially apparent for V50, L61-δ1, and L63-δ2 sites. Further, for the V50 sites at the highest temperature the values of S a x i s 2 exceed 1, violating the definition of the order parameter.
The irregularities noted in the temperature dependence imply the possibility of slower motions of methyl axes that need to be taken into account outside of the macromolecular limit approximation. As the cross-correlated relaxation rate is a single measurement, the fitting procedure cannot accommodate unambiguously more than one fitting parameter and we need to make assumptions regarding the values of the correlation times τ f . According to the calculations of Figure 2 for the typical value of τ C in the 2 to 5 ns range for HP36 protein, the deviation from the macromolecular limit becomes significant when the correlation time of the methyl axis motions is above 300–500 ps, with the use of the model-free spectral density of Equation (4). We, thus, first make the simplest assumption of τ f = 500 ps for all sites at all temperatures. While this is clearly an approximation and τ f values will in reality depend on temperature, this allows us to move to a different timescale regime qualitatively, within the precision of the data. With this assumption the resulting S a x i s 2 values are shown in black in Figure 8. For most sites, the temperature dependence trends are improved, apart from the two V50 sites and L61 sites. Further, V50 sites still display order parameters larger than 1 at the highest temperature.
Thus, for V50 and L61 residues we explore the case of coupling between the overall and internal motions, given by the spectral density of Equation (6). Both methyl groups in each residue are analyzed within the same model for consistency. We perform the fits with the internal correlation times fixed at either 500 ps or 1 ns (Figure S5), and arrive at the conclusion that the 1 ns choice is needed to bring the order parameters below 1 for V50 sites, as well as obtain the expected order parameter trend with temperature for both residues, i.e., no increase in S a x i s 2 with temperature. These values of S a x i s 2 are shown in magenta in Figure 8.
As glycerol increases the viscosity of the solution and thus the overall tumbling times, measurements in the presence of glycerol in principle can help increase the timescale separation of internal and overall motions and thus extend the range of validity of Equation (4) at high temperatures. Indeed, when the ηHH/CH rates are measured in the presence of 28% w/w glycerol (Table 2) and the fits to Equations (1) and (4) are performed with τ f = 500 ps, there are no sites that display S a x i s 2 > 1 at 32 °C (Figure 9). Further, in general there is an agreement between the values of the order parameters obtained with and without glycerol (Figure 9 and Figure S6), with the exception of residues that had the potential coupling between the overall and internal motions, as described in the section above. Thus, the experimental results in the presence of glycerol support the choice of spectral density of Equation (6) for V50 and L61 sites. It is of note that coalescence of overall and internal motions was also observed for carbonyl backbone sites in HP36 at high temperatures [36].
The resulting values of the slopes of d S a x i s 2 / d T are shown in Figure 10 for either the macromolecular limit or the final choice of the models with the inclusion of slow motions. The solid lines show their corresponding weighted averages. In the macromolecular limit the temperature dependence is mostly flat, and is contrasted with the one obtained on the basis of prior 2H relaxation data for the 65% deuterated HP36 [14]. With the accounting of the slow motions, there is a good agreement in the overall temperature dependence of order parameters between the two H-H/C-H cross-correlated experiment and 2H-based relaxation data. The 2H relaxation data was fitted without the slow time scale motions of methyl axis, with all sites indicating τ f values at or below 60 ps. The reason for the different ranges of τ f presented by the two experiments is not entirely clear. The sample conditions were somewhat different in terms of their concentration and, importantly, had different levels of overall perdeuteration. We have previously shown that the full perdeuteration can have an effect on protein stability and dynamics in the third IgG-binding domain of protein G and HP36 proteins [20,37]. In this regard, follow up using 2H-based relaxation measurement on the perdeuterated sample with the introduction of LV 13CH2D isotopomers can be useful.
These types of measurements can be expected to be useful for studies of dynamics in smaller-sized protein domains connected to larger domains and/or protein complexes by flexible linkers [38,39]. The smaller-sized flexible domains can have functional methyl groups dynamics defining regulatory or interfacial properties. The above analysis highlights the need for a careful choice of spectral densities when analyzing functionable methyl axes motions in smaller-sized proteins and domains.

4. Conclusions

From a methodological perspective, we found that the method based on the interference of H-H/H-C dipolar interactions can be useful for detecting and evaluating methyl axes motions in cases with relatively similar timescales of overall tumbling and internal methyl axes fluctuations.
We have applied the technique to the HP36 protein, for which correlation times range between 2 to 5 ns in the temperature range of 2 to 32 °C, in which the protein is at least 99% folded. When the fit using the macromolecular limit was attempted, the temperature dependence of methyl axes order parameters was either mostly flat or displayed increased S a x i s 2 values at high temperatures, with the extreme case of V50 showing S a x i s 2 above the value of 1. This prompted us to step away from the macromolecular limit and employ the use of slow time scales in the 0.5–1 ns range. Further, for V50 and L61 methyl groups we have found that the spectral density model that explicitly takes into account the coupling between the overall molecular tumbling and internal motions is needed at least for high temperatures. Changing solvent viscosity with glycerol has proved to be a useful tool for separating the timescales of the two motional modes and validating the approach.

Supplementary Materials

The following supporting information can be downloaded at: https://www.mdpi.com/article/10.3390/magnetochemistry9010033/s1, Figure S1: Sample DOSY decay curves. Table S1. Diffusion coefficients D from DOSY measurements. Figure S2: Additional spectra and CSP differences in the presence and absence of glycerol. Figure S3: Tumbling times versus ŋ/T for different glycerol content. Figure S4: Inverse tumbling time versus diffusion coefficient from DOSY measurements. Figure S5: Additional methyl axis order parameters analysis obtained with Equation (6). Table S2: 15N R1 and R1ρ values. Figure S6: Comparison of order parameters with and without glycerol at 15 °C.

Author Contributions

Conceptualization, L.V. and B.V.; methodology, L.V. and B.V.; software, P.J.N. and D.O.; validation, all authors; formal analysis, all authors; investigation, all authors; resources, C.J.M., L.V. and B.V.; data curation, L.V. and B.V.; writing—original draft preparation, L.V.; writing—all authors; visualization, all authors; supervision, L.V. and B.V.; project administration, L.V.; funding acquisition, L.V., B.V. and C.J.M. All authors have read and agreed to the published version of the manuscript.

Funding

This research was funded by the National Institutes of Health (NIH) Grant 1R15-GM111681 to L.V, the NIH grant S10OD011941 to C.J.M. and the NIH grant R01GM130694 to B.V.

Institutional Review Board Statement

Not applicable.

Informed Consent Statement

Not applicable.

Data Availability Statement

All data associated with this manuscript is published in the text and Supplementary Materials.

Acknowledgments

We thank V. Tugarinov for providing Matlab scripts that facilitated theoretical calculations.

Conflicts of Interest

The authors declare no conflict of interest. The funders had no role in the design of the study; in the collection, analyses, or interpretation of data; in the writing of the manuscript; or in the decision to publish the results.

References

  1. Boswell, Z.K.; Latham, M.P. Methyl-Based NMR Spectroscopy Methods for Uncovering Structural Dynamics in Large Proteins and Protein Complexes. Biochemistry 2019, 58, 144–155. [Google Scholar] [CrossRef]
  2. Wiesner, S.; Sprangers, R. Methyl groups as NMR probes for biomolecular interactions. Curr. Opin. Struct. Biol. 2015, 35, 60–67. [Google Scholar] [CrossRef] [PubMed] [Green Version]
  3. Igumenova, T.I.; Frederick, K.K.; Wand, A.J. Characterization of the fast dynamics of protein amino acid side chains using NMR relaxation in solution. Chem. Rev. 2006, 106, 1672–1699. [Google Scholar] [CrossRef]
  4. Ishima, R.; Petkova, A.P.; Louis, J.M.; Torchia, D.A. Comparison of methyl rotation axis order parameters derived from model-free analyses of (2)H and (13)C longitudinal and transverse relaxation rates measured in the same protein sample. J. Am. Chem. Soc. 2001, 123, 6164–6171. [Google Scholar] [CrossRef]
  5. Tugarinov, V.; Ceccon, A.; Clore, G.M. Probing Side-Chain Dynamics in Proteins by NMR Relaxation of Isolated (13)C Magnetization Modes in (13)CH(3) Methyl Groups. J. Phys. Chem. B 2021, 125, 3343–3352. [Google Scholar] [CrossRef]
  6. Millet, O.; Muhandiram, D.R.; Skrynnikov, N.R.; Kay, L.E. Deuterium spin probes of side-chain dynamics in proteins. 1. Measurement of five relaxation rates per deuteron in (13)C-labeled and fractionally (2)H-enriched proteins in solution. J. Am. Chem. Soc. 2002, 124, 6439–6448. [Google Scholar] [CrossRef] [PubMed]
  7. Sun, H.; Tugarinov, V. Observation and relaxation properties of individual fast-relaxing proton transitions in [(1)(3)CH(3)]-methyl-labeled, deuterated proteins. J. Magn. Reson. 2012, 217, 100–105. [Google Scholar] [CrossRef] [PubMed]
  8. McKnight, C.J.; Doering, D.S.; Matsudaira, P.T.; Kim, P.S. A thermosTable 35-residue subdomain within villin headpiece. J. Mol. Biol. 1996, 260, 126–134. [Google Scholar] [CrossRef] [Green Version]
  9. Brewer, S.H.; Vu, D.M.; Tang, Y.F.; Li, Y.; Franzen, S.; Raleigh, D.P.; Dyer, R.B. Effect of modulating unfolded state structure on the folding kinetics of the villin headpiece subdomain. Proc. Natl. Acad. Sci. USA 2005, 102, 16662–16667. [Google Scholar] [CrossRef] [PubMed] [Green Version]
  10. De Mori, G.M.S.; Colombo, G.; Micheletti, C. Study of the villin headpiece folding dynamics by combining coarse-grained Monte Carlo evolution and all-atom molecular dynamics. Proteins-Struct. Funct. Bioinform. 2005, 58, 459–471. [Google Scholar] [CrossRef]
  11. Kubelka, J.; Chiu, T.K.; Davies, D.R.; Eaton, W.A.; Hofrichter, J. Sub-microsecond protein folding. J. Mol. Biol. 2006, 359, 546–553. [Google Scholar] [CrossRef] [PubMed]
  12. Chiu, T.K.; Kubelka, J.; Herbst-Irmer, R.; Eaton, W.A.; Hofrichter, J.; Davies, D.R. High-resolution x-ray crystal structures of the villin headpiece subdomain, an ultrafast folding protein. Proc. Natl. Acad. Sci. USA 2005, 102, 7517–7522. [Google Scholar] [CrossRef] [Green Version]
  13. Xiao, S.F.; Bi, Y.; Shan, B.; Raleigh, D.P. Analysis of core packing in a cooperatively folded miniature protein: The ultrafast folding Villin Headpiece helical subdomain. Biochemistry 2009, 48, 4607–4616. [Google Scholar] [CrossRef] [PubMed]
  14. Harpole, K.W.; O’Brien, E.S.; Clark, M.A.; McKnight, C.J.; Vugmeyster, L.; Wand, A.J. The unusual internal motion of the villin headpiece subdomain. Protein Sci. 2016, 25, 423–432. [Google Scholar] [CrossRef] [Green Version]
  15. Lipari, G.; Szabo, A. Model-Free Approach to the Interpretation of Nuclear Magnetic-Resonance Relaxation in Macromolecules. 1.Theory and Range of Validity. J. Am. Chem. Soc. 1982, 104, 4546–4559. [Google Scholar] [CrossRef]
  16. Meirovitch, E. The Slowly Relaxing Local Structure Perspective of Protein Dynamics by NMR Relaxation. Isr. J. Chem. 2014, 54, 47–59. [Google Scholar] [CrossRef]
  17. Tugarinov, V.; Liang, Z.; Shapiro, Y.E.; Freed, J.H.; Meirovitch, E. A structural mode-coupling approach to 15N NMR relaxation in proteins. J. Am. Chem. Soc. 2001, 123, 3055–3063. [Google Scholar] [CrossRef]
  18. Vugmeyster, L.; Raleigh, D.P.; Palmer, A.G.; Vugmeister, B.E. Beyond the decoupling approximation in the model free approach for the interpretation of NMR relaxation of macromolecules in solution. J. Am. Chem. Soc. 2003, 125, 8400–8404. [Google Scholar] [CrossRef]
  19. Bi, Y.; Tang, Y.F.; Raleigh, D.P.; Cho, J.H. Efficient high level expression of peptides and proteins as fusion proteins with the N-terminal domain of L9: Application to the villin headpiece helical subdomain. Protein Expr. Purif. 2006, 47, 234–240. [Google Scholar] [CrossRef] [PubMed]
  20. Nichols, P.J.; Falconer, I.; Griffin, A.; Mant, C.; Hodges, R.; McKnight, C.J.; Vögeli, B.; Vugmeyster, L. Deuteration of nonexchangeable protons on proteins affects their thermal stability, side-chain dynamics, and hydrophobicity. Protein Sci. 2020, 29, 1641–1654. [Google Scholar] [CrossRef]
  21. Ollerenshaw, J.E.; Tugarinov, V.; Kay, L.E. Methyl TROSY: Explanation and experimental verification. Magn. Reson. Chem. 2003, 41, 843–852. [Google Scholar] [CrossRef]
  22. Delaglio, F.; Grzesiek, S.; Vuister, G.W.; Zhu, G.; Pfeifer, J.; Bax, A. NMRPipe: A multidimensional spectral processing system based on UNIX pipes. J. Biomol. NMR 1995, 6, 277–293. [Google Scholar] [CrossRef]
  23. Cavanagh, J.; Fairborther, W.J.; Palmer, A.G.P.; Skelton, N.J.; Rance, M. Protein NMR Spectroscopy. Principles and Practice, 2nd ed.; Elsevier Academic Press: Cambridge, MA, USA, 2006. [Google Scholar]
  24. Johnson, C.S. Diffusion ordered nuclear magnetic resonance spectroscopy: Principles and applications. Prog. Nucl. Magn. Reson. Spectrosc. 1999, 34, 203–256. [Google Scholar] [CrossRef]
  25. Wu, D.H.; Chen, A.D.; Johnson, C.S. An Improved Diffusion-Ordered Spectroscopy Experiment Incorporating Bipolar-Gradient Pulses. J. Magn. Reson. Ser. A 1995, 115, 260–264. [Google Scholar] [CrossRef]
  26. Karlicek, R.F.; Lowe, I.J. A modified pulsed gradient technique for measuring diffusion in the presence of large background gradients. J. Magn. Reson. 1980, 37, 75–91. [Google Scholar] [CrossRef]
  27. Piotto, M.; Saudek, V.; Sklenár, V. Gradient-tailored excitation for single-quantum NMR spectroscopy of aqueous solutions. J. Biomol. NMR 1992, 2, 661–665. [Google Scholar] [CrossRef]
  28. Findeisen, M.; Brand, T.; Berger, S. A H-1-NMR thermometer suitable for cryoprobes. Magn. Reson. Chem. 2007, 45, 175–178. [Google Scholar] [CrossRef]
  29. Tugarinov, V.; Kay, L.E. Relaxation Rates of Degenerate 1H Transitions in Methyl Groups of Proteins as Reporters of Side-Chain Dynamics. J. Am. Chem. Soc. 2006, 128, 7299–7308. [Google Scholar] [CrossRef]
  30. Kay, L.E.; Torchia, D.A. The effects of dipolar cross correlation on 13C methyl-carbon T1, T2, and NOE measurements in macromolecules. J. Magn. Reson. 1991, 95, 536–547. [Google Scholar] [CrossRef]
  31. Williamson, M.P. Using chemical shift perturbation to characterise ligand binding. Prog. Nucl. Magn. Reson. Spectrosc. 2013, 73, 1–16. [Google Scholar] [CrossRef]
  32. Vugmeyster, L.; Trott, O.; McKnight, C.J.; Raleigh, D.P.; Palmer, A.G. Temperature-dependent dynamics of the villin headpiece helical subdomain, an unusually small thermostable protein. J. Mol. Biol. 2002, 320, 841–854. [Google Scholar] [CrossRef]
  33. Cheng, N.-S. Formula for the Viscosity of a Glycerol−Water Mixture. Ind. Eng. Chem. Res. 2008, 47, 3285–3288. [Google Scholar] [CrossRef]
  34. Volk, A.; Kähler, C.J. Density model for aqueous glycerol solutions. Exp. Fluids 2018, 59, 75. [Google Scholar] [CrossRef] [Green Version]
  35. Korchuganov, D.S.; Gagnidze, I.E.; Tkach, E.N.; Schulga, A.A.; Kirpichnikov, M.P.; Arseniev, A.S. Determination of protein rotational correlation time from NMR relaxation data at various solvent viscosities. J. Biomol. NMR 2004, 30, 431–442. [Google Scholar] [CrossRef]
  36. Vugmeyster, L.; Ostrovsky, D. Temperature dependence of fast carbonyl backbone dynamics in chicken villin headpiece subdomain. J. Biomol. NMR 2011, 50, 119–127. [Google Scholar] [CrossRef] [Green Version]
  37. Vugmeyster, L.; Griffin, A.; Ostrovsky, D.; Bhattacharya, S.; Nichols, P.J.; McKnight, C.J.; Vögeli, B. Correlated motions of C’–N and Cα–Cβ pairs in protonated and per-deuterated GB3. J. Biomol. NMR 2018, 72, 39–54. [Google Scholar] [CrossRef] [PubMed]
  38. Reddy Chichili, V.P.; Kumar, V.; Sivaraman, J. Linkers in the structural biology of protein-protein interactions. Protein Sci. A Publ. Protein Soc. 2013, 22, 153–167. [Google Scholar] [CrossRef] [PubMed] [Green Version]
  39. Walsh, J.D.; Meier, K.; Ishima, R.; Gronenborn, A.M. NMR studies on domain diffusion and alignment in modular GB1 repeats. Biophys. J. 2010, 99, 2636–2646. [Google Scholar] [CrossRef]
Figure 1. Ribbon diagram of HP36 protein (PDB ID: 1VII) with leucine and valine methyl groups in the otherwise perdeuterated protein are shown in a space-filling representation. The helices and the three core phenylalanine residues (black sticks), as well as N- and C-termini are labeled.
Magnetochemistry 09 00033 g001
Figure 2. Relative changes in the order parameters, ( S a p p 2 S a x i s 2 ) / S a x i s 2 , calculated with the spectral densities of Equations (4) and (6) with the input order parameter S a x i s 2 and the macromolecular limit of Equation (5), given by S a p p 2 , versus the correlation time for methyl axes motions τ f . Specific spectral densities contributions are stated in the legend.
Magnetochemistry 09 00033 g002
Figure 3. Overlay of backbone 15N-1H correlation spectra for five temperatures (A) and corresponding bar graph of chemical shift perturbations versus residue number relative to the highest temperature of 32 °C (B). The combined CSP is defined as: [31] N 15 ,   H 1   C S P = 1 2 [ 0.14 2 ( δ N ( 32   ° C ) δ N ( T ) ) 2 + ( δ H ( 32   ° C ) δ H ( T ) ) 2 ] . The data were collected using homogeneously 15N labeled and perdeuterated HP36 protein.
Magnetochemistry 09 00033 g003
Figure 4. Overlay of spectra corresponding to the smallest delay from the H-H/C-H dipole-dipole cross-correlated interference experiment for five temperatures (A) and the corresponding bar graph of chemical shift perturbations versus residue identity relative to the highest temperature of 32 °C (B). The combined CSP is defined as C 13 ,   H 1   C S P = 1 2 [ 0.3 2 ( δ C ( 32   ° C ) δ C ( T ) ) 2 + ( δ H ( 32   ° C ) δ H ( T ) ) 2 ] [31]. The data were collected using perdeuterated and LV-methyl protonated HP36 protein.
Magnetochemistry 09 00033 g004
Figure 5. Overlay of spectra at 32 °C in the absence of glycerol and in the presence of 28% w/w glycerol-d8 content for (A) backbone 15N-1H correlation and (B) smallest relaxation delay from the H-H/C-H dipole-dipole cross-correlated relaxation interference experiment. (C) backbone CSP defined as N 15 ,   H 1   C S P = 1 2 [ 0.14 2 ( δ N ( 0 %   g l y c e r o l ) δ N ( 28 %   g l y c e r o l ) ) 2 + ( δ H ( 0 %   g l y c e r o l ) δ H ( 28 %   g l y c e r o l ) ) 2 ] . (D) methyl CSP given by C 13 ,   H 1   C S P = 1 2 [ 0.3 2 ( δ C ( 0 %   g l y c e r o l ) δ C ( 28 %   g l y c e r o l ) ) 2 + ( δ H ( 0 %   g l y c e r o l ) δ H ( 28 %   g l y c e r o l ) ) 2 ] .
Magnetochemistry 09 00033 g005
Figure 6. Tumbling times τC in the perdeuterated and homogeneously 15N-labeled HP36 protein derived from average 15N R1ρ/R1 ratios at individual temperatures as a function of ŋ/T in the absence of glycerol (black) and in the presence of 28% w/w glycerol-d8 content (blue). Lines represent linear fits. The temperatures at which the data were collected are 2, 7, 15, 22, and 32 °C.
Magnetochemistry 09 00033 g006
Figure 7. Representative cross-correlated (methyl dipole-dipole Hi − Hj/Hi − C) relaxation decays for the L63-δ1 site in the absence of glycerol at all temperatures. Intensities for the fast- and slowly-relaxing components (red and blue circles, respectively) as well as the corresponding ratios (open black circles) of the two components normalized to the shortest relaxation delay of 8 ms. The curves show monoexponential fits.
Magnetochemistry 09 00033 g007
Figure 8. Methyl axis order parameters S a x i s 2 versus temperature for perdeuterated/LV protonated HP36 protein, obtained from the Hi-Hj/Hi-C dipole-dipole cross-correlated relaxation rates and fitted according to three different approaches: using the macromolecular limit of Equation (5) (blue), using the model-free spectral density of Equation (4) with τ f fixed at 500 ps (black), and using the spectral density of Equation (6) allowing for coupling between the overall tumbling and internal motions and fixing τ f at 1 ns for V50 and L61 sites (magenta).
Magnetochemistry 09 00033 g008
Figure 9. Comparison of methyl axis order parameters S a x i s 2 in the perdeuterated/LV protonated sample at 32 °C and 22 °C in absence of glycerol-d8 (black circles) and in the presence of 28% w/w glycerol (blue circles) versus site identity. The fits were done according to Equation (4) with τ f fixed at 500 ps.
Magnetochemistry 09 00033 g009
Figure 10. Comparison of slopes d S a x i s 2 d T as a function of residue identity for perdeuterated/LV protonated HP36 protein using the Hi-Hj/Hi-C cross-correlated relaxation rates and fitted either to the macromolecular limit (blue) or with the inclusion of slow motions of the methyl axes (black). The slow motions were included using the spectral density of Equation (4) and τ f   = 500 ps for all sites except for V50 and L61, for which the spectral density of Equation (6) and τ f   = 1 ns was used. The slopes for the prior data using the 65% deuterated HP36 protein characterized with 2H relaxation are shown in red.14 The solid lines represent the corresponding weighted averages.
Magnetochemistry 09 00033 g010
Table 1. List of experimental ηHH/CH rates obtained for HP36 perdeuterated/LV protonated protein in the absence of glycerol. The units are s−1.
T, °C24.5715222832
L42 δ26.0 ± 2.6 8.0 ± 1.97.6 ± 0.96.2 ± 0.73.2 ± 0.83.1 ± 0.5
V50 γ112.5 ± 3.27.5 ± 3.610.5 ± 2.410.1 ± 2.66.0 ± 0.97.1 ± 1.49.4 ± 1.1
V50 γ214.2 ± 2.112.5 ± 3.614.0 ± 1.710.3 ± 0.67.1 ± 0.87.3 ± 0.88.0 ± 0.7
L61 δ112.7 ± 0.612.0 ± 1.09.8 ± 2.26.8 ± 1.34.8 ± 0.85.8 ± 1.35.2 ± 0.6
L61 δ211.3 ± 0.98.0 ± 1.78.6 ± 0.67.6 ± 0.86.0 ± 0.24.7 ± 0.34.9 ± 0.8
L63 δ16.9 ± 1.15.4 ± 0.94.2 ± 0.62.9 ± 1.12.0 ± 0.33.4 ± 0.32.3 ± 0.4
L63 δ26.6 ± 0.67.9 ± 1.16.3 ± 0.54.2 ± 0.23.0 ± 0.32.6 ± 0.43.6 ± 0.5
L69 δ18.6 ± 1.17.9 ± 1.18.6 ± 0.56.0 ± 0.34.5 ± 0.53.8 ± 0.32.4 ± 0.7
L69 δ29.0 ± 2.19.4 ± 1.110.5 ± 1.37.7 ± 1.55.5 ± 0.24.8 ± 0.33.3 ± 0.5
L75 δ24.8 ± 2.33.5 ± 2.85.6 ± 1.33.2 ± 1.32.7 ± 0.53.2 ± 0.32.5 ± 0.9
Table 2. List of experimental η HH/CH rates obtained for HP36 perdeuterated/LV protonated protein in the presence of 28% w/w deuterated glycerol The units are s−1. At 15 °C the L75-δ2 and L42-δ2 sites are not included due to spectral overlap.
T, °C152232
L42 δ2 5.3 ± 0.86.3 ± 0.7
V50 γ111.0 ± 4.08.1 ± 0.98.3 ± 1.2
V50 γ213.1 ± 1.812.3 ± 1.49.5 ± 0.4
L61 δ111.9 ± 2.68.5 ± 0.66.1 ± 0.7
L61 δ27.7 ± 1.38.6 ± 0.29.3 ± 0.4
L63 δ16.2 ± 0.55.2 ± 0.33.0 ± 0.3
L63 δ26.2 ± 0.64.8 ± 0.53.8 ± 0.2
L69 δ19.5 ± 0.47.7 ± 0.15.0 ± 0.4
L69 δ215.9 ± 2.911.4 ± 0.77.2 ± 0.3
L75 δ2 3.6 ± 1.13.4 ± 1.1
Disclaimer/Publisher’s Note: The statements, opinions and data contained in all publications are solely those of the individual author(s) and contributor(s) and not of MDPI and/or the editor(s). MDPI and/or the editor(s) disclaim responsibility for any injury to people or property resulting from any ideas, methods, instructions or products referred to in the content.

