Extensive magnetic measurements on 21 pristine inhomogeneous commercial (Fisher) a-C samples were performed by taking 15–20 mg directly from their glass container in which they were stored for 75 years. The scattered results obtained are divided into three different groups.
3.1. Superconductivity
(1)
a-C commercial powders.
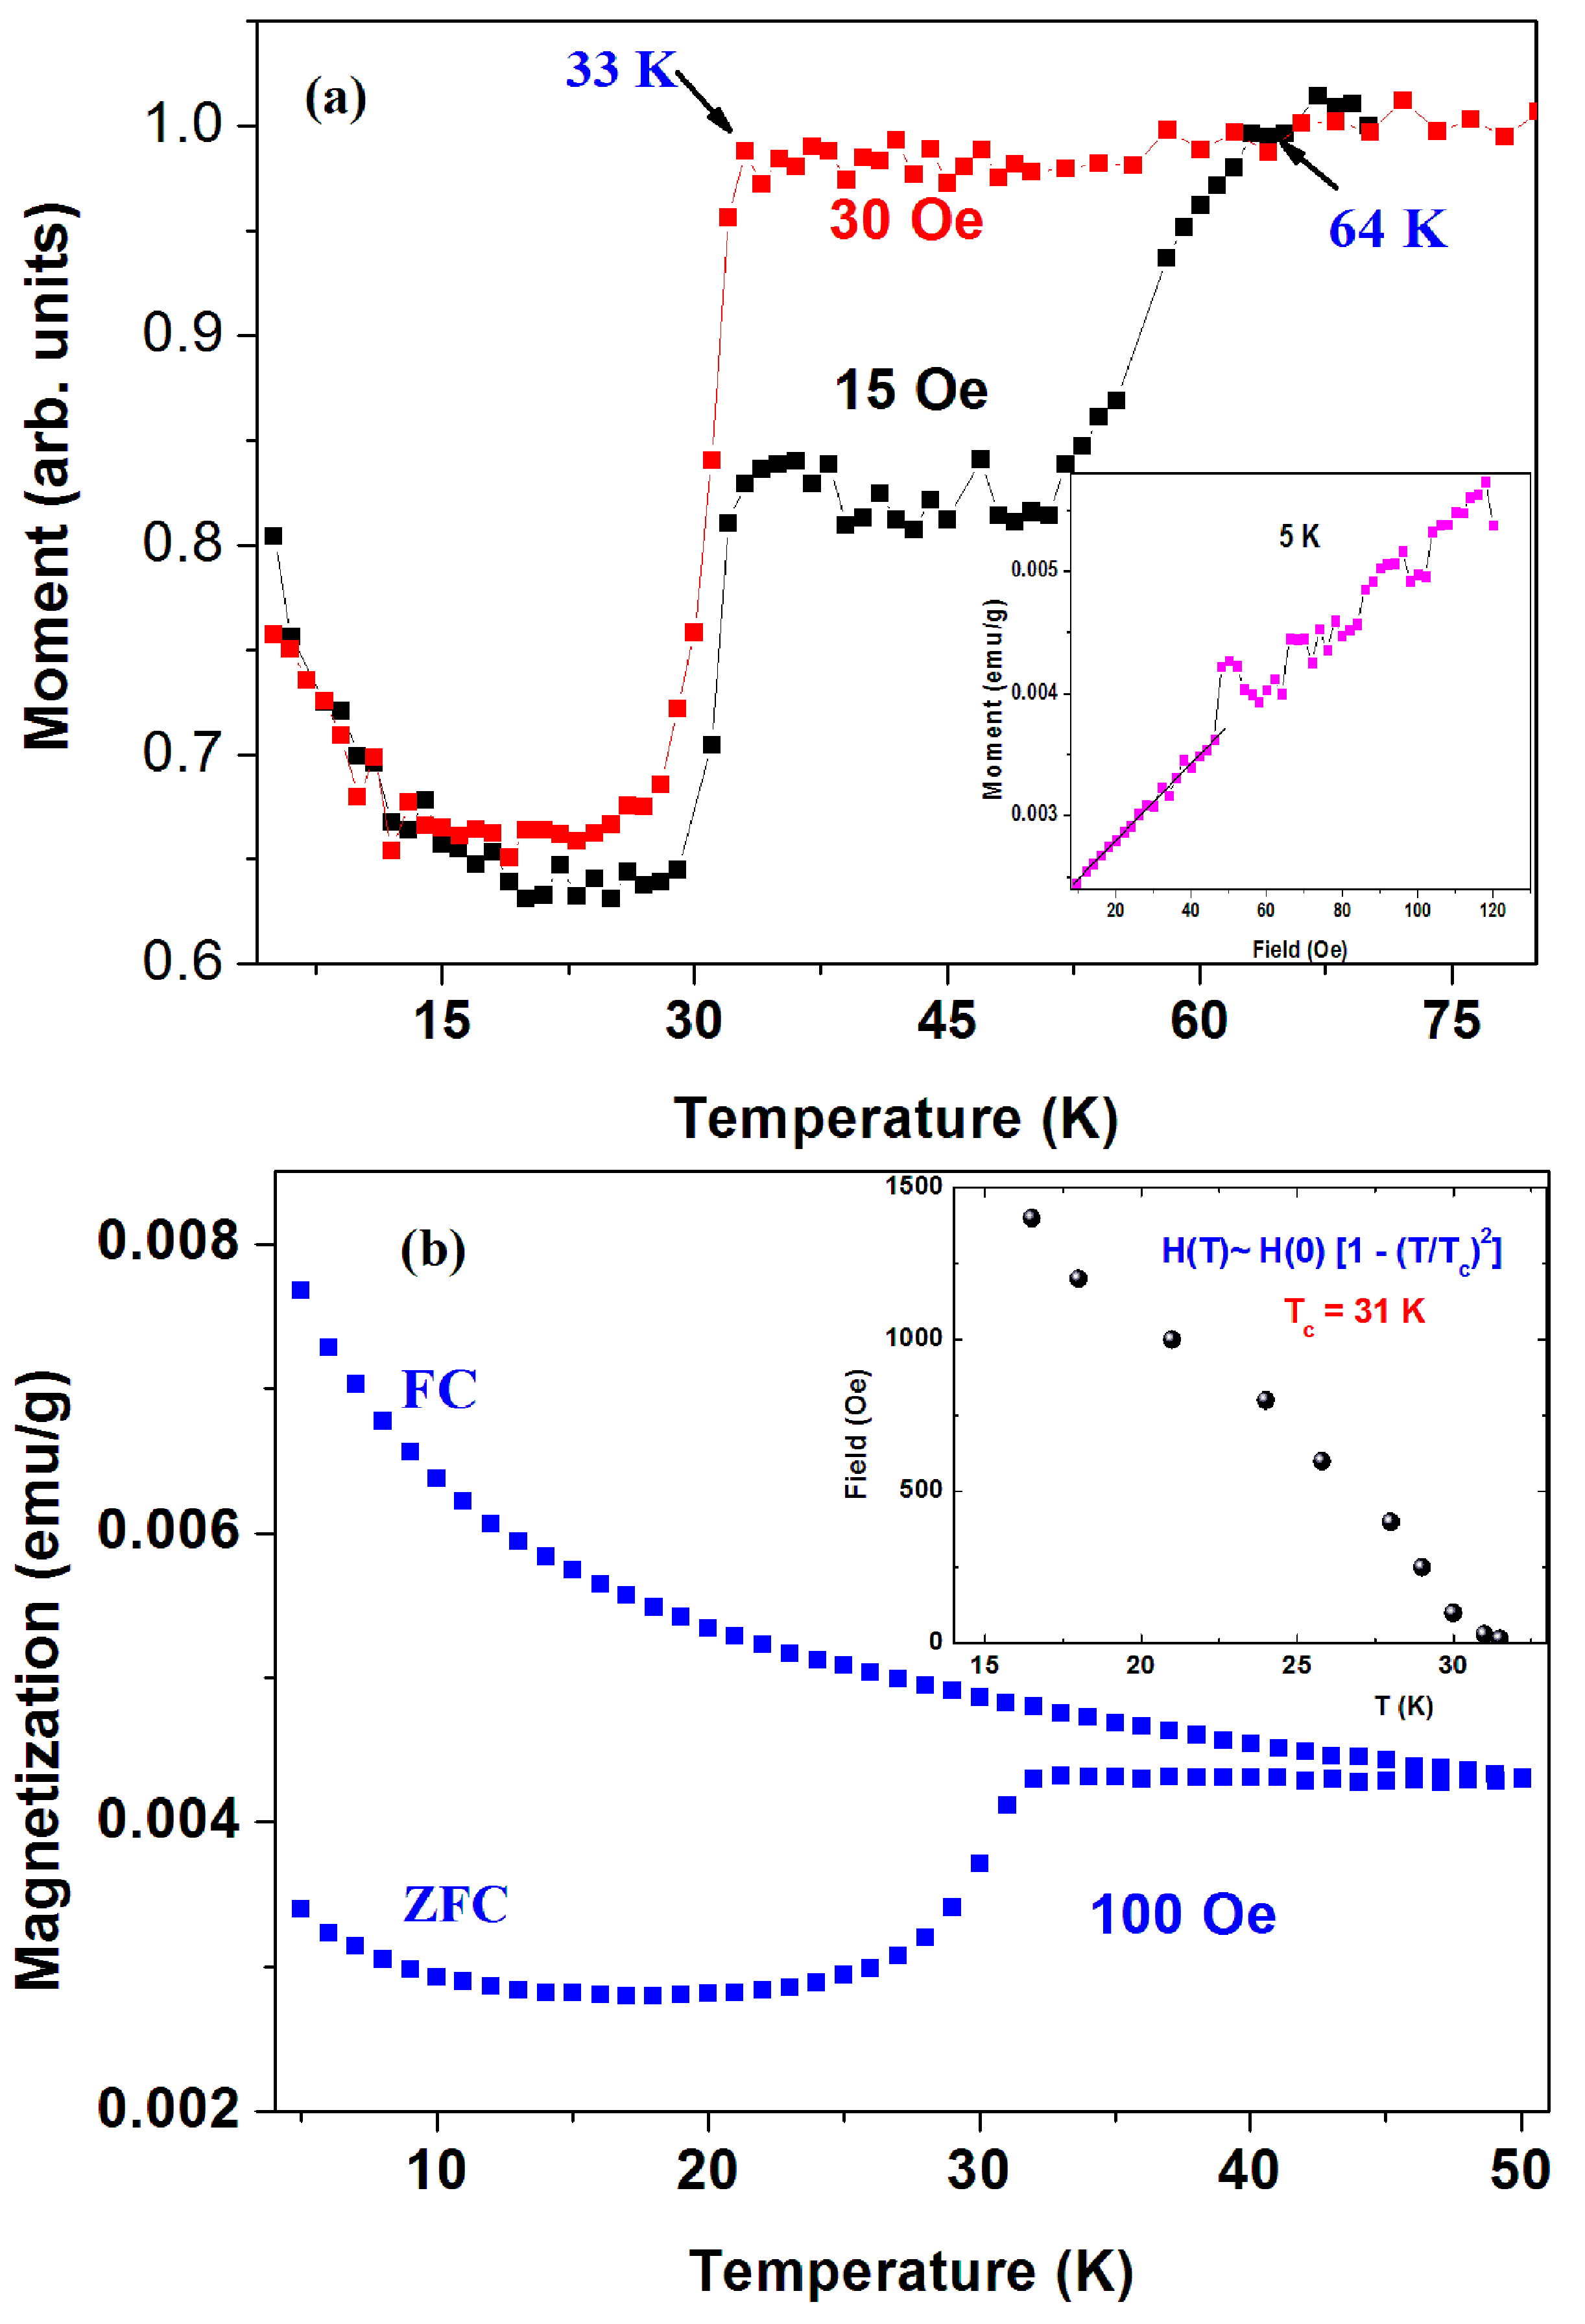
Figure 4a shows two ZFC plots (normalized at 70 K) of the pristine a-C powder (sample No. 1) measured at
H = 15 and 30 Oe. The 15 Oe curve shows two drops at 33(1) K and
Tc = 64 K(1) attributed to two SC transitions. The estimated shielding fraction (SF) below 30 K is ~ 0.03%. No corrections for the PM impurity contributions were made. Due to the inhomogeneous a-C powder, this SF value provides the lower limit for the SC volume fraction. Since the a-C powder contains 0.21 atom % of sulfur, we tend to believe that the two SC phases stem from two different a-CS phases. Due to their lower SF fractions, all attempts to isolate them and/or to determine their compositions were unsuccessful. The signature of SC at
Tc = 64 K is barely observed at
H = 30 Oe and washed out at higher applied fields. On the other hand, as expected, the lower
Tc transition shifts with
H (up to 1.5 kOe) to lower temperatures as shown in
Figure 4b (inset). For
H > 1.5 kOe, the PM magnetite impurities obscure this SC transition. Below 1.5 kOe, the variation of
Tc (or
HC2) with
H follows the conventional BCS relation:
HC2 ~ [1 − (
T/
Tc)
2] where
Tc = 31 K obtained as free parameter. Since the SC transition is not visible at higher fields, no determination of
HC2 (0) was done. Due to Fe
3O
4 and PM impurities, further characteristic parameters of the lower SC states were not evaluated. The amorphous nature the of nano-size a-C particles, we could not press the powder into pellets and therefore no resistivity and STM studies could be performed.
Figure 4a (panel inset) also shows the isothermal magnetization M
(H) curve at 5 K in which a linear increase up to ~50 Oe and instabilities at higher fields are observed. Due to the presence of ~350 ppm of Fe
3O
4, we assume that the linear M
(H) part is a superposition of the negative Meissner contribution of the SC phases and the positive linear shape of magnetite. Therefore, these instabilities presumably express the magnetic flux line penetration above
HC1 ~ 50 Oe of the SC phases. A similar curve at 10 K yields
Hc
1 of 40 Oe.
Figure 4b also shows the ZFC and FC branches for this sample measured at 100 Oe up to 50 K. The SC transition around 33 K is readily observed in the ZFC branch only. At low temperatures, both branches decrease with temperature and adhere closely to the PM Curie-Weiss (CW) law: χ(
T) = χ
0 +
C/(
T − θ), where χ
0 is the independent part of the susceptibility,
C is the Curie constant, and θ is the CW temperature. The PM parameters deduced for the FC curve are: χ
0 = 4 × 10
−5 emu/g Oe, C = 4.3 × 10
−4 emu·K/g Oe and θ = −5.8(2) K, which correspond to 0.016 μ
B/C atom.
The two SC phases at
Tc = 34(1) K and
Tc = 64(1) K were also observed separately in other a-C systems. The SC phase with
Tc = 34 K was obtained in a-C thin-films and presented later and the highest
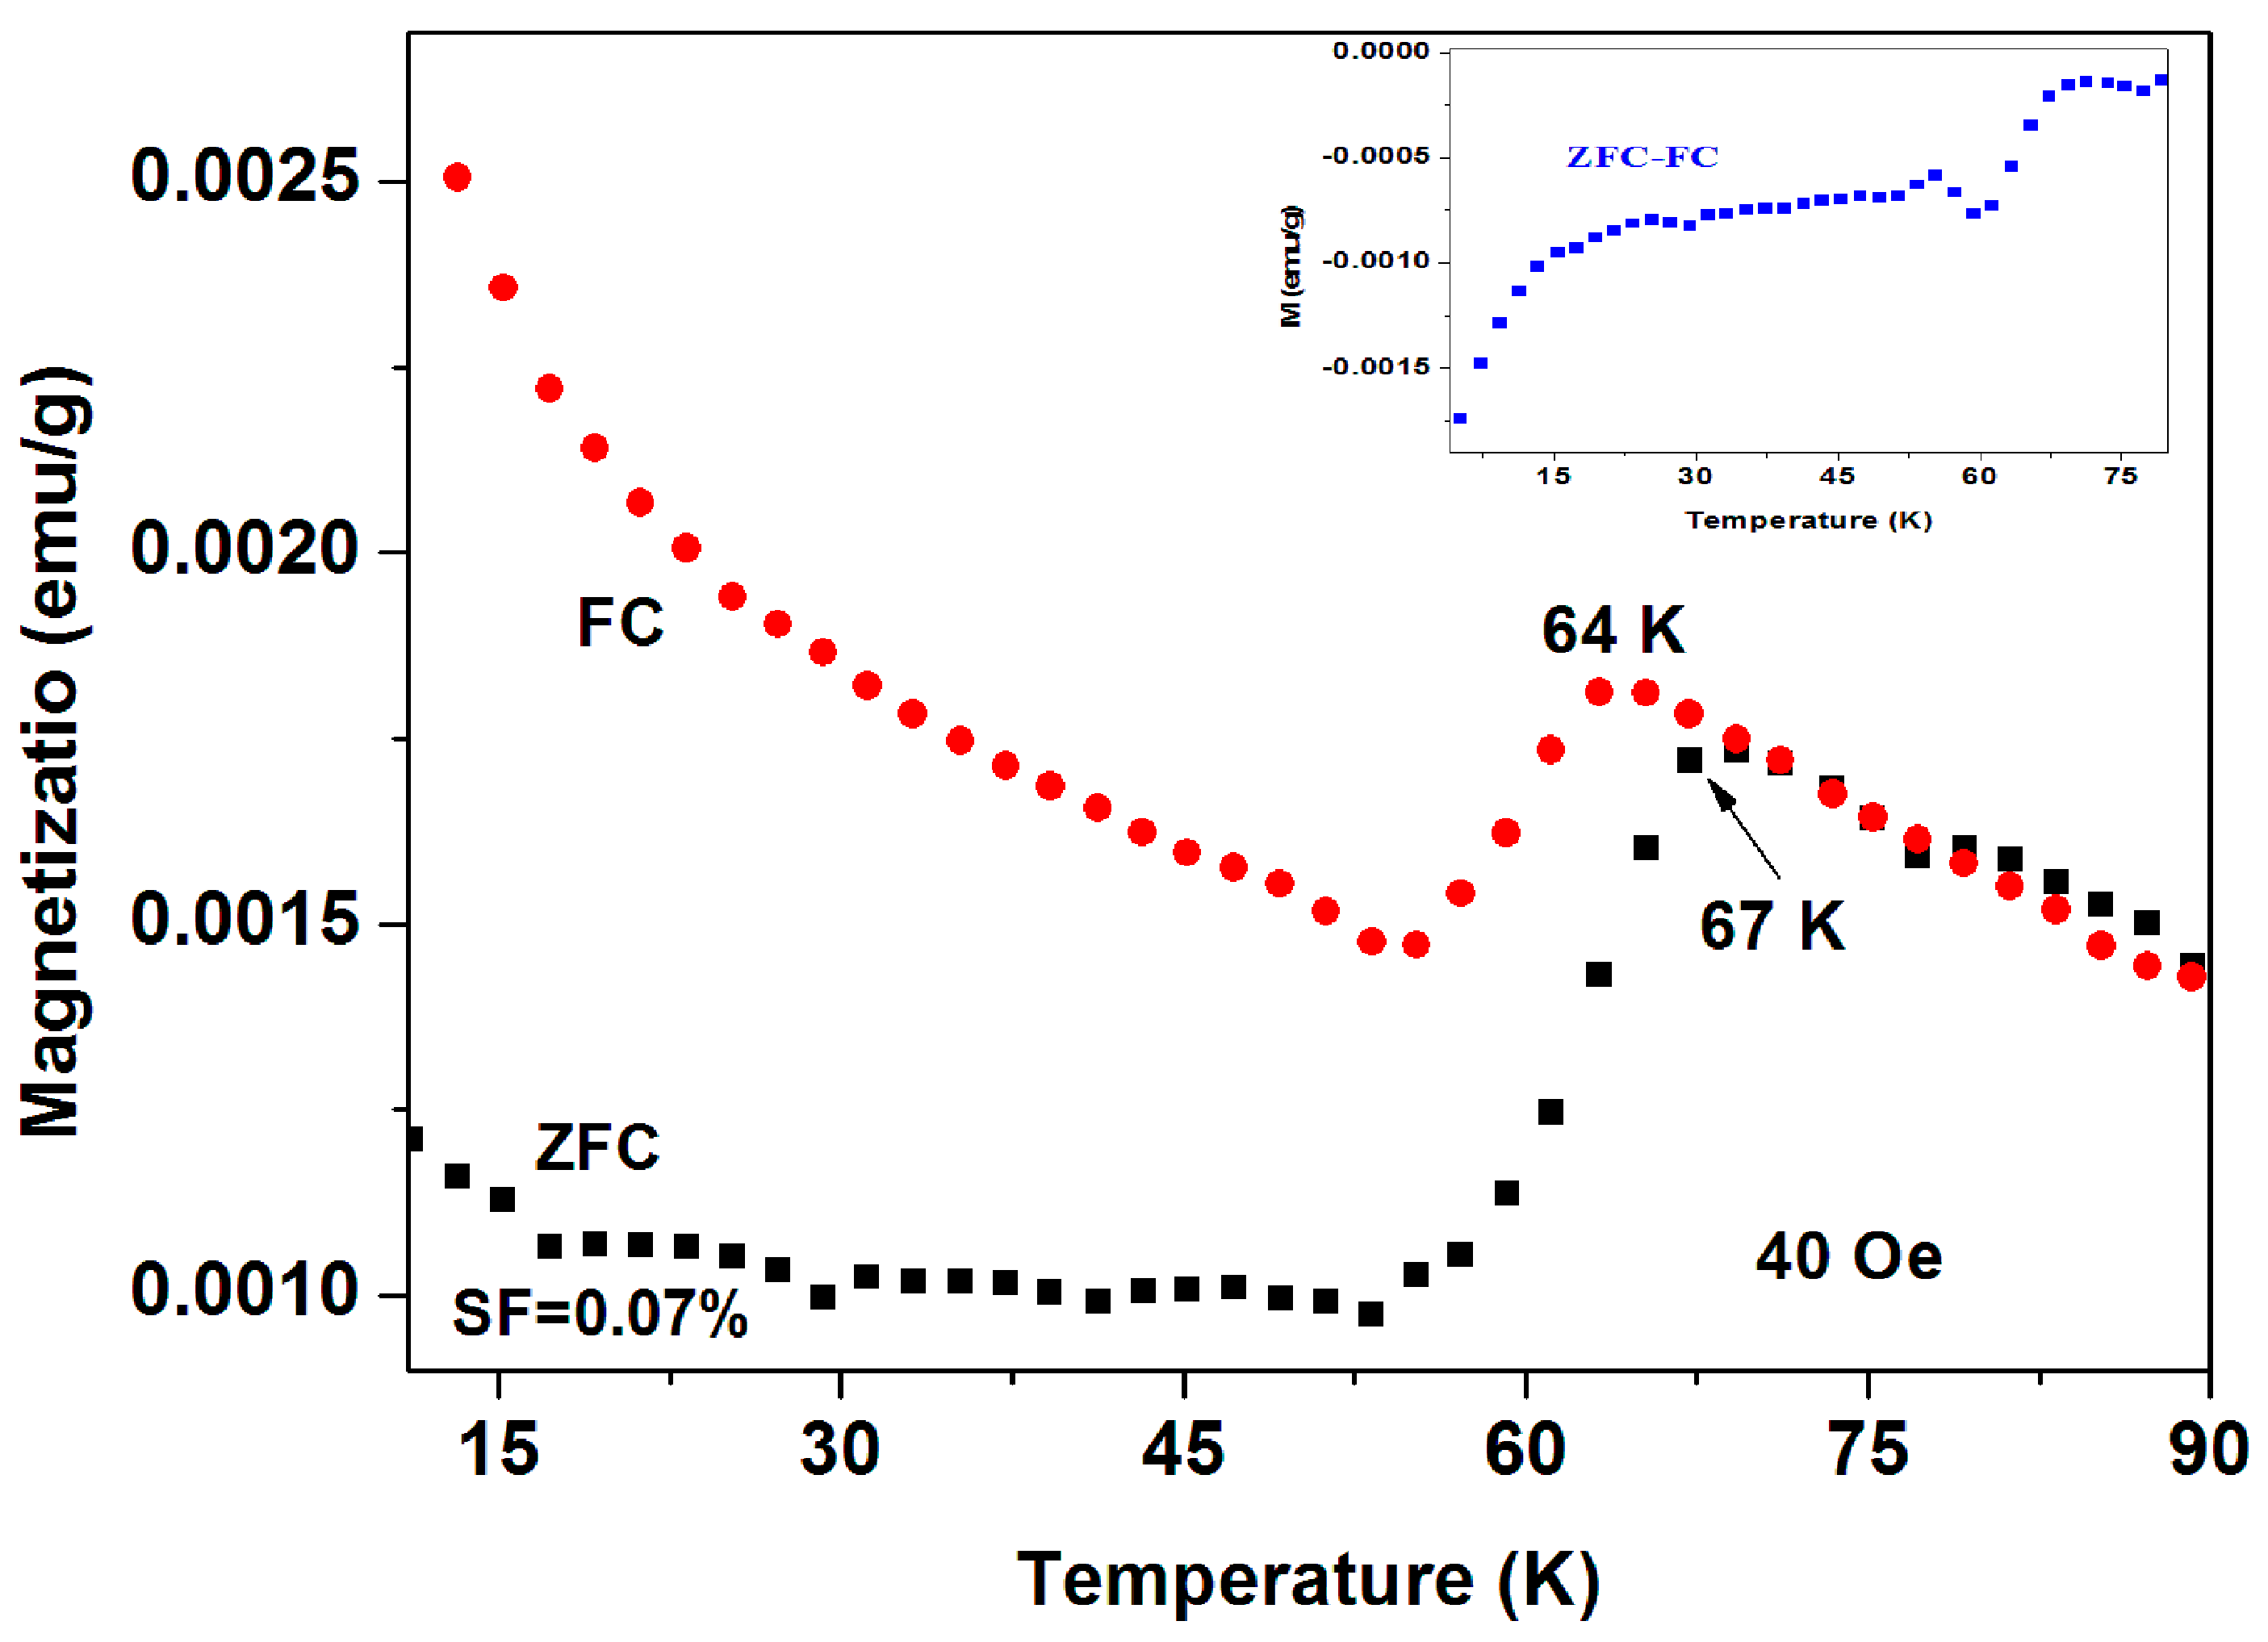
Tc = 64 K phase was observed in another a-C commercial sample (No. 18) as shown in
Figure 5 Here, the ZFC and FC plots (measured at 40 Oe) show distinct SC transitions at
Tc = 67 K and 64 K respectively. The SF = 0.07% deduced is twice as much as that of the previous sample, but still too low to determining the SC phase composition. This
Tc is highest achieved for all a-C powders reported here. In order to reduce the magnetic contributions of magnetite and the PM impurities, we show in (
Figure 5 inset) the ZFC-FC plot which becomes almost zero around 65 K. The low temperatures FC branch can be fitted with the CW law with almost similar parameters.
Commercial a-C reacted with sulfur at 250 °C (a-CS). As stated above, EDS studies showed that the pristine a-C material contains ~0.21 at % of sulfur. Bearing in mind that sulfur is essential for the SC state, an attempt to increase its content was made by mixing commercial a-C powders with sulfur (ratio 2:1) and heating the mixtures at 250 °C. It appears that also the synthesized a-CS products are inhomogeneous. That means that parts taken from the same synthesized batch may exhibit different magnetic behavior. Two a-CS samples (out of many) have shown SC signatures as follows.
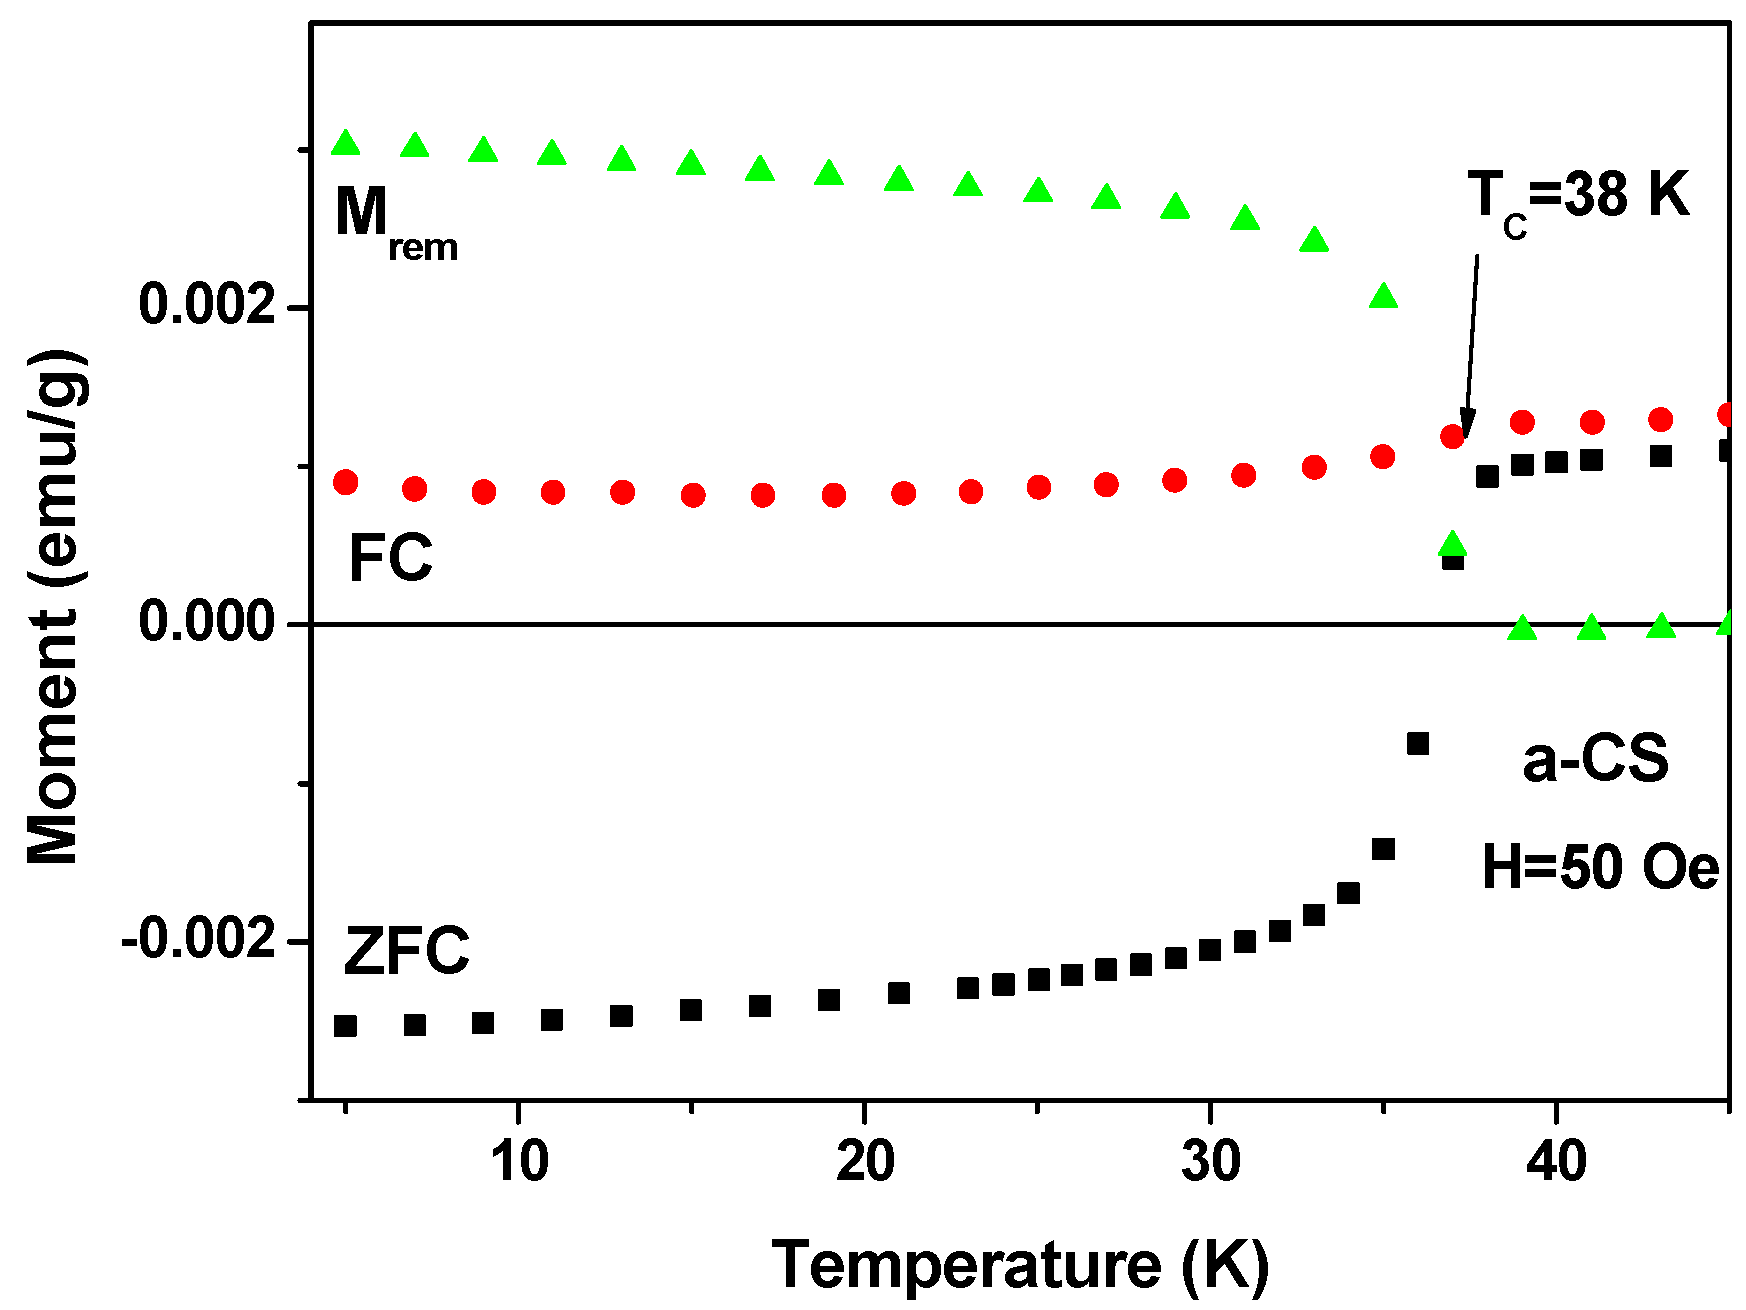
First, a-CS sample shows a clear SC transitions in both ZFC and FC branches at
Tc = 38(1) K. EDS measurements on this a-CS sample show that the sulfur content was increased to ~10.3 at %, whereas practically no change was detected for all other element concentrations. The ZFC and FC (measured at 50 Oe) and the remnant magnetization (M
rem) plots are presented in
Figure 6. M
rem was recorded after tracing the FC curve up to 50 K, cooling the sample down to 5 K, and switching off
H to zero [
3].
The pronounced step-like features in both ZFC and M
rem clearly indicate the existence of a type II SC state below
Tc = 38 ± 1 K. The estimated SF = 0.15% is higher than that obtained for pristine a-C (
Figure 4) and as a result the ZFC curve is in the negative region. Due to this higher SF, a drop at
Tc (the Meissner effect), though smaller in magnitude, is well observed in the FC branch. This drop supports the claim for bulk SC in a-CS.
(2)
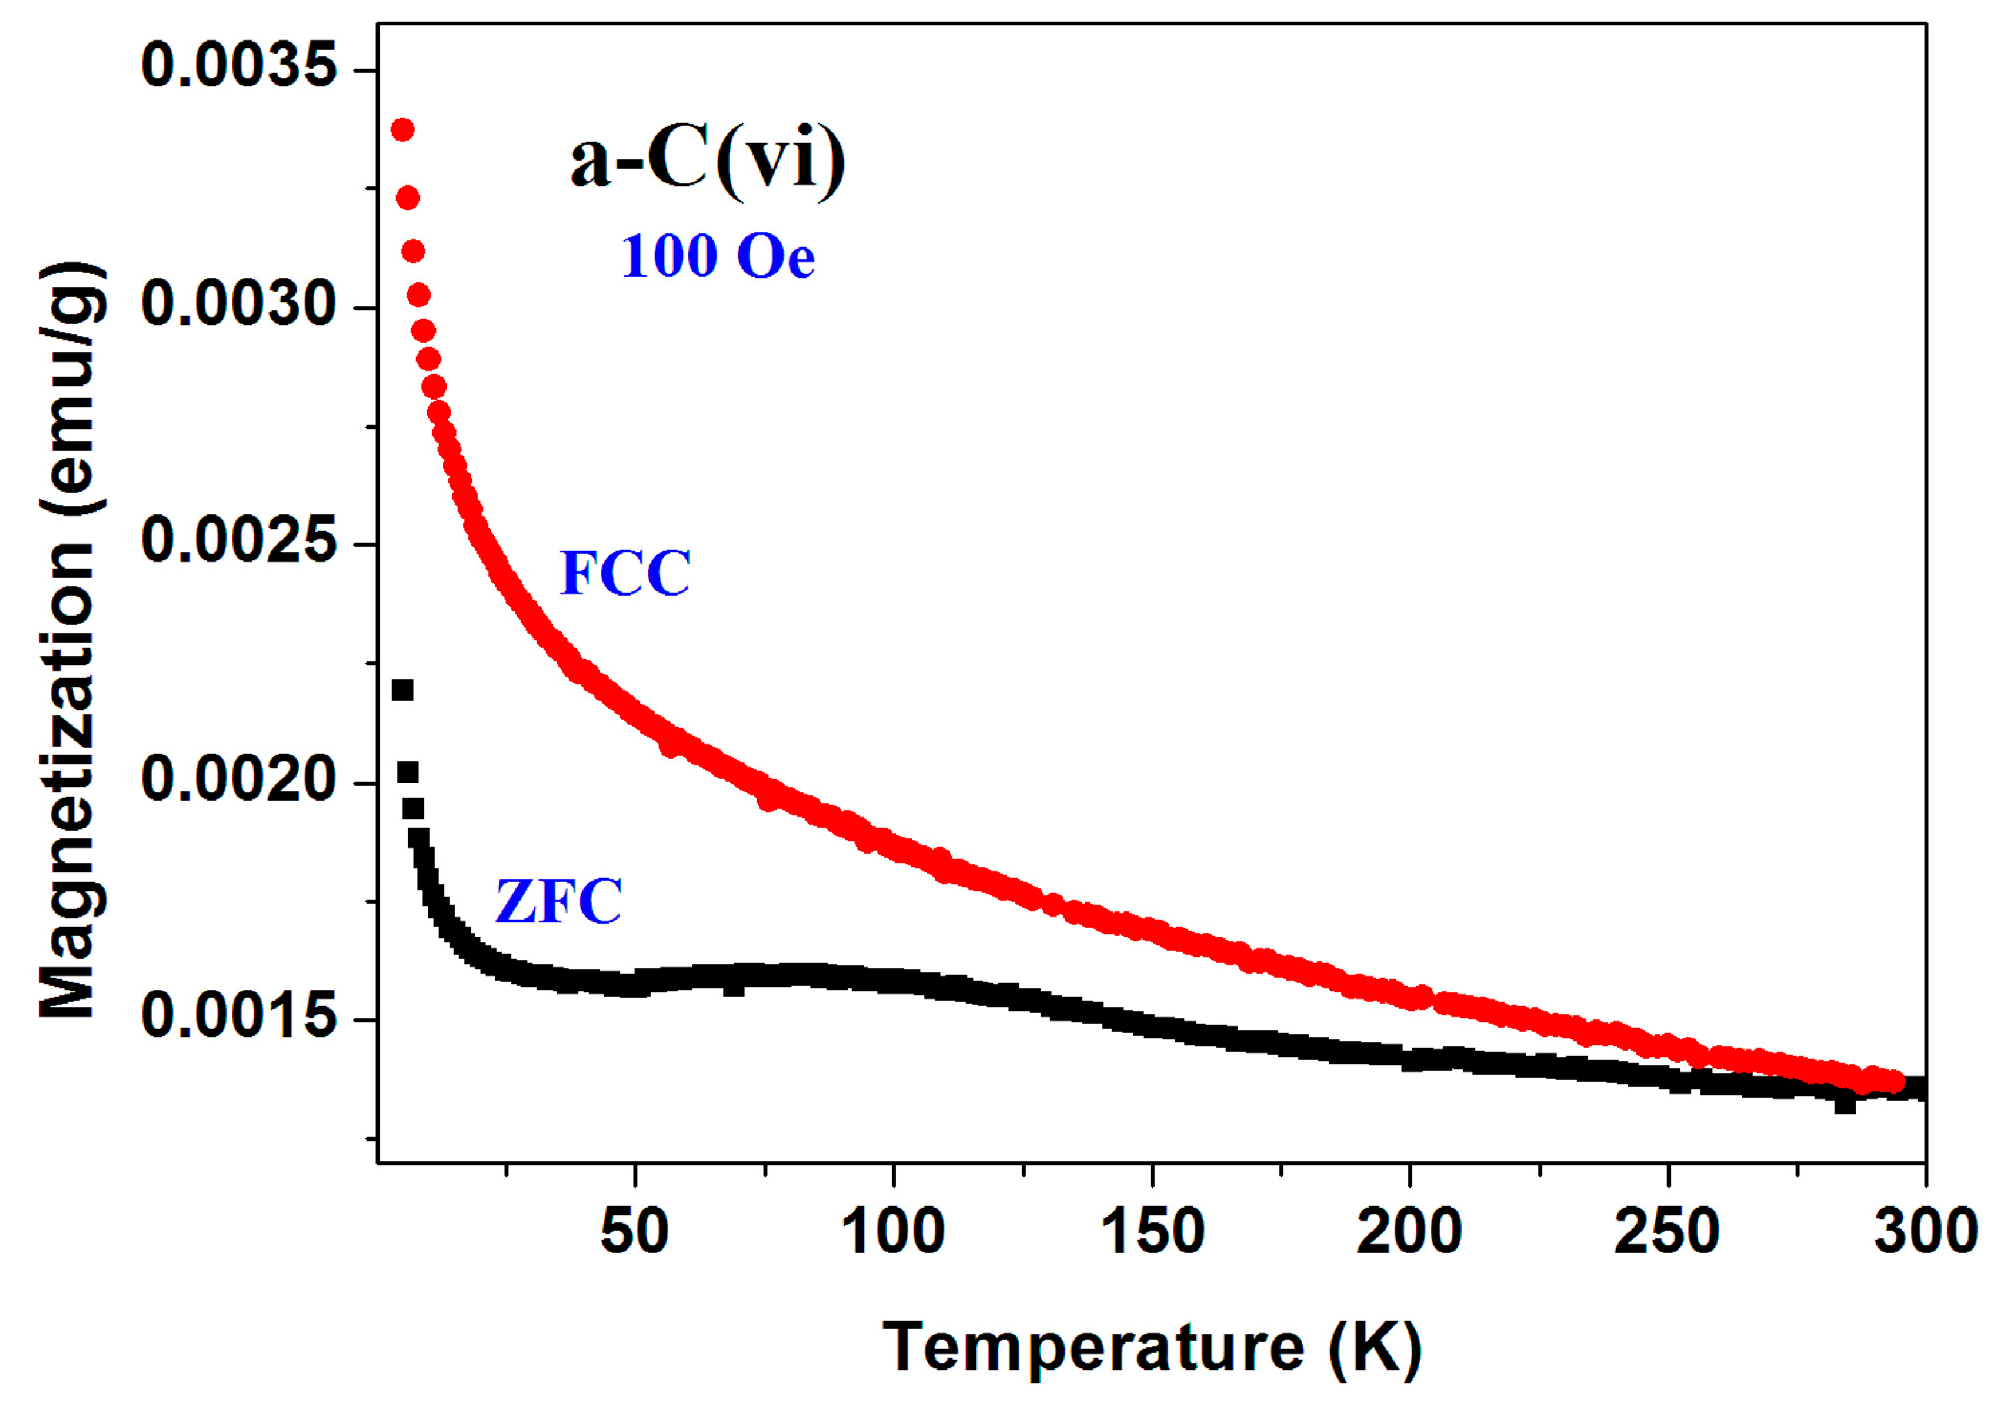
Fabricated Pyrolytic a-C powder. In contrast to the commercial a-C powder, this a-C powder was fabricated by a multi-stage pyrolytic heat treatment of pure sucrose. Here again, XRD pattern and SEM images confirmed the amorphous nature of this powder and its ZFC and FC plots (blank) are depicted in
Figure 7 (inset). This powder is basically diamagnetic. The low temperatures PM behavior is induced by tiny amount of impurities. The PM parameters values deduced for the ZFC branch by applying the CW law are: χ
0 = −4.4 × 10
−7 emu/g Oe,
C = 8.32 × 10
−6 emu K/g Oe and θ = 0.16 K. The deduced PM effective moment is ~0.007 μ
B/C, a value which is an order of magnitude lower than that for pristine commercial a-C.
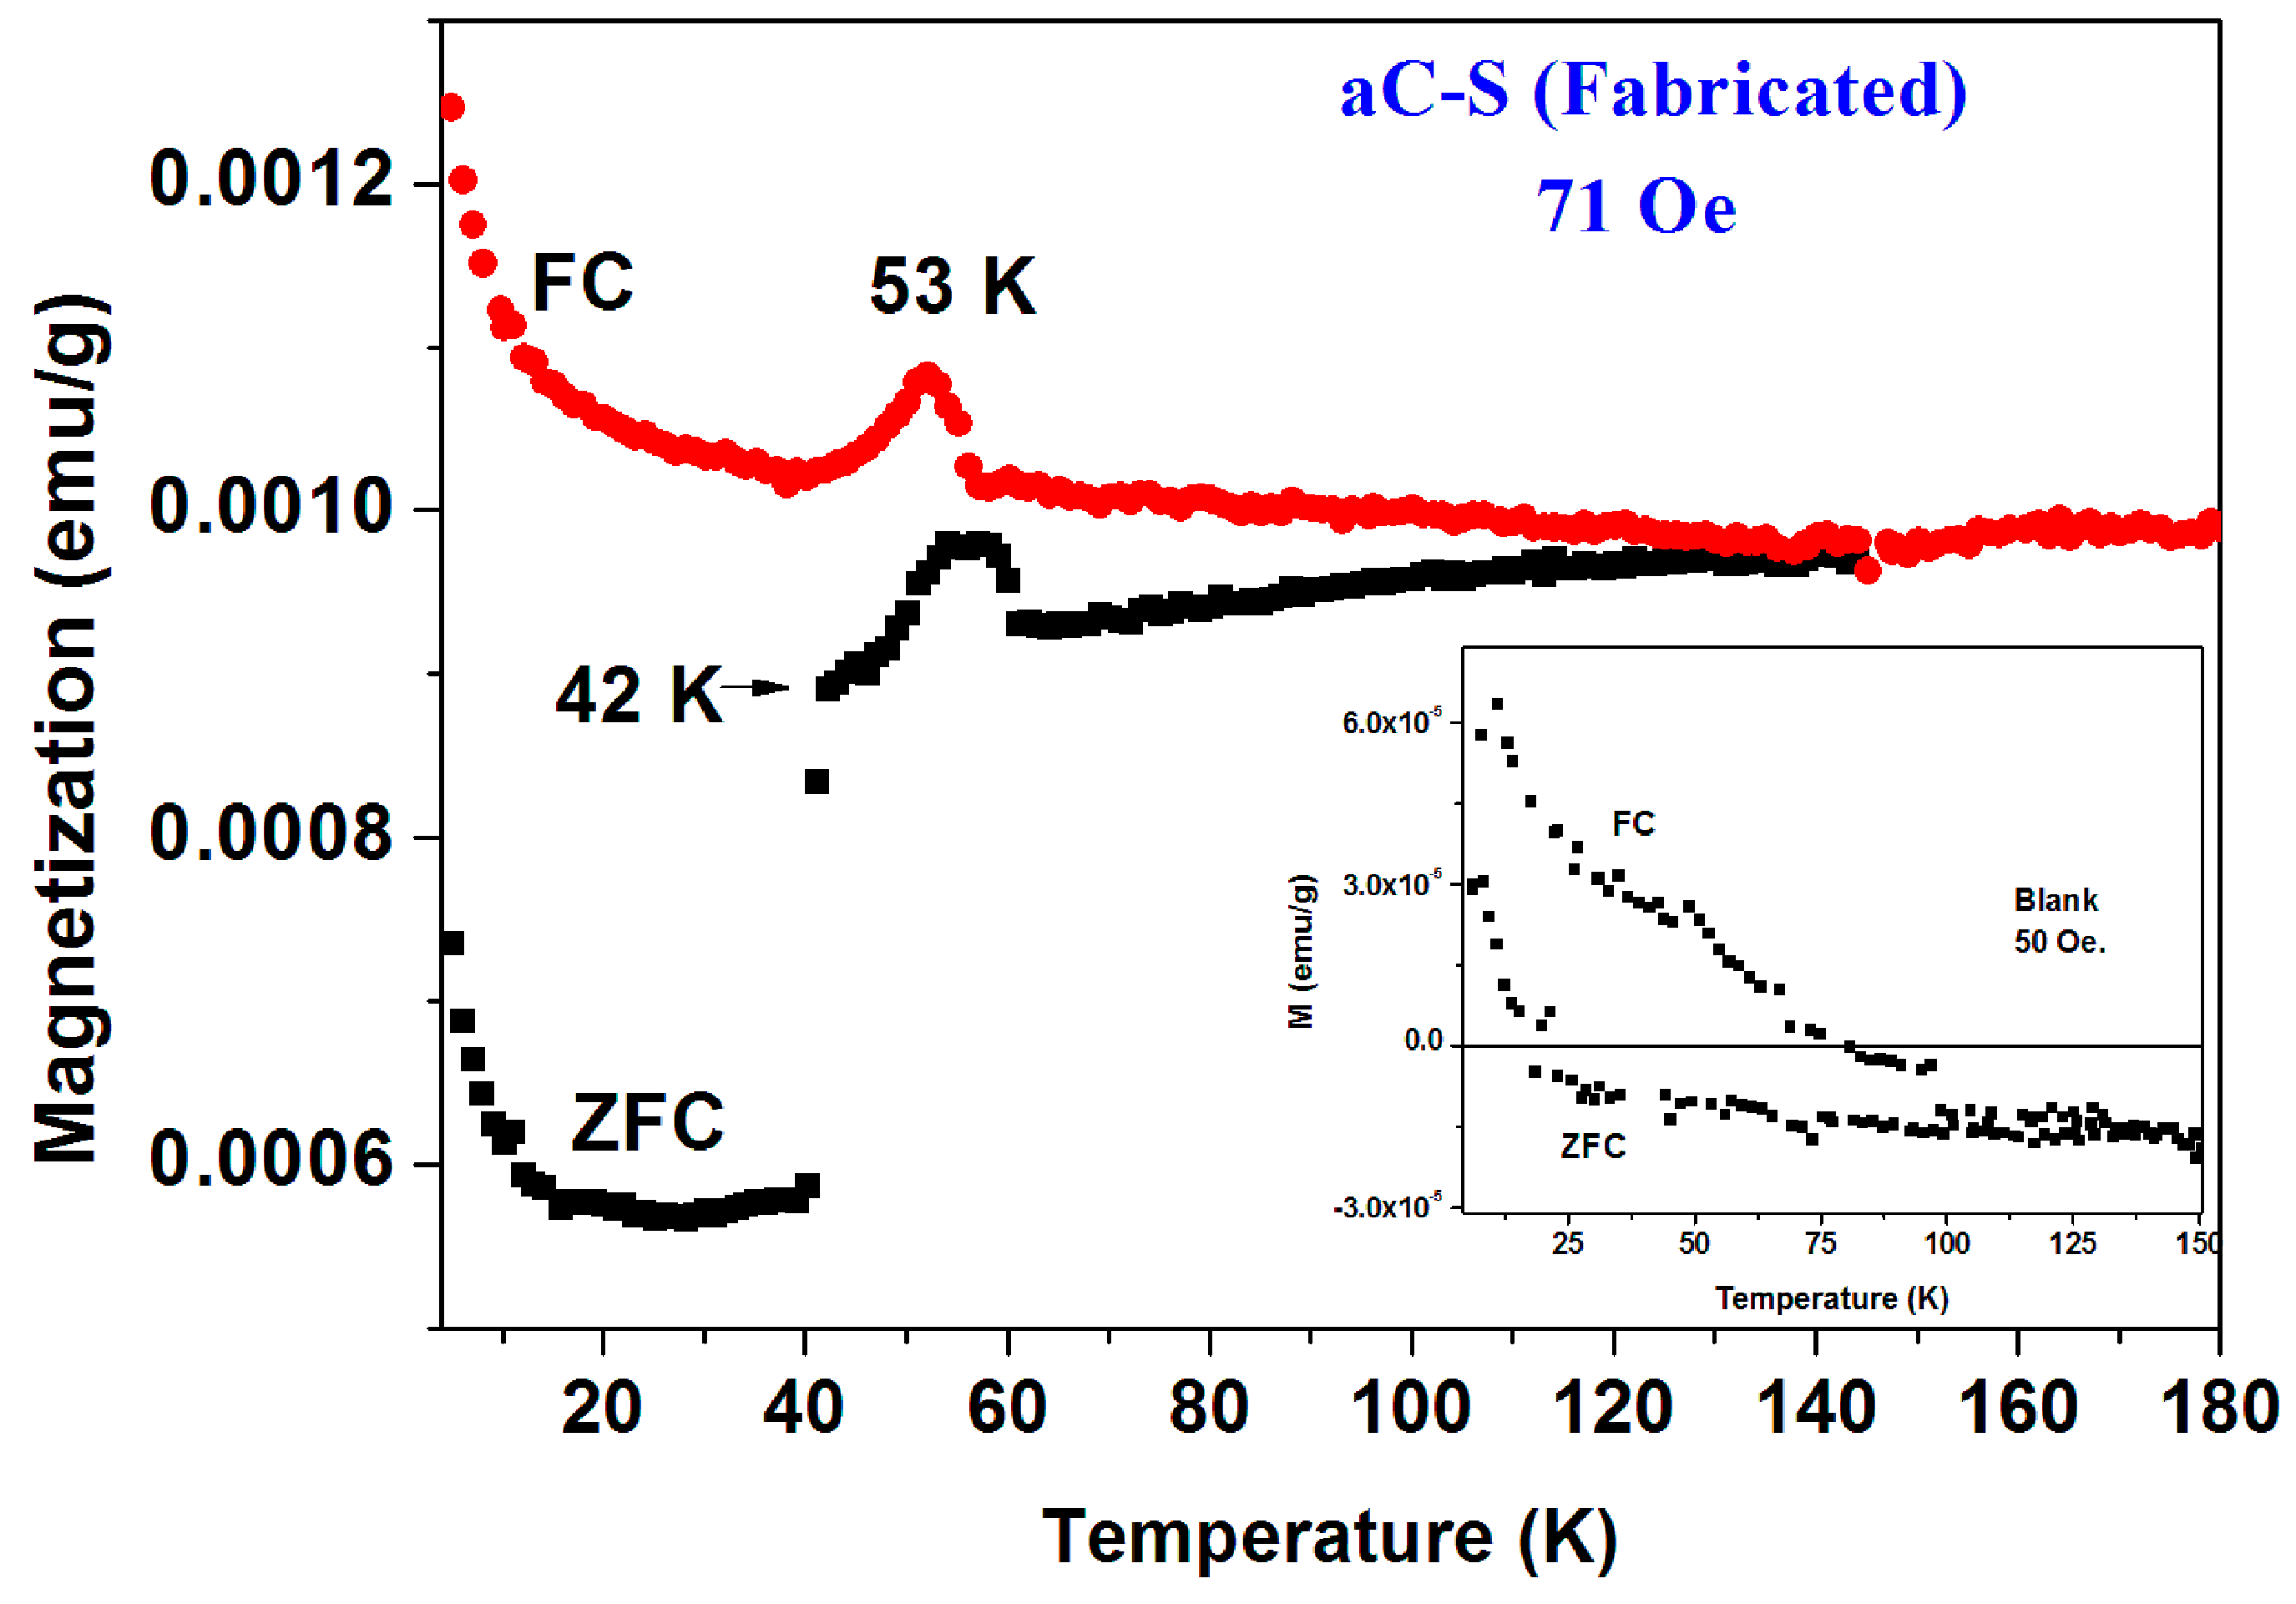
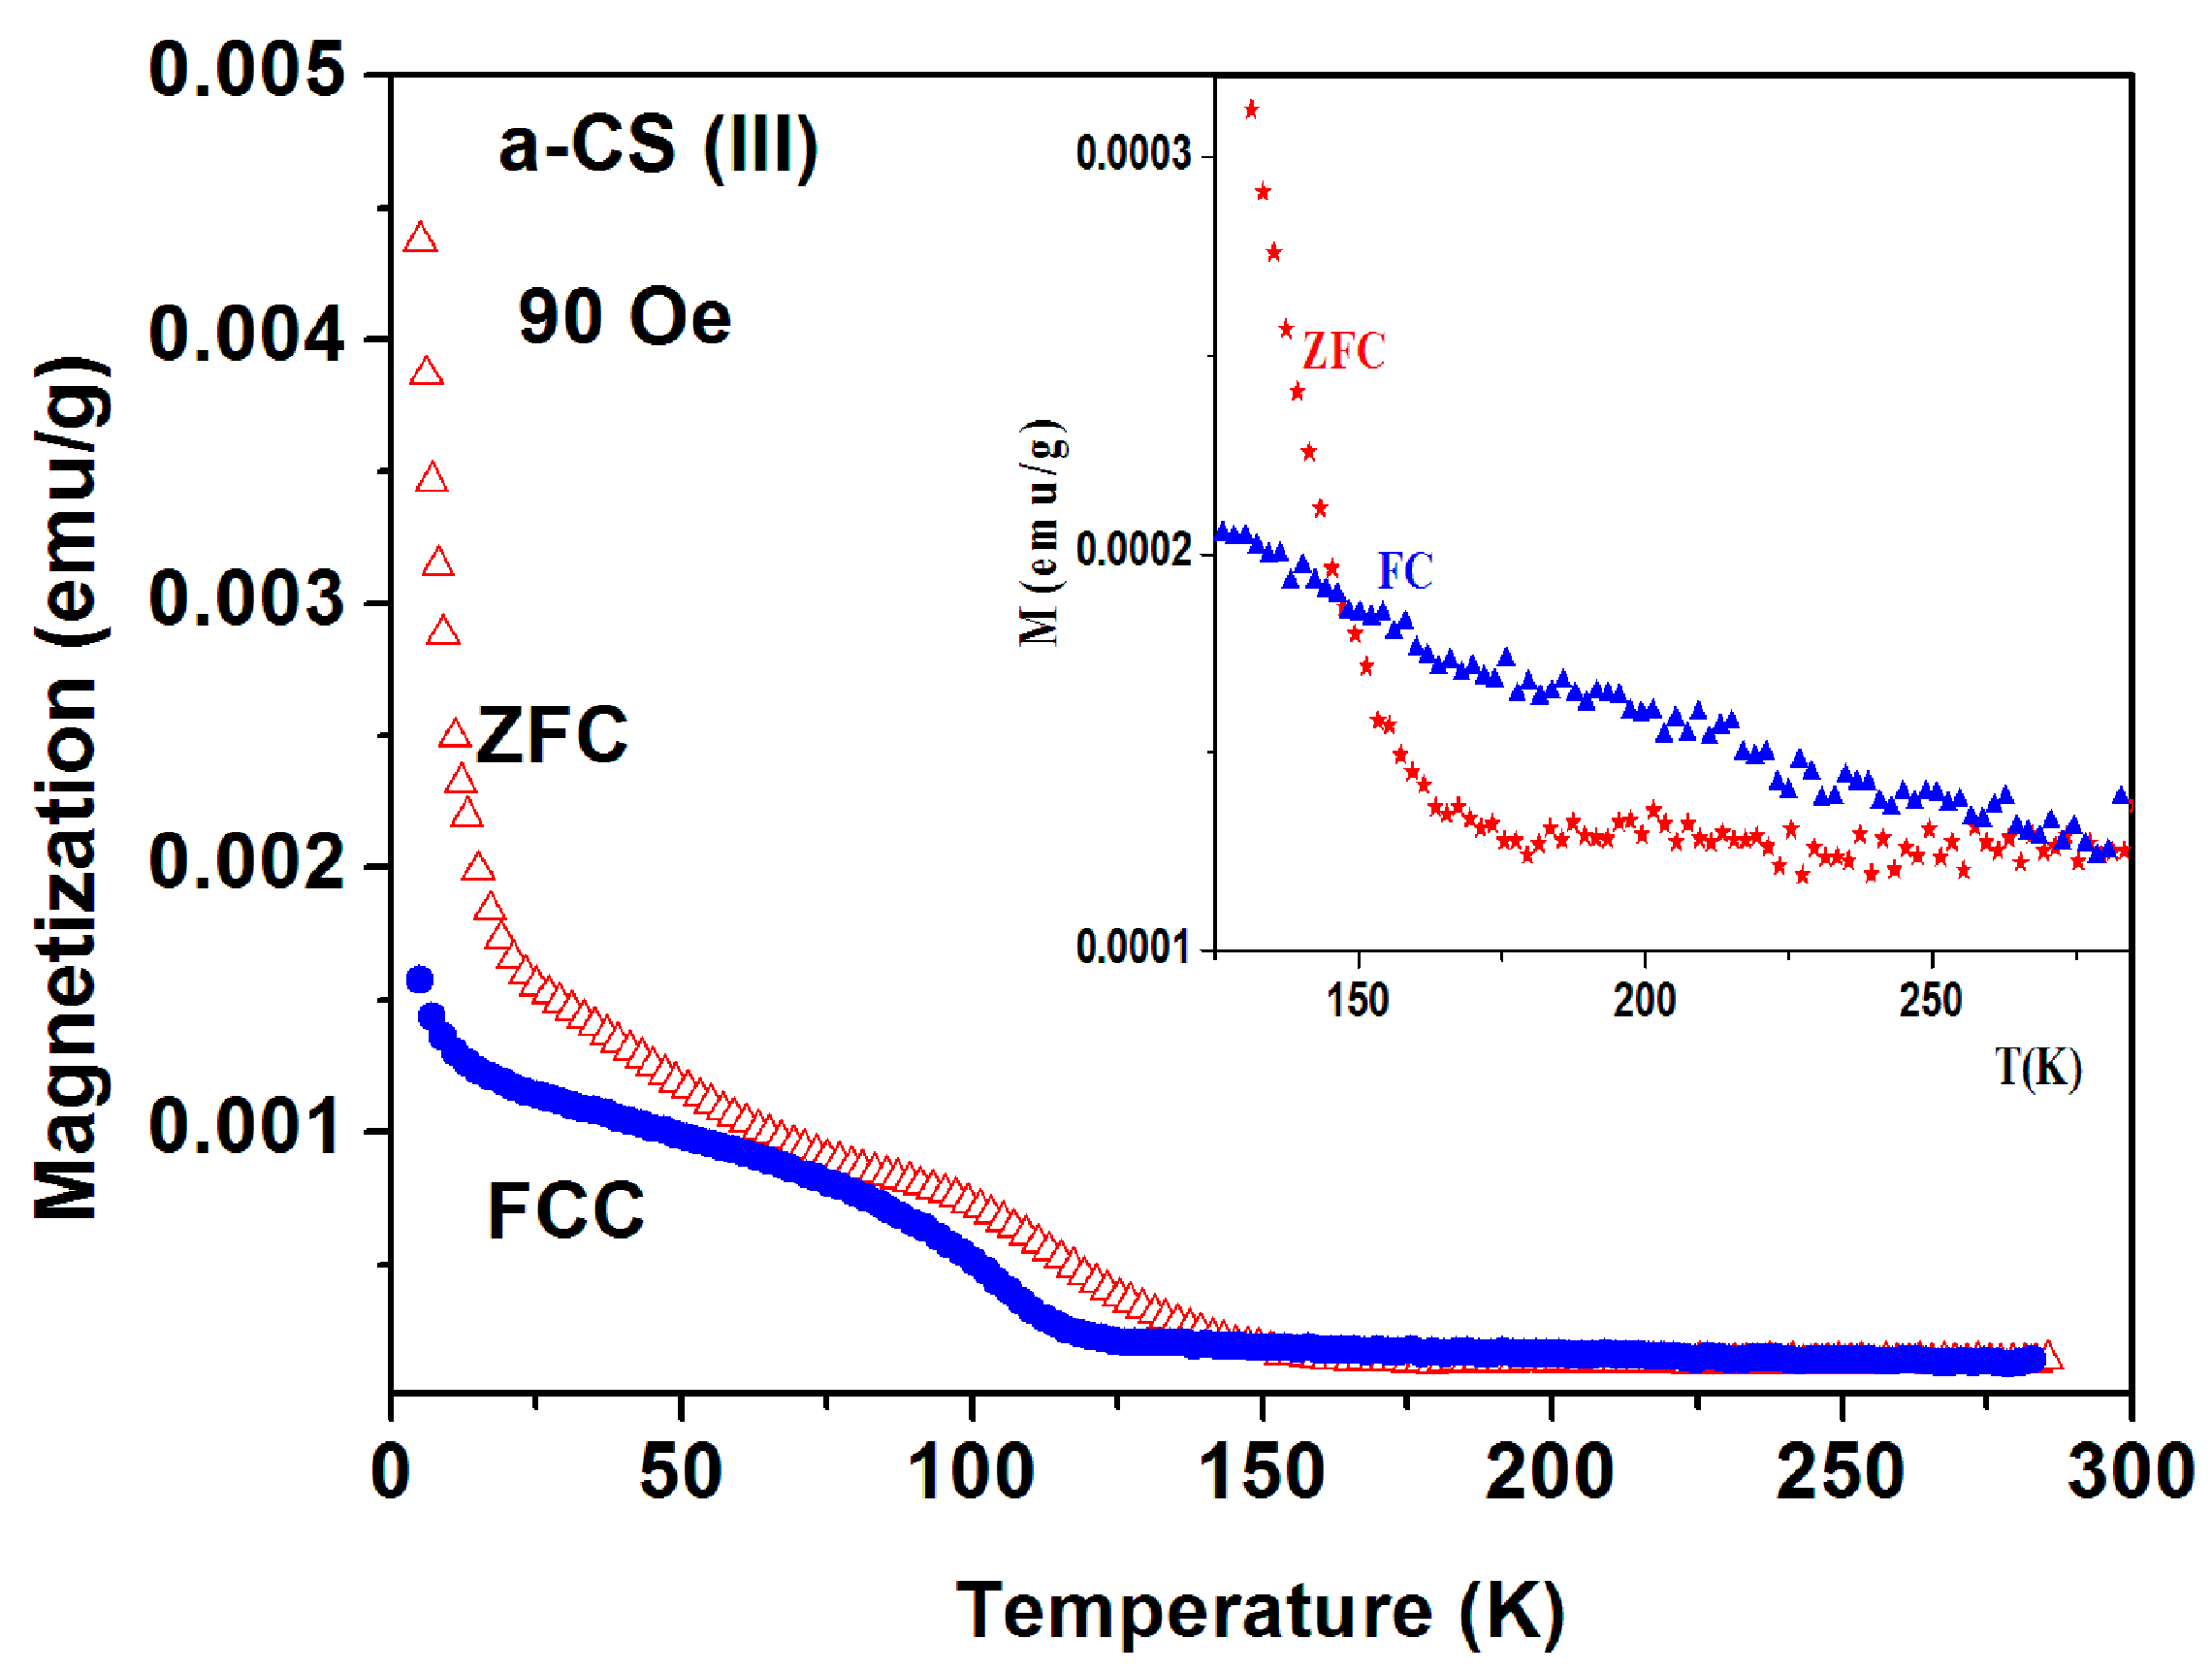
The a-CS materials were obtained by mixing this fabricated a-C powder with sulfur and heated the mixture at 250 °C and/or 380–400 °C under a protective atmosphere. Extensive magnetic measurements have been performed on many pyrolytic a-CS powders which appear to be not homogeneous and exhibits magnetic scattered results. Similar to the commercial powders, the a-CS examples may be divided into three groups. (i) Most of the samples have shown the similar magnetic behavior as presented in
Figure 2 and
Figure 3; (ii) One a-CS sample (obtained at 250 °C) showed a sign of a SC phase at
Tc = 17 K (not shown); (iii) The rest exhibited pronounced peaks at 50–60 K in their first ZFC curves as described later. A second stage of heating at 380 °C for 3 h, yields a SC phase at
Tc = 42 K its SF is around 0.02% (
Figure 7). The lower positive PM moments are caused by PM impurities. The peaks at 53 K in both ZFC and FC branches (
Figure 7) are related to the spontaneous magnetic order of solid oxygen which apparently has been detected by the EDS studies. It is important to note that the presence of oxygen appears as peaks in
both ZFC and FC branches [
28].
(3)
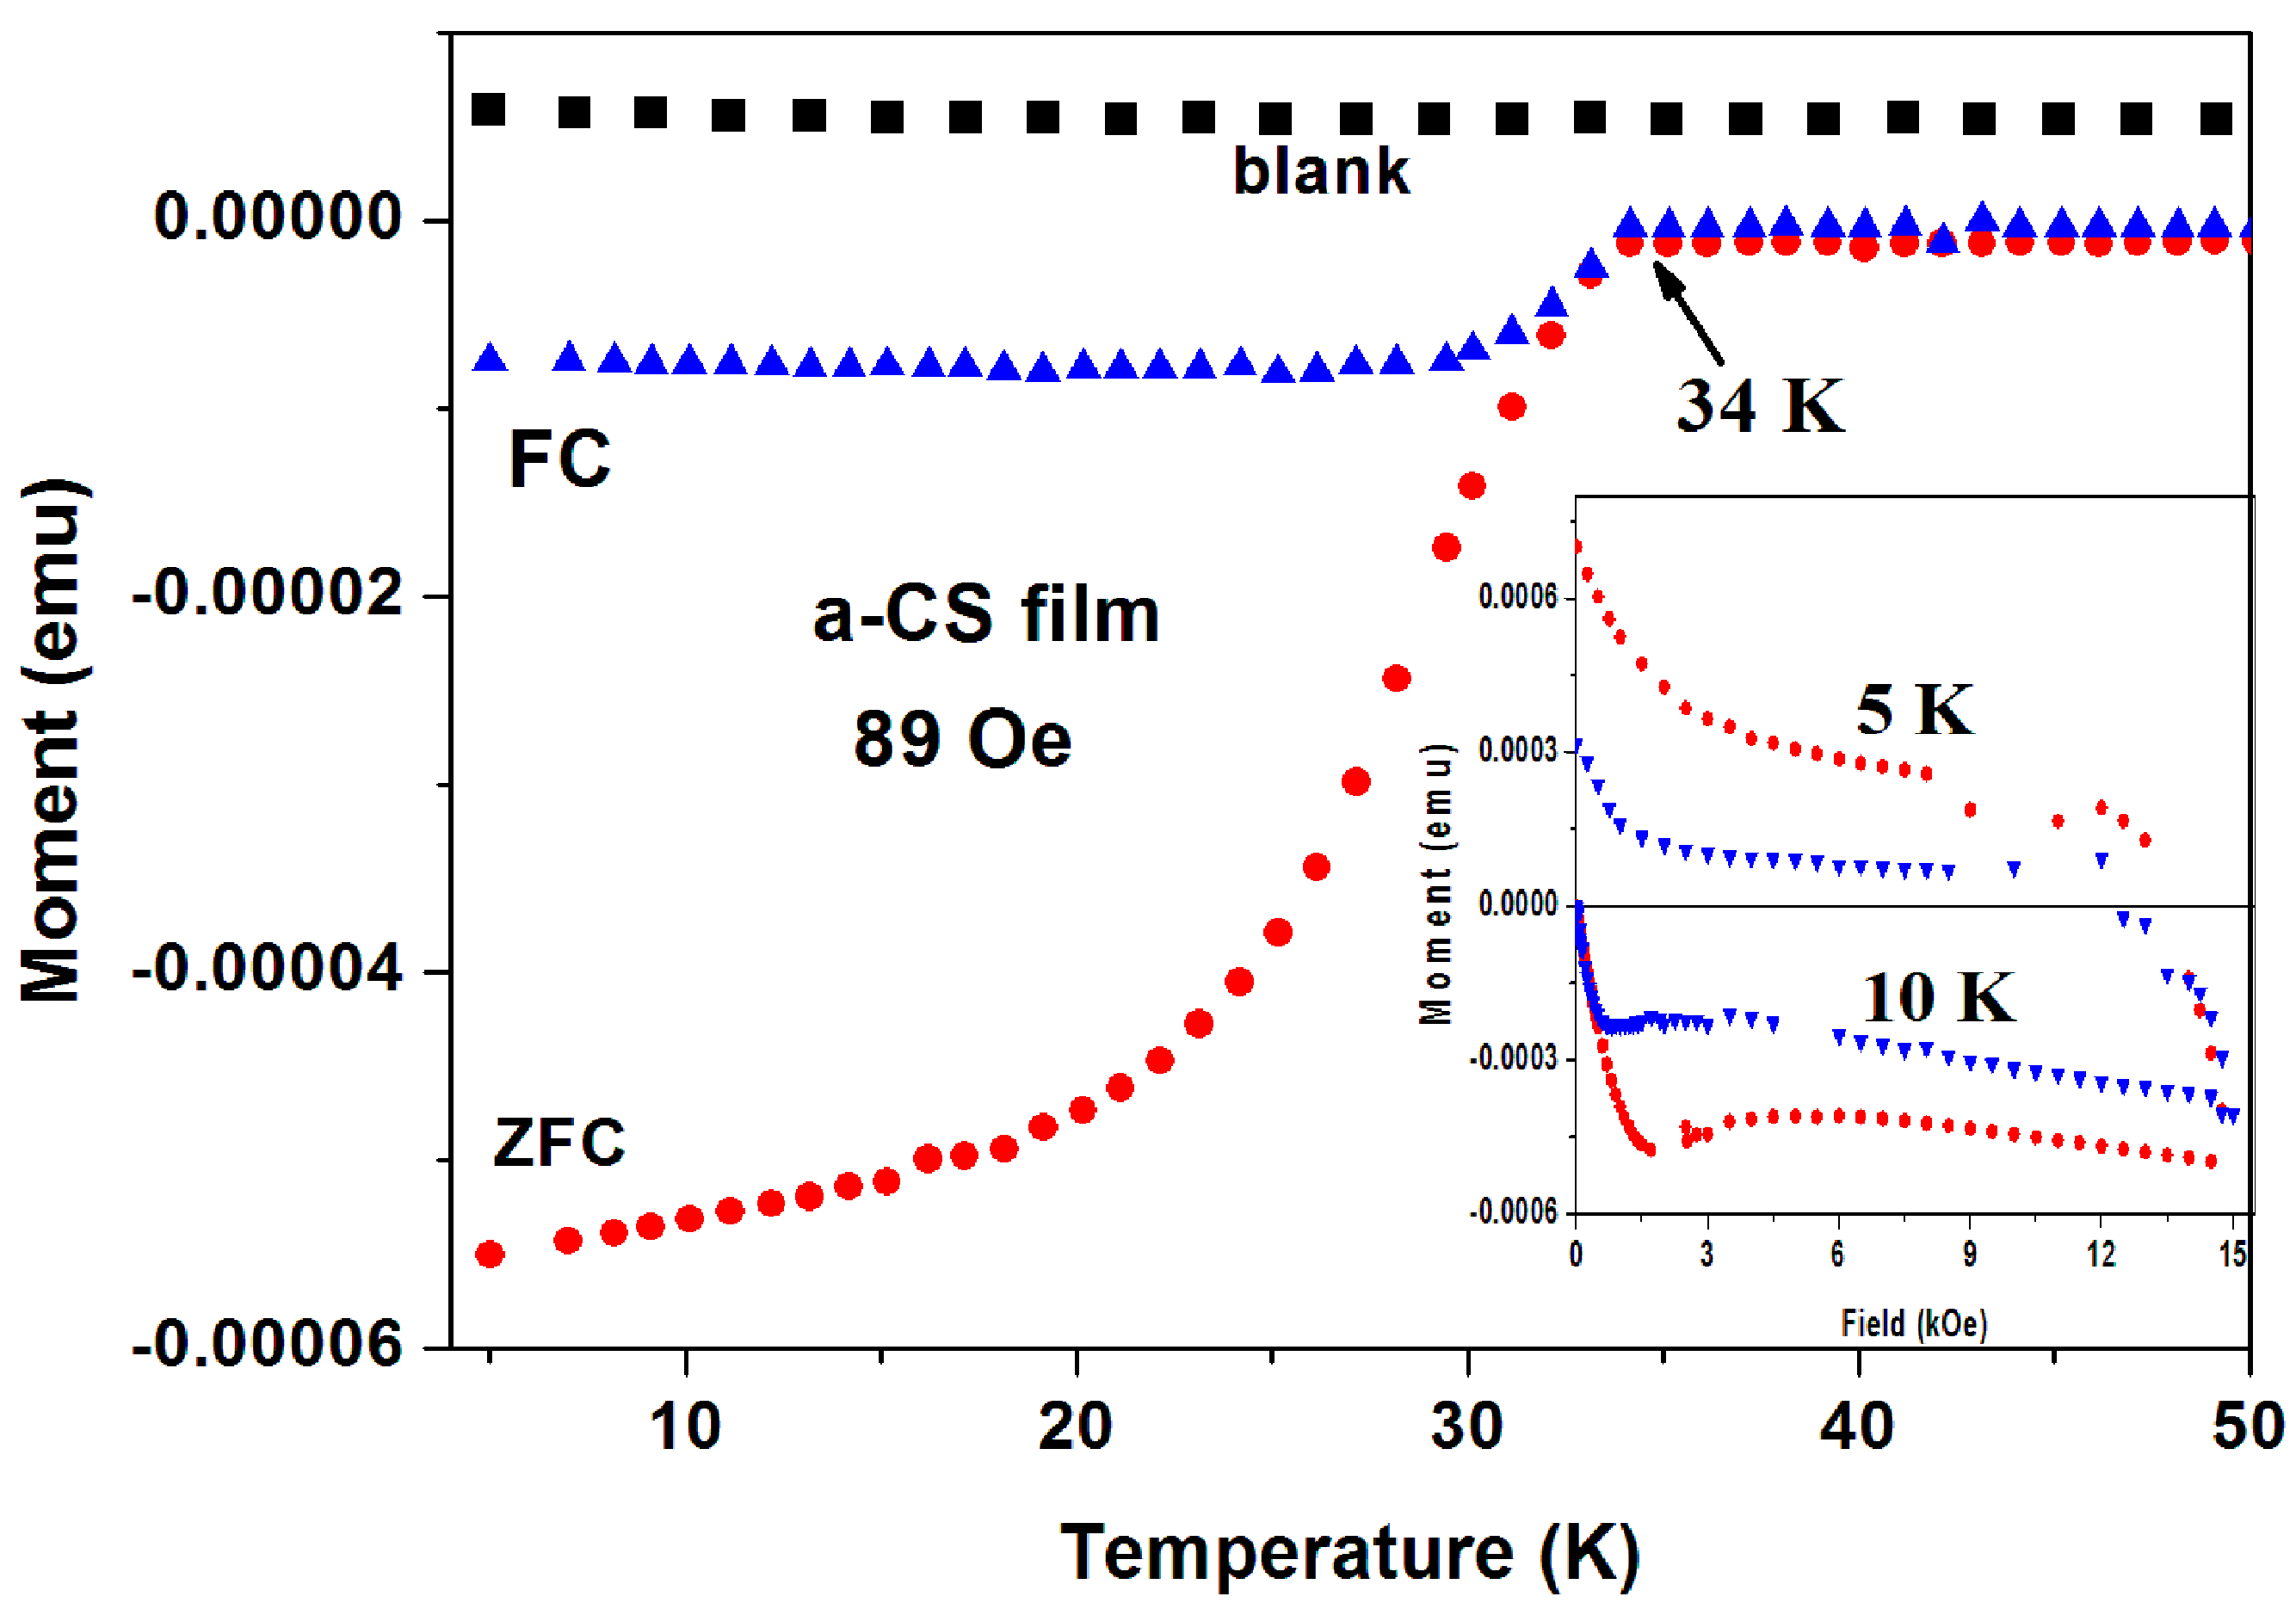
Superconductivity in a-C thin films. As a third example, we present here the magnetic data collected on a-CS thin films. Six a-C thin films were grown by the EBID method (blank) and show a positive constant magnetization. This clean system is a result of the absence of PM and/or magnetite impurities. The blank films were treated with sulfur at 250 °C and two of them exhibit SC traces [
27]. First, a-CS film exhibits a clear SC transition at
Tc = 34.4(0.5) K (
Figure 8), where
H was applied perpendicular to the film area. The ZFC and FC plots were obtained after subtracting the blank magnetization. It is readily observed that below
Tc, both the ZFC and FC magnetization curves are diamagnetic and the FC curve exhibit the typical expulsion of the field lines (the Meissner effect).
Tc shifts with
H (up to 2 kOe) to lower temperatures with a rate of
dH/dt = 0.45 kOe/K (not shown). The blank films contain W inclusions embedded in the a-C matrix. These inclusions are not responsible to the SC state, since SC appears only after the sulfur treatment. They only enhance the phase coherences by Josephson coupling of nearby localized SC regions.
Figure 8 (inset) shows two typical isothermal hysteresis loops. Below
HC1 at ~ 600 and ~400 Oe for
T = 5 and 10 K, respectively the
M(
H) curves are linear.
Thus, in addition to the
commercial a-C and a-CS samples (
Figure 4,
Figure 5 and
Figure 6), The SC state observed in the
pyrolytic a-CS powders and in a-CS thin films were induced by sulfur. This definitely proves our claim that various a-CS phases are the origin of SC in all a-C materials studied.
3.2. Unusual Magnetic Properties
Thermal irreversibility in dc magnetic measurements at constant dc field (H) is a well-known common phenomenon. It is readily found in FM, antiferromagnetic (AFM), spin-glass systems and in SC materials as well. In all standard cases, the FC curves lie above the ZFC curves (FC > ZFC) up to a typical characteristic transition temperatures attributed to the various physical states.
The unusual magnetic behavior where the FC branches cross the ZFC curves (ZFC > FC) has been recently observed in two unrelated materials: in (i) inhomogeneous commercial and fabricated a-C and a-CS [
4] and (ii) in a chiral-based magnetic memory device its structure and electrical properties are reported in Ref. [
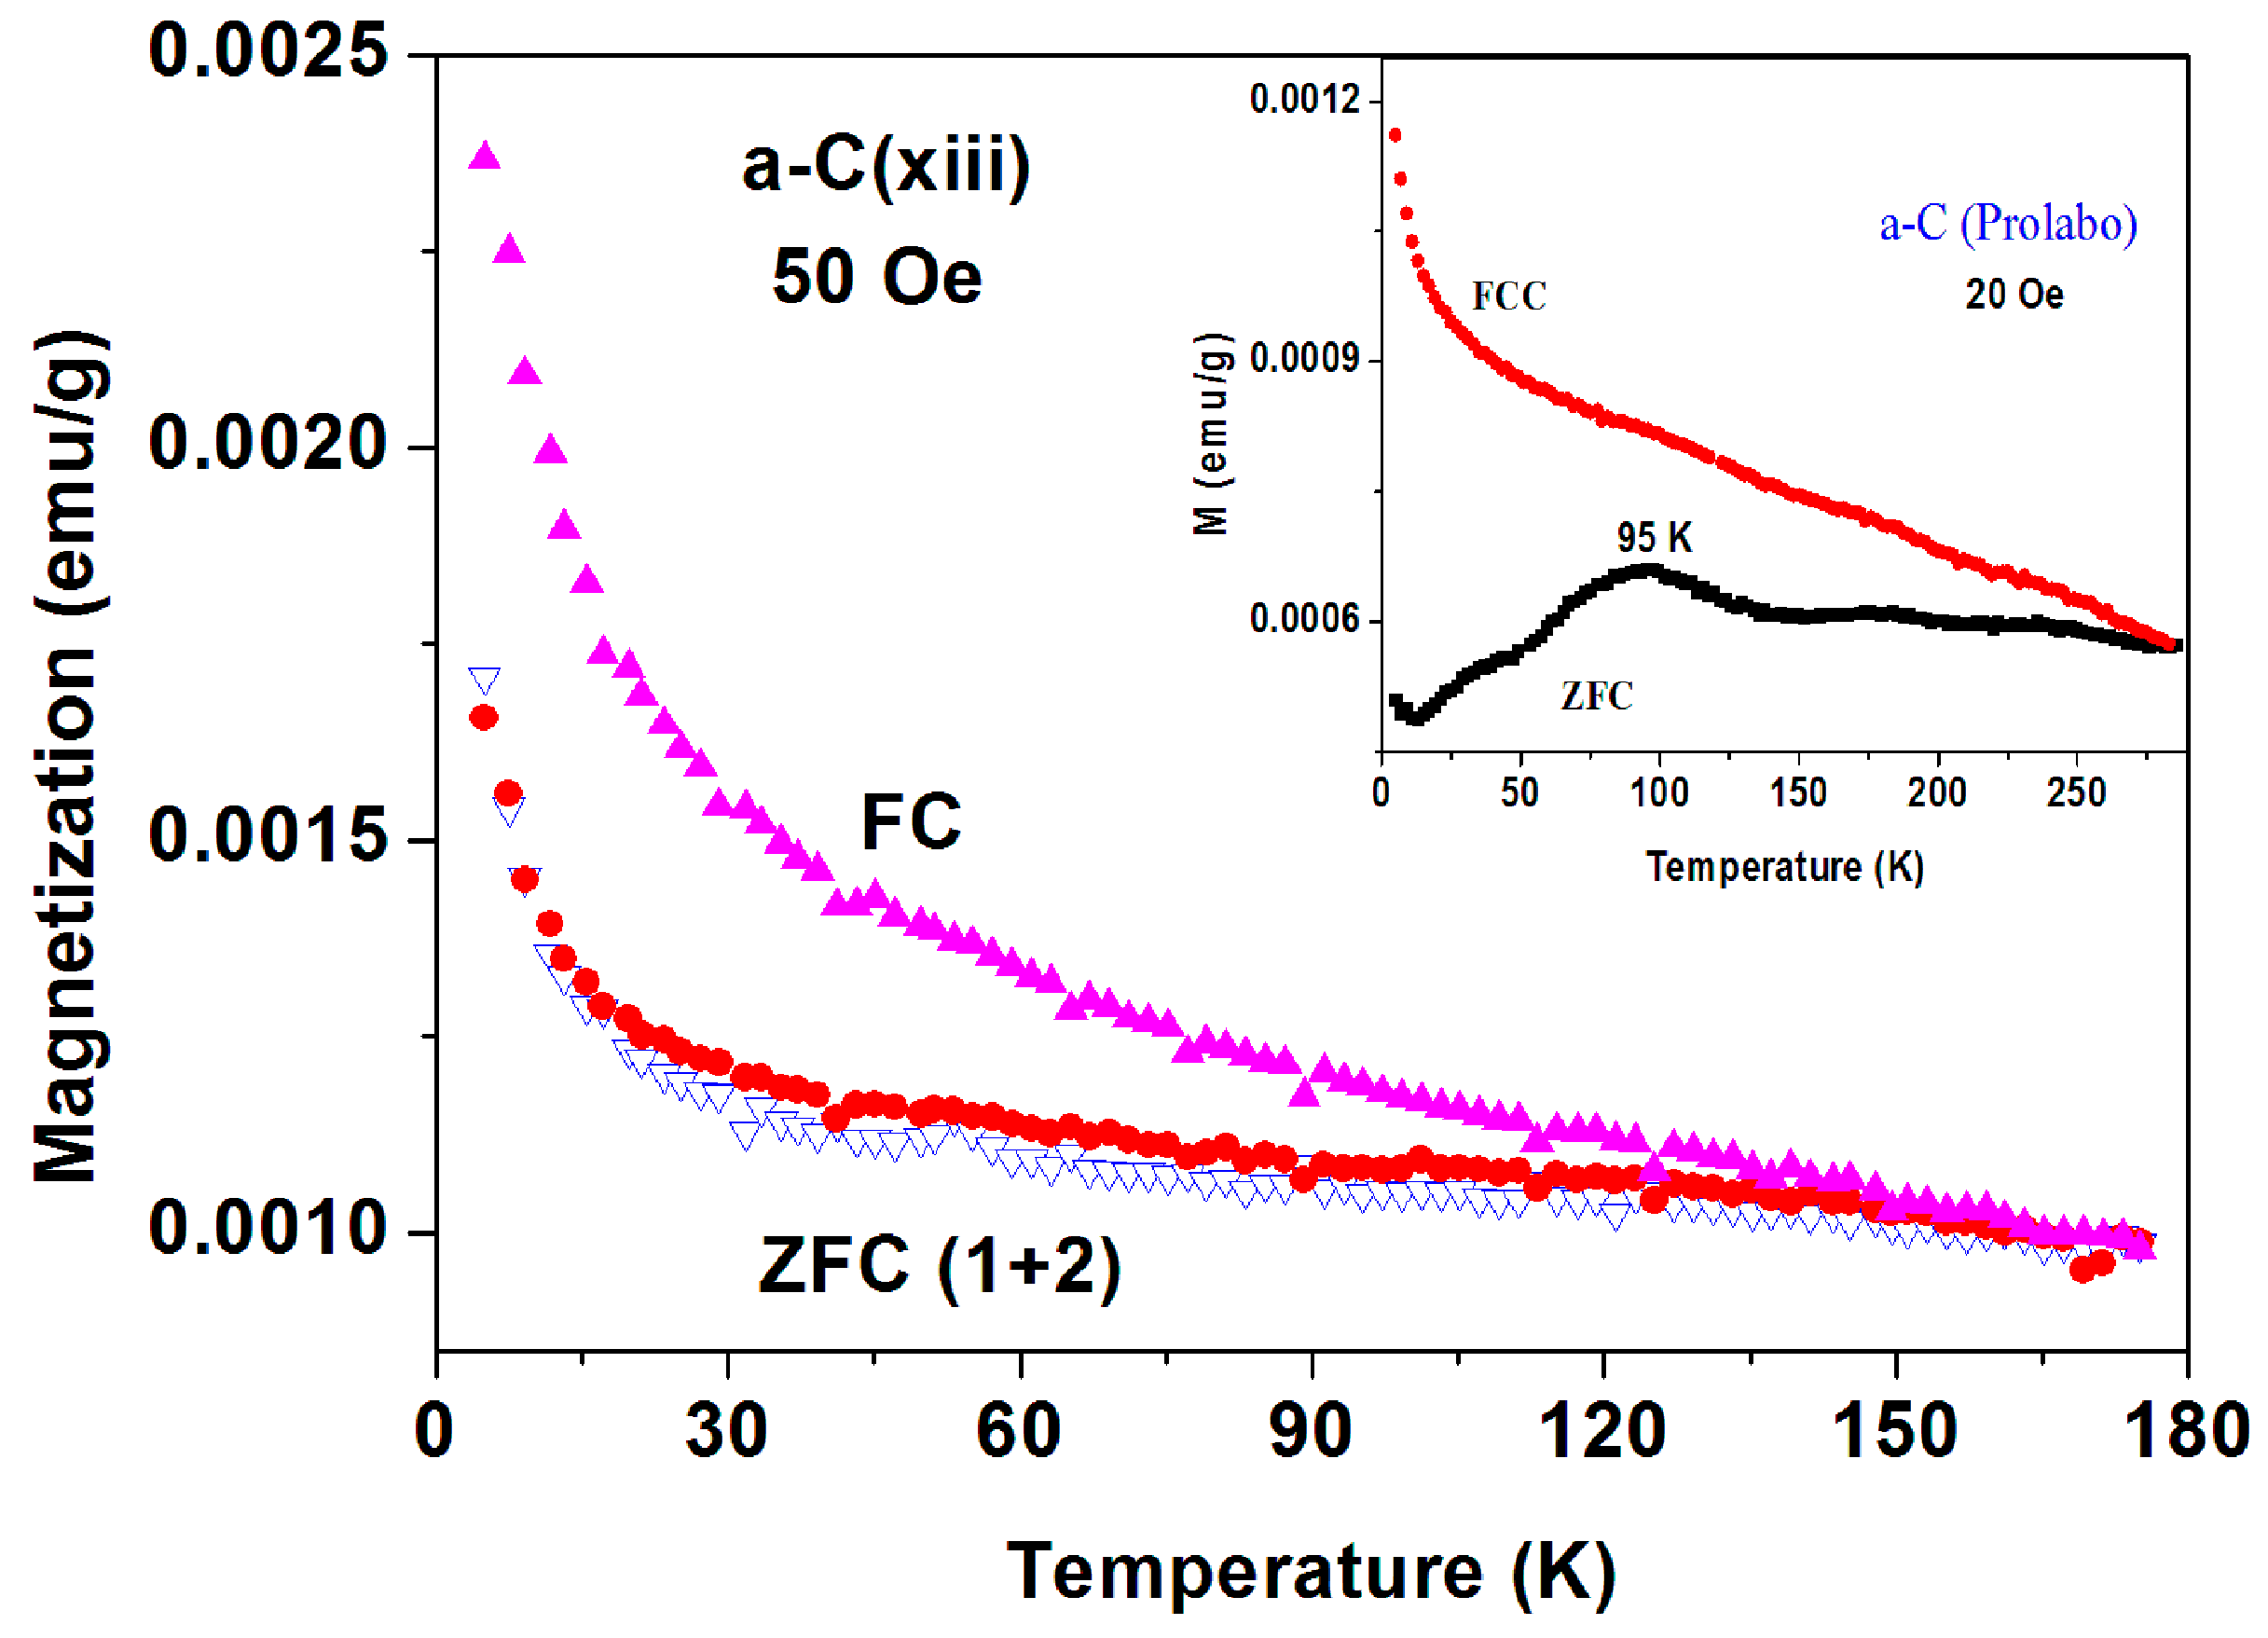
29]. Unexpectedly, in a-C and a-CS, two anomalies are observed. (1) Pronounced peaks at 50–80 K are observed in the ZFC branches only. Around the peaks position, (in contrast to the usual behavior), the ZFC branches lie above the FC curves (ZFC > FC) (puzzle 1); (2) This unusual behavior is irreproducible and disappears in the second ZFC run (puzzle 2). These two phenomena are intrinsic properties of the a-CS materials and are connected to each other. They are not ascribed neither to conventional FM nor to any magnetic impurities such as magnetite and/or oxygen. We present here the most unexpected magnetic results appearing in both commercial and fabricated a-C and a-CS materials, starting with the commercial a-C800.
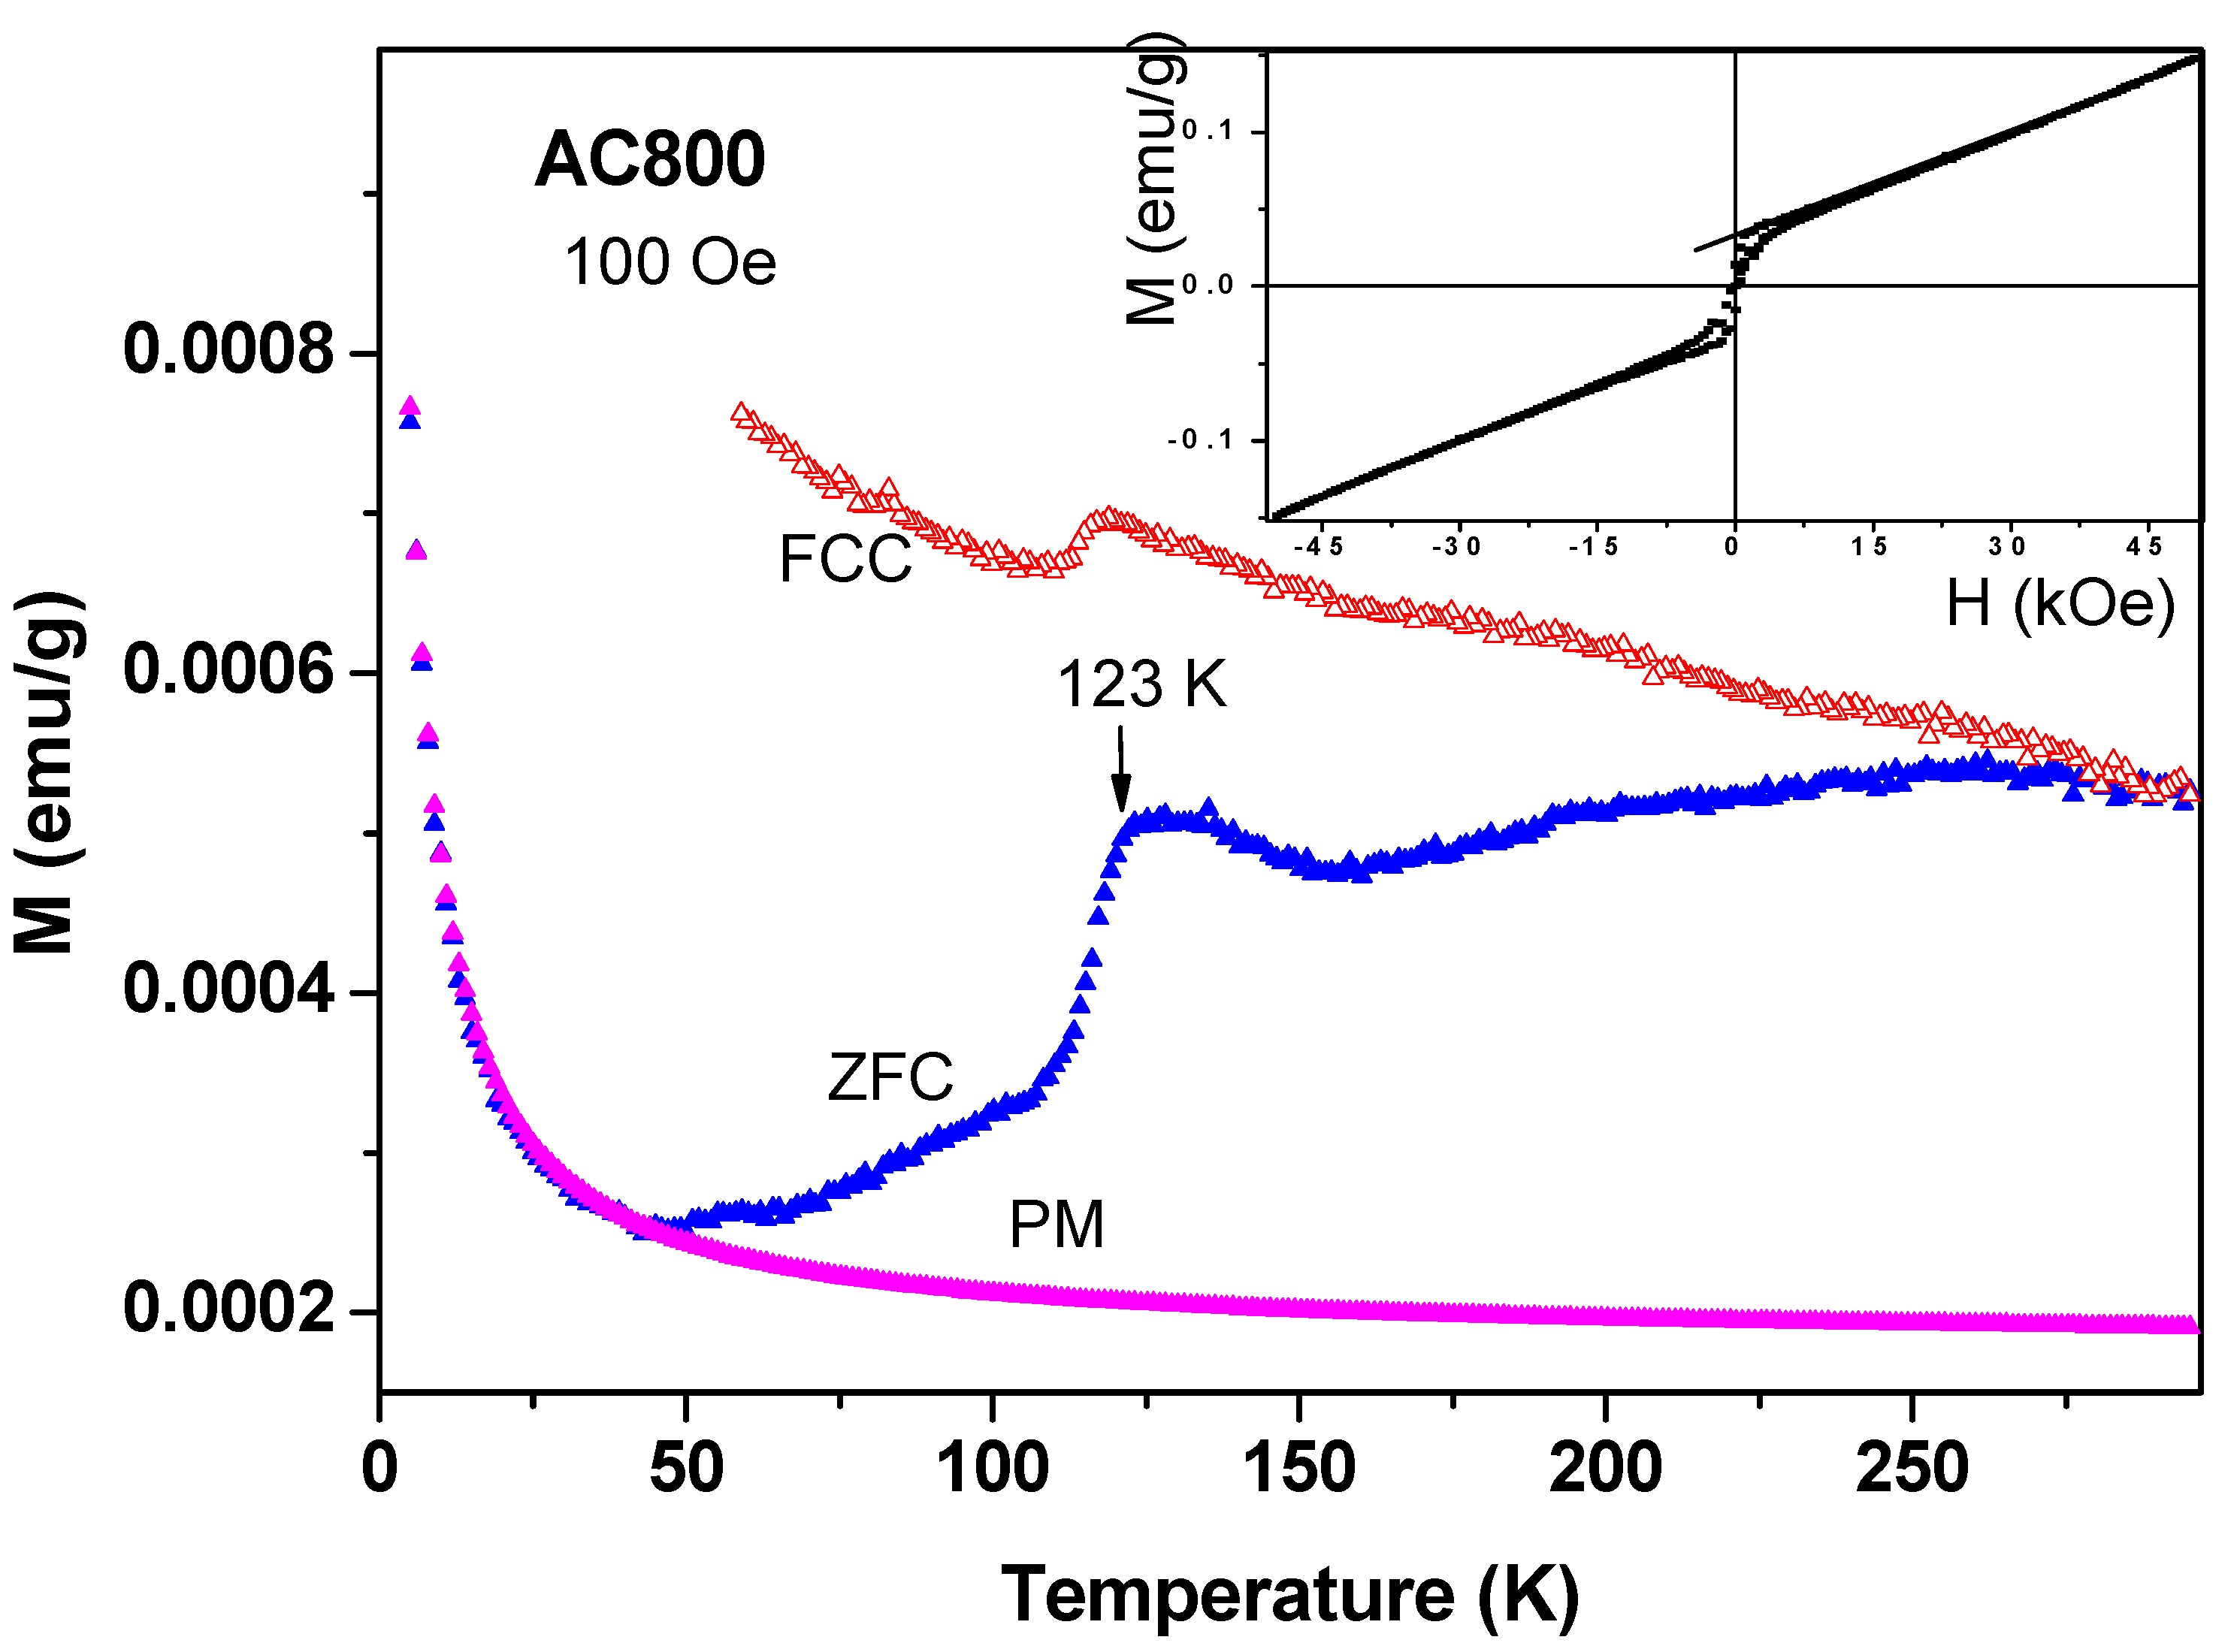
(i)
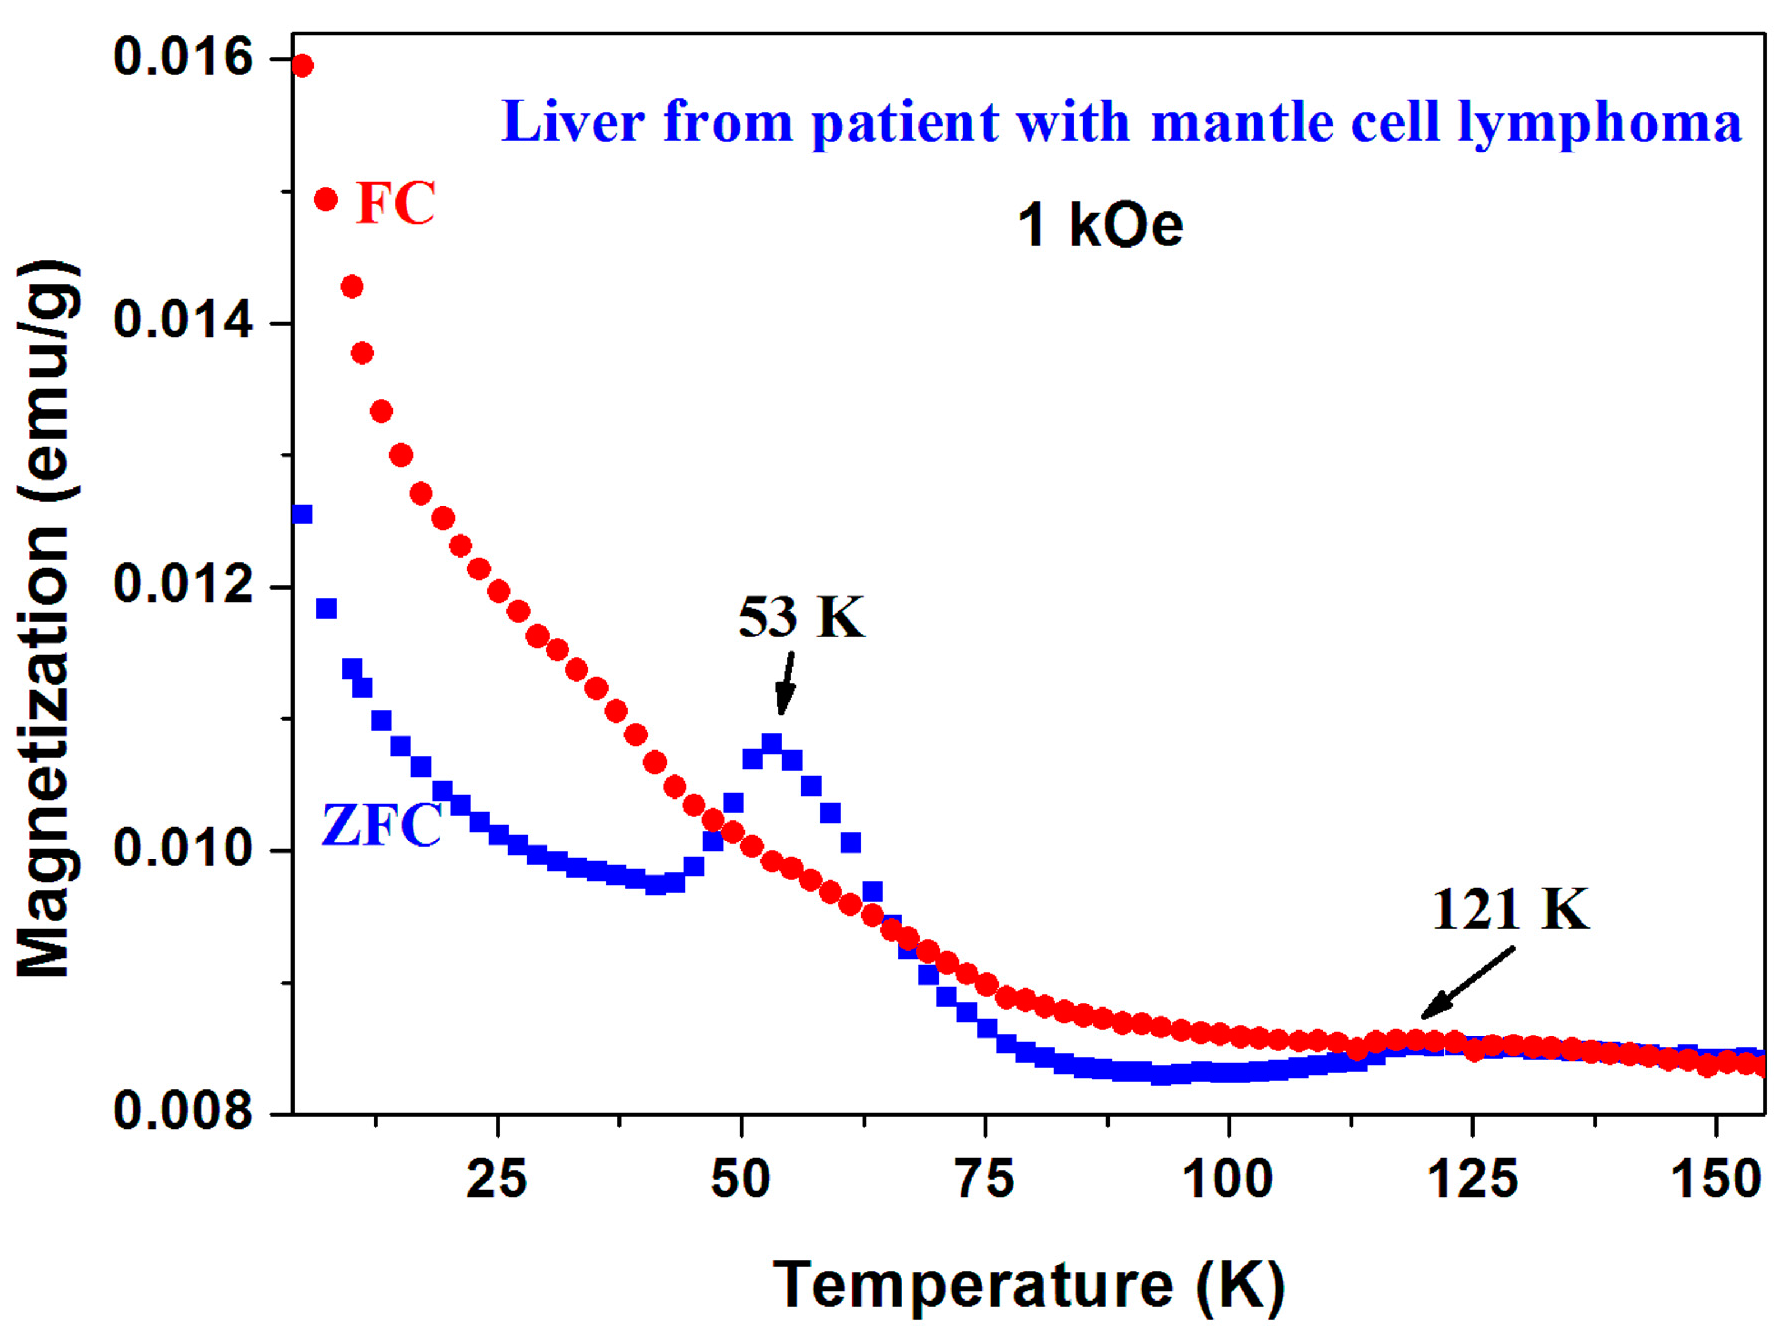
Magnetic studies of commercial a-C samples: Around 200 mg of the commercial a-C powder was heated at 800 °C under ambient conditions (a-C800). At that temperature, the amorphous carbon particles were evaporated and the residue contained mainly inorganic impurities. The ZFC and FC plots for a-C800 measured at 100 Oe are shown in
Figure 9. It is observed that this material is composed of two magnetic phases: (i) The FM-like feature with a sharp transitions at 123(1) K in both branches (the Verwey transition) which are related to the presence of ferri-magnetically Fe
3O
4 as deduced from both ICP and Mössbauer spectroscopy studies discussed above. The Verwey transition is attributed to electron hopping between the octahedral sites of Fe
2+ and Fe
3+ ions in Fe
3O
4. The bifurcation of the ZFC and FC curves at RT is caused by Fe
3O
4 (
TM = 853 K) as discussed above. The narrow hysteresis loop measured at 10 K (
Figure 9 inset) confirms this interpretation; (ii) At low temperatures, the ZFC branch exhibits the typical PM shape and by using the CW law we obtain: χ
0 = 1.7 × 10
−6 emu/g Oe,
C = 3.24 × 10
−5 emu K/g Oe and θ = −0.5 K. Extrapolation of these values to high temperatures yields the curve assigned as PM in
Figure 9, which is well below both ZFC and FC curves. This PM curve serves as a background to all other commercial a-C materials shown below.
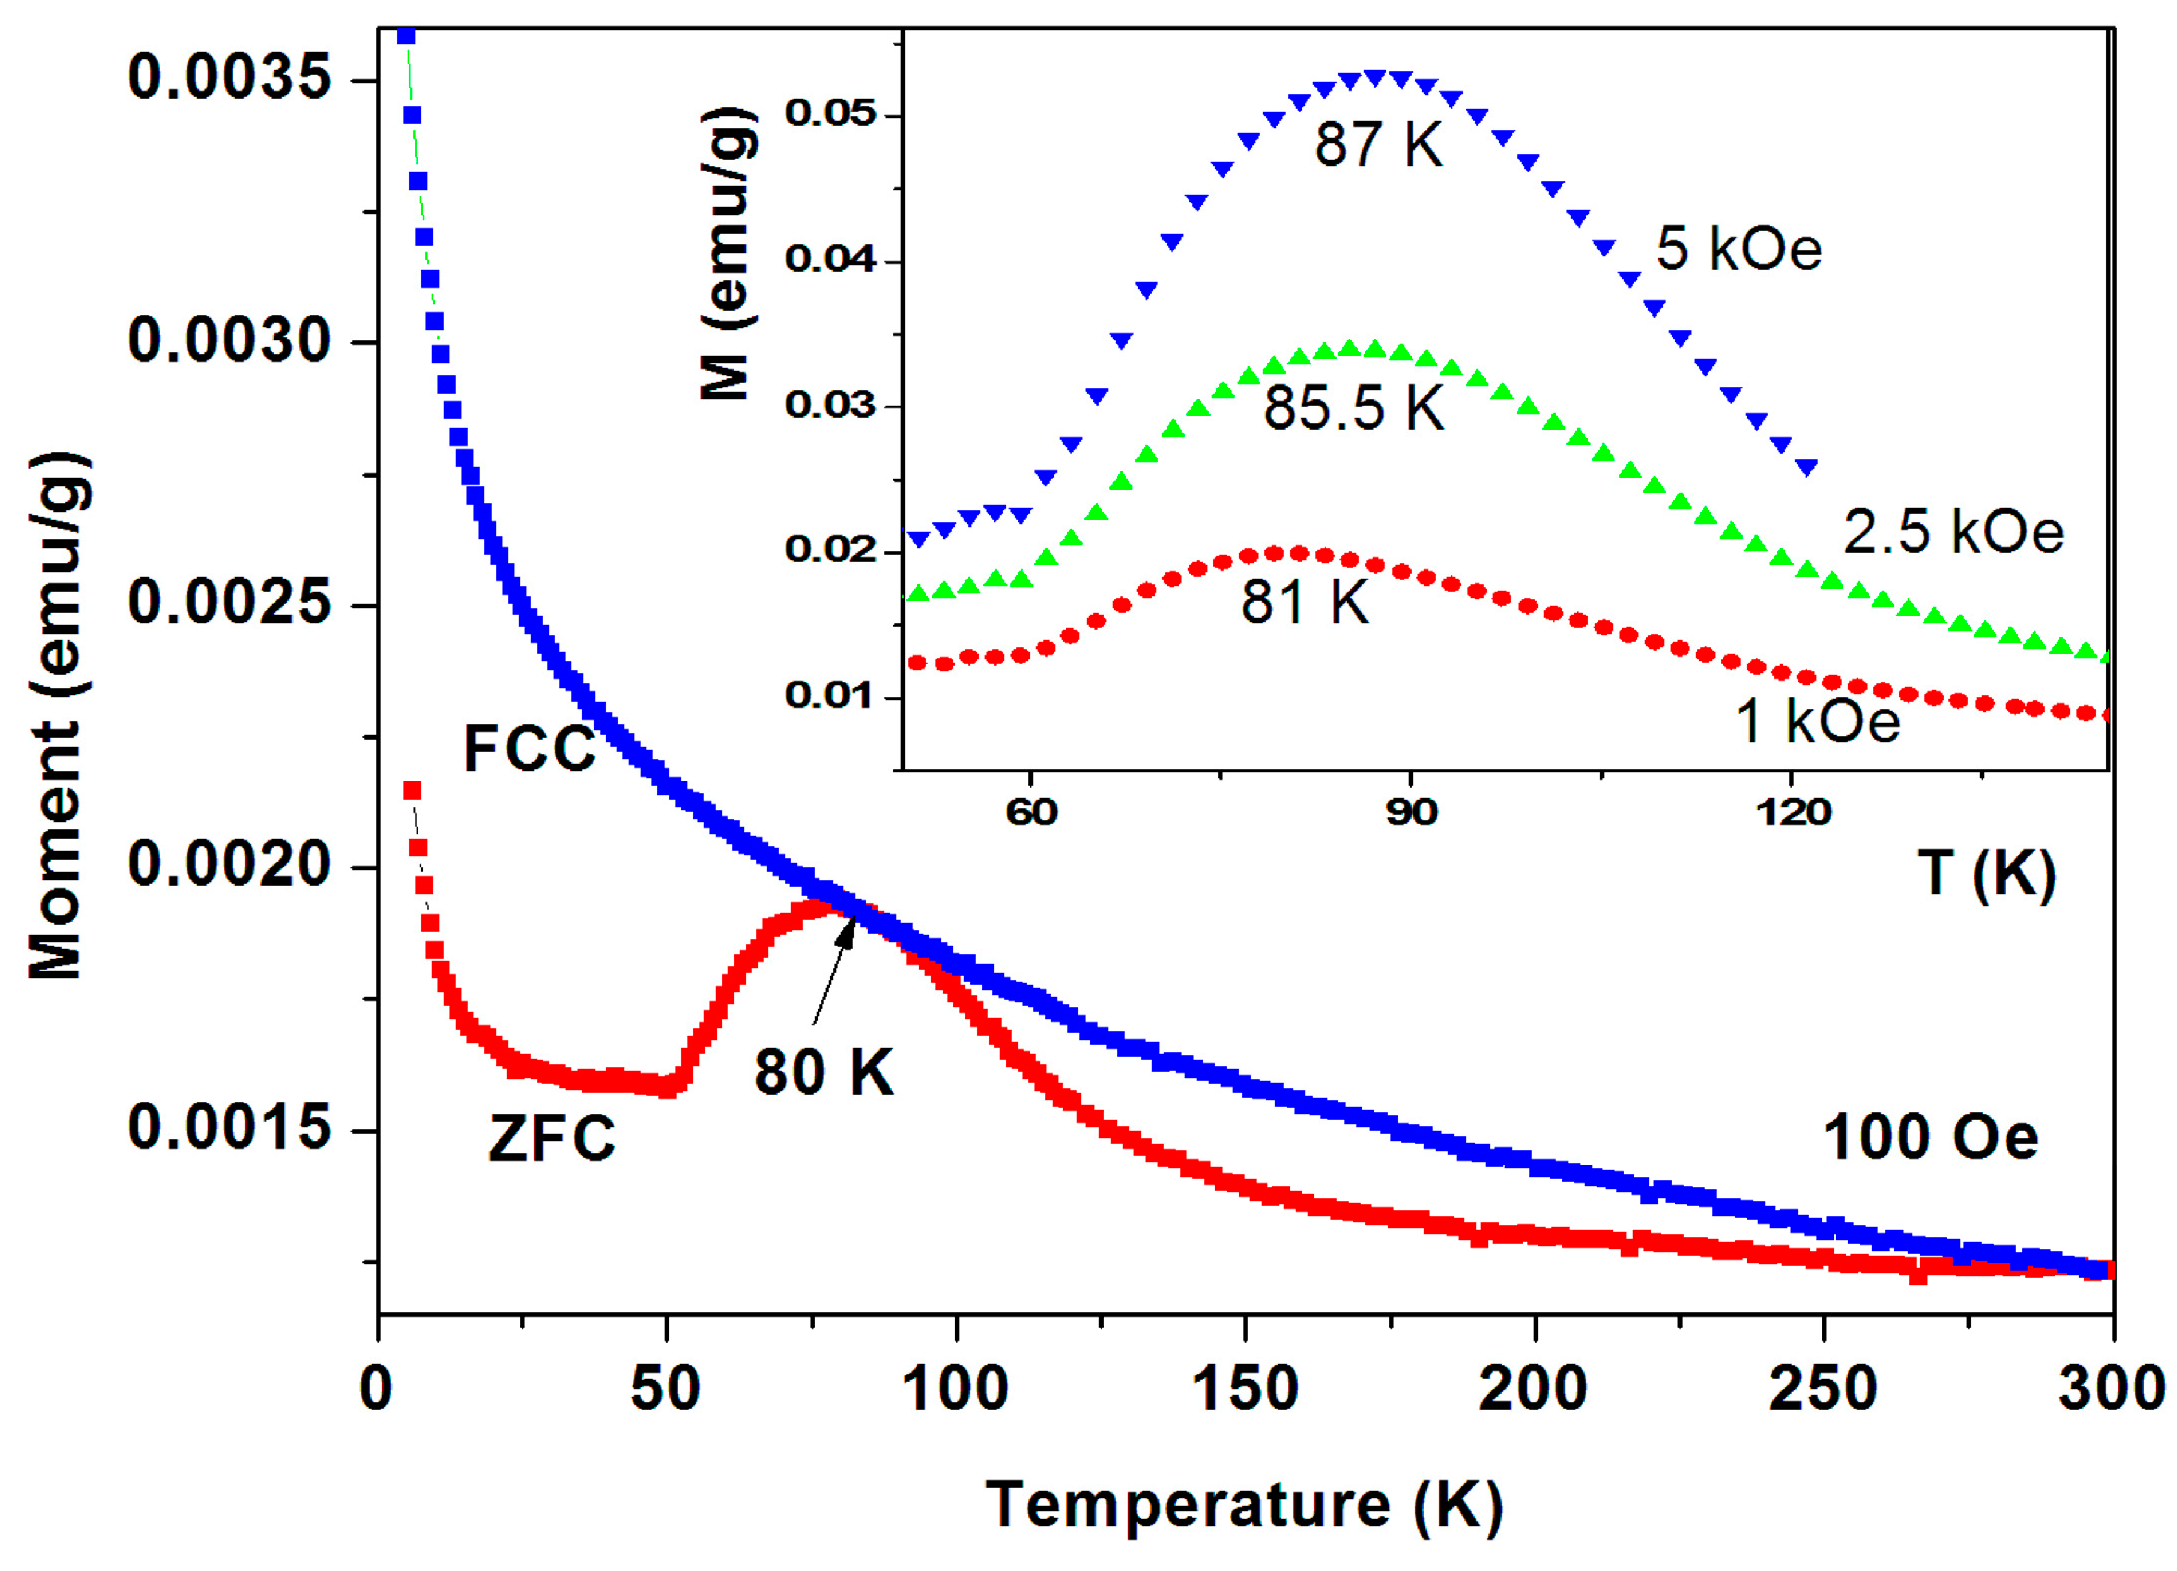
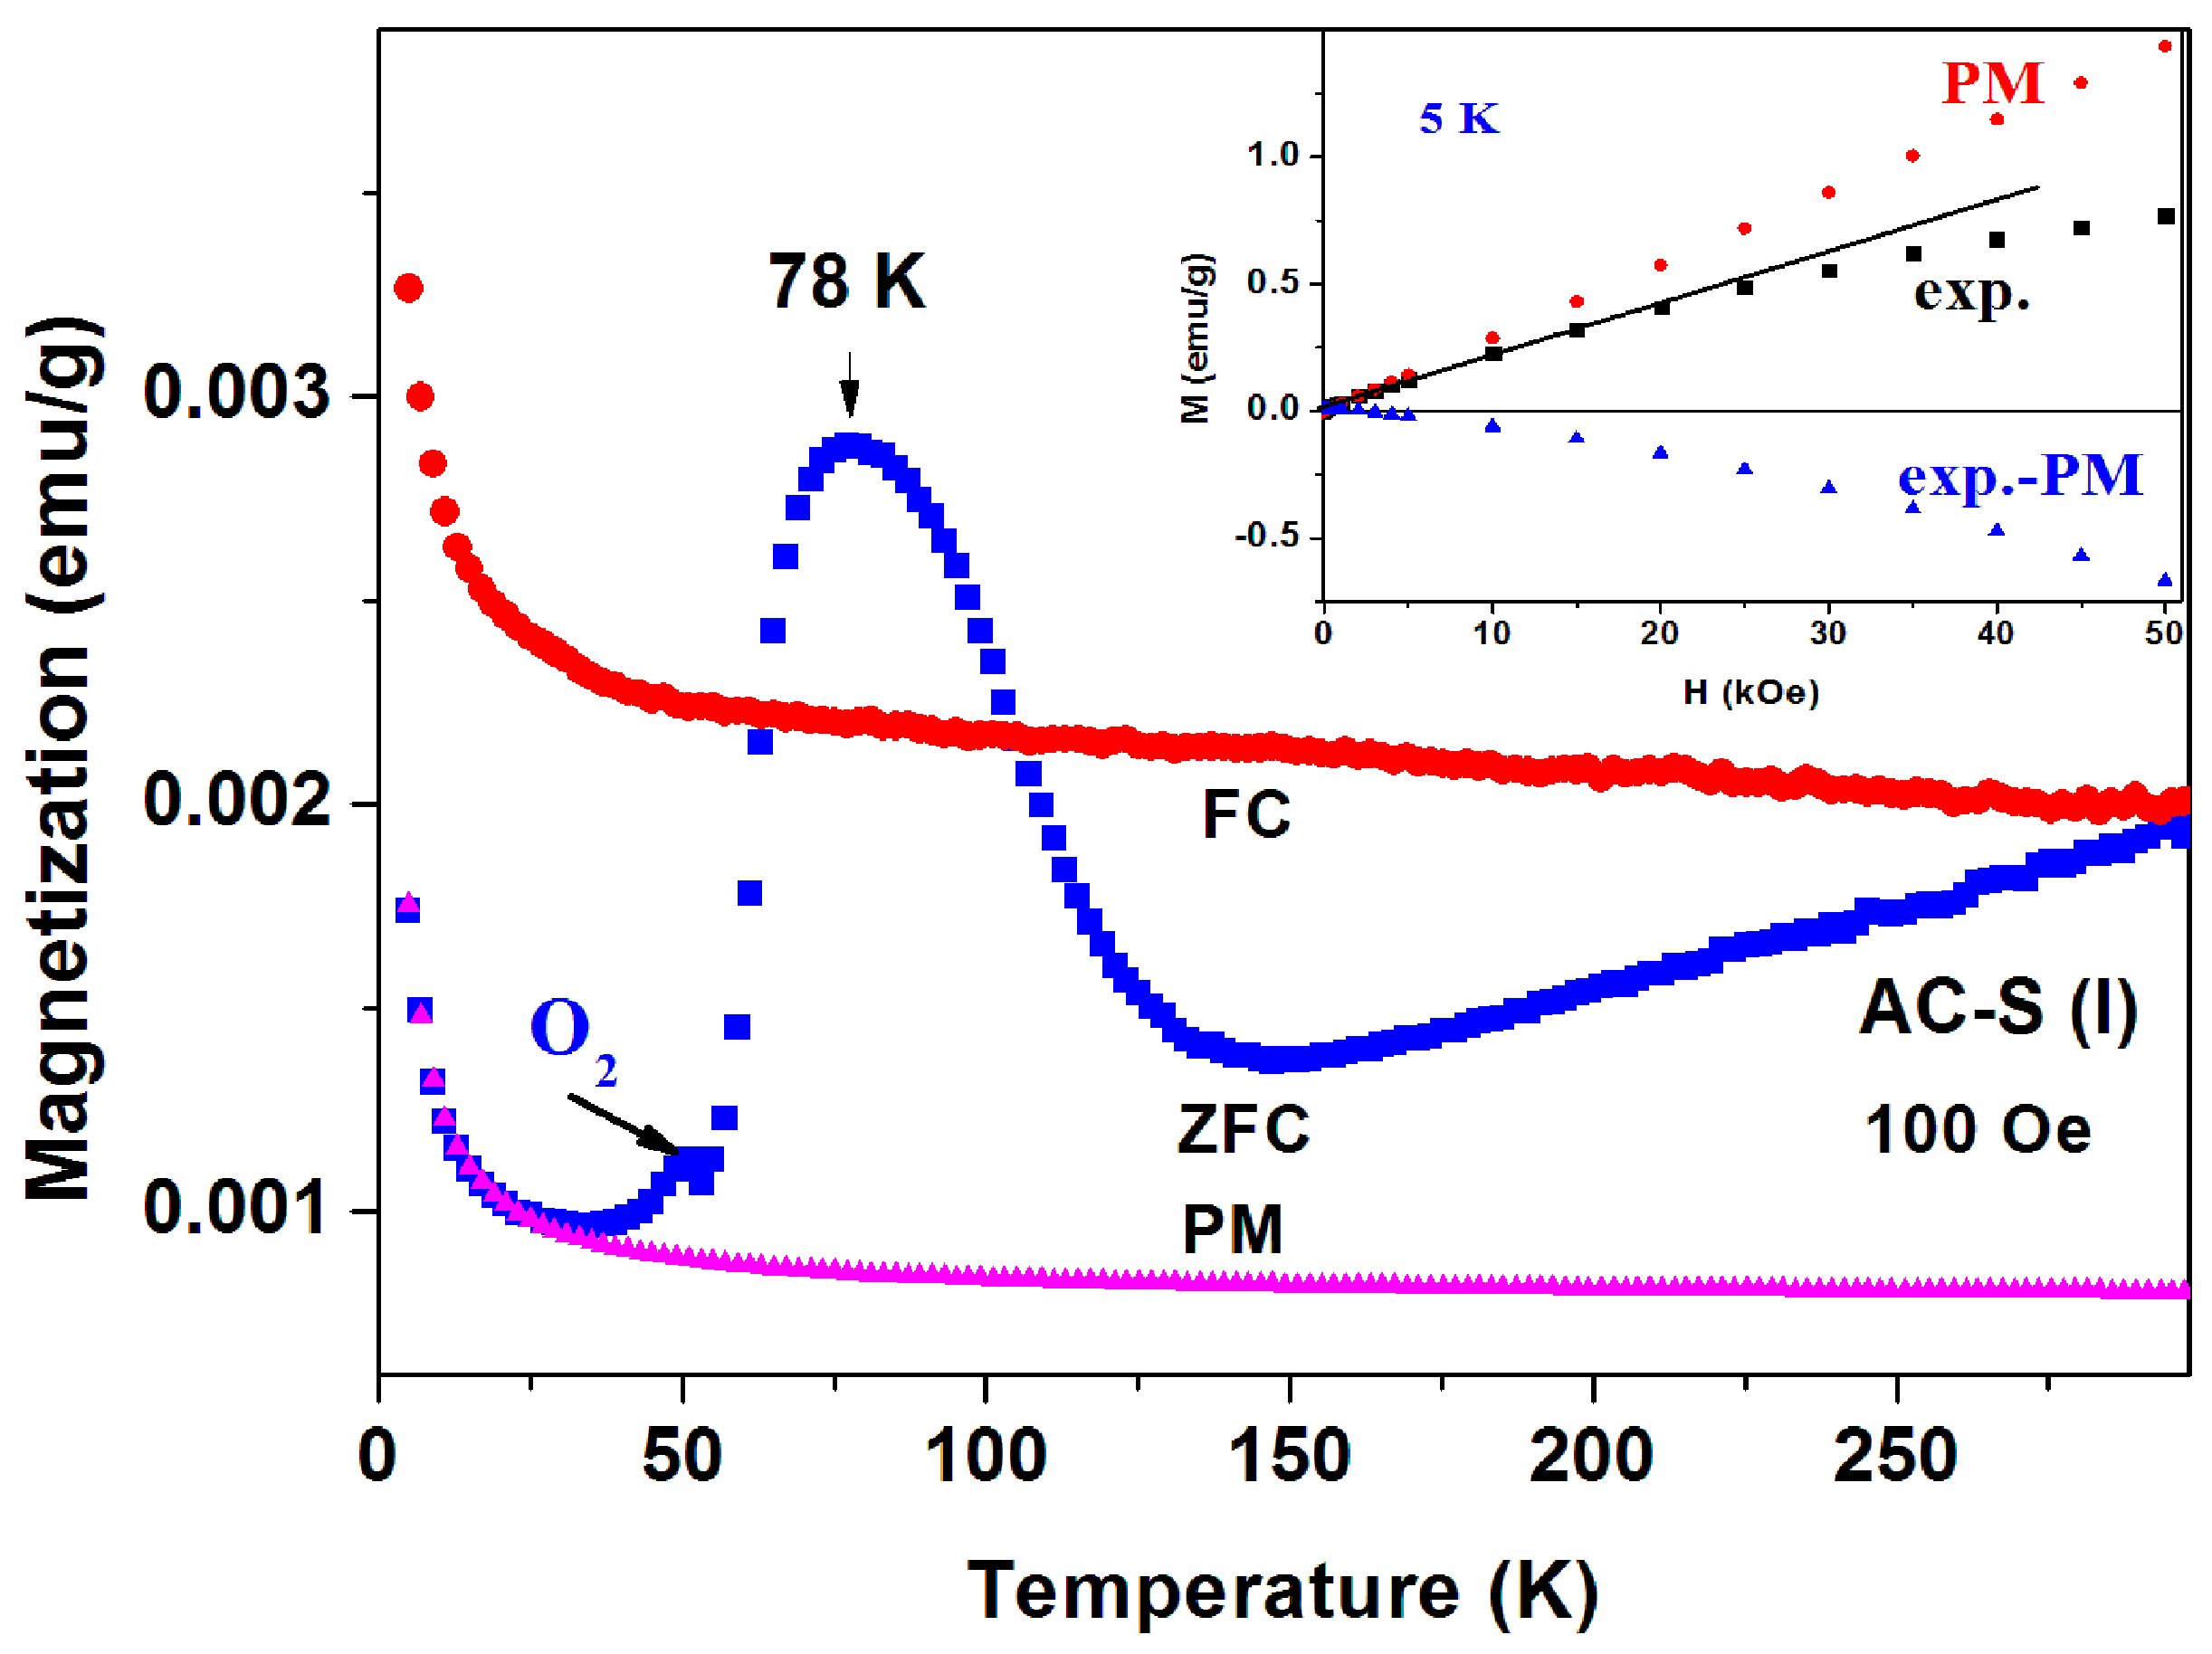
Four pristine commercial a-C samples have exhibited pronounced peaks at 65–85 K in their ZFC branches and a typical behavior for sample No. 6 is shown in
Figure 10. The ZFC plot demonstrates a pronounced peak at 80 K and the FC branch lies above ZFC one in the entire temperature range. The ZFC peak position is field dependent and shifts with
H to higher temperatures (
Figure 10 inset). For
H = 5 kOe, the peak obtained is at 87 K. That means that after each ZFC measurement up to room temperature, the field was switched off and turned on at 5 K to trace the next plot.
Peaks at
T ~ 50–60 K may originate from adsorbed oxygen [
18]. Indeed, solidified of oxygen traces are already observed (see
Figure 7) but the peaks in
Figure 10 cannot be attributed to oxygen because (i) they appear at much higher temperatures; (ii) Solidification of oxygen appears in
both ZFC and FC curves (
Figure 7) and (iii) the peaks related to oxygen are small and negligible as compared to the major magnetization peak (see later). Therefore, these peaks are believed to be intrinsic to the a-C powder which contains another magnetically unpaired localized spins active phase. As a result, the magnetic behavior of the pristine a-C samples is composed of three sources: Fe
3O
4 and the PM impurities which are responsible for the low temperature rise (as discussed above), and an unknown additional intrinsic magnetic phase which does not exist in crystalline carbon as shown later. Note that the peak amplitude in
Figure 10 is higher than that of a-C800 (
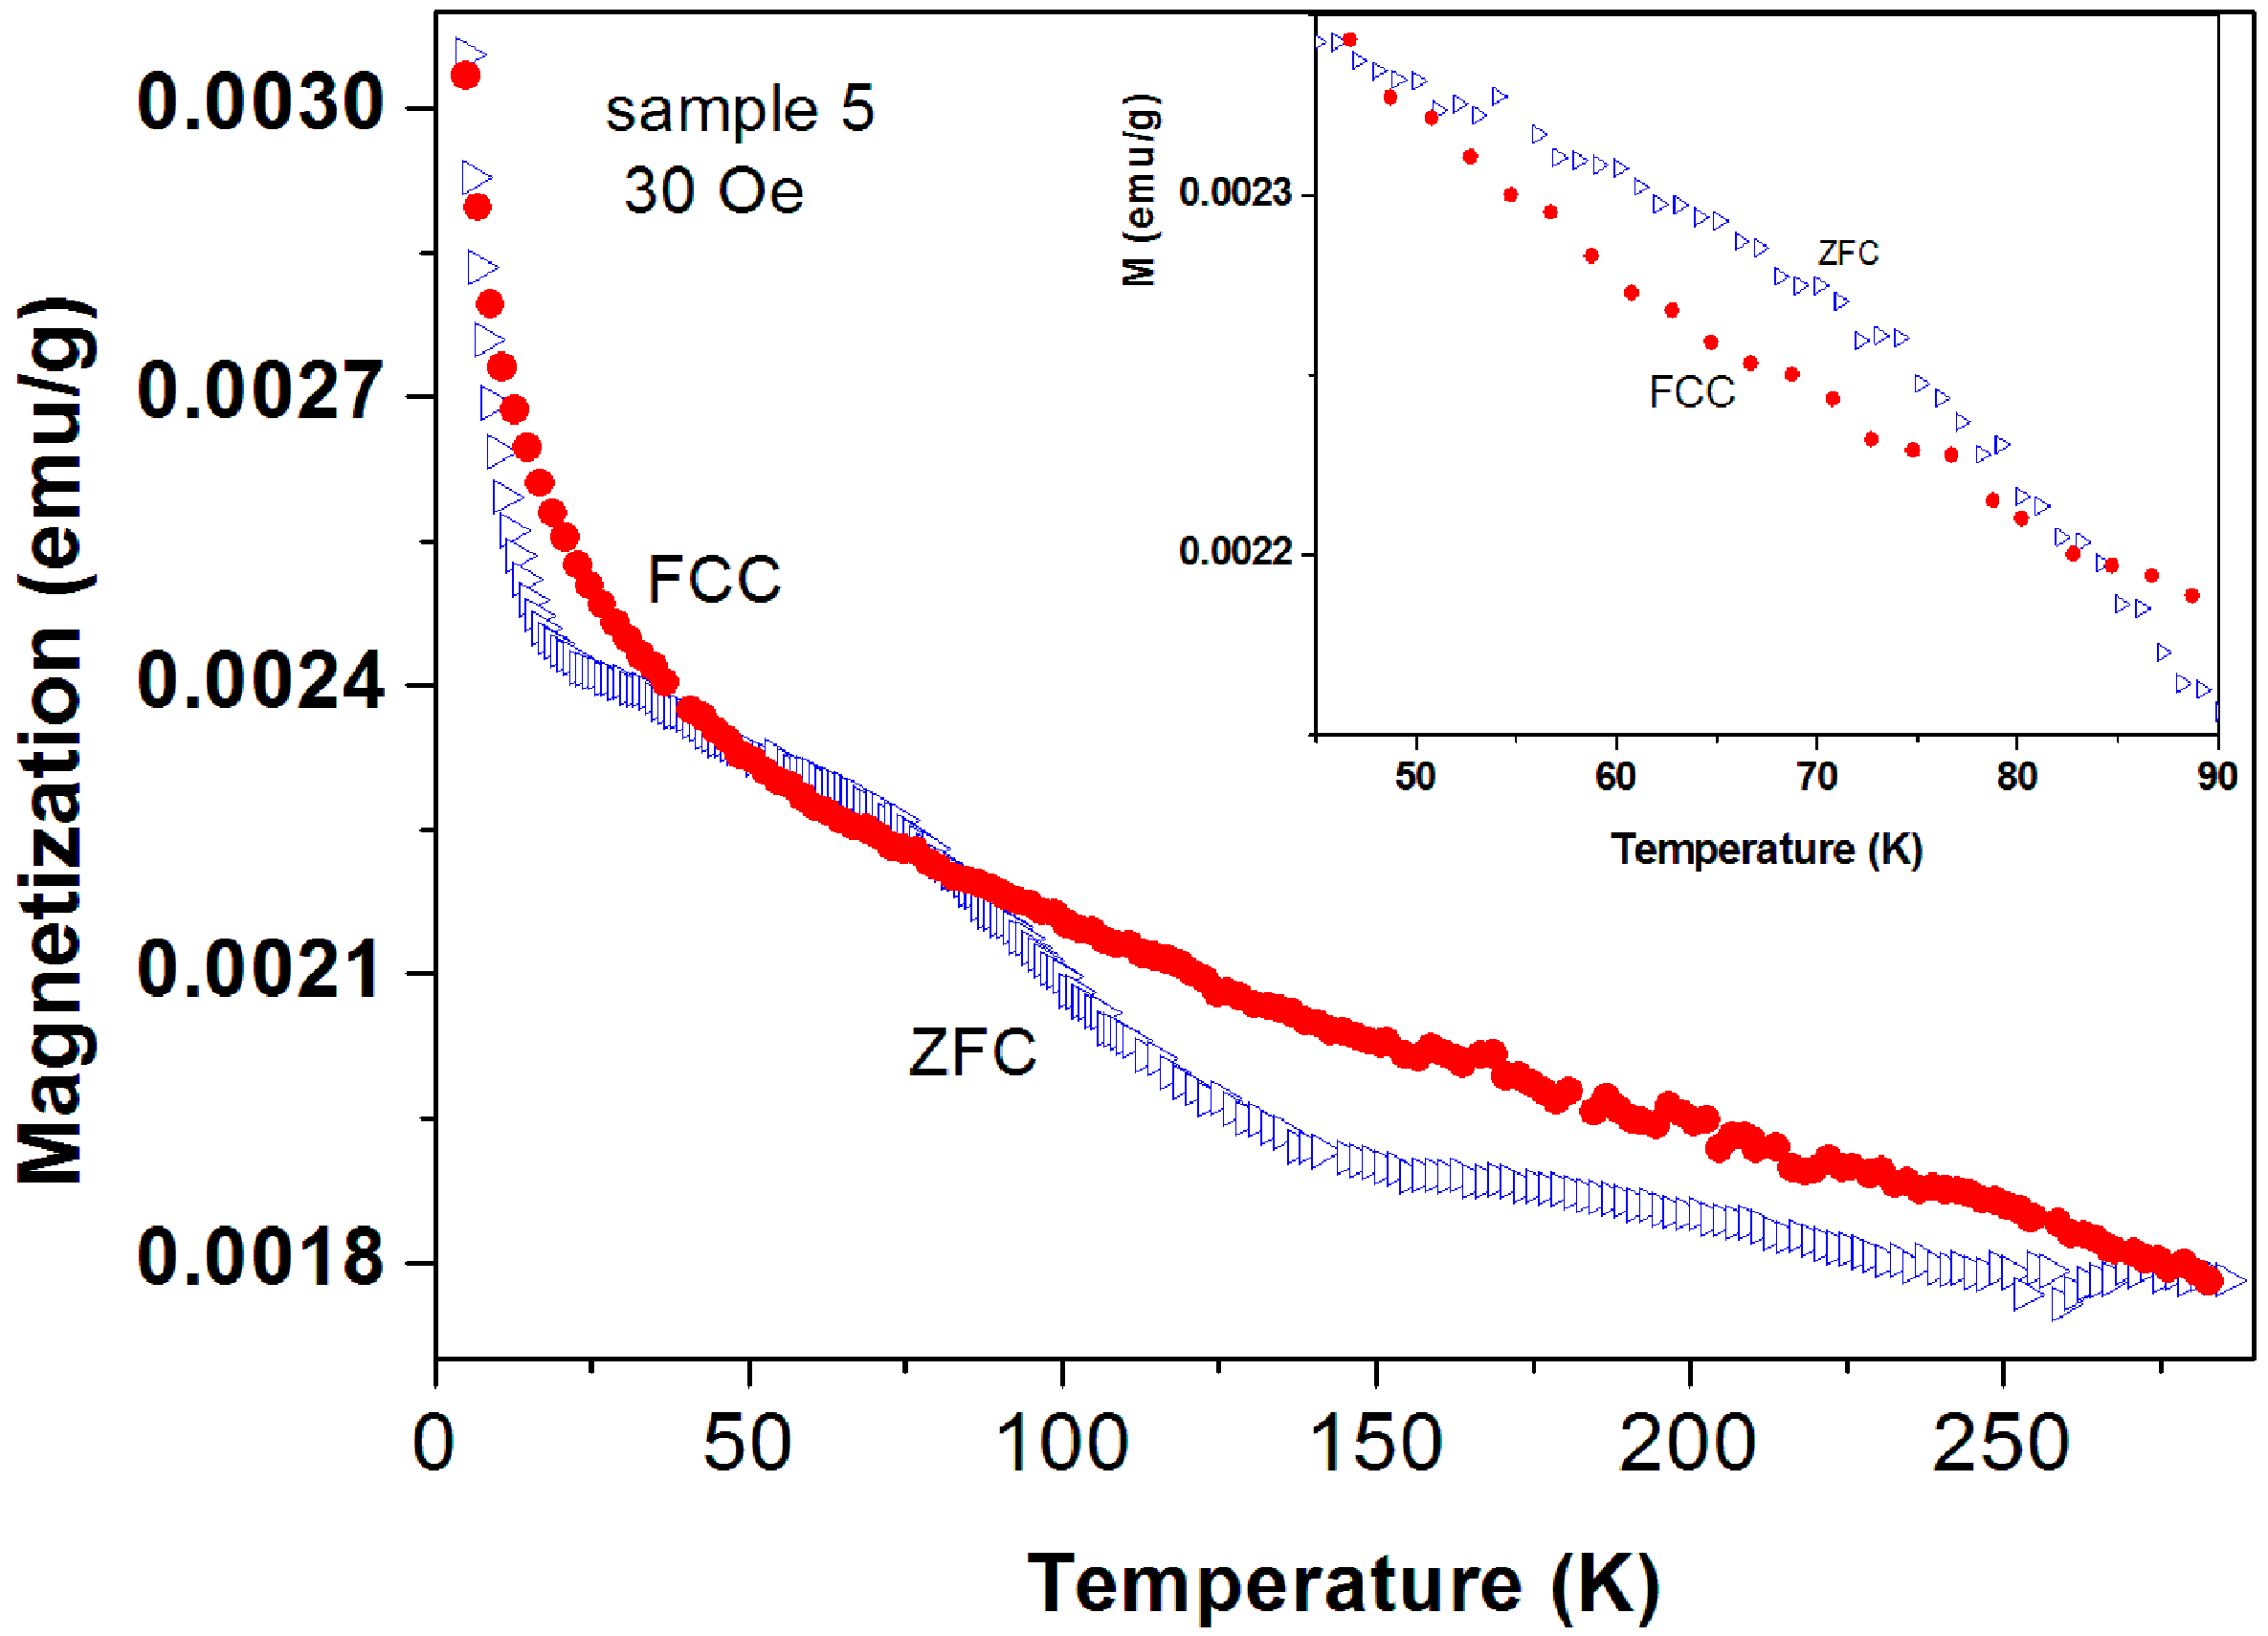
Figure 9). Therefore, the Verwey transition around 120 K is not visible. Another pristine a-C sample (No. 5) shows that in a certain range of temperatures the ZFC curve lies above the FC one (
Figure 11). This is a rare phenomenon which is more pronounced in the a-CS materials synthesized at 400 °C, as presented below.
(ii)
Magnetic studies of a-CS samples synthesized at 400 °C. The Traces of SC phases in a-C and in a-C synthesized with sulfur (a-CS) at 250 °C discussed above motivated us to explore a-CS materials which were synthesized at 400 °C. Several a-CS samples were synthesized. Since the a-C powder is not homogeneous, it may be expected that synthesis at elevated temperatures would produce better homogeneous products. It appears, however, that all synthesized samples remain inhomogeneous. In what follows, the magnetic properties of two a-CS parts (part I and III) taken from the
same batch of sample 1 are described. Part II exhibited similar magnetic behavior to that shown in
Figure 2. EDS study of this a-CS sample shows that the sulfur content increases to 0.69 at %, a value which is a bit higher than 0.21 at % obtained for pristine a-C powder, but much smaller than that of a-CS sample synthesized at 250 °C.
Sample 1 part I. The ZFC and FC curves measured at
H = 100 Oe and 1 kOe are presented in
Figure 12 and
Figure 13. The magnetic irreversibility up to RT, and the peak in ZFC(
T) at 78 K can easily be seen. Due to the high ZFC peak, the FC branch crosses the ZFC one, (see also
Figure 11) thus in this temperature range (63–106 K) we observe unexpectedly that ZFC > FC (puzzle 1). Here again, the ZFC(
T) and FC(
T) merging at RT is due to Fe
3O
4. Note the minor peak around 50 K which is attributed to the spontaneous magnetic order of solid oxygen as discussed above. At low temperature, the PM plot follows the CW law and the PM parameters deduced are: χ
0 = 6.1 × 10
−6 emu/g Oe,
C = 1.72 × 10
−5 emu K/g Oe and θ = 0.41 K, values which are very similar to these obtained for a-C powder. This C value corresponds to PM effective moment
Peff = 0.01 μ
B/C. That means that the PM impurities do not change much during the 400 °C heating process. Here again, the extrapolated PM curve lies below the ZFC and FC plots. The isothermal magnetization
M(
H) curve measured at 5 K (
Figure 12 inset) first increases linearly up to 25 kOe and then tends to saturate. This curve may be fitted as: (ii)
M(
H) =
H(−χ
d + χ
p), where −χ
d = −2.8 × 10
−5 and χ
p = 2.7 × 10
−5 emu/g·Oe are the a-C matrix intrinsic diamagnetic and the PM ions contributions, respectively.
At 1 kOe the irreversibility observed in
Figure 12 disappears and both ZFC and FC curves coincide to one curve (
Figure 13). The peak position is field dependent and shifts to lower temperatures with
H, in contrast to
Figure 10. The peaks are at: 71, 67 and 59 K for
H = 1, 5, and 10 kOe, respectively (
Figure 13, inset). At higher applied fields, the PM contribution masks the peaks and they are not visible.
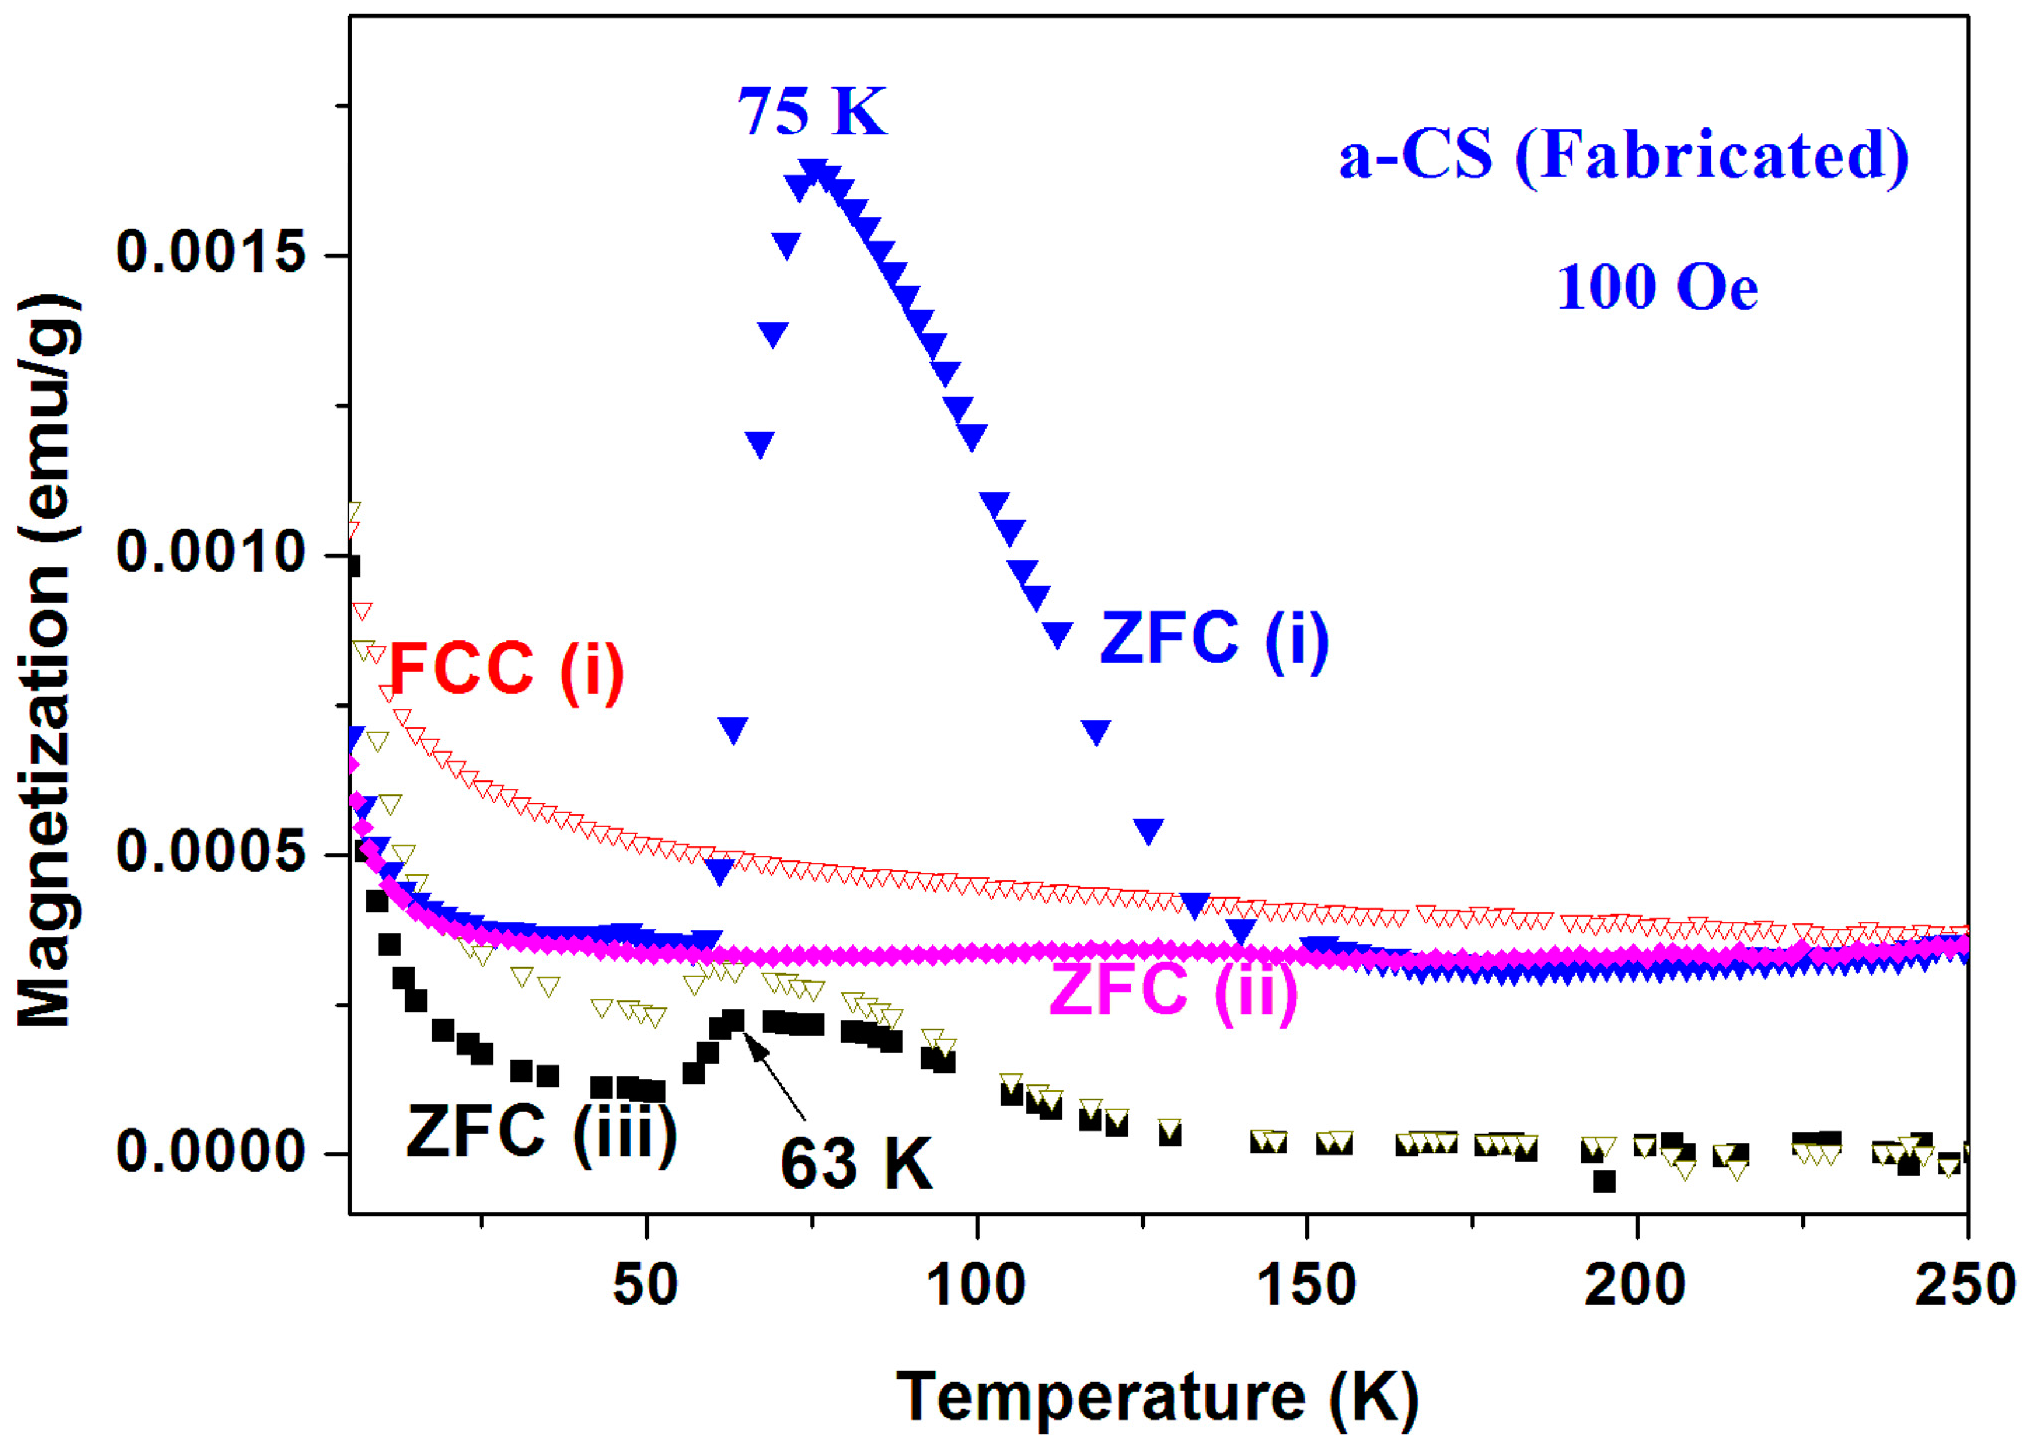
The measurements of a-CS sample 1, part III, are exhibited in
Figure 14. The most striking effect is that below 150 K, the entire ZFC curve is
above the FC one down to 5 K, whereas at higher temperatures (inset) the FC signals exceed the ZFC curves as expected. This indicates that this peculiar behavior does not stem from any experimental failure. The two ZFC > FC phenomena (
Figure 12 and
Figure 14) have the same origin and the slight discrepancy may be caused by tiny differences in their inhomogeneous composition.
Magnetic properties of pyrolytic a-CS samples synthesized at 400 °C. The magnetic behavior of the blank pyrolytic a-C powder was already presented in
Figure 7 (inset). Several a-CS samples have been synthesized at 400 °C and the scattered results obtained are very similar to that shown above. In
Figure 15 and
Figure 16, we show two examples, out of many, which definitely prove that puzzle 1 is reproducible.
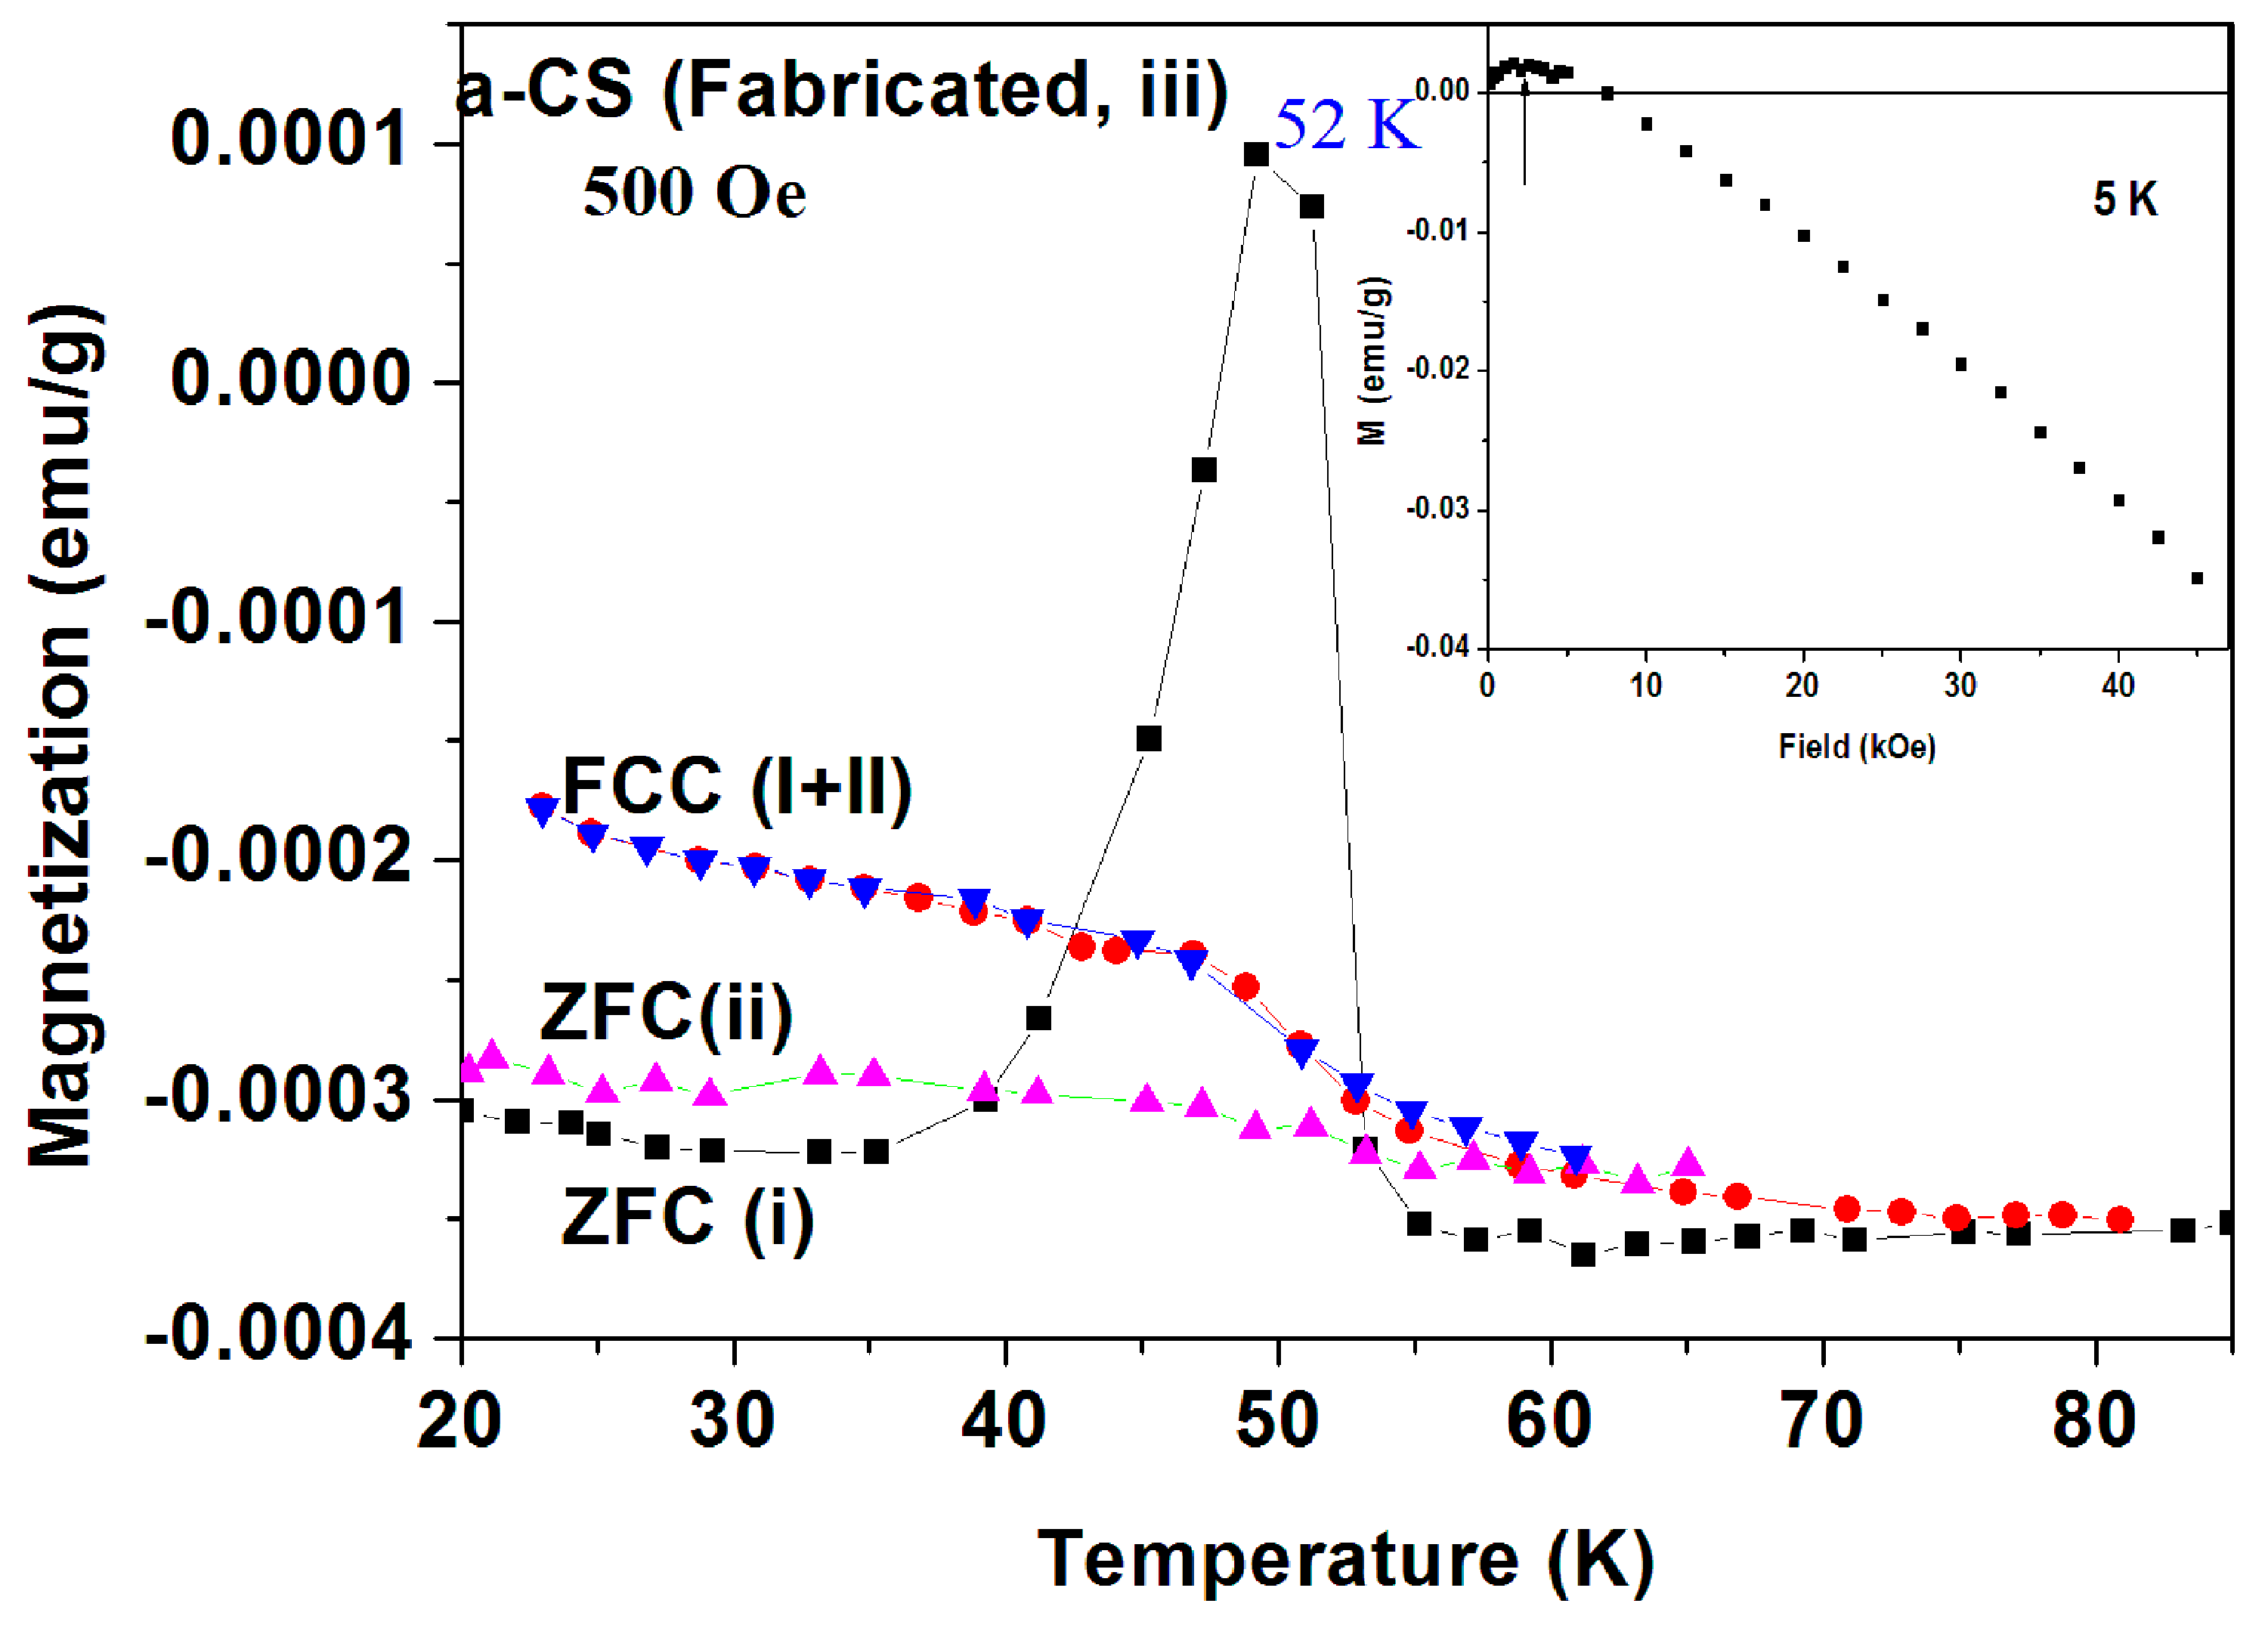
Sample 1(part III). In order to explore the peak nature in the ZFC branch, we show in
Figure 15 the measurements at 500 Oe of sample 3 (part III) where two ZFC and FC processes were performed. The protocol of
Figure 15 is as follows. (a) In order to shorten the elapsing time between the two measurements and to eliminate the PM contribution, the measurements were started at 20 K and
H = 0. Then, the field was turned on to 500 Oe to trace ZFC(i) curve; (b) At 150 K, the FCC(i) (via cooling) plot was measured back to 20 K; (c)
H was switched off, the SQUID was heated to RT and immediately cooled back to 20 K; (d) The field was switched back on to 500 Oe to record the ZFC(ii) up to 70 K and (e) the FCC(ii) process was completed.
Similar to
Figure 11, the pronounced peak around 52 K in the ZFC(i) run did not show up in the FCC(i) plot which crosses the ZFC(i) one at 42 and 53 K (ZFC > FC, puzzle 1). Moreover, this peak is totally suppressed in the ZFC(ii) curve which was measured shortly later (puzzle 2). It is interesting to note that FCC(i) coincides with FCC(ii), indicating that the peak in ZFC(i) does not stem from adsorbed oxygen, and is not an experimental artifact. This also proves that the sample was not damaged and that no extra magnetization was gained during these measurements. The
M(
H) at 5 K of the pyrolytic a-CS sample is shown in
Figure 16 (inset). Due to the small amount of magnetite and PM impurities,
M(
H) saturates at
Ms = 0.0021 emu/g and then becomes diamagnetic. This
Ms value corresponds to 20.3 ppm of Fe
3O
4 (
Ms = 94.5 emu/g) and fits well to Fe concentration accepted from ICP study reported above.
Sample 4 (part III). Figure 16 shows three sequences performed on another pyrolytic a-CS using the same protocol as for
Figure 15. Here again, the two puzzles are present and the two FCC branches overlap. For the sake of clarity, FCC(ii) is not shown. This material was restored under ambient conditions and re-measured 18 months later. Surprisingly, a broad peak in the ZFC(iii) run re-appears at 63 K. Although this temperature is lower than 75 K, the fact that the elusive ZFC peak is restored with time is appealing.
(iii)
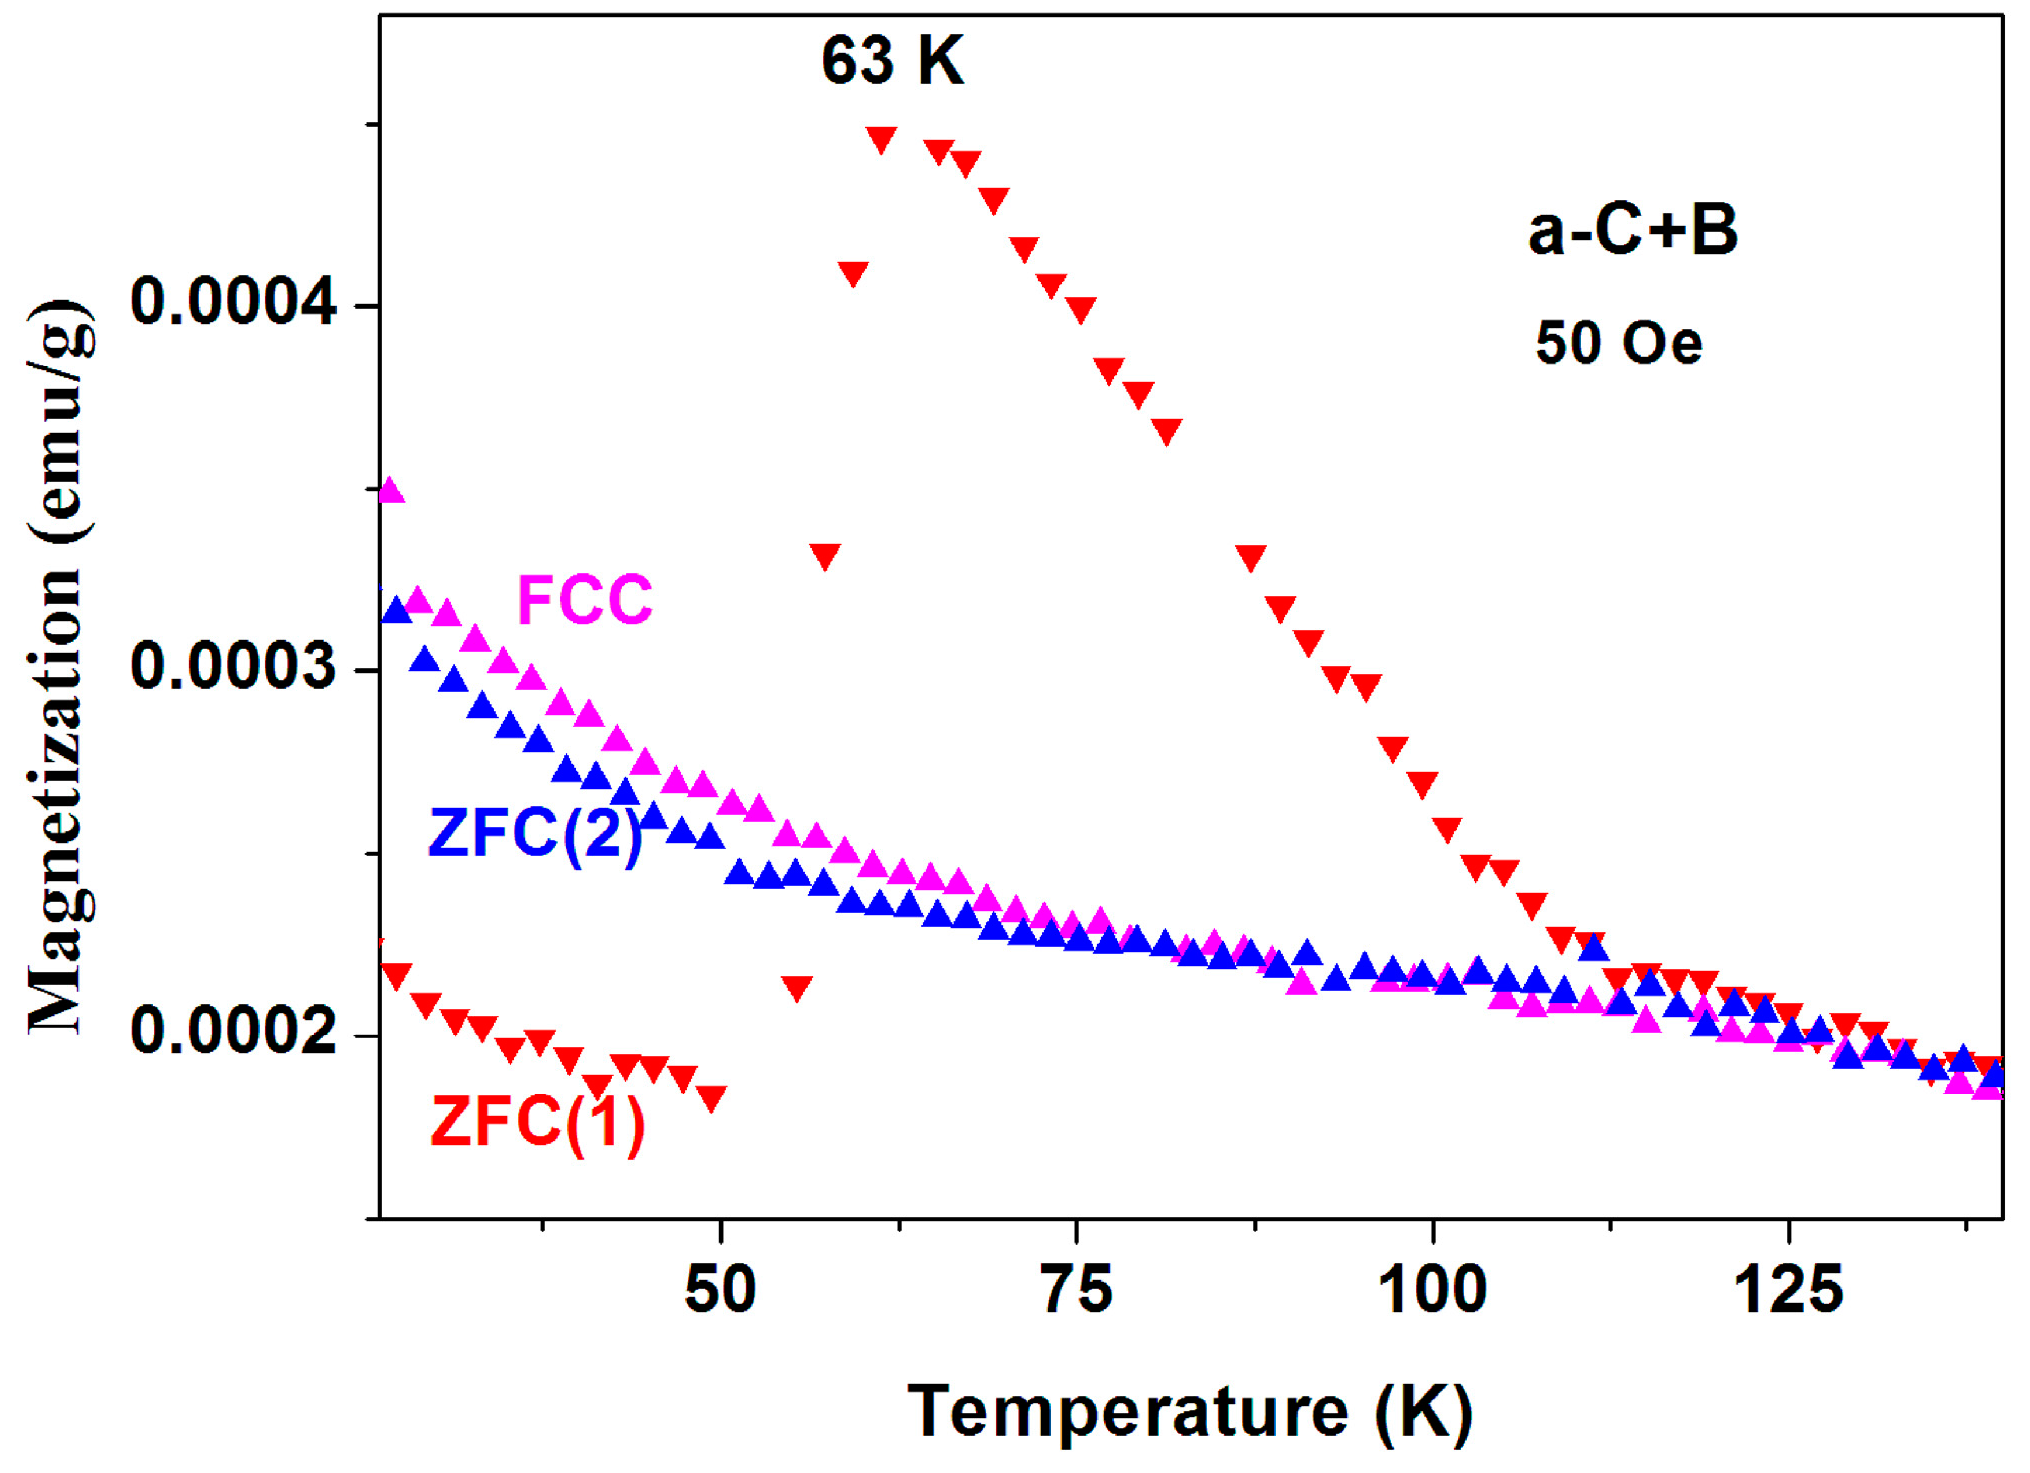
Magnetic studies of a-C+B and crystalline graphite. The same two puzzles described above have been observed in a mixture of pristine a-C and boron powders (instead of sulfur) reacted at 400 °C (a-C + B).
Figure 17 shows two ZFC and one FCC measured similarly to the protocol described previously. All the features described above appear here too. However, since this a-C powder contains sulfur, it is possible that this behavior is related to tiny a-CS fraction imbedded in the a-C + B matrix.
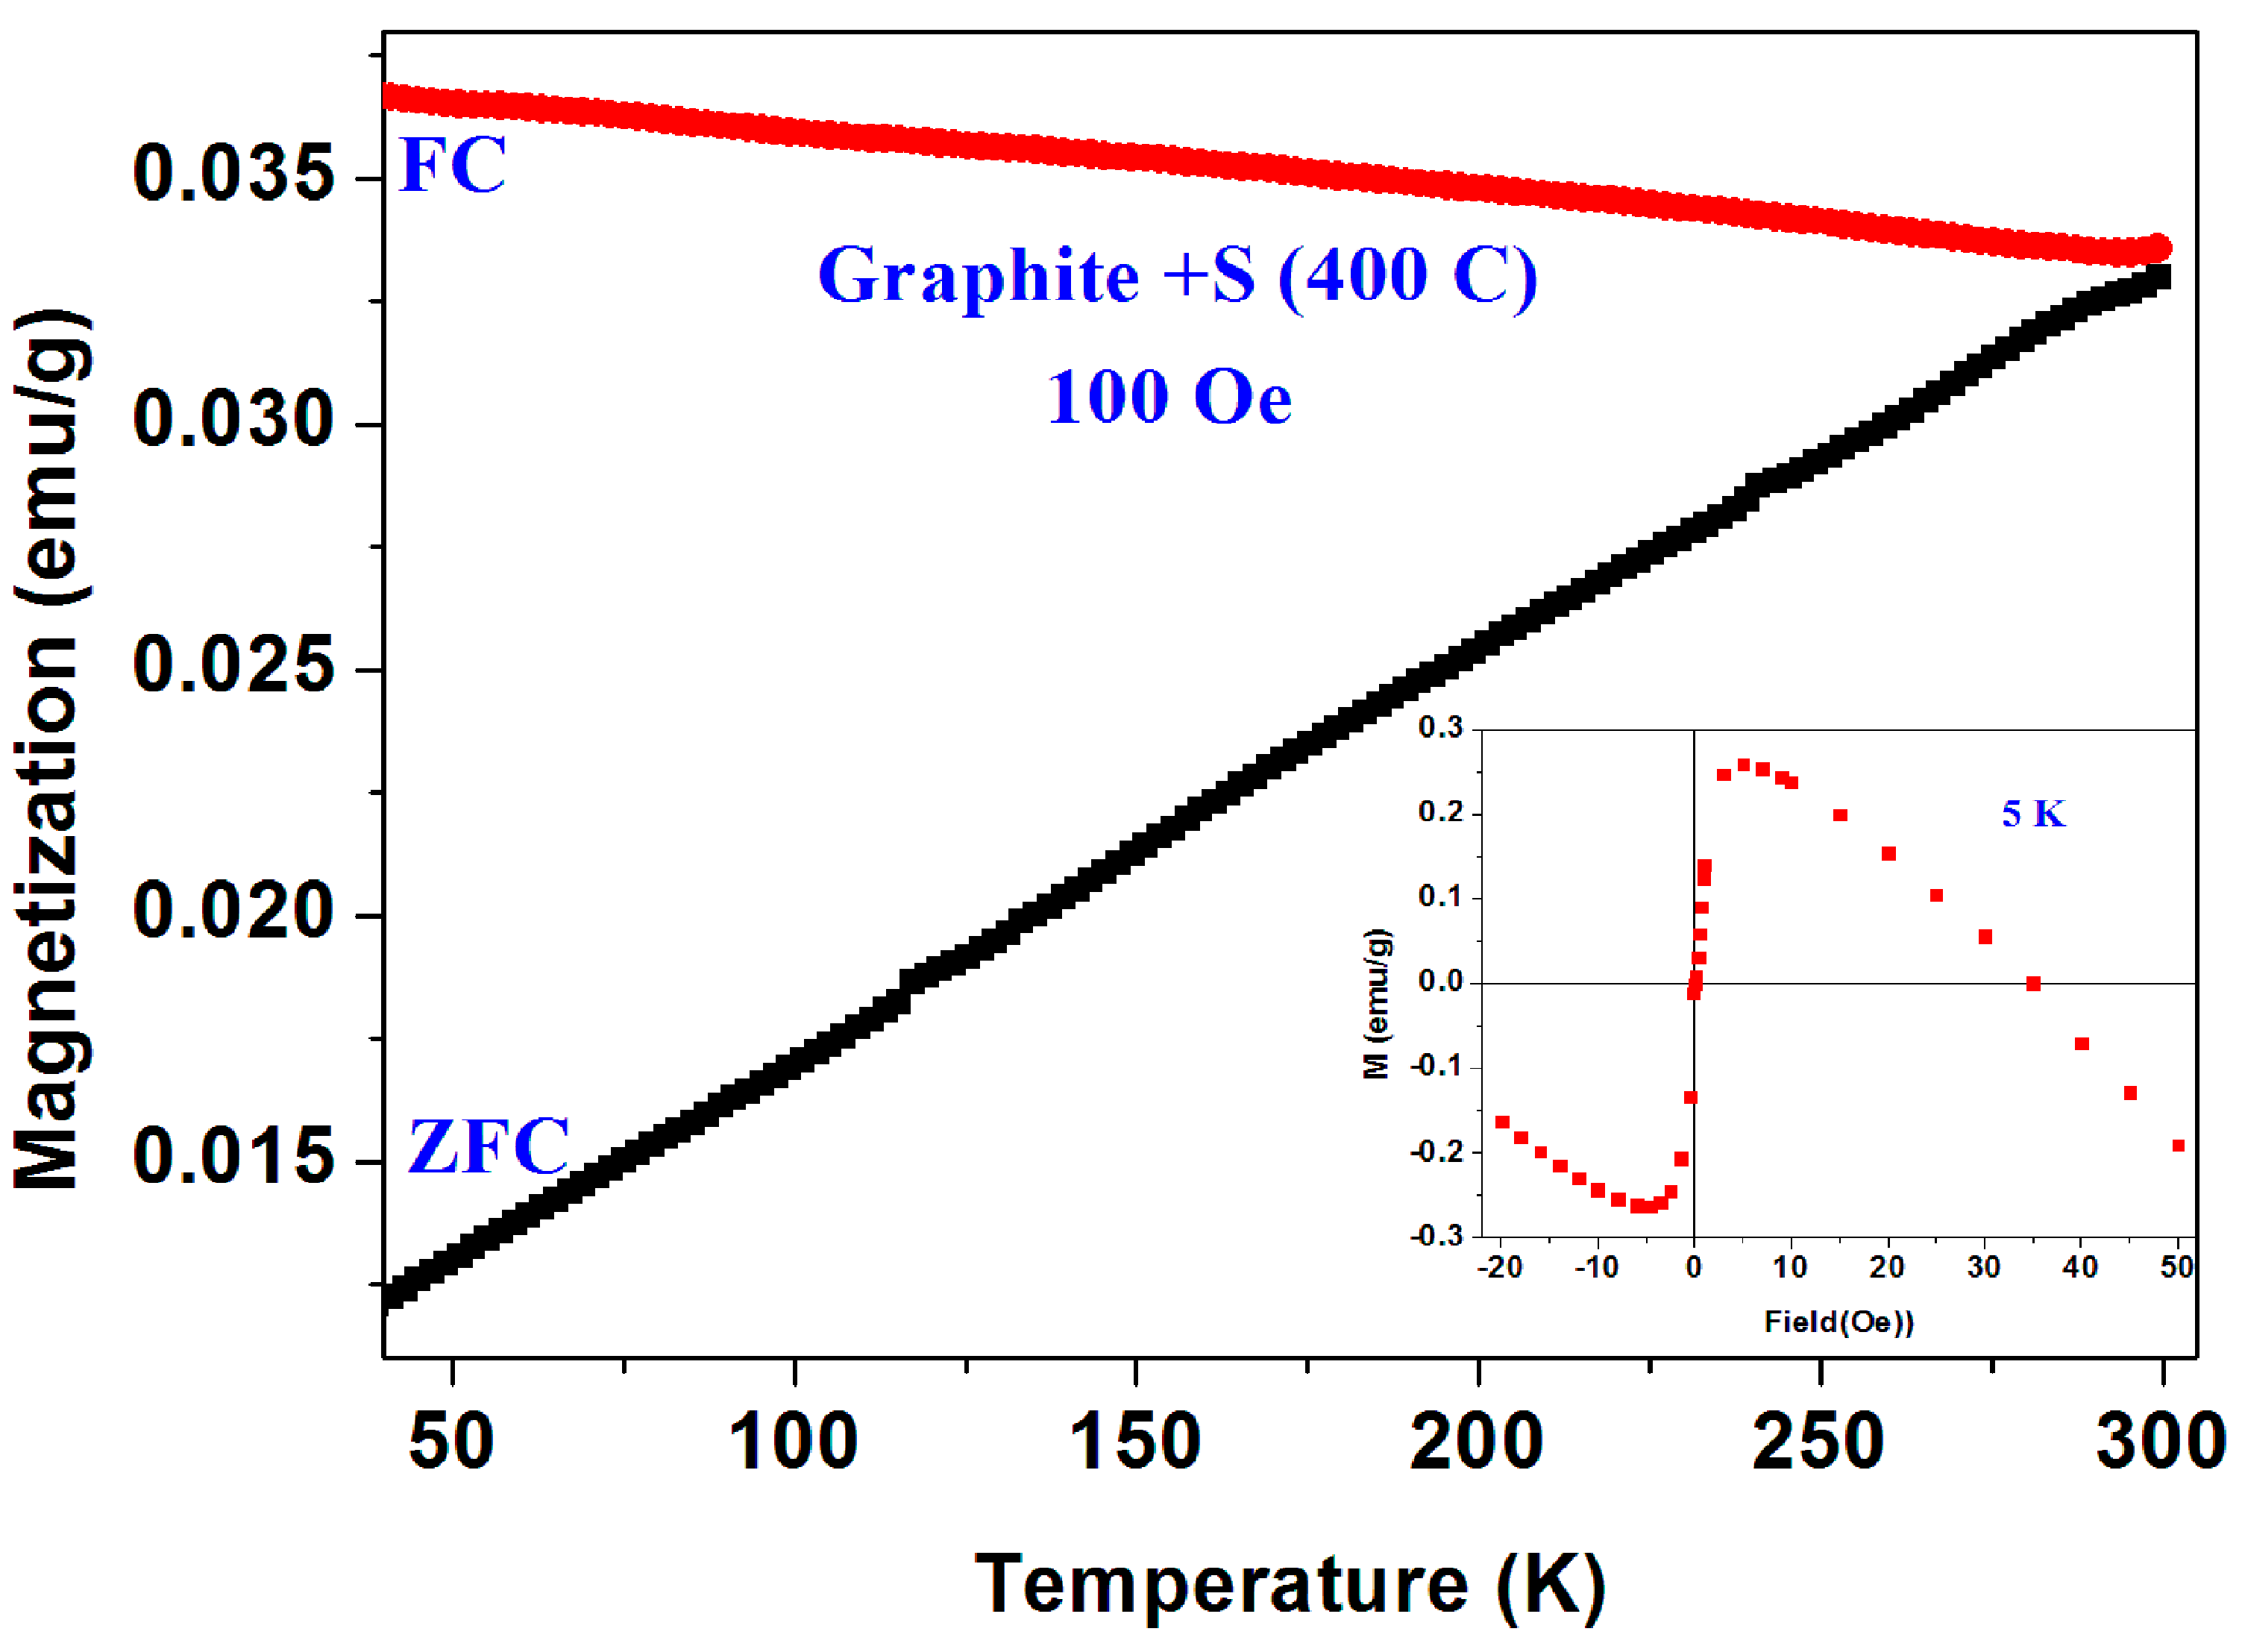
As a final point of interest,
Figure 18 shows magnetic studies performed on a mixture of crystalline graphite (BDH) and sulfur which was synthesized at 400 °C under the same conditions described above. The magnetic impurities traces (not determined) dictate the plots shape in
Figure 18. None of the two mentioned puzzles are observed here. The results obtained are consistent with resent data published on highly ordered pyrolytic graphite (HOPG) [
30].
The accumulated experimental results of both inhomogeneous commercial and fabricated a-C powders (
Figure 9,
Figure 10,
Figure 11,
Figure 12,
Figure 13,
Figure 14,
Figure 15,
Figure 16 and
Figure 17) can be summarized as follows: (1) Both powders are magnetically inhomogeneous; (2) The materials and their a-CS products contain traces of Fe
3O
4 and PM impurities; (3) At low applied fields, a few a-C powders reveal huge peaks in their ZFC curves at 50–80 K and their positions and relative amplitudes are sample and field dependent; (4) In a-CS, the FC curves cross the ZFC ones, (puzzle 1); (5) These peaks are present in the first ZFC(i) runs only and suppressed in the ZFC(ii) or FC processes performed very shortly later (puzzle 2); (6) This peak re-appears after 18 months (
Figure 16); (7) The two puzzles are also observed in a-C + B but not in crystalline graphite; (9) The two puzzles are intrinsic properties of the a-CS materials. Even if this maximum is related to extra magnetic impurities, the mechanisms that produce such anomalies still remain unclear; (10) This complex inhomogeneity does not allow neither to measure twice the same material nor to reproduce the results even for two samples taken from the same batch. Obviously, the two puzzles are inter-related and connected to each other and it is quite obvious that the first puzzle is a direct consequence of the second one. Since these peaks appear only in the ZFC(i) plots, the following ZFC(ii) and/or the FC branches behave “normally” as shown in
Figure 2 and
Figure 3. The main problem remains as to the origin of the elusive peaks as discussed hereafter.


