2.1. Structural Study
The crystal structure of [Fe(qsal-Cl)(thsa)]∙MeCN,
1 has been examined at 100 K. The data revealed that the structure crystallizes in the triclinic, P
system and there are two neutral molecules of [Fe(qsal-Cl)(thsa)] in the asymmetric units together with two molecules of MeCN solvent. There is, therefore, one molecule of MeCN per formula unit of the Fe(III) compound
1. After compound
1 had been left to dry under ambient conditions for 1 week, the crystal maintained its crystallinity and was still suitable to provide the crystal structure at 100 K of the de-solvated phase, [Fe(qsal-Cl)(thsa)],
2. Compound
2 crystallized in the same crystal system as
1 with a slightly smaller cell volume by about 13 Å
3. The crystallographic data are shown in
Table S1. The asymmetric unit of compound
2 also shows two neutral molecules of [Fe(qsal-Cl)(thsa)] but without any trace of solvent molecules (
Figure 1). It results in a calculated accessible void of about 12% of the unit cell volume (307 Å
3) which is larger than that in the unsubstituted related compound [Fe(qsal)(thsa)],
3 (10 %, 244 Å
3) [
3].
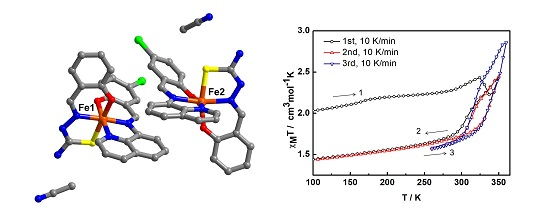
Figure 1.
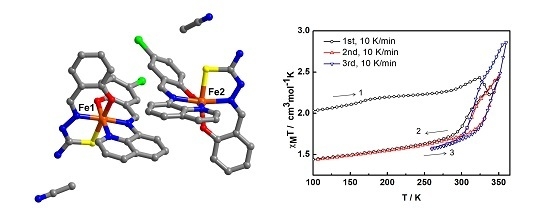
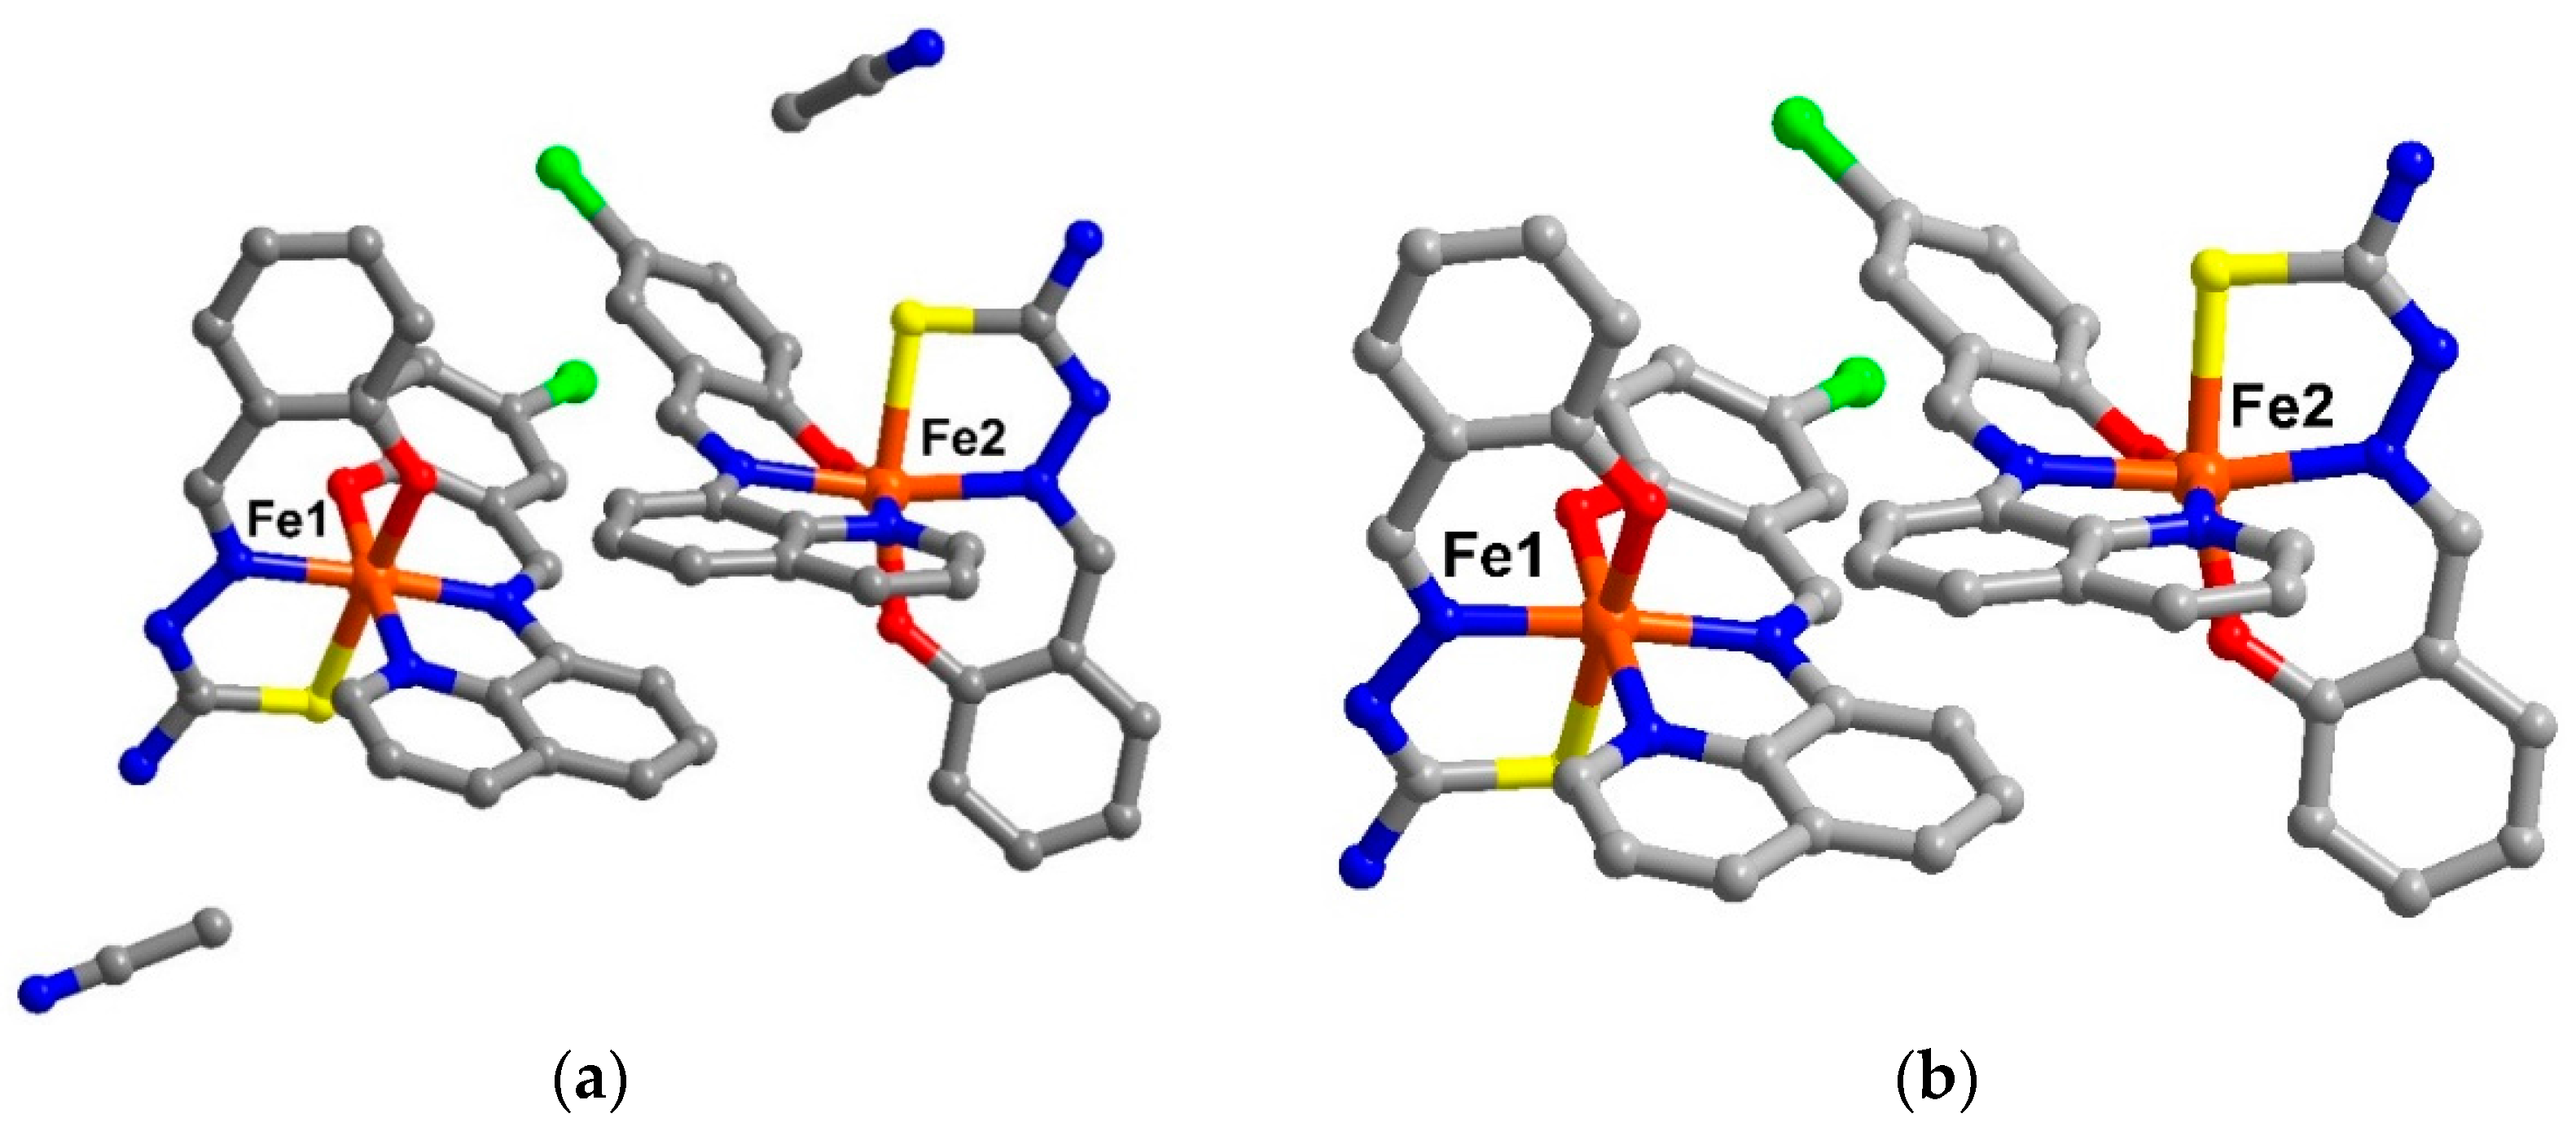
The asymetric unit of (a) solvate form, compound 1 and (b) de-solvate form, compound 2 (hydrogen atoms are omitted for clarity).
Figure 1.
The asymetric unit of (a) solvate form, compound 1 and (b) de-solvate form, compound 2 (hydrogen atoms are omitted for clarity).
The Fe(III) centres in compounds
1 and
2 are coordinated to a qsal
− and a thsa
2− ligand in meridional fashion. For Fe1, the Fe-L bond lengths (Fe–O ≈ 1.87-1.91, Fe–N ≈ 1.93-1.97, Fe–S ≈ 2.22 Å) and low octahedral distortion parameters (Ʃ ≈ 40–44 and Θ ≈ 77–79) [
4,
5] are indicative of the LS state. Whilst at the Fe2 centre, the average bond lengths are longer than those of the Fe1 by about 0.04, 0.18, and 0.21 Å for Fe–O, Fe–N, and Fe–S, respectively. These are consistent with the larger distortion parameters (
Table S2) and are typical for HS Fe(III). They, thus, define the mixture of LS and HS states of Fe(III) for compound
1 and
2 at low temperature.
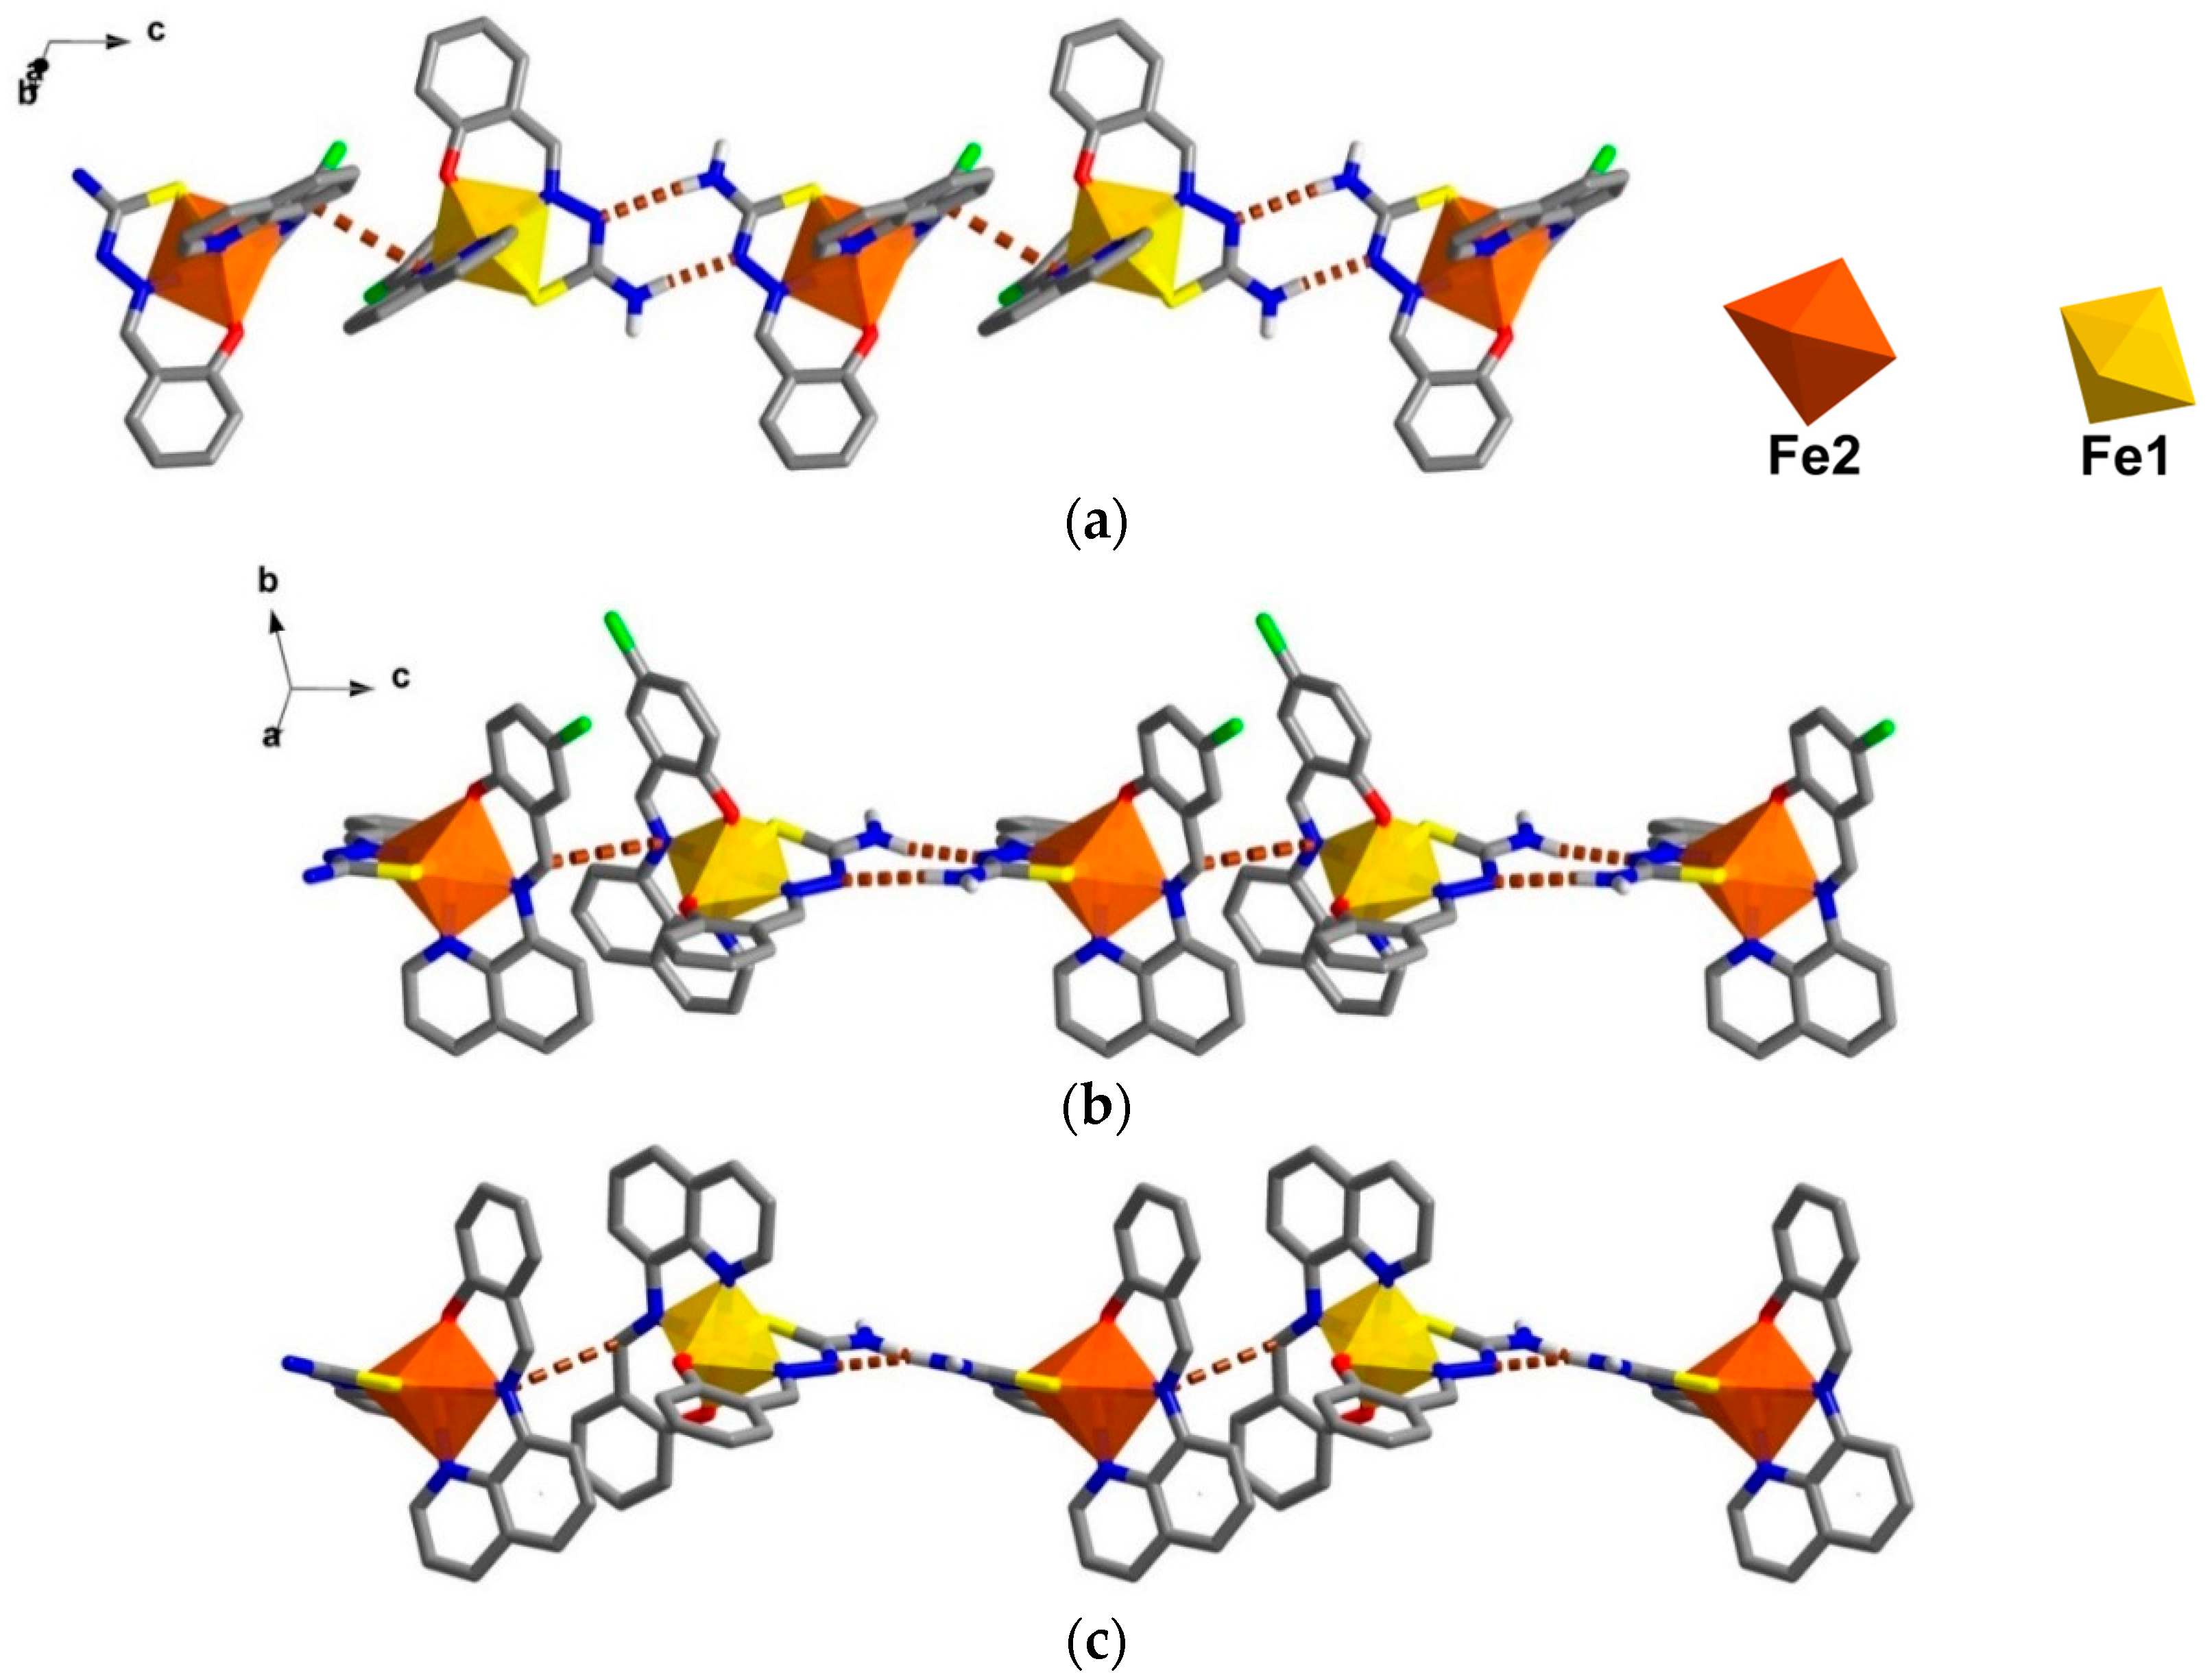
The crystal packing for the solvate,
1, and the de-solvated compound,
2, are intriguingly identical. A chain along the
c axis connects through π-π and N-H∙∙∙N interactions resulting in a Fe1-Fe2-Fe1 chain connectivity which is a similar situation to that found in
3. However, the π-π interactions are different, since in
1 they connect the sal-sal and quin-quin rings but they connect sal-quin rings in the case of
3, as shown in
Figure 2. Consequently, the different packing from
3 is observed in a higher dimension. These chains form double chains along the
c axis through π-π interactions involving the thsa
2− ligand. This gives rise to a free cavity for the MeCN solvent to occupy in compound
1 or be absent from in compound
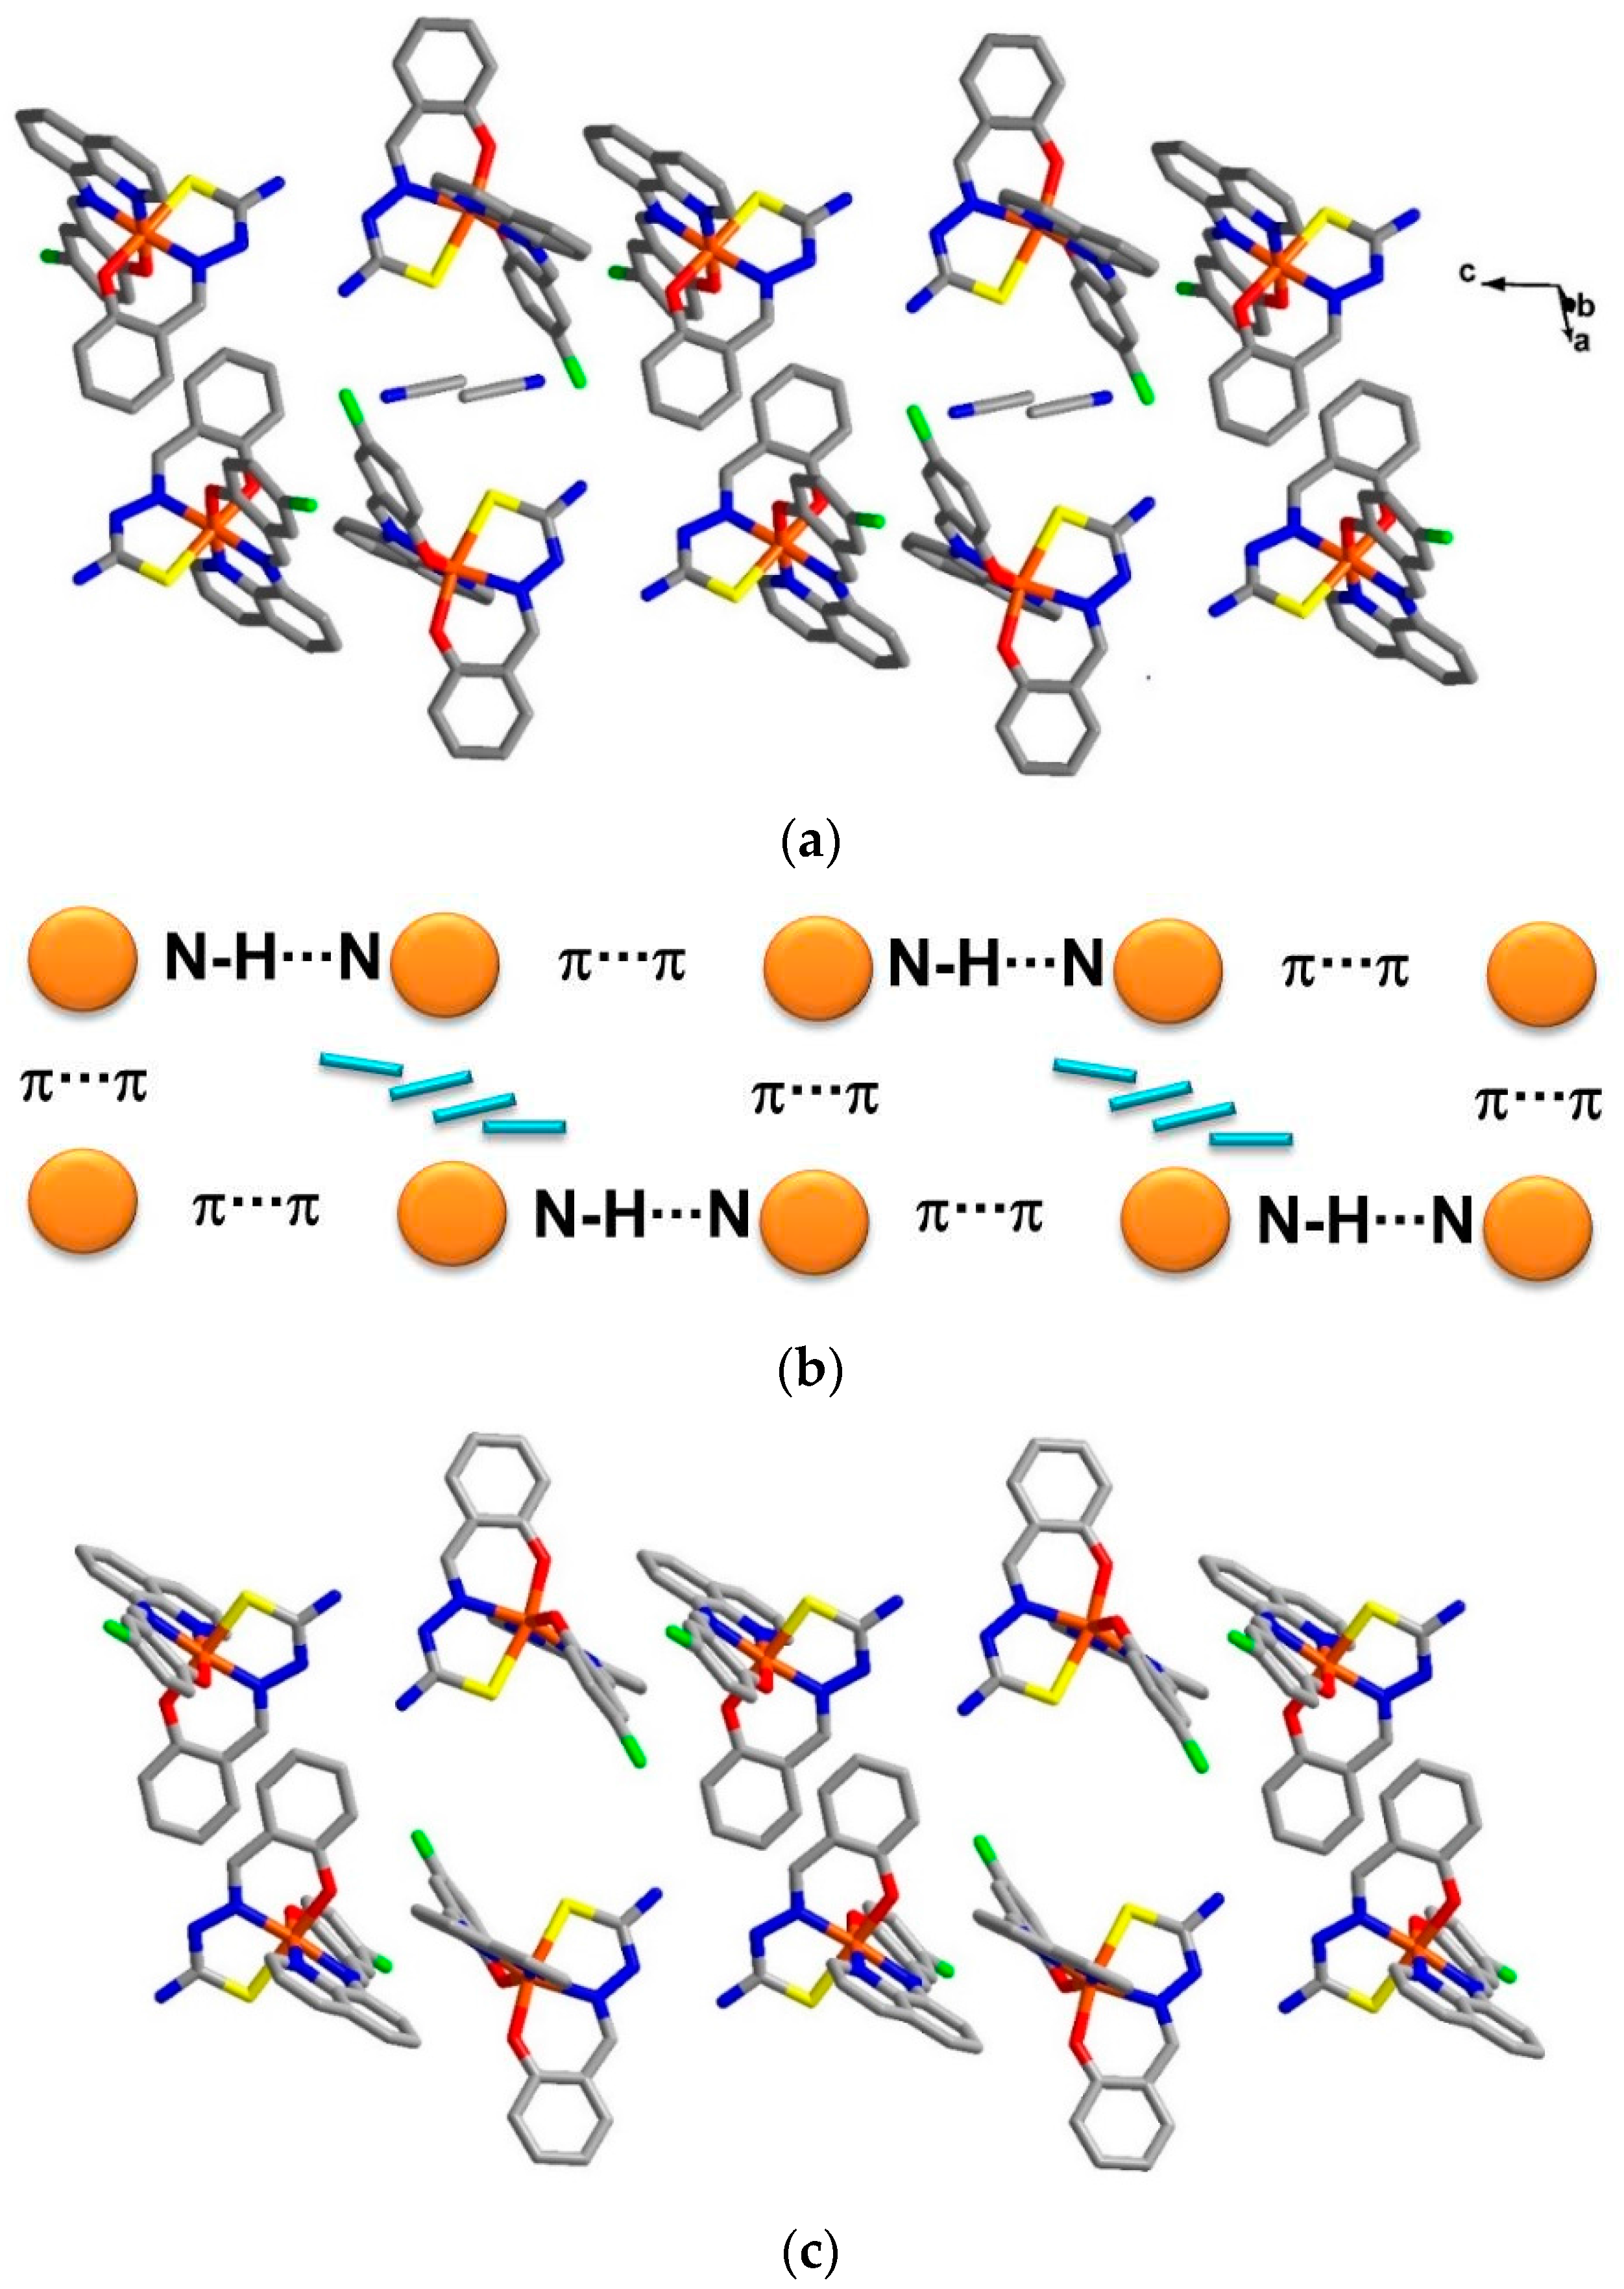
2. Moreover, there are C–H∙∙∙Cl and two sets of P4AE (Parallel Four Fold Aryl Embrace) [
6] interactions along the
a axis that forms a double helix-like chain (
Figure S1) and there are Fe1-Fe1 chains that connect through π-π interactions of qsal-qsal and thsa-thsa ligands along diagonal
ab axes that mainly hold the sheet in a
pseudo-3D structure (
Figure S2). All detail of intermolecular interactions and simplified packing schemes are presented in
Table S3 and
Figure S3. As mentioned ealier, the structural packing as well as the intermolecular interactions, in
1 and
2, are really alike (
Figure 3) with small differences compared to those are found in
3. This confirms that the strong rigidity of the frameworks of [Fe(qsal-X)(thsa)] (where X = H,
3 and Cl ,
1) is able to maintain the framework even during de-solvation processes. Such behaviour is rarely observed in isolated molecular systems.
Figure 2.
(a) π-π and N-H∙∙∙N interactions connecting Fe moieties along the c axis producing Fe1-Fe2-Fe1-Fe2 chains in compound 1; (b) π-π interactions connecting sal-sal and quin-quin moieties in 1; and (c) π-π interactions in 3 connecting sal-quin moieties.
Figure 2.
(a) π-π and N-H∙∙∙N interactions connecting Fe moieties along the c axis producing Fe1-Fe2-Fe1-Fe2 chains in compound 1; (b) π-π interactions connecting sal-sal and quin-quin moieties in 1; and (c) π-π interactions in 3 connecting sal-quin moieties.
Figure 3.
Double chains along the c axis in (a) compound 1; (b) a simplified scheme of related interactions and (c) compound 2.
Figure 3.
Double chains along the c axis in (a) compound 1; (b) a simplified scheme of related interactions and (c) compound 2.
2.2. Magnetism
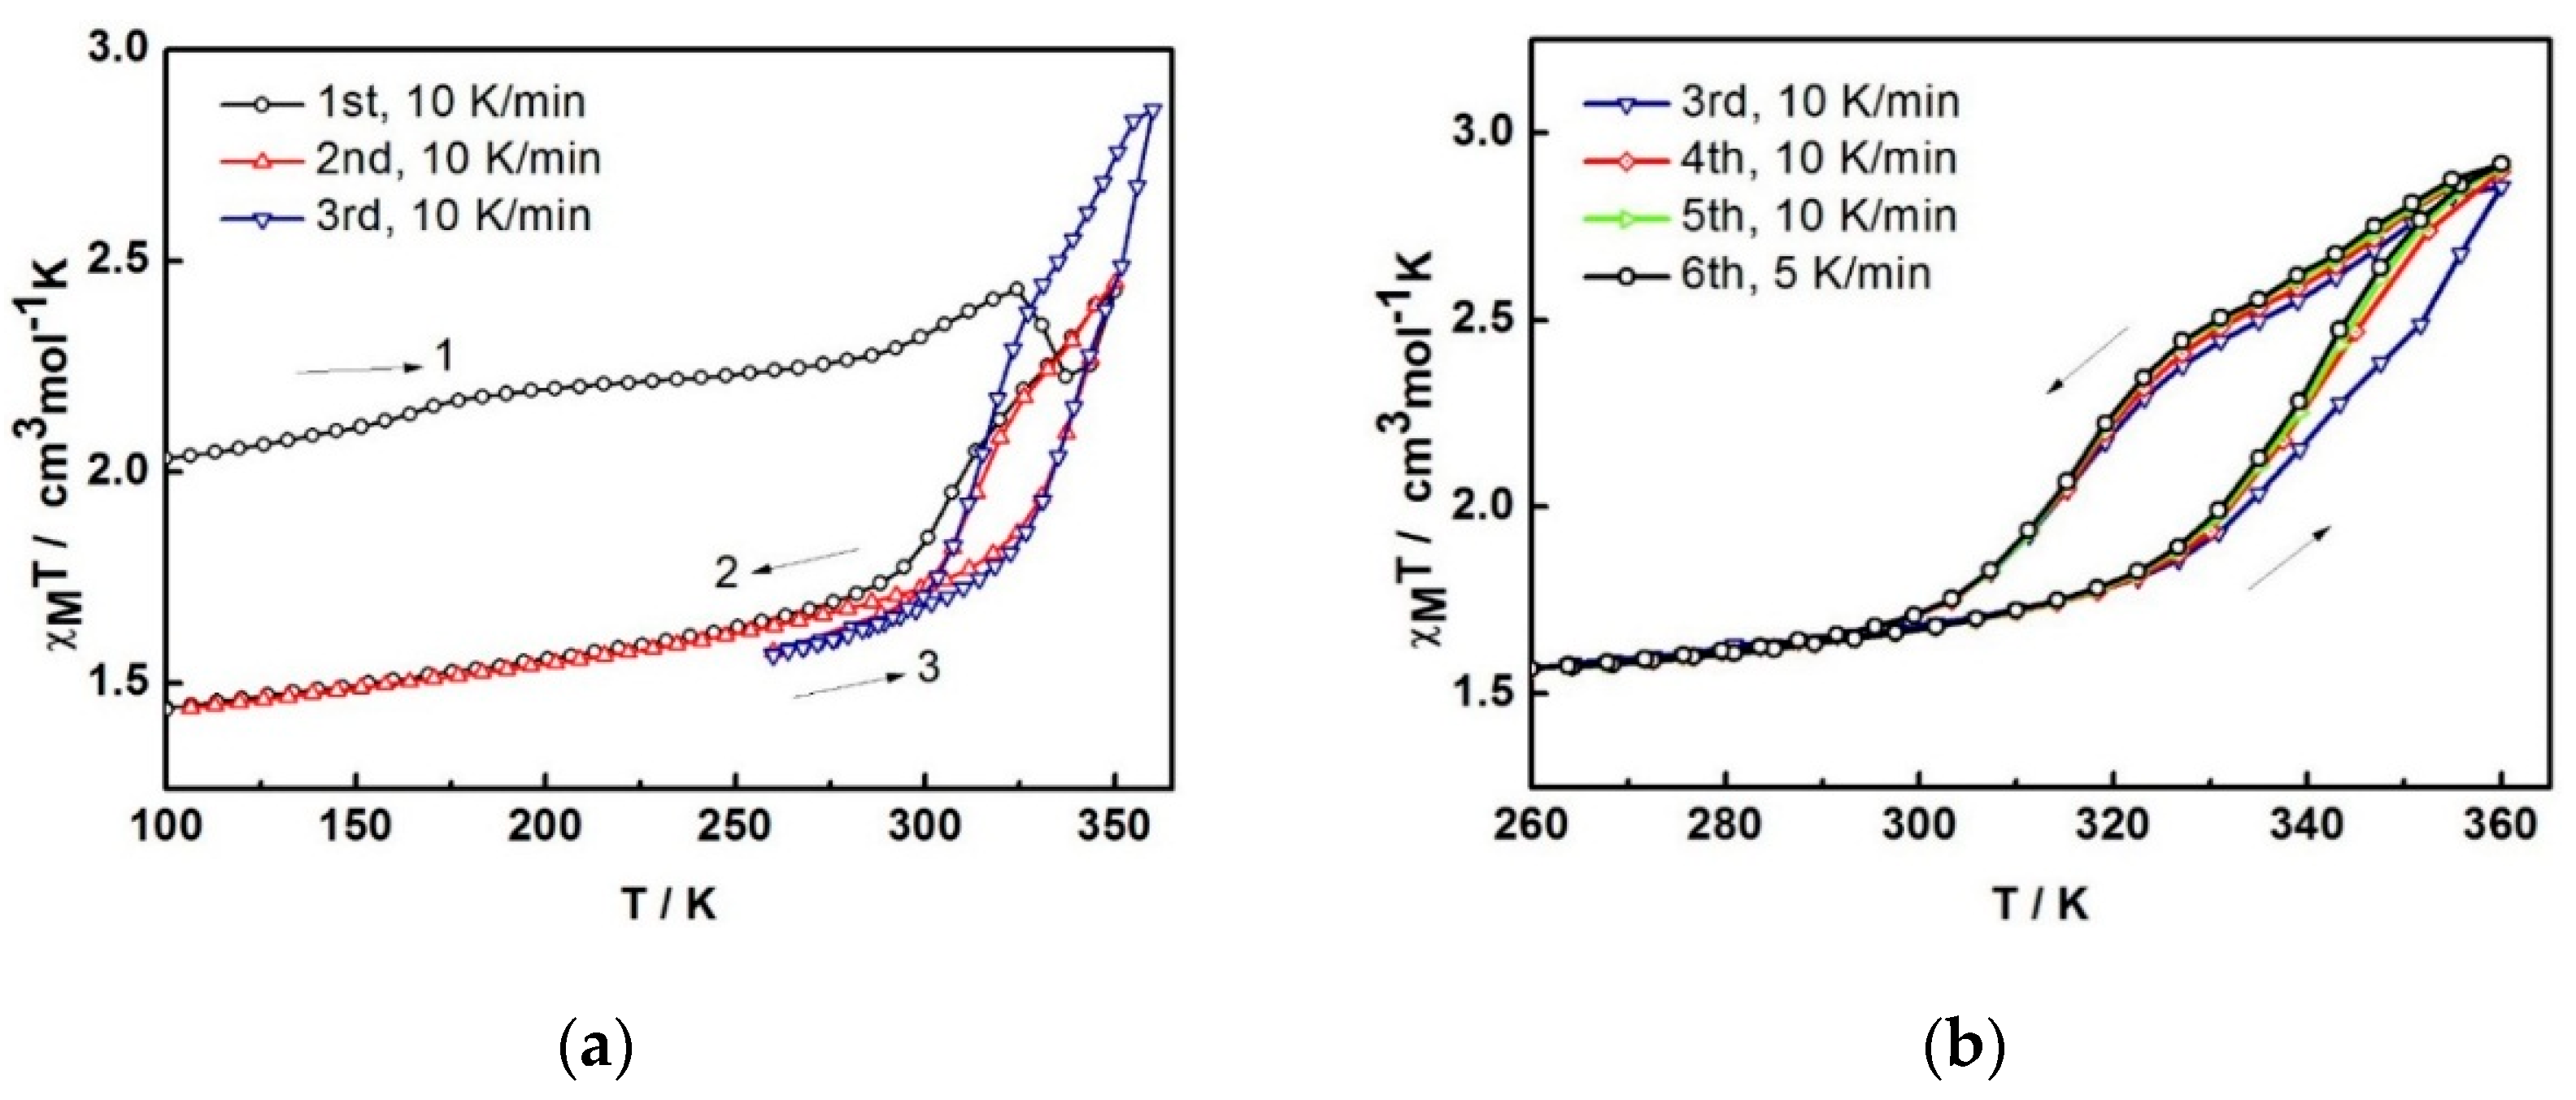
The variable-temperature magnetic susceptibility data for the compounds were measured between 100 and 360 K and are illustrated in
Figure 4. The data are unusual and repeatable using freshly-prepared samples. Compound
1 was freshly removed from the mother liquor and held in an unsealed gel capsule without Vaseline coating. The sample was quench-cooled to 100 K and the measurements started at low temperature. In
Figure 4a, at 100 K, the χ
MT of 2.03 cm
3 K mol
−1 is consistent with the single crystal structure that indicates the mixture of LS and HS states present at 100 K. Warming up to 324 K, the magnetic susceptibility slightly increases up to 2.43 cm
3 K mol
−1. After that, it unpredictably fluctuates, decreasing to 2.22 cm
3 K mol
−1 at 337 K and increasing back again to reach the maximum of 2.43 cm
3 K mol
−1 at 350 K. Upon cooling, the magnetic susceptibility drops to 1.74 cm
3 K mol
−1 at 288 K and gradually decreases to reach 1.44 cm
3 K mol
−1 at 100 K. For the second cycle, the profile repeats the cooling mode in the first cycle and faintly rise up to 1.86 cm
3 K mol
−1 at 324 K before increasing again to 2.45 cm
3 K mol
−1 at 350 K. Notably, the heating plot in the second cycle overlaps with the heating plot in the first cycle after solvent loss above 337 K. Cooling down to 260 K, the plot are also similar to the cooling mode in the first run and results in the small hysteresis of 20 K (
T1/2↑ = 333 K and
T1/2↓ = 313 K). The spin transition region has been explored in detail and cycles-measured between 260–360 K. For the following cycles, the hysteresis is also observed with 20 K width (T
1/2↑ = 343 K and T
1/2↓ = 323 K) but it approaches the maximum χ
MT of 2.9 cm
3 K mol
−1 at 360 K. The magnetic profile is repeatable after the third cycle,
Figure 4b with a slightly smaller hysteresis width of 17 K (T
1/2↑ = 339 K and T
1/2↓ = 322 K) that is independent of the scan rate. Thus, it can be seen from the magnetic data of the sixth cycle, measured with a scan rate of 5 K/min, it is identical to the others measured at 10 K/min scan rate.
As the magnetic plot alters after the first heating run, we believe that this is a result of MeCN loss occurring
in situ during the magnetic measurement. The fluctuation noted between 324 and 350 K is similar to the magnetic plots reported in the first cycle for [Fe(bpp)
2][Cr(bpy)(ox)
2]
2∙2H
2O and [Fe(bpp)
2][Cr(phen)(ox)
2]
2∙0.5H
2O∙0.5MeOH (bpp = 2,6-bis(pyrazol-3-yl)pyridine) [
7]. We suggest that the Fe(III) centres in
1 are changing their spin state to the more stabilized LS phase after
1 has lost MeCN of solvation. However, it is immediately forced back to the HS state again, as the temperature increases. It, therefore, shows a rapid decrease followed by a rapid increase within about 25 K. The stable LS phase of the de-solvated compound is consistent with the lower magnetic susceptibility by about 0.6 cm
3 K mol
−1 in the following cycle at 100 K (2.03 cm
3 K mol
−1 and 1.44 cm
3 K mol
−1 for the solvated and desolvated phase, respectively). This contrasts with the behavior of compound
3 in which de-solvation gives rise to more stabilized HS phase and spin crossover concomitantly takes place from LS to HS [
3].
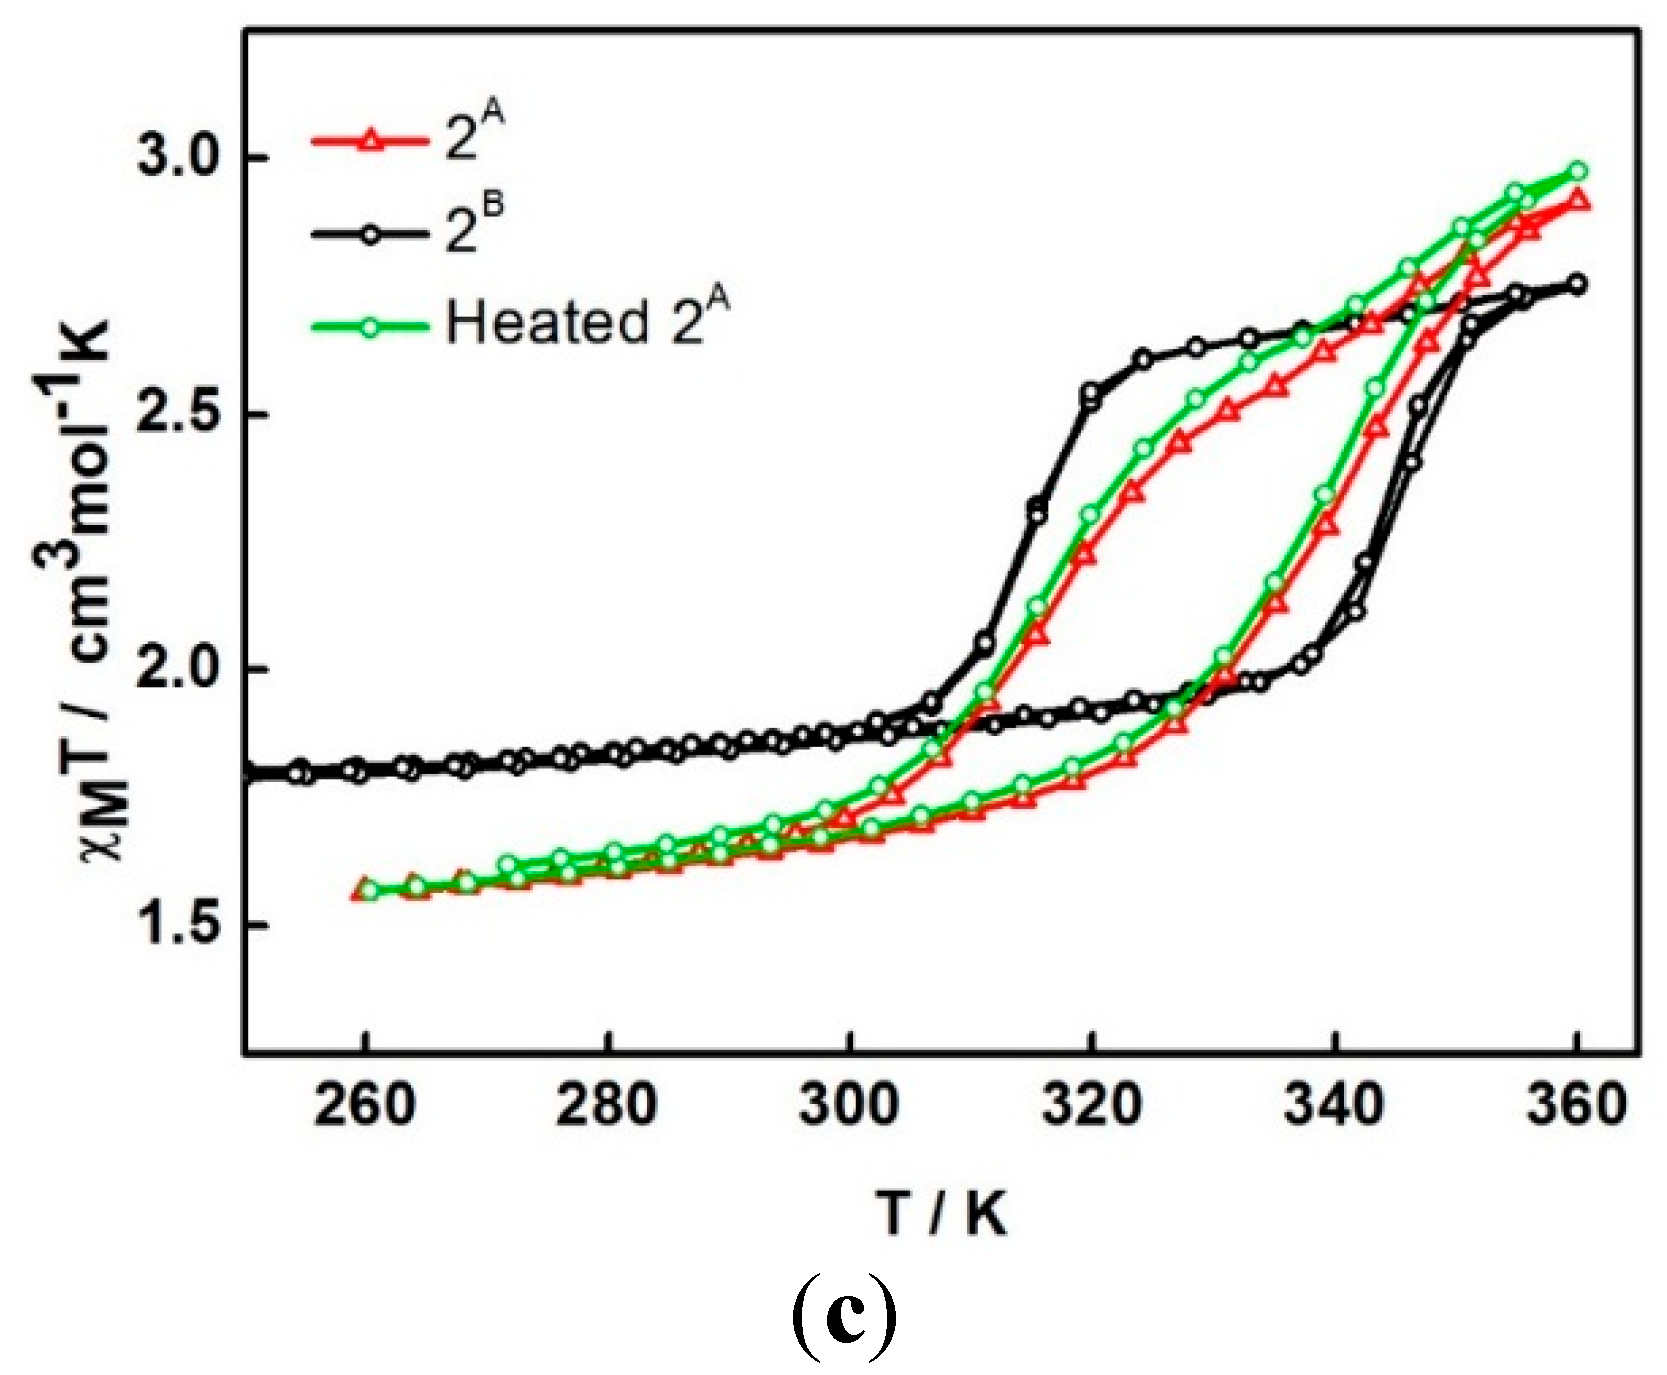
For the second cycle, the structure packing is assumed to re-orientate until reaching a stable phase,
2A, and provide the steady plot in the third cycle. The magnetic properties of a dry form has been investigated in detail. A fresh sample of compound
1 was heated under vacuum at 100 °C for 2 h to obtain the dry sample (see TGA result below). The magnetic plot for this dry sample is shown in
Figure 4c (
2B). It surprisingly shows a distinctly different plot from sample
2A i.e., incomplete spin crossover (χ
MT = 1.8 cm
3 K mol
−1 and 2.75 cm
3 K mol
−1 at 250 and 360 K, respectively) with an abrupt hysteresis width of 29 K (
T1/2↑ = 344 K and
T1/2↓ = 315 K). It is surprising and rather unpredictable that the magnetic profiles from the two drying methods are different and suggests that another dry phase,
2B, is formed. In a further examination of the stability of the de-solvated sample, after sample
2A obtained from the SQUID measurement, it was treated in the same way as sample
2B (heating at 100 °C for 2 h under vacuum). The magnetic data do not change, red and green in
Figure 4c are similar,
i.e., do not mimic
2B. It is thus indicative of the stability of the sample after the de-solvation process.
In regard to the structural packing, Cl substitution has been introduced on the qsal ligand and expected to provide a variety of intermolecular interactions and enhanced cooperativities in the compounds to be reflected in the magnetism. Along this line, C–H∙∙∙Cl and P4AE interactions are present. In regard to P4AE interactions, it is believed they are responsible for hysteresis occurring in Fe(III) spin crossover. [
8] Accordingly, the hysteresis width of about 30 K is observed in compound
1 but not in compound
3, the latter having an absence of P4AE interactions. This system, however, shows incomplete spin crossover. It is due to a difference in the core ligands of qsal
− and thsa
2− that do not support the symmetrically ordered packing originating from strong π-π interactions along the one-dimensional intermolecular chain [
9].
Figure 4.
The χMT versus T plots for 1 in (a) first to third cycles and (b) third to sixth cycles and (c) comparison of the plots among different heating methods; 2A is in situ de-solvated sample, 2B is external heating sample.
Figure 4.
The χMT versus T plots for 1 in (a) first to third cycles and (b) third to sixth cycles and (c) comparison of the plots among different heating methods; 2A is in situ de-solvated sample, 2B is external heating sample.
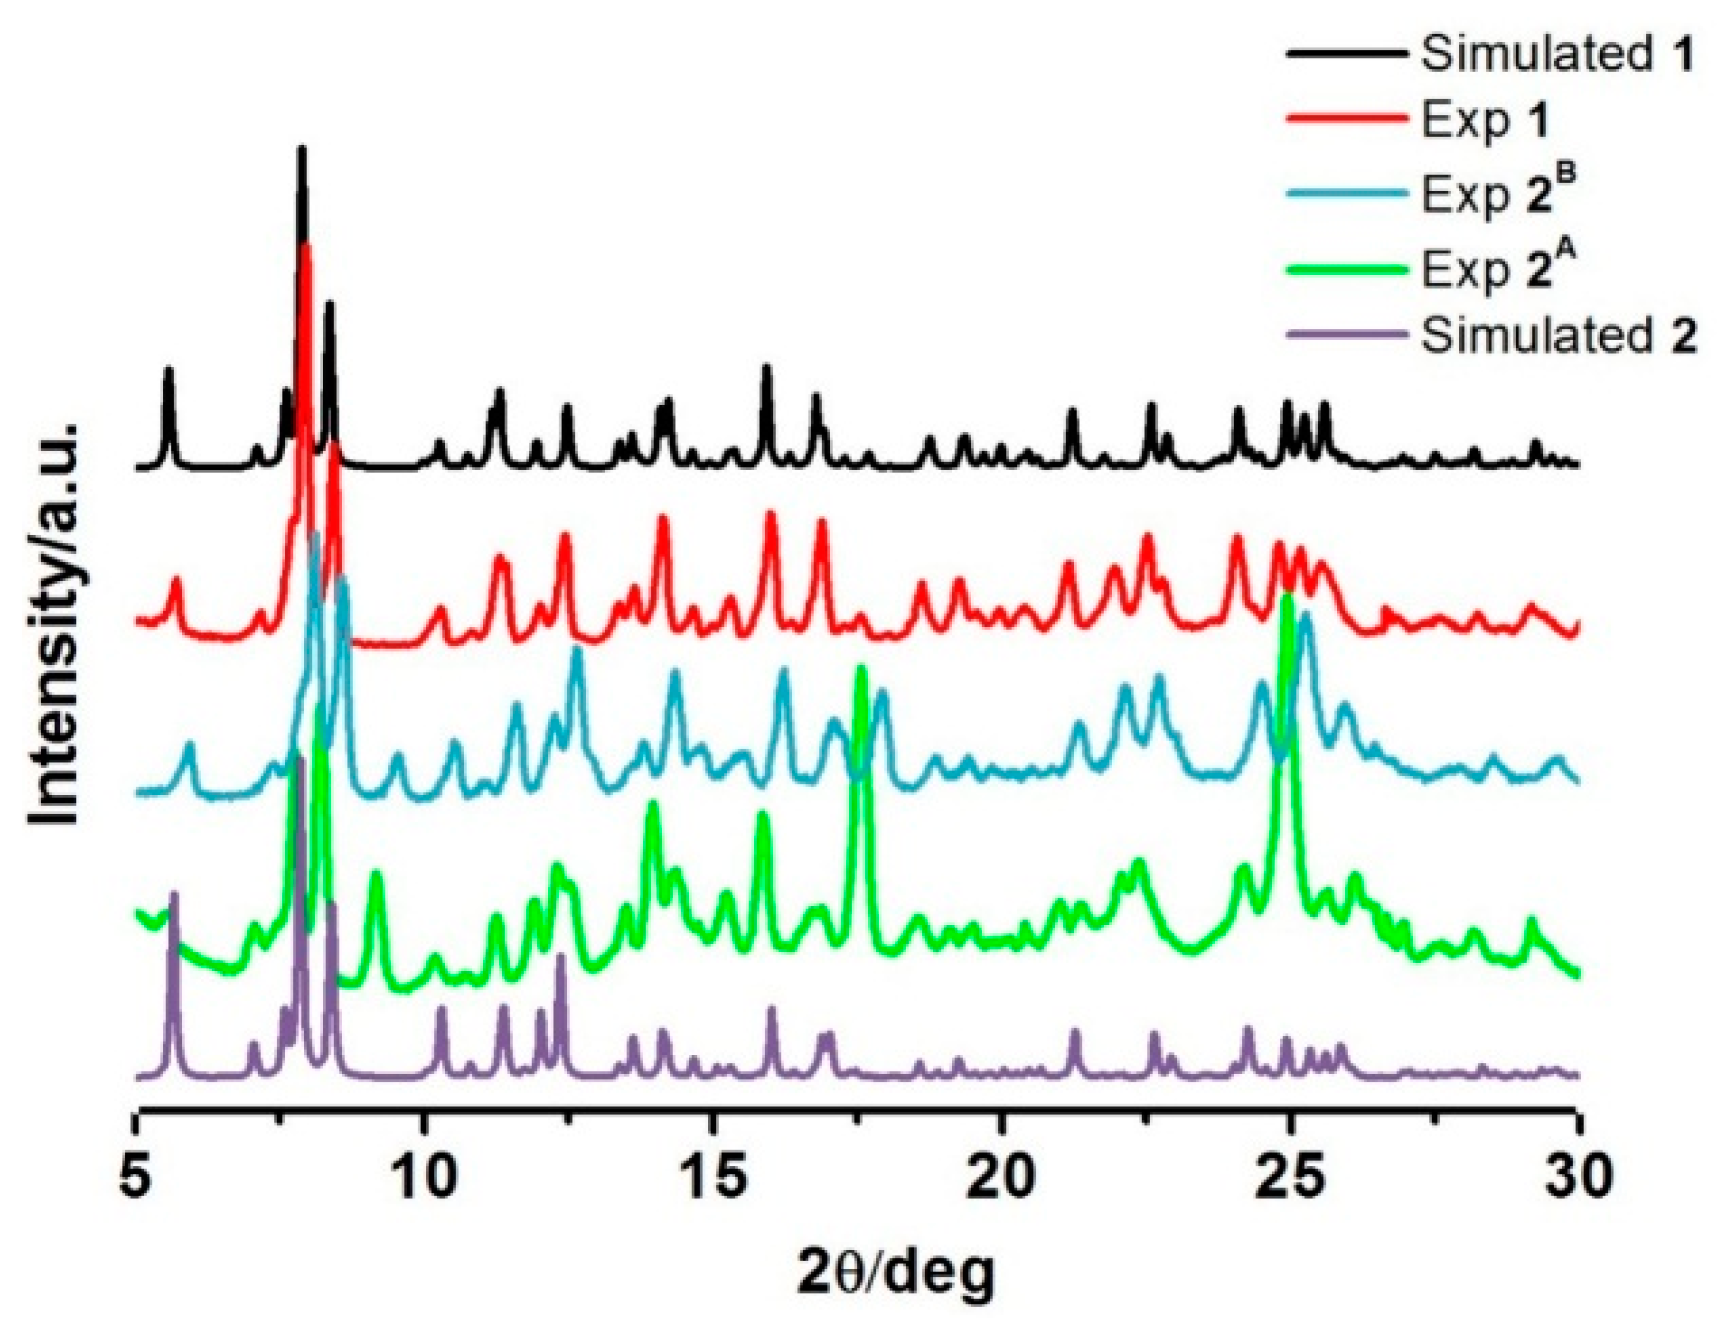
2.3. Powder Diffraction Data
As we have just seen, the magnetic properties of the two different drying-method samples,
2A and
2B, are different. PXRD was, therefore, examined to investigate the phase differences of the samples. All the experiments were performed at room temperature (
Figure 5). The PXRD plot for the fresh sample of
1 agrees well with that simulated from single crystal data, suggesting the bulk sample is a pure phase. For sample
2A and
2B, the patterns are mostly similar, however there are some peaks and relative intensities at 2θ = 9°, 17°, and 25° that are distinct and pose questions about the phase resemblance/purity. However, it is understandable that the PXRD patterns of these two phases are largely identical as they are expected to maintain similar structures as the magnetic properties exhibit some similarities of the hysteresis shape. Moreover, FT-IR spectra of the compounds are also comparative (
Figure S4). However, under various heating conditions, they possibly re-orientate during the de-solvation process in different fashions resulting in dissimilar structural packing. The simulated PXRD from single crystal data of de-solvated form
2 was created (
Figure 5). It is interesting to note that those peaks over the abovementioned ranges in
2A and
2B are different from what was observed in this simulation pattern. This suggests that compound
1 gives rise to three de-solvated forms by different de-solvation methods
i.e. under vacuum at 100 °C, dried
in situ during SQUID measurement and slow evaporation in ambient conditions. Unfortunately, we do not have enough information to confirm this assumption and conclude about the structure of
2A and
2B as they all lost crystallinity after de-solvation. Thus, we are unable to get single crystal data for them. Rietveld refinements are planned to get a better understanding about the packing in
2A and
2B.
Figure 5.
PXRD patterns of the compounds in comparison with the simulated PXRD from single crystal data for 1 and 2.
Figure 5.
PXRD patterns of the compounds in comparison with the simulated PXRD from single crystal data for 1 and 2.
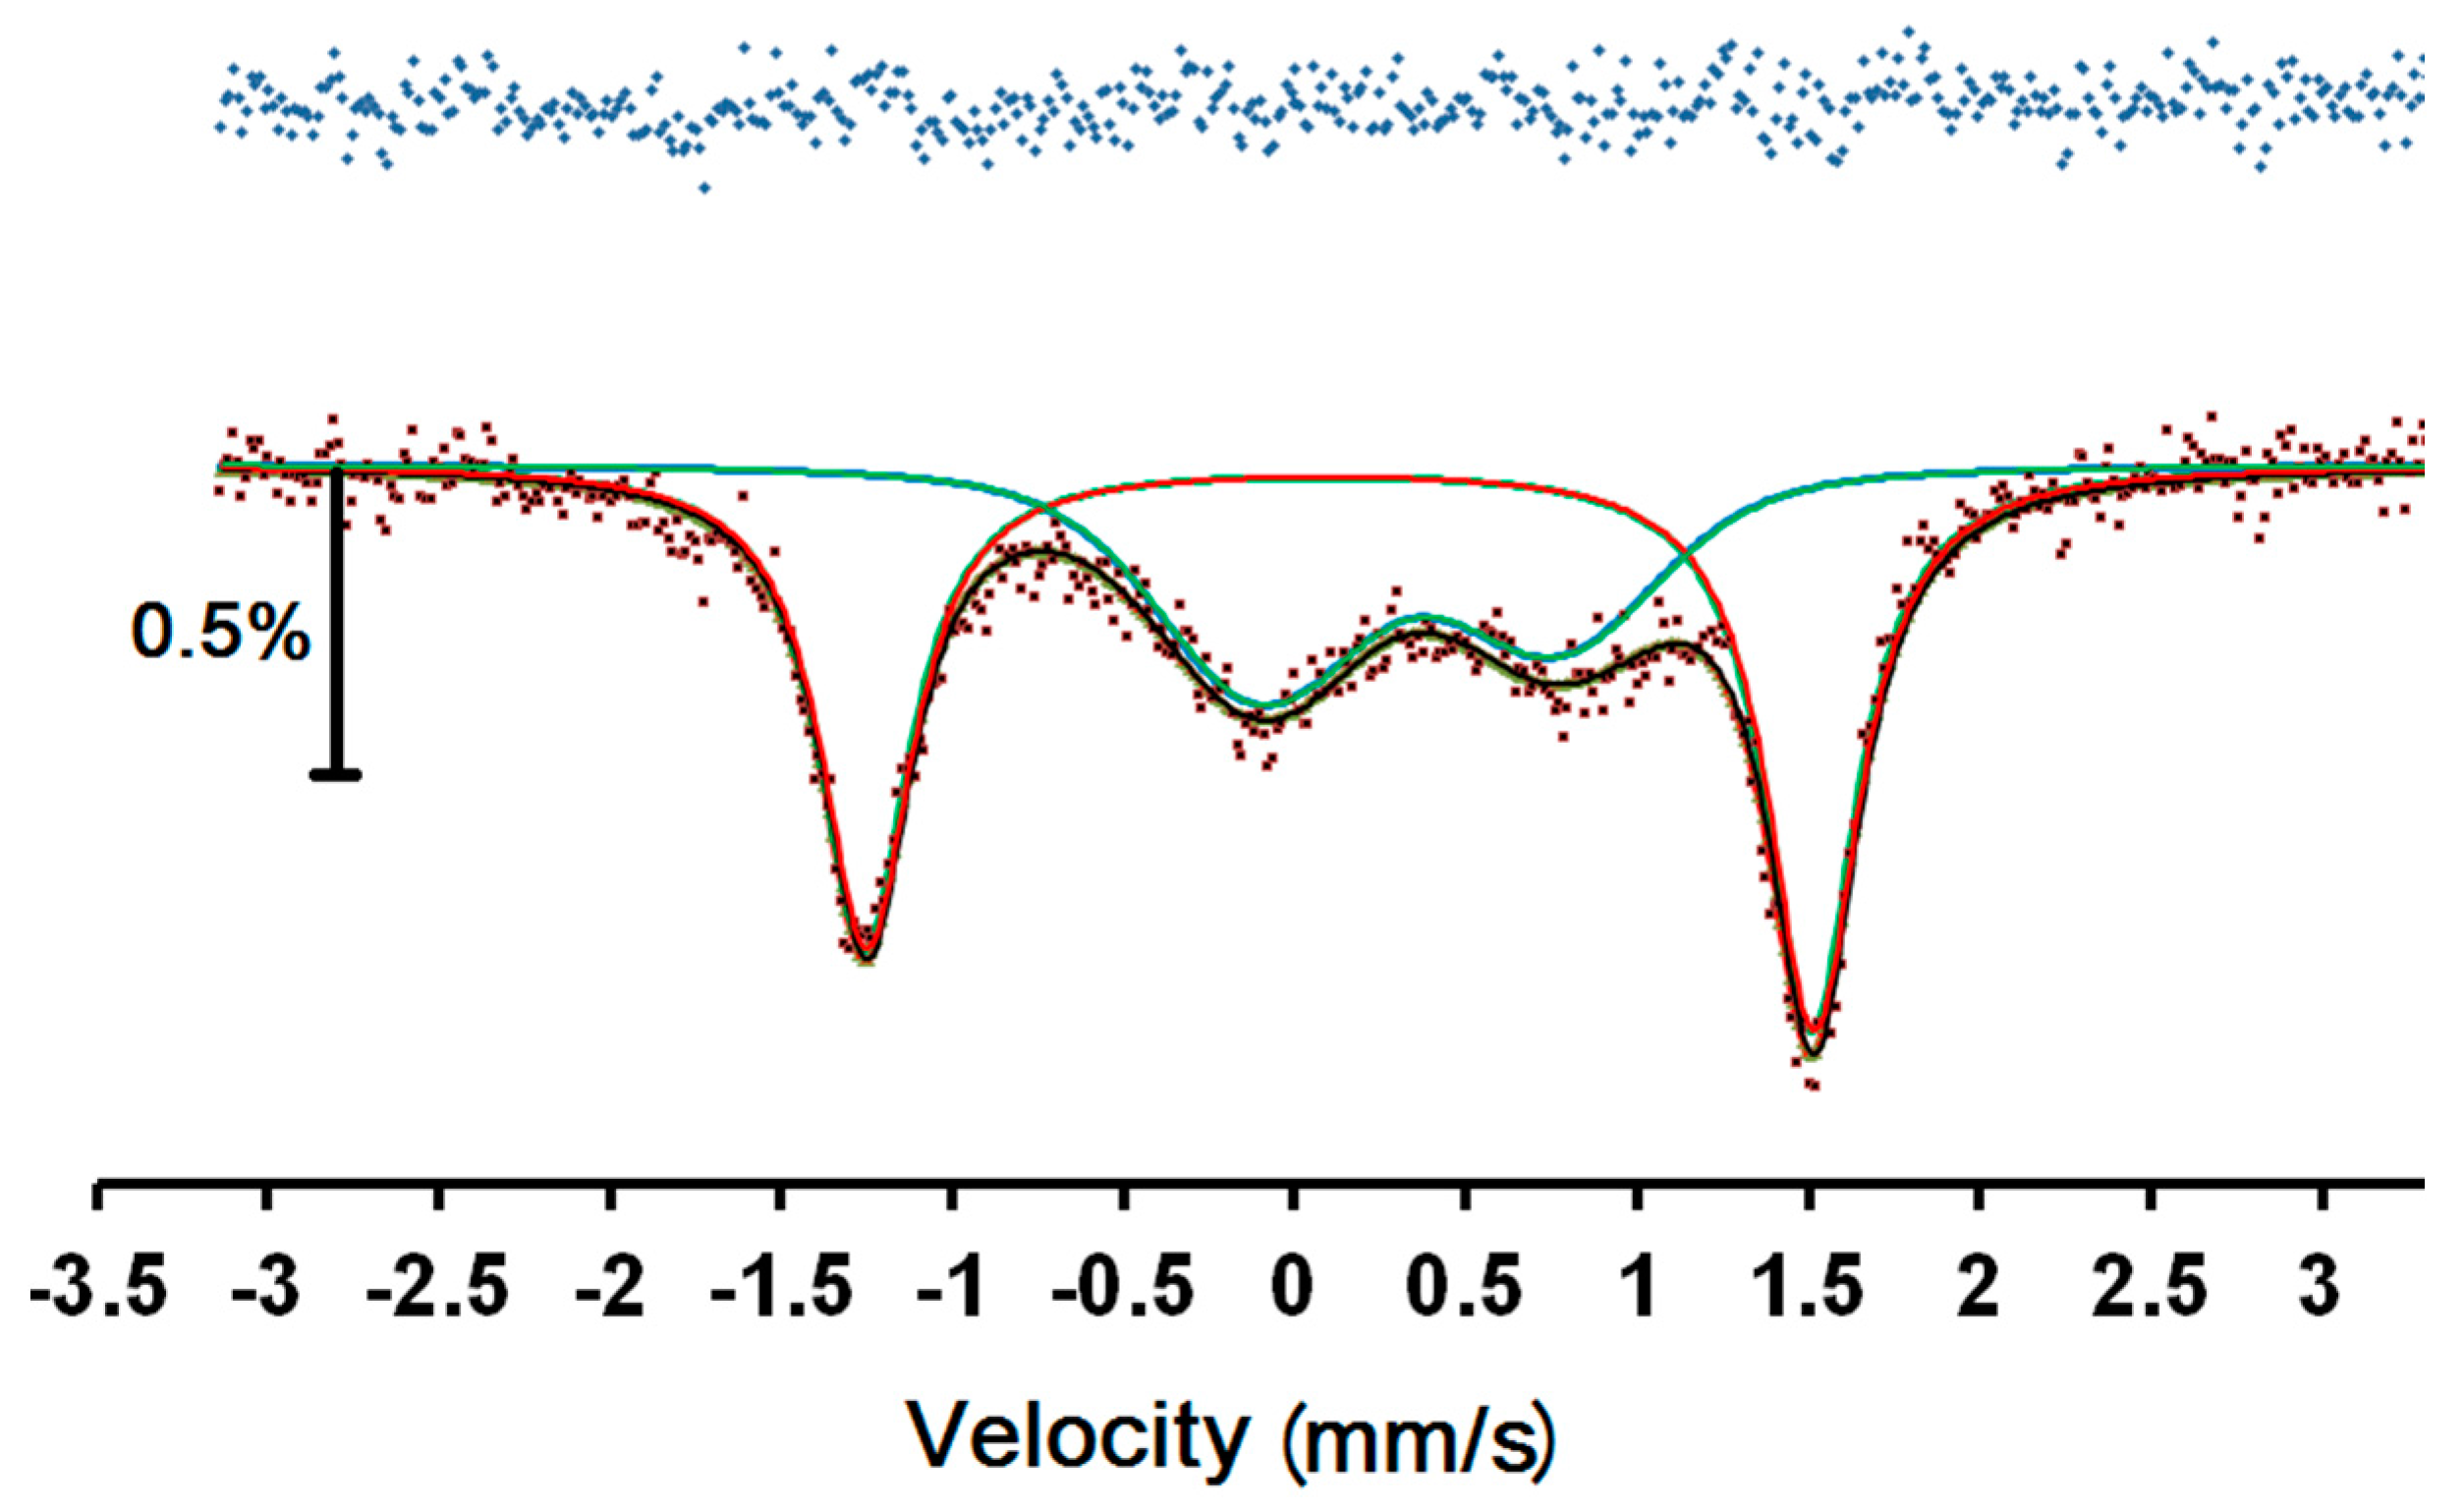
2.4. Mössbauer Spectroscopic Study
Room temperature Mössbauer spectra were taken of two fresh samples of compound 1. The first sample was allowed to drain on filter paper before being sealed in a perspex holder. The second was transferred quickly and a small drop of solvent added before sealing. The spectra were very similar consisting of two asymmetrical doublets with the inner doublet being considerably broadened.
An attempt to fit the spectra to two asymmetrical doublets showed notable misfit in the right hand outer peak. Fitting to a magnetic relaxation spectrum was much more successful and this is shown in
Figure 6, with the parameters in
Table 1. Since this is a magnetic spectrum, the quadrupole shift, ε, is listed, which is half the common quadrupole splitting, Δ, normally listed for doublets. The parameters are similar to those of other related Fe(III) complexes [
10,
11,
12], with the outer doublet clearly attributable to a LS Fe(III) site and the inner doublet to a HS Fe(III) site. In
Table 1, we see that the sign of the quadrupole shifts is opposite for the two sites, however the absolute value of the signs is undetermined and has been given relative to the positive value ascribed to the hyperfine magnetic field. The areas of the two sites are equal, within error, as expected from the magnetic data.
The uncertainties in both B and the relaxation frequency, f, are very large because there is very limited resolution in the slightly broadened lines. We note that the magnetic hyperfine field is much larger for the HS site, as expected. It can also be seen that the relaxation frequency of the HS site is much faster than for the LS site because of the larger magnetic moment. We note that, with the limited resolution, this determination of the relaxation frequency is not mathematically orthogonal to the determination of the linewidth, Γ, so that the considerably larger linewidth of the HS site may not necessarily be an indication of greater local disorder.
Figure 6.
57Fe Mössbauer spectrum of 1 at room temperature. Red and blue lines are the best fit sub-spectra for LS and HS, respectively, while the black line denotes the overall fit. The top line is the difference between the data and the fitted curve.
Figure 6.
57Fe Mössbauer spectrum of 1 at room temperature. Red and blue lines are the best fit sub-spectra for LS and HS, respectively, while the black line denotes the overall fit. The top line is the difference between the data and the fitted curve.
Table 1.
57Fe Mössbauer spectral parameters for the compound 1. Values in brackets are the uncertainty in the last digit.
Table 1.
57Fe Mössbauer spectral parameters for the compound 1. Values in brackets are the uncertainty in the last digit.
| Complex | Species | IS/mms−1 | ε/mms−1 | Γ/mms−1 | B/T | f/MHz | Area/% |
|---|
| 1 | LS | 0.13(1) | −1.39(1) | 0.26(2) | 4(50) | 60(1300) | 52(2) |
| HS | 0.34(2) | 0.44(2) | 0.60(10) | 14(1500) | 310(8000) | 48(2) |


 ,
, 
