Article

Two Types of Europium-Based Photoconversion Covers for Greenhouse Farming with Different Effects on Plants

by
Mark O. Paskhin
1,
Denis V. Yanykin
1,2,
Alexander V. Popov
1,
Roman V. Pobedonostsev
1,
Dina V. Kazantseva
1,
Alexey S. Dorokhov
3,
Andrey Yu. Izmailov
3,
Alexey A. Vyatchinov
1,4,
Elena O. Orlovskaya
1,
Artem T. Shaidulin
1,
Yurii V. Orlovskii
1,5,
Vladimir A. Vodeneev
6,* and
Sergey V. Gudkov
1,4,6
1
Prokhorov General Physics Institute of the Russian Academy of Sciences, Vavilov Str. 38, 119991 Moscow, Russia
2
Institute of Basic Biological Problems of the Russian Academy of Sciences, Federal Research Center “Pushchino Scientific Center for Biological Research” FRC PSCBR of the Russian Academy of Sciences, 2 Institutskaya Str., 142290 Pushchino, Russia
3
Federal State Budgetary Scientific Institution “Federal Scientific Agroengineering Center VIM” (FSAC VIM), 109428 Moscow, Russia
4
All-Russian Research Institute of Phytopathology (ARRIP), 5 Institute Str., Bolshie Vyazemy, Moscow Region, 143050 Odintsovo, Russia
5
Institute of Physics, University of Tartu, W. Ostwaldi Str. 1, 50411 Tartu, Estonia
6
Department of Biophysics, Lobachevsky State University, 23 Gagarin Avenue, 603950 Nizhny Novgorod, Russia
*
Author to whom correspondence should be addressed.
Horticulturae 2023, 9(7), 846; https://doi.org/10.3390/horticulturae9070846
Submission received: 5 July 2023 / Accepted: 18 July 2023 / Published: 24 July 2023

Abstract

:
In the present work, we investigated the effect of light conversion using europium (Eu(III))-based photoconversion covers on the cultivation of agricultural plants and their resistance to stress conditions. Two types of europium nanoparticles were used. The first one was obtained from europium oxide (Eu2O3) by laser fragmentation. The second one was Eu3+:LaF3 nanocrystals obtained by hydrothermal-microwave treatment, the content of europium ions in which was 50% of the total amount of cations. Tomatoes (Solanum lycopersicum) and cucumbers (Cucumis sativus) were used as model plants. It was shown that plants grown under cover with Eu2O3 (PCC-Eu2O3) were 30–40% larger, gave a higher yield, and the activation of gas exchange processes and the light phase of photosynthesis in the leaves in response to the lighting was faster. On the contrary, plants grown under cover with Eu3+:LaF3 (PCC-Eu3+:LaF3) tended to slow down the rate of biomass accumulation and decrease the rate of gas exchange activation. It was shown that photoconversion covers change the resistance of plants to stress conditions: if plants grown under PCC-Eu2O3 became more sensitive to heat (+40 °C) and cold (+4 °C) treatment, then plants grown under PCC-Eu3+:LaF3 became more resistant to high and low temperatures. It was found that PCC-Eu2O3 inhibited the development of the phytopathogen Phytophthora infestans on tomato plants. It was assumed that changes in the illumination spectrum by the photoconversion covers cause both the activation of plant growth in the case of Eu2O3 and an increase in plant resistance in the case of Eu3+:LaF3 applications.

Graphical Abstract

1. Introduction

Photosynthesis is a process that has a significant impact on all life on the Earth, both through the production of large amounts of biomass and atmospheric oxygen reserves [1,2,3,4,5]. Despite the fact that photosynthetic organisms in the process of evolution have developed a highly efficient photosynthetic apparatus, the efficiency of converting light energy reaching the surface of plants is low [6,7,8,9].
Currently, there are several approaches that help increase the efficiency of light use by photosynthetic organisms: genetic engineering approaches [10], increasing the effective area of photosynthetic antenna complexes by including exogenous light absorbers (organic dyes, nanoparticles, etc.) capable of transmitting excitons on photosynthetic-light-harvesting complexes [11,12,13], and methods of directional changes of the intensity and the spectrum of light [14]. The first two approaches still have numerous limitations due to the high cost, labor costs, and instability of modified organisms [15,16]. Methods for the quantitative and qualitative conversion of light have long been effective in farms due to their ease of application and relatively low price. In turn, they can be combined into several groups: illumination, shading, and the application of photoconversion covers (PCCs) [14,17,18]. Currently, PCCs have become more and more popular. While the main reference to PCCs at present is for research projects, some farms are already using PCCs for profit [19,20].
Several types of phosphors are used in such covers. The most widely used phosphors now are based on organic dyes [21,22,23,24,25,26,27,28,29,30,31,32,33,34,35,36]. Despite all their advantages, such phosphors have a significant drawback: they lose their effectiveness very quickly due to light burnout [37]. Another type of phosphor that is gaining more popularity is nanosized metal-containing phosphors [33,38,39], among which luminescent nanoparticles based on rare earth metals occupy a special place [34,40,41,42,43,44,45]. A relatively widely used rare earth metal in the production of phosphors is europium (Eu). Basically, europium is used as an oxide (Eu2O3): in optical devices, in the production of banknotes, televisions, and monitors [46]. Europium(III) oxide is of interest in the production of covers for greenhouses due to the fact that the main maximum of its fluorescence is in the red region (612 nm) [47,48,49]. As is known, red light (λ = 600 nm–700 nm) is most effectively used by plants, and the addition of red light most strongly activates photosynthetic processes in plants under low light conditions [50]. In recent years, many studies have been devoted to the synthesis, properties, and application of complex nanocrystals, which consist of an inorganic matrix that enhances the stability of nanoparticles and europium ions [51,52]. The structure of these nanoparticles contributes to an increase in the lifetime of the excited state of europium ions and increases the fluorescence intensity. Such structures include nanocrystals based on yttrium vanadate, lutetium oxide compounds, zinc oxide or sulfide, lanthanum fluoride, etc., doped with Eu3+ ions [53,54,55,56]. Due to their spectral properties, Eu-based nanoparticles can be used as nanofluorophores (NFs) for PCCs, converting part of the ultraviolet light that is little used by plants into red light. In several studies, the effectiveness of nanocrystals as elements of the photoconversion covers of greenhouses has been tested [34,43]. The results of these studies demonstrate a positive effect of PCCs on the growth of plant biomass. Note that europium nanocrystals deposited on greenhouse covers had only one fluorescence maximum (λ = 612 nm or 630 nm) [34,43], while three pronounced maxima were observed outside the covers (λ = 590 nm, 615 nm, 700 nm) [53,54,55,56].
In this work, we studied the optical properties of two PCCs containing Eu2O3 and Eu3+:LaF3 nanoluminophores and their effect on the growth and development of tomato (Solanum lycopersicum) and cucumber (Cucumis sativus) plants grown in laboratory conditions and greenhouses. A very important difference between the Eu3+:LaF3 PCC used in this study and earlier works is the presence of a pronounced luminescence maximum at 591 nm, which was provided by using lanthanum fluoride as a matrix [57,58,59].

2. Materials and Methods

2.1. Preparation of Nanoparticles and Study of Their Properties

Stable aqueous colloidal solutions of NPs x at.% Eu3+:LaF3, where x = 0.1, 10, 30, 50, were synthesized by hydrothermal-microwave treatment (HTMW) of freshly precipitated gels with HTMW laboratory device speedwave XPERT (Berghof Products+ Instruments GmbH, Eningen unter Achalm, Germany) with two magnetrons (2.45 GHz, 2 kW maximum output power).
The initial reagents used in the synthesis without any further purification include Eu(NO3)3 5H2O (Aldrich, 99.999% purity), La(NO3)3 6H2O (99.999%), NH4F (>98%) (Sigma-Aldrich, Stockholm, Sweden AB). For the synthesis of aqueous colloidal solutions of Eu3+:LaF3 NPs doped with (0.1–50 mol.%) Nd3+ ions, La(NO3)3 6H2O (0.4995–0.25 mmol) and Eu(NO3)3 5H2O (0.0005–0.234 mmol) were dissolved in deionized water (15 mL). The solution of rare earth salts was added dropwise to the NH4F solution (5 mmol) in deionized water (25 mL) under vigorous stirring. The freshly precipitated gels were diluted with deionized water (10 mL) and left stirring for 15 min. The resulting solutions were transferred into a 100 mL Teflon autoclave and placed under microwave irradiation for 2 h at 200 °C using HTMW laboratory device. After they were cooled, they were centrifuged using a Hermle Z326 device and washed several times with deionized water. The resulting precipitates were redispersed in deionized water using ultrasonication.
Eu2O3 nanoparticles were obtained by laser fragmentation in an aqueous solution of europium oxide (Sigma-Aldrich, Stockholm, Sweden, purity 99.99%) on a laser facility with second-harmonic generation (Ekspla, Vilnius, Lithuania) at a wavelength of 532 nm with a laser pulse frequency of 1 kHz, individual pulse duration 3.6 ns, and pulse energy 2 mJ for 1 h.
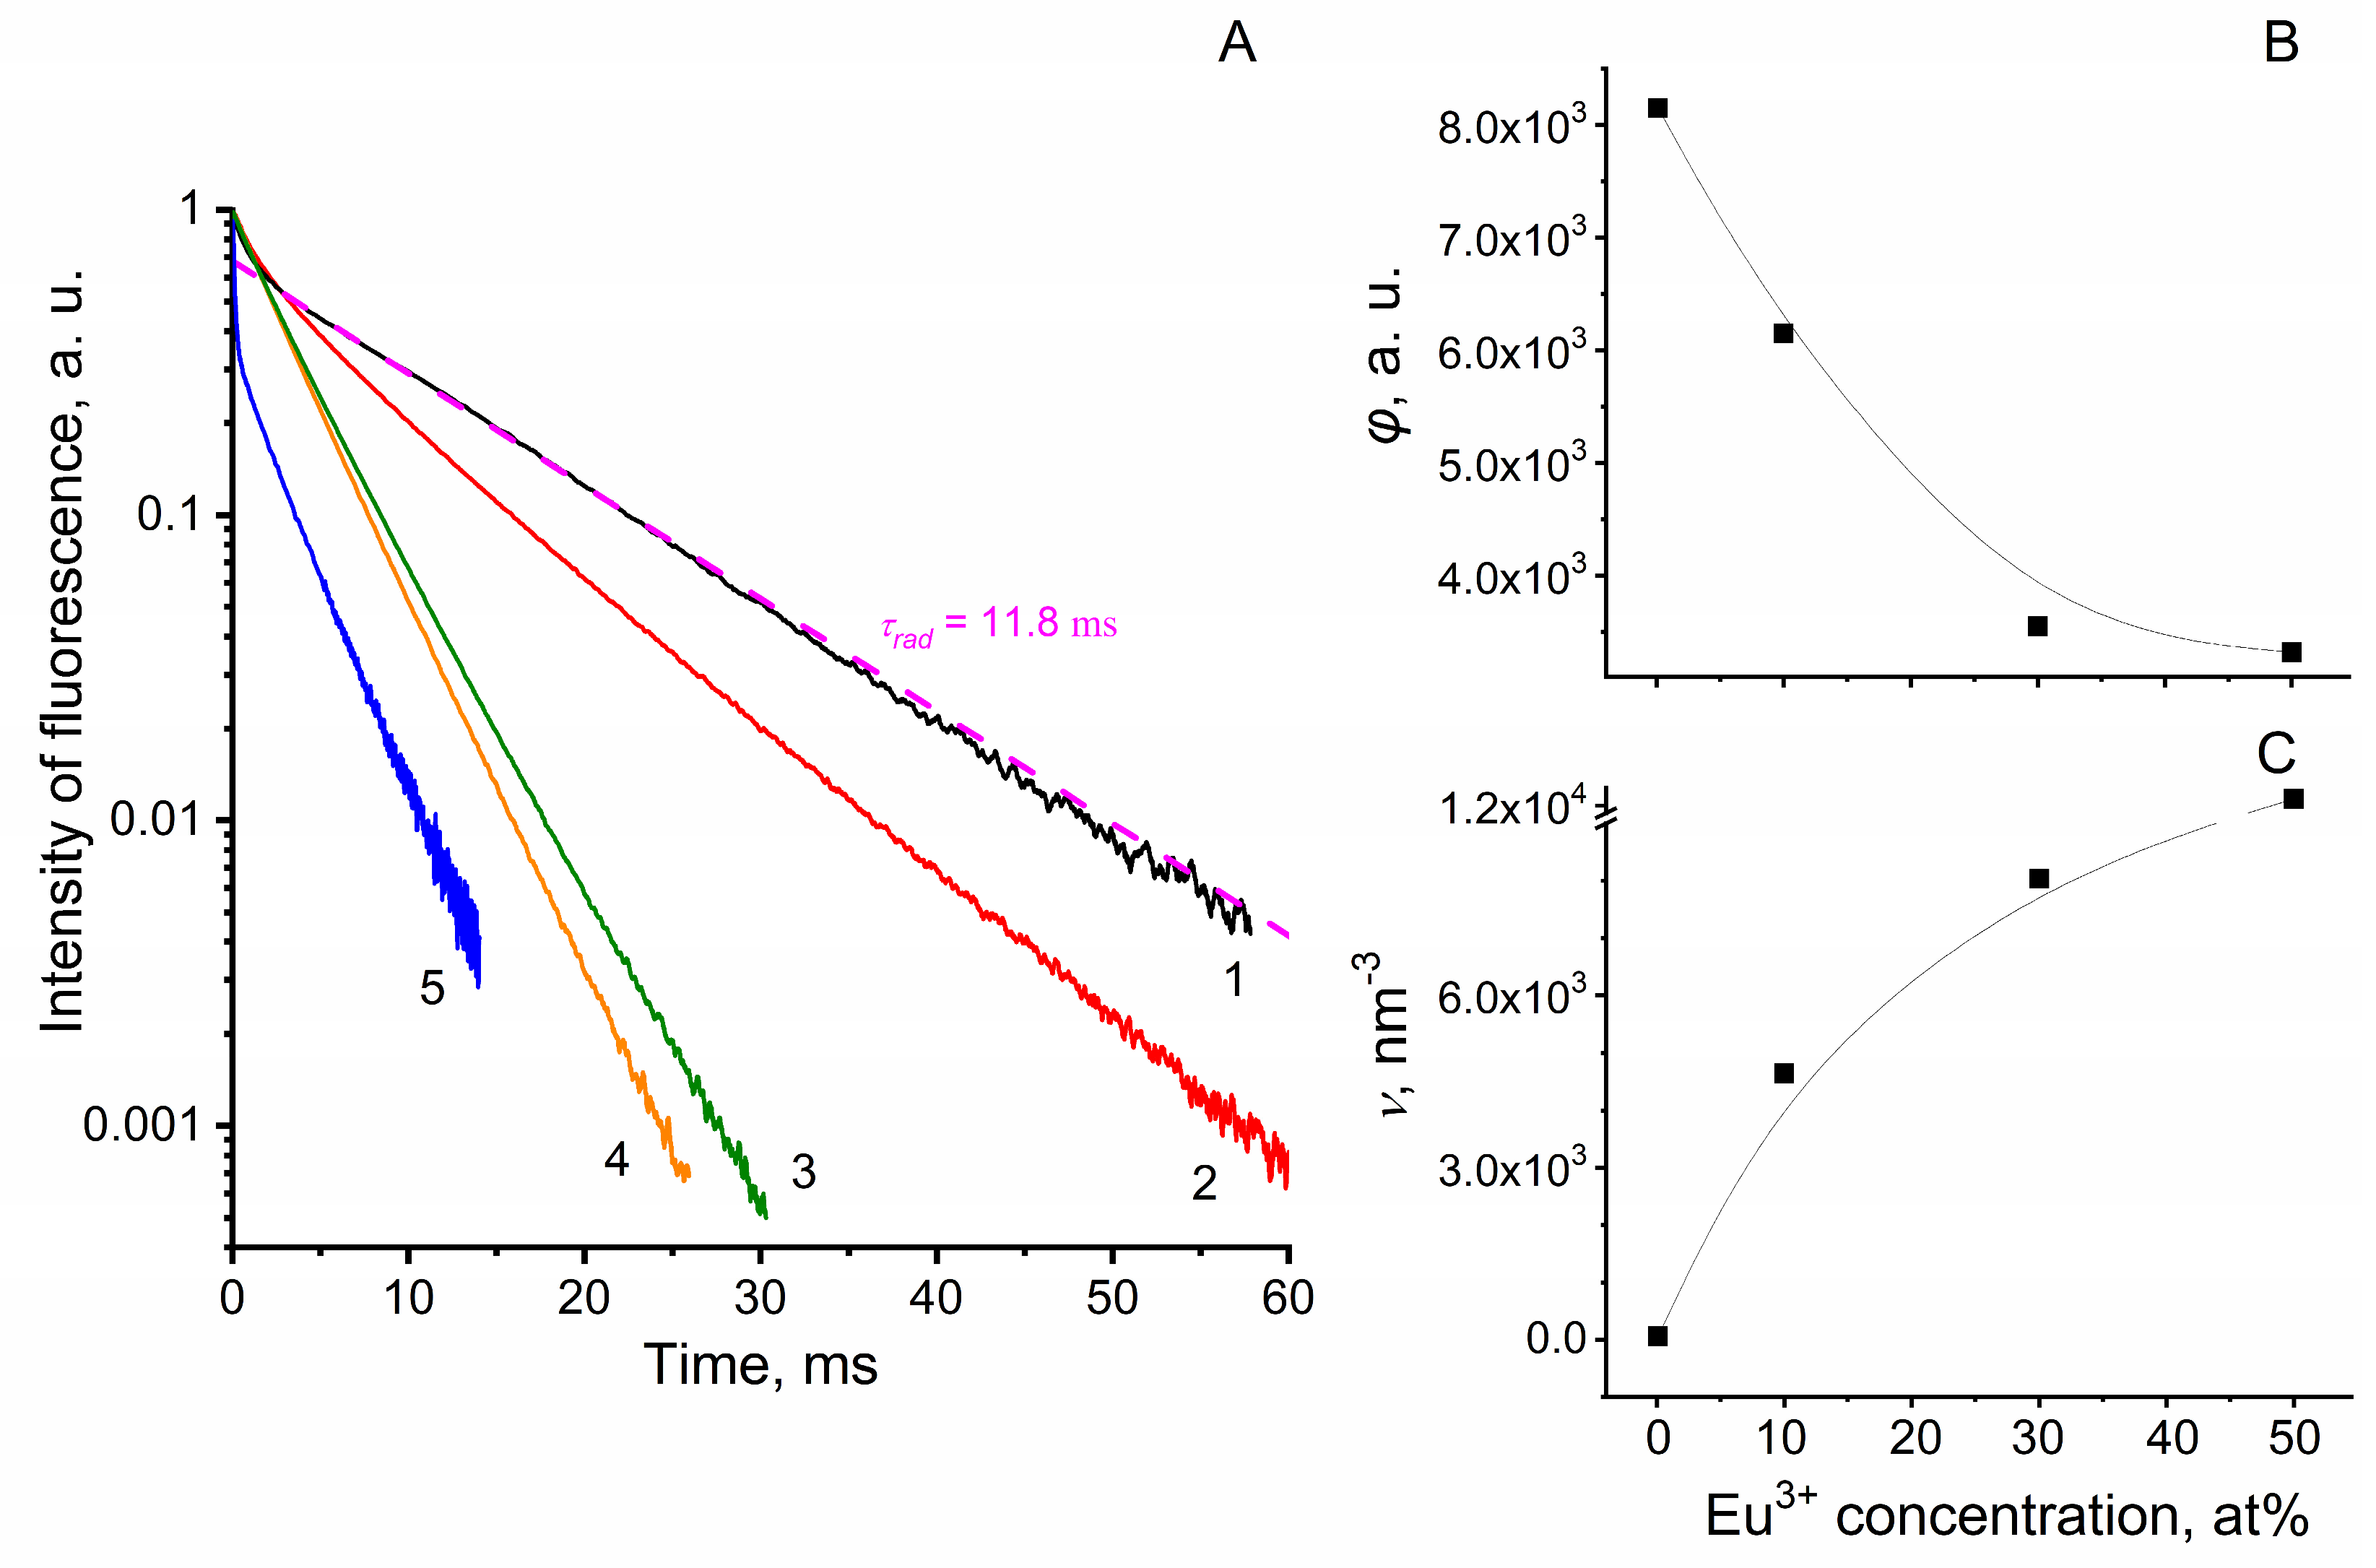
The luminescence decay kinetics of Eu3+ ions was measured upon excitation of luminescence using a pulsed tunable Al2O3-Ti laser (LOTIS-TII, Minsk, Belarus) at a wavelength of 395 nm and its registration at a wavelength of 591 nm (electronic transition 5D07F1) using a monochromator MDR-23 (LOMO, Russia), a photomultiplier Hamamatsu R13456P, and a multichannel counter Timeharp 260 (PicoQuant GmbH, Berlin, Germany) operating in the gated photon counting mode.
A Malvern Zetasizer ULTRA RED LABEL setup (Malvern panalytical LTD, Worcestershire, UK) was used to determine the hydrodynamic radius of NF in solution by dynamic light scattering. An amount of 1.5 mL of the solution was poured into a DTS0012 polystyrene cuvette with an optical path length of 10 mm. Scattering was observed at an angle of 174.7° at a temperature of 25 °C. In each experiment, 10 measurements were carried out.

2.2. The Glass Surface Application of NF

A solution of the obtained nanoparticles in acetone (107 ppm) was used for the manufacture of PCCs. They were mixed with the liquid component of the fluoroplastic polymer in a ratio of 1/100. Fluoroplast-32L (St. Petersburg Paint and Varnish Plant, KRASKI SPB LLC, Russia) served as the basis for obtaining a polymer varnish. The mixture was stirred for 10 min until a homogeneous mass was obtained. The glasses were washed with ionic and nonionic detergents and then degreased with a solvent before applying the NF integrated into the polymer. NF was applied to glass using an airbrush with No. 4 nozzles. The pressure in the compressor was raised to 2.5–3.0 atm, when applying photoconversion nanoparticles integrated into a fluoropolymer matrix. The distance of the spray gun nozzle from the surface was 15–25 cm. The covers applied to the glass were tested for adhesion strength: they were not washed off with deionized water or detergent solutions, and were extremely difficult to mechanically clean. Thus, a PCC containing photoconversion nanoparticles was formed on the glass surface.

2.3. Fluorescence Spectroscopy

A Jasco FP-8300 spectrofluorimeter (JASCO Applied Sciences, Victoria, BC, Canada) was used to analyze the absorption and fluorescence properties of the obtained PCC. A glass slide with a photoconversion cover was placed in a special holder. The experiments were carried out at room temperature.

2.4. Planting and Growing Conditions

Two types of plants were selected for the experiment: tomato (Solanum lycopersicum) and cucumber (Cucumis sativus). Three seeds were planted in an organomineral plug (45 mm × 45 mm) in a fertilizer solution containing 0.05 g/L KNO3; 0.17 g/L Mg(NO3)2 6H2O; 1.06 g/L Ca(NO3)2 4H2O; 0.38 g/L K2SO4; 0.135 g/L KH2PO4; 0.49 g/L MgSO4 7H2O. One week after germination, one plant was left in each plug, and the concentration of nutrients in the solution was doubled.
After planting, the trays were immediately placed under the glass with (experimental) or without (control) NF. Plants were grown under a 16 h photoperiod at 25–26 °C. The intensity of photosynthetically active radiation (PAR, λ = 350–800 nm) was ≈130 µmol photons s1 m2. The UV-A component (λ = 370 nm, photon flux density (PPF) ≤ 10 µmol photons s1 m2) was added to the illumination spectrum. The PG200N spectrometer (UPRtek, Zhunan, Miaoli, Taiwan) was used to estimate the light flux density of the PAR spectrum.
For growing plants in protected ground, 4 experimental boxes (2 m × 0.5 m × 0.7 m, length, width, height, respectively) of a similar design were assembled using two covers: glass without any cover and glass with PCCs based on Eu2O3 nanoparticles. On the north side, the boxes were upholstered with a single spunbond layer for natural ventilation. Boxes were planted with seven 35-day-old S. lycopersicum bushes (16 June 2022). Temperature and humidity sensors were placed in the boxes to control the growing conditions. The plants were watered every three days with tap water. The collection of fruits, as well as accounting for their number and weight, was carried out from 30 July until 14 August.

2.5. Measurement of Leaf Chlorophyll Content

In order to control the concentration of chlorophyll in the leaves of plants without damaging them, during the entire experiment, we carried out measurements using a CL-01 chlorophyll meter. To convert the obtained values into generally accepted units of measurement (mg chl g−1 of fresh weight), we investigated the dependence of the values obtained using CL-01 on the actual chlorophyll content in the leaves of plants grown under the same conditions as an experimental plant. The actual chlorophyll content was measured in fresh leaf samples (0.3 g). Leaf samples were homogenized in ethanol (95% v/v), left in the dark for 10 min, then filtered and centrifuged for 5 min at 15,000 rpm. The chlorophyll concentration was calculated from the absorbance of the extract at 664 nm and 648 nm using the formula:
C a + b = 5.24 × A ( 664 ) + 22.24 × A ( 648 ) ,
where A(664) is the absorption at λ = 664 nm, A(648) is the absorption at λ = 648 nm [60]. Based on the obtained data, a calibration curve was built, and a linear dependence was calculated to calculate the chlorophyll content in the leaf “mg chl g1 of fresh weight”, as previously described in [61].

2.6. Measurement of Plant Morphological Parameters

The number of leaves was determined manually. The stem length was measured with a graduated ruler accurate to the millimeter. The GreenImage software was used to determine the leaf area [33]. Dry weight was determined using a moisture analyzer OHAUS MB23 (Ohaus corporation, NJ, USA). Plant leaves were dried at 150 °C for 15 min.

2.7. Measurement of the Kinetics of Photoinduced Changes in Chlorophyll a Fluorescence (FChl) and the Intensity of Carbon Dioxide Assimilation and Transpiration

To measure FChl and the intensity of carbon dioxide assimilation and transpiration in plant leaves, a GFS-3000 gas analyzer integrated with a DUAL-PAM-100 was used (Waltz, Eichenring, Effeltrich, Germany). The measurements were carried out in a measuring cuvette on untouched leaves at room temperature (25 °C) and 65% humidity in a laminar CO2 flow 400 with concentration 200 ppm. The measurements were preceded by a 1 h incubation of plants in the dark at room temperature to ensure complete relaxation of all photoinduced processes and thirty-minute adaptation in a cuvette.
To measure the maximal photochemical quantum yield of photosystem II (PSII) in dark-adapted leaves (Fv/Fm) and FChl parameters after light adaptation (1–21 min, λ = 625 nm, 200 µmol photons s1 m2), the leaves were illuminated with a 300 ms saturating pulse (λ = 625 nm, 12,000 µmol photons s1 m2). The FChl parameters were calculated using the DUAL-PAM software according to Equations (2)–(7) [62,63]:
F v F m = ( F m F o ) F m ,
Y ( I I ) = F m F F m ,
Y ( N P Q ) = F F m F F m ,
E T R ( I I ) = Y ( I I ) × a b s I × 0.5 ,
Y ( I ) = ( P m P ) P m ,
E T R ( I ) = Y ( I ) × a b s I × 0.5 ,
where F0—the intensity of FChl caused by measured light, Fm—the maximal intensity of FChl, Fv—the photoinduced change in the yield of FChl, Y(II)—the effective quantum yield of PSII photochemistry, Y(NPQ)—the quantum yield of light-induced non-photochemical fluorescence quenching, Fm′—the induced maximal level of FChl in light-adapted leaves, F—the intensity of FChl measured immediately before a saturated pulse of light, Pm—the difference signal between the fully reduced and oxidized states of P700, P—the P700 signal recorded just before a saturated pulse, Pm′—the P700 signal recorded briefly after onset of a saturated pulse, ETR(II)—rate of linear electron transport through photosystem II, ETR(I)—rate of linear electron transport through photosystem I, Y(I)—effective quantum yield of PSI photochemistry, absI—absorbed irradiance taken as 0.84 of incident irradiance, 0.5—the fraction of absorbed light reaching PSI or PSII.
The calculation of the intensity of assimilation and transpiration was carried out using the GFS-win software according to Equations (8) and (9) [64]:
E = U e × ( W o W e ) L A × ( 1 W o ) ,
A = U e × ( C e C o ) L A E × C o ,
where E—transpiration rate, A—assimilation rate, Ue—molar flow rate at the inlet of the cuvette, Wo—H2O mole fraction at the outlet of the cuvette, We—H2O mole fraction at the inlet of the cuvette, LA—leaf area (4 cm2), Co—CO2 mole fraction at the outlet of the cuvette, Ce—CO2 mole fraction at the inlet of the cuvette.

2.8. Accounting for the Development of Late Blight on Tomato Leaves during Natural and Artificial Infection

Accounting for the development of late blight during spontaneous infection of plants in boxes (as described in Section 2.4.) was carried out according to the scale of the British Mycological Society [65].
To calculate the number and diameter of colonies during artificial infection of detached leaves with Phytophthora infestans, two independent experiments were carried out according to Filippov’s method [66]. For each experiment, 12 leaves were selected randomly. In the first experiment, the leaves were sprayed with a suspension of zoosporangia (300,000 pieces m2) using a spray gun and kept in the dark at 20 °C and 80% humidity for 3 days. The number of necroses on the leaf surface was counted. In the second experiment, leaves were infected by spot application of 10 µL of zoosporangia suspension. After that, the leaves were kept in the dark at 20 °C and 80% humidity. After 18 h, the remains of the suspension were removed with filter paper and incubation continued for another 3 days.

2.9. Statistical Analysis

To determine statistically significant differences between plant groups, one-way analysis of variance (ANOVA) was performed, followed by post hoc comparison using Student’s t-test for independent means. The difference was considered statistically significant if p ≤ 0.05.

3. Results

3.1. Selection of the Optimal Concentration of Europium Ions in Eu3+:LaF3 Nanoparticles for Use in Photoconversion Covers

To select the optimal concentration of europium ions in Eu3+:LaF3 nanoparticles, we studied the concentration dependence of the luminescence decay kinetics from the 5D0 level of Eu3+ ions in aqueous colloidal solutions of the nanoparticles (Figure 1A, curves 1–4). The radiative lifetime of the 5D0 level of Eu3+ ions was determined by approximating the luminescence decay curve of the nanoparticles colloid with a minimum concentration of europium ions of 0.1 at.% Eu3+:LaF3 (Figure 1A, black curve 1) by an exponential function with exponent τrad = 11.8 ms (Figure 1A, magenta dashed line). With an increase in the Eu3+ ion concentration, the luminescence decay rate increased, and the area under the kinetic curve decreased (Figure 1A, curves 1–4), which was a consequence of the concentration quenching of the Eu3+ ions luminescence, which was observed in earlier work [52]. Therefore, an increase in the Eu3+ ion concentration in LaF3 nanoparticles was accompanied by a decrease in the relative luminescence quantum yield φ (Figure 1B), which is determined by the following equation:
φ = 1 τ r a d × 0 I m t × d t ,
where Im(t) is the measured luminescence decay kinetics and τrad is the radiative lifetime of the excited level.
One of the most important parameters in creating a PCC is the luminescence brightness (ν) of a fluorophore, which is determined by the product of the relative luminescence quantum yield (φ) and the absolute concentration (na) of Eu3+ ions, which increased with an increase in the europium concentration and shows how concentration quenching of luminescence affects its brightness excluding other factors (Figure 1C) [67].
v = n a × φ ,
where na is the absolute concentration of Eu3+ ions, expressed, for example, in nm−3.
The maximum luminescence brightness of Eu3+:LaF3 colloidal solutions was observed at an Eu3+ concentration of 50 at.%. With a further increase in the Eu3+ ion concentration, the colloidal solution of nanoparticles became unstable, and the nanoparticles themselves sedimented. This circumstance did not allow the formation of a uniform PCC on glass at the next stage of the study.
Figure 1A (blue curve 5) also shows the luminescence decay kinetics of Eu2O3 nanoparticles in aqueous colloidal solution. The nature of this kinetic curve differed from that for Eu3+:LaF3 solutions and may indicate the presence of a larger amount of luminescence quenchers in the structure of Eu2O3 nanoparticles, probably due to defects.

3.2. Properties of NF

The analysis of micrographs obtained by transmission electron microscopy showed that after drying of the solution dropped on the carbon film, the Eu3+:LaF3 nanoparticles containing 50% Eu3+ of the total amount of cations were collected into chains and coils (Figure 2A). At the same time, individual nanoparticles were well crystallized and partially “faceted”. The average diameter of an individual nanoparticle, approximated to the shape of a sphere and averaged over 1000 nanoparticles, was 21 ± 7 nm. Micrographs of europium oxide nanoparticles indicated an average individual particle size of 16 ± 5 nm collected in aggregates (Figure 2B).
These data correlated with the data obtained by measuring the hydrodynamic radius of the obtained particles in an aqueous solution. Individual nanoparticles were not found in the aqueous colloid of Eu3+:LaF3, but two pools of agglomerates about 230 ± 11 nm and 1210 ± 20 nm in size were registered (Figure 3, curve 1). At the same time, the total number of large agglomerates was 1.5 times more than small ones. Consequently, more than 99% of the individual nanoparticles were collected into agglomerates with an average size of 1210 nm. When studying an aqueous colloid of Eu2O3 nanoparticles, it was revealed that the nanoparticles were assembled into aggregates with an average size of 200 ± 21 nm (Figure 3, curve 2).

3.3. Optical Properties of PCC

Figure 4 shows the differential (“spectrum of photoconversion film” minus “spectrum of common film”) luminescence excitation and emission spectra of Eu2O3 and Eu3+:LaF3 nanoparticles (with a fraction of europium ions equal to 50%) deposited on glass. The most efficient luminescence of both nanoparticle types was observed under near-ultraviolet illumination at 395 nm (Figure 4A,B). However, the luminescence spectra of PCCs were different: PCC-Eu3+:LaF3 had three maxima at 591 nm, 615 nm, and 622 nm (Figure 4C); PCC-Eu2O3 had two pronounced maxima at 612 nm and 625 nm (Figure 4D). It should be noted that the maximum luminescence of PCC-Eu3+:LaF3 was observed at 591 nm, while that of PCC-Eu2O3 was observed at 615 nm. Thus, the developed covers had different optical characteristics, which allowed us to assume their unequal effect on plants.

3.4. Plant Growth under PCC

Further studies aimed to test the effectiveness of the developed covers on plants grown under conditions of artificial lighting, simulated sunlight, and in the protected ground under natural light.

3.4.1. The Effect of PCC on Plant Growth and Development

The effect of PCC-Eu2O3 on cucumber plants was practically absent, while plants grown under PCC-Eu3+:LaF3 had a lower leaf area and chlorophyll content by 30% and 20%, respectively (Table 1). It was shown that tomato plants grown under PCC-Eu2O3 were taller and had a larger total leaf surface area (by 25% and 40%, respectively), as well as a reduced chlorophyll content. The rest of the studied parameters (the number of leaves, the length of internodes, the ratio of wet weight of leaves to dry weight) were the same as in control plants. Tomato plants grown under PCC-Eu3+:LaF3 did not differ from the control ones in all studied parameters. In order to control the chlorophyll content in the plant leaves without damaging them, during the entire experiment, we carried out measurements using a chlorophyll meter CL-01 (Hansatech instruments, Norfolk, UK). It was shown that the chlorophyll content in the leaves of both plant species practically did not change during the entire experiment. In order to convert the values obtained with CL-01 into conventional units of measurement (mg chl g−1 of fresh weight), we investigated the dependence of the values obtained with CL-01 on the actual content of chlorophyll in plant leaves. We obtained equations that allowed us to perform this translation (Table 1).
Based on the positive effect of PCC-Eu2O3 on the biomass of tomato plants grown in laboratory conditions, we carried out field studies in which we assessed the yield of tomatoes growing under PCC-Eu2O3. The number and weight of fruits collected from one bush of the experimental group were 30% and 40% more compared to the number and weight of fruits collected from control plants, respectively (Figure 5), while the humidity and temperature in the experimental groups were the same.
Thus, PCC-Eu2O3 had a positive effect on the growth, development, and yield of tomato plants.

3.4.2. Effect of PCC on Gas Exchange in Leaves

Figure 6 shows the kinetic curves of light-induced changes in the intensity of transpiration and CO2 assimilation in leaves of C. sativus (Figure 6A,B) and S. lycopersicum (Figure 6C,D). In the dark, the intensity of transpiration in all groups of cucumber plants was almost the same (1.64 mol H2O m2 s1) (Figure 6A, Table 2). The inclusion of light activates transpiration in the leaves of all plants, however, in different groups differently. If the activation of transpiration in plants of the control group and in plants grown under PCC-Eu2O3 was the same (2.25–2.35 mol H2O m2 s1), then in the leaves of plants grown under PCC-Eu3+:LaF3, the intensity of transpiration in the light would be less by 12% (Table 2). The intensity of CO2 assimilation in the leaves of cucumber plants was also activated in the light (Figure 6B). In the dark, the absorption of CO2 by plant leaves was not fixed, but its release (0.5–0.7 µmol CO2 m2 s1) was observed as a result of light-independent processes occurring in plant tissues. The kinetic curves of CO2 assimilation after switching on the illumination had three phases: fast, expressed as a rapid increase in the intensity of CO2 absorption in the first minutes; a slow, gradual increase in the CO2 assimilation rate over the next seven minutes of illumination; and stationary, when the maximum intensity of the CO2 assimilation is reached. Despite the fact that the intensity of CO2 assimilation into the stationary phase in the leaves of all groups was almost the same, the development of the fast phase in plants grown under PCC-Eu3+:LaF3 was slower (Figure 6B, curve 2), which, however, did not affect the growth rate of plants in general (Table 1). It should be noted that oscillations on the kinetic curves of CO2 assimilation and transpiration were caused by saturating pulses of light produced by the PAM fluorimeter, which was connected to the gas analyzer measurement cuvette. The amplitude and shape of these oscillations were not taken into account in this work. Other parameters of gas exchange (total conductivity of leaf tissues for CO2 and H2O in the light, intercellular concentration of CO2) did not differ in control and experimental cucumber plants, except the total conductivity of leaf tissues for CO2 and water in the dark, which was higher in plants grown under PCC-Eu2O3 (Table 2).
As can be seen from Figure 6C,D, the kinetic curves of gas exchange in the leaves of tomato plants were similar to those obtained in the leaves of cucumber plants. Transpiration in tomato leaves was activated in the light from 0.12 mol H2O m2 s1 to 0.50 mol H2O m2 s1. Although there were no statistically significant differences in maximum transpiration rates between plant groups, plants grown under PCC-Eu3+:LaF3 showed slower transpiration activation compared to other plant groups (Figure 6C). The intensity of CO2 assimilation into the stationary phase was the same in the leaves of tomato plants grown under control and PCC-Eu2O3 covers and amounted to 3.1–3.3 µmol CO2 m2 s1 (Figure 6D, Table 2). In the leaves of plants grown under PCC-Eu3+:LaF3, the rate of CO2 assimilation at this phase was 25% lower. At the same time, the kinetic curves of CO2 assimilation in plants grown under PCC-Eu2O3 were characterized by a large amplitude of the fast phase (two times greater than in control plants and five times greater than in PCC-Eu3+:LaF3 plants). The total conductivity of leaf tissues for CO2 and water in the dark in control plants and plants grown under PCC-Eu3+:LaF3 differed slightly (≈10%), while in the leaves of plants grown under PCC-Eu2O3, this indicator was three times higher (Table 2). The inclusion of illumination led to a 3–4-fold increase in conductivity in the leaf tissues of all groups of plants. At the same time, the conductivity in the leaves of plants grown under PCC-Eu2O3 was up to two times higher than in the control, and amounted to about 90 mmol m2 s1. The intercellular concentration of CO2 in the leaves of control and PCC-Eu3+:LaF3 plants adapted to the dark was approximately the same (≈415 ppm). In the leaves of PCC-Eu2O3 plants, this indicator was slightly lower (≈ 400 ppm). In the light, the intercellular concentration of CO2 in the leaves of control and PCC-Eu3+:LaF3 plants decreased by about 20–25%, while in the PCC-Eu2O3 plants, the decrease was noticeably less—by 14% (Table 2).

3.4.3. Effect of PCC on Photochemical Activity

In order to understand the reasons for the different productivity of plants grown under different covers, we studied the effect of such covers on the parameters of the photochemical activity of plants, measured by registering light-induced changes in chlorophyll a fluorescence. It was found that the maximum quantum yield of plant photochemistry (Fv/Fm) (which gives an idea of the general state of the photosynthetic apparatus of plants) in all groups of plants was the same (≈0.8–0.81). However, other parameters such as the effective quantum yield of the photochemistry of photosystem II (Y(II)) and photosystem I (Y(I)), the rate of linear electron transfer through photosystem II (ETRII) and photosystem I (ETRI), and the quantum yield non-photochemical fluorescence quenching (Y(NPQ)), differed in the groups of plants (Figure 7G,H). Moreover, the effect of PCCs on the photochemistry in cucumber and tomato plants was slightly different. It was shown that in plants grown under control covers, Y(II) at the beginning of illumination was low (≈0.1, both cucumber and tomato), and with further illumination, it increased and reached maximum values (≈0.57) within 5–6 min (for cucumber plants) or 10–12 min (for tomato plants) (Figure 7A,B). Similarly, during leaf illumination, the values of ETR(II) (Figure 7C,D), ETR(I), and Y(I) (Figure 7C,G, Table 3) changed. Y(NPQ) in the leaves of both plant species increased to ≈0.4 in the first minute after switching on the illumination, and then gradually decreased and reached a stationary value (≈0.1) after about 10 min (in cucumber plants) or 15 min (in tomato plants) (Figure 7G,H). These data indicate the adaptation of the photosynthetic apparatus of plants to the light and the replacement of the process of utilization of excitation energy through dissipation into heat by the processes of energy storage in the dark stages of photosynthesis. In cucumber plants grown under PCC-Eu3+:LaF3, the redistribution of excitation energy toward thermal dissipation processes was observed, while PCC-Eu2O3 plants did not differ from control plants of these parameters (Figure 7A,C,E,G). The effect of PCCs on photochemical processes in tomato plants was somewhat different from their effect on cucumber plants. While PCC-Eu3+:LaF3 had no effect, PCC-Eu2O3 significantly accelerated the achievement of the equilibrium value of the investigated parameters (Figure 7B,D,F,H).
Thus, the data obtained correlated with data on the effect of PCCs on the morphological parameters of tomato plants (Table 1).

3.5. Effect of PCC-Eu3+:LaF3 on Plant Resistance to Abiotic and Biotic Stress Factors

It is known that the sensitivity of plants to the characteristics of illumination is expressed not only in a change in their productivity, but also in a change in their resistance to stress factors. Further studies were devoted to the effect of PCCs on the ability of plants to withstand both abiotic (cold, heat) and biotic (P. infestans) stress factors. These studies were carried out using S. lycopersicum, since the most pronounced effect of PCCs was observed on these plants.

3.5.1. Plant Resistance to Abiotic Factors

Plants were exposed to low (+4 °C for 22 h) and high (+40 °C for 40 min) temperatures. It was shown that both heat and cold treatments affect gas exchange and photochemical processes in tomato leaves of all studied groups.
Plant incubation at low temperatures had almost no effect on the intensity of dark transpiration. However, in the light, transpiration activation was significantly less compared to in untreated plants. The intensity of transpiration in the light in the control group of plants decreased by 50%, in PCC-Eu3+:LaF3 plants by 30%, and in PCC-Eu2O3 plants by 65% (Figure 6E, Table 4). A similar picture was observed when measuring the intensity of CO2 assimilation by plants subjected to cold treatment. The dark assimilation of CO2 in all groups of plants practically did not change, but the activation of CO2 assimilation in the light was largely inhibited: in the control group by 90%, in PCC-Eu3+:LaF3 plants by 55%, and in PCC-Eu2O3 plants by 85% (Figure 6F, Table 4). Interestingly, before cold treatment, the intensity of assimilation in PCC-Eu3+:LaF3 plants was significantly lower than in plants of other groups, while after cold treatment, the opposite pattern was observed. Plant incubation at +4 °C led to a change in the overall conductivity for CO2 and water. And if the dark parameter decreased only in plants grown under PCC-Eu2O3 (by about 90%), then the light parameter decreased in control and PCC-Eu2O3 plants by 90–95%, and in PCC-Eu3+:LaF3 plants by significantly less (by 65–70%).
As a result of cold treatment, the efficiency of photochemical processes in plants also decreased. Fv/Fm decreased in all groups of plants (from 0.8–0.81 to 0.72–0.76), which indicates a violation of the photosynthetic apparatus. In addition to the decrease in the maximum quantum yield, after cold treatment, there was a significant decrease in Y(II) (Figure 8B), Y(I) (Table 5), ETR(II) (Figure 8E), and ETR(I) (Figure 8H), which indicates a decrease in the fraction of excitation energy directed from the photosynthetic electron transport chain to the dark stages of photosynthesis. At the same time, the degree of drop in these indicators depended on the cover under which the plants were grown. Thus, in the control group of plants, the share of effectively assimilated solar energy decreased by 65%, in PCC-Eu3+:LaF3 plants by 35%, and in PCC-Eu2O3 plants by 60% (Figure 8B,E,H). Due to cold treatment, the kinetics of light-induced changes Y(NPQ) underwent significant changes. On the one hand, the maximum values of Y(NPQ) did not increase very much. On the other hand, there was a slow (compared to plants untreated with cold) decrease with further illumination, which indicates inefficient activation of the processes of the dark stage of photosynthesis. Therefore, in order to avoid overreduction of the photosynthetic electron transport chain, most of the absorbed light energy was converted into heat. This phenomenon was more pronounced in control and PCC-Eu2O3 plants (Figure 8K). In PCC-Eu3+:LaF3 plants, the deceleration of the decrease in Y(NPQ) was much less, which indicates a greater tolerance of PCC-Eu3+:LaF3 plants to cold treatment.
The heat treatment of plants had a negative effect on the state of all studied groups of tomato plants, although to a lesser extent than cold treatment. Dark transpiration in the leaves of all groups of plants treated at 40 °C increased by about one and a half times (Figure 6G, Table 4). However, light-induced transpiration in the treated control and PCC-Eu3+:LaF3 plants did not change compared to that measured in untreated plants. And only in PCC-Eu2O3 plants was the inhibition of light-induced transpiration observed. The heat treatment of plants led to the activation of CO2 assimilation in the dark by 50% in control plants and by 105% in PCC-Eu3+:LaF3 plants, without affecting this parameter in PCC-Eu2O3 plants (Figure 6H, Table 4). The light-induced assimilation of CO2 in PCC-Eu3+:LaF3 plants practically did not change (differences were not statistically significant) compared to untreated plants, while in control and PCC-Eu2O3 plants, heat treatment inhibited CO2 assimilation by 16% and 70%, respectively. Plant incubation at +40 °C, as well as cold treatment, led to a decrease in the total conductivity for CO2 and water in PCC-Eu2O3 plants, although to a lesser extent. At the same time, the control and PCC-Eu3+:LaF3 plants retained their conductivity for CO2 and water almost unchanged.
The efficiency of photochemical processes due to heat treatment mainly decreased in PCC-Eu2O3 plants, remaining practically unchanged in plants grown under control and PCC-Eu3+:LaF3 covers. A decrease in Fv/Fm was observed in all plants, but in control and PCC-Eu3+:LaF3 plants, this decrease was less than in PCC-Eu2O3 plants: from 0.8–0.81 to 0.76 and 0.73, respectively. At the same time, the kinetics of light-induced changes Y(II), ETR(II), ETR(I), and Y(NPQ) significantly changed only in PCC-Eu2O3 plants, which was expressed in a slow achievement of stationary values (Figure 8C,F,I,L), indicating inefficient activation of the processes of the dark stage of photosynthesis.
Plants grown under PCC-Eu3+:LaF3 were more resistant to adverse environmental conditions compared to the control groups of plants, while PCC-Eu2O3 plants, despite increased productivity under normal conditions, were more sensitive to both high and low temperatures.

3.5.2. Resistance of Tomato Plants to Late Blight Pathogen P. infestans

Next, we studied the effect of PCC-Eu2O3 on the resistance of tomato plants to P. infestans, a common pathogen of late blight in plants [68]. The choice of this type of cover for these experiments was due to its pronounced positive effect on the growth, development, and yield of this crop. We performed two types of experiments. In the first approach, plants were grown in protected ground under common (glass) or photoconversion covers, where they were infected with a phytopathogen naturally. It was shown that in control plants, the area of phytopathogen infection was about 2.5% of the total leaf area. At the same time, the presence of late blight pathogen colonies was not visually determined on any plant grown under photoconversion covers (Figure 9A). Thus, it was found that PCC-Eu2O3 prevented the development of late blight on the leaves of tomato plants, which is due to the effect of light modified by the cover both on the phytopathogen directly and on the ability of the plants themselves to actively resist the development of late blight, since signs of infection were not observed in both groups when the fungicide was added (data not shown). To answer this question, we performed experiments in which uninfected leaves of tomato plants grown under common covers or PCC-Eu2O3 cover were treated with a suspension of P. infestans (3·105 pieces m−2) and placed in darkness at 20 °C and relative humidity air 80%. It was shown that the number of P. infestans colonies did not depend on the type of cover under which the plants were grown (Figure 9B). However, the size of the colonies varied significantly (Figure 9C). On the leaves of control plants, the average damage diameter was 7 ± 1 mm, and on the leaves of PCC-Eu2O3 plants, the average damage diameter was 2 ± 1 mm. Thus, PCC-Eu2O3 plants were able to more effectively inhibit the development of colonies of the phytopathogen P. infestans in the dark.

4. Discussion

Nowadays, a wide variety of europium compounds with particle sizes from 4 nm to 500 nm are used [47,48,49,53,54,55,56,69]. It is known that the use of europium nanoparticles compounds is based on their luminescent properties, which, in turn, are determined by factors such as particle size, morphology, and symmetry, environmental coordination, the presence of defects and impurities, and particle temperature [70]. One of the main qualities of europium compounds, which allows them to be used in the creation of PCCs for greenhouses, is the ability to emit light in the photosynthetically active range due to the absorption of near-ultraviolet radiation [47,48,49]. The main absorption of europium is observed at 380 nm and 395 nm (7F05G2 and 7F05L6), and the main luminescence is observed at 580 nm and 613 nm (the position and relative intensity of which very strongly depend on the environment of europium ions and particle size) [49]. The remaining luminescence maxima make an insignificant contribution to the total emission and change only slightly with changes in the environment or particle size. In this work, two types of compounds were used to prepare nanophosphors: Eu2O3 and Eu3+:LaF3. Europium oxide nanoparticles are relatively widely used in various branches of science and technology [46], as they are an example of primary nanoparticles, that is, obtained from europium compounds as such, which significantly speeds up and reduces the cost of their production. Eu3+:LaF3 nanocrystals are representative of nanoluminophores based on a lanthanide substrate doped with Eu3+ ions. The advantage of Eu3+:LaF3 nanoparticles is their biocompatibility [70,71], which can be crucial when dealing with food products. However, the production of such particles is more difficult. Eu2O3 nanoparticles have less biocompatibility [72,73] in comparison to Eu3+:LaF3 nanoparticles. However, there are approaches to increase the biocompatibility of Eu2O3 nanoparticles. For example, a decrease in the concentration of nanoparticles [72,74], particle size [75], and environment [72,75] affects the biocompatibility of Eu2O3 nanoparticles. Currently, biological (green) methods for the synthesis of nanoparticles have gained popularity. This method is more eco-friendly and allows you to receive ultrasmall nanoparticles, which are more biocompatible in comparison to physical and chemical methods of synthesis [76]. The PCC developed by us can be safely used in greenhouses since nanoparticles created in our work do not interact with plants or soil, due to their inclusion in a fluoroplastic matrix, which has a very high adhesion to greenhouse glass.
In earlier published works, it was shown that the incorporation of europium nanocrystals into a PCC reduces the ability of Eu3+ to luminesce in the region of 5D07F1 (λ = 591 nm) and 5D07F4 (λ = 690 nm) transitions and retains the ability to emit in the region of the 5D07F2 transition (615 nm) [34,43]. Phosphors in the PCC-Eu3+:LaF3 obtained by us retained the ability to effectively luminesce in the region of the 5D07F
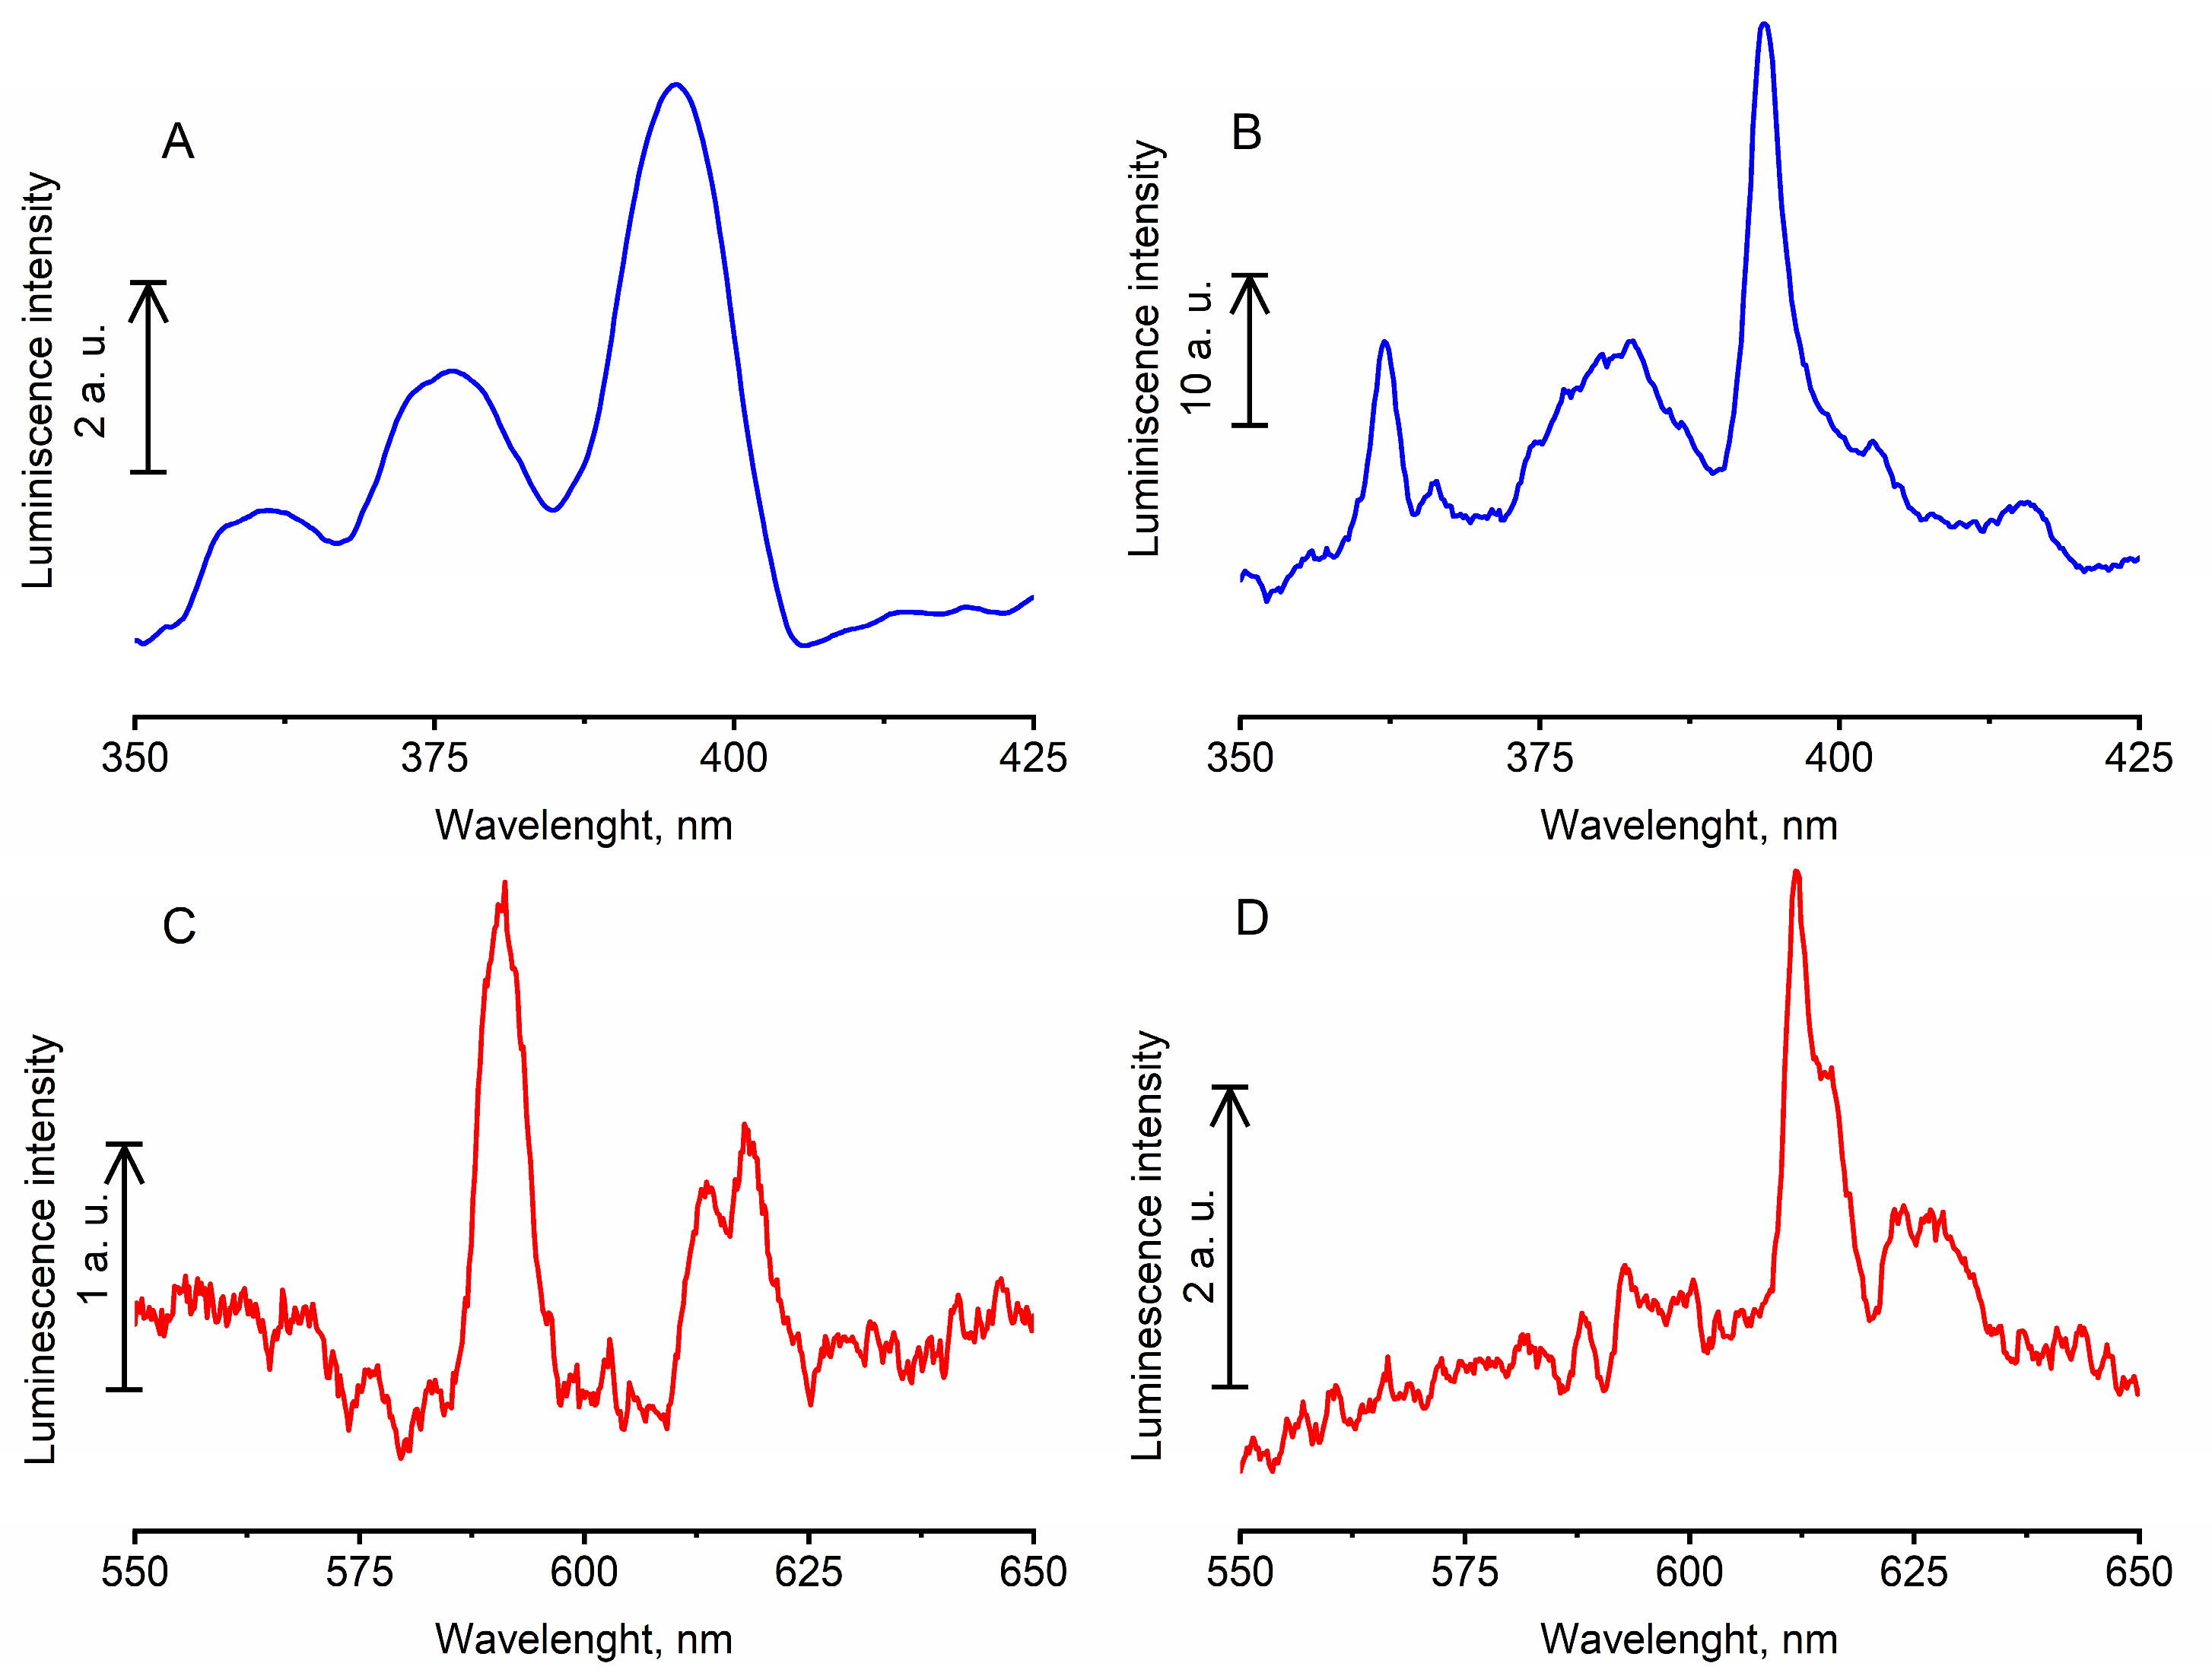
1 transition, and the luminescence band at 591 nm was much more intensive than the band at 615 nm (Figure 4C). The presence of an intensive band at 591 nm is associated with a feature of the crystal field of lanthanum fluoride [57,58,59]. The luminescence spectrum of PCC-Eu2O3 differed from the luminescence spectrum of PCC-Eu3+:LaF3 and had a pronounced luminescence maximum corresponding to the 5D07F2 transition (Figure 4D).
It is known that light of different wavelengths has different effects on plants [
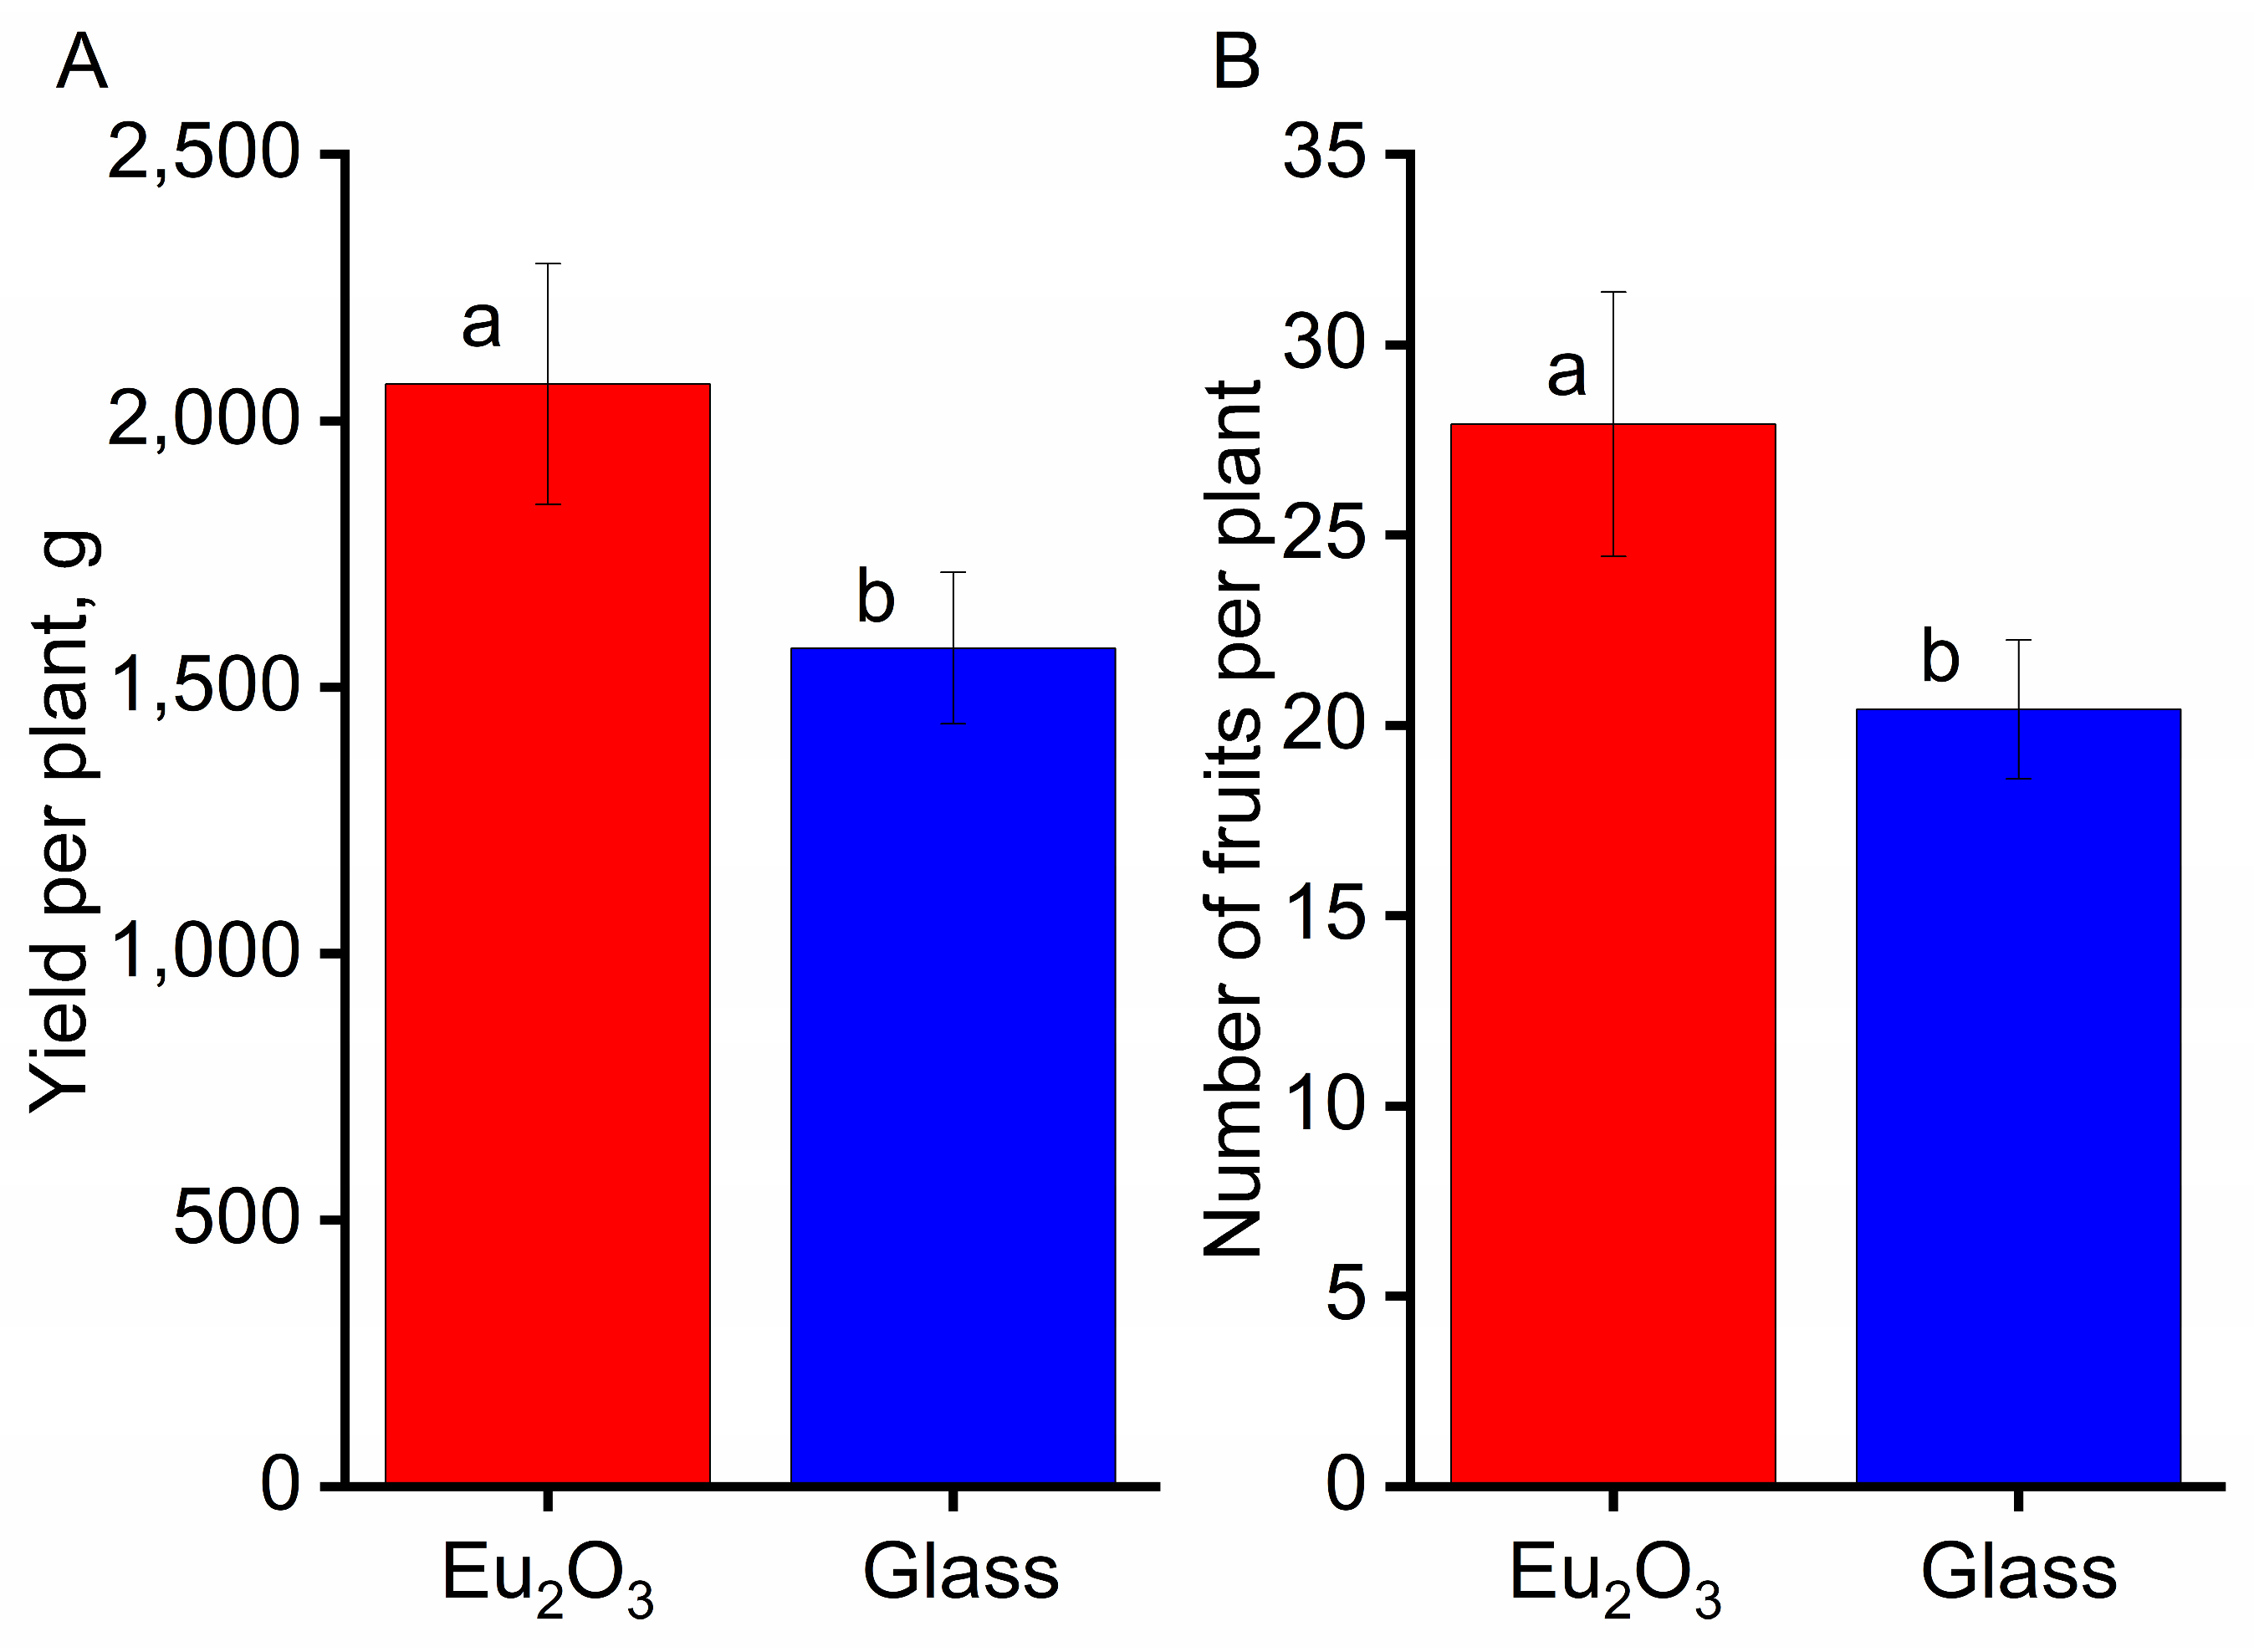
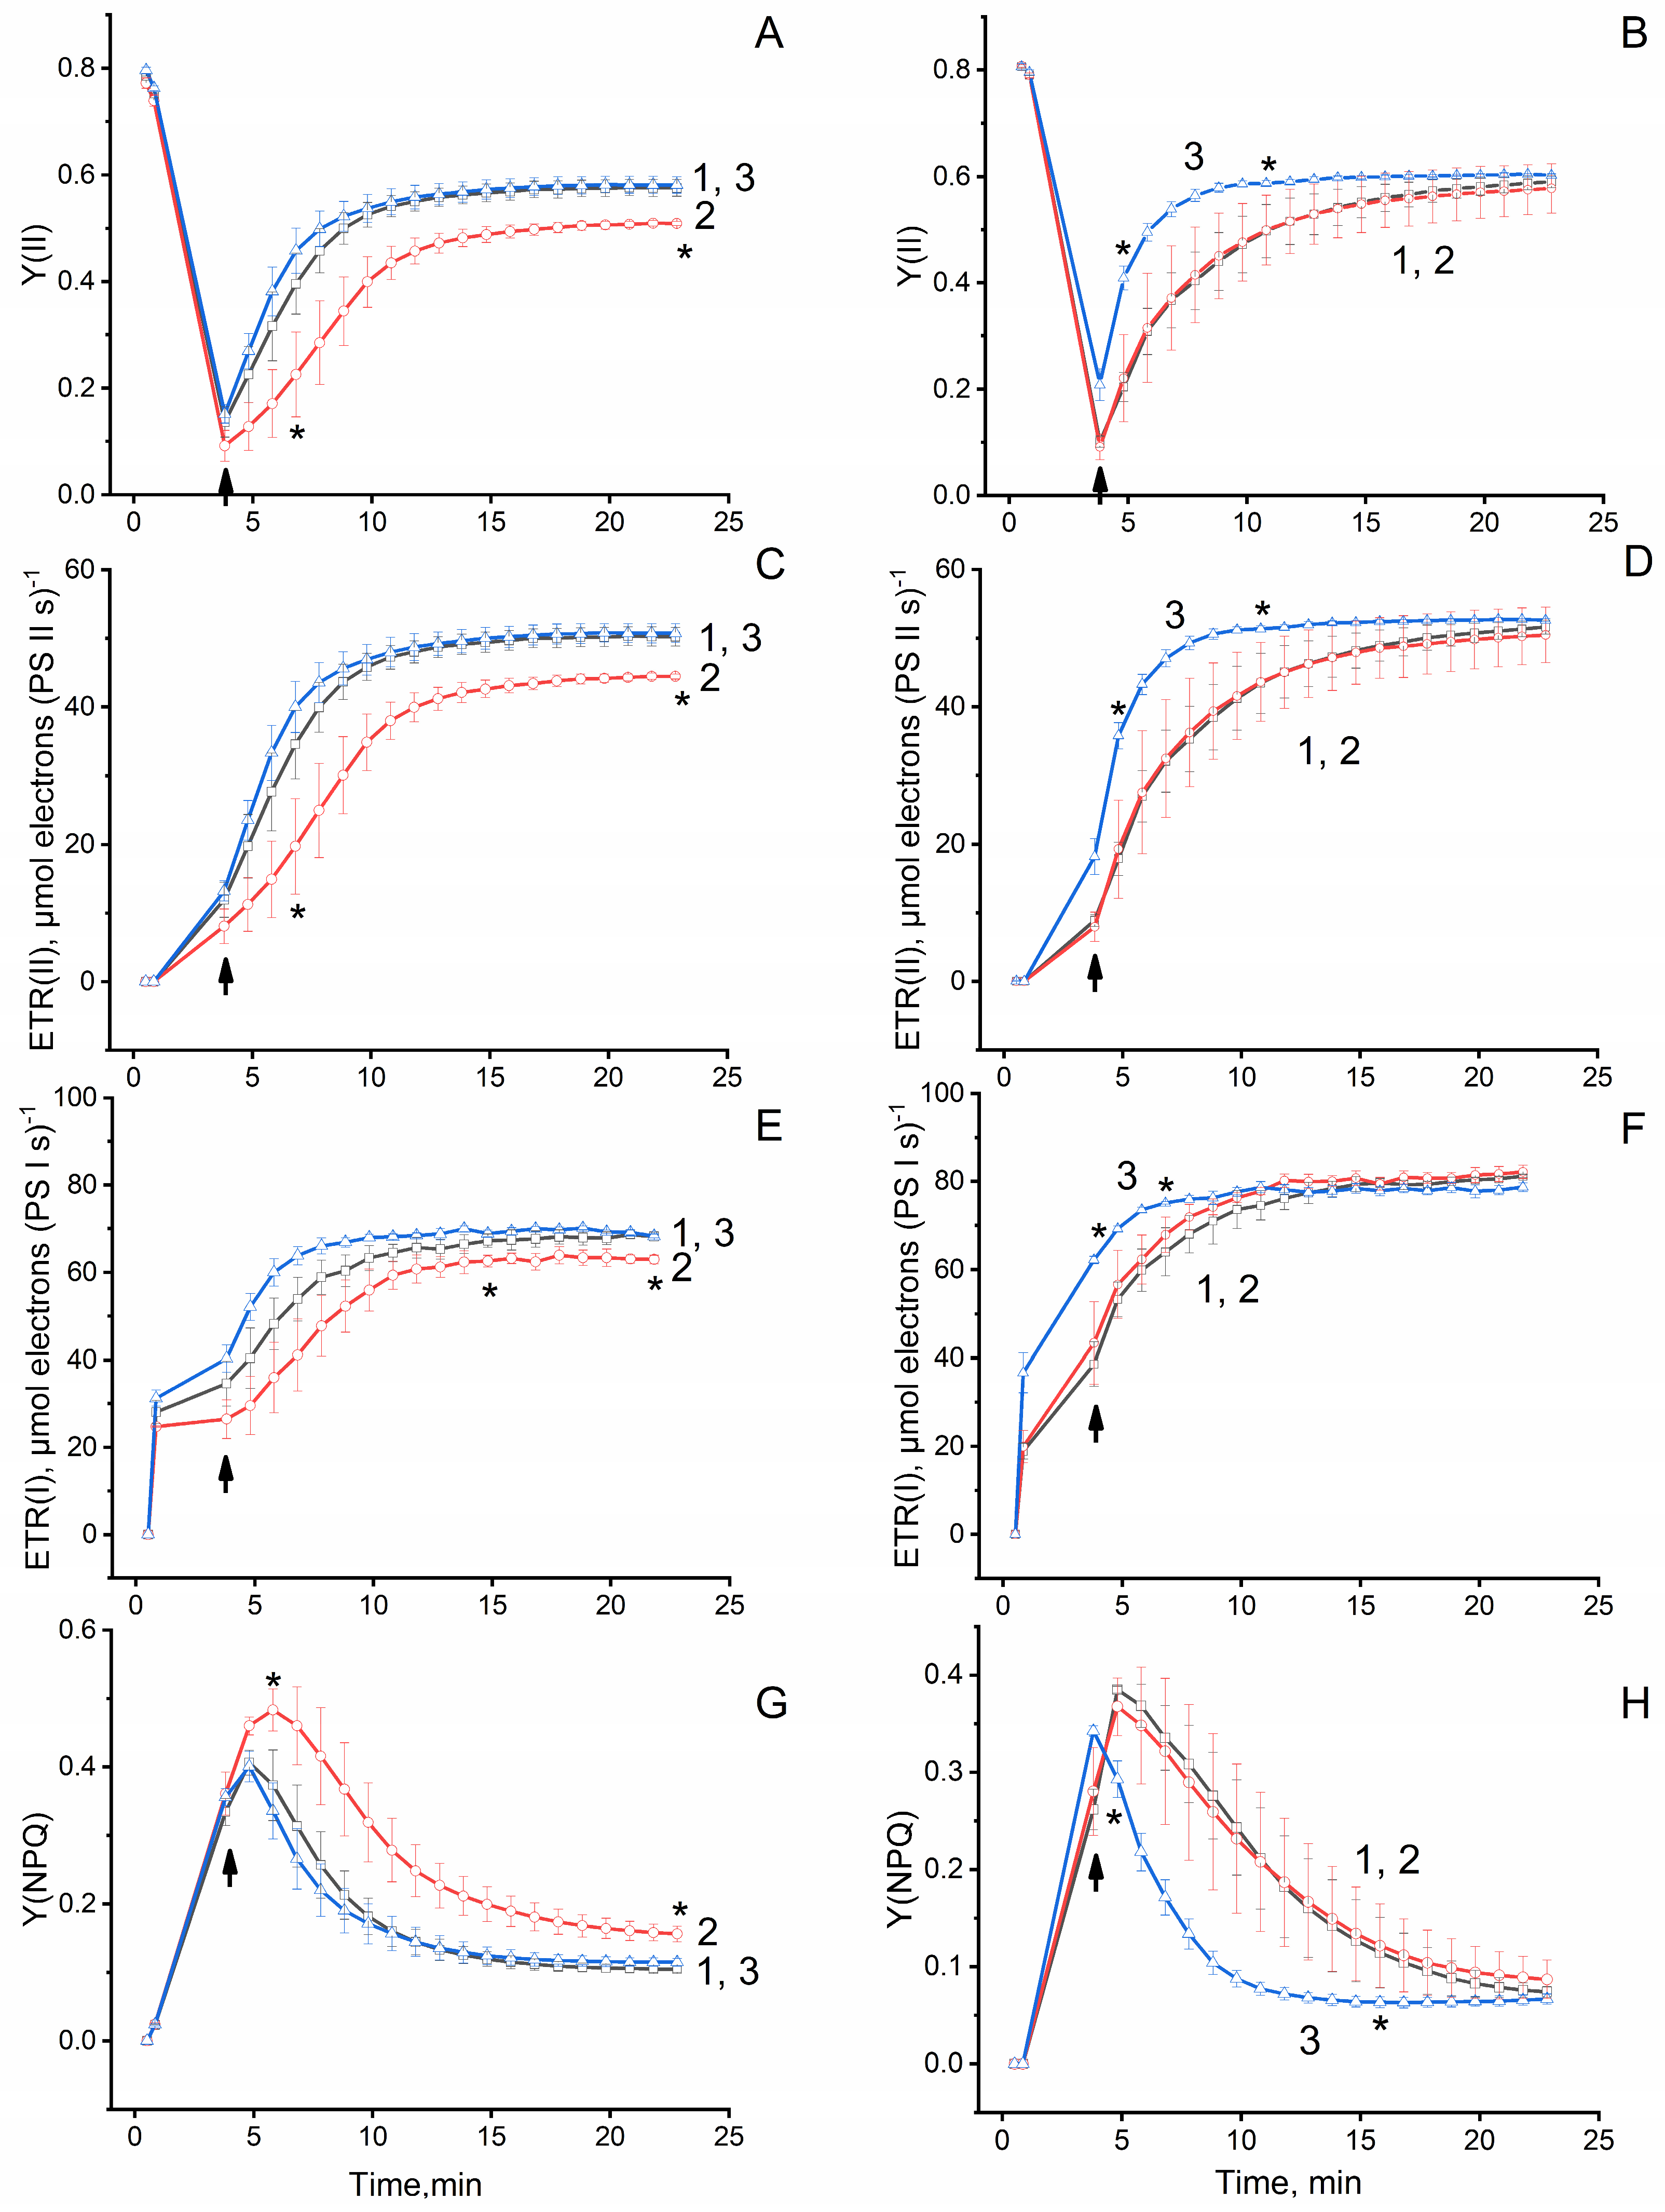
77]. In the present work, we observe stimulation (up to 40%) of the growth and development of tomato plants, as well as an increase in yield under PCC-Eu2O3, which converts ultraviolet light to red (with a maximum of 612 nm) (Figure 5). A statistically significant increase in biomass was not observed in cucumber plants (Table 1). In the leaves of plants grown under PCC-Eu2O3, an intensification of gas exchange processes, especially CO2 assimilation, correlating with a redistribution of the energy of absorbed light in favor of the dark stages of photosynthesis, confirmed by a change in the parameters of chlorophyll a fluorescence, was observed (Figure 6C,D and Figure 7B,D,F,H). PCC-Eu3+:LaF3, the main luminescence maximum of which is observed at λ = 591 nm, did not stimulate the growth and development of all the studied plant species. In contrast, cucumber plants grew 30% slower than control plants, and tomato plants grew on average lower than control plants, although without a statistically significant difference (Table 1). These data correlate with data on the development of gas exchange processes and chlorophyll fluorescence parameters (Figure 6 and Figure 7). It is known that the induction of carbon dioxide assimilation (photosynthesis) includes at least two phases [78]. It is assumed that the first fast phase (with a time constant of 1–2 min) is where the stock of ribulose-1,5-bisphosphate or other Calvin cycle intermediates available in the dark is consumed, while the second slow phase (with a time constant of 4–5 min) is where the photoactivation of Rubisco by Rubisco activase occurs. Differences in the kinetics of Rubisco activation may be due to differences in the total concentration of Rubisco activase or the ratio of its isoforms (α- and β-Rubisco activase), in the binding affinity of Rubisco activase to Rubisco, and/or in the localization of Rubisco activase relative to Rubisco. Arabidopsis mutants expressing only the β-Rubisco activase isoform, which is less sensitive to the redox status of chloroplasts than α-Rubisco activase, had a faster induction of photosynthesis [79]. In rice, Rubisco activase overexpressing mutants maintain higher Rubisco activation states in the dark and respond faster to changes in illumination than wild-type plants [80]. Differences in the development of the first phase of CO2 assimilation induction were found in our study among groups of plants grown under different covers, likely due to different contents of Calvin cycle intermediates in plants previously adapted in the dark, which may be the reason for the different plant productivity. The kinetics of changes in the parameters of chlorophyll fluorescence induction also have two phases and correlate well with gas exchange curves in plants. Some features in the fluorescence kinetics of chlorophyll a may be due to the lower activity of the Calvin cycle, and delayed activation of ferredoxin-NADP+ reductase, which is responsible for the transfer of electrons to NADP+ at the end of the electron transport chain of chloroplasts [81,82,83,84]. It was previously shown that the addition of even a small amount of red light leads to the intensification of photosynthesis [50] and an increase in plant productivity [34,43]. Moreover, additional red light strongly affects the parameters of the so-called “variable” fluorescence of chlorophyll a [85,86,87], having no effect on the intensity of gas exchange, due to a weak effect on the opening of stomata [88]. It was shown that the use of PCCs with europium compounds as a luminophore (with a luminescence maximum at 612 nm) has a positive effect on plant development [34,43]. It is believed that even a small increase in the proportion of red light (in particular, a change in the ratio of red light to far red) under PCCs can affect the functioning of the phytochrome system, which can regulate plant growth and increase resistance to adverse environmental conditions [40,45,89,90]. An increase in the proportion of orange light, in contrast to red, somewhat inhibits the growth and development of plants, and also leads to the appearance of signs of stress [91,92]. For example, in the work of Brazaityte et al., it was shown that the addition of 15 µmol photon s1 m2 of orange light (λ = 590 nm) slows down the development of cucumber seedlings [92]. It is known that orange light causes an increase in lipid peroxidation, an increase in antioxidant activity, and an increase in the content of osmolytes in plant leaves [86,93]. Thus, plants grown under light with an increased proportion of orange light, on the one hand, gain biomass more slowly, and, on the other hand, have increased resistance to oxidative stress due to an increased level of activity of the antioxidant system. It is likely that we observe a similar effect of orange light in the present study (Table 6). Red light can have the opposite effect: inhibit the synthesis of protective antioxidant enzymes, but stimulate photosynthesis [87,94,95].
Light is perceived by plants and microorganisms, which react even to small changes in intensity in a narrow wavelength range, as a signal, activates specific internal reactions, and affects the interaction of plants and microorganisms [96,97,98,99,100,101]. Plant light responses include changes in hormonal levels, the production of secondary metabolites, and the release of volatile compounds, which ultimately affect the interactions between plants and the phyllosphere, laimosphere, and rhizosphere. The reactions of microorganisms to light may include the release of various substances, including plant growth regulators. It is known that light can have a great influence on the development of both beneficial and neutral and pathogenic microflora [41,97,102,103]. On the one hand, light can have a direct effect on the microflora [104,105,106,107,108,109,110]. On the other hand, light has a plant-mediated effect on the microflora [111,112,113,114,115,116,117,118,119]. Light can both increase plant resistance to phytopathogens [116,120,121,122,123,124] and decrease it [122,125]. Many studies have shown that microflora is affected not only by white or sunlight per se, but each component of the solar spectrum is important: ultraviolet radiation, blue, far red, etc. Red light has a great influence on the microflora [106,126] and the interaction of plants with microorganisms [114,123,124,125,126,127,128,129,130,131]. As a rule, red light inhibits the development of phytopathogens and increases plant resistance. The increase in the resistance of tomato plants to the development of P. infestans on leaves observed in our experiments may be associated with an increase in the proportion of red light (Table 6) due to the use of PCC-Eu2O3. At the same time, the effect of PCC-Eu2O3 was manifested both in the light (Figure 9A) and in the dark (Figure 9B,C), which may indicate a plant-mediated effect of the changed light spectrum. Also, an important factor can be the ratio of the light intensities of different parts of the spectrum, for example, the ratio of red light to far red. On the one hand, an increase in the proportion of far red light leads to an increase in plant susceptibility to phytopathogens [115,125,132,133], and on the other hand, plant morphology altered by an increased proportion of far red light can prevent the spread of diseases [134,135]. However, some studies highlight the crucial role of biological rhythms rather than climate factors in exploring seasonal carbon dynamics and global carbon balance. For example, terrestrial ecosystems in the Northern Hemisphere in the peak of the growing season were dominated by the shifts in plant phenology [136]. Therefore, under our conditions, changes in both the light spectrum and biological rhythms can influence the growth and development of plants.
Thus, we developed two types of europium-based PCC with different luminescence spectra. The covers had various effects on the growth and development, including biochemical and photochemical processes, of agricultural plants. It was assumed that changes in the illumination spectrum by the PCC cause both the activation of plant growth in the case of using Eu2O3 and the increase in plant resistance to the action of high and low temperatures in the case of using Eu3+:LaF3. Moreover, PCC-Eu2O3 can be used to increase the resistance of tomato plants to P. infestans.

Author Contributions

Conceptualization, M.O.P., D.V.Y., A.V.P., S.V.G. and V.A.V.; methodology, M.O.P., D.V.Y., A.V.P., A.T.S., R.V.P., D.V.K., A.A.V., A.S.D. and A.Y.I.; validation, D.V.Y., A.V.P., S.V.G., E.O.O., Y.V.O. and M.O.P.; formal analysis, M.O.P., D.V.Y. and A.V.P.; investigation, M.O.P., D.V.Y., A.V.P., A.T.S., R.V.P., D.V.K., A.A.V., A.S.D. and A.Y.I.; writing—review and editing, D.V.Y., A.V.P., S.V.G., E.O.O., Y.V.O. and M.O.P.; funding acquisition, S.V.G. All authors have read and agreed to the published version of the manuscript.

Funding

This research was funded by a grant of the Ministry of Science and Higher Education of the Russian Federation for large scientific projects in priority areas of scientific and technological development (subsidy identifier 075-15-2020-774).

Data Availability Statement

Not applicable.

Acknowledgments

The authors are grateful to the Center for Collective Use of the GPI RAS for the equipment provided.

Conflicts of Interest

The authors declare no conflict of interest.

References

  1. Zhang, T.; Lin, W. Metal–Organic Frameworks for Artificial Photosynthesis and Photocatalysis. Chem. Soc. Rev. 2014, 43, 5982–5993. [Google Scholar] [CrossRef] [PubMed]
  2. Shevela, D.; Björn, L.O.; Govindjee, L. Photosynthesis: Solar Energy for Life; World Scientific: Singapore, 2019; p. 10522. [Google Scholar] [CrossRef]
  3. Kruse, O.; Rupprecht, J.; Mussgnug, J.H.; Dismukes, G.C.; Hankamer, B. Photosynthesis: A Blueprint for Solar Energy Capture and Biohydrogen Production Technologies. Photochem. Photobiol. Sci. 2005, 4, 957–970. [Google Scholar] [CrossRef] [PubMed]
  4. Rye, R.; Holland, H. Paleosols and the Evolution of Atmospheric Oxygen: A Critical Review. Am. J. Sci. 1998, 298, 621–672. [Google Scholar] [CrossRef] [PubMed]
  5. Dismukes, G.C.; Klimov, V.V.; Baranov, S.V.; Kozlov, Y.N.; DasGupta, J.; Tyryshkin, A. The Origin of Atmospheric Oxygen on Earth: The Innovation of Oxygenic Photosynthesis. Proc. Natl. Acad. Sci. USA 2001, 98, 2170–2175. [Google Scholar] [CrossRef]
  6. Bolton, J.R.; Hall, D.O. The maximum efficiency of photosynthesis*. Photochem. Photobiol. 1991, 53, 545–548. [Google Scholar] [CrossRef]
  7. Zhu, X.G.; Long, S.P.; Ort, D.R. What Is the Maximum Efficiency with Which Photosynthesis Can Convert Solar Energy into Biomass? Curr. Opin. Biotechnol. 2008, 19, 153–159. [Google Scholar] [CrossRef]
  8. Zhu, X.G.; Long, S.P.; Ort, D.R. Improving Photosynthetic Efficiency for Greater Yield. Annu. Rev. Plant Biol. 2010, 61, 235–261. [Google Scholar] [CrossRef] [Green Version]
  9. Grinberg, M.A.; Vodeneev, V.A.; Il’in, N.V.; Mareev, E.A. Laboratory Simulation of Photosynthesis in a Wide Range of Electromagnetic and Radiation Environment Parameters. Astron. Rep. 2023, 67, 71–77. [Google Scholar] [CrossRef]
  10. Kromdijk, J.; Głowacka, K.; Leonelli, L.; Gabilly, S.T.; Iwai, M.; Niyogi, K.K.; Long, S.P. Improving Photosynthesis and Crop Productivity by Accelerating Recovery from Photoprotection. Science 2016, 354, 857–861. [Google Scholar] [CrossRef] [Green Version]
  11. Leone, G.; De la Cruz Valbuena, G.; Cicco, S.R.; Vona, D.; Altamura, E.; Ragni, R.; Molotokaite, E.; Cecchin, M.; Cazzaniga, S.; Ballottari, M.; et al. Incorporating a Molecular Antenna in Diatom Microalgae Cells Enhances Photosynthesis. Sci. Rep. 2021, 11, 5209. [Google Scholar] [CrossRef]
  12. Shen, L.; Yin, X. Solar Spectral Management for Natural Photosynthesis: From Photonics Designs to Potential Applications. Nano Converg. 2022, 9, 36. [Google Scholar] [CrossRef] [PubMed]
  13. Xu, X.; Shen, R.; Mo, L.; Yang, X.; Chen, X.; Wang, H.; Li, Y.; Hu, C.; Lei, B.; Zhang, X.; et al. Improving Plant Photosynthesis through Light-Harvesting Upconversion Nanoparticles. ACS Nano 2022, 16, 18027–18037. [Google Scholar] [CrossRef]
  14. Paskhin, M.O.; Yanykin, D.V.; Gudkov, S.V. Current Approaches to Light Conversion for Controlled Environment Agricultural Applications: A Review. Horticulturae 2022, 8, 885. [Google Scholar] [CrossRef]
  15. Borowitzka, M.A.; Vonshak, A. Scaling up Microalgal Cultures to Commercial Scale. Eur. J. Phycol. 2017, 52, 407–418. [Google Scholar] [CrossRef]
  16. Szyjka, S.J.; Mandal, S.; Schoepp, N.G.; Tyler, B.M.; Yohn, C.B.; Poon, Y.S.; Villareal, S.; Burkart, M.D.; Shurin, J.B.; Mayfield, S.P. Evaluation of Phenotype Stability and Ecological Risk of a Genetically Engineered Alga in Open Pond Production. Algal Res. 2017, 24, 378–386. [Google Scholar] [CrossRef] [Green Version]
  17. Bella, F.; Sibí, M. Review of Luminescence-Based Light Spectrum Modifications Methods and Materials for Photovoltaics Applications. Materials 2023, 16, 3112. [Google Scholar] [CrossRef]
  18. Fang, M.J.; Tsao, C.W.; Hsu, Y.J. Semiconductor Nanoheterostructures for Photoconversion Applications. J. Phys. D Appl. Phys. 2020, 53, 143001. [Google Scholar] [CrossRef]
  19. LLEAF. Available online: https://lleaf.com/ (accessed on 28 April 2023).
  20. UbiGro Greenhouse Film|Shop Greenhouse Covering Materials. Available online: https://ubigro.com/ (accessed on 28 April 2023).
  21. De Salvador, F.R.; Scarascia Mugnozza, G.; Vox, G.; Schettini, E.; Mastrorilli, M.; Bou Jaoudé, M. Innovative Photoselective and Photoluminescent Plastic Films for Protected Cultivation. Acta Hortic. 2008, 801, 115–121. [Google Scholar] [CrossRef]
  22. González, A.; Rodríguez, R.; Bañón, S.; Franco, J.A.; Fernández, J.A.; Salmerón, A.; Espí, E. Strawberry and Cucumber Cultivation under Fluorescent Photoselective Plastic Films Cover. Acta Hortic. 2003, 614, 407–413. [Google Scholar] [CrossRef]
  23. Edser, C. Light Manipulating Additives Extend Opportunities for Agricultural Plastic Films. Plast. Addit. Compd. 2002, 4, 20–24. [Google Scholar] [CrossRef]
  24. Hamada, K.; Shimasaki, K.; Nishimura, Y.; Oyama-Egawa, H.; Yoshida, K. Effects of Red, Blue and Yellow Fluorescent Films on Proliferation and Organogenesis in Cymbidium and Phalaenopsis PLB in Vitro. Acta Hortic. 2011, 907, 381–384. [Google Scholar] [CrossRef]
  25. Hamada, K.; Shimasaki, K.; Ogata, T.; Nishimura, Y.; Nakamura, K.; Oyama-Egawa, H.; Yoshida, K. Effects of Spectral Composition Conversion Film and Plant Growth Regulators on Proliferation of Cymbidium Protocorm Like Body (PLB) Cultured In Vitro. Environ. Control Biol. 2010, 48, 127–132. [Google Scholar] [CrossRef] [Green Version]
  26. Hemming, S.; van Os, E.A.; Hemming, J.; Dieleman, J.A. The Effect of New Developed Fluorescent Greenhouse Films on the Growth of Fragaria x Ananassa “Elsanta”. Eur. J. Hortic. Sci. 2006, 71, 145–154. [Google Scholar]
  27. Hidaka, K.; Yoshida, K.; Shimasaki, K.; Murakami, K.; Yasutake, D.; Kitano, M. Spectrum Conversion Film for Regulation of Plant Growth. J. Fac. Agric. Kyushu Univ. 2008, 53, 549–552. [Google Scholar] [CrossRef] [PubMed]
  28. Ke-li, Z.; Liang-jie, Y.; Mei-yun, X.; You-zu, Y.; Ju-tang, S. The Application of Lights-Conversed Polyethylene Film for Agriculture. Wuhan Univ. J. Nat. Sci. 2002, 7, 365–367. [Google Scholar] [CrossRef]
  29. Nishimura, Y.; Wada, E.; Fukumoto, Y.; Aruga, H.; Shimoi, Y. The Effect of Spectrum Conversion Covering Film on Cucumber in Soilless Culture. Acta Hortic. 2012, 956, 481–487. [Google Scholar] [CrossRef]
  30. Novoplansky, A.; Sachs, T.; Cohen, D.; Bar, R.; Bodenheimer, J.; Reisfeld, R. Increasing Plant Productivity by Changing the Solar Spectrum. Sol. Energy Mater. 1990, 21, 17–23. [Google Scholar] [CrossRef]
  31. Sánchez-Lanuza, M.B.; Menéndez-Velázquez, A.; Peñas-Sanjuan, A.; Navas-Martos, F.J.; Lillo-Bravo, I.; Delgado-Sánchez, J.M. Advanced Photonic Thin Films for Solar Irradiation Tuneability Oriented to Greenhouse Applications. Materials 2021, 14, 2357. [Google Scholar] [CrossRef]
  32. Schettini, E.; de Salvador, F.R.; Scarascia-Mugnozza, G.; Vox, G. Radiometric Properties of Photoselective and Photoluminescent Greenhouse Plastic Films and Their Effects on Peach and Cherry Tree Growth. J. Hortic. Sci. Biotechnol. 2015, 86, 79–83. [Google Scholar] [CrossRef]
  33. Simakin, A.V.; Ivanyuk, V.V.; Dorokhov, A.S.; Gudkov, S.V. Photoconversion Fluoropolymer Films for the Cultivation of Agricultural Plants Under Conditions of Insufficient Insolation. Appl. Sci. 2020, 10, 8025. [Google Scholar] [CrossRef]
  34. Wu, W.; Zhang, Z.; Dong, R.; Xie, G.; Zhou, J.; Wu, K.; Zhang, H.; Cai, Q.; Lei, B. Characterization and Properties of a Sr2Si5N8:Eu2+-Based Light-Conversion Agricultural Film. J. Rare Earths 2020, 38, 539–545. [Google Scholar] [CrossRef]
  35. Yoon, H.I.; Kim, J.H.; Park, K.S.; Namgoong, J.W.; Hwang, T.G.; Kim, J.P.; Son, J.E. Quantitative Methods for Evaluating the Conversion Performance of Spectrum Conversion Films and Testing Plant Responses under Simulated Solar Conditions. Hortic. Environ. Biotechnol. 2020, 61, 999–1009. [Google Scholar] [CrossRef]
  36. In Yoon, H.; Hyeun Kang, J.; Kim, D.; Eek Son, J. Seedling Quality and Photosynthetic Characteristic of Vegetables Grown Under a Spectrum Conversion Film. J. Bio-Environ. Control. 2021, 30, 110–117. [Google Scholar] [CrossRef]
  37. Chiu, Y.H.; Chang, T.F.M.; Chen, C.Y.; Sone, M.; Hsu, Y.J. Mechanistic Insights into Photodegradation of Organic Dyes Using Heterostructure Photocatalysts. Catalysts 2019, 9, 430. [Google Scholar] [CrossRef] [Green Version]
  38. Parrish, C.H.; Hebert, D.; Jackson, A.; Ramasamy, K.; McDaniel, H.; Giacomelli, G.A.; Bergren, M.R. Optimizing Spectral Quality with Quantum Dots to Enhance Crop Yield in Controlled Environments. Commun. Biol. 2021, 4, 124. [Google Scholar] [CrossRef] [PubMed]
  39. Ivanyuk, V.V.; Shkirin, A.V.; Belosludtsev, K.N.; Dubinin, M.V.; Kozlov, V.A.; Bunkin, N.F.; Dorokhov, A.S.; Gudkov, S.V. Influence of Fluoropolymer Film Modified with Nanoscale Photoluminophor on Growth and Development of Plants. Front. Phys. 2020, 8, 616040. [Google Scholar] [CrossRef]
  40. Burmistrov, D.E.; Yanykin, D.V.; Simakin, A.V.; Paskhin, M.O.; Ivanyuk, V.V.; Kuznetsov, S.V.; Ermakova, J.A.; Alexandrov, A.A.; Gudkov, S.V. Cultivation of Solanum lycopersicum under Glass Coated with Nanosized Upconversion Luminophore. Appl. Sci. 2021, 11, 10726. [Google Scholar] [CrossRef]
  41. Minich, A.S.; Minich, I.B.; Shaitarova, O.V.; Permyakova, N.L.; Zelenchukova, N.S.; Ivanitskiy, A.E.; Filatov, D.A.; Ivlev, G.A. Vital Activity of Lactuca Sativa and Soil Microorganisms under Fluorescent Films. TPSU Bull. 2011, 8, 78–84. [Google Scholar]
  42. Golovatskaya, I.F.; Minich, A.S.; Bolshakova, M.A. Regulation and Development of Brassica oleracea L. Plants Growth with the Help of Sunlight Correction. Tomsk. State Univ. J. Biol. 2012, 2, 151–165. [Google Scholar]
  43. Zelenchukova, N.S.; Ivanitsky, A.E.; Agaeva, S.A.; Tishkina, V.N. Productivity, Ascorbic Acid Synthesis and Catalase Activity in Lactuca sativa L. Leaves under Plastic Films. TSPU Bull. 2013, 8, 55–59. [Google Scholar]
  44. Yanykin, D.V.; Burmistrov, D.E.; Simakin, A.V.; Ermakova, J.A.; Gudkov, S.V. Effect of Up-Converting Luminescent Nanoparticles with Increased Quantum Yield Incorporated into the Fluoropolymer Matrix on Solanum lycopersicum Growth. Agronomy 2022, 12, 108. [Google Scholar] [CrossRef]
  45. Yanykin, D.V.; Paskhin, M.O.; Simakin, A.V.; Burmistrov, D.E.; Pobedonostsev, R.V.; Vyatchinov, A.A.; Vedunova, M.V.; Kuznetsov, S.V.; Ermakova, J.A.; Alexandrov, A.A.; et al. Plant Photochemistry under Glass Coated with Upconversion Luminescent Film. Appl. Sci. 2022, 12, 7480. [Google Scholar] [CrossRef]
  46. De Sousa Filho, P.C.; Lima, J.F.; Serra, O.A. From Lighting to Photoprotection: Fundamentals and Applications of Rare Earth Materials. J. Braz. Chem. Soc. 2015, 26, 2471–2495. [Google Scholar] [CrossRef]
  47. Chen, Q.H.; Shi, S.Y.; Zhang, W. gong Study on the Structure and Luminescent Properties of the Coordinated Eu2O3 Ethanol Colloids. Mater. Chem. Phys. 2009, 114, 58–62. [Google Scholar] [CrossRef]
  48. Feng, J.; Shan, G.; Maquieira, A.; Koivunen, M.E.; Guo, B.; Hammock, B.D.; Kennedy, I.M. Functionalized Europium Oxide Nanoparticles Used as a Fluorescent Label in an Immunoassay for Atrazine. Anal. Chem. 2003, 75, 5282–5286. [Google Scholar] [CrossRef]
  49. Peng, Y.; Chen, X.; Gao, Z. Determination of Trace Amounts of Mercury Using Hierarchically Nanostructured Europium Oxide. Talanta 2010, 82, 1924–1928. [Google Scholar] [CrossRef]
  50. McCree, K.J. The Action Spectrum, Absorptance and Quantum Yield of Photosynthesis in Crop Plants. Agric. Meteorol. 1971, 9, 191–216. [Google Scholar] [CrossRef]
  51. Sudarsan, V.; Van Veggel, F.C.J.M.; Herring, R.A.; Raudsepp, M. Surface Eu3+ Ions Are Different than “Bulk” Eu3+ Ions in Crystalline Doped LaF3 Nanoparticles. J. Mater. Chem. 2005, 15, 1332–1342. [Google Scholar] [CrossRef]
  52. Janssens, S.; Williams, G.V.M.; Clarke, D. Systematic Study of Sensitized LaF3: Eu3+ Nanoparticles. J. Appl. Phys. 2011, 109, 23506. [Google Scholar] [CrossRef]
  53. Vistovskyy, V.; Malyi, T.; Vas’kiv, A.; Chylii, M.; Mitina, N.; Zaichenko, A.; Gektin, A.; Voloshinovskii, A. Luminescent Properties of LuPO4-Pr and LuPO4-Eu Nanoparticles. J. Lumin. 2016, 179, 527–532. [Google Scholar] [CrossRef]
  54. Huignard, A.; Buissette, V.; Franville, A.C.; Gacoin, T.; Boilot, J.P. Emission Processes in YVO4:Eu Nanoparticles. J. Phys. Chem. B 2003, 107, 6754–6759. [Google Scholar] [CrossRef]
  55. Trandafilović, L.V.; Jovanović, D.J.; Zhang, X.; Ptasińska, S.; Dramićanin, M.D. Enhanced Photocatalytic Degradation of Methylene Blue and Methyl Orange by ZnO:Eu Nanoparticles. Appl. Catal. B 2017, 203, 740–752. [Google Scholar] [CrossRef] [Green Version]
  56. Chen, W.; Malm, J.-O.; Zwiller, V.; Huang, Y.; Liu, S.; Wallenberg, R.; Bovin, J.-O.; Samuelson, L. Energy Structure and Fluorescence of Eu2+ in ZnS:Eu Nanoparticles. Phys. Rev. B 2000, 61, 11021. [Google Scholar] [CrossRef]
  57. Pawlik, N.; Szpikowska-Sroka, B.; Pietrasik, E.; Goryczka, T.; Pisarski, W.A. Structural and Luminescence Properties of Silica Powders and Transparent Glass-Ceramics Containing LaF3:Eu3+ Nanocrystals. J. Am. Ceram. Soc. 2018, 101, 4654–4668. [Google Scholar] [CrossRef]
  58. Zhu, L.; Meng, J.; Cao, X. Facile Synthesis and Photoluminescence of Europium Ion Doped LaF3 Nanodisks. Eur. J. Inorg. Chem. 2007, 2007, 3863–3867. [Google Scholar] [CrossRef]
  59. Sun, J.; Wang, H.; Zhang, Y.; Zheng, Y.; Xu, Z.; Liu, R. Structure and Luminescent Properties of Electrodeposited Eu3+-Doped CaF2 Thin Films. Thin Solid Films 2014, 562, 478–484. [Google Scholar] [CrossRef]
  60. Lichtenthaler, H.K. Chlorophylls and Carotenoids: Pigments of Photosynthetic Biomembranes. Methods Enzymol. 1987, 148, 350–382. [Google Scholar] [CrossRef]
  61. Kalaji, H.M.; Dąbrowski, P.; Cetner, M.D.; Samborska, I.A.; Łukasik, I.; Brestic, M.; Zivcak, M.; Tomasz, H.; Mojski, J.; Kociel, H.; et al. A Comparison between Different Chlorophyll Content Meters under Nutrient Deficiency Conditions. J. Plant Nutr. 2016, 40, 1024–1034. [Google Scholar] [CrossRef]
  62. Walz, H. DUAL-PAM-100 DUAL-PAM/F MANUAL. Available online: https://www.walz.com/files/downloads/manuals/dual-pam-100/DualPamEd05.pdf (accessed on 17 July 2023).
  63. Yamori, W.; Makino, A.; Shikanai, T. A Physiological Role of Cyclic Electron Transport around Photosystem I in Sustaining Photosynthesis under Fluctuating Light in Rice. Sci. Rep. 2016, 6, 20147. [Google Scholar] [CrossRef] [Green Version]
  64. Available online: https://www.walz.com/files/downloads/manuals/gfs-3000/GFS-3000_Manual_9.pdf (accessed on 17 July 2023).
  65. James, W.C. Illustrated Series of Assessment Keys for Plant Diseases, Their Preparation and Usage. Can. Plant Dis. Surv. 1971, 51, 39–65. [Google Scholar]
  66. Filippov, A.V. Late Blight of Potatoes. Plant Prot. Quar. 2012, 5, 61–88. [Google Scholar]
  67. Orlovskii, Y.V.; Popov, A.V.; Orlovskaya, E.O.; Vanetsev, A.S.; Vagapova, E.A.; Rähn, M.; Sammelselg, V.; Sildos, I.; Baranchikov, A.E.; Grachev, P.V.; et al. Comparison of Concentration Dependence of Relative Fluorescence Quantum Yield and Brightness in First Biological Window of Wavelengths for Aqueous Colloidal Solutions of Nd3+: LaF3 and Nd3+: KY3F10 Nanocrystals Synthesized by Microwave-Hydrothermal Treatment. J. Alloys Compd. 2018, 756, 182–192. [Google Scholar] [CrossRef]
  68. Grünwald, N.J.; Flier, W.G. The Biology of Phytophthora infestans at Its Center of Origin*. Annu. Rev. Phytopathol. 2005, 43, 171–190. [Google Scholar] [CrossRef]
  69. Yu, L.; Song, H.; Lu, S.; Liu, Z.; Yang, L.; Kong, X. Luminescent Properties of LaPO4:Eu Nanoparticles and Nanowires. J. Phys. Chem. B 2004, 108, 16697–16702. [Google Scholar] [CrossRef]
  70. Syamchand, S.S.; Sony, G. Europium Enabled Luminescent Nanoparticles for Biomedical Applications. J. Lumin. 2015, 165, 190–215. [Google Scholar] [CrossRef]
  71. Yan, D.; Lei, B.; Chen, B.; Wu, X.J.; Liu, Z.; Li, N.; Ge, J.; Xue, Y.; Du, Y.; Zheng, Z.; et al. Synthesis of High-Quality Lanthanide Oxybromides Nanocrystals with Single-Source Precursor for Promising Applications in Cancer Cells Imaging. Appl. Mater. Today 2015, 1, 20–26. [Google Scholar] [CrossRef]
  72. Chaudhary, S.; Sharma, P.; Kumar, S.; Alex, S.A.; Kumar, R.; Mehta, S.K.; Mukherjee, A.; Umar, A. A comparative multi-assay approach to study the toxicity behaviour of Eu2O3 nanoparticles. J. Mol. Liq. 2018, 269, 783–795. [Google Scholar] [CrossRef]
  73. Kattel, K.; Park, J.Y.; Xu, W.; Kim, H.G.; Lee, E.J.; Bony, B.A.; Heo, W.C.; Chang, Y.; Kim, T.J.; Do, J.Y.; et al. Water-soluble ultrasmall Eu2O3 nanoparticles as a fluorescent imaging agent: In vitro and in vivo studies. Colloids Surf. A Physicochem. Eng. Asp. 2012, 394, 85–91. [Google Scholar] [CrossRef]
  74. Olifirenko, V.; Abduraimova, A.; Kang, M.S.; Raja, I.S.; Duisenbayeva, B.; Molkenova, A.; Khamkhash, L.; Hwang, Y.-H.; Han, D.-W.; Atabaev, T.S. Potential applicability of polyethyleneimine PEI-coated Eu2O3 and Dy2O3 nanoparticles for contrast enhancement in computed tomography. Nano Express 2021, 2, 010022. [Google Scholar] [CrossRef]
  75. Zhang, Q.; Pratt, E.C.; Tamura, R.; Ogirala, A.; Hsu, H.T.; Farahmand, N.; O’Brien, S.; Grimm, J. Ultrasmall downconverting nanoparticle for enhanced Cerenkov imaging. Nano Lett. 2021, 21, 4217–4224. [Google Scholar] [CrossRef]
  76. Narayanan, K.B.; Sakthivel, N. Biological synthesis of metal nanoparticles by microbes. Adv. Colloid Interface Sci. 2010, 156, 1–13. [Google Scholar] [CrossRef] [PubMed]
  77. Gudkov, S.V.; Andreev, S.N.; Barmina, E.V.; Bunkin, N.F.; Kartabaeva, B.B.; Nesvat, A.P.; Stepanov, E.V.; Taranda, N.I.; Khramov, R.N.; Glinushkin, A.P. Effect of Visible Light on Biological Objects: Physiological and Pathophysiological Aspects. Phys. Wave Phenom. 2017, 25, 207–213. [Google Scholar] [CrossRef]
  78. Pearcy, R.W. Sunflecks and Photosynthesis in Plant Canopies. Annu. Rev. Plant Biol. 2003, 41, 421–453. [Google Scholar] [CrossRef]
  79. Elizabete Carmo-Silva, A.; Salvucci, M.E. The Regulatory Properties of Rubisco Activase Differ among Species and Affect Photosynthetic Induction during Light Transitions. Plant Physiol. 2013, 161, 1645–1655. [Google Scholar] [CrossRef] [Green Version]
  80. Yamori, W.; Masumoto, C.; Fukayama, H.; Makino, A. Rubisco Activase Is a Key Regulator of Non-Steady-State Photosynthesis at Any Leaf Temperature and, to a Lesser Extent, of Steady-State Photosynthesis at High Temperature. Plant J. 2012, 71, 871–880. [Google Scholar] [CrossRef] [PubMed]
  81. Dau, H. New Trends in Photobiology: Short-Term Adaptation of Plants to Changing Light Intensities and Its Relation to Photosystem II Photochemistry and Fluorescence Emission. J. Photochem. Photobiol. B 1994, 26, 3–27. [Google Scholar] [CrossRef]
  82. Hansen, U.P.; Moldaenke, C.; Tabrizi, H.; Ramm, D. The Effect of Transthylakoid Proton Uptake on Cytosolic PH and the Imbalance of ATP and NAPDH/H+ Production as Measured by CO2- and Light-Induced Depolarisation of the Plasmalemma. Plant Cell Physiol. 1993, 34, 681–695. [Google Scholar] [CrossRef]
  83. Schansker, G.; Tóth, S.Z.; Strasser, R.J. Dark Recovery of the Chl a Fluorescence Transient (OJIP) after Light Adaptation: The QT-Component of Non-Photochemical Quenching Is Related to an Activated Photosystem I Acceptor Side. Biochim. Biophys. Acta (BBA)—Bioenerg. 2006, 1757, 787–797. [Google Scholar] [CrossRef] [Green Version]
  84. Allen, J.F.; Gantt, E.; Golbeck, J.H.; Osmond, B.; Schansker, G.; Yuan, Y.; Strasser, R.J. Chl a Fluorescence and 820 Nm Transmission Changes Occurring During a Dark-to-Light Transition in Pine Needles and Pea Leaves: A Comparison. In Photosynthesis. Energy from the Sun; Springer: Dordrecht, The Netherlands, 2008; pp. 945–949. [Google Scholar] [CrossRef]
  85. Wang, J.; Lu, W.; Tong, Y.; Yang, Q. Leaf Morphology, Photosynthetic Performance, Chlorophyll Fluorescence, Stomatal Development of Lettuce (Lactuca sativa L.) Exposed to Different Ratios of Red Light to Blue Light. Front. Plant Sci. 2016, 7, 250. [Google Scholar] [CrossRef] [Green Version]
  86. Rehman, M.; Fahad, S.; Saleem, M.H.; Hafeez, M.; Rahman, M.; Liu, F.; Deng, G. Red Light Optimized Physiological Traits and Enhanced the Growth of Ramie (Boehmeria nivea L.). Photosynthetica 2020, 58, 922–931. [Google Scholar] [CrossRef]
  87. Aliniaeifard, S.; Seif, M.; Arab, M.; Zare Mehrjerdi, M.; Li, T.; Lastochkina, O. Growth and Photosynthetic Performance of Calendula Officinalis under Monochromatic Red Light. Int. J. Hortic. Sci. Technol. 2018, 5, 123–132. [Google Scholar] [CrossRef]
  88. XiaoYing, L.; ShiRong, G.; ZhiGang, X.; XueLei, J.; Tezuka, T. Regulation of Chloroplast Ultrastructure, Cross-Section Anatomy of Leaves, and Morphology of Stomata of Cherry Tomato by Different Light Irradiations of Light-Emitting Diodes. HortScience 2011, 46, 217–221. [Google Scholar] [CrossRef] [Green Version]
  89. Kreslavski, V.D.; Los, D.A.; Schmitt, F.J.; Zharmukhamedov, S.K.; Kuznetsov, V.V.; Allakhverdiev, S.I. The Impact of the Phytochromes on Photosynthetic Processes. Biochim. Biophys. Acta (BBA)—Bioenerg. 2018, 1859, 400–408. [Google Scholar] [CrossRef] [PubMed]
  90. Cao, K.; Yu, J.; Xu, D.; Ai, K.; Bao, E.; Zou, Z. Exposure to Lower Red to Far-Red Light Ratios Improve Tomato Tolerance to Salt Stress. BMC Plant Biol. 2018, 18, 92. [Google Scholar] [CrossRef]
  91. Brazaitytė, A.; Duchovskis, P.; Urbonavičiūtė, A.; Samuolienė, G.; Jankauskienė, J.; Sakalauskaitė, J.; Šabajevienė, G.; Sirtautas, R.; Novičkovas, A. The Effect of Light-Emitting Diodes Lighting on the Growth of Tomato Transplants. Zemdirb.-Agric. 2010, 97, 98. [Google Scholar]
  92. Brazaityte, A.; Duchovskis, P.; Urbonaviciute, A.; Samuoliene, G.; Jankauskiene, J.; Kasiuleviciute-Bonakere, A.; Bliznikas, Z.; Novickovas, A.; Breive, K.; Zukauskas, A. The Effect of Light-Emitting Diodes Lighting on Cucumber Transplants and after-Effect on Yield. Zemdirb.-Agric. 2009, 96, 102–118. [Google Scholar]
  93. Saleem, M.H.; Gohar, F.; Muhammaf, I.F.; Rehman, O.; Naseem, N.; Iqbal, M.; Hassan, A. Effect of Different Colors of Lights on Growth and Antioxidants Capacity in Rapeseed (Brassica napus L.) Seedlings. Ann. Agric. Crop Sci. 2019, 4, 1045. [Google Scholar]
  94. Simlat, M.; Ślęzak, P.; Moś, M.; Warchoł, M.; Skrzypek, E.; Ptak, A. The Effect of Light Quality on Seed Germination, Seedling Growth and Selected Biochemical Properties of Stevia Rebaudiana Bertoni. Sci. Hortic. 2016, 211, 295–304. [Google Scholar] [CrossRef]
  95. Kim, S.J.; Hahn, E.J.; Heo, J.W.; Paek, K.Y. Effects of LEDs on Net Photosynthetic Rate, Growth and Leaf Stomata of Chrysanthemum Plantlets in Vitro. Sci. Hortic. 2004, 101, 143–151. [Google Scholar] [CrossRef]
  96. Carvalho, S.D.; Castillo, J.A. Influence of Light on Plant–Phyllosphere Interaction. Front. Plant Sci. 2018, 9, 1482. [Google Scholar] [CrossRef] [Green Version]
  97. Carvalho, S.; Folta, K. Expanding Genetic Potential with Light Environmentally Modified Organisms. Crit. Rev. Plant Sci. 2015, 2689, 486–508. [Google Scholar] [CrossRef]
  98. Alsanius, B.W.; Karlsson, M.; Rosberg, A.K.; Dorais, M.; Naznin, M.T.; Khalil, S.; Bergstrand, K.J. Light and Microbial Lifestyle: The Impact of Light Quality on Plant–Microbe Interactions in Horticultural Production Systems—A Review. Horticulturae 2019, 5, 41. [Google Scholar] [CrossRef] [Green Version]
  99. Losi, A.; Gärtner, W. A Light Life Together: Photosensing in the Plant Microbiota. Photochem. Photobiol. Sci. 2021, 20, 451–473. [Google Scholar] [CrossRef] [PubMed]
  100. Ruiz-Roldán, M.C.; Garre, V.; Guarro, J.; Mariné, M.; Roncero, M.I.G. Role of the White Collar 1 Photoreceptor in Carotenogenesis, UV Resistance, Hydrophobicity, and Virulence of Fusarium Oxysporum. Eukaryot. Cell 2008, 7, 1227–1230. [Google Scholar] [CrossRef] [Green Version]
  101. Cheng, Y.T.; Zhang, L.; He, S.Y. Plant-Microbe Interactions Facing Environmental Challenge. Cell Host Microbe 2019, 26, 183–192. [Google Scholar] [CrossRef]
  102. Marulanda, A.; Barea, J.M.; Azcón, R. Stimulation of Plant Growth and Drought Tolerance by Native Microorganisms (AM Fungi and Bacteria) from Dry Environments: Mechanisms Related to Bacterial Effectiveness. J. Plant Growth Regul. 2009, 28, 115–124. [Google Scholar] [CrossRef]
  103. Alsanius, B.W.; Bergstrand, K.J.; Hartmann, R.; Gharaie, S.; Wohanka, W.; Dorais, M.; Rosberg, A.K. Ornamental Flowers in New Light: Artificial Lighting Shapes the Microbial Phyllosphere Community Structure of Greenhouse Grown Sunflowers (Helianthus annuus L.). Sci. Hortic. 2017, 216, 234–247. [Google Scholar] [CrossRef]
  104. Canessa, P.; Schumacher, J.; Hevia, M.A.; Tudzynski, P.; Larrondo, L.F. Assessing the Effects of Light on Differentiation and Virulence of the Plant Pathogen Botrytis Cinerea: Characterization of the White Collar Complex. PLoS ONE 2013, 8, e84223. [Google Scholar] [CrossRef] [Green Version]
  105. Rastogi, R.P.; Richa; Kumar, A.; Tyagi, M.B.; Sinha, R.P. Molecular Mechanisms of Ultraviolet Radiation-Induced DNA Damage and Repair. J. Nucleic Acids 2010, 2010, 592980. [Google Scholar] [CrossRef] [Green Version]
  106. Gharaie, S.; Vaas, L.A.I.; Rosberg, A.K.; Windstam, S.T.; Karlsson, M.E.; Bergstrand, K.J.; Khalil, S.; Wohanka, W.; Alsanius, B.W. Light Spectrum Modifies the Utilization Pattern of Energy Sources in Pseudomonas sp. DR 5-09. PLoS ONE 2017, 12, e0189862. [Google Scholar] [CrossRef] [Green Version]
  107. Kim, H.; Ridenour, J.B.; Dunkle, L.D.; Bluhm, B.H. Regulation of Stomatal Tropism and Infection by Light in Cercospora Zeae-Maydis: Evidence for Coordinated Host/Pathogen Responses to Photoperiod? PLoS Pathog. 2011, 7, e1002113. [Google Scholar] [CrossRef]
  108. Ballario, P.; Vittorioso, P.; Magrelli, A.; Talora, C.; Cabibbo, A.; Macino, G.; Sapienza, L.; di Biopatologia Umana, D.; Umberto, P.I.; Regina Margherita, V. White Collar-1, a Central Regulator of Blue Light Responses in Neurospora, Is a Zinc Finger Protein. EMBO J. 1996, 15, 1650–1657. [Google Scholar] [CrossRef]
  109. Choudhury, R.A.; McRoberts, N. Temperature and Light Effects on in Vitro Germination of Peronospora Effusa Sporangia. Trop. Plant Pathol. 2018, 43, 572–576. [Google Scholar] [CrossRef]
  110. Cetz-Chel, J.E.; Balcázar-López, E.; Esquivel-Naranjo, E.U.; Herrera-Estrella, A. The Trichoderma Atroviride Putative Transcription Factor Blu7 Controls Light Responsiveness and Tolerance. BMC Genom. 2016, 17, 327. [Google Scholar] [CrossRef] [Green Version]
  111. Ansari, K.I.; Doyle, S.M.; Kacprzyk, J.; Khan, M.R.; Walter, S.; Brennan, J.M.; Arunachalam, C.S.; McCabe, P.F.; Doohan, F.M. Light Influences How the Fungal Toxin Deoxynivalenol Affects Plant Cell Death and Defense Responses. Toxins 2014, 6, 679–692. [Google Scholar] [CrossRef] [Green Version]
  112. Balint-Kurti, P.; Simmons, S.J.; Blum, J.E.; Ballaré, C.L.; Stapleton, A.E. Maize Leaf Epiphytic Bacteria Diversity Patterns Are Genetically Correlated with Resistance to Fungal Pathogen Infection. Mol. Plant-Microbe Interact. 2010, 23, 473–484. [Google Scholar] [CrossRef] [Green Version]
  113. Ahn, S.Y.; Kim, S.A.; Yun, H.K. Inhibition of Botrytis Cinerea and Accumulation of Stilbene Compounds by Light-Emitting Diodes of Grapevine Leaves and Differential Expression of Defense-Related Genes. Eur. J. Plant Pathol. 2015, 143, 753–765. [Google Scholar] [CrossRef]
  114. Chen, L.J.; Zhao, F.F.; Zhang, M.; Lin, H.H.; Xi, D.H. Effects of Light Quality on the Interaction between Cucumber Mosaic Virus and Nicotiana Tabacum. J. Phytopathol. 2015, 163, 1002–1013. [Google Scholar] [CrossRef]
  115. De Wit, M.; Spoel, S.H.; Sanchez-Perez, G.F.; Gommers, C.M.M.; Pieterse, C.M.J.; Voesenek, L.A.C.J.; Pierik, R. Perception of Low Red: Far-Red Ratio Compromises Both Salicylic Acid- and Jasmonic Acid-Dependent Pathogen Defences in Arabidopsis. Plant J. 2013, 75, 90–103. [Google Scholar] [CrossRef] [PubMed] [Green Version]
  116. Demkura, P.V.; Ballaré, C.L. UVR8 Mediates UV-B-Induced Arabidopsis Defense Responses against Botrytis Cinerea by Controlling Sinapate Accumulation. Mol. Plant 2012, 5, 642–652. [Google Scholar] [CrossRef] [PubMed]
  117. Vandenbussche, F.; Yu, N.; Li, W.; Vanhaelewyn, L.; Hamshou, M.; Van Der Straeten, D.; Smagghe, G. An Ultraviolet B Condition That Affects Growth and Defense in Arabidopsis. Plant Sci. 2018, 268, 54–63. [Google Scholar] [CrossRef]
  118. Mewis, I.; Schreiner, M.; Nguyen, C.N.; Krumbein, A.; Ulrichs, C.; Lohse, M.; Zrenner, R. UV-B Irradiation Changes Specifically the Secondary Metabolite Profile in Broccoli Sprouts: Induced Signaling Overlaps with Defense Response to Biotic Stressors. Plant Cell Physiol. 2012, 53, 1546–1560. [Google Scholar] [CrossRef] [Green Version]
  119. Gouinguené, S.P.; Turlings, T.C.J. The Effects of Abiotic Factors on Induced Volatile Emissions in Corn Plants. Plant Physiol. 2002, 129, 1296–1307. [Google Scholar] [CrossRef] [Green Version]
  120. Kook, H.S.; Park, S.H.; Jang, Y.J.; Lee, G.W.; Kim, J.S.; Kim, H.M.; Oh, B.T.; Chae, J.C.; Lee, K.J.; Moo Kim, H. Blue LED (Light-Emitting Diodes)-Mediated Growth Promotion and Control of Botrytis Disease in Lettuce. Acta Agric. Scand. Sect. B—Soil. Plant Sci. 2013, 63, 271–277. [Google Scholar] [CrossRef]
  121. Young, H.M.; George, S.; Narváez, D.F.; Srivastava, P.; Schuerger, A.C.; Wright, D.L.; Marois, J.J. Effect of Solar Radiation on Severity of Soybean Rust. Phytopathology 2012, 102, 794–803. [Google Scholar] [CrossRef] [Green Version]
  122. Nagendran, R.; Lee, Y.H. Green and Red Light Reduces the Disease Severity by Pseudomonas Cichorii JBC1 in Tomato Plants via Upregulation of Defense-Related Gene Expression. Phytopathology 2015, 105, 412–418. [Google Scholar] [CrossRef]
  123. Khanam, N.N.; Ueno, M.; Kihara, J.; Honda, Y.; Arase, S. Suppression of Red Light-Induced Resistance in Broad Beans to Botrytis Cinerea by Salicylic Acid. Physiol. Mol. Plant Pathol. 2005, 66, 20–29. [Google Scholar] [CrossRef]
  124. Wang, H.; Jiang, Y.P.; Yu, H.J.; Xia, X.J.; Shi, K.; Zhou, Y.H.; Yu, J.Q. Light Quality Affects Incidence of Powdery Mildew, Expression of Defence-Related Genes and Associated Metabolism in Cucumber Plants. Eur. J. Plant Pathol. 2010, 127, 125–135. [Google Scholar] [CrossRef]
  125. Suthaparan, A.; Torre, S.; Stensvand, A.; Herrero, M.L.; Pettersen, R.I.; Gadoury, D.M.; Gislerød, H.R. Specific Light-Emitting Diodes Can Suppress Sporulation of Podosphaera Pannosa on Greenhouse Roses. Plant Dis. 2010, 94, 1105–1110. [Google Scholar] [CrossRef] [PubMed] [Green Version]
  126. Cohen, Y.; Vaknin, M.; Ben-Naim, Y.; Rubin, A.E. Light Suppresses Sporulation and Epidemics of Peronospora Belbahrii. PLoS ONE 2013, 8, e81282. [Google Scholar] [CrossRef] [PubMed]
  127. Zahirul, S.; Islam Slam, I.; Mohammad, M.; Abadoost, B.; Sadia, S.; Bekal Ekal, B.; Kris, K.; Lambert Ambert, L. Red Light-Induced Systemic Disease Resistance against Root-Knot Nematode Meloidogyne javanica and Pseudomonas syringae Pv. Tomato DC 3000. J. Phytopathol. 2008, 156, 708–714. [Google Scholar] [CrossRef]
  128. Xu, H.; Fu, Y.N.; Li, T.L.; Wang, R. Effects of Different LED Light Wavelengths on the Resistance of Tomato against Botrytis Cinerea and the Corresponding Physiological Mechanisms. J. Integr. Agric. 2017, 16, 106–114. [Google Scholar] [CrossRef] [Green Version]
  129. Zahirul Islam, S.; Honda, Y.; Sawa, Y.; Babadoost, M. Characterization of Antifungal Glycoprotein in Red-Light-Irradiated Broadbean Leaflets. Mycoscience 2002, 43, 471–473. [Google Scholar] [CrossRef]
  130. Shirasawa, H.; Ueno, M.; Kihara, J.; Arase, S. Protective Effect of Red Light against Blast Disease Caused by Magnaporthe Oryzae in Rice. Crop Prot. 2012, 39, 41–44. [Google Scholar] [CrossRef]
  131. Islam, S.Z.; Honda, Y.; Sonhaji, M. Phototropism of Conidial Germ Tubes of Botrytis Cinerea and Its Implication in Plant Infection Processes. Plant Dis. 2007, 82, 850–856. [Google Scholar] [CrossRef] [Green Version]
  132. Shibuya, T.; Itagaki, K.; Tojo, M.; Endo, R.; Kitaya, Y. Fluorescent Illumination with High Red-to-Far-Red Ratio Improves Resistance of Cucumber Seedlings to Powdery Mildew. HortScience 2011, 46, 429–431. [Google Scholar] [CrossRef] [Green Version]
  133. Cerrudo, I.; Keller, M.M.; Cargnel, M.D.; Demkura, P.V.; de Wit, M.; Patitucci, M.S.; Pierik, R.; Pieterse, C.M.J.; Ballaré, C.L. Low Red/Far-Red Ratios Reduce Arabidopsis Resistance to Botrytis Cinerea and Jasmonate Responses via a COI1-JAZ10-Dependent, Salicylic Acid-Independent Mechanism. Plant Physiol. 2012, 158, 2042–2052. [Google Scholar] [CrossRef] [Green Version]
  134. Legard, D.E.; Xiao, C.L.; Mertely, J.C.; Chandler, C.K. Effects of Plant Spacing and Cultivar on Incidence of Botrytis Fruit Rot in Annual Strawberry. Plant Dis. 2007, 84, 531–538. [Google Scholar] [CrossRef] [Green Version]
  135. Elad, Y.; Israeli, L.; Fogel, M.; Rav David, D.; Kenigsbuch, D.; Chalupowicz, D.; Maurer, D.; Lichter, A.; Silverman, D.; Biton, S.; et al. Conditions Influencing the Development of Sweet Basil Grey Mould and Cultural Measures for Disease Management. Crop Prot. 2014, 64, 67–77. [Google Scholar] [CrossRef]
  136. Huang, Z.; Zhou, L.; Chi, Y. Spring phenology rather than climate dominates the trends in peak of growing season in the Northern Hemisphere. Glob. Chang. Biol. 2023, 29, 4543–4555. [Google Scholar] [CrossRef]
Figure 1. (A) Kinetic curves of luminescence decay of Eu3+:LaF3 nanoparticles with different contents of Eu3+: 0.1 at.% (1), 10 at.% (2), 30 at.% (3), 50 at.% (4), and Eu2O3 (5). The numbers above curve 1 indicate the radiative lifetime (τrad) of the 5D0 level of Eu3+ ions (for more details, see the Section 2). (B) Dependence of relative luminescence quantum yield (φ) on Eu3+ content in nanoparticles. (C) Dependence of luminescence brightness (ν) on Eu3+ content in nanoparticles. Measurements were performed in aqueous colloidal solutions of nanoparticles (107 ppm) at room temperature. Luminescence was excited at wavelength of 395 nm and detected at the 5D07F1 transition at wavelength of 591 nm.
Horticulturae 09 00846 g001
Figure 2. Micrographs of Eu3+:LaF3 (A) and Eu2O3 (B) nanoparticles.
Horticulturae 09 00846 g002
Figure 3. Distribution of (1) Eu3+:LaF3 and (2) Eu2O3 nanoparticles over the hydrodynamic radius. The measurements were performed in aqueous colloidal solutions of nanoparticles (107 ppm) at room temperature.
Horticulturae 09 00846 g003
Figure 4. Differential spectra (“spectrum of photoconversion film” minus “spectrum of common film”) excitation (A,B) and luminescence (C,D) spectra of PCC-Eu3+:LaF3 (A,C) and PCC-Eu2O3 (B,D). Luminescence excitation spectra were detected at wavelengths of 591 nm (A) and 612 nm (B). Luminescence spectra were obtained upon excitation at wavelength of 395 nm (C,D).
Horticulturae 09 00846 g004
Figure 5. Yield of S. lycopersicum grown in greenhouses under natural light. (A) Average fruit weight and (B) number of fruits per plant. The letters a, b above the columns indicate the presence of statistically significant differences between the groups at p ≤ 0.05.
Horticulturae 09 00846 g005
Figure 6. Kinetic curves of light-induced changes in the intensity of transpiration and intensity of CO2 assimilation in the leaves of C. sativus (A,B) and S. lycopersicum (CH), before (AD) and after cold (E,F) and heat (G,H) treatments. Measurements were performed using control plants (1), PCC-Eu3+:LaF3 plants (2), PCC-Eu2O3 plants (3). Temperature, relative air humidity, and CO2 content in the measuring cell were set to 25 °C, 65%, and 200 ppm, respectively. ↑—the moment of turning on the acting light (λ = 625 nm, 200 µmol photons m2 s1).
Horticulturae 09 00846 g006
Figure 7. Light-induced changes in parameters of effective quantum yield of PSII (A,B), the rate of linear electron transport per PSII reaction center (C,D), the rate of linear electron transport per PSI reaction center (E,F), quantum yield of light-induced non-photochemical quenching of FChl (G,H) in leaves of C. sativus (A,C,E,G) and S. lycopersicum (B,D,F,H). Measurements were performed using control plants (1), PCC-Eu3+:LaF3 plants (2), and PCC-Eu2O3 plants (3). Before measurements, the plants were adapted in the dark for 1 h at 25 °C. The intensity of 300 ms saturating light flashes was 12,000 µmol photons m2 s1. *—the boundaries, in which there were statistically significant differences between the experimental (2 or 3) and control groups (1) plants at p ≤ 0.05. ↑—the moment of turning on the acting light (λ = 625 nm, 200 µmol photons m2 s1).
Horticulturae 09 00846 g007
Figure 8. Light-induced changes in parameters of effective quantum yield of PSII (AC), the rate of linear electron transport per PSII reaction center (DF), the rate of linear electron transport per PSI reaction center (GI), quantum yield of light-induced non-photochemical quenching of ChlF (JL) in leaves of S. lycopersicum before (A,D,G,J) and after cold (B,E,H,K) and heat (C,F,I,L) treatment. Measurements were performed using control plants (1), PCC-Eu3+:LaF3 plants (2), and PCC-Eu2O3 plants (3). Before measurements, the plants were adapted in the dark for 1 h at 25 °C. The intensity of 300 ms saturating light flashes was 12,000 µmol photons m2 s1. *—the boundaries, in which there are statistically significant differences between the experimental (2 or 3) and control group (1) plants at p ≤ 0.05. ↑—the moment of turning on the acting light (λ = 625 nm, 200 µmol photons m2 s1).
Horticulturae 09 00846 g008
Figure 9. Effect of photoconversion covers on the phytopathogen P. infestans development during spontaneous (A) and artificial (B,C) infection. The letters a, b indicate the presence of statistically significant differences between groups at p ≤ 0.05.
Horticulturae 09 00846 g009
Table 1. The effect of PCC on the growth of S. lycopersicum and C. sativus, measured on the seventeenth and forty-third days of the experiment, respectively.
C. sativusS. lycopersicum
ControlEu3+:LaF3Eu2O3ControlEu3+:LaF3Eu2O3
Stem lenght, cm---165 ± 12 a’159 ± 8 a’205 ± 8 b’
Leaves area, cm2245 ± 23 a175 ± 16 b263 ± 29 a383 ± 26 a’362 ± 24 a’528 ± 40 b’
Leaves number---16.0 ± 0.7 a’15.3 ± 0.5 a’17.4 ± 1.6 a’
Internodes length, cm---7.7 ± 0.3 a’8.0 ± 0.3 a’7.8 ± 0.2 a’
Dry weight/Fresh weight0.13 ± 0.01 a0.12 ± 0.01 a0.12 ± 0.01 a0.12 ± 0.02 a’0.12 ± 0.01 a’0.11 ± 0.01 a’
Chlorophyll content, a.u.10.5 ± 0.3 a8.1 ± 0.5 a10.0 ± 0.2 a20.8 ± 1.5 a’17.1 ± 1.3 ab’15.3 ± 0.5 b’
Chlorophyll determination formulay = 0.636 + 0.036xy = 0.63 + 0.0535x
Chlorophyll content, mg Chl g−1 of fresh weight 1.01 ± 0.03 a0.93 ± 0.06 a1.00 ± 0.02 a1.74 ± 0.13 a’1.54 ± 0.12 ab’1.44 ± 0.05 b
Data are the result of averaging from eight (leaves area, number, stem, and internode length) to twenty (all other parameters) measurement. The letters a, b indicate statistically significant differences between the parameters between cucumber groups at p ≤ 0.05; a’, b’ indicate statistically significant differences between the parameters between tomato groups at p ≤ 0.05.
Table 2. Effect of PCC on gas exchange parameters in the leaves of C. sativus and S. lycopersicum.
C. sativusS. lycopersicum
ControlEu3+:LaF3Eu2O3ControlEu3+:LaF3Eu2O3
A, µmol CO2 m−2 s−1Dark−0.5 ± 0.01 a−0.54 ± 0.03 a−0.7 ± 0.1 a−0.19 ± 0.01 a’−0.20 ± 0.06 a’−0.19 ± 0.03 a’
Light2.6 ± 0.2 a2.5 ± 0.1 a2.9 ± 0.1 a3.1 ± 0.3 a’2.3 ± 0.4 b’3.3 ± 0.1 a’
E, mol H2O m−2 s−1Dark1.6 ± 0.2 a1.6 ± 0.2 a1.6 ± 0.1 a0.12 ± 0.01 a’0.11 ± 0.01 a’0.12 ± 0.03 a’
Light2.3 ± 0.1 a2 ± 0.3 a2.4 ± 0.1 a0.55 ± 0.1 a’0.5 ± 0.1 a’0.57 ± 0.05 a’
GCO2, mmol m−2 s−1Dark72 ± 16 a103 ± 20 ab112 ± 8 b12 ± 0.1 a’10 ± 0.3 a’37 ± 4 b’
Light135 ± 33 a160 ± 53 a173 ± 12 a56 ± 2 a’37 ± 13 a’90 ± 9 b’
GH2O, mmol m−2 s−1Dark112 ± 25 a162 ± 31 ab175 ± 13 b19 ± 0.2 a’16 ± 0.5 a’57 ± 6 b’
Light211 ± 51 a249 ± 83 a270 ± 18 a87 ± 3 a’57 ± 21 a’140 ± 14 b’
Ci, ppmDark400 ± 1 a399 ± 1 a400 ± 1 a414 ± 1 a’416 ± 5 a’403 ± 1 b’
Light353 ± 1 a358 ± 11 a353 ± 3 a334 ± 2 a’311 ± 11 a’347 ± 5 b’
The measurements were performed on plants adapted in the dark for one hour and in light (λ = 625 nm, 200 µmol photons m−2 s−1) for twenty minutes. A, CO2 assimilation rate; E, H2O transpiration rate; GCO2, total CO2 conductivity; GH2O, total H2O conductivity; Ci, intercellular CO2 concentration. The letters a, b indicate statistically significant differences between the parameters between cucumber groups at p ≤ 0.05; a’, b’ indicate statistically significant differences between the parameters between tomato groups at p ≤ 0.05.
Table 3. Effect of PCC on the photochemical parameters.
C. sativusS. lycopersicum
ControlEu3+:LaF3Eu2O3ControlEu3+:LaF3Eu2O3
Fv/Fm0.8 ± 0.01 a0.8 ± 0.01 a0.8 ± 0.01 a0.81 ± 0.01 a’0.81 ± 0.01 a’0.81 ± 0.01 a’
Y(II) 0.58 ± 0.02 a0.5 ± 0.01 b0.58 ± 0.02 a0.58 ± 0.02 a’0.57 ± 0.05 a’0.6 ± 0.01 a’
ETR(II), µmol electrons (PII s)−150.2 ± 1.4 a44.2 ± 0.6 b50.8 ± 1.3 a50.8 ± 1.4 a’49.8 ± 4.3 a’52.6 ± 0.2 a’
Y(NPQ) 0.10 ± 0.01 a0.16 ± 0.02 b0.12 ± 0.01 a0.08 ± 0.02 a’0.09 ± 0.03 a’0.06 ± 0.01 b’
ETR(I), µmol electrons (PI s)−167.8 ± 1.4 a63.4 ± 2 b69.2 ± 0.4 a80.3 ± 0.6 a’81.5 ± 1.7 a’77.7 ± 1.5 a’
Y(I)0.92 ± 0.01 a0.93 ± 0.02 a0.89 ± 0.02 a0.78 ± 0.02 a’0.73 ± 0.02 b’0.8 ± 0.01 a’
Fv/Fm, the maximum quantum yield of photosystem II; Y(II), the effective quantum yield of photochemistry of photosystem II; ETR(II), the rate of linear electron transfer in photosystem II; Y(NPQ), the quantum yield of light-induced non-photochemical fluorescence quenching; ETR (I), the rate of linear electron transfer in photosystem I; Y(I), the effective quantum yield of photochemistry of photosystem I of C. sativus and S. lycopersicum on 20 min of lighting. The letters a, b, indicate statistically significant differences between the parameters between cucumber groups at p ≤ 0.05; a’, b’, indicate statistically significant differences between the parameters between tomato groups at p ≤ 0.05.
Table 4. Effect of abiotic stress conditions (+4 °C, +40 °C) on the parameters of gas exchange in leaves S. lycopersicum, growing under PCC.
+4 °C+40 °C
ControlEu3+:LaF3Eu2O3ControlEu3+:LaF3Eu2O3
A, umol CO2 m−2 s−1Dark−0.26 ± 0.01 a−0.25 ± 0.03 a−0.16 ± 0.01 a−0.28 ± 0.01 a’−0.41 ± 0.05 b’−0.16 ± 0.04 c’
Light0.28 ± 0.01 a1.00 ± 0.2 b0.55 ± 0.02 a2.60 ± 0.2 a’2.90 ± 0.1 a’1.00 ± 0.3 b’
E, mol CO2 m−2 s−1Dark0.14 ± 0.01 a0.14 ± 0.02 a0.14 ± 0.01 a0.17 ± 0.02 a’0.17 ± 0.01 a’0.18 ± 0.01 a’
Light0.29 ± 0.01 a0.36 ± 0.05 a0.21 ± 0.01 b0.61 ± 0.03 a’0.66 ± 0.03 a’0.30 ± 0.04 b’
GCO2, mmol m−2 s−1Dark8.0 ± 0.8 a10.0 ± 1 a3.9 ± 0.6 b11.6 ± 1.5 a’9.3 ± 0.1 a’4.7 ± 0.1 b’
Light6.8 ± 0.2 a11.7 ± 3.8 a3.6 ± 0.9 b32.2 ± 0.2 a’28.7 ± 2 a’7.3 ± 2.1 b’
GH2O, mmol m−2 s−1Dark12.6 ± 1 a15.7 ± 1.7 a6.1 ± 1 b18.1 ± 1.8 a’14.5 ± 0.2 a’7.4 ± 0.1 b’
Light11.0 ± 0.3 a18.2 ± 6 a5.6 ± 1.4 b50.2 ± 2.4 a’44.7 ± 3.1 a’11.4 ± 3.3 b’
Ci, ppmDark425 ± 2 a420 ± 6 a441 ± 11 a416 ± 3 a’431 ± 5 b’432 ± 7 b’
Light353 ± 1 a305 ± 9 b291 ± 22 b313 ± 2 a’301 ± 5 b’246 ± 1 c’
The measurements were performed on plants adapted in the dark for one hour and in light (λ = 625 nm, 200 µmol photons m−2 s−1) for twenty minutes. A, CO2 assimilation rate; E, H2O transpiration rate; GCO2, total CO2 conductivity; GH2O, total H2O conductivity; Ci, intercellular CO2 concentration. The letters a, b indicate statistically significant differences between the parameters between cucumber groups at p ≤ 0.05; a’, b’, c’ indicate statistically significant differences between the parameters between tomato groups at p ≤ 0.05.
Table 5. Effect of PCC on photochemical parameters under stress condition.
+4 °C+40 °C
ControlEu3+:LaF3Eu2O3ControlEu3+:LaF3Eu2O3
Fv/Fm0.76 ± 0.01 a0.72 ± 0.01 b0.73 ± 0.02 c0.76 ± 0.01 a’0.75 ± 0.01 a’0.73 ± 0.01 a’
Y(II) 0.2 ± 0.03 a0.37 ± 0.04 b0.25 ± 0.06 a0.59 ± 0.01 a’0.62 ± 0.01 a’0.44 ± 0.02 b’
ETR(II), µmol electrons (PSII s)−117 ± 3 a32 ± 3 b22 ± 5 a51 ± 1 a’54 ± 1 a’38 ± 2 b’
Y(NPQ) 0.42 ± 0.03 a0.26 ± 0.03 b0.37 ± 0.05 a0.04 ± 0.01 a’0.01 ± 0.01 b’0.19 ± 0.02 c’
ETR(I), µmol electrons (PSI s)−142 ± 7 a60 ± 0.1 b46 ± 5 a70 ± 3 a’69 ± 3 a’57 ± 4 b’
Y(I) 0.48 ± 0.06 a0.69 ± 0.01 b0.53 ± 0.06 a0.8 ± 0.03 a’0.8 ± 0.03 a’0.66 ± 0.05 b’
Fv/Fm, maximum quantum yield of photosystem II; Y(II), effective quantum yield of photochemistry of photosystem II; ETR(II), linear electron transfer rate in photosystem II; Y(NPQ), quantum yield of light-induced non-photochemical fluorescence quenching; ETR(I), the rate of linear electron transfer in photosystem I; Y(I), the effective quantum yield of photochemistry of photosystem I of S. lycopersicum plants on 20 min of lightning under stress conditions (+4 °C, +40 °C). The letters a, b, c indicate statistically significant differences between the parameters between cucumber groups at p ≤ 0.05; a’, b’, c’ indicate statistically significant differences between the parameters between tomato groups at p ≤ 0.05.
Table 6. Ratio of spectral ranges under covers.
ControlEu3+:LaF3Eu2O3
B:G 0.70 a0.66 b0.68 ab
R:B 1.30 a1.40 b1.40 b
R:FR 2.80 a2.82 a2.64 a
R:PPFD 0.35 a0.36 b0.36 b
O:PPFD 0.135 a0.138 b0.136 a
O:R 0.380 a0.385 a0.370 b
B, blue light; G, green light; R, red light; FR, far red light; PPFD, photosynthetic photon flux density; O, orange light. Letters a, b indicate statistically significant differences between groups at p ≤ 0.05.
Disclaimer/Publisher’s Note: The statements, opinions and data contained in all publications are solely those of the individual author(s) and contributor(s) and not of MDPI and/or the editor(s). MDPI and/or the editor(s) disclaim responsibility for any injury to people or property resulting from any ideas, methods, instructions or products referred to in the content.

