1. Introduction
Food demand is forecasted to increase by 60–110% to feed the rising human population in 2050 [
1]. Traditional farming methods cannot meet such needs; and moreover, they face challenges due to climate change [
2] and arable land destruction [
3]. Vertical farming is a promising solution for alternative and supplementary food production [
4]. Although environmental factors are controlled, and thus cultivation outcomes and plant performance are predictable, additional focus on precision management is needed to further optimize crop production in a controlled environment agriculture [
5,
6,
7]. Precision management in agriculture relies on various sensors to gather data on crop performance and environmental conditions [
8], which is then analyzed using sophisticated algorithms and machine learning to identify patterns and make calculated decisions [
9]. Although data-driven decisions will unlock new crop performance optimization possibilities, those decisions need to rely on plant physiological requirements and behavior in a specific environment. Vertical farming will be competitive in the global food production system if a high degree of automation and precision management is achieved [
10,
11]. Historically, research has focused on artificial lighting and environmental factors’ impacts on plant performance in controlled environment conditions [
12,
13], thus leaving the importance of nutrient solution in hydroponics behind.
Hydroponics is the most frequently used cultivation method in a controlled environment agriculture, which uses nutrient solution instead of soil [
14], and its popularity has steadily risen through the years [
15]. The nutrient solution is a multivalent salt mixture created in the twentieth century by Hoagland and Arnon. It is used up to this day with minor crop/grower-specific modifications [
16,
17]. Usually, plants are cultivated in a slightly acidic nutrient solution, and the most used pH interval for leafy greens cultivation is 5.5–6.5 [
18,
19,
20]; however, different pH intervals may be used for specific reasoning, e.g., nutrient solution pH reduction to 4.0 suppressed the severity of root rot caused by
Pythium aphanidermatum without influencing basil growth [
18]. On the contrary, spinach fresh shoot weight was suppressed by 62% at a low 4.5 pH treatment [
19]. Interestingly, a pH as low as 4 increased the nutritional and dietary value of
Taraxacum officinale (L.) and
Reichardia picroides (L.) Roth in the floating hydroponic system [
20].
Plant mineral nutrition is an active process [
21], and absorbed ions are involved in multiple processes in plant cells, such as potassium for homeostasis [
22] and iron as a cofactor for enzymes that are involved in electron/oxygen transfer [
23]. Ions from the root environment are absorbed unequally during plant growth; charge equilibrium is disrupted between the inner root membrane and nutrient solution—as cations are absorbed, H
+ ions are released into a nutrient solution to compensate for the charge difference; and the opposite reaction occurs as anions are absorbed, where OH
− ions are released to compensate for the charge difference [
24]. Various equilibrium-based processes may restrict nutrient availability in hydroponic solutions, such as precipitation, co-precipitation, and complexation [
25]. The increased alkalinity of the nutrient solution may cause the precipitation of cations, such as copper, iron, and zinc, into insoluble compounds [
26].
Active pH management is needed to ensure optimal growing conditions in hydroponics, and acid/base titration is a common choice for hydrogen ion (H
+) concentration management in nutrient solutions. It is known that for pH regulation, it is better to use a mixture of strong acids instead of one [
27]. Traditionally, nutrient solution pH is readjusted after it deviates from the preferred range [
28]; contrariwise, optimal pH levels can be maintained passively during plant growth [
29]. While the passive pH management of a nutrient solution is not yet commonly used in practice, some studies have investigated this approach, suggesting that it is a potentially viable option worth considering [
30,
31]. Precision management aims to achieve optimal conditions in every cultivation aspect [
6]; thus, passive pH management would accomplish an efficient nutrient solution pH and mineral nutrition control without external interference. However, a deeper understanding of plant response toward stable pH and behavior to increased buffer capacity of a nutrient solution is needed to employ passive pH control in hydroponics [
32]. A passive pH management in hydroponics can be performed in two ways. Ion-exchange resins control the pH due to an ion interchange between a solid surface and a nutrient solution [
30]. Nevertheless, the main disadvantage is the removal of cations, such as magnesium or manganese [
30]. Supplementary buffering agents can increase the initial nutrient solution buffer capacity, and most comprise the following characteristics: buffering region at the desired range; not toxic for plant growth; and inert in nutrient solution [
28]. Due to the favorable dissociation constant value, 2-(N-morpholino) ethanesulfonic acid (MES) could be the eligible choice for passive nutrient solution pH control [
33], although its molarity and increased nutrient solution salinity due to supplementary buffering addition need to be addressed. Buffering agent molarity directly determines buffers’ ability to mitigate pH fluctuations, and hydrogen ion concentration detriments plant behavior and the effectiveness of mineral nutrition. Notwithstanding, it is known that high salinity levels reduce yield and cause stress for the plant [
34]. Therefore, the development of precise management principles, nutrient solution pH, and buffer characteristics, such as molarity, need to be addressed simultaneously. By incorporating this, our objective was to evaluate the physiological response of hydroponically cultivated lettuces to minor differences in nutrient solution pH, as well as the impact of a supplementary MES buffering agent’s molarity on their growth, antioxidant activity, and nutrient uptake.
2. Materials and Methods
Plant material and cultivation. A two-step complementary experiment was performed in a walk-in controlled environment chamber, replicating common vertical farming conditions. Day/night temperatures of 21/17 ± 2 °C were established within a 16 h photoperiod, a relative humidity of 50–60%, and a CO2 concentration of 1000 ppm. Artificial lighting was provided by 4-channel controllable light-emitting diode (LED) lighting units (TUAS GTR 2V 0021096109 C1 DL ST, Tungsram, Budapest, Hungary). The photosynthetic photon flux density (PPFD) was maintained at 250 ± 10 µmol m−2s−1, representing a daylight integral of 14.4 mol m−2d−1 throughout the 16 h photoperiod, with preselected spectral composition (deep red 61%, blue 20%, white 15%, far red 4%). PPFD was measured and regulated at the plant level using a photometer–radiometer (RF-100, Sonopan, Bialystok, Poland).
During the first experiment, lettuce’s physiological response to the minor pH differences in the theoretically optimal pH range was investigated. Nutrient solution pH intervals of pH 5.0–5.5, pH 5.5–6.0, and pH 6.0–6.5 were established daily using acid/base (H2SO4/KOH) titration through lettuce vegetation. The target pH value refers to the lowest pH value within a given interval. Throughout the intervals, the pH levels consistently shift toward the alkaline side on a daily basis, but never surpass the upper limit of the pH interval range.
During the second experiment, a pH interval of pH 6.0–6.5 was selected, and the pH fluctuations were passively mitigated using an additional supplementary agent 2-(N-morpholino) ethanesulfonic acid (MES), and the impact of its 0/1/3/5 mM molarity on lettuce physiological response was investigated.
In both experiments, the seeds of green lettuce (Lactuca sativa (L.)) ‘Hugin’ (Seminis, Bayer, Germany) were germinated in rockwool cubes (20 mm × 20 mm, Grodan, Roermond, The Netherlands) under 250 ± 10 µmol m−2s−1 PPFD. On the seventh day after germination, seedlings were transferred into deep water culture (DWC) hydroponics systems. Each experimental treatment consisted of 3 (each tank represents experimental replication) DWC tanks of 40 L volume. Each DWC tank contained 12 pots, one plant in each. A nutrient solution concentrate was provided by Plagron (Ospel, The Netherlands): Hydro a (NPK (3-0-1), Ca 4.2%, MgO 0.4%) and Hydro b (NPK (1-3-6), MgO 1.4%), 1:1 diluted with deionized water 1:400. Nutrient solution electrical conductivity range (EC) was from 1300 ± 66 µS/cm to 1620 ± 26 µS/cm.
Biometric measurements and biochemical analyses were performed 35 days after germination. All measurements in each experimental replication were performed in 3 analytical replications (9 measurements in total). Plant material was dried at 70 °C for 48 h (Venticell-BMT, Brno-střed, Czech Republic) or flash-frozen in liquid nitrogen until analysis.
Biometric measurements. The plant leaf area was determined using a benchtop leaf area meter (AT Delta–T Devices, Burwell, UK). After tissue dehydration at 70 °C for 48 h (Venticell-BMT, Brno-střed, Czech Republic), dry leaf and root mass were determined.
Chlorophyll and polyphenols determination. Chlorophyll (Chl), flavonol (Flav), and nitrogen balance indices were determined using a portable Dualex meter (Force-A, Orsay, France) on the third fully developed leaf.
Leaf gas exchange indices. Photosynthesis parameters were measured from 9 to 12 am. The photosynthetic rate (Pr, µmol CO2 m−2 s−1), transpiration rate (Tr, mmol H2O m−2 s−1), stomatal conductance (gs, mol H2O m−2 s−1), and the ratio of intercellular to ambient CO2 concentration (Ci/Ca) were measured on the third fully developed leaf, using a portable photosynthesis system (LI-COR 6400XT, Lincoln, NE, USA). Measurements were performed at the following leaf chamber conditions: temperature 21 °C, the CO2 concentration of 400 µmol mol−1, a relative humidity of 60%, and an artificial irradiation of ~1000 µmol m−2 s−1 were provided by 470 and 665 nm LED sources. Derivative parameters such as water usage efficiency (WUE, µmol CO2 mmol−1 H2O) and light use efficiency (LUE, mol CO2 mol−1 photons) were calculated using MS Excel.
Antioxidant activity determination. Antioxidant activity expressed as DPPH (2-diphenyl-1-picrylhydrazyl) and ABTS (2,2-azino-bis(3-ethylbenzothiazoline-6-sulphonic acid) free radical scavenging activity. Plant extracts were prepared by grinding 0.5 g fresh plant material with liquid nitrogen, diluted with 80% methanol 1:10 (w/v), and incubated for 24 h, and then centrifuged (4500 rpm; Z366, Hermle, Gosheim, Germany), and the supernatant was used for analysis.
STable 126.8 µM DPPH (100% purity; Sigma-Aldrich, Burlington, MA, USA) solution was prepared in methanol. Analysis was performed in 96-well plates by mixing 280 µL DPPH solution with 20 µL of plant extract in each well; absorbance was read 515 nm (Spectro-star Nano, BMG Labtech microplate reader, Ortenberg, Germany) at the sixteenth minute [
35]. Results were expressed as µmol of DPPH scavenged per 1 g of fresh plant weight (mmol g
–1 FW).
The ABTS radical solution was prepared by mixing 50 mL of 2 mM ABTS with 200 µL 70 mM potassium persulfate K
2S
2O
8, allowing the mixture to stand in the dark for 16 h before use [
36]. Analysis was performed in 96-well plates by mixing 280 µL ABTS radical solution with 20 µL of plant extract in each well; absorbance was read 734 nm (Spectro-star Nano, BMG Labtech microplate reader, Gosheim, Germany) after 10 min. Results were expressed as µmol ABTS scavenged by 1 g of fresh plant weight.
Determination of mineral nutrients. A modified microwave-assisted digestion technique was combined with ICP-OES methods to determine macronutrients (K, Ca, Mg, S, and P) and micronutrients (B, Cu, Fe, Mn, Na, Zn, Se, and Mo) in lettuce leaves and roots [
37,
38]. The complete digestion of 0.3 g of the powdered shoot and 0.2 g of root material was achieved with 8 mL of 65% HNO
3 using a microwave-assisted digestion system (Multiwave GO; Anton Paar GmbH, Graz, Austria). Digestion was completed in 2 steps: (1) heating to 150 °C in 3 min and holding for 10 min, and (2) heating to 180 °C in 10 min and holding for 10 min, followed by cooling. The mineralized samples were diluted to 50 mL with ultrapure deionized water, filtered with Whatman Grade 1 qualitative filter paper, and stored at 4 °C until analysis. The nutrient concentration was analyzed using ICP–OES (SPECTRO Genesis spectrometer, Analytical Instruments GmbH, Kleve, Germany). Mineral content was evaluated (mg L
−1) according to the respective analytical wavebands for each element. The content of each element concentration was recounted and expressed as mg g
−1 dry weight.
Statistical analysis. The results are presented as the average ± standard deviation of 3 experimental and 3 analytical replications, n = 9. One-way ANOVA, using Tukey’s HSD test, was employed to determine differences between applied pH intervals and MES molarity treatments at the confidence level of p ≤ 0.05. For result modeling, multivariate principal component analysis (PCA) was performed. Data were evaluated using MS Excel and compatible XLStat 2022.3.1 (Addinsoft, France) software packages.
3. Results
Nutrient solution pH influenced the growth parameters and leaf optical indices of hydroponically cultivated lettuce (
Table 1). pH treatment did not significantly affect leaf and root dry weight accumulation. Lettuce grown in the pH of 5.0–5.5, distinguished by 36% and 30% smaller leaf areas, compared to those cultivated in pH 5.5–6.0 and 6.0–6.5, which did not differ statistically significantly in-between. The more alkaline pH of 6.0–6.5 resulted in the lowest flavonoid and the highest NBI index value of lettuce leaves; however, according to one-way ANOVA analysis, nutrient solution pH had no significant impact on the chlorophyll index.
Different pH treatments had a light response of the antioxidant system and a more pronounced photosynthetic response (
Table 2). The transpiration rate (Tr) was statistically undistinguished between all pH treatment groups. Photosynthetic rate (Pr) and light use efficiency (LUE) were 20% higher in the pH 5.5–6.0-treated lettuces than in the lowest pH-treated lettuce. There was no significant difference in intercellular-to-ambient CO
2 ratio (C
i/C
a) between the highest pH interval and the pH 5.5–6.0-treated lettuce, although pH 6.0–6.5 resulted in the lowest C
i/C
a compared to the other two pH groups. Interestingly, the pH 5.5–6.0 treatment group resulted in a 56% greater lettuce stomatal conductance activity (gs) than the highest pH treatment. The lettuce, cultivated in a pH interval of 6.0–6.5 had a 44% higher water usage efficiency (WUE) compared to the lowest pH interval.
The antioxidant activity of lettuce leaves was not caused by the pH of the nutrient solution (
Table 2) according to DDPH and ABTS free radical scavenging activity methods. However, the more acidic pH treatment of 5.0–5.5 resulted in an 85% higher ABTS free radical scavenging activity in roots compared to the 6.0–6.5 pH treatment.
The differences in mineral accumulation in lettuce tissues due to the nutrient solution pH are presented in
Table 3. There was no significant difference in the B, K, and Se accumulation between different pH treatment groups and lettuce organs. Lettuce, cultivated in pH 5.0–5.5, contained the highest S concentration, and the leaves accumulated 3 times more of S (sulfur) than the roots. Roots accumulated 42% higher Cu (copper) contents in the pH 5.5–6.0 treatment group compared with the lowest pH of 5.0–5.5. Cu accumulation in lettuce leaves was not affected significantly by nutrient solution pH, although leaves accumulated 7.6 times less Cu in the pH 5.5–6.0 treatment compared with Cu contents in roots. Roots accumulated higher concentrations of P (phosphorus), Fe (iron), and Mo (molybdenum) in the corresponding pH treatment compared with leaves; a lower pH interval of 5.0–5.5 resulted in a mineral content reduction in lettuce leaves; and roots accumulated 2.1 times more of P and 5.0 times Fe compared with its contents in leaves. Mg (magnesium), Na (sodium), and Zn (zinc) accumulation in leaves were not affected by nutrient solution pH; however, there were differences in mineral accumulation in roots due to different nutrient solution pH. Specifically, lettuce cultivated in a lower pH range of 5.0–5.5 had a 27.3% and 41.4% reduction in Na and Zn accumulation in their roots, respectively, compared to lettuce cultivated in the pH range of 5.5–6.0. Conversely, cultivation in the lowest pH treatment resulted in a 44.7% accumulation of Mg in their roots compared to lettuce cultivated in the pH 5.5–6.0 treatment.
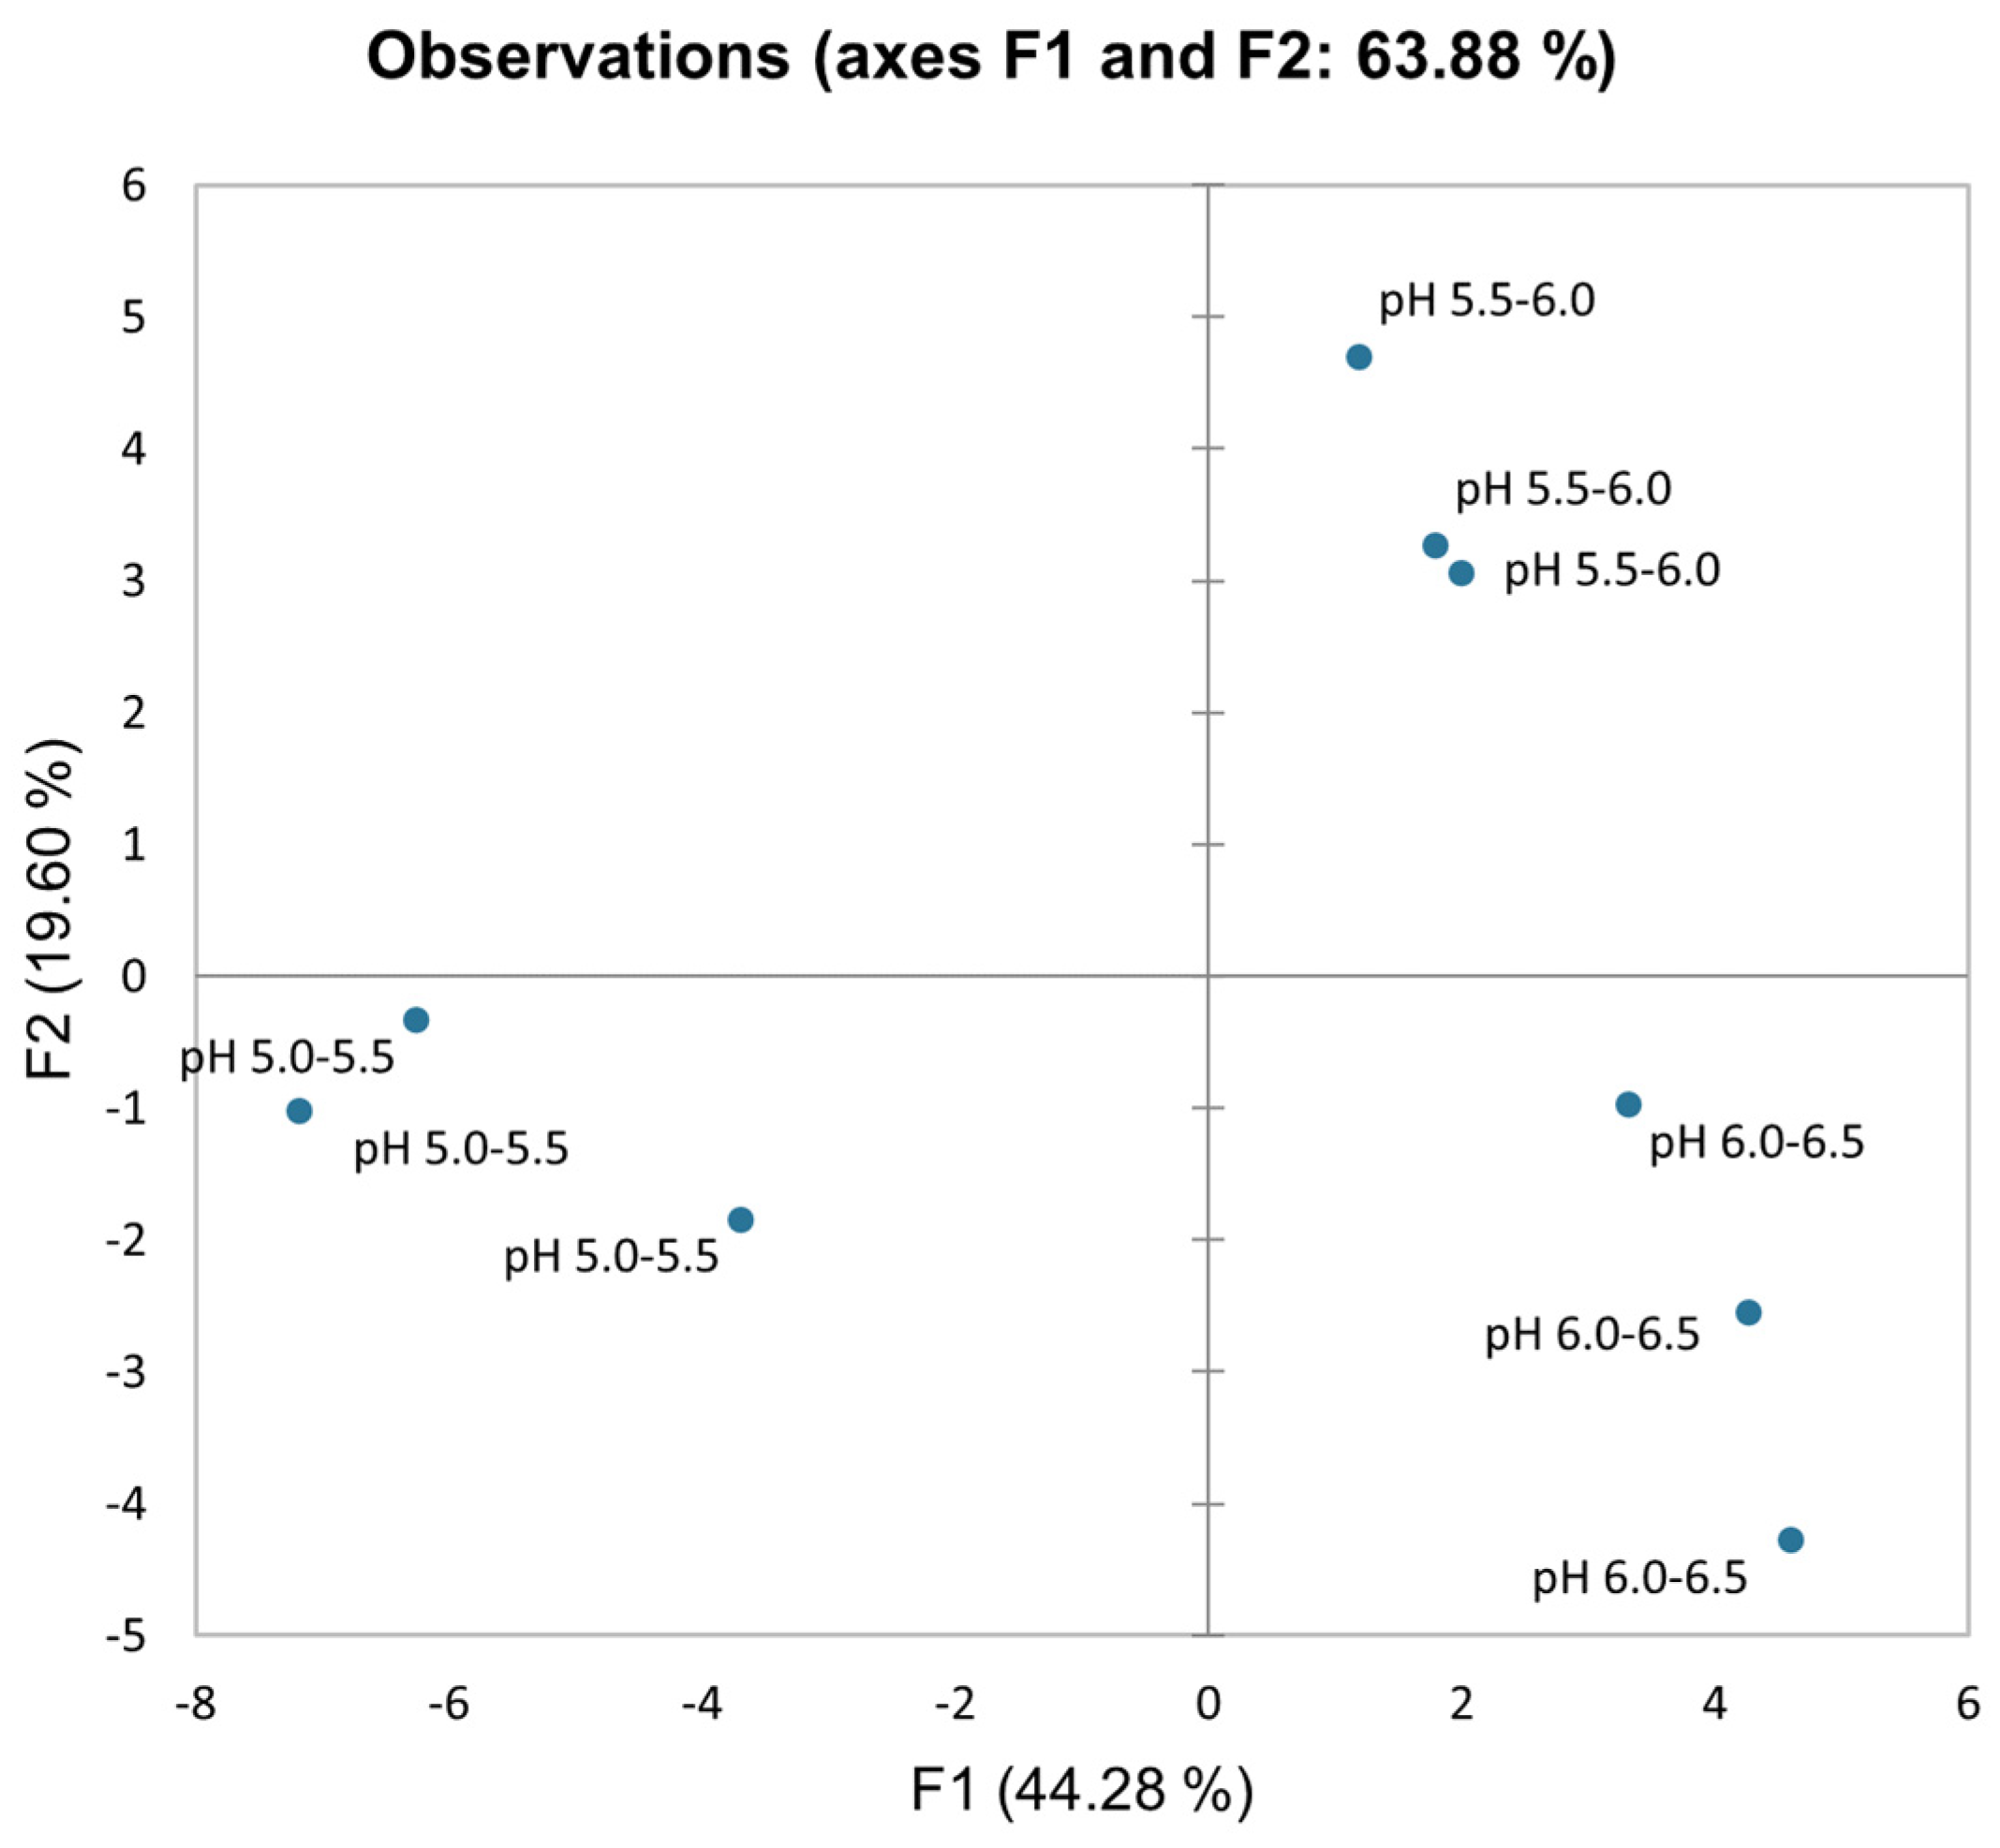
The PCA (principal component analysis) score scatterplot (
Figure 1) shows distinct differences between pH treatment groups and experimental replications according to the average coordinates of biometric parameters, antioxidant activity, mineral accumulation, and photosynthetic and leaf optical indices in hydroponically cultivated lettuce under three different pH treatments: pH 5.0–5.5, pH 5.5–6.0, and 6.0–6.5. The PCA’s first two factors (F1 vs. F2) explained 63.88% of the total variance. F1 approximately explained 44%, whereas F2 explained 20% of the total variability. Regarding the F1 score, the lowest pH treatment differs from pH 5.5–6.0 and 6.0–6.5. According to factor loadings (
Appendix A Table A1), the key factors distinguishing these treatment groups according to the F1 component are leaf area, antioxidant activity in roots, and mineral accumulation in different plant organs, while photosynthesis properties (excluding water use efficiency and transpiration rate) differentiate the treatment groups for the F2 component.
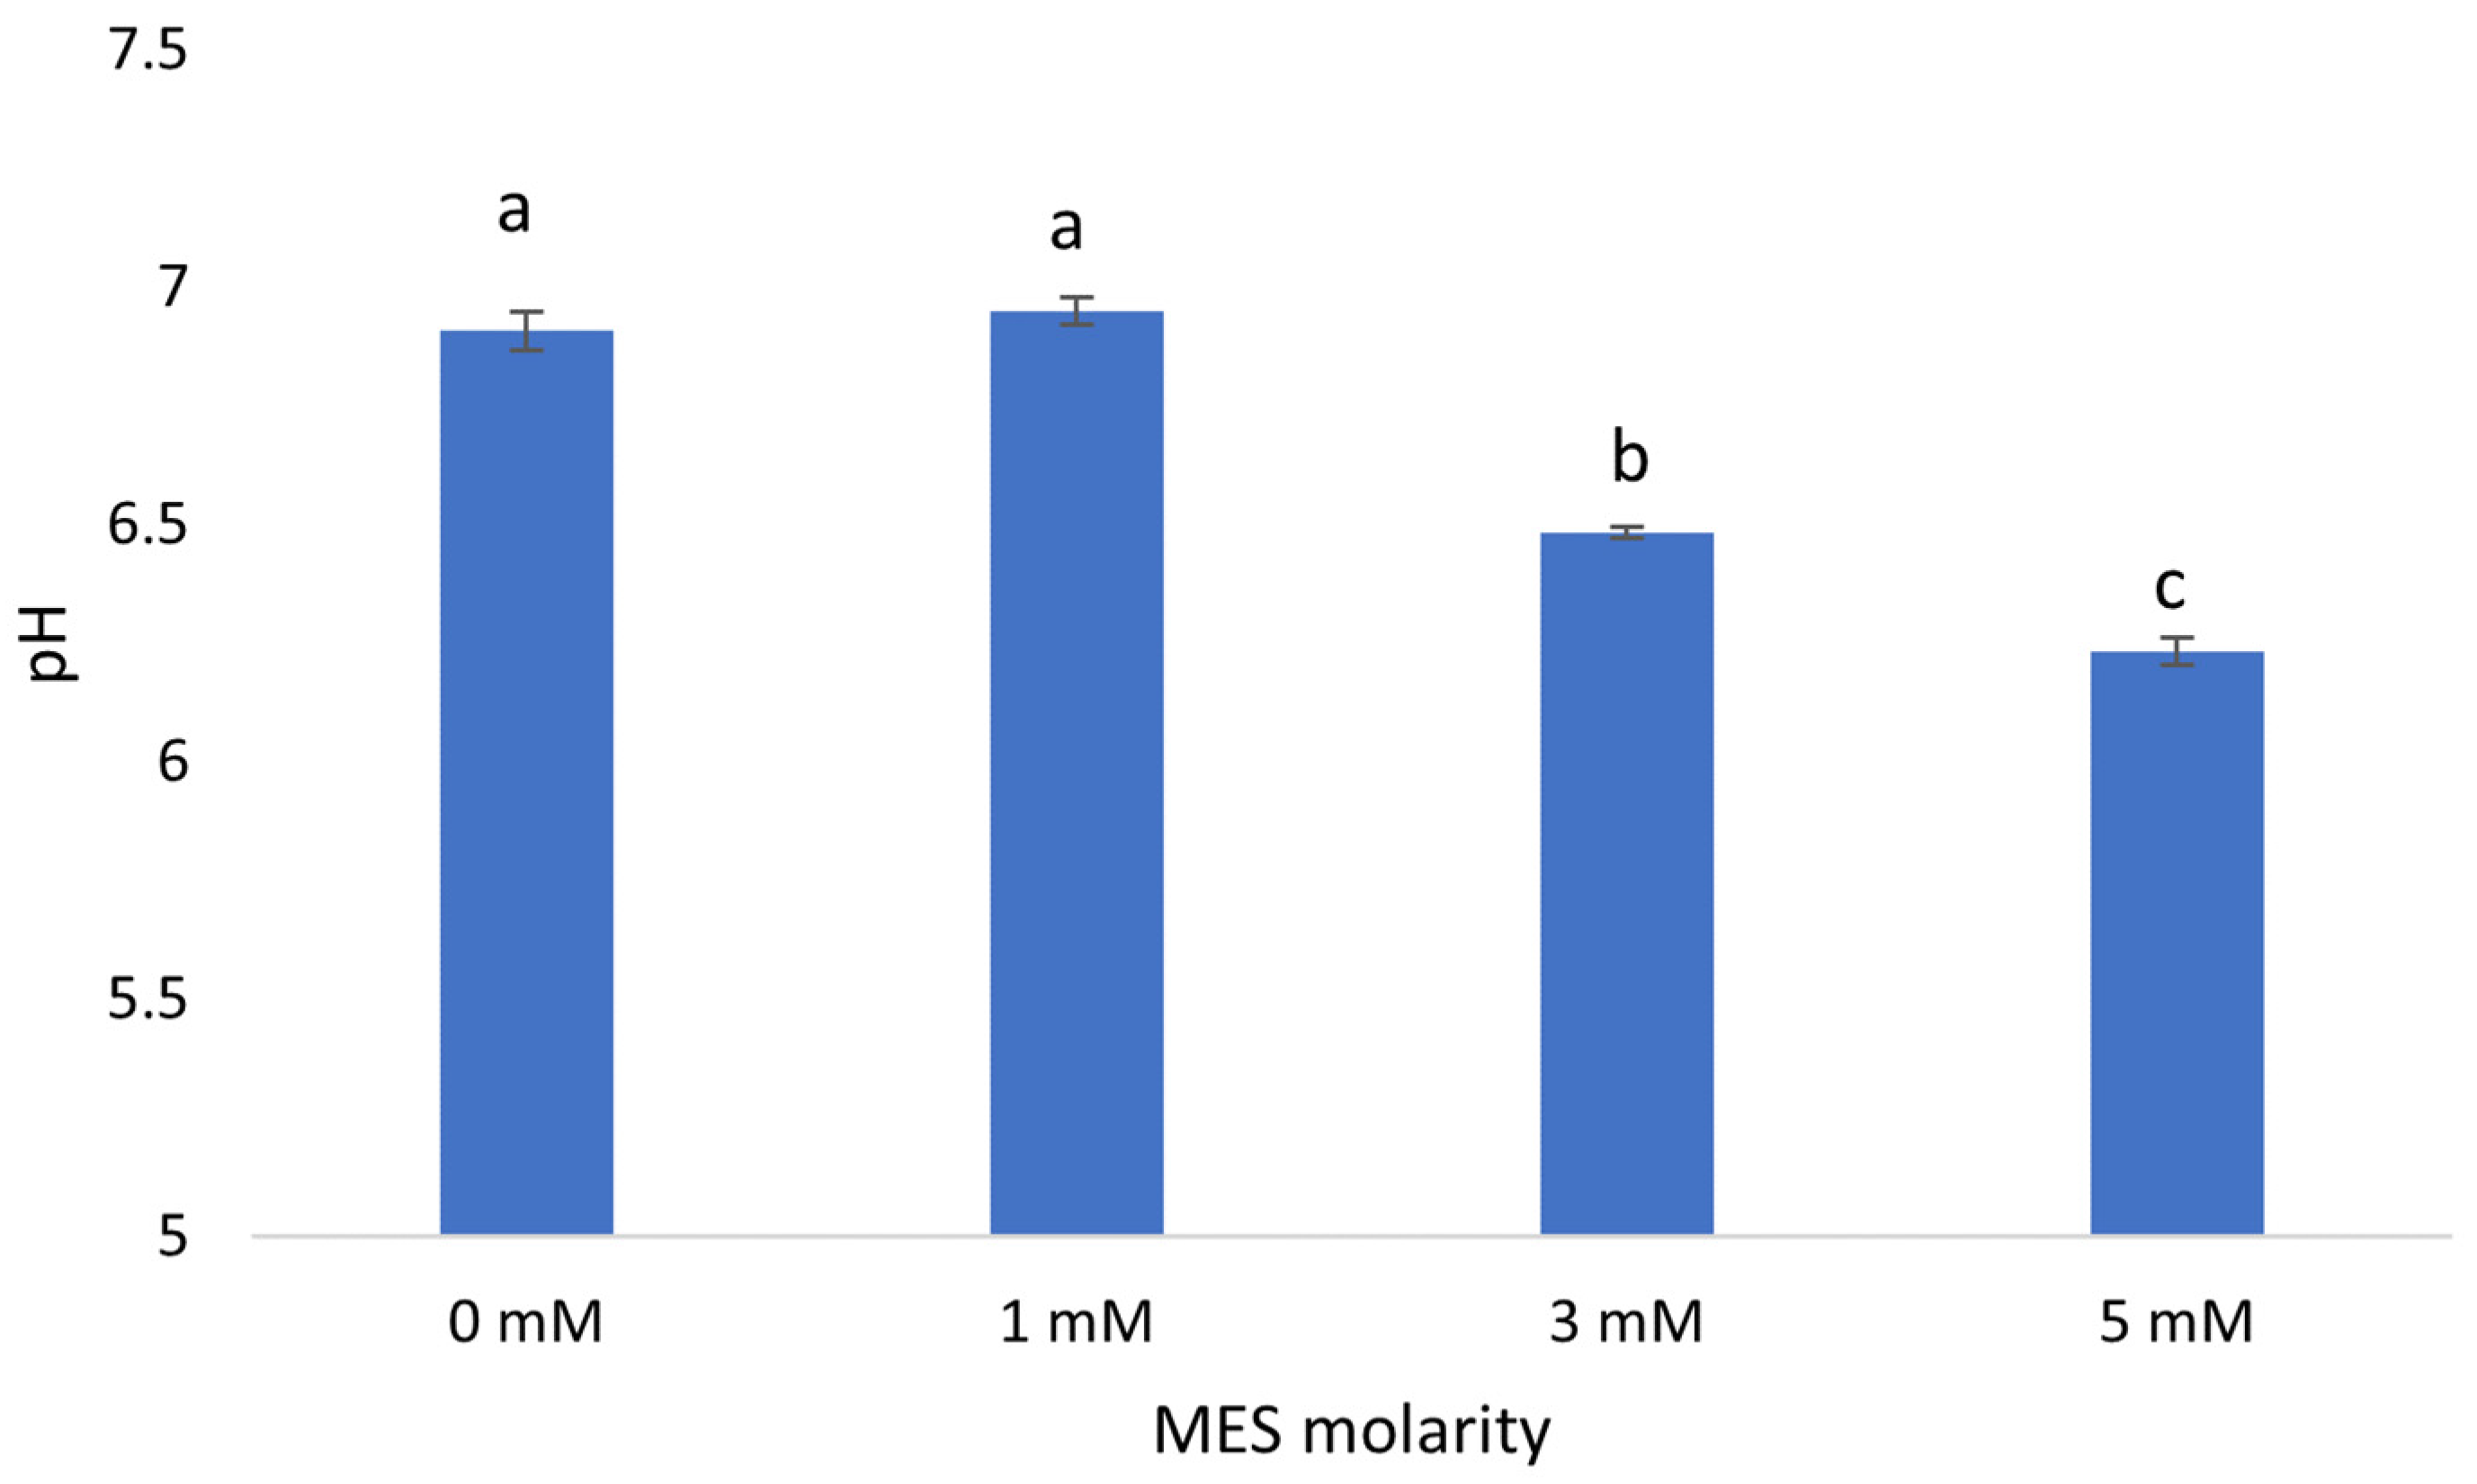
Even minor (0.5 pt) pH changes clearly distinguish lettuce’s physiological response to different nutrient solution acidity levels according to the PCA scatter plot. Therefore, nutrient solution pH must be controlled in a narrow range for predictable and precise plant physiological responses in hydroponic plant cultivation. A precise nutrient solution pH can be passively controlled in a narrow range using a supplementary buffering agent, and pH mitigation ability is directly dependent on the buffering capacity of the nutrient solution. The maximum buffering capacity is attained when the dissociation constant value of the buffering agent closely matches the desired pH of the nutrient solution. This study explores supplementary buffering agent 2-ethanesulfonic acid (MES, dissociation constant value—6.15 at 20 °C [
39]) molarity ability to maintain pH fluctuations (
Figure 2) and lettuce physiological response.
Due to the low initial buffering capacity of the nutrient solution, pH deviates from the preferred range of 6.0–6.5 in 0 mM MES treatment. Additional buffering capacity from 1 mM MES treatment was not enough to maintain the nutrient solution in the desired range. Nevertheless, the 3 mM and 5 mM MES treatments’ additional buffering capacity is sufficient to maintain pH in the preferred range.
Leaf area and leaf dry weight tend to increase at higher buffering agent molarities (
Table 4), and they were determined to be the highest at 3 mM MES buffer molarity; leaf area—27%, leaf dry weight—17%, compared with 0 mM treatment. The additional buffering capacity provided by a 1 mM MES buffer did not affect leaf dry weight and leaf area compared to the 0 mM MES treatment. Leaf area formation was restricted in the highest MES molarity treatment (5 mM) and the treatment group without an additional buffering agent (0 mM) by 10% and 22%, respectively, compared with the 3 mM MES treatment. Nutrient solution buffering with a 5 mM MES buffer resulted in a 16% higher leaf area than the 0 mM MES group. Dry root weight was not influenced by an increased buffer molarity.
The nitrogen balance index was 23% higher in a 5 mM MES treatment than in a 0 mM MES treatment (
Table 4). Additionally, the chlorophyll index was 37% higher in a 5 mM MES treatment than in a 1 mM MES treatment. Nutrient solution without additional buffering agent resulted in a 42% higher flavonoid index compared with the 1 mM MES treatment.
Buffer molarity also had a significant impact on the photosynthetic parameters and antioxidant activity of hydroponically cultivated lettuce (
Table 5). The treatment group without an additional buffering agent (0 mM) had a 22% higher photosynthetic rate (Pr), and light use efficiency (LUE), an 11% higher transpiration rate (Tr), and a 20% higher water use efficiency (WUE) compared to the 3 mM MES treatment. The highest buffer molarity treatment of 5 mM MES resulted in an 11% reduction in stomatal conductance compared with treatment without additional buffering. The intercellular-to-ambient CO
2 (C
i/C
a) ratio increased gradually with the increment of MES molarity, and no statistically significant difference was recorded between the 3 mM and the 5 mM MES treatments. A higher level of root antioxidant activity (
Table 5) was observed in the 0 mM MES treatment compared to the 3 mM MES treatment, according to both DPPH (49%) and ABTS (65%) methods. Interestingly, this antioxidant trend was not reflected in the leaves.
The differences in lettuce mineral contents due to differences in MES molarity are presented in
Table 6. Accumulated S (sulfur) concentration in leaves increased linearly (R
2 = 0.95) with the increment of MES buffer molarity. However, no disparity was recorded in S accumulation in lettuce roots cultivated in 3 mM and 5 mM MES buffer. B (boron), Fe (iron), K (potassium), Na (sodium), and Mo (molybdenum) accumulation were not affected in leaves and roots by the differences in nutrient solution pH and buffering capacity. However, no significant differences in Zn (zinc) and Cu (copper) absorption were recorded in roots and, inversely, the 0 mM MES treatment resulted in a 52% Zn accumulation reduction in leaf tissue compared to the 3 mM MES treatment. However, the same treatment relationship recorded a 48% higher Cu accumulation. Ca (calcium), Mg (magnesium), and Mn (manganese) accumulation quantities were not affected in leaves in all treatment groups. Nevertheless, the 0 mM MES treatment resulted in 80%, 18%, and 37% higher contents of respective minerals in roots than the 5 mM MES treatment.
4. Discussion
The stable pH of a nutrient solution is one of the key factors for predictable and precise plant growth and mineral nutrition in hydroponics; nutrient solution pH fluctuations due to unbalanced ion absorption can be passively mitigated [
40]. Although various buffers can efficiently mitigate a broad spectrum of pH intervals, a deeper understanding of plant physiological response to narrow but constant pH intervals is needed before utilizing buffers that can mitigate nutrient solution pH fluctuations in a desired range. It is often stated that the preferred nutrient solution pH for optimal growth is 5.5–6.5 [
18,
19,
20]. However, we found that a slight deviation from the preferred pH range by 0.5 pt (pH 5.0–5.5 treatment) did not affect lettuce growth but slightly influenced some individual physiological parameters. We found that dry weight accumulation was not affected by 5.0–5.5 pH treatment, only significantly decreased the leaf area compared with lettuce cultivated in the preferred pH interval. It was recorded that a pH as low as 4 does not restrict basil growth [
18] or even enhance the nutritional value of
Taraxacum officinale (L.) and
Reichardia picroides (L.) Roth [
20]. Optimal plant growth is achieved when photosynthesis requirements are met, and external stress factors are minimized [
41]. A statistically significant increase in root ABTS scavenging activity in 5.0–5.5 pH treatment was not reflected in leaf antioxidant activity, and transpiration rate was statistically undistinguished between all pH treatment groups. Interestingly, the pH treatment of 5.5–6.0 had a 20% higher photosynthetic rate than the lowest pH treatment of 5.0–5.5, but did not differ from the highest pH treatment of 6.0–6.5. It was reported that a hydroponic solution pH as low as 3 would not decrease photosynthetic characteristics [
42]. Mineral accumulation is directly dependent on nutrient solution pH [
40]. The lowest pH treatment of 5.0–5.5 had no significant difference in overall elements accumulation in leaves, even though mineral accumulation in the root was significantly different. There were differences in individual mineral accumulation in leaves; for instance, P contents were the lowest at the pH treatment of 5.0–5.5, which corresponds with the literature. A nutrient solution acidity increase causes a decrease in P accumulation in leaf tissue [
18], even though the highest alkalinity pH treatment has the lowest P accumulation in roots. High acidity increases Fe accumulation in roots [
20]. The lowest nutrient solution treatment pH of 5.0–5.5 had a 76% higher Fe accumulation in roots compared to pH 5.5–6.0 treatment. The efficiency of element absorption should not solely be attributed to ion availability, which is determined by the pH of the nutrient solution [
43]. The process of ion absorption can also be influenced by root exudates, which have the potential to either increase or decrease ion availability [
44]. It is known that exuded carboxylates can enhance the availability of phosphorus to plants, while secreted phytosiderophores can enhance Fe absorption [
45]. Although minor or insignificant changes were observed at the individual parameter level, the combined physiological responses were able to differentiate lettuces cultivated in different nutrient solution acidity, as depicted by the PCA scatter plot.
A significant pH acidification below the preferred nutrient solution pH range may confer benefits, such as an increased nutritional value [
20] and restricted pathogen growth [
18]. Our study revealed that a minor nutrient solution deviation from the preferred nutrient solution pH range did not affect lettuce biometric parameters but had a noticeable impact on the overall physiological balance. This underscores the importance of precise nutrient solution management to achieve predictable outcomes in hydroponic lettuce cultivation.
MES buffer usage for passive pH control for hydroponically grown plants has been scarcely researched for wheat [
30,
46],
Trifolium repens (L.) [
33], soybean [
31,
47], corn [
30], lettuce [
30], tomatoes [
29,
30], and cucumber [
32], but it is difficult to compare the findings due to different cultivation techniques, nutrient solution compositions, and environmental factors. However, previous studies did not focus on plant physiological response to an increased nutrient solution molarity; therefore, an additional understanding of MES molarity effects on various plant physiological aspects is needed. Furthermore, MES usage as a pH control tool is once again suggested for small-scale hydroponic cultivation [
29]. Nutrient solution initial buffering capacity increment with 5 mM and 10 mM MES buffer increased the canopy yield of hydroponically grown
Brassica napus (L.) 2-fold compared to the unbuffered hydroponic solution [
48]. Our findings show that the 3 mM MES treatment increased lettuce dry weight by 17% and leaf area by 22% compared with the nutrient solution without an additional buffering agent. Nutrient solution buffering capacity significantly increased [
49], but the applicable concentration is limited to plant physiological response, and the supplementary buffering agent should be used at the lowest but effective concentration. An amount of 3 mM MES or 5 mM MES buffering agent additive was sufficient to elevate the initial buffering capacity to mitigate pH fluctuations during lettuce vegetation. The 2 mM difference in MES molarity between the highest MES molarity treatments resulted in a statistically significant transpiration rate reduction. Photosynthesis characteristics with antioxidant properties reflect plant health in a particular growth environment [
41]. An increased transpiration rate and root antioxidant activity indicate a stressful growth environment due to the lack of buffering capacity in 0 mM MES treatment. Interestingly, an increased antioxidant activity in roots at the 0 mM MES treatment is not reflected in leaves; both ABTS and DPPH free radical scavenging abilities are undistinguished from the 3 mM MES treatment. Zwitterionic buffers, including MES, can interact with biological systems and form complexes with metals [
50]. It is reported that MES can decrease cations’ availability, such as Mn, Ca, Cu, Mg, and Zn [
32]. According to our findings, the 5 mM MES treatment decreased Mn accumulation in roots compared to the 0 mM MES treatment, and this tendency was not reflected in leaves. On the contrary, Miyasaka et al. found that 5 mM MES buffer decreased Mn concentration in wheat shoots [
46]. An inverse accumulation relationship was recorded with Zn. However, there was no significant difference in root accumulation in all treatment groups, but leaves accumulated 2-fold more Zn in a 3 mM MES treatment compared with the treatment without an additional buffering agent. It is proven that MES concentrations from 1 mM to 10 mM provide an adequate pH control through various plants’ vegetation, and it is not likely that MES is absorbed through the root membrane due to a relatively large molecular size [
29,
30,
31,
32,
33,
46,
47,
48]. MES, as a supplementary buffering agent, can be used as a passive and precise pH management tool, notwithstanding MES has a low cation binding possibility and adds an additional compound to the nutrient solution, and it needs to be addressed before usage. According to the obtained results, we propose that 3 mM MES concentration is beneficial for DWC lettuce cultivation and is sufficient to sustain pH in a precise range. Nevertheless, each cultivation protocol needs to be optimized separately.
The importance of precise management and automation for hydroponic crop cultivation is steadily increasing [
51]. Nutrient solution acidity could be used as a tool for targeted crop physiological manipulation and assurance of constant product quality in a controlled environment agriculture. Although the preferred pH range of 5.5 to 6.5 is commonly used for hydroponic crop cultivation, even minor deviations of 0.5 points within or outside this range can have noticeable physiological effects on the plants. A buffered nutrient solution with MES ensures a precise nutrient solution pH control through lettuce vegetation. The selection of buffer molarity must be based on the plant’s physiological response because an increased or decreased molarity can alter the biometric parameters and mineral nutrition. Although the precise management of the nutrient solution can be achieved through the use of various sensors [
52], buffers can also be used for the passive control of the nutrient solution pH, ensuring precision without external interference.


