Article

Genetic Diversity and Population Structure Analysis of Anatolian Kara Grapevine (Vitis vinifera L.) Germplasm Using Simple Sequence Repeats

1
Biotechnology Institute, Ankara University, 06135 Ankara, Turkey
2
Department of Horticulture, Agriculture Faculty, Ankara University, 06110 Ankara, Turkey
3
Ministry of Agriculture and Forestry, General Directorate of Agricultural Researches and Policies, Viticulture Research Institute, 59200 Tekirdağ, Turkey
4
Ministry of Agriculture and Forestry, General Directorate of Agricultural Researches and Policies, Atatürk Horticultural Central Research Institute, 77100 Yalova, Turkey
*
Author to whom correspondence should be addressed.
These authors contributed equally to this work.
Horticulturae 2023, 9(7), 743; https://doi.org/10.3390/horticulturae9070743
Submission received: 20 May 2023 / Revised: 15 June 2023 / Accepted: 20 June 2023 / Published: 24 June 2023
(This article belongs to the Special Issue Genetic Resources for Viticulture)

Abstract

:
Grape (Vitis vinifera L.) is among the most important commercial fruit species grown worldwide in terms of its economic value. Anatolia (Turkey), located in the favorable climate zone for viticulture, has a rich grape genetic potential due to its location at the intersection of the grapevine gene centers. In Turkish Kara grape germplasm, there are problems in terms of accuracy during the production phase due to the inadequacies in ampelographic definitions, and also very little information is available on genetic analysis of Kara grape germplasm. This study carried out genetic analysis of 49 Kara grape cultivars from six regions (sub-populations) of Turkey and 3 reference cultivars using 22 microsatellite loci (SSR), and ampelographic analysis were also performed concerning 39 OIV descriptors. In the SSR analysis, the average number of alleles per locus was 8.91, ranging from 4 to 13; four synonymous and five homonymous cases were also identified. In the population structure analysis, the genetic differentiation (Fst) values among six populations were moderate. In the BAPS analysis, all populations except Central Anatolia were found to be highly admixed with each other, and in the FCA analysis, the East Anatolia population was completely separated. In the multilocus lineages (MLLs) analysis, a total of three accessions were matched to different accessions as clone assignment. In this study, SSR-based genetic characterization of the Turkish Kara grape germplasm was revealed for the first time, and it is thought that the obtained data will help other grape genetic characterization studies and contribute to viticulture research in other areas such as breeding, protection and variety registration.

1. Introduction

The grapevine (Vitis vinifera L.), apart from being one of the most extensively cultivated fruit trees in the world, is also a fascinating subject for history and evolutionary studies [1,2]. The plant is an extremely important resource, not only in terms of its fruit, but also because of the presence of secondary metabolites contained in its cellular structure. Resveratrol is one of these secondary metabolites which acts like an antioxidant, protecting the body against high risks [3,4,5].
Anatolia, located in Turkey, is rich in wild grape (Vitis vinifera ssp. sylvestris) varieties [6,7], and diversity among germplasm of these varieties has gradually resulted in the creation of a potent cultivated variety (Vitis vinifera ssp. sativa). The coastlines of the Eastern Black Sea and Eastern Anatolian regions, except for the highlands, are involved in economic viticulture. According to data from the FAO 2020, 77.1 million tons of grape production has been conducted on an area of 6.9 million hectares worldwide. Turkey ranks fifth in terms of area with 400,000 hectares (5.85%) of cultivated land and sixth in terms of grape production with 4.2 million tons (5.32%) in the world.
As an important exporting crop in Turkey, more than 1200 cultivars of this species are gathered in Turkey’s National Collection Repository (TNCR) by Tekirdağ Viticulture Research Institute-Tekirdağ for the identification and protection of grape genetic potential. In this collection, numerous ampelographic investigations have been performed, and as a result of ampelographic researches, cultivars with different or similar morphological features but same names have been encountered. The most important of them, especially those consumed as fresh edible grapes, include 10 to 50 prevalent cultivars like White, Black, Amasya, Dimrit, Parmak and Razakı. Due to the insufficiency of ampelographic discrimination/identification of Kara (or Siyah, called Black in English) grape cultivars, its nomenclature has been inaccurate and its synonyms/homonyms are undetermined. This has complicated the correct identification of the number of grape cultivars. In addition to its nutritional value, black grapes have accumulations of effective antioxidant substances, especially in the skin and seeds, which are very important for health [8].
Development of genetic markers is considered a big step forward, because they are not influenced by environmental conditions, nor by the type of the sample or the developmental stage, and thus provide distinctive information [9,10]. DNA markers are widely used in germplasm characterization and variety creation, and also in clone identification through parent analysis [11,12]. A common criterion of a suitable or applicable marker is the degree of polymorphism that can highlight differences between cultivars and clones [13]. Due to the high polymorphism, repeatability and predominant quality of SSR microsatellites, they have most often been selected for genetic analysis of Vitis cultivars [14,15].
SSR microsatellite markers, or Simple Sequence Repeats (SSR), are genomic repetitive regions in the category of abundant Short Tandem Repeats (STRs) scattered throughout the genome [16,17]. Indicatively, Velasco et al. [18] estimated the number of SSRs in the genome of highly heterozygous individuals of Vitis vinifera to be about 89,000.
Recently, it was concluded that the utilization of 20 SSR markers tends to be sufficient to distinguish existing cultivars or to solve synonymy and homonymy issues [19]. In this work, the identical, synonymous and homonymous status of 49 Kara grape cultivars derived from 30 provinces of six different eco-geographic sub-populations were distinguished using 22 SSR loci and 39 ampelographic characterization descriptors (OIV: International Organization of Vine). Furthermore, correlation between cultivars and eco-geographical sub-population (region) distribution was illustrated by genetic relations, different population structure approaches and clonal analysis.

2. Materials and Methods
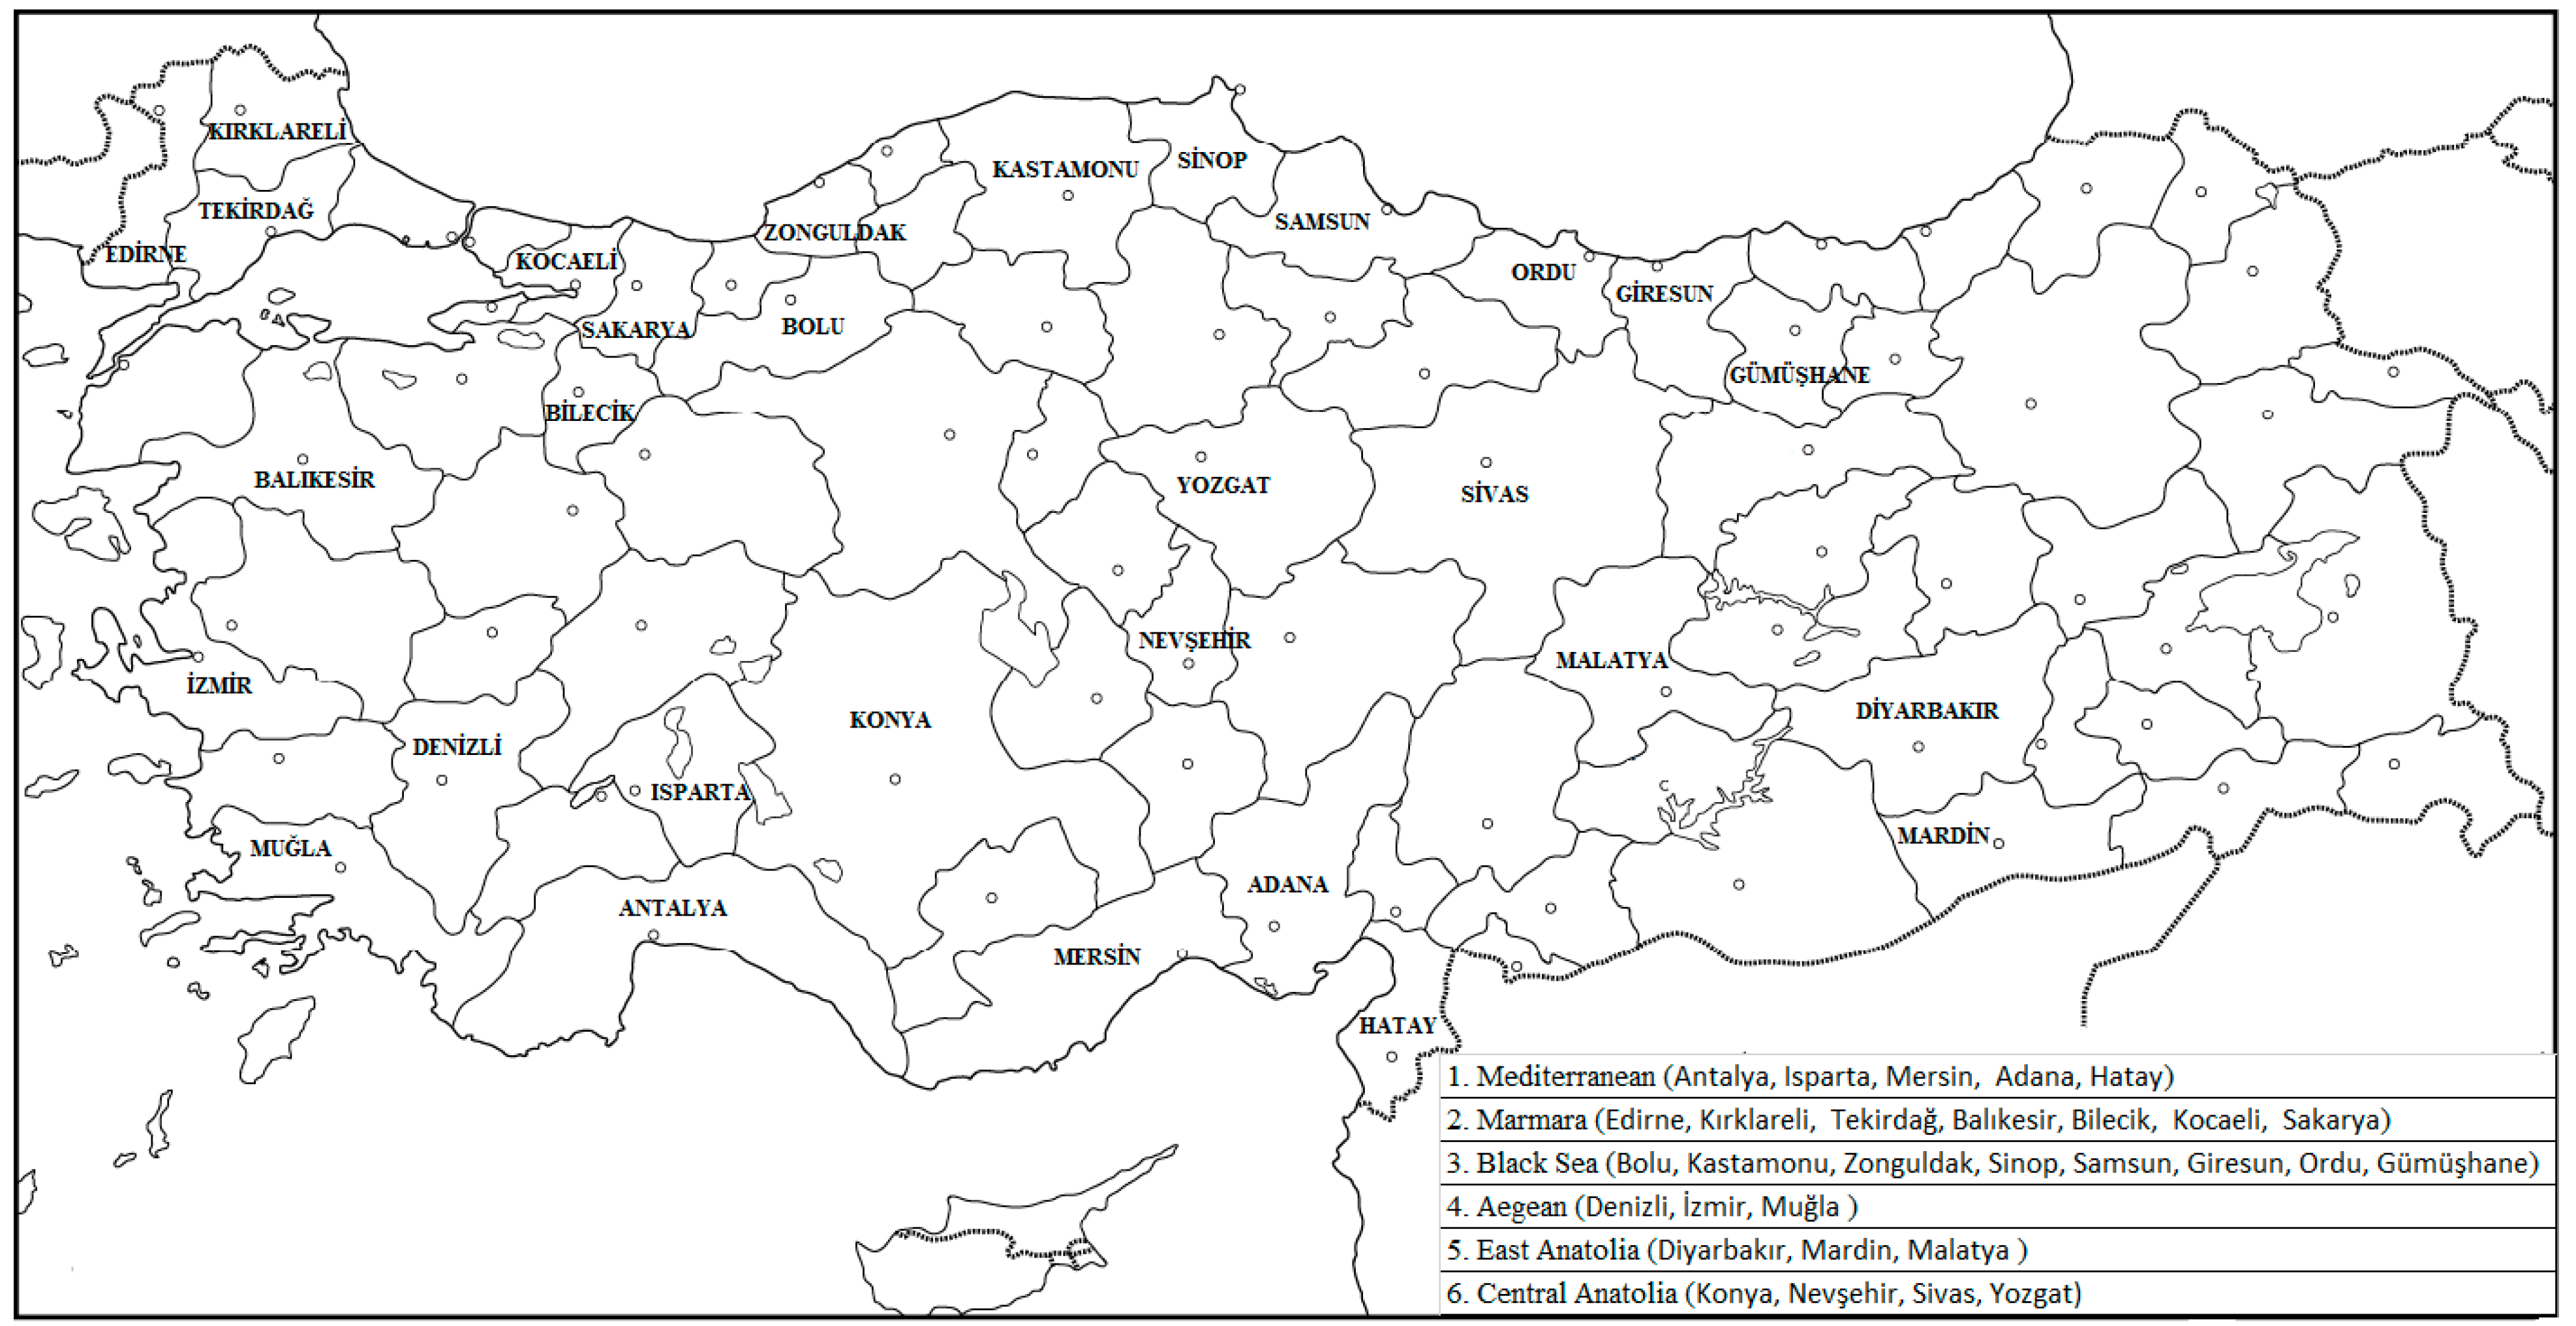
2.1. Plant Material

Overall, 52 cultivars, including 49 Kara grape cultivars (Table S1) and 3 reference cultivars (CS: Carbernet Sauvignon, M: Merlot, PN: Pinot noir), were analyzed in this study (Figure 1). These grape cultivars were obtained from the National Grapevine Germplasm Vineyard at the Institute of Viticulture in Tekirdağ, Turkey.

2.2. OIV Data Analysis

Ampelographic characters of these grape cultivars were determined according to the Descriptors of Grape norms from the IBPGR (International Board for Plant Genetic Resources) [20]. A total of thirty nine major OIV descriptors were used for a set of 49 Kara grape cultivars. Information related to OIV descriptors (characteristic description) and OIV data codes is given in Table S2. The morphometric data were constructed using standard OIV codes. However, the standard OIV coding was converted into a data format that could be analyzed. The OIV 016 character was removed from the data file as it contained no variation (all cultivars were coded as 1). PAST (Paleontological Statistics Version 3.22) was used for the data analysis [21].

2.3. DNA Isolation

DNA was extracted from leaf tissue as described by Lefort et al. [22]. Determination of DNA concentration and quality was performed according to Akçay et al. [23] and Ergül et al. [24] using an ND-1000 spectrophotometer (NanoDrop Technologies, Wilmington, DE, USA) and agarose (1%, w/v) gel electrophoresis. Isolated DNA was stored at −20 °C until PCR reactions were performed.

2.4. SSR Analysis and Capillary Electrophoresis

22 SSR loci, named VVS1, VVS2 [25], VVMD5, VVMD7, VVMD21, VVMD24, VVMD27, VVMD28, VVMD31 [26], vrZAG21, vrZAG47, vrZAG64, vrZAG112, vrZAG62, vrZAG79, vrZAG83 [27], VMC2H4, VMC2C3 [28] and VVIH54, VVIB01 [29], VVMD25, VVMD32 [26], were used in this study. Nine loci, called the “core SSR marker set” (VVS2, VVMD5, VVMD7, VVMD27, ZAG62, ZAG79, VVMD25, VVMD32), directly allow comparisons of allele sizes from different grape cultivars analyzed in different studies [30,31]. Information on the 22 SSR loci used (SSR locus name, primer sequence and references) is given in Table S3.
Allele size detections, PCR amplifications and capillary electrophoresis conditions were conducted according to Akçay et al. [23] and Yılmaz et al. [32]. In the PCR reactions, fluorescent-labeled D4 (blue), D3 (green), and D2 (black) forward primers allocated to each SSR locus were applied. A negative control (distilled water instead of DNA) was used for checking for the presence of possible contamination in the PCR reactions. Samples for DNA amplification were subjected to PCR for 3 min at 94 °C, 1 min at 94 °C, or 1 min at 48–66 °C, depending on the degree of primer binding (annealing temperature), then for 2 min at 72 °C, and kept at 72 °C for 10 min during the last cycle. This was carried out for 35 cycles. Amplification (with 100 bp DNA ladder, Invitrogen™, Waltham, MA, USA), and control of SSR loci products once their PCR steps were completed, were performed using electrophoresis on a 2% agarose gel.
After diluting the PCR products with SLS (Sample Loading Solution) solution in suitable proportions (20 μL), Genomelab DNA Standard Kit-400 (0.4 μL) was added to the mixture, and then electrophoresis was applied in the CEQ 8800XL capillary DNA analysis system (Beckman Coulter, Fullerton, CA, USA). Determination of the peak sizes (bp) was carried out using the fragment analysis software of the system. “Cabernet Sauvignon (CS)”, “Merlot (M)” and “Pinot noir (PN)” were included as reference cultivars. PCR and SSR analyses were performed at least twice to indicate reproducibility of the results. The heterozygosity or homozygosity of PCR fragments was visualized considering the types and colors of each SSR locus peak after capillary electrophoresis.

2.5. Genetic Analysis

2.5.1. SSR Analysis

In this study, allele number (n), allele frequency, expected (He) and observed heterozygosity (Ho) and detection probability (PI, Probability of Identity) values were determined as genetic parameters with the IDENTITY 1.0 program [33]. This program was used to detect the same genotypes. The proportion of shared alleles was determined by the ‘ps (option 1-(ps))’ method described by Bowcock et al. [34], and the similarity ratio index was calculated using the Microsat program [35]. Genetic similarities among a total of 52 studied cultivars were determined with the NTSYS program (version 2.02g, Exeter Software, Setauket, NY, USA) using the UPGMA (Unweighted Pair-Group Method using Arithmetic means) method [36].
Additionally, to confirm international synonymous and homonymous cases, the genetic profiles of 49 cultivars were determined using the nine core SSR marker set (VVS2, VVMD5, VVMD7, VVMD27, ZAG62, ZAG79, VVMD25, VVMD32) and compared with the European Vitis database (www.eu-vitis.de (accessed on 15 May 2021)) and Vitis International Variety Catalogue VIVC (www.vivc.de (accessed on 10 June 2021)).

2.5.2. Population Genetic Analysis

Population genetic parameters of Kara grape sub-populations (population information of cultivars can be seen in Table S1) were estimated using the Arlequin software Ver. 5.3 program according to the method of Excoffier and Lischer [37]. The genetic relationship dendrogram of the cultivars was created on the basis of the genetic distance of Nei, using the NTSYS-pc (Numerical Taxonomy and Multiware Analysis System) analysis program [38]. FCA was performed to find the presence of any population structure among eight grape populations using Genetix 4.05 [39]. Gene flows (Nm) among populations were estimated using Genetix 4.05, and genotypes were analyzed using the STRUCTURE 2.3 program. For each run, 100,000 replicates of “burn-in” followed by an additional 100,000 MCMC (Markov Chain Monte Carlo) replicates of data collection were conducted. A linkage model based on known distances among microsatellite loci and a model of correlated allele frequencies were used, and the data were analyzed with the STRUCTURE 2.3 program. Bayesian Population genetic analysis was also applied using the BAPS software to visualize population structure and admixture (http://www.helsinki.fi/bsg/software/BAPS (accessed on 21 March 2020)) [40].
We also analyzed the population structure with the STRUCTURE 2.3 program to estimate the possible RPPs. The grape populations were analyzed according to Pereira-Lorenzo et al. [41], and were based on the population structure analyzed with the STRUCTURE 2.3 program [42] using the same computing parameters except that the K level was calculated for K = 2–9 unknown RPPs with 25 replicates. We also used STRUCTURE-HARVESTER [43] to estimate the best K value supported by the current data [44]. Similar to Ergül et al. [24], the number of accessions strongly assigned to each RPP was determined based on the qI probabilities (probability of membership) higher than 80%.

2.5.3. Clonal Analysis

For clonal differentiation, the GenAlEx v6.5 program [45] was used to identify Multi-locus Genotypes (MLGs) in the populations. Effective alleles (Ne), number of different alleles (Na), observed heterozygosity (Ho), Nei’s [46] unbiased expected heterozygosity (uHe) and private alleles summary (PAS) values for each population were determined by using the same program.
In addition, a histogram of pairwise distances created by the software GenoType v1.2 [47] was applied to determine whether somatic mutations were present. Simpson’s diversity and possible number of clones (representing clone number) based on multilocus lineage (MLLs) calculations were conducted by using the GenoDive v1.1 program [47]. Furthermore, genotypic diversity (div), effective number of genotypes (accessions) (eff), evenness (eve) and Shannon–Wiener (shw) diversity index values were calculated by using the GenoDive v1.1 program.
In analysis of the MLGs, various mutational threshold or T values (T represents the maximum distance allowed to identify a clone among the individuals with the same “multilocus genotype (accession)” value) were tested (e.g., from threshold = 0 to threshold = 10) to minimize the mutational problems and potential scoring errors. The groupings of MLGs within MLLs were evaluated, and accessions with the similar values of the mutational thresholds were thought to represent the clones.

3. Results

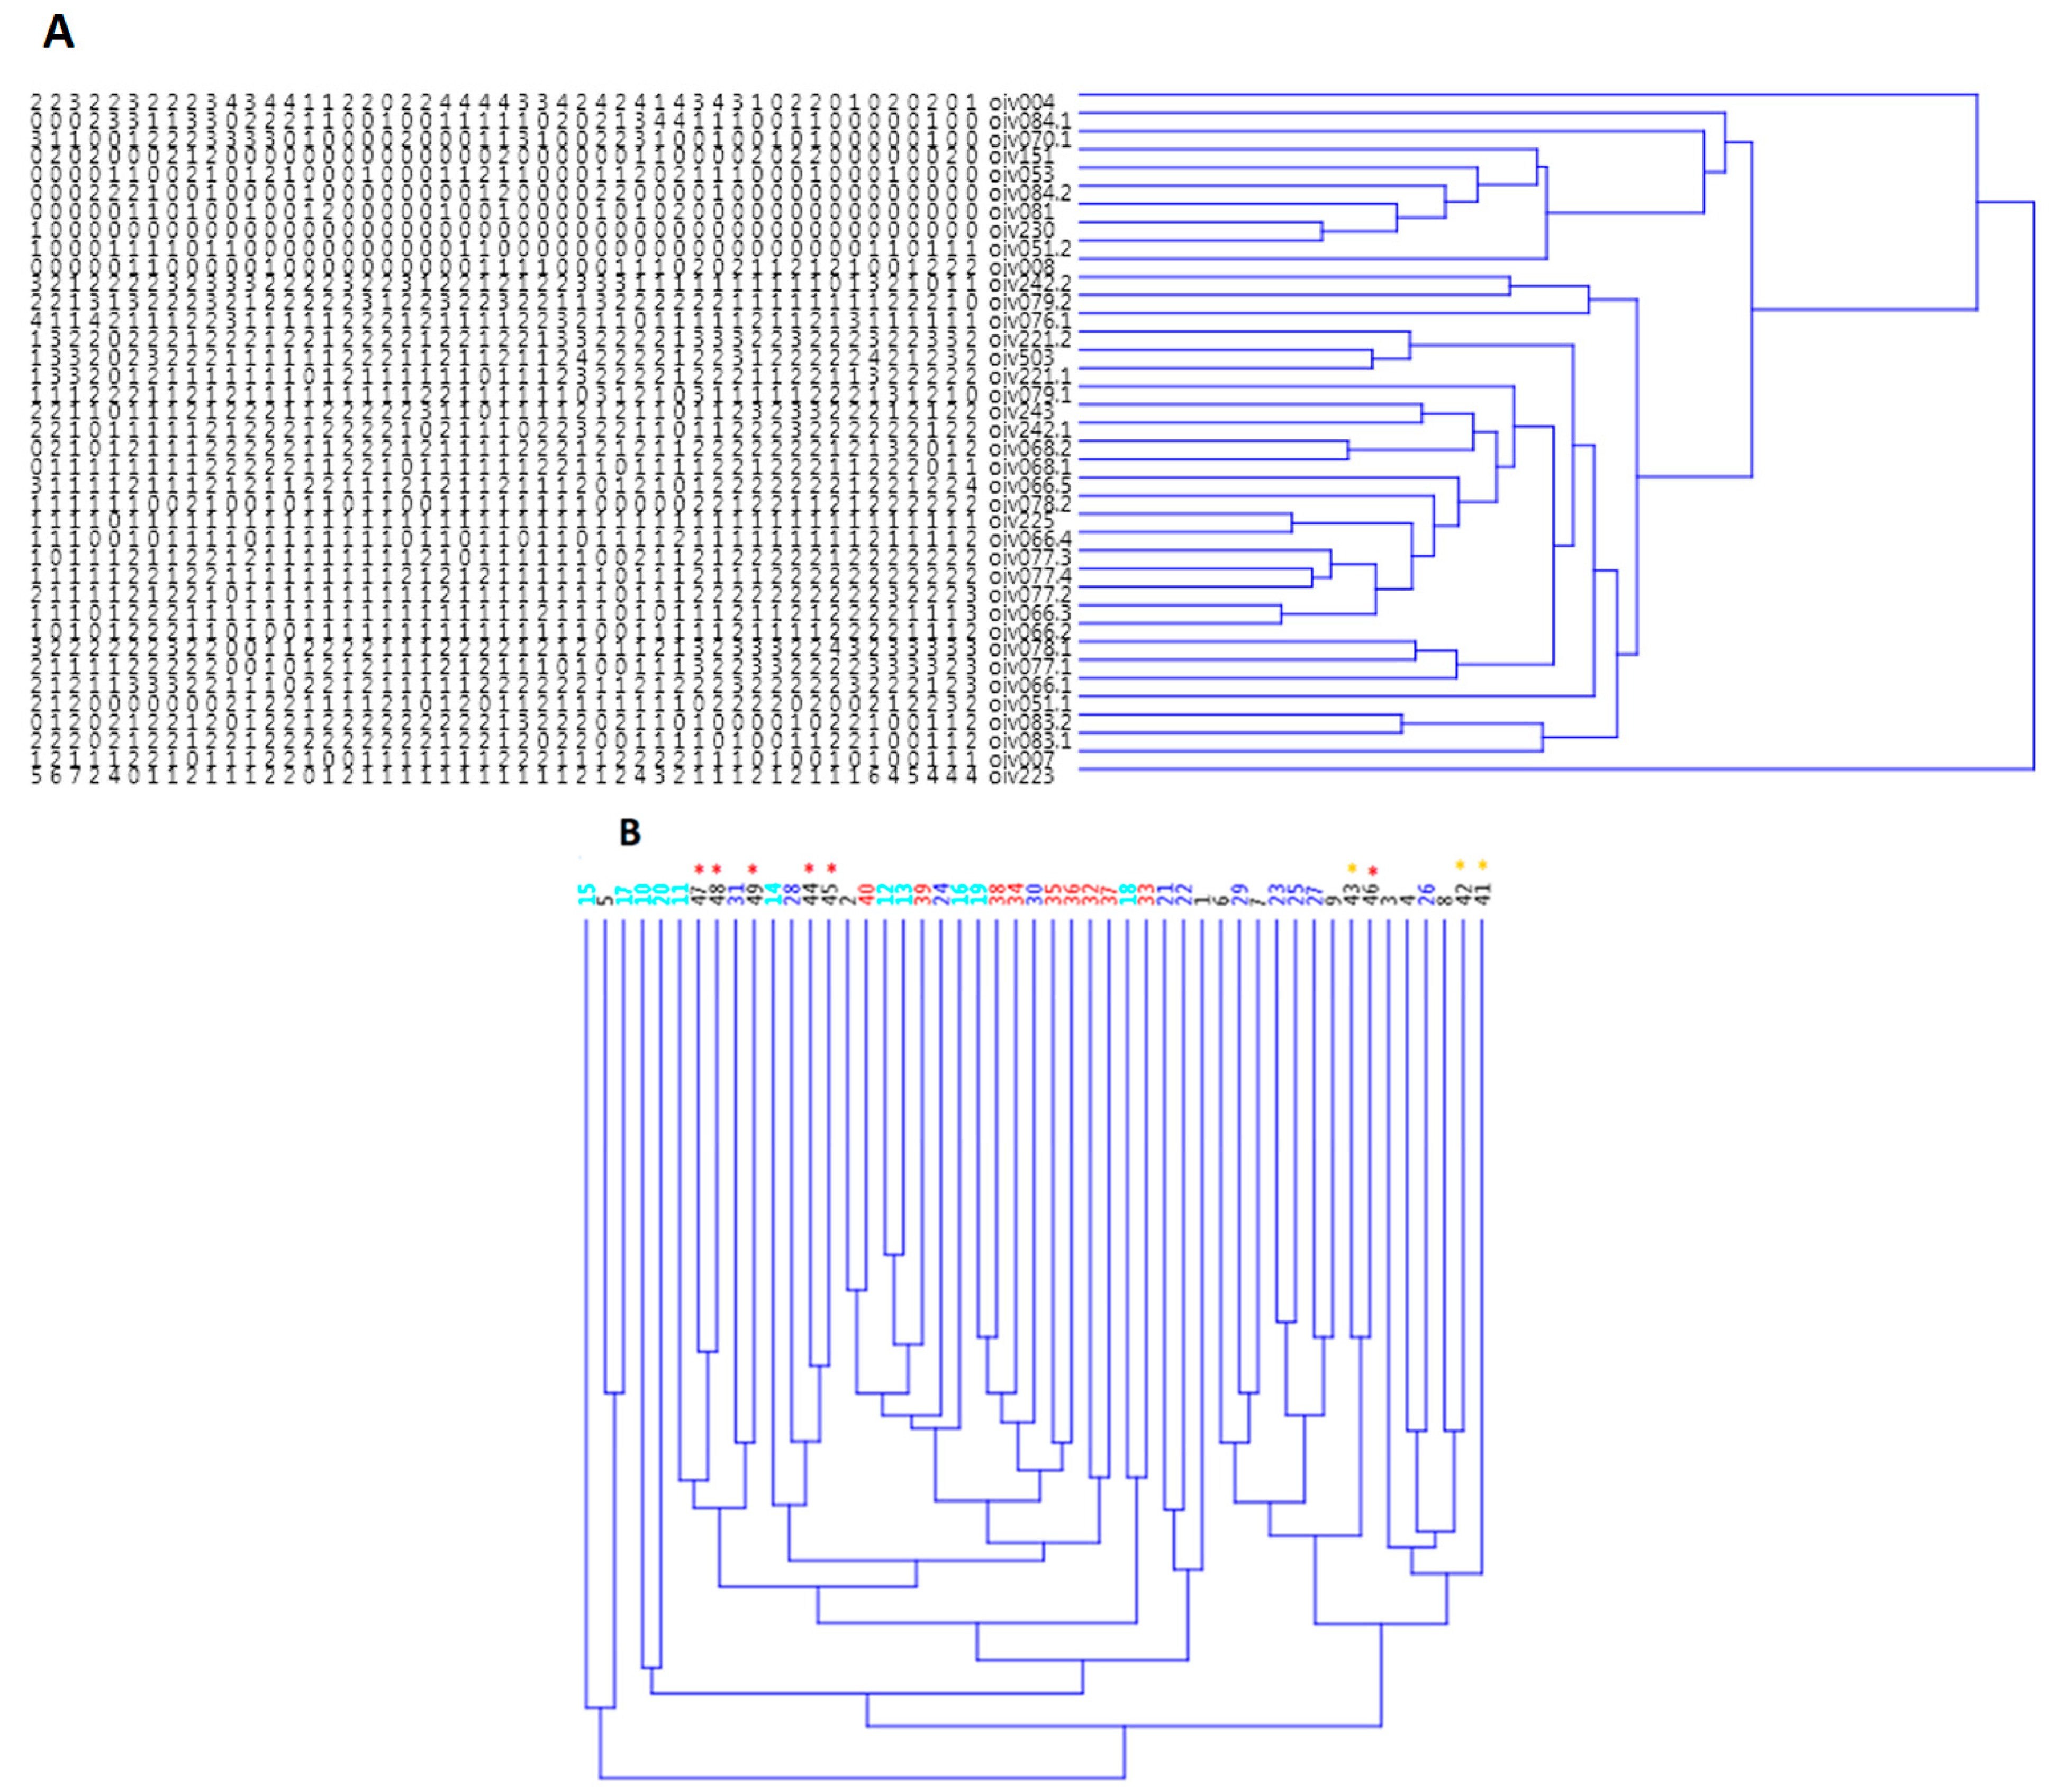
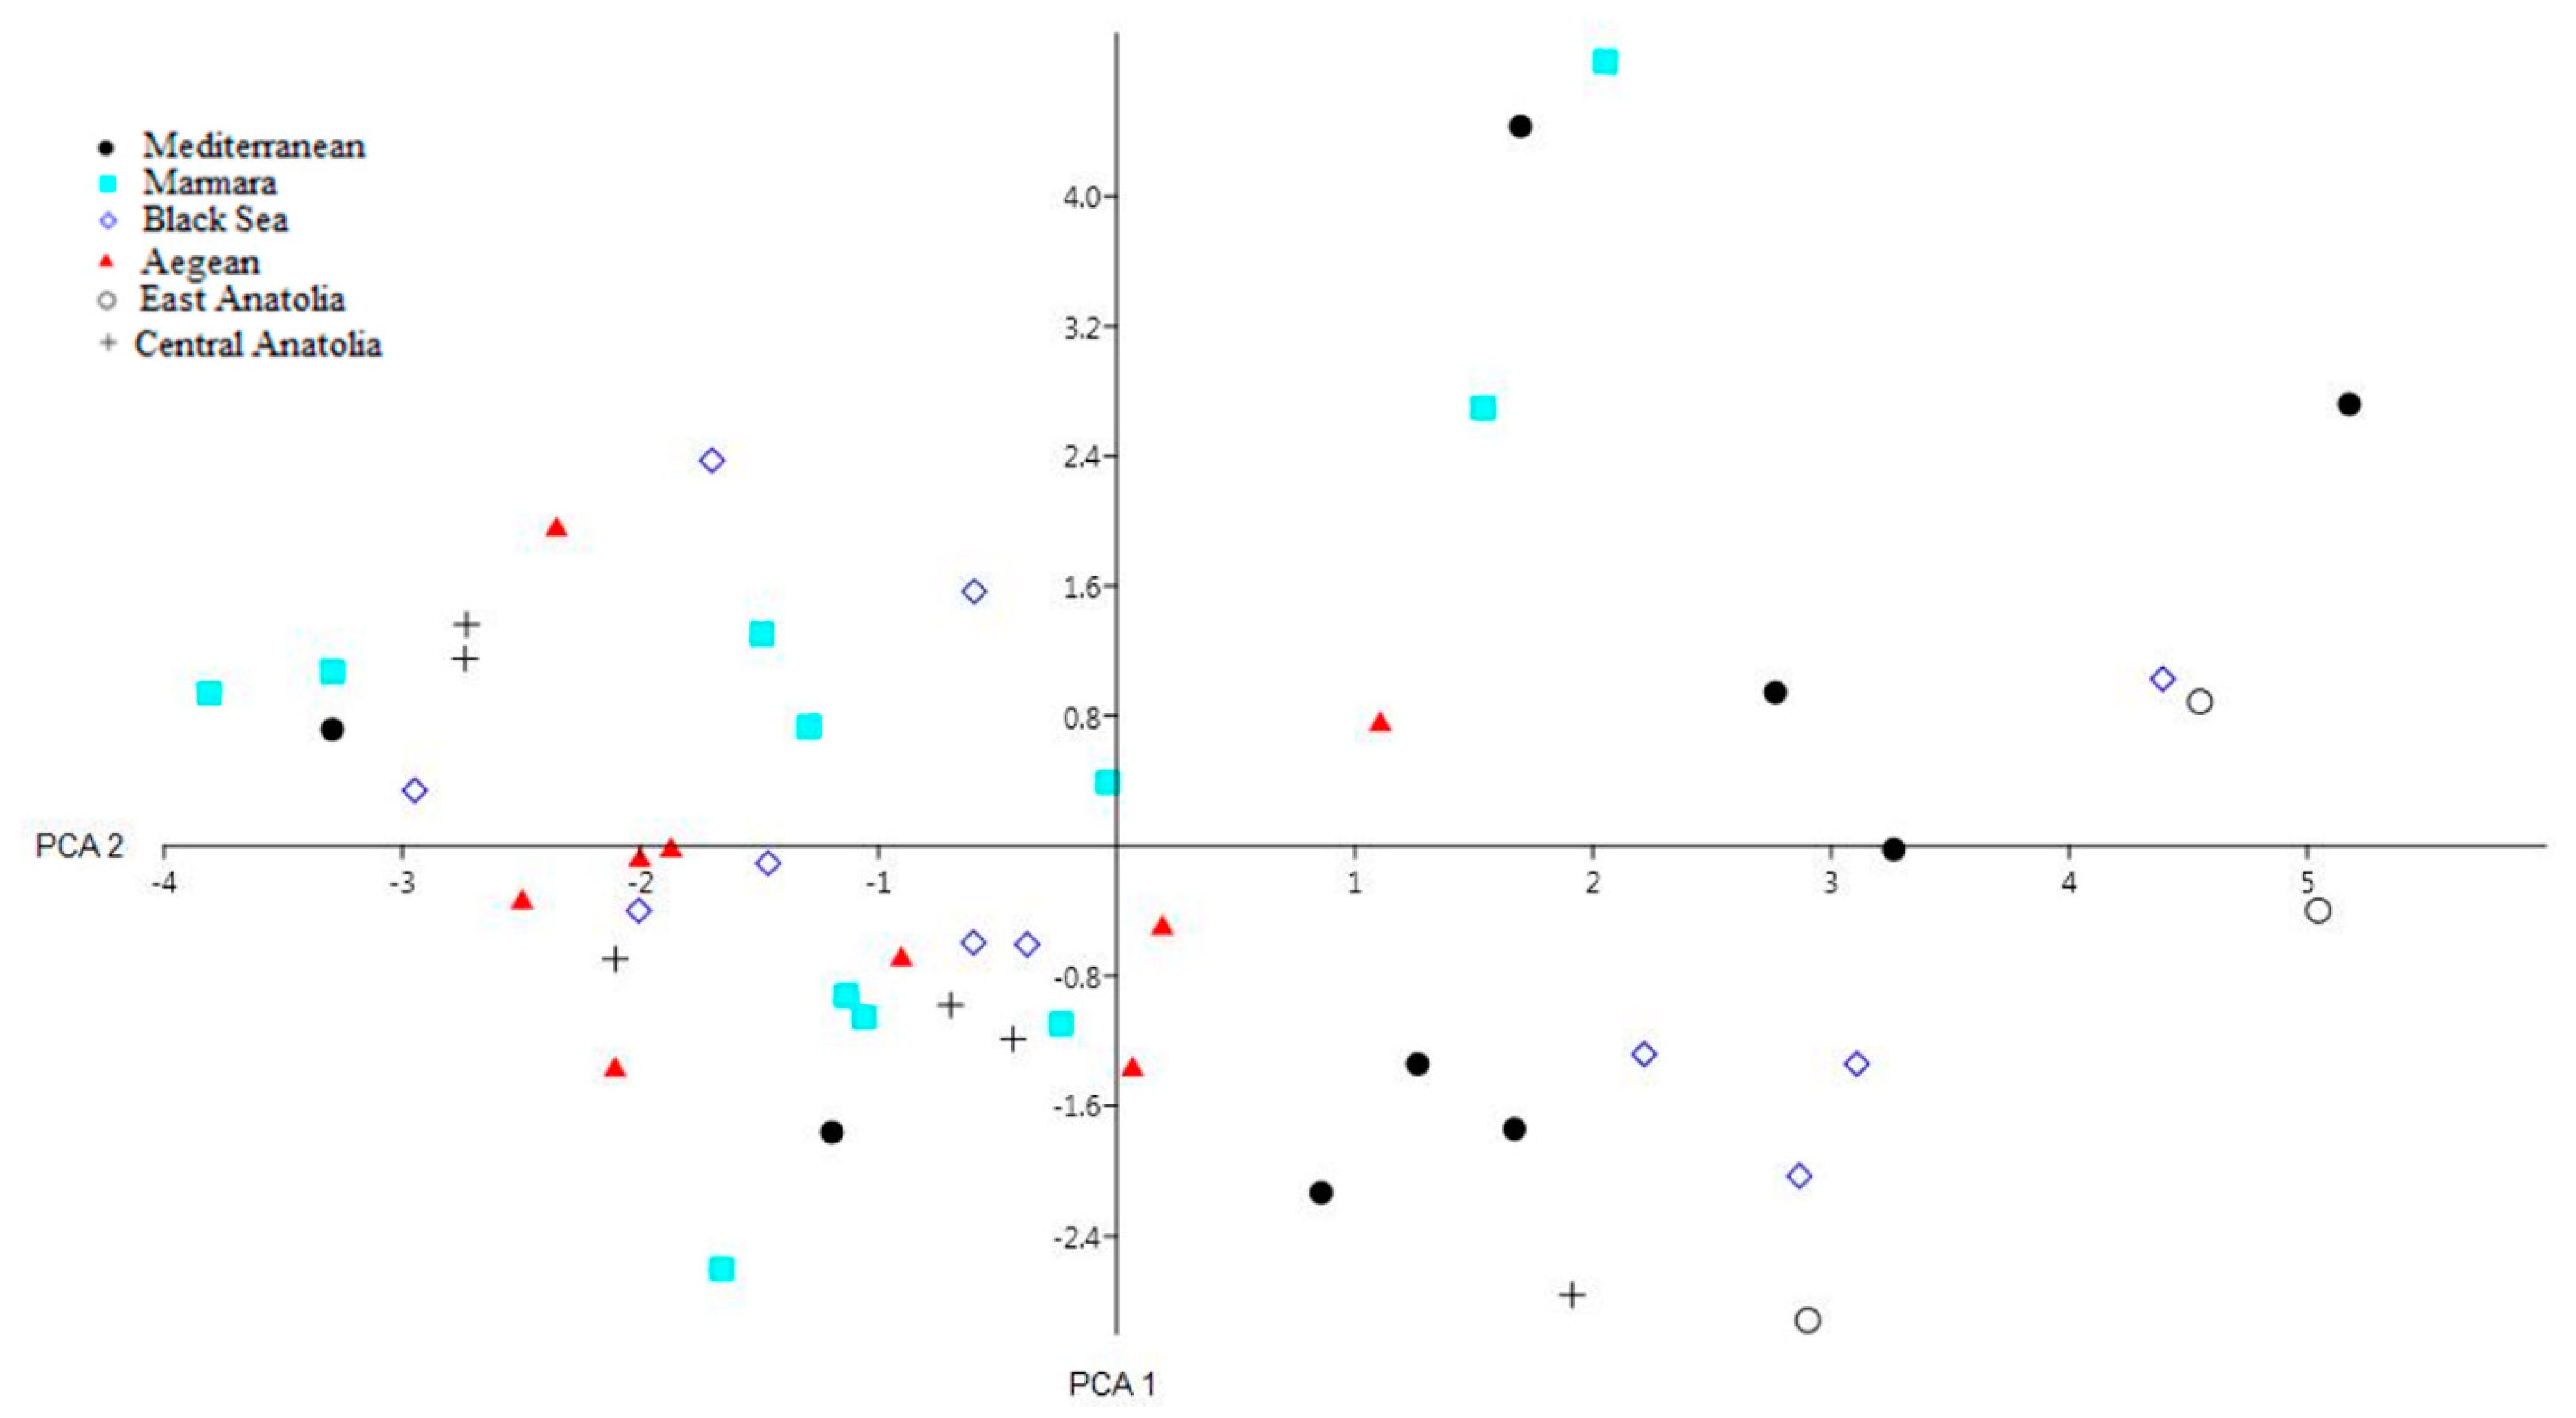
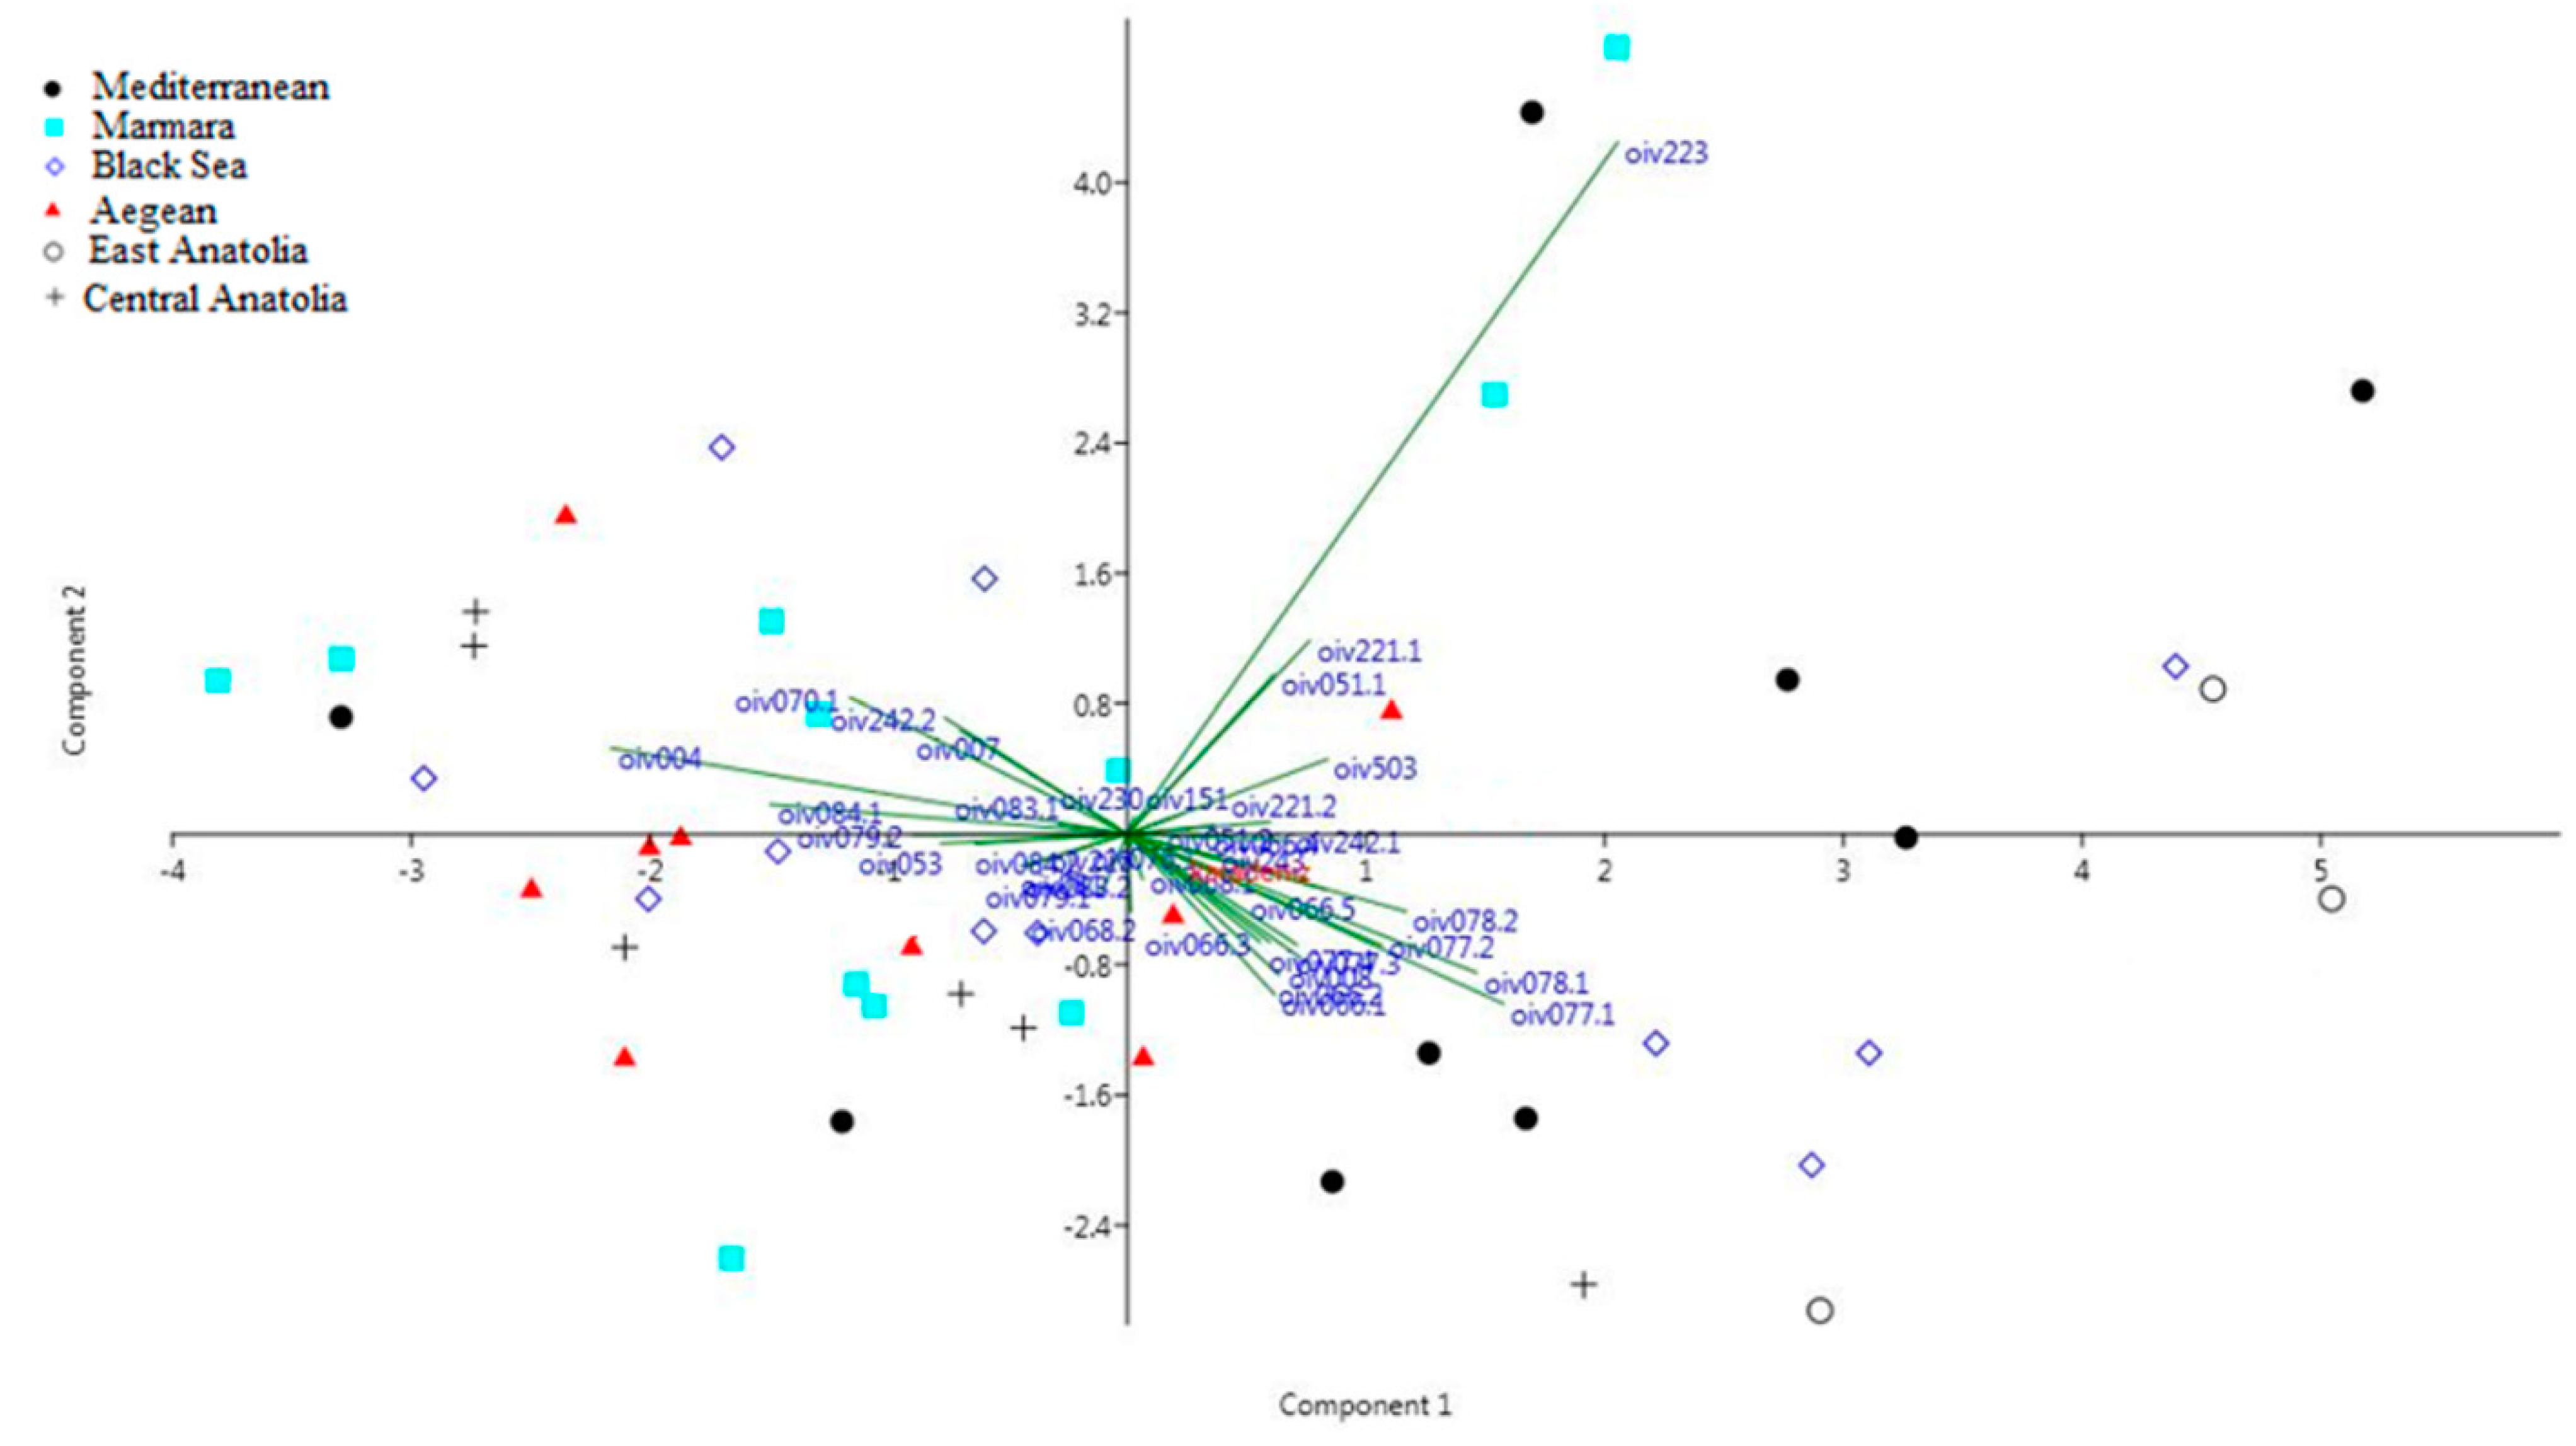
3.1. OIV Data Analysis

The detailed ampelographic definition presented in this work highlights clear morphological differentiation between studied Kara grape cultivars characterized using 39 OIV descriptors (Table S2).
The dendrogram (Figure 2A) of the studied OIV descriptors ultimately consists of two sub-groups, in which the character OIV 223 (Berry: shape) alone constitutes a single-member group. However, the larger sub-group with 37 members consists of two sub-groups, one of which is the OIV 004 (Young Shoot: density of prostrate hairs on tip) character alone. In other words, cultivars are more diverse in terms of OIV 223 and OIV 004 traits, and there was no significant correlation between these traits and the other examined traits. On the other hand, the OIV 66-4 (Mature leaf: length of vein N5) and OIV 225 (Berry: color of skin) properties showed correlation with each other and defined the shorter length of vein N5 in Kara grape cultivars. Additionally, OIV 51-2 (Young leaf: color of the upper side—leaf 4–6) was in correlation with the OIV 230 (Berry: color of flesh) character and determined that cultivars with green and yellow leaves contain colorless flesh. Besides the correlation of OIV 83-1 (Mature leaf: shape of base of upper leaf sinuses) and OIV 83-2 (Mature leaf: shape of base of lower leaf sinuses) with OIV 007 (Young leaf: density of prostrate hairs between veins), and other descriptors were identified (Figure 2A).
Using all accessions, two major clusters were identified by the cluster analysis: group 1 (46 accessions) and group 2 (3 accessions) (Figure 2B). The most dissimilar cultivars grouped together showing the longer branches in the tree. The minor cluster consisted of accessions: Miri Kara (Dendrogram no: 17) and Acı Kara (Dendrogram no: 5), which were linked to the Bulgar Karası (Dendrogram no: 15), while Bulgar Karası (Dendrogram no: 15) had the least similarity with the remaining 48 cultivars, although the larger group was divided to two sub-groups in dendrogram. The most similar accessions were Kokulu Kara (Dendrogram no: 12) and Beyaz Saplı Kara (Dendrogram no: 13), both of which are from the Marmara region. Finally, it should be noted that the results of the genetic and phenotypic similarity graphs were not completely consistent.
The scatter plot showing the individuals with the sub-group population names is presented in Figure 3. It shows the scattering of the different grape samples and individuals belonging to different geographic sub-groups, analyzed in the bi-dimensional space determined by PCA 1 and PCA 2. In Figure 3, we do not see any groupings among Kara sub-populations based on the OIV data, but it can be seen that the Mediterranean accessions (black circles) accumulate on one side of the graph while the accessions of the Marmara region (blue squares) are gathered on the other side of the graph. However, among these, the Black Sea accessions (white diamonds) are well distributed among different sub-groups of accessions.
The biplot with loadings of each OIV characters is presented in Figure 4, showing which characters contributed to the separation of the individuals. It can be easily seen that OIV223 and OIV 077.1 (Mature leaf: length of teeth N2) have the highest loadings on the positive side, while OIV 004 and OIV 084.1 (Mature leaf: density of prostrate hairs—lower side) have the highest loadings on the negative side. Additionally, the first axis was defined by the density of prostrate hairs on the tip in young shoots (OIV 004) and length of teeth N2 in mature leaves (OIV 077-1), respectively.

3.2. SSR Analysis

A total of 196 alleles were approved in the 22 mentioned SSR loci, and the mean allele number (n) was found to be 8.91. The most and least informative loci were determined to be VMC2H4, with 13 alleles, and VVIB01, with 4 alleles, respectively (Table 1).
Observed (Ho) and expected (He) heterozygosity rates were 0.734 and 0.746, respectively. The highest Ho was determined in VMC2H4, with a rate of 0.962, and the lowest was determined in VVS1 and VVIH54, with a rate of 0.500. He rates for VMC2H4 and VVIB01 were 0.871 and 0.526, respectively. These results prove the high polymorphism characteristics of these loci in grapes. VMC2H4 (0.056) and VVS2 (0.075) loci showed the lowest PI rates and were identified as being the most informative among the studied loci (Table 1).

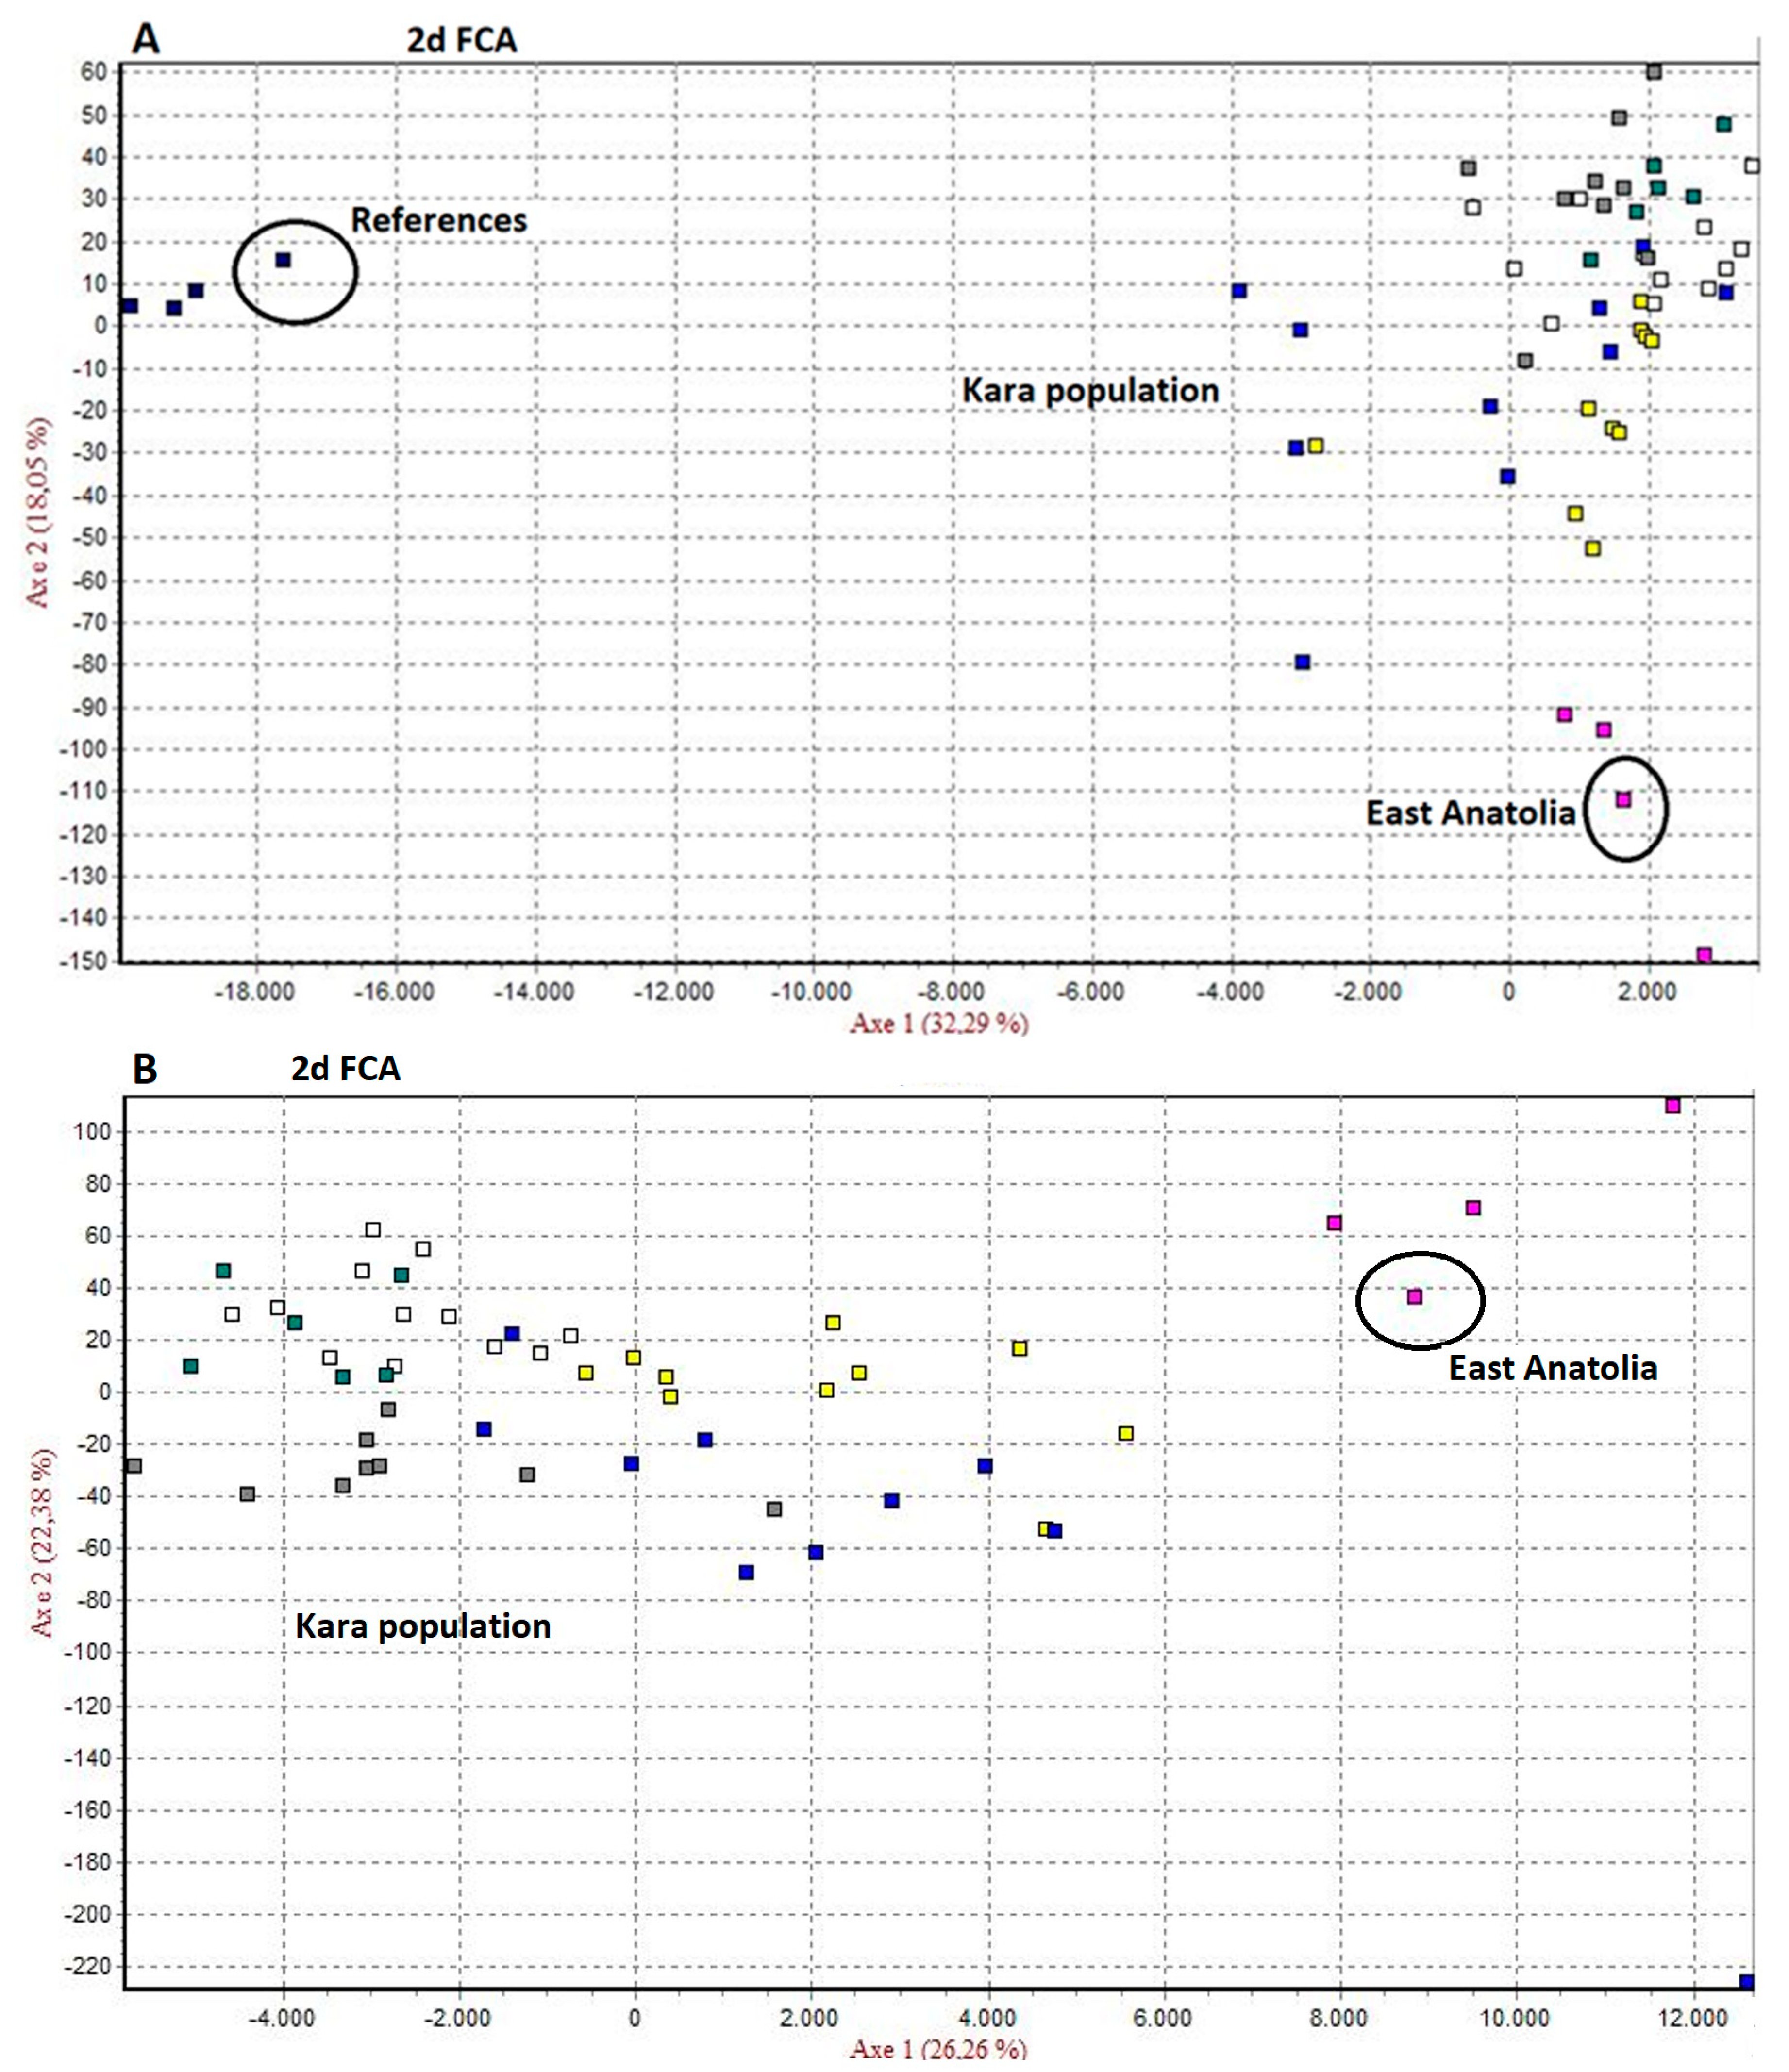
3.2.1. Genetic Relations among the Kara Grape Cultivars

In this study, four synonymous (identical genotypes called by the different names) and five homonymous (different genotypes called by the same name) cases were determined. However, no identical (same names and same SSR profiles) cases were found in the study. The similarity cases detected in 49 Kara grape cultivars are shown in Table 2.
In comparison with the European Vitis database (www.eu-vitis.de (accessed on 15 May 2021)) and Vitis International Variety Catalogue VIVC (www.vivc.de (accessed on 10 June 2021)), it was found that one cultivar (Siyah Üzüm, List no: 17) was synonymous with the “Muscat Hamburg” cultivar originating in the United Kingdom (Variety number VIVC: 8226, Accession number: DEU098-1980-274).

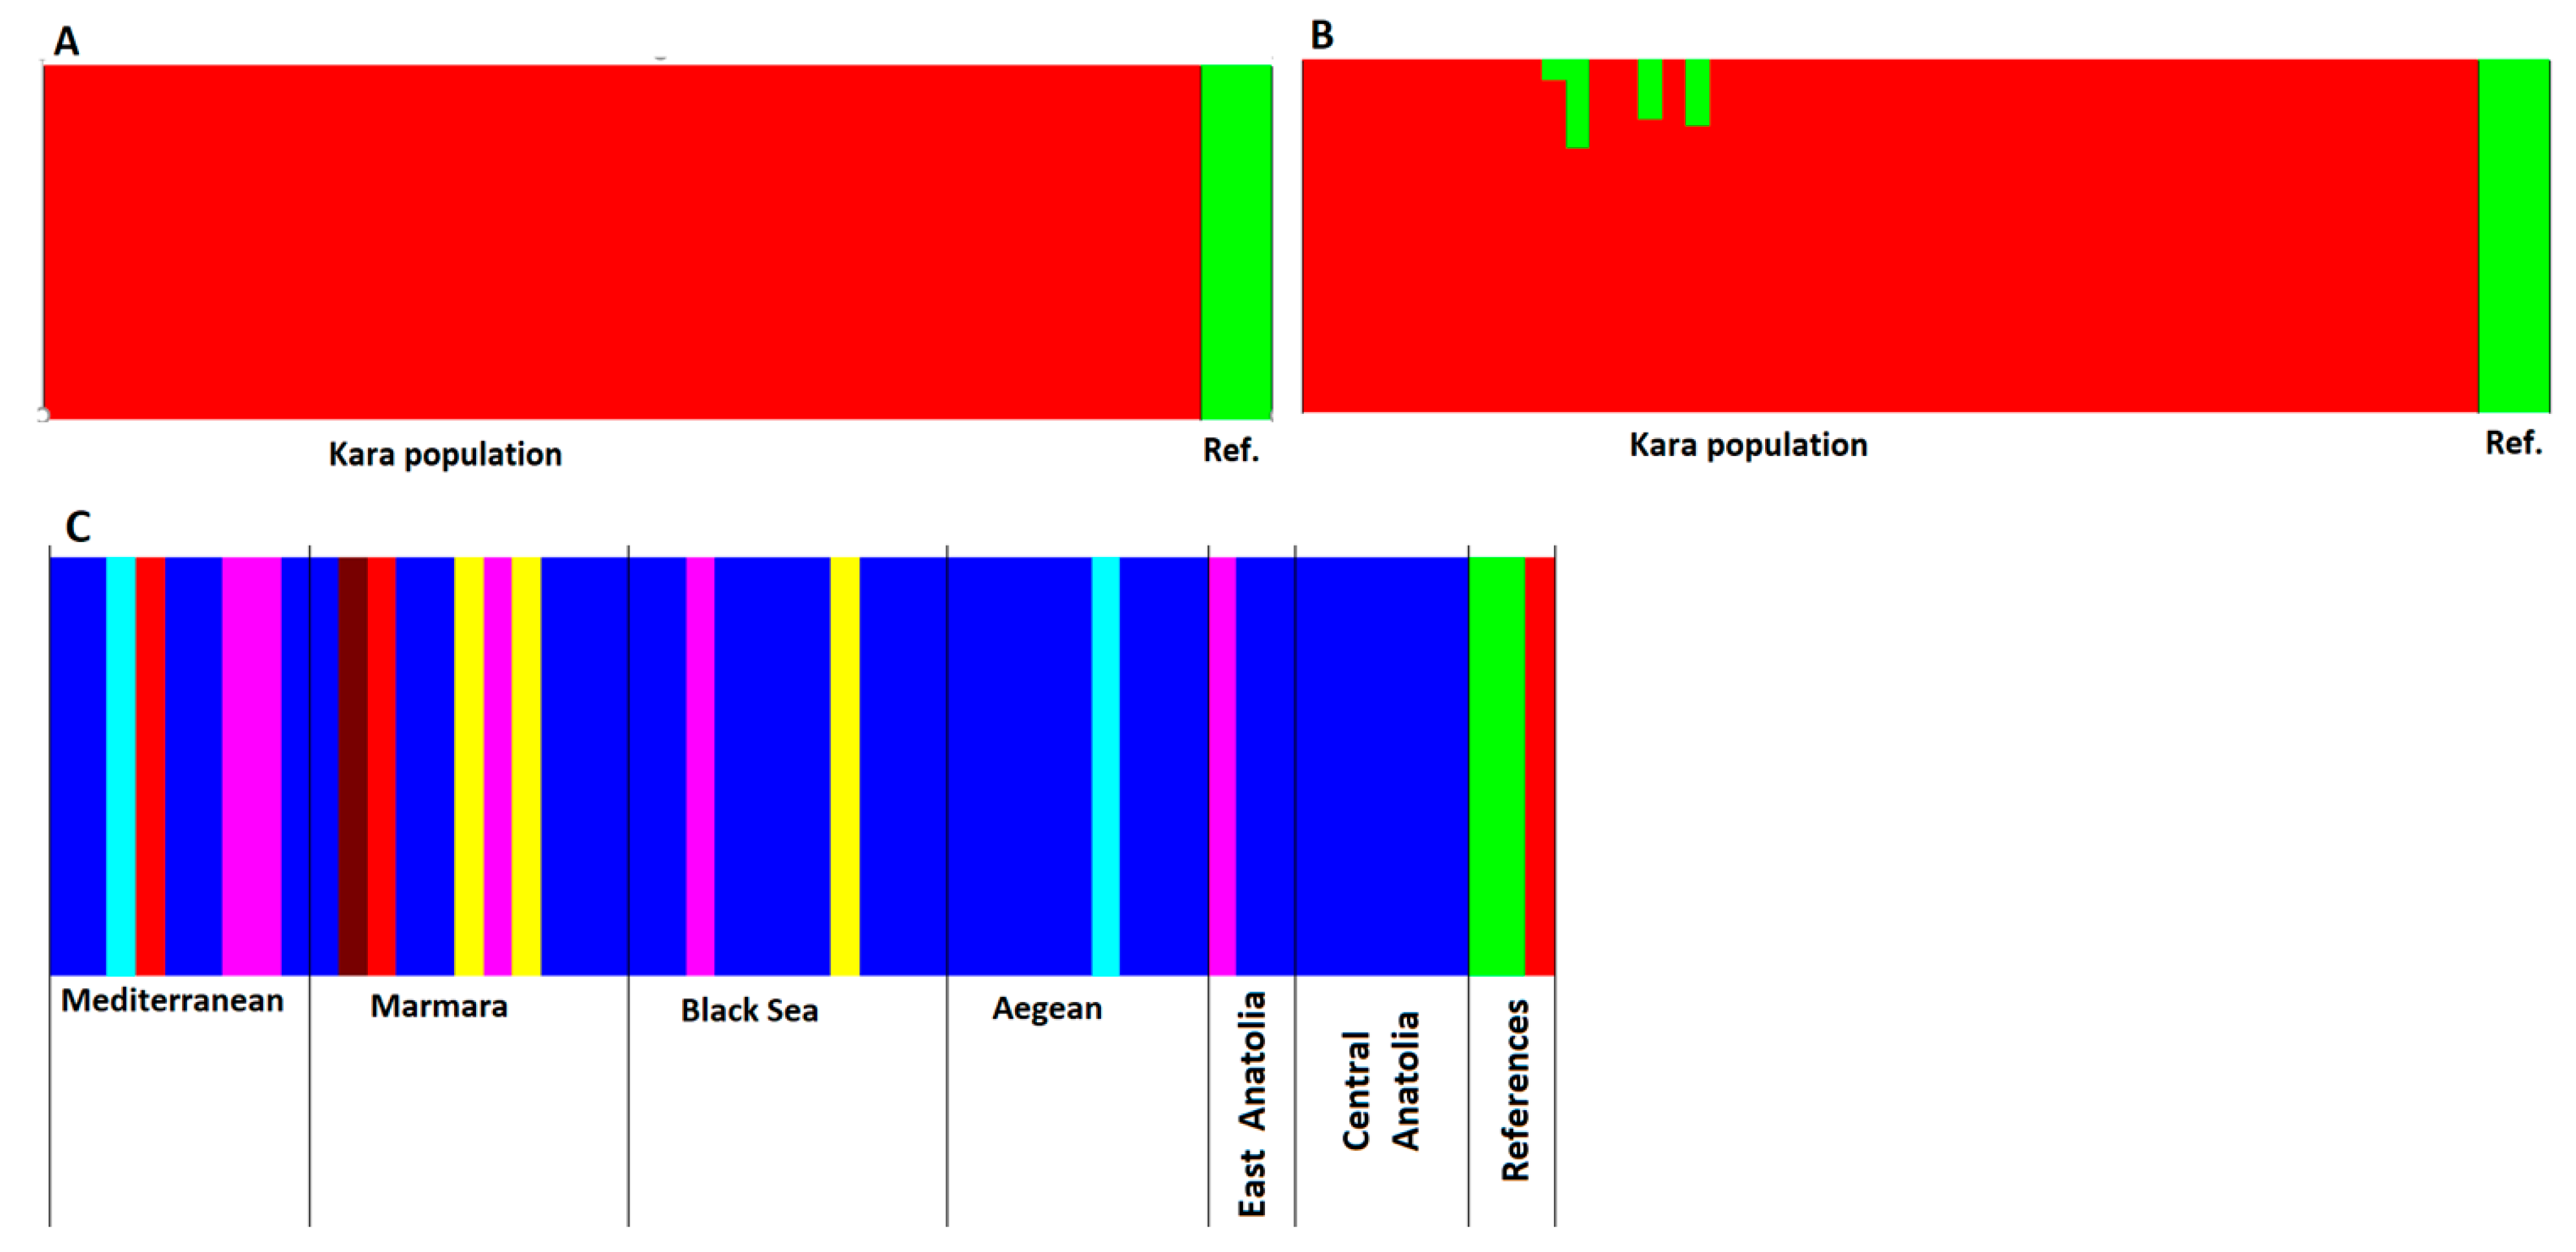
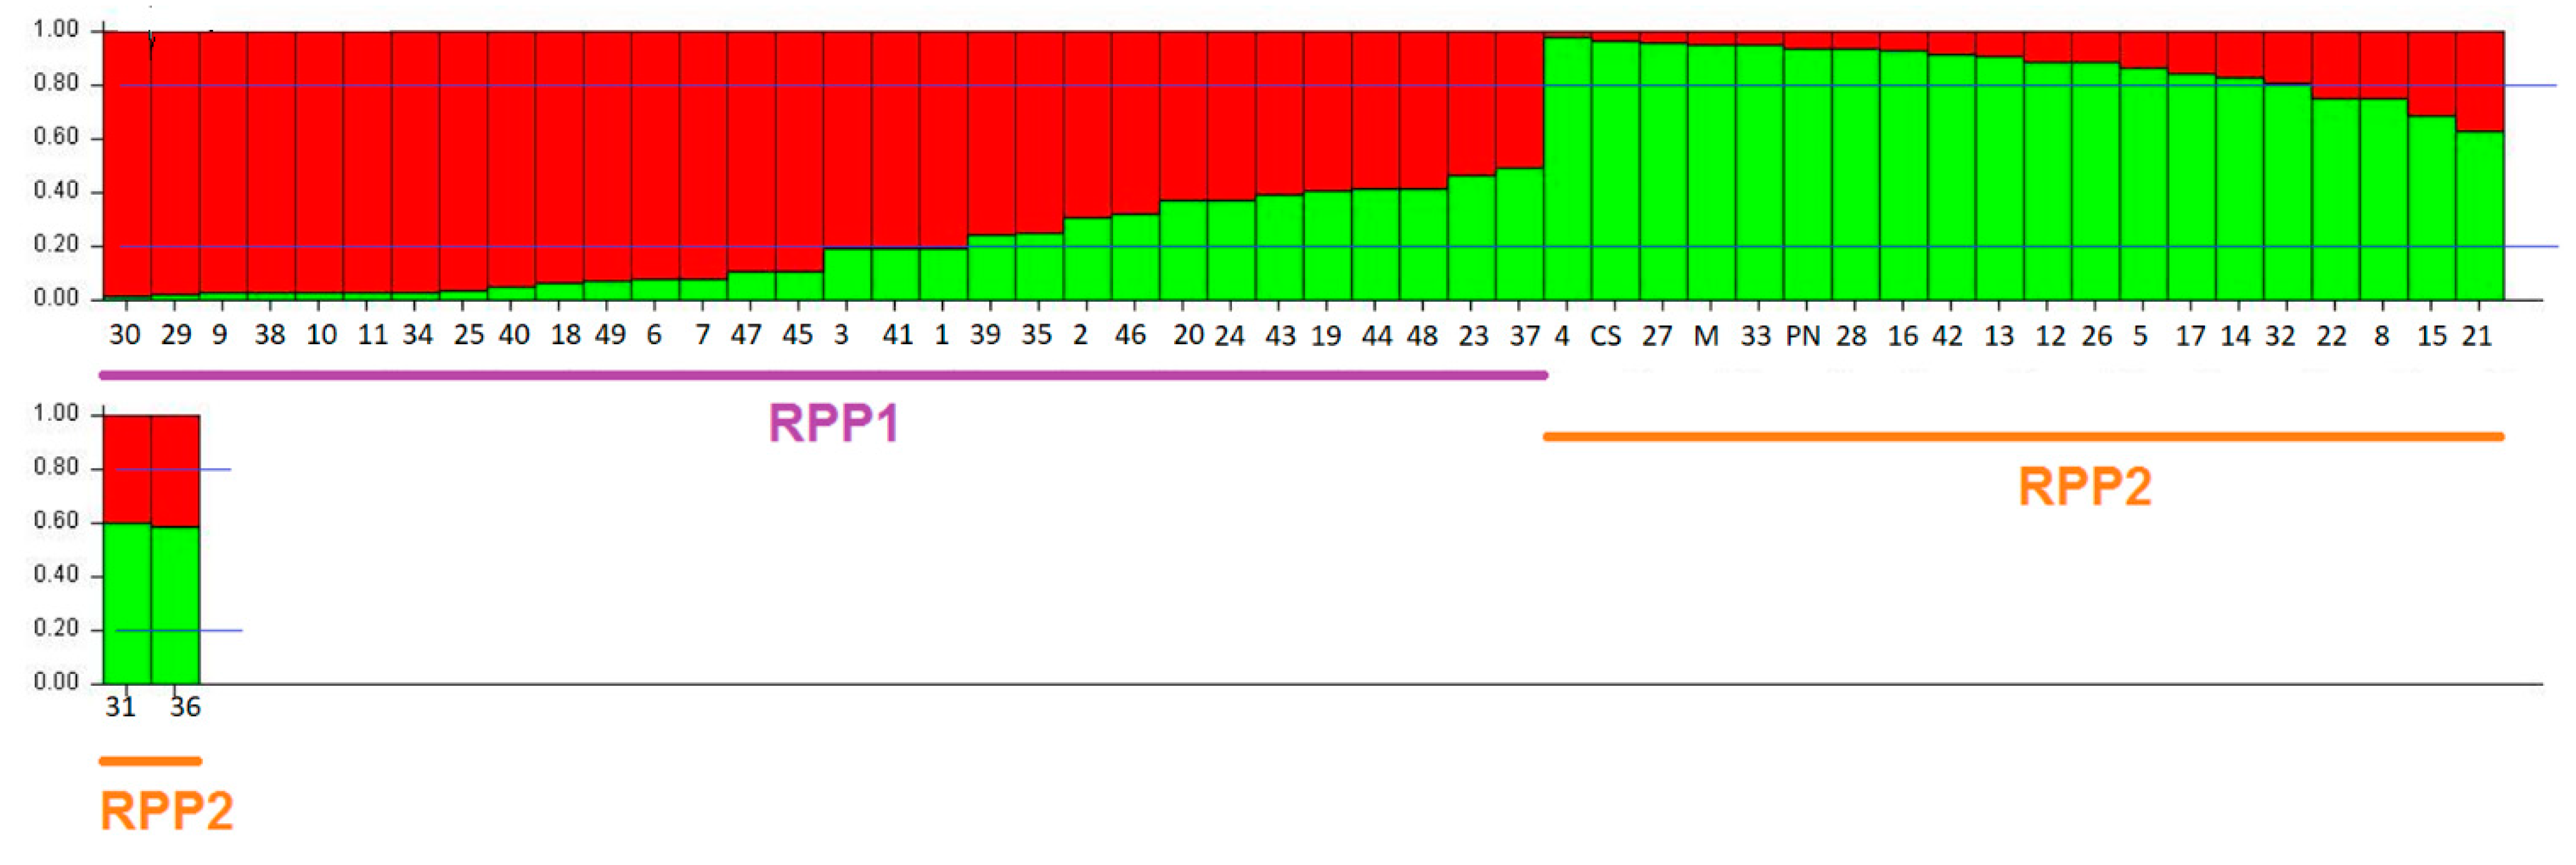
3.2.2. Genetic Structure Analysis among Kara Sub-Populations

The expected (Hexp) and observed (Hobs) heterozygosity values considering all sub-populations are presented in Table 3. Among the Kara grape sub-populations, the highest mean number of alleles was observed in the Marmara sub-population (6.72), while the lowest one was observed in the East Anatolia sub-population (3.31). However, Hexp and Hobs values were found to be approximately close to each other in all Kara sub-populations (~0.700) except East Anatolia, Central Anatolia and reference sub-populations (Table 3).
The Kara grape cultivars and reference (PN-CS-M) population were divided into two groups in the factorial correspondence analysis (FCA) (Figure 5A). In the FCA analysis of seven sub-populations, it was seen that the reference cultivars and the East Anatolia cultivars emerged as separate groups, while the remaining cultivars formed a cluster (Figure 5B).
In the Bayesian population structure (BAPS) analysis, similarly to the FCA, the Kara grape population and reference population were clearly separated from each other (Figure 6A). In the BAPS analysis based on individuals (as six sub-populations and one reference population) (Figure 6B), it was observed that the Kara sub-populations were admixed to some extent (Figure 6B). In the BAPS analysis based on individuals and populations, all sub-populations except Central Anatolia were found to be highly admixed with each other (Figure 6C).
Genetic distance values are given in Table 4. The reference population had high genetic distance values relative to the Kara sub-populations. Excluding the reference population, the highest genetic distance values among the Kara sub-populations were observed between the East Anatolia and Aegean populations (0.478), and between the Central Anatolia and East Anatolia (0.470) populations. The lowest genetic distance values were recorded between the Black Sea and Marmara populations (0.147), and between the Black Sea and Mediterranean (0.149) populations.
The genetic differentiation (Fst) values and gene flow (Nm) values are given in Table 5. Fst values among sub-populations were moderate, and the East Anatolia sub-population showed especially significant genetic differentiation with the Aegean (0.087, p < 0.001) and Central Anatolia (0.084, p < 0.05) sub-populations. Table 5 also indicates that the reference population showed significant genetic differentiation with the Central Anatolia (0.147, p < 0.05) and Aegean (0.122, p < 0.05) sub-populations. The Fst values explain the high Nm among the sub-populations. The gene flow (Nm) between Kara sub-populations and the reference population is extremely limited, and the highest Nm value (4.08) was observed between the reference and Marmara populations. Among Kara sub-populations, the highest Nm value (84.93) was observed between the Marmara and Black Sea sub-populations, and the lowest Nm value (2.28) was observed between the Central Anatolia and East Anatolia sub-populations (Table 5).
The structural analysis of the whole dataset of Kara grape cultivar sub-populations reached a maximum K value at K = 2, as estimated by STRUCTURE-HARVESTER, which corresponds to two main groups (RPP1 and RPP2) of genotypes (Figure S1). Reconstructed panmictic populations were realized based on the Bayesian model-based clustering methods. We also calculated the number of genotypes strongly assigned to each of the two RPPs based on the qI (probability of membership) probabilities greater than 80%. The RPP distribution of the cultivars (individuals) is given in Figure 7.
Overall, results showed that 34 (65%) genotypes were assigned to each RPP with higher than 80% probability, and 35% either did not belong to the representative RPPs or showed a low probability of membership. Table 6 summarizes the results of membership probabilities and the representative populations that formed the RPPs. All members of the reference and East Anatolia sub-populations were grouped in RPP2, and all members of the Central Anatolian sub-population were grouped in RPP1. All other sub-population genotypes were seemingly admixed and were grouped in both RPP1 and RPP2.

3.2.3. Clonal Analysis

In the MLG analysis, except for three reference cultivars, 12 different multi-locus genotypes (MLGs) were determined, while 37 unique genotypes were detected. According to the distribution of the sub-populations, the highest MLG number was determined as 3 in the Marmara sub-population, while the lowest was 1 in East Anatolia. The number of different alleles (Na) was highest in the Marmara (Na: 6.72) and Black Sea (Na: 5.95) sub-populations, in direct correlation with the sub-population number (Table 7).
Effective alleles (Ne) ranged from 2.75 (East Anatolia) to 4.44 (Marmara) among sub-populations, and Ho values were found to be greater than uHe values in the same sub-population comparisons (except for Mediterranean and Marmara sub-populations). The highest private alleles summary (PAS) value was found in Marmara, with 17 alleles at 15 different SSR loci, and the lowest PAS value was found in Central Anatolia, with 1 allele at 1 SSR locus; no correlation was shown between PAS values and the sub-population number (Table 7).
Considering the clonal diversity values, it was seen that all accessions of the East Anatolia, Mediterranean and Black Sea sub-populations were unique genotypes. Genotypic diversity (div) values, also known as expected heterozygosity, were found to be similar to each other (approximately 0.9) in all sub-populations, while the evenness (eve) value, which shows the distribution profiles of individuals within the sub-population, had the lowest amount in the Aegean (0.920) sub-population (Table 8).
The highest evenness value was observed in East Anatolia (1.00), Mediterranean (1.00) and Black Sea (1.00), which reflects the equal frequency of all genotypes in these sub-populations. The Shannon–Wiener (shw) value was found to be higher (1.041) in the Black Sea sub-population compared to other populations, and this value shows that this population has a high diversity (Table 8).
In the multi-locus lineages (MLLs) analysis, it was determined that there were some small differences in the number of different MLLs, especially between T = 0 and T = 3 threshold values, and only one match difference occurred between T = 1 and 2.
There was no difference in the number of MLLs between T = 2 and 3. For this reason, results for T = 2 were considered as the threshold value, and a total of three clones were detected. Detailed information (accession name, accession no, etc.) of the clones determined in the T = 2 threshold value are given in Table 9.

4. Discussion

4.1. OIV Data Analysis

Similar to the results of previous investigations [48,49,50], the highest correlations were observed between traits of the same category (i.e., leaf and berry traits). In this sense, the characters OIV 66-2 (Mature leaf: length of vein N2) and OIV 66-3 (Mature leaf: length of vein N3) were the most strongly correlated descriptors, and showed similar variations in different accessions. The other correlation was seen between OIV 221-1 (Berry length) and OIV 221-2 (Berry width) properties and OIV 503 (Single berry weight); this showed that the single berry weight is more strongly related to the length of the berry. Additionally, a high correlation between OIV 242-1 (Length of berry seed) and OIV 243 (Weight of berry seed) descriptors was detected. Previously, Lamine et al. [51], in a multivariate analysis and clustering of Tunisian autochthonous grapes, reported that OIV 225 (color of the berry skin) and OIV 230 (color of the berry flesh) descriptors were the most strongly correlated characters in terms of fruit characteristics, and characters OIV 079-1 and OIV 079-2 were the most strongly correlated descriptors in terms of leaf characteristics. In fact, morphological markers have a higher degree of genomic coverage and most individual phenotypic markers are multigenic [51]. Morphological investigations of grapevine have previously been carried out by Lamine et al. [51] and Khalil et al. [52].
Shoot, leaf and berry descriptors have been generally used as powerful tools for discrimination of grapevine cultivars. The number of shoot descriptors (n = 4) in our study was not enough to separate grapevine cultivars. The number of leaf descriptors used in this work (n = 25) was higher than those reported previously by Sabir et al. [53], who used 12 descriptors, Khalil et al. [52], who used 9 descriptors, Dilli et al. [54], who used 22 descriptors, and Knezović et al. [55], who used 7 descriptors. Furthermore, nine ampelographic descriptors were evaluated for berry characterization in this study, and the highest amount of variation was attained by berry descriptors. The number of descriptors in the studies by Dilli et al. [54], Knezović et al. [55] and Khalil et al. [52] was 12, 15, 4 and 9, respectively.
Finally, in order to determine the table cultivars of grape, the berry shape variable, representing the most independent variance segment, was selected, along with the variables of berry weight, berry seed weight, berry length and berry width. These traits are important both for the consumer and producers in terms of berry size, seed size and berry shape [52]. As a result, considering the above characteristics, the cultivars Kara üzüm (List no: 16), Acı kara (List no: 18), İyi Bağ Karası (List no: 28) and Sofra Karası (List no: 33) were identified as table grapes, due to the high (5.1 g) or very high (6.3 g or more) weight of their berries, their small seeds (35–50 mg), the berry length (21.5–25 mm or more), berry width (17.5–21.0 mm) and cylindrical and elliptic shapes. In addition, the cultivars Pat kara (List no: 20) and Patlak kara (List no: 45), with the above specifications in the size of berry, but with a roundish berry shape, were among the special table cultivars. Kara üzüm (List no:26), from Kırklareli (Marmara sub-population), has a berry with colored flesh, and so could be a suitable candidate for use in the fruit juice industry. All cultivars had blue and black berry skin. In table cultivars, a deep red to dark purple color is preferred to light-colored selections, and a round to oval shape and a strong Muscat flavor are welcomed [56].
Doligez et al. [57] indicated the lack of co-localization between QTLs for berry and seed traits, suggesting that the genetic control of both traits may be partly dissociated. In this sense, direct correlation between seed traits and berry traits, like berry dimensions, were not observed. This is in accordance with the findings of Khalil et al. [52].

4.2. SSR Analysis

In this study, the number of different alleles for 22 SSR was 196, ranging from 4 (VVIB01) to 13 (VMC2H4) per locus. The VMC2H4 locus has been shown among the loci with high allele numbers [28,58], and previous studies also showed that the VVS2 locus [58,59,60] and VVMD28 locus [58,59,61] were among the most informative loci (Table 1). Furthermore, the VVIB01 locus has been used in genetic diversity studies of grapevine accessions from Southeast [62] and Eastern Turkey [63], and also the genetic identification and characterization of Armenian grapevine cultivars [60], in which it showed the lowest allele number among the loci. In this study, the VVIB01 locus, with four alleles, involved the lowest number of alleles, showing similar results to those of previous studies.
Given that the average number of alleles in each locus is influenced by the number of samples and the number of examined loci, this amount varies from 5 to 20 in different analyses [13,60,64], similar to our study (average number of alleles: 8.91, Table 1). This value was found to be 5.75 by Eyduran et al. [63] in the genetic characterization of autochthonous grapevine cultivars from Eastern Turkey, whereas it was recorded as 20.95 by Riaz et al. [61] in accessions from around the Mediterranean basin and Central Asia.
Ho is the proportion of heterozygous individuals in the analyzed sample; expected heterozygosity (He) or genetic diversity shows the percentage of the population that would be heterozygous if an accidental cross occurred between individuals. The highest amount of Ho was found in locus VMC2H4 and VrZAG62, implying high genetic diversity in the mentioned SSR loci. Additionally, the average Ho value (0.73) obtained in this survey for the Kara grape population was found to be very similar to average values for East Anatolia grapes (0.71, 0.75 and 0.73) [62,63,65], to Armenian grapevine cultivars (0.74) [60] and also to Mediterranean basin and Central Asian cultivars, which had an average of 0.74 [61]. Moreover, the high average value of heterozygosity (Table 3) may be seen by the high number of crosses in the variety set and random pollination, which is consistent with findings from previous studies [66].

4.3. Genetic Relations among the Kara Grape Cultivars

There are over 10,000 cultivars of grapes in the world, and the grouping of these cultivars is mostly confused due to homonymous, synonymous, limited or inaccurate historical information, etc. [67]. In this study, which might contribute to the conservation of national genetic resources, four synonymous and five homonymous cases were found as a result of SSR analysis. The synonymous cultivars were Patlak Kara (List no: 45) and Siyah Üzüm (List no: 47), from Sivas and Yozgat provinces, respectively; Deli Kara (List no: 3) and Yerli Kara (List no: 41) from Balıkesir and Sakarya provinces, respectively; and Eski Kara (List no: 11) and Yerli Kara (List no: 34) from Denizli and Muğla, respectively. These cultivars are from the same region, but some of their morphological characteristics (Table S2) are different. Siyah Üzüm (List no: 12) and Kara Üzüm (List no: 26) from the synonymous cultivars were collected from Diyarbakır (East Anatolia sub-population) and Kırklareli (Marmara sub-population) provinces, respectively, and also gave different morphological results in some traits from separate regions. In this case, it can be concluded that the same cultivar has incorrectly been nominated by a different name. Furthermore, the fact that these cultivars are taken from different places with similar morphological data supports their synonymous cases.
Kara Üzüm (List no: 1), Kara Üzüm (List no: 15), Kara Üzüm (List no: 16), Kara Üzüm (List no: 23), Kara Üzüm (List no: 25) Kara Üzüm (List no: 26) and Kara Üzüm (List no: 49) were found to be homonymous cultivars. All homonymous cultivars were collected from different provinces, and there was no relationship between them (Table 2 and Table S1). The fact that homonymous cultivars are not the same could be caused by incorrect nominating. In addition, variations (clones, types, etc.) of each variety could occur over time. Molecular studies have shown that the majority of homonymous cultivars are clonal variations [68], and these findings support our results.
The highest similarity ratio among cultivars was found to be 95.5% between Kokulu Kara (List no: 5) and Siyah Üzüm (List no: 17) and between Siyah Üzüm (List no: 29) and Yerli Siyah (List no: 30) cultivars. Kokulu Kara (List no: 5) and Siyah Üzüm (List no: 17) were different from each other in one allele of the VVMD7 locus, and Siyah Üzüm (List no: 29) and Yerli Siyah (List no:30) were different from each other in one allele of the VVMD28 locus. However, the Kokulu Kara (List no: 5) and Siyah Üzüm (List no: 17) cultivars have relatively different morphological features, and they are quite different in terms of their sampling place. On the other hand, morphological data in the Siyah Üzüm (List no: 29) and Yerli Siyah (List no: 30) cultivars support the genetic data (genetic similarity. These two cultivars were collected from the same location and are morphologically separated from each other only in berry shape (Table S1).
Except for the examples mentioned above, the highest similarity ratio was found to be 75% in Kara Üzüm (List no: 23) and Sıkkara (List no: 24) cultivars, while they differed in 11 loci. Moreover, the regions from which these two cultivars were collected were the same, their maturation dates were close to each other and they were similar in terms of other morphological characteristics. (Table S2).
In this study, a relatively low similarity ratio was determined among the Kara grape cultivars. On the other hand, there was no direct correlation between the genetic relations (genetic similarity dendrogram) of the cultivars and the original cultivation regions. The genotypes belonging to six sub-populations (regions) show a nested distribution in the dendrogram, and the homonymous character in some cultivars is an indicator of a gene flow that occurs naturally or by transport in the regions in ancient times. This is supported by the results obtained in Table 5.

4.4. Genetic Structure Analysis among Kara Sub-Populations

Despite the large number of synonymous and clonal relationships among the accessions, we observed a high level of genetic variation. In the total germplasm collection, the average genetic diversity quantified by the expected heterozygosity (0.752) and the number of alleles in each locus (6.7) was higher for Marmara (Table 3). Likewise, the highest value of observed heterozygosity was revealed for the Central Anatolia and Marmara sub-populations (Table 3).
As shown in Table 5, Fst values that are significantly greater than zero indicate a deficiency of differentiation among these populations, probably as a consequence of genetic drift, gene flow, mating systems, selection, and mutations [69]. Previously, Ergül et al. [7] emphasized that limited genetic differentiations observed in Anatolian grape cultivars might be a reflection of the area’s long history of grape cultivation and material exchanges between provinces of Turkey. In this survey, the Nm value among Kara sub-populations ranged from 2.28 to an infinite amount, indicating a high degree of gene flow and continuous distribution of genes, and also limited differentiation between sub-populations (Table 5). On the other hand, as expected, the highest levels of pairwise genetic differentiation values were observed between Anatolian grapes and the reference populations (PN-CS-M), which is in accordance with Yılmaz et al. [32].
Genetic distances and genetic similarities are two important parameters to measure when assessing the genetic diversity of the population. Results of genetic distance (genetic similarity, %) between populations based on Nei [46] revealed that Kara grape sub-populations of the Aegean and East Anatolia regions were the least genetically similar (52.2%), with a maximum genetic distance (0.478) (Table 4). Among these, the minimum genetic distance (0.147) was found between Black Sea and Marmara regions.
To understand the effect of geographic distance on genetic structure, genetic distances among studied populations were examined and the results showed that the genetic distance was not exactly correlated with the geographic distance, suggesting that the geographic distance is not the principal factor influencing genetic differentiation among the Kara sub-populations of Turkey. For instance, these results showed that the genetic relationship of Mediterranean germplasm with Marmara germplasm was close. These results are consistent with a long history of cultivation and increased selection pressure by humans for Kara cultivars. In addition, the East sub-population was found to have the most genetic distance with other groups.
It is accepted that, the consequences of gene introgression from sympatric populations are strongly dependent on the extent of gene flow. In the Bayesian analysis of population structure, the results showed that genotypes similar to the reference cultivars were found in sub-populations, and also similar genotypes were seen between different regions (Figure 6C). When the same data was analyzed collectively, it is clear that the sub-population with the most different genotypes is Marmara, whereas the Central region was found to be a non-admixing region. In FCA analysis, dispersion in Marmara is also clearly seen. According to the BAPS results, this indicates the introgression of genes from different regions to this region, while they were least similar to those from the Eastern and reference accessions. Nevertheless, the highest genetic distance was observed between Anatolian and reference accessions, which is consistent with the results of Wang et al. [70], who showed that Cabernet Sauvignon and Merlot were clustered together in a discrete cluster separately from the remaining local Anatolian cultivars. A high population differentiation value was observed between the grapes from East Anatolia region and the reference cultivars (0.815). High differentiation values were observed between Anatolian and reference cultivars (PN-CS-M), which could be explained by factors such as geographic isolation, variety evolution, and restricted gene flow.
As mentioned in the BAPS analysis, genotypes similar to reference cultivars (PN-CS-M) were also found in sub-populations, and similar genotypes were seen among different regions. This structure was not influenced by geography with an Eastern–Western gradient and human usage factor, as already identified by Laucou et al. [71] using 10 K genome-wide SNPs (Single nucleotide polymorphisms). Additionally, the large number of genotypes (40%) remained in a large admixed group. This could be due to several factors, such as: (i) the low genetic differentiation [72]; (ii) a departure from the underlying assumptions of the Bayesian model (random mating population), which are probably not met in this cultivated grape population; (iii) true admixing in some cultivars if they are directly descended from spontaneous or man-made crosses between parents belonging to separate ancestral groups; and finally (iv) a computational difficulty for STRUCTURE to assign individuals to groups in the presence of a large number of informative markers [71].

4.5. Clonal Analysis

In viticulture, it is known that grape cultivars usually consist of separate clones sharing common phenotypic characteristics which are grouped as a cluster of cultivars. Clonal polymorphism within perennial species is mainly accepted to be associated with naturally occurring mutations during plant growth [73]. However, if clones belonging to a cluster have sufficiently different characteristics, they are considered different cultivars. Therefore, these clones, which are morphologically very similar, are very difficult to distinguish by visual observation [74]. On the other hand, SSR markers have frequently been used in clone analysis of different plant species in recent years, as they are highly informative about the level of heterozygosity between and within grapevine cultivars [75,76,77,78].
In the analysis of 70 Italian grape genotypes with 13 SSR markers, 39 unique genotypes were determined, while in our study [78], interestingly, 46 unique genotypes were determined among 49 grapevine cultivars belonging to six different regions (sub-populations). On the other hand, in the analysis performed with 11 SSR markers on 164 Cypriot indigenous grape genotypes, a total of 83 multi-locus genotypes (MLGs) were identified [77]. In this study, however, 12 MLGs were determined, which could be attributed to the fact that the genotypic abundance feature associated with the number of MLGs in genotypes is slightly lower, despite the different sub-populations.
Heterozygosity values (uHe and Ho) determined in MLG analysis provide information about the genetic diversity and relationships between multi-locus genotypes [79]. In our study, unbiased expected heterozygosity (uHe) and observed heterozygosity (Ho) values were found to be very close to each other and both heterozygosity values were found to be more than 0.66 in all six populations in MLG analysis. This situation reveals that there might be possible genetic variation among multi-locus genotypes in each population [79].

5. Conclusions

Anatolia (Turkey) is among the most important countries in the world in terms of vineyard areas and grape production due to the suitability of climatic and growing conditions. In addition, Turkey, as one of the countries wherein Vitis vinifera L. was first cultivated, possesses a rich grapevine gene potential that has emerged over time through natural hybridization.
In this study, ampelographic analysis of 49 Kara grapevine germplasms (from six different regional sub-populations), which have high antioxidant content and also economic importance, was performed with 39 OIV descriptors. Genetic characterization and population structure analysis were also carried out using 22 SSR markers. As a result of OIV analysis, it was determined that especially OIV 223 (Berry: shape) and OIV 004 (Young Shoot: density of prostrate hairs on tip) were the defining features in the Kara grape OIV dendrogram. In the PCA analysis, a clear grouping profile was not determined among the Kara grape sub-populations.
As a result of SSR analysis, the high number of homonyms and the low number of detected clones and synonyms reveals the genetic richness of the Kara grape germplasm. Among the sub-populations, the East Anatolia sub-population especially differed from other sub-populations according to FCA and genetic distance analysis, while the Central Anatolia sub-population showed a homogeneous profile in the BAPS analysis. It is useful to screen the detected clonal genotypes with SNP-level techniques such as GBS (Genotyping-by-Sequencing).
Evaluation of the genetic diversity in grape germplasms is of great importance in terms of improving quality traits of interest and identifying gene sources. In this sense, it is thought that the data from this study will contribute to genetic characterization, genetic protection and different breeding programs in grapes.

Supplementary Materials

The following supporting information can be downloaded at: https://www.mdpi.com/article/10.3390/horticulturae9070743/s1, Table S1: Some ampelographic characteristics and original collection locations of Kara grape accessions used in this study, Table S2: Information related to OIV descriptors (characteristic description) and OIV data codes, Table S3: SSR loci information (SSR locus name, primer sequence (F: forward primer, R: reverse primer) and references) [25,26,27,28,29], Figure S1: Population structure of predefined Kara grape sub-populations based on 22 SSR data (A). The graph showing the best K value as 2 (the highest peak) (B). Reconstructed panmictic populations (RPPs) groups general distribution (C).

Author Contributions

Conceptualization, N.A. and A.E.; methodology F.Y.B. and C.Y.Ö.; data curation, N.H., C.Y.Ö., O.E. and T.U.; writing—original draft preparation, N.A. and F.Y.B.; writing—review and editing, N.H.; provided plant collections, O.E., T.U. and A.S.Y.; supervision, A.E.; formal analysis Y.B.; investigation, Y.S.K. and C.Ö.; visualization C.Ö., Y.S.K. and A.S.Y. All authors have read and agreed to the published version of the manuscript.

Funding

This study was supported by the Scientific and Technical Research Council of Turkey (TUBITAK) (Grant No. 105 G 078). A portion of the current study was conducted as thesis of the first author.

Data Availability Statement

All data are included in the manuscript.

Conflicts of Interest

The authors declare no conflict of interest.

References

  1. Ekhvaia, J.; Akhalkatsi, M. Morphological variation and relationships of Georgian populations of Vitis vinifera L. subsp. sylvestris (C.C. Gmel.). Hegi. Flora-Morphol. Distrib. Funct. Ecol. Plants 2010, 205, 608–617. [Google Scholar] [CrossRef]
  2. Naqinezhad, A.; Ramezani, E.; Djamali, M.; Schnitzler, A.; Arnold, C. Wild grapevine (Vitis vinifera subsp. sylvestris) in the Hyrcanian relict forests of northern Iran: An overview of current taxonomy, ecology and palaeorecords. J. For. Res. 2018, 29, 1757–1768. [Google Scholar] [CrossRef] [Green Version]
  3. da Silva Haas, I.C.; Toaldo, I.M.; de Gois, J.S.; Borges, D.L.; de Oliveira Petkowicz, C.L.; Bordignon-Luiz, M.T. Phytochemicals, monosaccharides and elemental composition of the non-pomace constituent of organic and conventional grape juices (Vitis labrusca L.): Effect of drying on the bioactive content. Plant Foods Hum. Nutr. 2016, 71, 422–428. [Google Scholar] [CrossRef] [PubMed]
  4. Glevitzky, I.; Dumitrel, G.A.; Glevitzky, M.; Pasca, B.; Otrisal, P.; Bungau, S.; Cioca, G.; Pantis, C.; Popa, M. Statistical analysis of the relationship between antioxidant activity and the structure of flavonoid compounds. Rev. Chim. 2019, 70, 3103–3107. [Google Scholar] [CrossRef]
  5. Taymaz, E.R.; Uslu, M.E. Investigation and Determination of the Presence of Resveratrol in the Leaves of 99 Grapevine Varieties from the Western Anatolia Region in Turkey. JMPB 2022, 1, 1–8. [Google Scholar]
  6. Arroyo-García, R.; Ruiz-García, L.; Bolling, L.; Ocete, R.; López, M.A.; Arnold, C.; Ergul, A.; Söylemezoğlu, G.; Uzun, H.I.; Cabello, F.; et al. Multiple origins of cultivated grapevine (Vitis vinifera L. ssp. sativa) based on chloroplast DNA polymorphisms. Mol. Ecol. 2006, 15, 3707–3714. [Google Scholar] [CrossRef] [PubMed] [Green Version]
  7. Ergül, A.; Perez-Rivera, G.; Söylemezoğlu, G.; Kazan, K.; Arroyo-Garcia, R. Genetic diversity in Anatolian wild grapes (Vitis vinifera subsp. sylvestris) estimated by SSR markers. Plant Genet. Resour. 2011, 9, 375–383. [Google Scholar] [CrossRef]
  8. Samah, M.I.; Sahar, S.A.S.; Khaled, A.S.; Hoda, M.H.A. Phenolic compounds and antioxidant activity of white, red, black grape skin and white grape seeds. Life Sci. J. 2012, 9, 3464–3474. [Google Scholar]
  9. Nadeem, M.A.; Nawaz, M.A.; Shahid, M.Q.; Doğan, Y.; Comertpay, G.; Yıldız, M.; Hatipoğlu, R.; Ahmad, F.; Alsaleh, A.; Labhane, N.; et al. DNA molecular markers in plant breeding: Current status and recent advancements in genomic selection and genome editing. Biotechnol. Biotechnol. Equip. 2018, 32, 261–285. [Google Scholar] [CrossRef] [Green Version]
  10. Vezzulli, S.; Doligez, A.; Bellin, D. Molecular Mapping of Grapevine Genes. In The Grape Genome. Compendium of Plant Genomes; Cantu, D., Walker, M., Eds.; Springer: Cham, Switzerland, 2019; pp. 103–136. [Google Scholar]
  11. Upadhyay, A.; Saboji, M.D.; Reddy, S.; Deokar, K.; Karibasappa, G.S. AFLP and SSR marker analysis of grape rootstocks in Indian grape germplasm. Sci. Hortic. 2007, 112, 176–183. [Google Scholar] [CrossRef]
  12. Meneghetti, S.; Costacurta, A.; Morreale, G.; Calò, A. Study of intra-varietal genetic variability in grapevine cultivars by PCR-derived molecular markers and correlations with the geographic origins. Mol. Biotechnol. 2012, 50, 72–85. [Google Scholar] [CrossRef]
  13. Jahnke, G.; Májer, J.; Varga, P.; Szőke, B. Analysis of clones of pinots grown in Hungary by SSR markers. Sci. Hortic. 2011, 129, 32–37. [Google Scholar] [CrossRef]
  14. Huang, H.; Lu, J.; Ren, Z.; Hunter, W.; Dowd, S.E.; Dang, P. Mining and validating grape (Vitis L.) ESTs to develop EST-SSR markers for genotyping and mapping. Mol. Breed. 2011, 28, 241–254. [Google Scholar] [CrossRef] [PubMed] [Green Version]
  15. Emanuelli, F.; Lorenzi, S.; Grzeskowiak, L.; Catalano, V.; Stefanini, M.; Troggio, M.; Myles, S.; Martinez-Zapater, J.M.; Zyprian, E.; Moreira, F.M.; et al. Genetic diversity and population structure assessed by SSR and SNP markers in a large germplasm collection of grape. BMC Plant Biol. 2013, 13, 39. [Google Scholar] [CrossRef] [Green Version]
  16. Kantartzi, S.K. (Ed.) Microsatellites Methods and Protocols, in Methods in Molecular Biology; Humana Press: Totowa, NJ, USA, 2013; Volume 1006. [Google Scholar]
  17. Tello, J.; Forneck, A. Use of DNA markers for grape phylloxera population and evolutionary genetics: From RAPDs to SSRs and beyond. Insects 2019, 10, 317. [Google Scholar] [CrossRef] [PubMed] [Green Version]
  18. Velasco, R.; Zharkikh, A.; Troggio, M.; Cartwright, D.A.; Cestaro, A.; Pruss, D.; Pindo, M.; FitzGerald, L.M.; Vezzulli, S.; Reid, J.; et al. A high quality draft consensus sequence of the genome of a heterozygous grapevine variety. PLoS ONE 2007, 2, e1326. [Google Scholar] [CrossRef] [Green Version]
  19. Stavrakaki, M.; Bouza, D.; Biniari, K. Differentiation of Greek grapevine cultivars (Vitis vinifera L.) based on the combination of ampelographic description and microsatellite markers. Genet. Resour. Crop. Evol. 2020, 67, 21–40. [Google Scholar] [CrossRef]
  20. Anonim. Descriptor for Grapevine (Vitis spp.); International Plant Genetic Resources Institute: Roma, Italy, 1997; p. 58. [Google Scholar]
  21. Hammer, Ø.; Harper, D.A.T.; Ryan, P.D. PAST: Paleontological Statistics Software Package for Education and Data Analysis. Palaeontol. Electron. 2001, 4, 9. [Google Scholar]
  22. Lefort, F.; Lally, M.; Thompson, D.; Douglas, G.C. Morphological traits microsatellite fingerprinting and genetic relatedness of a stand of elite oaks (Q. Robur L.) at Tuallynally, Ireland. Silvae Genet. 1998, 47, 257–262. [Google Scholar]
  23. Akçay, M.E.; Burak, M.; Kazan, K.; Yüksel, C.; Mutaf, F.; Bakir, M.; Ayanoğlu, H.; Ergül, A. Genetic analysis of Anatolian pear germplasm by simple sequence repeats. Ann. Appl. Biol. 2014, 164, 441–452. [Google Scholar] [CrossRef]
  24. Ergül, A.; Büyük, B.P.; Hazrati, N.; Yılmaz, F.; Kazan, K.; Arslan, N.; Özmen Yüksel, C.; Aydın Soydam, S.; Bakir, M.; Tan, N.; et al. Genetic characterization and population structure analysis of Anatolian figs (Ficus carica L.) by SSR markers. Folia Hortic. 2021, 33, 49–78. [Google Scholar] [CrossRef]
  25. Thomas, M.R.; Scott, N.S. Microsatellite repeats in grapevine reveal DNA polymorphisms when analyzed as sequence-tagged sites (STSs). Theor. Appl. Genet. 1993, 86, 985–990. [Google Scholar] [CrossRef]
  26. Bowers, J.E.; Dangl, G.S.; Meredith, C.P. Development and characterization of additional microsatellite DNA markers for grape. Am. J. Enol. Vitic. 1999, 50, 243–246. [Google Scholar] [CrossRef]
  27. Sefc, K.M.; Regner, F.; Turetshek, E.; Glössl, J.; Steınkellner, H. Identification of microsatellite sequences in Vitis riparia and their applicability for genotyping of different Vitis species. Genome 1999, 42, 367–373. [Google Scholar] [CrossRef] [PubMed]
  28. Goto-Yamamoto, N.; Mouri, H.; Azumi, M.; Edwards, K.J. Development of grape microsatellite analysis including oriental cultivars. Am. J. Enol. Vitic. 2006, 57, 105–108. [Google Scholar] [CrossRef]
  29. Merdinoglu, D.; Butterlin, G.; Baur, C.; Balthazard, D.J. Comparison of RAPD, AFLP and SSR (microsatellite) markers for genetic diversity analysis in Vitis vinifera L. Acta Hortic. 2000, 528, 193–197. [Google Scholar] [CrossRef]
  30. This, P.; Jung, A.; Boccacci, P.; Borrego, J.; Botta, R.; Constantini, L.; Crespan, M.; Dangl, G.S.; Eisenheld, C.; Ferreria-Montteiro, F.; et al. Development of a standard set of microsatellite reference alleles for identification of grape cultivars. Theor. Appl. Genet. 2004, 109, 1448–1458. [Google Scholar] [CrossRef]
  31. Maul, E.; Sudharma, K.N.; Kecke, S.; Marx, G.; Müller, C.; Audeguin, L.; Bosellı, M.; Boursiquot, J.M.; Bucchetti, B.; Cabello, F.; et al. The European Vitis Database (www.eu-vitis.de)—A technical innovation through an online uploading and interactive modification system. Vitis 2012, 51, 79–86. [Google Scholar]
  32. Yılmaz, F.; Shidfar, M.; Hazrati, N.; Kazan, K.; Yüksel Özmen, C.; Uysal, T.; Özer, C.; Yaşasın, A.S.; Söylemezoğlu, G.; Boz, Y.; et al. Genetic analysis of central Anatolian grapevine (Vitis vinifera L.) germplasm by simple sequence repeats. Tree Genet. Genomes 2020, 16, 55. [Google Scholar] [CrossRef]
  33. Wagner, H.W.; Sefc, K.M. Identity 1.0. Centre for Applied Genetics; University of Agricultural Science: Vienna, Austria, 1999. [Google Scholar]
  34. Bowcock, A.M.; Ruiz-Linares, A.; Tomfohrde, J.; Minch, E.; Kidd, J.R.; Cavalli-Sforza, L.L. High resolution of human evolutionary trees with polymorphic microsatellites. Nature 1994, 368, 455–457. [Google Scholar] [CrossRef]
  35. Minch, E.; Ruiz-Linares, A.; Goldstein, D.B.; Feldman, M.; Cavallisforza, L.L. Microsat (Version 1.4d): A Computer Program for Calculating Various Statistics on Microsatellite Allele Data; Stanford University: Stanford, CA, USA, 1995. [Google Scholar]
  36. Rohlf, F. NTSYS-pc: Numerical Taxonomy and Multivariate Analysis System; Version 2.1; Exeter Software: Setoukat, NY, USA, 2000. [Google Scholar]
  37. Excoffier, L.; Lischer, H.E.L. Arlequin suite ver 3.5: A new series of programs to perform population genetics analyses under Linux and Windows. Mol. Ecol. Resour. 2010, 10, 564–567. [Google Scholar] [CrossRef]
  38. Rohlf, F. NTSYS-pc: Numeric Taxonomic Systems; Version 2.20; Exeter Software, Applied Biostatistics Inc.: Setoukat, NY, USA, 2004. [Google Scholar]
  39. Belkhir, K.; Borsa, P.; Goudet, J.; Bonhomme, F. GENETIX, Logiciel sous Windows TM pour la Génétique des Populations; Laboratoire Génome et Populations, CNRS UPR 9060; Université de Montpellier II: Montpellier, France, 1998. [Google Scholar]
  40. Corender, J.; Marttinen, P.; Siren, J.; Tang, J. Enhanced Bayesian Modelling in BAPS software for learning genetic structure of populations. BMC Bioinform. 2008, 9, 539. [Google Scholar] [CrossRef] [Green Version]
  41. Pereira-Lorenzo, S.; Ramos-Cabrer, A.M.; Ferreira, V.; Díaz-Hernández, M.B.; Carnide, V.; Pinto-Carnide, O.; Rodrigues, R.; Velázquez-Barrera, M.E.; Rios-Mesa, D.; Ascasíbar-Errasti, J.; et al. Genetic diversity and core collection of Malus × domestica in northwestern Spain, Portugal and the Canary Islands by SSRs. Sci. Hortic. 2018, 240, 49–56. [Google Scholar] [CrossRef]
  42. Pritchard, J.K.; Stephens, M.; Donnelly, P. Inference of population structure using multilocus genotype data. Genetics 2000, 155, 945–959. [Google Scholar] [CrossRef] [PubMed]
  43. Earl, D.A.; Von Holdt, B.M. Structure harvester: A website and program for visualizing structure output and implementing the Evanno method. Conserv. Genet. Resour. 2012, 4, 359–361. [Google Scholar] [CrossRef]
  44. Evanno, G.; Regnaut, S.; Gould, J. Detecting the number of clusters of individuals using the software STRUCTURE: A simulation study. Mol. Ecol. 2005, 14, 2611–2620. [Google Scholar] [CrossRef] [Green Version]
  45. Peakall, R.; Smouse, P.G. 6.5: Genetic analysis in Excel. Population genetic software for teaching and researchdan update. Bioinformatics 2012, 28, 2537–2539. [Google Scholar] [CrossRef] [PubMed] [Green Version]
  46. Nei, M. Estimation of average heterozygosity and genetic distance from a small number of individuals. Genetics 1978, 89, 583–590. [Google Scholar] [CrossRef]
  47. Meirmans, P.G.; van Tienderen, P.H. Genotype and Genodive: Two programs for the analysis of genetic diversity of asexual organisms. Mol. Ecol. Notes 2004, 4, 792–794. [Google Scholar] [CrossRef]
  48. Leão, P.C.D.S.; Cruz, C.D.; Motoike, S.Y. Genetic diversity of table grape based on morphoagronomic traits. Sci. Agric. 2011, 68, 42–49. [Google Scholar] [CrossRef]
  49. Khadivi-Khub, A.; Salimpour, A.; Rasouli, M. Analysis of grape germplasm from Iran based on fruit characteristics. Rev. Bras. Bot. 2014, 37, 105–113. [Google Scholar] [CrossRef]
  50. Tello, J.; Torres-Pérez, R.; Grimplet, J.; Carbonell-Bejerano, P.; Martínez-Zapater, J.M.; Ibáñez, J. Polymorphisms and minihaplotypes in the VvNAC26 gene associate with berry size variation in grapevine. BMC Plant Biol. 2015, 15, 253. [Google Scholar] [CrossRef] [Green Version]
  51. Lamine, M.; Zemni, H.; Ziadi, S.; Chabaane, A.; Melki, I.; Mejri, S.; Zoghlami, N. Multivariate analysis and clustering reveal high morphological diversity in Tunisian autochthonous grapes (Vitis vinifera): Insights into characterization, conservation and commercialization. Oeno One 2014, 48, 111–122. [Google Scholar] [CrossRef] [Green Version]
  52. Khalil, S.; Tello, J.; Hamed, F.; Forneck, A. A multivariate approach for the ampelographic discrimination of grapevine (Vitis vinifera) cultivars: Application to local Syrian genetic resources. Genet. Resour. Crop. Evol. 2017, 64, 1841–1851. [Google Scholar] [CrossRef] [Green Version]
  53. Sabir, A.; Tangolar, S.; Buyukalaca, S.; Kafkas, S. Ampelographic and molecular diversity among grapevine (Vitis spp.) cultivars. Czech J. Genet. 2009, 45, 160–168. [Google Scholar] [CrossRef] [Green Version]
  54. Dilli, Y.; Ünal, A.; Kesgin, M.; İnan, M.S.; Söylemezoğlu, G. Comparison of ampelographic characteristics of some important grape varieties are grown in the Aegean Region, rootstock and clones. TURKJANS 2014, 1, 1546–1553. [Google Scholar]
  55. Knezović, Z.; Mandić, A.; Perić, N.; Beljo, J.; Žulj Mihaljević, M. Morphological and genetic characterization of vine grape cultivars of Herzegovina. CREBSS 2017, 3, 1–9. [Google Scholar] [CrossRef] [Green Version]
  56. Wang, Z.; Zhou, J.; Xu, X.; Perl, A.; Chen, S.; Ma, H. Adoption of table grape cultivars: An attribute preference study on Chinese grape growers. Sci. Hortic. 2017, 216, 66–75. [Google Scholar] [CrossRef]
  57. Doligez, A.; Bertrand, Y.; Farnos, M.; Grolier, M.; Romieu, C.; Esnault, F.; Dias, S.; Berger, G.; François, P.; Pons, T.; et al. New stable QTLs for berry weight do not colocalize with QTLs for seed traits in cultivated grapevine (Vitis vinifera L.). BMC Plant Biol. 2013, 13, 217. [Google Scholar] [CrossRef]
  58. Vouillamoz, J.F.; McGovern, P.E.; Ergul, A.; Söylemezoğlu, G.; Tevzadze, G.; Meredith, C.P.; Grando, M.S. Genetic characterization and relationships of traditional grape cultivars from Transcaucasia and Anatolia. Plant Genet. Resour. 2006, 4, 144–158. [Google Scholar] [CrossRef] [Green Version]
  59. Ibañez, J.; Andrés, M.T.; Molino, A.; Borrego, J. Genetic study of key Spanish grapevine varieties using microsatellite analysis. Am. J. Enol. Vitic. 2003, 54, 22–30. [Google Scholar] [CrossRef]
  60. Nebish, A.; ris Ochssner, I.; Maul, E.; Topfer, R.; Hausmann, L.; Hovhannisyan, A.; Devejyan, H.; Melyan, G.; Aroutiounian, R. Genetic identification and characterization of Armenian grapevine cultivars. In Proceedings of the BIO Web of Conferences, 40th World Congress of Vine and Wine, Sofia, Bulgaria, May 29–June 2 2017; Volume 9. [Google Scholar]
  61. Riaz, S.; De Lorenzis, G.; Velasco, D.; Koehmstedt, A.; Maghradze, D.; Bobokashvili, Z.; Musayev, M.; Zdunic, G.; Laucou, V.; Walker, M.A.; et al. Genetic diversity analysis of cultivated and wild grapevine (Vitis vinifera L.) cultivars around the Mediterranean basin and Central Asia. BMC Plant Biol. 2018, 18, 137. [Google Scholar] [CrossRef] [PubMed] [Green Version]
  62. Karataş, D.D.; Karatas, H.; Laucou, V.; Sarikamiş, G.; Riahi, L.; Bacilieri, R.; This, P. Genetic diversity of wild and cultivated grapevine accessions from southeast Turkey. Hereditas 2014, 151, 73–80. [Google Scholar] [CrossRef]
  63. Eyduran, P.S.; Ercisli, S.; Akin, M.; Eyduran, E. Genetic characterization of autochthonous grapevine cultivars from Eastern Turkey by simple sequence repeats (SSRs). Biotechnol. Biotechnol. Equip. 2015, 30, 26–31. [Google Scholar] [CrossRef] [Green Version]
  64. Cipriani, G.; Spadotto, A.; Jurman, I.; Di Gaspero, G.; Crespan, M.; Meneghetti, S.; Frare, E.; Vignani, R.; Cresti, M.; Morgante, M.; et al. The SSR-based molecular profile of 1005 grapevine (Vitis vinifera L.) accessions uncovers new synonymy and parentages, and reveals a large admixture. Theor. Appl. Genet. 2010, 12, 1569–1585. [Google Scholar] [CrossRef]
  65. Boz, Y.; Bakır, M.; Çelikkol, B.P.; Kazan, K.; Yılmaz, F.; Çakır, B.; Aslantaş, Ş.; Söylemezoğlu, G.; Yaşasın, A.S.; Özer, C.; et al. Genetic characterization of grape (Vitis vinifera L.) germplasm from Southeast Anatolia by SSR markers. Vitis 2011, 50, 99–106. [Google Scholar]
  66. Shen, Z.; Zhang, K.; Ma, L.; Duan, J.; Yan, A. Analysis of the genetic relationships and diversity among 11 populations of Xanthoceras sorbifolia using phenotypic and microsatellite marker data. Electron. J. Biotechnol. 2017, 26, 33–39. [Google Scholar] [CrossRef]
  67. Myles, S.; Boyko, A.R.; Owens, C.L.; Brown, P.J.; Grassi, F.; Aradhya, M.K.; Prins, B.; Reynolds, A.; Chia, J.-M.; Ware, D.; et al. Genetic structure and domestication history of the grape. Proc. Natl. Acad. Sci. USA 2011, 108, 3457–3458. [Google Scholar] [CrossRef] [PubMed] [Green Version]
  68. Ergül, A.; Kazan, K.; Aras, S.; Çevik, V.; Çelik, H.; Söylemezoğlu, G. AFLP analysis of genetic variation within the two economically important Anatolian grapevine (Vitis vinifera L.) varietal groups. Genome 2006, 49, 467–495. [Google Scholar] [CrossRef]
  69. Hou, L.; Cui, Y.; Li, X.; Chen, W.; Zhang, Z.; Pang, X.; Li, Y. Genetic Evaluation of Natural Populations of the Endangered Conifer Thuja koraiensis Using Microsatellite Markers by Restriction-Associated DNA Sequencing. Genes 2018, 9, 218. [Google Scholar] [CrossRef] [Green Version]
  70. Wang, L.; Zhang, J.; Liu, L.; Zhang, L.; Wei, L.; Hu, D. Genetic diversity of grape germplasm as revealed by microsatellite (SSR) markers. Afr. J. Biotechnol. 2015, 14, 990–998. [Google Scholar]
  71. Laucou, V.; Launay, A.; Bacilieri, R.; Lacombe, T.; Adam-Blondon, A.F.; Beârard, A.; Chauveau, A.; de Andrés, M.T.; Hausmann, L.; Ibáñez, J.; et al. Extended diversity analysis of cultivated grapevine Vitis vinifera with 10K genome-wide SNPs. PLoS ONE 2018, 13, e0192540. [Google Scholar] [CrossRef] [Green Version]
  72. Latch, E.K.; Dharmarajan, G.; Glaubitz, J.C.; Rhodes, O.E. Relative performance of Bayesian clustering software for inferring population substructure and individual assignment at low levels of population differentiation. Conserv. Genet. 2006, 7, 295–302. [Google Scholar] [CrossRef]
  73. Pelsy, F. Molecular and cellular mechanisms of diversity within grapevine varieties. Heredity 2010, 104, 331–340. [Google Scholar] [CrossRef] [PubMed] [Green Version]
  74. Aradhya, M.K.; Dangl, G.S.; Prins, B.H.; Boursiquot, J.-M.; Walker, M.A.; Meredith, C.P.; Simon, C.J. Genetic structure and differentiation in cultivated grape Vitis vinifera L. Genet. Res. 2003, 81, 179–192. [Google Scholar] [CrossRef] [PubMed] [Green Version]
  75. Barazani, O.; Westberg, E.; Hanin, N.; Dag, A.; Kerem, Z.; Tugendhaft, Y.; Hmidat, M.; Hijawi, T.; Kadereit, J.W. A comparative analysis of genetic variation in rootstocks and scions of old olive trees–A window into the history of olive cultivation practices and past genetic variation. BMC Plant Biol. 2014, 14, 146. [Google Scholar] [CrossRef] [Green Version]
  76. Xu, N.N.; Jiang, K.; Biswas, S.R.; Tong, X.; Wang, R.; Chen, X.Y. Clone configuration and spatial genetic structure of two Halophila ovalis populations with contrasting internode lengths. Front. Ecol. Evol. 2019, 7, 170. [Google Scholar] [CrossRef] [Green Version]
  77. Grigoriou, A.; Tsaniklidis, G.; Hagidimitriou, M.; Nikoloudakis, N. The Cypriot indigenous grapevine germplasm is a multi-clonal varietal mixture. Plants 2020, 9, 1034. [Google Scholar] [CrossRef] [PubMed]
  78. Zombardo, A.; Storchi, P.; Valentini, P.; Ciofini, A.; Migliaro, D.; Crespan, M. Recovery, molecular characterization, and ampelographic assessment of marginal grapevine germplasm from southern umbria (Central Italy). Plants 2021, 10, 1539. [Google Scholar] [CrossRef]
  79. Harris, A.M.; De Giorgio, M. An unbiased estimator of gene diversity with improved variance for samples containing related and inbred individuals of any ploidy. G3-Genes Genom Genet. 2017, 7, 671–691. [Google Scholar] [CrossRef] [Green Version]
Figure 1. Provinces from which Kara grape cultivars were collected (each sub-population and the provinces belonging to each sub-population are given in the below right part of the figure).
Horticulturae 09 00743 g001
Figure 2. Cluster analysis dendrogram of OIV characters. (A) The cluster analysis dendrogram shows the relationship between Kara grape individuals (Table S2 can be used for the dendrogram sample numbers (dendrogram no) information. Green numbers: Marmara; Blue numbers: Black sea; Red numbers: Aegean; Black numbers: Mediterranean; Black numbers with yellow star: East Anatolia; Black numbers with red stars: Central Anatolia) (B).
Horticulturae 09 00743 g002
Figure 3. PCA scatter plot of Kara sub-populations. The PCA plot was determined for the first two principal components (PCA 1 and PCA 2). Each sample is indicated as a colored shape, according to the population information.
Horticulturae 09 00743 g003
Figure 4. Biplot showing both scattering and the loadings of all OIV characters used in the analysis. Each sample is indicated as a colored shape according to the sub-population information.
Horticulturae 09 00743 g004
Figure 5. Factorial correspondence analysis (FCA). Six Kara sub-populations with reference population based on individuals (1. Mediterranean—yellow, 2. Marmara—blue, 3. Black Sea—white, 4. Aegean—gray, 5. East Anatolia—pink, 6. Central Anatolia—dark blue) (A). Six Kara sub-populations without reference population. The points in the circle show the average values of the reference population and East Anatolia population (B).
Horticulturae 09 00743 g005
Figure 6. Bayesian analysis of population structure (BAPS) of Kara grape cultivars (Kara population) and reference (Ref.) populations (A). Bayesian analysis of population structure based on individuals of Kara grape cultivars (Kara population) and reference (Ref.) cultivars (B). Bayesian analysis of population structure based on individuals and sub-populations (sub-populations are separated by black vertical lines) (C).
Horticulturae 09 00743 g006
Figure 7. Individual representation of RPPs and the percent probabilities of each individual in RPP groups (Table S1 can be used for the sample numbers (List no.) information).
Horticulturae 09 00743 g007
Table 1. SSR loci, allele number (n), expected heterozygosity (He), observed heterozygosity (Ho), probability of identity (PI).
NoSSR LocinHeHoPI
1VVS170.5510.5000.315
2VVS2120.8430.8850.075
3VVMD590.80360.7690.111
4VVMD770.7750.8080.162
5VVMD2170.7430.6920.190
6VVMD2490.6820.7500.198
7VVMD2790.8230.7690.099
8VVMD28120.8120.7690.110
9VVMD3190.7140.6920.196
10VrZAG2180.7090.7500.185
11VrZAG47110.8310.7310.090
12VrZAG62100.7780.9040.140
13VrZAG6480.8020.8460.122
14VrZAG7990.8150.8460.100
15VrZAG8360.6600.6730.277
16VrZAG11290.6210.6150.219
17VMC2H4130.8710.9620.056
18VMC2C370.6960.7120.240
19VVIH54110.7450.5000.132
20VVIB0140.5260.5580.557
21VVMD2580.7890.8460.136
22VVMD32110.8200.5770.094
Total19616.41116.1543.803
Average8.910.7460.7340.173
Table 2. Identical, synonymous and homonymous cultivars identified based on SSR analysis.
NoIdenticalSynonymousHomonymous
(Cultivar Name/List no/Population (Region)-Location (Province))
1-Patlak Kara/45/Central Anatolia-SivasKara Üzüm/1/Mediterranean-Adana-Kara Üzüm/15/Black Sea-Gümüşhane-Kara Üzüm/16/Mediterranean-Hatay-Kara Üzüm/23/Aegean-İzmir-Kara Üzüm/25/Black Sea-Kastamonu-Kara Üzüm/26/Marmara-Kırklareli-Kara Üzüm/49/Black Sea-Zonguldak
Siyah Üzüm/47/Central Anatolia-Yozgat
2-Deli Kara/3/Marmara-BalıkesirSiyah Üzüm/12/East Anatolia-Diyarbakır-Siyah Üzüm/17/Mediterranean-Hatay-Siyah Üzüm/29/Central Anatolia-Konya-Siyah Üzüm/31/East Anatolia-Malatya-Siyah Üzüm/32/East Anatolia-Mardin-Siyah Üzüm/42/Black Sea-Samsun-Siyah Üzüm/43/Black Sea-Sinop-Siyah Üzüm/44/Black Sea-Sinop/-Siyah Üzüm/47/Central Anatolia-Yozgat
Yerli Kara/41/Marmara-Sakarya
3-Eski Kara/11/Aegean-DenizliEkşi Kara/10/Aegean-Denizli-Ekşi Kara/48/Central Anatolia-Yozgat
Yerli Kara/34/Aegean-Muğla
4-Siyah Üzüm/12/East Anatolia-DiyarbakırYerli Kara/34/Aegean-Muğla-Yerli Kara/41/Marmara-Sakarya
Kara Üzüm/26/Marmara-Kırklareli
5--Katı Kara/36/Aegean-Muğla-Katı Kara/38/Black Sea-Ordu-Katı Kara/39/Black Sea-Ordu
Table 3. The expected and observed heterozygosity values for Kara grape sub-populations.
Sub-PopulationNumber of Cultivars (n) HeterozygosityPolymorphic LocusMean of Alleles/Locus
HexpHobsp (0.95)p (0.99)
Mediterranean9 0.7000.7321.00001.00005.27
Std. error0.0860.170
Marmara11 0.7520.7431.00001.00006.72
Std. error0.0840.155
Black Sea11 0.7000.7141.00001.00005.95
Std. error0.1480.178
Aegean9 0.6510.7171.00001.00004.54
Std. error0.1180.226
East Anatolia3 0.5960.7271.00001.00003.31
Std. error0.1700.284
Central Anatolia6 0.6130.7651.00001.00003.72
Std. error0.1250.255
References3 0.6110.7721.00001.00003.50
Std. error0.1510.238
Std. error: Standard error.
Table 4. Genetic distance between sub-populations.
Sub-PopulationsMediterraneanMarmaraBlack SeaAegeanEast AnatoliaCentral AnatoliaRef.
Mediterranean-
Marmara0.149-
Black Sea0.1700.147-
Aegean0.2480.1800.195-
East Anatolia0.3000.3110.3520.478-
Central Anatolia0.2290.2320.1570.2310.470-
Ref.0.6320.5190.6990.6410.8150.757-
Ref: references.
Table 5. Pairwise Fst values and gene flow (Nm) among the Kara sub-populations.
Sub-Population (Fst/Nm)MediterraneanMarmaraBlack SeaAegeanEast AnatoliaCentral AnatoliaRef.
Mediterranean-
Marmara0.00027/İnf.-
Black Sea0.01284/21.030.00500/84.93-
Aegean0.04291 ***/5.470.02003/12.820.03029 */7.96-
East Anatolia0.01655/15.660.01518/25.110.03902 */6.500.08739 ***/2.48-
Central Anatolia0.03113/6.970.03068/7.800.00898/22.230.04072 */5.080.08424 */2.28-
Ref.0.09815 ***/2.290.06173 */4.080.11655 ***/1.910.12209 */1.710.12159/1.680.14787 */1.28-
* p < 0.05, *** p < 0.001, Inf: infinite, Ref.: References.
Table 6. Classification of Kara grape cultivars by STRUCTURE using 22 SSR loci in K = 2 reconstructed panmictic populations.
RPPNumber of GenotypesqI > 0.8qI < 0.8The Most Representative Populations and the Number of Individuals
RPP13018 (60%)12 (40%)Mediterranean (5), Marmara (5),
Black Sea (7), Aegean (7),
Central Anatolia (6)
RPP22216 (73%)6 (27%)Mediterranean (4), Marmara (6),
Black Sea (4), Aegean (2),
East Anatolia (3), References (3)
Overall5234 (65%)18 (35%)All populations
qI: coefficient coancestry.
Table 7. Multi-locus (MLG) number, number of different alleles (Na), effective alleles (Ne), observed heterozygosity (Ho), unbiased expected heterozygosity (uHe) and private alleles summary (PAS) values found in different grape sub-populations.
Sub-Population (Sub-Population Number)MLGNaNeHouHePAS (Locus No: Alleles (bp))
Central Anatolia (6)23.722.830.760.66VVMD32:146
East Anatolia (3)13.312.750.720.71VVS1:181, VVMD28:281, VVMD31:201, ZAG83:203
Mediterranean (9)25.273.620.730.74VVS2:141, VVMD7:230, VVMD24:221, ZAG62:190, ZAG112:229, VVMD5:271
Marmara (11)36.724.440.740.78VVS1:193, VVMD5:231, VVMD7:258, VVMD24:201, VVMD28:219, ZAG21:195, ZAG47:183, ZAG62:210, ZAG83:183, ZAG112:247, VMC2h4:196, VVIh54:142 and154, VVIb01:300, VVMD25:237 and247,
VVMD32:258
Black Sea (11)25.953.990.710.73VVMD5:219,VVMD28:245, ZAG21:211, ZAG47:169, ZAG62:208, ZAG64: 144, VMC2h4:208 and210; VMC2c3:187, VVMD32:262
Aegean (9)24.543.140.710.68VVMD21:250, VVIb01:308
Total1224.9720.774.374.3-
Table 8. Number of genotypes (accessions) (gen)/clonality, effective number of genotypes (accessions) (eff), genotypic diversity (div), evenness (eve), and Shannon–Wiener (shw) values (for threshold = 2) determined in multi-locus lineages (MLLs) analysis.
Sub-Population (Sub-Population Number)Number of Genotypes (Accessions) (gen)/ClonalityEffective Number of Genotypes (Accessions) (eff)Genotypic Diversity (div)Evenness (eve)Shannon–Wiener (shw)
Central Anatolia (6)5/140.9330.9000.677
East Anatolia (3)3/03110.477
Mediterranean (9)9/09110.954
Marmara (11)10/190.9810.9300.986
Black Sea (11)11/011111.041
Aegean (9)8/170.9720.9200.887
Table 9. Cultivar names and other cultivar names assigned to different accessions at the T = 2 threshold value based on MLLs analysis.
Matched NumberAccession Name (List No-Region, Province)Matches at T = 2
(List No-Region, Province)
1Kokulu Kara (5-Marmara, Bilecik)Siyah Üzüm (17-Mediterranean, Hatay)
2Yerli Kara (34-Aegean, Muğla)Eski Kara (11-Aegean, Denizli)
3Patlak Kara (45-Central Anatolia, Sivas)Kara Üzüm (26-Marmara, Kırklareli)
Disclaimer/Publisher’s Note: The statements, opinions and data contained in all publications are solely those of the individual author(s) and contributor(s) and not of MDPI and/or the editor(s). MDPI and/or the editor(s) disclaim responsibility for any injury to people or property resulting from any ideas, methods, instructions or products referred to in the content.

