Article

Trend Analysis of Different Climate Parameters and Watering Requirements for Hazelnut in Central Italy Related to Climate Change

1
Department of Agricultural, Food and Environmental Sciences, University of Perugia, Borgo XX Giugno, 74, 06121 Perugia, Italy
2
Abruzzo Region, Agriculture Directorate-Regional Agro-Meteorological Centre, Contrada Colle Comune, 66020 Scerni, Italy
3
Institute of Research on Terrestrial Ecosystems (IRET), National Research Council (CNR), Via Marconi 2, 05010 Porano, Italy
4
National Biodiversity Future Center, 90133 Palermo, Italy
*
Authors to whom correspondence should be addressed.
Horticulturae 2023, 9(5), 593; https://doi.org/10.3390/horticulturae9050593
Submission received: 28 March 2023 / Revised: 24 April 2023 / Accepted: 16 May 2023 / Published: 17 May 2023
(This article belongs to the Special Issue New Challenge of Horticultural Crops under Climate Change)

Abstract

:
In this study, the effects of climate change on the irrigation water requirement of hazelnut trees were investigated in Central Italy. The meteorological variables considered were precipitation, temperature, chilling units, and the Standardized Precipitation Index (SPI) in Central Italy. The hydrological variables were the reference evapotranspiration (ET0) and the water requirement based on soil water balance. Climate data were collected from eight meteorological stations for the period 1974–2021, and ET0 was estimated by the Hargreaves and Samani equation. The SPI index was calculated for a four-month time scale corresponding to the hazelnut growing season (April–August). A statistical analysis of the trends of the variables considered was conducted. The results showed an increasing trend for temperature, ET0, and water requirements, while a decreasing trend was shown for the chilling units. No significant trends were detected for precipitation and SPI.

1. Introduction

Agriculture is one of the sectors that is most damaged by changes in the climate. Precipitation and temperature patterns, their distribution throughout the year, and the incidence of extreme weather events are the most critical variables in the agricultural sector in terms of both production and sustainability [1,2].
In the Mediterranean region, the majority of the 21st Century scenarios show a decrease in average precipitation, with a peak signal in the summer months with increasing intensity and frequency of Extreme Weather Events (EWEs). However, there is no consensus on the evolution of the frequency and intensity of EWEs, even though an increase in precipitation variability during the dry warm season is expected, and an increased probability of occurrence of events conducive to floods has been suggested [3]. According to Valdes-Abellan [4], during the last 50 years, Italy recorded an annual precipitation reduction of about 135 mm.
Cramer et al. [5] indicated that for every 1 °C of global warming, the mean precipitation will probably have decreased by about 4% in many of the regions, particularly in the South Mediterranean areas. In addition, the upward temperature trends have led to a decrease in chilling conditions, affecting the physiological functions of many crops [1,6,7,8]. In general, the synergistic effects of drought, excessive heat load, and high daily irradiance have become limiting factors for agricultural productivity worldwide, with consequences on growth, productivity, and fruit quality [2,7,9]. The European hazelnut (Corylus avellana L.) is a perennial crop adapted to specific locations with humid and temperate conditions in relation to its regular water demand [6,8]. The main hazelnut-producing countries are Turkey, Italy, the United States of America, Azerbaijan, Georgia, Spain, and China [10,11]. Its total cultivated area in the world is about 660,000 ha, with an average world annual production of about 865,000 t (in-shell hazelnuts), showing an increasing trend of geographical expansion caused by strong demand from the confectionery industry [12]. Despite this wide range of natural distribution, commercial orchards are concentrated in a few regions worldwide. In fact, this crop grows more efficiently in areas with an average annual total precipitation of 755–800 mm and with average annual temperatures of 13–16 °C [6,13]. In particular, the water requirement of the European hazelnut ranges between 80 and 100 mm/month from April to August, and the species is quite adaptive to different soil conditions, avoiding clay types due to the risk of root asphyxia [13].
In Italy, the main production zones are Piedmont, Latium, and Campania, however, new growing areas are in Umbria, Abruzzo, in central Italy, in Basilicata in the south, and in Veneto and Lombardy in the north [14], where the hazelnut orchards are normally irrigated using drip irrigation and sub-irrigation systems [13].
The extension of hazelnut growing areas from traditional hilly cultivation to lowlands and the impact of climate change on the year-to-year yield variability are increasingly leading scientists to deepen their understanding of the influence of agro-environmental conditions on key plant processes [15].
In fact, the seasonal cycle of hazelnuts shows the overlapping of different vegetative and reproductive processes (shoot growth, fruit set, shell expansion, kernel filling, flower bud initiation, and differentiation) from the beginning of June to the end of August. These overlapping processes make the availability of water a priority to overcome physiological competition between different organs, especially in relation to the cultivar and the growing environment. During the fertilization/ripening period of hazelnut (from May to August/September), wind, high summer temperatures, and drought adversely affect the annual shoot development, flower bud formation, and internal development of fruits [10]. Consequently, even slight water stress during the sensitive period can markedly reduce the final yield [15]. For this reason, irrigation systems targeting water stress prevention, and allowing reserve accumulation for the following growing seasons, are increasingly adopted in many growing areas such as Nebraska, Spain, and Italy [15,16].
Secondly, for hazelnuts, the dates of flowering and leafing at the end of the winter or early spring are a function of the chilling requirements for the buds and the heat requirements during the post-rest phase [8]. A recent study carried out in the Abruzzo Region, in the central-eastern part of Italy, showed that the chilling units for hazelnuts were highly accumulated, except for the stations located on the southern coast of the region, where the minimum threshold was still reached, although with a decreasing trend [8]. Considering that Rodríguez et al. [7] have pointed out how the viability of temperate fruit-tree varieties in Spain under climate change has been varied, mainly due to a decrease in chilling accumulation, it is necessary to evaluate the chilling units, specifically for hazelnut crops in Central Italy as the first effect of climate change.
Moreover, due to global warming, the assessment of drought risk, even in hazelnut cultivation areas, is crucial information for decision-makers intending to mitigate drought-related crop losses by using a meteorological index known as the Standardized Precipitation Index (SPI), which depends on the cumulative amounts of precipitation and ET0 in a given multi-month period [17,18]. Until now, several studies have been carried out on the effects of high temperatures and decreasing chilling conditions on hazelnut physiology [16,19,20], phenology, and yield [8,15,20], but none have evaluated the possible variations of hazelnut watering requirements related to climate change. Recently, studies have been carried out for other crop species, such as olive in Portugal [21] and apple in Turkey and Polland [22]. Some years ago, two authors [23] analyzed the time series of some climatic and agro-climatic indices in the Region of Umbria (Central Italy) for 38 stations. They showed a decreasing trend in the cumulated precipitation characterized by a defined spatial pattern. The precipitation reduction during the irrigation season, although less widespread, could have the most important practical consequences. However, until now, all the studies on hazelnuts were mainly focused on how to mitigate climate change in terms of abiotic stresses using several tools or techniques, such as kaolin [9,16,19,24,25], but not on also how to optimize irrigation in hazelnut orchards to face climate change.
Considering that precipitation plays a crucial role in the availability of the water supply for hazelnut orchards located in central Italy [10], the aims of this study were to analyze the effect of climate change on the climatic parameters of hazelnut growth (such as chilling requirements, precipitation, and temperatures) and on hazelnut watering requirements. Thus, the precipitation distribution along the years, the SPI, and the influence of the temperature were evaluated to assess the water demands. This study will be useful for improving the irrigation management of the new hazelnut orchard located in the inner areas of central Italy.

2. Materials and Methods

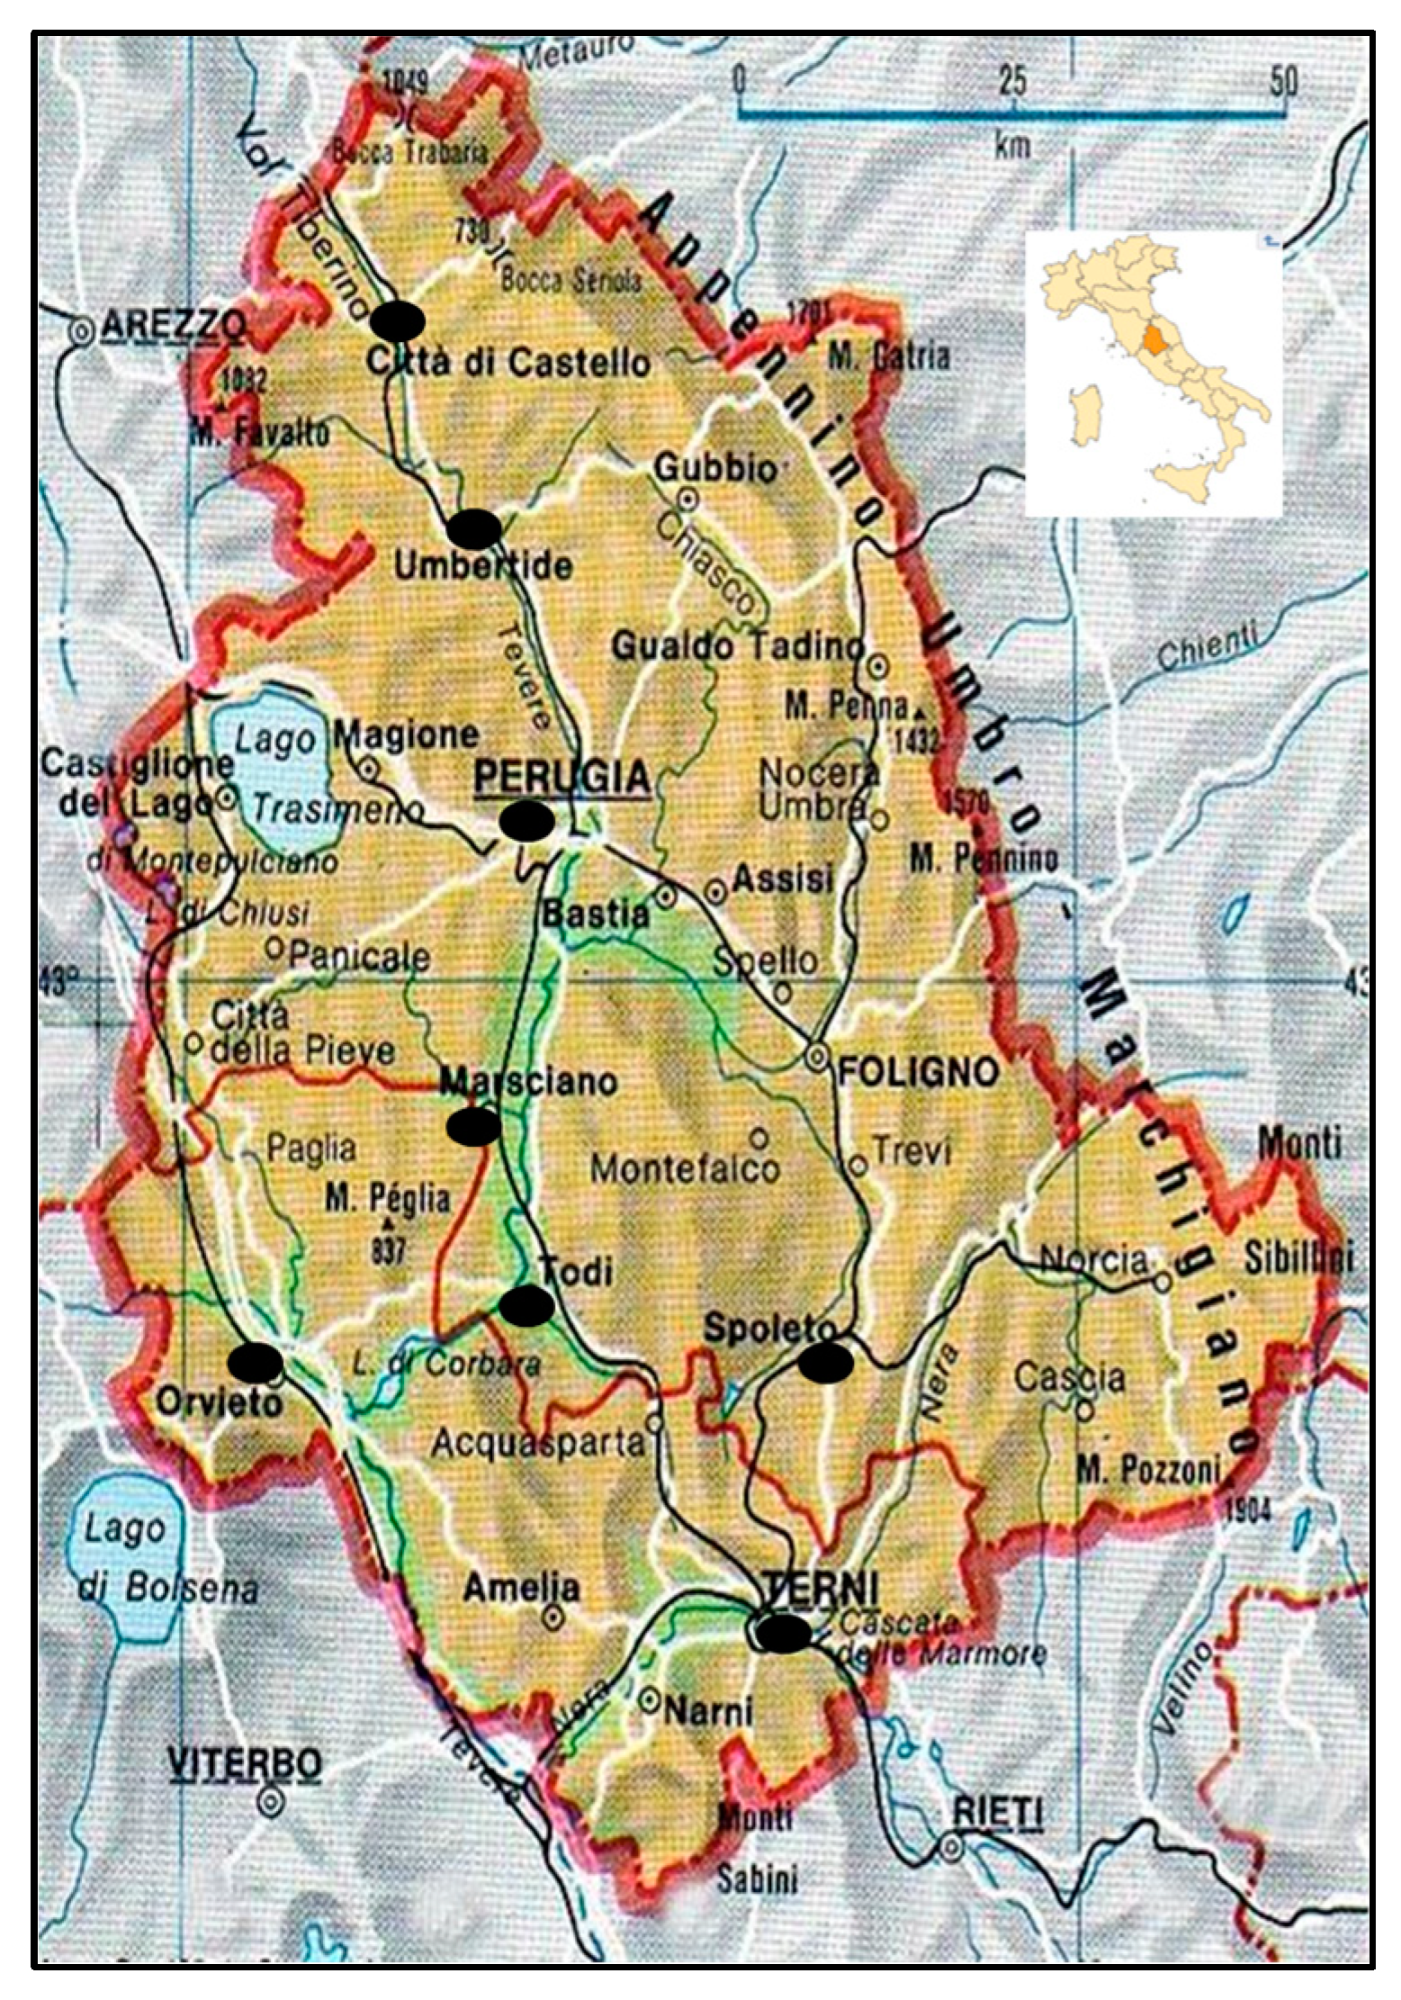
2.1. Climate Description and Climatic Data Collection from the Umbria Region

The study area is the region of Umbria (Central Italy), which covers an area of about 8.456 km2, located in an inland zone of central Italy (Figure 1). It is characterized by a complex orography and is mainly hilly in the central and western areas, with elevations ranging from 100 to 800 m asl. The climate is mainly sub-coastal temperate [26], and precipitation is mainly concentrated during the autumn and winter season.
Data from 8 meteorological stations of the Hydrographic Service of the Umbria Region were considered in the present study (Figure 1). The meteorological stations (Città di Castello, Compignano (later called Marsciano), Orvieto, Perugia, Spoleto, Terni, Todi, and Umbertide) were selected based on their suitability for hazelnut orchards based on the recent study carried out by Di Lena et al. [8] (Table 1). Therefore, stations in areas with an altitude greater than 500 m a.s.l. were not considered, as well as those characterized by very low winter and spring temperatures. The daily observations of temperature and precipitation of the period 1974–2021 were analyzed. Before the analysis, the procedure for building an upgradable long-term homogeneous climate dataset described by [27] was applied.
To characterize the climatic conditions, Tables S1–S3 report the annual cumulated precipitation from 1974 to 2021, the monthly precipitation (47 years averages), and the minimum and maximum monthly cumulated per station. In addition, in Tables S4–S6, the annual maximum, minimum, and mean temperatures (later Tmax, Tmin and Tmean), and the monthly maximum, minimum, and mean temperatures (47 years averages) are reported for each station.
To study the relevant climatic data, the Box plot data analysis method was applied using SigmaPlot® (San Jose, CA, USA) 13.0 software [28], which provides a useful summary of a potentially large amount of data. In the box plot method, the input data set is split into quartiles. A box plot has a minimum value, lower quartile (10th), median, upper quartile (90th), and maximum value. The box plot goes from the lower quartile to the upper quartile. The difference between the upper quartile and the lower quartile is the length of the box. Inside the box of the box plot, a horizontal line is drawn, which is the median of the dataset. On the outside of the box, two more horizontal lines are drawn; one horizontal near the upper quartile is called the upper whisker and another line near the lower quartile is called the lower whisker. The endpoints of the whiskers are typically defined as the most extreme data points [29].
Moreover, since the shoot and nut growth, as well as nut ripening, occur from April to September [30], climatic analysis has been focused on this period, except for the estimation of chilling accumulation [31].

2.2. Estimation of Chilling Accumulation

To estimate the average chilling unit (CU) accumulation conditions, a chilling-hours model was used. This model calculates the number of hours (H) in which the temperature (T) is below 7 °C, without considering freezing temperatures. The number of accumulated chilling hours (CH) at a given time (t) after a fixed starting time is given as:
C H t = i = 1 t H
If 0 °C < T < 7 °C, then add 1, otherwise 0.
The estimation of hourly temperatures, starting from the maximum and minimum daily temperatures, has been carried out using the Interpol T library of R. The starting date for the chilling accumulation was the 1st of November. Before that date, the temperatures are too high to contribute notably to the chilling accumulation. The chilling accumulation was calculated until the end of February [8].

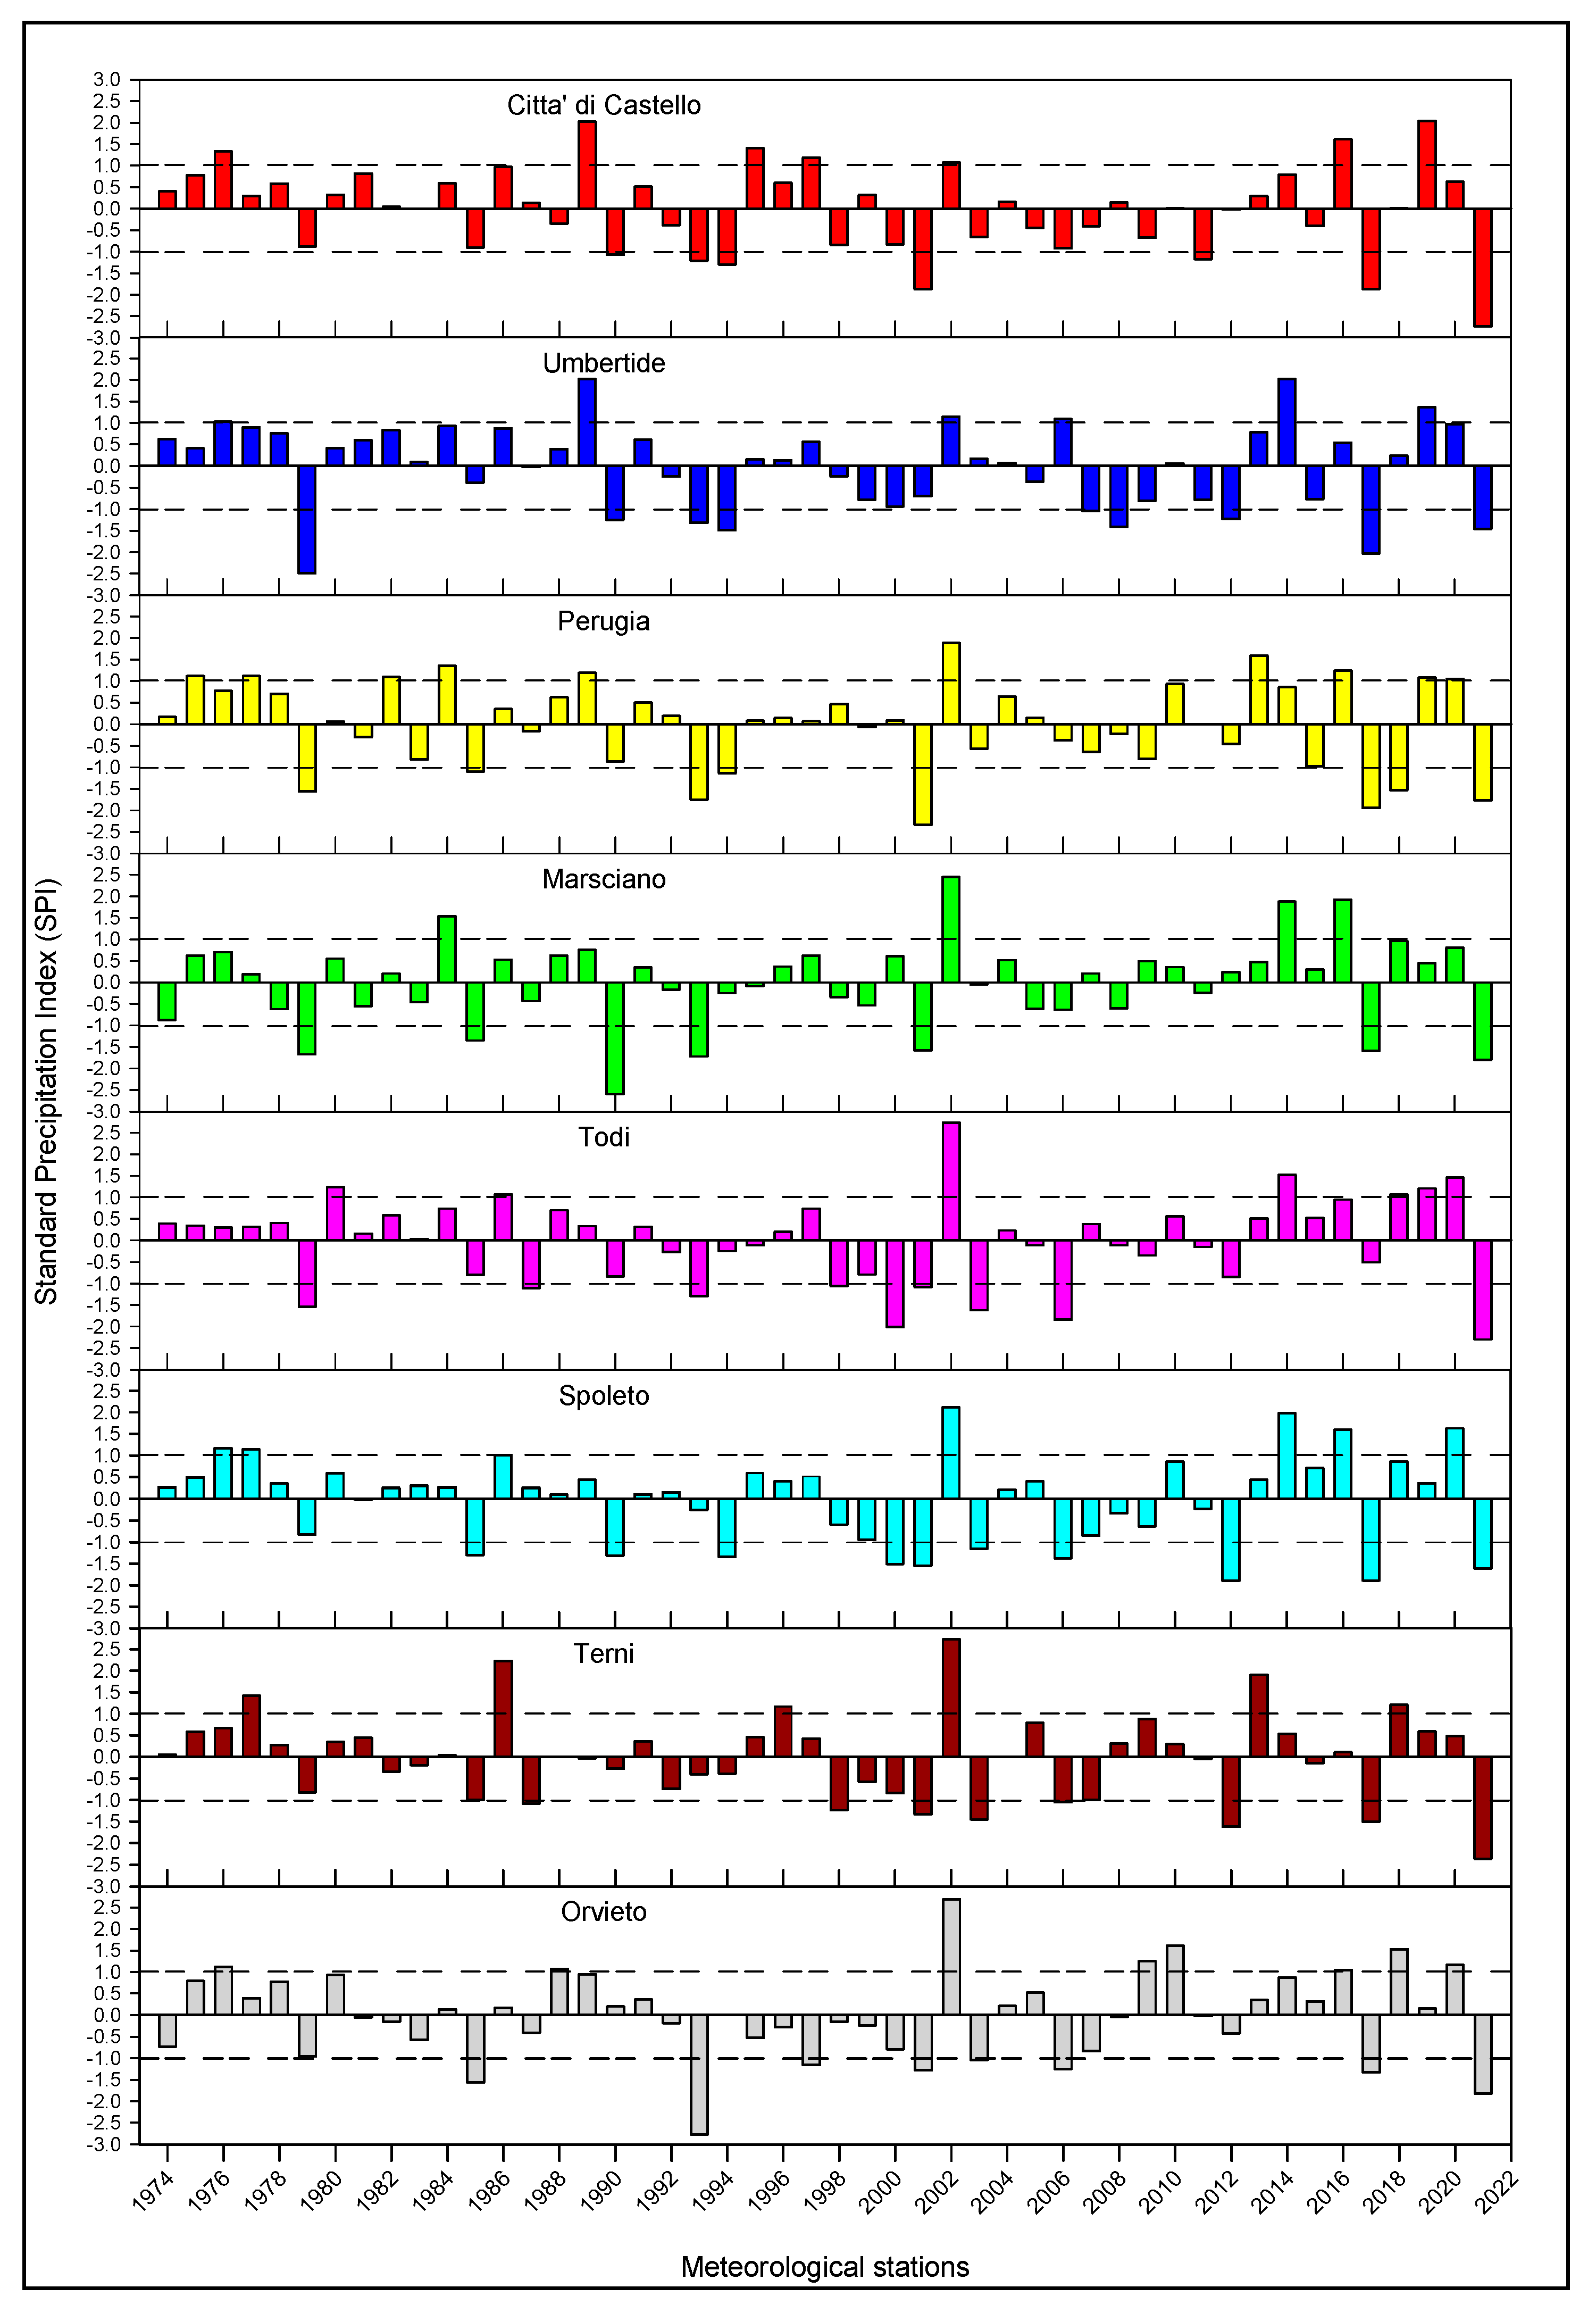
2.3. Standard Precipitation Index (SPI)

Here is just a brief description of the SPI calculation. The first step in the calculation of the SPI is the determination of a Probability Density Function (PDF) suitable for the description of the long-term series of observations Xki,j of cumulative precipitation related to a given month j (j = 1, …, 12) and time scale k. The subscript i (i = 1, …, N) indicates the observation of the time series of length N. The fitting is performed for each calendar month to consider the climatic differences due to seasonality. Once this PDF is determined, the cumulative probability of an observed precipitation amount Xki,j is estimated. Thanks to an equiprobability transformation, the estimated cumulative probability is transformed into a standard normal deviate representing the SPI value [18]. In this paper, SPI has been analyzed at the 4-month time scale (June–August) and the corresponding SPI. As reported by Jha et al. [18], the year could be classified based on the SPI, as shown in Table 2.

2.4. Estimation of Water Requirement Using the Soil Water Balance

As described by Allen [32], assuming the root zone as a container in which the water content may fluctuate, the daily soil water, expressed in terms of depletion at the end of the day, is:
D r , i = D r , i 1 ( P R O ) i I i C R i + E T c , i + D P i ,
where Dr,i is the root zone depletion at the end of day i [mm], Dr,i−1 is the water content in the root zone at the end of the previous day, i − 1 [mm], Pi is precipitation on day i [mm], ROi is the runoff from the soil surface on day i [mm], Ii is the net irrigation depth on day i that infiltrates the soil [mm], CRi is the capillary rise from the groundwater table on day i [mm], ETc,i is the crop evapotranspiration on day i [mm], DPi is the water loss out of the root zone by deep percolation on day i [mm].
As described in Allen [32], when the water stored in the root zone reaches the field capacity, the amount of water above the field capacity is lost by deep percolation (DP), and the root zone depletion reaches its maximum value, i.e., the Total Available Water (TAW). As a result of percolation and evapotranspiration, the water content in the root zone will gradually decrease, and the root zone depletion will increase. Therefore, following the procedure of Allen [32], the capillary rise CR was set equal to zero, and the runoff was not considered, assuming a flat terrain (slope = 0). Thus, Equation (1) became:
D r , i = D r , i 1 P i I i + E T c , i + D P i .
The water demand corresponds to the term Ii of Equation (2), thus:
I i = D r , i 1 D r , i P i + E T c , i + D P i .
The evaluation of the precipitation Pi was carried out by only considering the daily precipitation > 5 mm, and, for these, only 80% of the daily value was used (to consider the canopy interception, as described in Vinci et al. [33]). The daily crop evapotranspiration ETc,i, under standard conditions, was assessed from the reference crop evapotranspiration ET0 using the relationship [32]:
E T c , i = k c × E T 0 ,
with kc as the crop coefficient during the growing season of the hazelnut orchard [13,34,35]. In particular, kc = 0.3 for April, kc = 0.4 for May, kc = 0.62 for June, kc = 0.7 for July, kc = 0.55 for August, and kc = 0.3 for September.
The daily series of reference evapotranspiration, ET0 (mm/day), for each meteorological station, were calculated using the temperature-based Hargreaves and Samani equation [36]:
E T 0 = 0.0023 × ( T m e a n + 17.8 ) × ( T m a x T m i n ) 0.5 × R a ,
with Tmean, Tmax, and Tmin representing the mean, maximum, and minimum daily temperatures (°C), respectively, and Ra representing the extraterrestrial radiation (mm/day). As suggested by Gucci [32], Equation (5) was tested in the Umbria region by [37] that compared the reference evapotranspiration computed using the Hargreaves-Samani and Penman-Monteith equations and obtained a good correlation (r > 0.8). This simplified method was chosen due to the lack of detailed data on solar radiation, air humidity, and wind speed.
By calculating the soil water balance of the root zone on a daily basis, the time and depth of irrigation were evaluated for each year and each station. Hazelnut is a perennial crop, so the depth of the root zone was considered constant [16]. This species has some peculiar characteristics, i.e., blooming occurs during the winter, and a period of four months elapses between pollination and fertilization. Following fertilization that occurs at the end of May, nut growth follows a sigmoidal curve. Ripening occurs in August/September, according to the cultivar. A lack of water during nut growth (from June to July) results in reduced nut size, while during kernel growth (July and August) it leads to poorly filled nuts [38]. The seasonal cycle of hazelnuts shows the overlapping of different vegetative and reproductive processes (shoot growth, fruit set, shell expansion, kernel filling, flower bud initiation, and differentiation) from the beginning of June to the end of August, depending on the cultivars and growing environments, and this makes the availability of water a priority to overcome the physiological competition between different organs [13]. To avoid crop water stress, irrigation should be applied when the readily available soil water is depleted, which, in this paper, is in correspondence with 0.4⋅TAW [39]. The net daily irrigation volumes were reduced for the entire period of May–August to return 75% of the maximum evapotranspiration, as suggested by [39].
For analysis, the loam soil and the silty clay soil were considered because they are the most abundant in the Umbria region [40] and where hazelnut trees are grown.

2.5. Statistical Analysis of Trends

The nonparametric Mann–Kendall test [41,42] is a highly recommended test by the World Meteorological Organization for trend detection in hydrological studies. The null hypothesis H0 states that there is no trend in the analyzed records, while the alternative hypothesis of a two-sided test is that the series displays a changing trend. For a time-series X, the test statistic, S, is given by:
S = h = 1 n 1 j = h + 1 n s i g n ( X j X h ) ,
where Xj denotes ordered data values, n is the length of the observations, and XjXh is the sign function given by:
s i g n ( X j X h ) { 1   i f   X j X h > 0 0   i f   X j X h = 0 1   i f   X j X h < 0 .
Under the assumption that the data are independent and randomly ordered, the mean of S is zero, E(S) = 0, and the variance of the statistic can be calculated by:
v a r ( S ) = n ( n 1 ) ( 2 n + 5 ) h 1 m t h ( t h 1 ) ( 2 t h + 5 ) 18
where m is the number of groups of tied ranks (equal observations), each with th tied observations. Kendall shows that the distribution of S tends to normality as the number of observations becomes larger. For a sample size n > 10, the standardized normal test statistic Zs for the MK test is given by:
Z s = { ( S 1 ) v a r ( S )   i f   S > 0 0   i f   S = 0 ( S + 1 ) v a r ( S )   i f   S < 0
A positive Zs value indicates an increasing trend and a negative value shows a decreasing trend. When testing increasing or decreasing monotonic trends at the α significance level, the null hypothesis was rejected for an absolute value of Z greater than Z1 − α/2 obtained from the standard normal cumulative distribution tables. In this research, a significance level of α = 0.1 and 0.05 was applied, with a corresponding value of Z1 − α/2 being 1.64 and 1.96, respectively.

3. Results

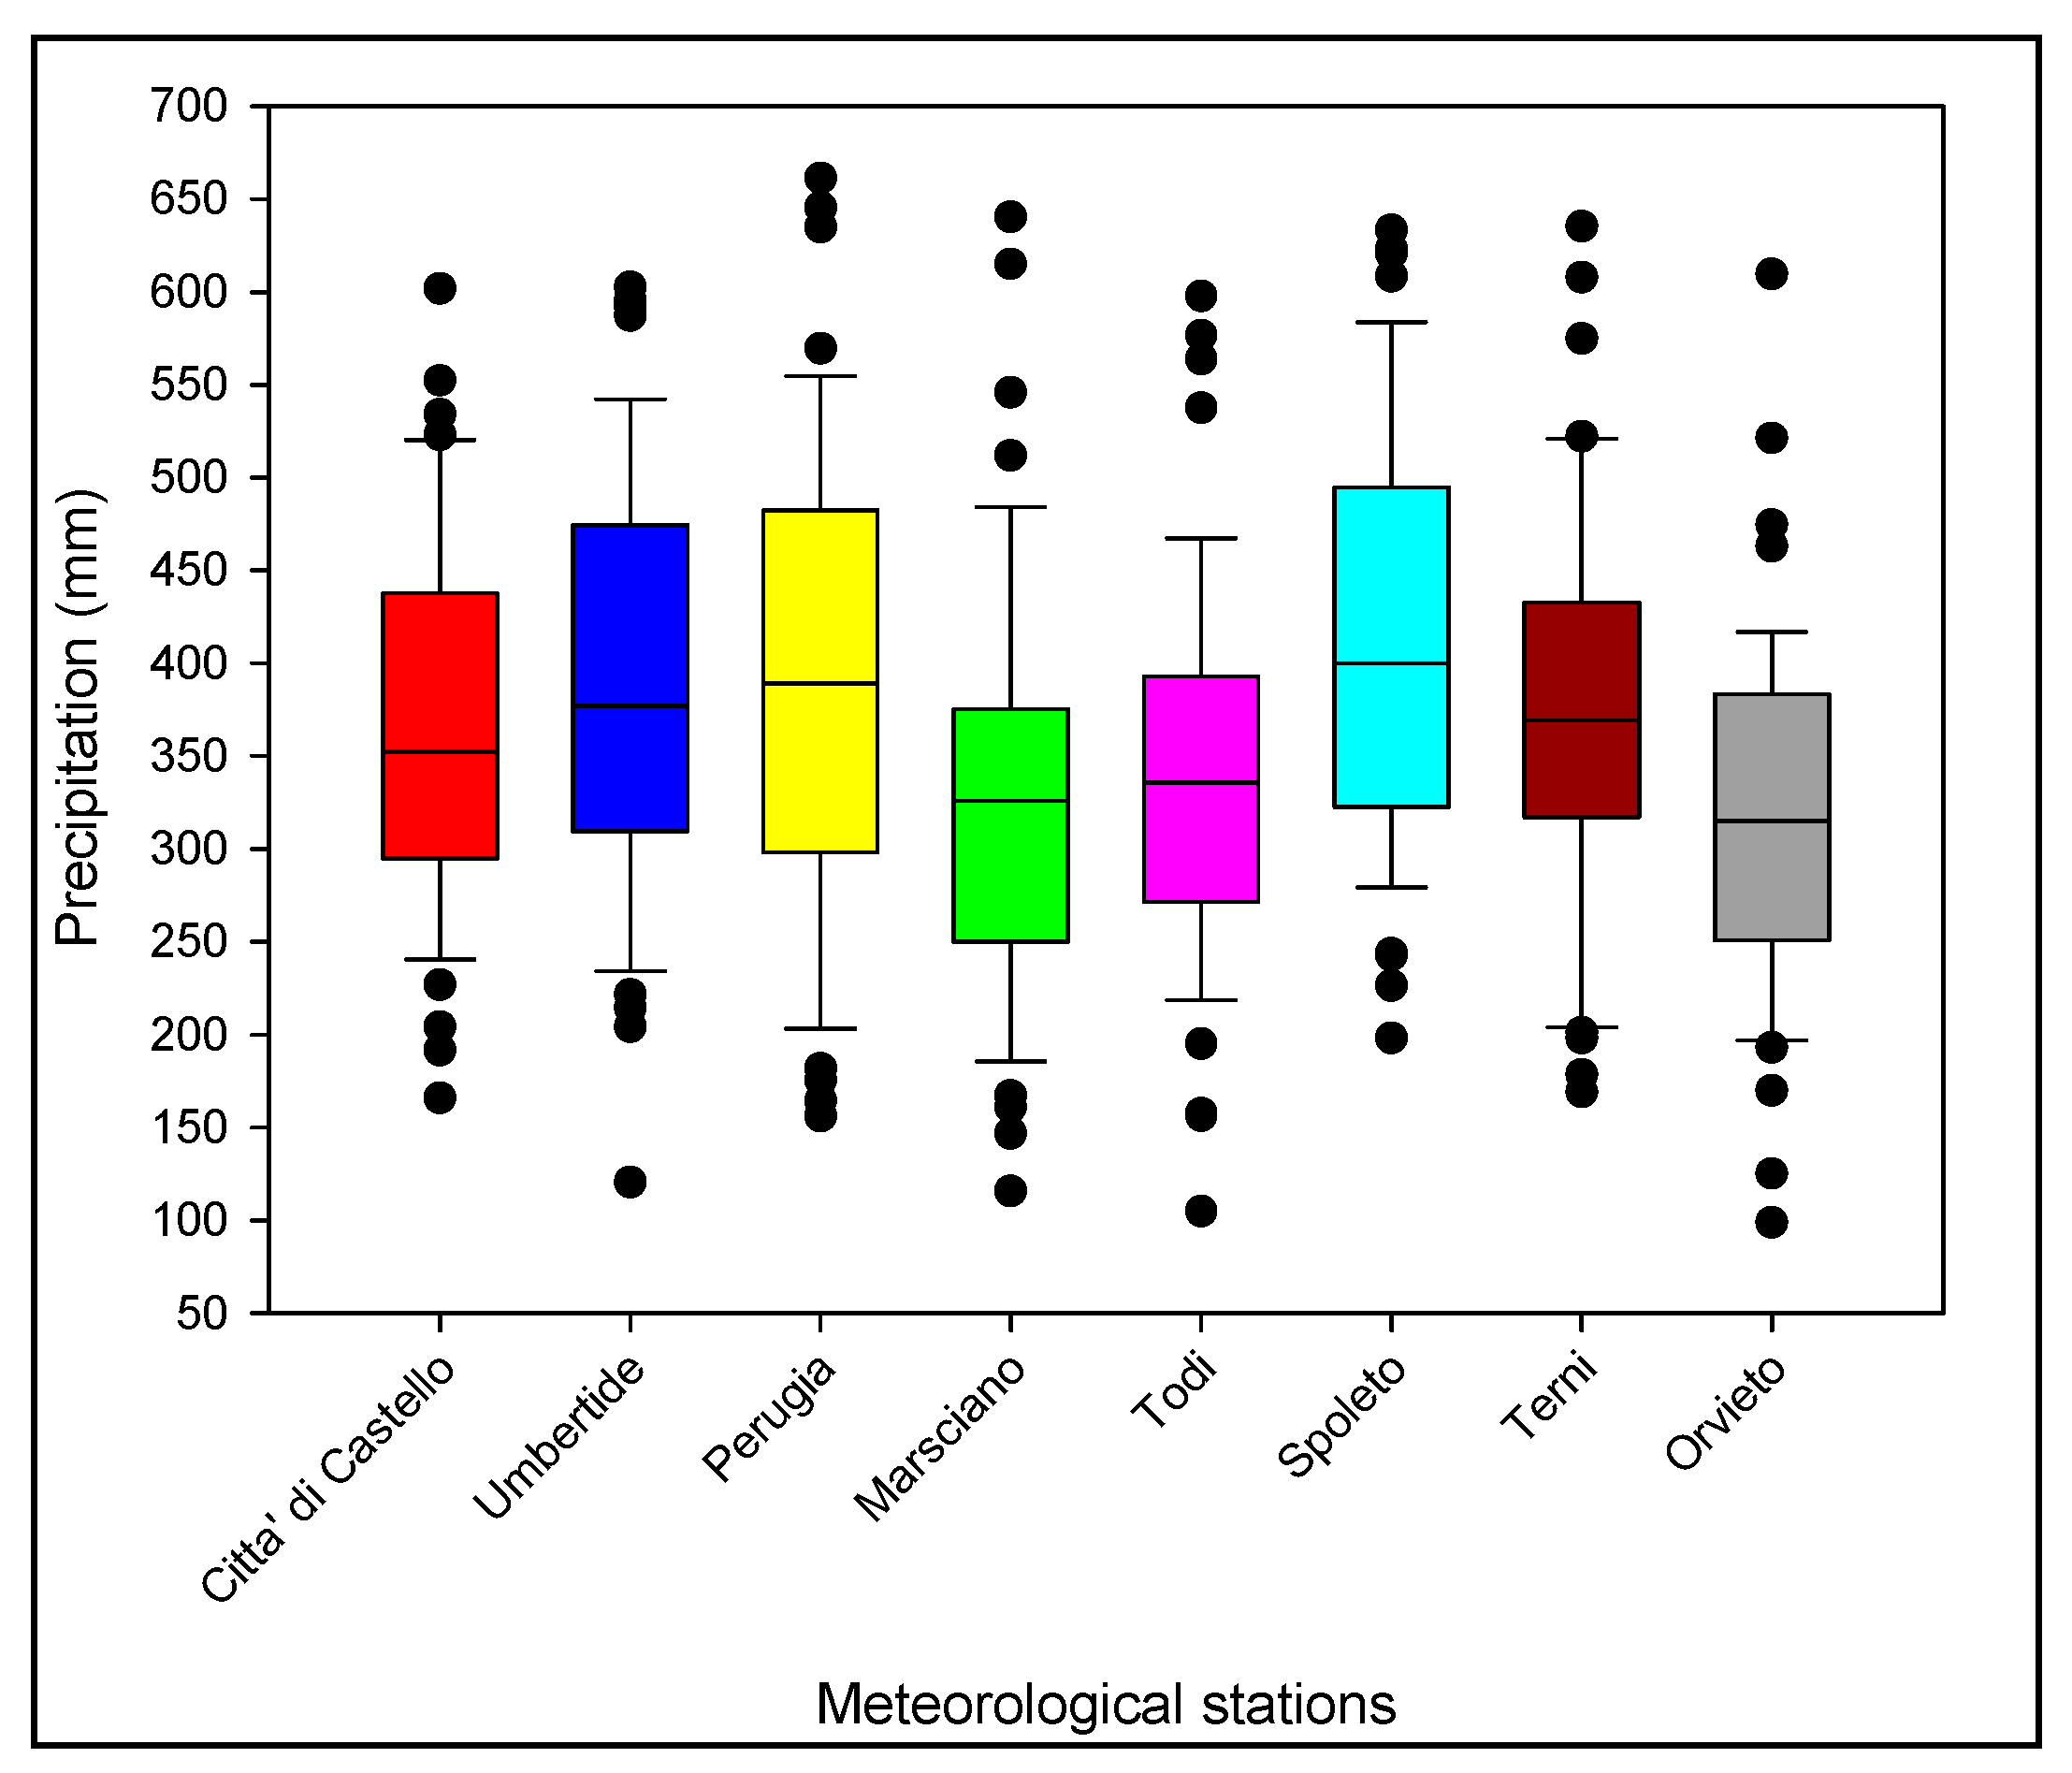
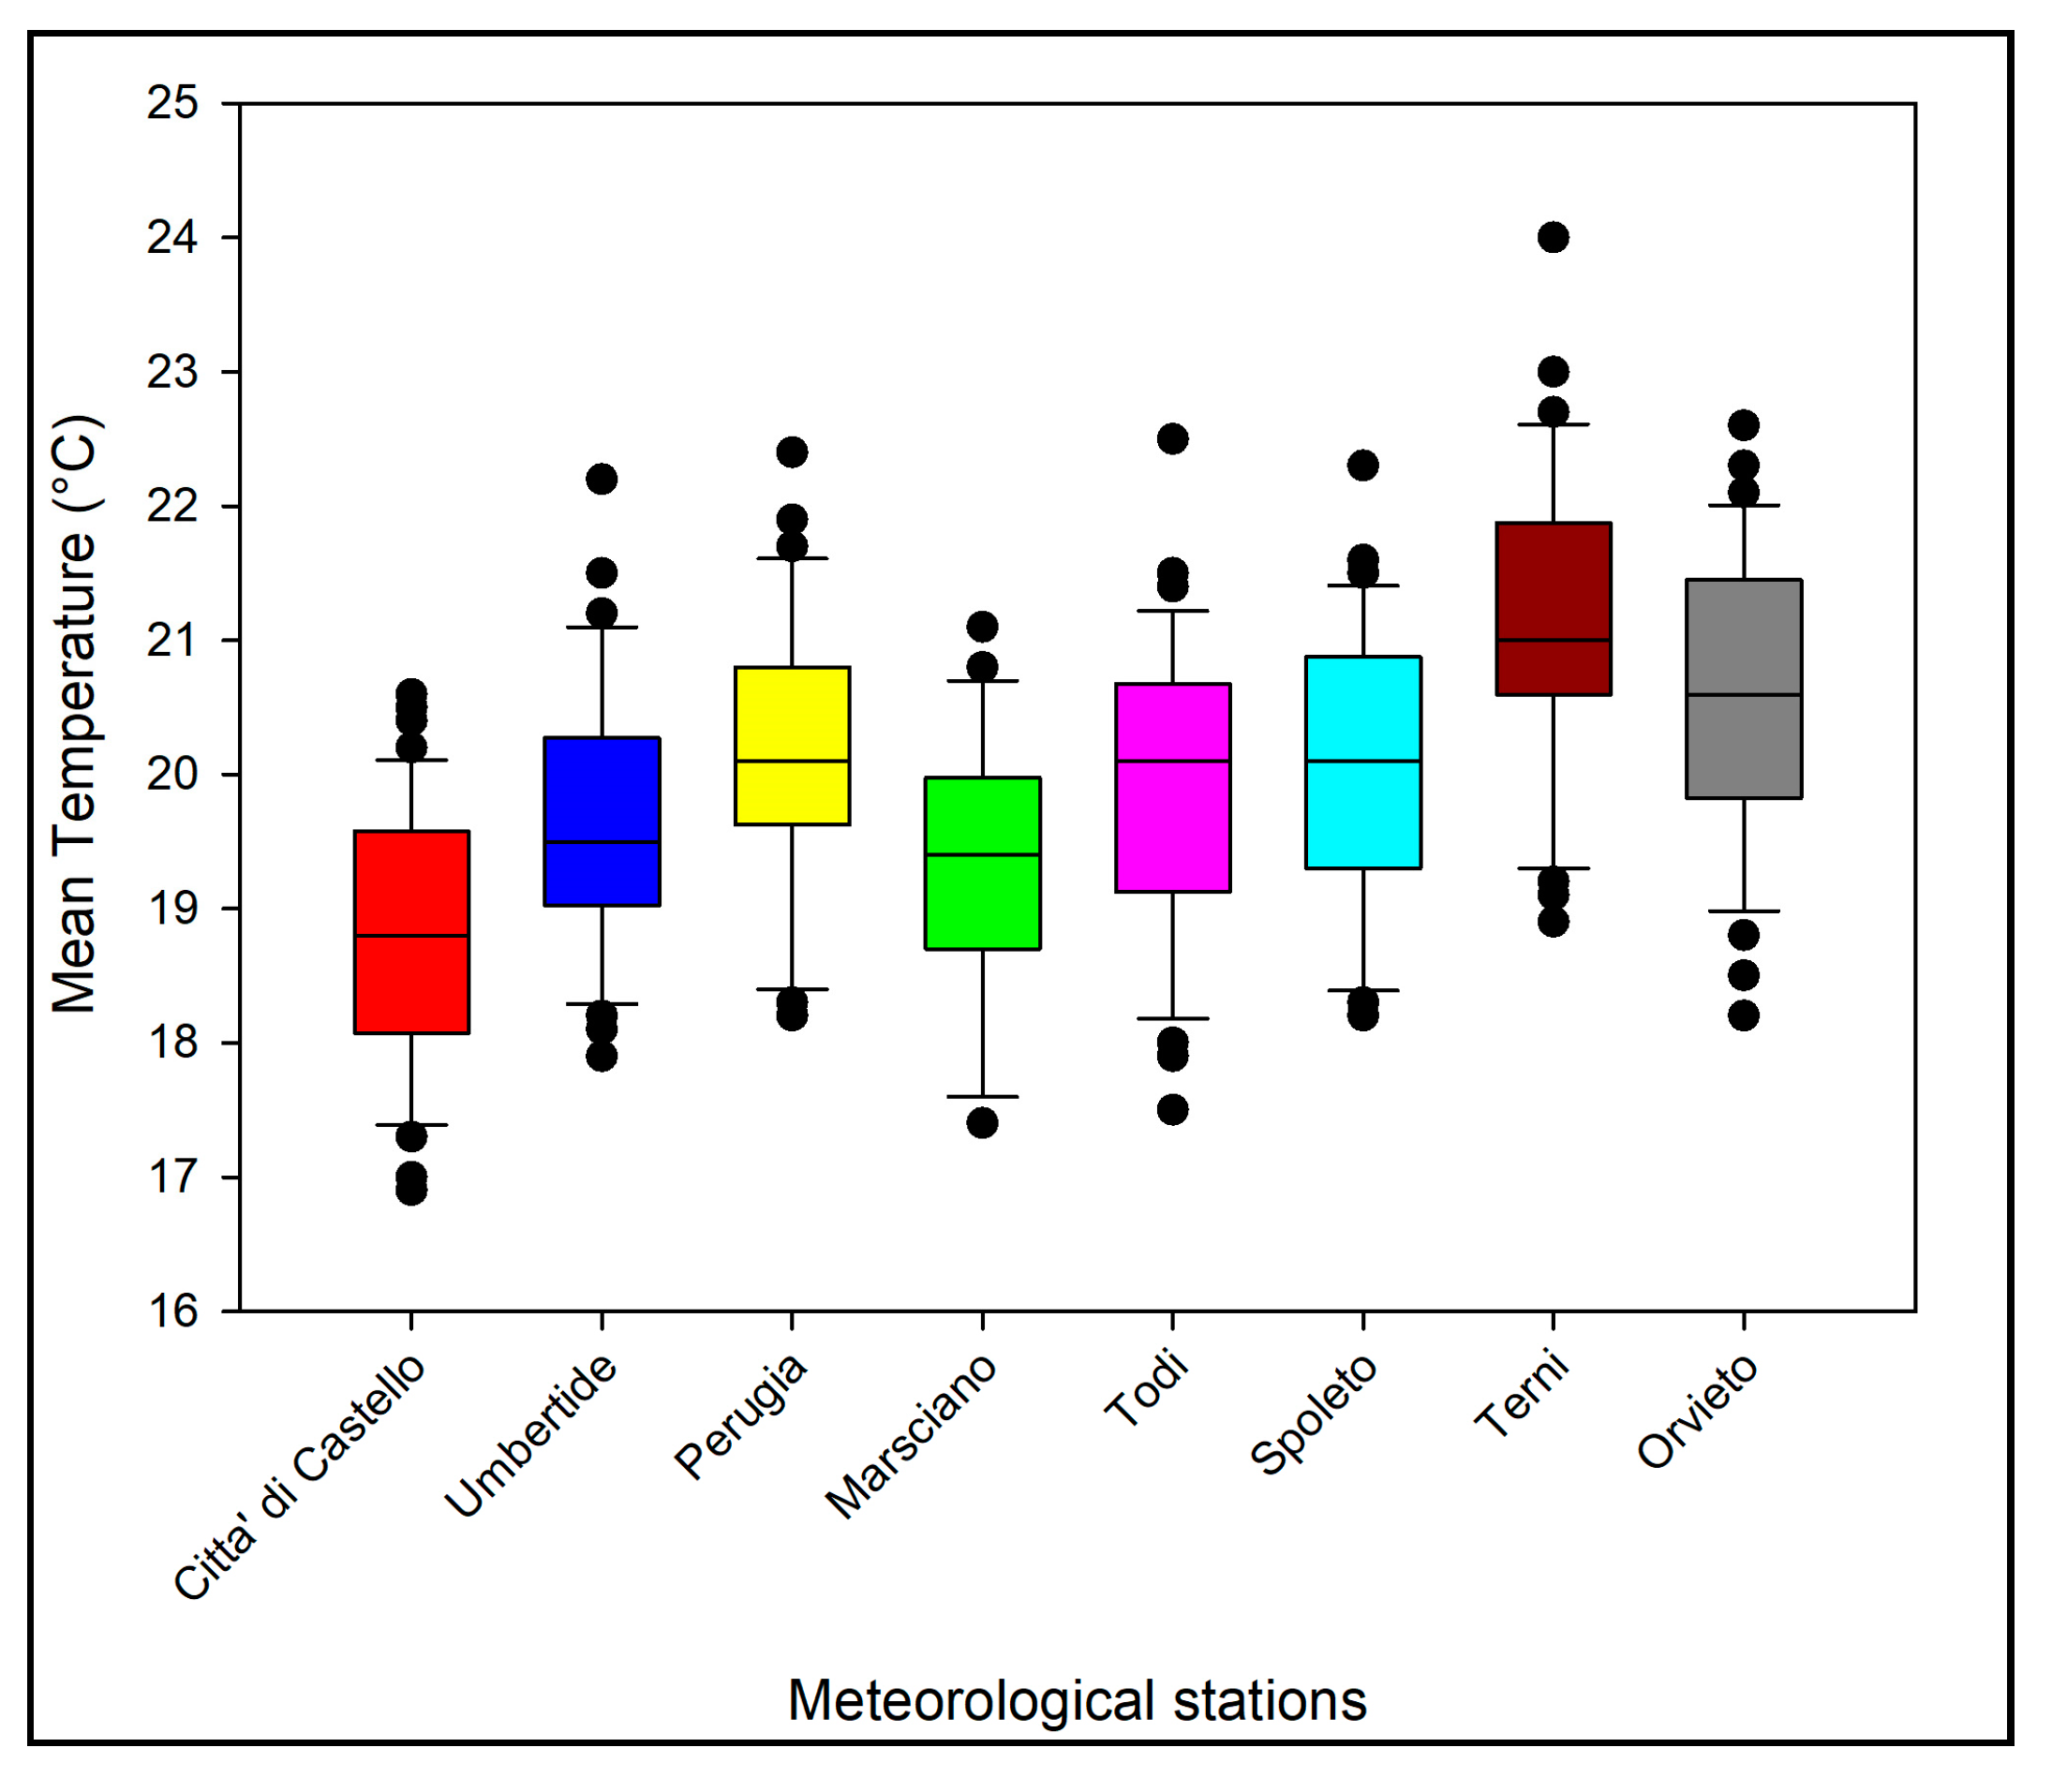
3.1. Analysis of the Precipitation and Temperature on the Umbria Region

In Figure 2, the statistical descriptors of the precipitation recorded from April to September are reported for each Umbrian station. In Figure S1, the same sample descriptors are reported per year. Table S1 reports the annual cumulated precipitation (mm), while Table S2 reports the monthly precipitation (mm) for each meteorological station for the period of 1974–2021. The year 2011 was recorded as the driest year in Città di Castello, Spoleto, and Todi stations (with less than 570 mm of precipitation); the year 1985 was the driest in Orvieto and Perugia stations (around 500 mm); the year 2007 was the driest for Terni (517 mm) and 2017 for Marsciano (472 mm) (Table S1). The driest month was July in all of the meteorological stations, with 36 mm of precipitation on average, followed by August (51 mm of precipitation on average), while the wettest month was November, with 112 mm of precipitation on average (Table S2).
The mean April–September precipitation values varied from 317.72 mm, in Orvieto, to 410.52 mm in Todi and Spoleto. The minimum precipitation was registered in Orvieto (98.8 mm), followed by Todi (104.7 mm), Marsciano (115.8 mm), and Umbertide (120.4 mm). The maximum value of precipitation was observed in Perugia (661.2 mm), followed by Marsciano (640.2 mm) and Spoleto (636.4 mm). In the studied period, a difference of about 100 mm of total precipitation was observed between the rainiest (Todi, Spoleto) and the least rainy location (Orvieto).
Figure 3 shows the statistical descriptors of the temperature (April–September) in each Umbrian station. The mean temperature values varied from 18.83 °C in Città di Castello (North of the Region) to 21.1 °C in Terni (South of the Region). The minimum temperature was registered in Città di Castello (16.9 °C), followed by Marsciano (17.4 °C) and Todi (17.5 °C). The maximum temperature was observed in Terni (24 °C), followed by Perugia (22.6 °C) and Todi (22.5 °C). In the studied period, a difference of about 2 °C was observed between the coldest (Città di Castello) and the warmest (Terni) location (Tables S1 and S2).

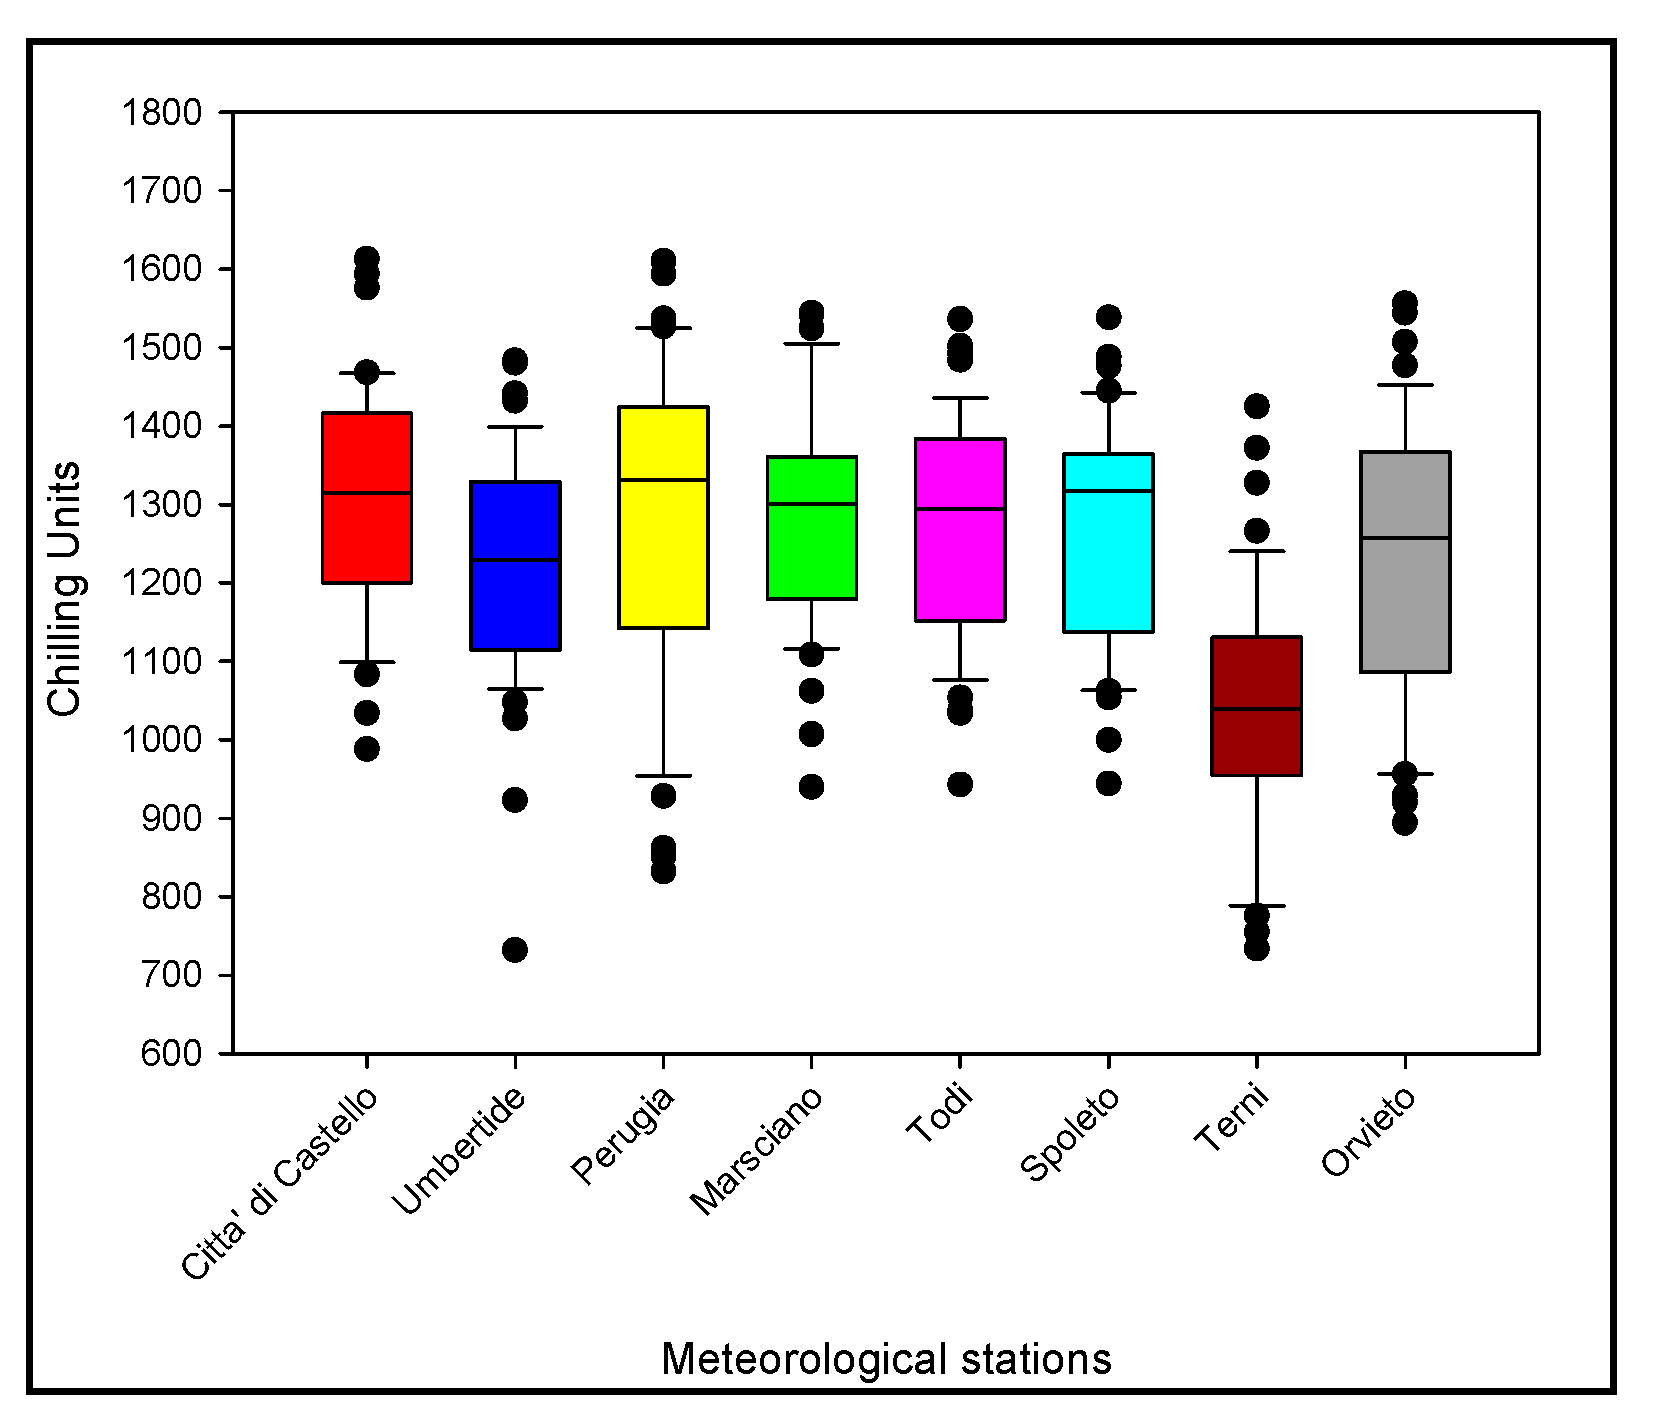
3.2. Estimation of Chilling Accumulation (CU)

In Figure 4, the box plots of chilling units per station were reported. Figure S2 shows the chilling units per year. The chilling accumulation was, on average, over 1200 CU for each station, with a median value of 1300 CU. The minimum value of 988 CU was recorded in the year 2015 for Città di Castello station (Figure S2) and 734 CU in 2001 for Terni station. On the other hand, in the stations of Marsciano, Orvieto, Perugia, Spoleto, Todi, and Umbertide, the lowest chilling accumulation was recorded in 2020, respectively, as 940 CU, 894 CU, 832 CU, 944 CU, 943 CU, and 732 CU.

3.3. Estimation of 4-Month SPI

In Figure 5, the annual values (1974–2021) of the Standard Precipitation Index (SPI) were reported for each station (Figure S3). As shown in Figure 5, the SPI for all the stations were lower than −1 for a minimum of 7 years. Specifically, in Città di Castello and Marsciano, 7 years resulted in dryness (SPI < −1), with minimum SPI values of −2.74 (2021) and −2.6 (1990), respectively.
For Perugia, Terni, and Orvieto, 8 years resulted in dryness (SPI < −1), with minimum SPI values equal to −2.34 (2001), −2.36 (2021), and −2.77 (1993), respectively.
Umbertide e Todi registered 9 very dry years (SPI < −1) with minimum SPI values of −2.49 (1979) and −2.3 (2021).
For Spoleto, 10 years resulted in dryness (SPI < −1), with a minimum SPI value of −1.89 (2017). Therefore, the year 2021 resulted in a dry (SPI < −1) or very dry (SPI < −2) year for all the stations.

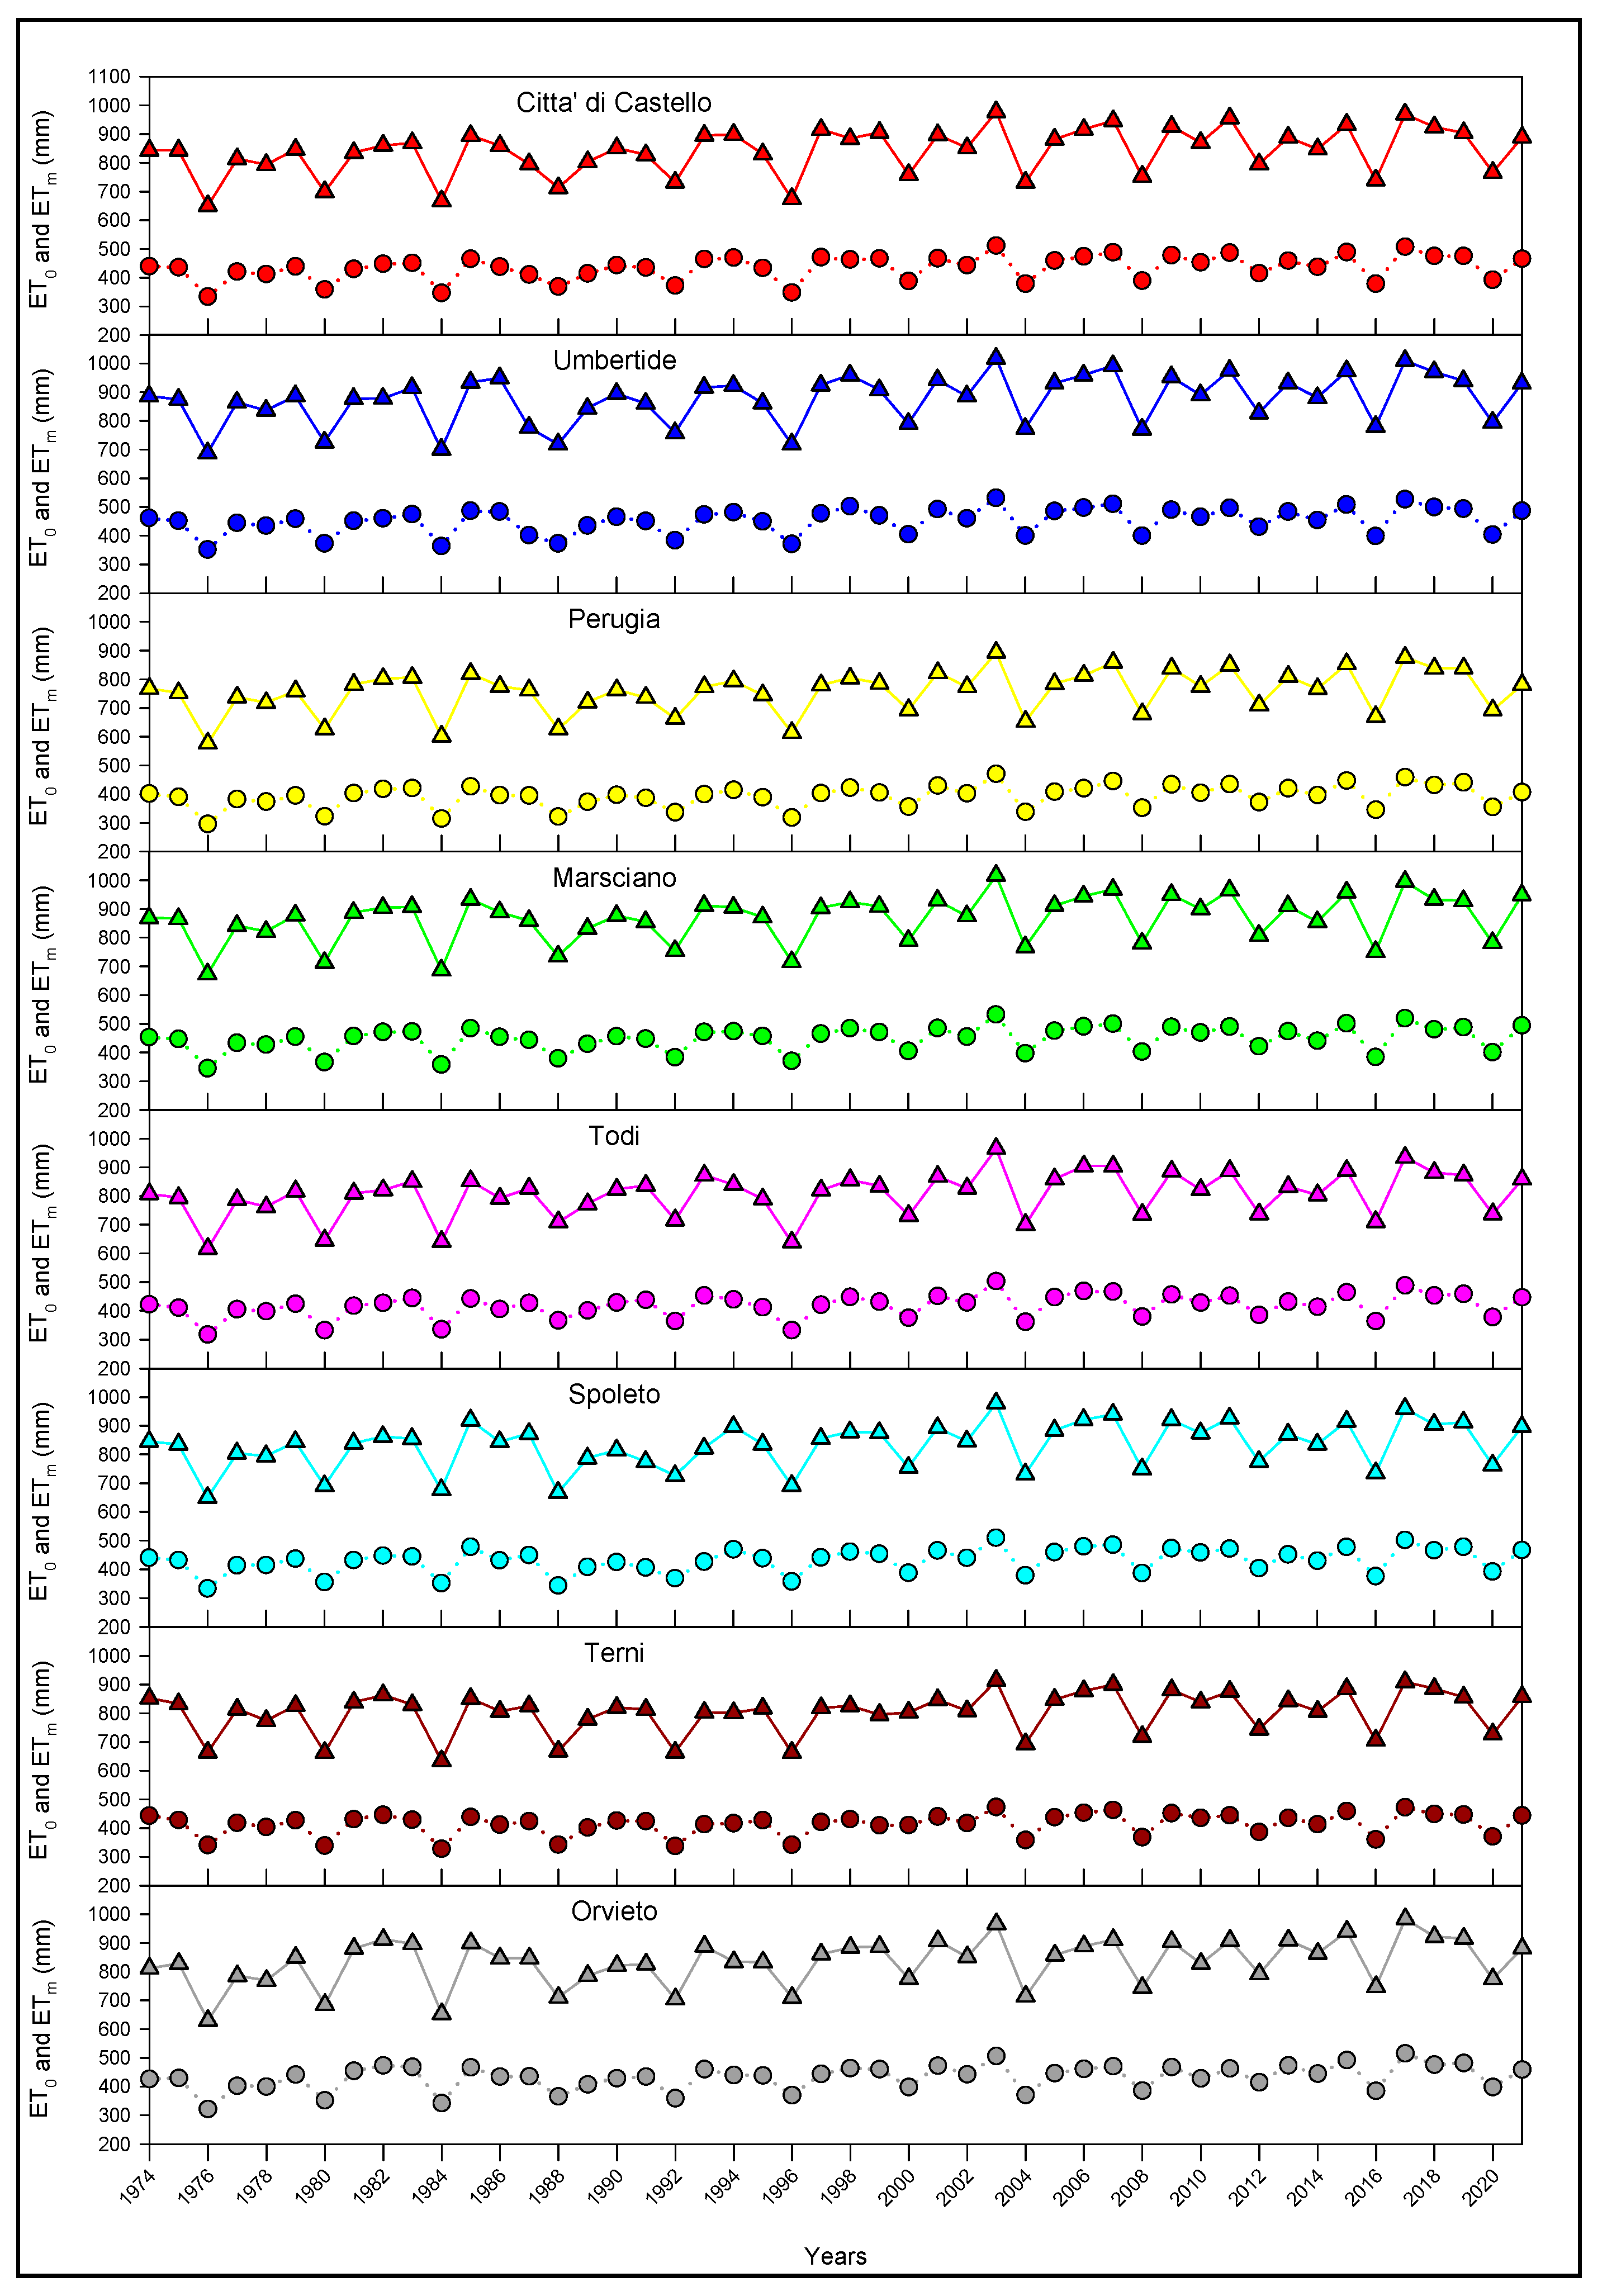
3.4. Estimation of Reference Evapotranspiration (ET0), Crop Evapotranspiration (ETm), and Water Balance

The April–September reference evapotranspiration ET0, relative to the period 1974–2021, evaluated using Equation (4), was reported for all the stations in Figure 6. Figure S4 shows the box plots of ET0 for each station.
The minimum value of ET0 was obtained for Perugia (577.3 mm), while the maximum value ET0 was evaluated for Umbertide (1018.4 mm), followed by Marsciano (1016.5 mm). On average, in the Umbria region, ET0 varies from 758 mm (Perugia) to 875 mm (Umbertide).
Except for Orvieto, the highest ET0 values for the station were recorded in the year 2003, with an average value of 966 mm. In Orvieto, the ET0 reached its maximum peak (984 mm) in 2017.
The crop evapotranspiration ETm for the growing season (April–September) of the period 1974–2021, evaluated using Equation (3), was also reported in Figure 6. In Figure S5 the box plots of ETm for each station were reported.
The results are in accordance with those obtained for the ET0. It is due to the coefficient kc of Equation (3) that it is fixed. Thus, the minimum value of ETm was obtained for Perugia (296.4 mm), while the maximum value was obtained for Umbertide (531.9 mm) and Marsciano (532 mm).
The average value of ETm varied from 453.3 mm (Umbertide) to 393.3 mm (Perugia).
In Figure 7a, the water requirement for loam soil during June–August was evaluated using Equation (1) and reported for all the stations. Figure S6 shows the water requirements from June to August per loam soil, recorded from 1974 to 2021 in each station. As shown in Figure 7a, higher values of water requirements were assessed for Marsciano, Orvieto, Umbertide, and Città di Castello.
Reducing the period of the analysis to July–August, the results, reported in Figure 7b and in Figure S7 for each station and year, confirmed that the locations of Orvieto, Marsciano, Umbertide, and Città di Castello, had more onerous results in terms of water requirements.
The analysis was repeated under the hypothesis of silty clay soil for the period of June–August (Figure 8a and Figure S8) and for the short period of July–August (Figure 8b and Figure S9). In all the cases, Marsciano showed the highest hazelnut water requirement.

3.5. Statistical Analysis of the Trends

As described above, the nonparametric Mann–Kendall test was used to detect the trend of the meteorological (precipitation, temperature, chilling units) and hydrological variables (ET0, ETm, water requirements) used in this study from 1974 to 2021. In Table 3, only the variables that showed a significant increasing/decreasing trend were reported.
For the precipitation, although the amount of precipitation decreased from 1974 to 2021, the Mann–Kendall test shows no significant trends.
Contrarily, for temperatures from April to September (Table 3), the results for all the stations registered showed a significantly increasing trend.
For the chilling units, all stations, except for Terni and Perugia (no observed trends), showed a significantly decreasing trend (Table 3).
For the SPI index, the Mann–Kendall test showed no significant trends.
The trend assessed for temperature, both ET0 and ETm, were significantly increasing, except for ET0 in Terni (Table 3).
The analysis of trends of water requirements (Table 3) showed that for the loam soil, during the period of June–August and July–August, only Umbertide has a significant increasing trend. Under the hypothesis of silty clay soil, no trends were observed for the period of June–August, while for the period of July–August, a significant increasing trend (α = 0.05) was found in Città di Castello, Orvieto, Todi, and Umbertide (Table 3).

4. Discussion

In central Italy, although the amount of precipitation decreased from 1974 to 2021, no significant trends were observed, which is in agreement with observations by [2] in California for the period of 1895–2011 and by [22] in Turkey from 1984–2021. However, the effects of climate change may depend on the specific regional and temporal scales showing different trends of variation, contrary to other authors [6,22,43,44].
On the other hand, for the temperatures recorded from April to September, all the stations registered an increasing trend, meaning very hot late summers. These changes in temperature may lead to a significant decrease in hazelnut yield and affect the grain-filling phenological process. In fact, hazelnut is a tree crop sensitive to water stress [17,18], low relative humidity, and high air and leaf temperatures, which may induce severe stomatal limitations and then reduce the net photosynthesis [6,9,17,45].
Concerning the chilling requirement of hazelnut buds, despite evidence of a decreasing trend of the chilling accumulation in almost all studied stations, it is still satisfied in all areas of the region. In fact, to date, the chilling units are higher than those indicated by Mehlembacher [46] for the Tonda Gentile delle Langhe cultivar (600–800 h for female flowers and 350–600 for male catkins). We cannot exclude that, in the future, the chilling accumulation in Umbria will not satisfy the hazelnut requirements, in accordance with the results reported by [47] in North-Eastern Slovenia, by [20] in Australia, and by [7] in Spain as well for other crops.
The analysis of trends shows a climate change scenario for hazelnut trees cultivated in Central Italy. Specifically, the increase in temperature will determine the decrease in the chilling unit accumulation in almost all the regions, except in Perugia and Terni stations, both of which experienced an increase in ET0 and ETm, with the exclusion of the Terni area. This scenario suggests an increase in water requirements to cultivate hazelnuts, especially in the summer months of July and August when nut fruits grow and ripen. Moreover, the water requirements will be higher for orchards cultivated in silty clay loam soils than those in loam soils. Significant trends have been shown for the stations located in the northern parts of the region and in the southwestern parts (Figure 1).
The significant trend observed in evapotranspiration reflects the joint effects of climate parameters and plant coefficients and is in accordance with what is observed in recent literature [2,22,44].
The increasing trends of the water requirements agree with those developed, though for the olive tree, using a soil water balance as well as climate data are required, according to Branquinho [21]. Several studies pointed out that in order to achieve the optimum yield and, at the same time, save water, it is necessary to accurately determine the water requirements of plants, especially during the summer months when it is essential to compensate the plant’s water deficit with irrigation [21,22,44]. This information is crucial for hazelnut irrigation and crop planning in the different agroclimatic regions. To date, hazelnut growers use an indicative frequency and amount of irrigation that is not supported by any reliable criteria. An optimal scientific irrigation strategy will allow it to meet the crop’s requirements, improving its production in terms of yield and quality [22,48,49,50].
The results obtained in this study can be very helpful for the development of appropriate irrigation management plans for hazelnut trees, especially in the inner part of Central Italy, which is characterized by an increasing trend of water requirement without significant changes in precipitation. Further research dealing with the optimization of irrigation in hazelnut production is needed, especially in the face of ongoing climate changes.

5. Conclusions

The aims of this study were to investigate the effects of climate change on climatic parameters and water requirements in hazelnut cultivation areas for two types of soil within the Umbria region in Central Italy.
The analysis of trends shows a climate change scenario for hazelnut trees cultivated in Central Italy. In fact, the results showed that in the last 47 years, temperatures and chilling accumulation had had, respectively, a significant increase and a decrease, although the chilling accumulation is still over the critical threshold, while precipitation had not varied. The hazelnut water requirement was significantly affected by climate change in some areas of the region, showing a significant increase. The greater and increased water requirements for hazelnut trees occurred mainly in the July–August period, especially in silty clay soil. All these suggest that the planning and designing of new irrigation systems, awareness of global warming effects, together with the use of efficient management practices, such as grafting [12,16,51], may become the solutions for hazelnut production in terms of efficiency and sustainability.

Supplementary Materials

The following supporting information can be downloaded at: www.mdpi.com/article/10.3390/horticulturae9050593/s1; Table S1: Annual cumulated precipitation (mm) for each meteorological station for the period 1974–2021; Table S2: Monthly precipitation (mm) for each meteorological station for the period 1974–2021; Table S3: Minimum and maximum monthly cumulated precipitation (mm) for each meteorological station for the period 1974–2021; Table S4: Annual maximum temperatures (T. max), monthly maximum temperatures (47 years averages), and standard errors per meteorological station and month; Table S5: Annual minimum temperatures (T. min), monthly minimum temperatures (47 years averages), and standard errors per meteorological station and month; Table S6: Annual mean temperatures (T. mean), monthly mean temperatures (47 years averages), and standard errors per meteorological station and month; Figure S1: Precipitations from April to September recorded from 1974 to 2021 in each meteorological station represented by different colors and per year; Figure S2: Chilling units recorded from 1974 to 2021 in each meteorological station represented by different colors and per year; Figure S3: Box plots of Standard Precipitation Index (SPI) from 1974 to 2021 at 4-month time scales (June–August). Whiskers (error bars) above and below the box indicate the 90th and 10th percentiles. The horizontal lines show the median values. Black dots display extreme data points; Figure S4: Box plots of ET0 from April to September, from 1974 to 2021, for each meteorological station represented by different colors. Whiskers (error bars) above and below the box indicate the 90th and 10th percentiles. The horizontal lines show the median values. Black dots display extreme data points; Figure S5: Box plots of ETm from April to September, from 1974 to 2021, per each meteorological station represented by different colors. Whiskers (error bars) above and below the box indicate the 90th and 10th percentiles. The horizontal lines show the median values. Black dots display extreme data points; Figure S6: Water requirements from June to August per loam soil, recorded from 1974 to 2021 in each meteorological station. The black lines indicate the trend; Figure S7: Water requirements from July to August per loam soil, recorded from 1974 to 2021 in each meteorological station represented by different colors. The black lines indicate the trend; Figure S8: Water requirements from June to August per silty clay soil, recorded from 1974 to 2021 in each meteorological station represented by different colors. The black lines indicate the trend; Figure S9: Water requirements from July to August per silty clay soil, recorded from 1974 to 2021 in each meteorological station represented by different colors. The black lines indicate the trend.

Author Contributions

Conceptualization, A.V., B.D.L. and D.F.; methodology, A.V. and B.D.L.; formal analysis, A.V. and B.D.L.; investigation, A.V., B.D.L. and D.F.; data curation, B.D.L.; writing—original draft preparation, A.V. and D.F.; writing—review and editing, A.V., S.P. and D.F.; visualization, D.F.; supervision, A.V. and D.F. All authors have read and agreed to the published version of the manuscript.

Funding

This research received no external funding.

Acknowledgments

The authors would like to express their gratitude to L. Vergni and G. Curci for the data and the procedures of the gap filling and validation of data, respectively.

Conflicts of Interest

The authors declare no conflict of interest.

References

  1. Freitas, T.R.; Santos, J.A.; Silva, A.P.; Fraga, H. Influence of climate change on chestnut trees: A review. Plants 2021, 10, 1463. [Google Scholar] [CrossRef]
  2. Pathak, T.B.; Maskey, M.L.; Dahlberg, J.A.; Kearns, F.; Bali, K.M.; Zaccaria, D. Climate change trends and impacts on California agriculture: A detailed review. Agronomy 2018, 8, 25. [Google Scholar] [CrossRef]
  3. Pantelidis, G.; Mavromatis, T.; Drogoudi, P. Consecutive wet days may impede fruit quality of peach and nectarine and cause fruit drop. Sci. Hortic. 2021, 282, 110011. [Google Scholar] [CrossRef]
  4. Valdes-Abellan, J.; Pardo, M.A.; Tenza-Abril, A.J. Observed precipitation trend changes in the western Mediterranean region. Int. J. Climatol. 2017, 37, 1285–1296. [Google Scholar] [CrossRef]
  5. Cramer, W.; Guiot, J.; Fader, M.; Garrabou, J.; Gattuso, J.-P.; Iglesias, A.; Lange, M.A.; Lionello, P.; Llasat, M.C.; Paz, S.; et al. Climate change and interconnected risks to sustainable development in the Mediterranean. Nat. Clim. Chang. 2018, 8, 972–980. [Google Scholar] [CrossRef]
  6. An, N.; Turp, M.T.; Türkeş, M.; Kurnaz, M.L. Mid-term impact of climate change on hazelnut yield. Agriculture 2020, 10, 159. [Google Scholar] [CrossRef]
  7. Rodríguez, A.; Pérez-López, D.; Centeno, A.; Ruiz-Ramos, M. Viability of temperate fruit tree varieties in Spain under climate change according to chilling accumulation. Agric. Syst. 2021, 186, 102961. [Google Scholar] [CrossRef]
  8. Di Lena, B.; Curci, G.; Vergni, L.; Farinelli, D. Climatic Suitability of Different Areas in Abruzzo, Central Italy, for the Cultivation of Hazelnut. Horticulturae 2022, 8, 580. [Google Scholar] [CrossRef]
  9. Luciani, E.; Palliotti, A.; Frioni, T.; Tombesi, S.; Villa, F.; Zadra, C.; Farinelli, D. Kaolin treatments on Tonda Giffoni hazelnut (Corylus avellana L.) for the control of heat stress damages. Sci. Hortic. 2020, 263, 109097. [Google Scholar] [CrossRef]
  10. Tercan, E.; Dengiz, O.; Özkan, B.; Dereli, M.A.; Öztekin, Y.B. Geographic information system–assisted site quality assessment for hazelnut cultivation using multi-criteria decision analysis in the Black Sea region, Turkey. Environ. Sci. Pollut. Res. 2022, 29, 35908–35933. [Google Scholar] [CrossRef]
  11. FAOSTAT Crops and Livestock Products. 2021. Available online: https://www.fao.org/faostat/en/#data (accessed on 10 February 2023).
  12. Vinci, A.; Brigante, R.; Traini, C.; Farinelli, D. Geometrical Characterization of Hazelnut Trees in an Intensive Orchard by an Unmanned Aerial Vehicle (UAV) for Precision Agriculture Applications. Remote. Sens. 2023, 15, 541. [Google Scholar] [CrossRef]
  13. Silvestri, C.; Bacchetta, L.; Bellincontro, A.; Cristofori, V. Advances in cultivar choice, hazelnut orchard management, and nut storage to enhance product quality and safety: An overview. J. Sci. Food Agric. 2021, 101, 27–43. [Google Scholar] [CrossRef] [PubMed]
  14. Piano Corilicolo Nazionale. 2022. Available online: https://www.politicheagricole.it/flex/cm/pages/ServeBLOB.php/L/IT/IDPagina/3282 (accessed on 10 March 2023).
  15. Bregaglio, S.; Orlando, F.; Forni, E.; De Gregorio, T.; Falzoi, S.; Boni, C.; Pisetta, M.; Confalonieri, R. Development and evaluation of new modelling solutions to simulate hazelnut (Corylus avellana L.) growth and development. Ecol. Model. 2016, 329, 86–99. [Google Scholar] [CrossRef]
  16. Portarena, S.; Gavrichkova, O.; Brugnoli, E.; Battistelli, A.; Proietti, S.; Moscatello, S.; Famiani, F.; Tombesi, S.; Zadra, C.; Farinelli, D. Carbon allocation strategies and water uptake in young grafted and own-rooted hazelnut (Corylus avellana L.) cultivars. Tree Physiol. 2022, 42, 939–957. [Google Scholar] [CrossRef] [PubMed]
  17. Cincera, I.; Frioni, T.; Ughini, V.; Poni, S.; Farinelli, D.; Tombesi, S. Intra-specific variability of stomatal sensitivity to vapour pressure deficit in Corylus avellana L.: A candidate factor influencing different adaptability to different climates? J. Plant Physiol. 2019, 232, 241–247. [Google Scholar] [CrossRef]
  18. Streit, M.; Gehlenborg, N. Points of view: Bar charts and box plots. Nat. Methods 2014, 11, 117. [Google Scholar] [CrossRef]
  19. Luciani, E.; Palliotti, A.; Tombesi, S.; Gardi, T.; Micheli, M.; Berrios, J.G.; Farinelli, D. Mitigation of multiple summer stresses on hazelnut (Corylus avellana L.): Effects of the new arbuscular mycorrhiza Glomus iranicum tenuihypharum sp. nova. Sci. Hortic. 2019, 257, 108659. [Google Scholar] [CrossRef]
  20. Jha, P.K.; Materia, S.; Zizzi, G.; Costa-Saura, J.M.; Trabucco, A.; Evans, J.; Bregaglio, S. Climate change impacts on phenology and yield of hazelnut in Australia. Agric. Syst. 2021, 186, 102982. [Google Scholar] [CrossRef]
  21. Branquinho, S.; João, R.; Teixeira, J.L. Climate change adaptation measures in the irrigation of a super-intensive olive orchard in the south of Portugal. Agronomy 2021, 11, 1658. [Google Scholar] [CrossRef]
  22. Ucar, Y.; Kocięcka, J.; Liberacki, D.; Rolbiecki, R. Analysis of Crop Water Requirements for Apple Using Dependable Precipitation. Atmosphere 2023, 14, 99. [Google Scholar] [CrossRef]
  23. Vergni, L.; Todisco, F. Spatio-temporal variability of precipitation, temperature and agricultural drought indices in Central Italy. Agric. For. Meteorol. 2011, 151, 301–313. [Google Scholar] [CrossRef]
  24. Khavari, M.; Fatahi, R.; Zamani, Z. Salicylic acid and kaolin effects on pomological, physiological, and phytochemical characters of hazelnut (Corylus avellana) at warm summer condition. Sci. Rep. 2021, 11, 4568. [Google Scholar] [CrossRef] [PubMed]
  25. Cabo, S.; Aires, A.; Carvalho, R.; Vilela, A.; Pascual-Seva, N.; Silva, A.P.; Gonçalves, B. Kaolin, Ascophyllum nodosum and salicylic acid mitigate effects of summer stress improving hazelnut quality. J. Sci. Food Agric. 2021, 101, 459–475. [Google Scholar] [CrossRef]
  26. Fratianni, S.; Acquaotta, F. The Climate of Italy. In Landscapes and Landforms of Italy. World Geomorphological Landscapes; Soldati, M., Marchetti, M., Eds.; Springer: Cham, Switzerland, 2017. [Google Scholar] [CrossRef]
  27. Curci, G.; Guijarro, J.A.; Di Antonio, L.; Di Bacco, M.; Di Lena, B.; Scorzini, A.R. Building a local climate reference dataset:Application to the Abruzzo region (Central Italy), 1930–2019. Int J Climatol. 2021, 41, 4414–4436. [Google Scholar] [CrossRef]
  28. SigmaPlot, version 13; Systat Software, Inc.: San Jose, CA, USA, 2016.
  29. Farinelli, D.; Portarena, S.; Da Silva, D.F.; Traini, C.; Da Silva, G.M.; Da Silva, E.C.; da Veiga, J.F.; Pollegioni, P.; Villa, F. Variability of Fruit Quality among 103 Acerola (Malpighia emarginata DC) Phenotypes from the Subtropical Region of Brazil. Agriculture 2021, 11, 1078. [Google Scholar] [CrossRef]
  30. Farinelli, D.; Boco, M.; Tombesi, A. Influence of canopy density on fruit growth and flower formation. Acta Hortic. 2005, 686, 247–252. [Google Scholar] [CrossRef]
  31. Vergni, L.; Vinci, A.; Todisco, F. Effectiveness of the new standardized deficit distance index and other meteorological indices in the assessment of agricultural drought impacts in central Italy. J. Hydr. 2021, 603, 126986. [Google Scholar] [CrossRef]
  32. Allen, R.G.; Pereira, L.S.; Raes, D.; Smith, M. Crop Evapotranspiration-Guidelines for Computing Crop Water Requirements-FAO Irrigation and Drainage Paper 56; FAO: Rome, Italy, 1998; p. 300. Available online: https://www.fao.org/3/X0490E/x0490e00.htm#Contents (accessed on 10 January 2023).
  33. Gucci, R. Irrigazione. In Collana Divulgativa; dell’Accademia Nazionale dell’olivo e dell’olio: Spoleto, Italy, 2012; Volume IX, ISSN 2281-4930. [Google Scholar]
  34. Vinci, A.; Traini, C.; Farinelli, D.; Brigante, R. Assessment of the geometrical characteristics of hazelnut intensive orchard by an Unmanned Aerial Vehicle (UAV). In Proceedings of the 2022 IEEE Workshop on Metrology for Agriculture and Forestry (MetroAgriFor), Perugia, Italy, 3–5 November 2022; pp. 218–222. [Google Scholar] [CrossRef]
  35. Vinci, A.; Traini, C.; Portarena, S.; Farinelli, D. Assessment of the Midseason Crop Coefficient for the Evaluation of the Water Demand of Young, Grafted Hazelnut Trees in High-Density Orchards. Water 2023, 15, 1683. [Google Scholar] [CrossRef]
  36. Hargreaves, G.H.; Samani, Z.A. Reference Crop Evapotranspiration from Temperature. Appl. Eng. Agric. 1985, 1, 96–99. [Google Scholar] [CrossRef]
  37. Todisco, F.; Vergni, L. Climatic changes in Central Italy and their potential effects on corn water consumption. Agric. For. Meteorol. 2008, 148, 1–11. [Google Scholar] [CrossRef]
  38. Valentini, N.; Moraglio, S.T.; Rolle, L.; Tavella, L.; Botta, R. Nut and kernel growth and shell hardening in eighteen hazelnut cultivars (Corylus avellana L.). Hortic. Sci. 2015, 42, 149–158. [Google Scholar] [CrossRef]
  39. Tombesi, A.; Rosati, A. Hazelnut response to water levels in relation to productive cycle. Acta Hortic. 1997, 445, 269–278. [Google Scholar] [CrossRef]
  40. Mannocchi, F.; Vinci, A. Risparmio Idrico e Pianificazione dell’uso Della Risorsa a Scopo Irriguo, 1st ed.; Nuova Bios: Castrolibero, Italy, 2009. [Google Scholar]
  41. Mann, H.B. Nonparametric tests against trend. Econom. J. Econom. Soc. 1945, 13, 245–259. [Google Scholar] [CrossRef]
  42. Kendall, M. Rank Correlation Methods; Griffin & Co: London, UK, 1975; ISBN 0-85264-199-0. [Google Scholar]
  43. Ahmadi, H.; Baaghideh, M. Assessment of anomalies and effects of climate change on reference evapotranspiration and water requirement in pistachio cultivation areas in Iran. Arab. J. Geosci. 2020, 13, 332. [Google Scholar] [CrossRef]
  44. Watson-Hernández, F.; Serrano-Núñez, V.; Gómez-Calderón, N.; Pereira da Silva, R. Quantification and Evaluation of Water Requirements of Oil Palm Cultivation for Different Climate Change Scenarios in the Central Pacific of Costa Rica Using APSIM. Agronomy 2022, 13, 19. [Google Scholar] [CrossRef]
  45. Mehlenbacher, S.A. Chilling requirements of hazelnut cultivars. Sci. Hortic. 1991, 47, 271–282. [Google Scholar] [CrossRef]
  46. Mehlenbacher, S.A. Hazelnuts (Corylus). Acta Hortic. 1991, 290, 791–838. [Google Scholar] [CrossRef]
  47. Črepinšek, Z.; Štampar, F.; Kajfež-Bogataj, L.; Solar, A. The response of Corylus avellana L. phenology to rising temperature in north-eastern Slovenia. Int. J. Biometeorol. 2012, 56, 681–694. [Google Scholar] [CrossRef]
  48. Kireva, R.; Mihov, M. Reduction of losses from drought by optimizing the use of water resources for irrigation of agricultural crops. Mech. Agric. Conserv. Resour. 2019, 65, 190–192. [Google Scholar]
  49. Stachowski, P.; Jagosz, B.; Rolbiecki, S.; Rolbiecki, R. Predictive capacity of precipitation data to estimate the water needs of fruit plants in water deficit areas. Atmosphere 2021, 12, 550. [Google Scholar] [CrossRef]
  50. Kahlown, M.A.; Ashraf, M. Effect of shallow groundwater table on crop water requirements and crop yields. Agric. Water Manag. 2005, 76, 24–35. [Google Scholar] [CrossRef]
  51. Farinelli, D.; Luciani, E.; Villa, F.; Manzo, A.; Tombesi, S. First selection of non-suckering rootstocks for hazelnut cultivars. Acta Hortic. 2022, 1346, 699–708. [Google Scholar] [CrossRef]
Figure 1. The map of Italy with the Umbria Region located on the upper right and the eight meteorological stations highlighted with dots in black.
Horticulturae 09 00593 g001
Figure 2. Box plots of precipitation from April to September for each meteorological station represented by different colors (from 1974–2021). Whiskers (error bars) above and below the box indicate the 90th and 10th percentiles. The horizontal lines show the median values. Black dots display extreme data points.
Horticulturae 09 00593 g002
Figure 3. Box plots of mean temperatures from April to September for each meteorological station represented by different colors (from 1974 to 2021). Whiskers (error bars) above and below the box indicate the 90th and 10th percentiles. The horizontal lines show the median values. Black dots display extreme data points.
Horticulturae 09 00593 g003
Figure 4. Box plots of chilling units for each meteorological station represented by different colors (from 1974 to 2021). Whiskers (error bars) above and below the box indicate the 90th and 10th percentiles. The horizontal line shows the median value. Black dots display extreme data points.
Horticulturae 09 00593 g004
Figure 5. Standard Precipitation Index (SPI) from 1974 to 2021 for 4 months (June–August) per meteorological station represented by different colors. Dotted lines (--) indicate a SPI value +1 (surplus) and a value −1 (deficit).
Horticulturae 09 00593 g005
Figure 6. ET0 ( triangle symbols) and ETm (circle symbols) from April to September, recorded from 1974 to 2021 in each meteorological station.
Horticulturae 09 00593 g006
Figure 7. (a) Box plots of water requirements from June to August per meteorological station represented by different colors and per loam soil (from 1974 to 2021). Whiskers (error bars) above and below the box indicate the 90th and 10th percentiles. The horizontal lines show the median values. Symbols display extreme data points. (b) Box plots of water requirements from July to August per meteorological station and per loam soil (from 1974 to 2021). Whiskers (error bars) above and below the box indicate the 90th and 10th percentiles. The horizontal lines show the median values. Symbols display extreme data points.
Horticulturae 09 00593 g007
Figure 8. (a) Box plots of water requirements from June to August per each meteorological station, represented by different colors, and per silty clay soil (from 1974 to 2021). Whiskers (error bars) above and below the box indicate the 90th and 10th percentiles. The horizontal lines show the median values. Symbols display extreme data points. (b) Box plots of water requirements from July to August per each meteorological station and per silty clay soil. Whiskers (error bars) above and below the box indicate the 90th and 10th percentiles. The horizontal lines show the median values. Symbols display extreme data points.
Horticulturae 09 00593 g008
Table 1. Names of meteorological stations, geographical coordinates, and altitudes of each station.
Meteorological
Station Name
Latitude
World Geodetic System 84 (WGS 84)
Longitude World Geodetic System 84 (WGS 84)Altitude
(m a.s.l.)
Città di Castello43.4613888912.25138889304
Marsciano42.9477777812.28361111244
Orvieto42.7180312.10773315
Perugia43.10124212.395929439
Spoleto42.7558333312.73861111357
Terni42.5597222212.65027778130
Todi42.7861111112.40916667331
Umbertide43.3116666712.34722222304
Table 2. Year classification based on SPI.
CategorySPI
WetSPI ≥ 1.0
Normal−1.0 ≤ SPI < 1.0
DrySPI ≤ −1.0
Table 3. Results of the analysis of trends using the Mann–Kendall test.
Station Name
Parameter
Città di CastelloMarscianoOrvietoPerugiaSpoletoTerniTodiUmbertide
TemperatureZm5.022 5.591 5.306 5.288 5.395 5.146 5.573 4.951
p-value0.000***0.000***0.000***0.000***0.000***0.000***0.000***0.000***
b0.049 0.052 0.058 0.053 0.053 0.051 0.054 0.047
Chilling UnitsZm−3.962***−4.586***−2.669**−1.862ns−2.302*−0.853ns−2.229*−2.770**
p-value0.000 0.000 0.008 0.063 0.021 0.394 0.026 0.006
b−5.500 −6.357 −5.118 −4.308 −3.138 −1.571 −3.733 −4.293
ET0Zm2.995 2.871 2.924 2.675 2.711 1.893 2.871 2.853
p-value0.003**0.004**0.003**0.007**0.007**0.058ns0.004**0.004**
b2.244 2.083 2.161 1.937 2.118 1.249 1.955 2.192
ETmZm3.049 3.031 2.871 2.800 2.711 1.982 2.835 2.835
p-value0.002**0.002**0.004**0.005**0.007**0.047*0.005**0.005**
b1.196 1.130 1.129 0.972 1.099 0.612 1.007 1.128
Water requirementsZm1.785 0.571 1.553 1.670 1.489 1.398 1.018 2.332
Loam soilp-value0.074ns0.568ns0.120ns0.095ns0.136ns0.162ns0.309ns0.020*
June–Augustb0.733 0.116 0.602 0.680 0.733 0.374 0.433 0.952
Water requirementsZm1.893 0.269 1.763 1.603 1.910 1.144 1.478 2.395
Loam soilp-value0.058ns0.788ns0.078ns0.109ns0.056ns0.253ns0.139ns0.017*
July–Augustb0.529 0.000 0.340 0.476 0.508 0.000 0.280 0.635
Water requirementsZm1.434 0.428 1.498 1.445 1.007 1.463 1.025 1.810
Silty clay soilp-value0.151 0.669 0.134 0.148 0.314 0.143 0.305 0.070
June–Augustb0.748ns0.193ns0.692ns0.644ns0.515ns0.486ns0.483ns0.786ns
Water requirementsZm2.039 −0.223 2.158 1.118 1.228 1.329 2.006 1.969
Silty clay soilp-value0.041*0.823ns0.031*0.263ns0.220ns0.184ns0.045*0.049*
July–Augustb0.594 0.000 0.507 0.368 0.322 0.233 0.483 0.527
ns = no significance trend; * = increasing/decreasing trend (α = 0.05); ** = increasing/decreasing trend (α = 0.01); *** = increasing/decreasing trend (α = 0.001).
Disclaimer/Publisher’s Note: The statements, opinions and data contained in all publications are solely those of the individual author(s) and contributor(s) and not of MDPI and/or the editor(s). MDPI and/or the editor(s) disclaim responsibility for any injury to people or property resulting from any ideas, methods, instructions or products referred to in the content.

