
Genetic Characterization of the Norwegian Apple Collection
by
 , , , ,
Liv Gilpin
1,*,
Dag Røen
2,
Marian Schubert
1,
Jahn Davik
3,
Kimmo Rumpunen
4,
Kristina Alme Gardli
1,
Stein Harald Hjeltnes
2 and
Muath Alsheikh
1,5 1
Department of Plant Sciences, Norwegian University of Life Sciences, 1433 Ås, Norway
2
Njøs Fruit and Berry Centre, 6863 Leikanger, Norway
3
Norwegian Institute for Agricultural and Environmental Research, Genetics and Biotechnology, 7500 Stjørdal, Norway
4
Department of Plant Breeding, Swedish University of Agricultural Sciences, 230 53 Alnarp, Sweden
5
Graminor Breeding Ltd., 2322 Ridabu, Norway
*
Author to whom correspondence should be addressed.
Horticulturae 2023, 9(5), 575; https://doi.org/10.3390/horticulturae9050575
Submission received: 14 April 2023
/
Revised: 27 April 2023
/
Accepted: 8 May 2023
/
Published: 12 May 2023
(This article belongs to the Special Issue Research on Germplasm Resources and Genetic Improvement of Tree Fruit)
Abstract
:Commercial fruit production in Norway is located at around latitude 60° north, demanding a careful choice of adapted cultivars. The most comprehensive collection of apple genetic resources in Norway is being kept in the Norwegian Apple Collection (NAC) at the Njøs Fruit and Berry Centre (NJØS). The collection contains around 350 accessions and was recently genotyped with a single nucleotide polymorphism (SNP) array. Curated SNP data were used for the assessment of structure and diversity, pedigree confirmation, and core collection development. In the following SNP analysis, we identified several duplicates and parent-child relationships. Across the geographic regions represented, the collection was equally diverse. Different methods for analyzing population structure were applied. K-means clustering and a Bayesian modeling approach with prior assumptions of the data revealed five subpopulations associated with geographic breeding centers. The collection has a distinct genetic structure and low relatedness among the accessions; hence, two core collections with 100 accessions in each were created. These new core collections will allow breeders and researchers to use the NAC efficiently. The results from this study suggest that several of the accessions in the Norwegian Apple Collection could be of high importance for breeding purposes.
1. Introduction
The most important fruit crop by volume in Norway is the cultivated apple (Malus domestica Borkh.), with an average annual production of 14,600 tons. In the Sogn region of western Norway, apples have been produced since the 11th century, and earlier, as recent medieval evidence suggests apples were of economic importance even before the monasteries introduced the species [1]. Genetic studies have identified the main ancestor of the cultivated apple as Malus sieversii (Lebed.) M. Roem. from Kazakhstan [2], and the secondary progenitor as the wild European crab apple Malus sylvestris (L.) Mill [3]. Around 3800 years ago, in Mesopotamia, the grafting process developed [4]. Grafting allows clonal propagation of selected individuals; thus, their genetic combinations are preserved. Accordingly, cultivars can be preserved in collections long after their origination from seeds.
The Fjord districts in South West Norway and around the lakes in the eastern part of the country, at around latitude 60° north, are where commercial fruit production is located. This is the world’s most northern border for commercial apple production [5]. The climatic conditions where the apples are grown depend on the Gulf Stream, which flows from south to northeast along the Norwegian coast. These areas have cooler, shorter growth seasons (1211–1775 growing degree days (GDD), 168–195 days) and longer days in the summer [6] than other European fruit-growing areas. Between the fruit districts in Norway, there are great differences in climate zones, where the southwestern region is characterized by a high mean annual precipitation (1024–1703 mm) and unstable snow cover and the eastern part has low minimum temperatures in the winter (−11.9 to −19.8 °C). This variance in climatic conditions demands a careful choice of adapted cultivars, with earliness and winter hardiness being the main limiting factors [6].
Today, releasing new apple cultivars with superior fruit quality characteristics, adapted to a changing climate, is important to most breeding programs [2,5]. Several factors have dramatically reduced the genetic diversity of apples, such as the use of few and related cultivars together with vegetative practices (cuttings and grafting) [7]. Valuable breeding material is often kept in germplasm collections where scarce documentation of commercially important traits reduces the potential use of these resources. Quantification of the genetic diversity available in the germplasm collections is crucial for detecting accessions with superior traits for breeding.
The most comprehensive collection of apple genetic resources in Norway is being kept in the Norwegian Apple Collection (NAC) at Njøs Fruit and Berry Centre (NJØS). The collection contains over 350 accessions, including heirloom cultivars originating from major fruit districts all over the country, cider cultivars, wild ancestral species, recent international releases, and breeding selections.
The research station at Njøs was founded in 1920 and has, since the beginning, focused on rootstock and scion cultivar research in several fruit species. The main collecting missions to prevent losing genetic resources were initiated in the 1980s and 1990s [8]. The main criteria were to collect cultivars of cultural importance to each fruit-growing region and not necessarily to capture as much fruit genetic diversity as possible. However, an SSR analysis of the Norwegian germplasm collections [9] indicated great diversity, with cultivars from southern countries and traditional Scandinavian cultivars clustering separately, including some winter-hardy genotypes. These results suggest that climate adaptation has influenced the genetic structure of the maintained germplasm, which is in line with genetic mapping studies of apple germplasm collections worldwide [10,11,12,13,14,15,16,17].
In recent times, high-throughput genotyping techniques, such as genotyping by sequencing (GBS) and single nucleotide polymorphism (SNP) arrays, have provided new low-cost options to reconstruct pedigrees [18,19,20]. For apples, three SNP genotyping arrays have been developed [21,22,23]. For the 20 K SNP array, 14 major founders of European breeding programs at high sequencing coverage made up the discovery panel [22]. The advantages of genome-wide SNP markers include the ability to assess, each time they are used, a consistent set of loci [24].
With new genomic tools available and the extension of the NAC since the work of Gasi et al. [9], the efforts to highlight the genetic architecture and diversity present in the collection should proceed. In this study, we studied (1) the genetic status of the NAC by identifying population stratification and kinship within the collection by genotyping with the 20K SNP array; in addition, we demonstrated (2) strategies of setting up core collections for breeding that best represents the diversity present in the collection.
2. Materials and Methods
2.1. Plant Material
The apple cultivars utilized throughout this research are 1/3 Norwegian heritage cultivars, 1/3 international releases, and 1/3 breeding selections from the NAC at NJØS (61°10′43.2″ N, 6°51′34.3″ E), located in the Sogn region of West Norway. The NAC selections (n = 347) with a minimum of 2 trees per clone were planted between 2014 and 2016 in a non-replicated design (Figure 1). The orchard contains cultivars originated from 27 countries, both dessert (304) and cider cultivars (11). Ten Malus species were represented in the collection, including 23 accessions of the wild ancestral species M. sieversii (and 1 accession of Malus kirghisorum Al. Fed. and Fed.) from Central Asia and ornamental Malus species (8 accessions).
2.2. Genotyping
In June 2021, young leaves from actively growing shoots were collected from 347 Malus sp. accessions. The leaves were freeze-dried (48 h), and following the protocol given by the manufacturer, DNA was extracted using the DNeasy® 96 Plant Kit (Qiagen®, Hilden, Germany). The total DNA content was quantified and checked for purity with spectrometry (NanoDrop 2000, Thermo Scientific™, Wilmington, NC, USA) and DNA integrity was tested using DNA gel electrophoresis (Owl™ electrophoresis cell, Thermo Scientific™, Wilmington, NC, USA). The SNP genotyping was conducted by the Trait Genetics Section (SGS Institut Fresenius GmbH, Stadt Seeland, Germany) using the 20 K Infinium® SNP array (Illumina Inc., San Diego, CA, USA) [22].
2.3. SNP-Data Curation
The SNP data were curated according to the workflow described by Vanderzande et al. [25], using Genome Studio (GS), v 2.0 (Illumina Inc., San Diego, CA, USA), and RStudio version 4.1.2, with cluster definitions obtained from ASSIsT [26]. This software is designed to filter and re-edit SNP calls which, due to the presence of null alleles, present a distorted segregation pattern. Minor allele frequencies (MAF) and missing data were set to 0.05. Frequency plots according to Chagné et al. [27], as described by Vanderzande et al. [25], were used to determine the sample quality and assumed ploidy levels.
Genotype comparisons of the accessions were made by using the GS report “Reproducibility and Heritability” to check for duplicates, parent-offspring heritability, and parent-parent-offspring heritability. Next, Plink 1.9 [28] was used to screen the data set for individuals with unknown identical genotypic data. Input files created with ASSIsT were used to calculate the proportion of identity-by-descent (IBD) between the pairs of accessions. Pairs of accessions with an IBD proportion higher than 99.9% were considered duplicates based on the threshold of known duplicates. If individuals were deemed duplicates, only one was kept for the downstream analysis. Morphological examinations were used to identify trueness-to-type if the known pedigree records differed between duplicate individuals. To identify putative first-degree relationships, that is, pairs of individuals with coefficients of relationships equal to 0.5 (such as full siblings and parent-offspring relationships), all duplicates were removed from the data set, which was then analyzed with Plink [28]. To calibrate the expected range of IBD values for the first-degree relationships, accessions with well-known pedigrees, such as ‘Elstar’, ‘Ingrid Marie’, ‘Aroma’, ‘Discovery’, and ‘James Grieve’, were used. In this study, the known first-degree relationships ranged from 0.483 to 0.539 in IBD values; hence, all accessions with pairwise values in this interval were considered to be putative first-degree relatives.
To confirm the available pedigree records, Mendelian inconsistent errors on the marker level were counted, using the R-script developed by Vanderzande et al. [25]. The pedigree records were corrected for detected errors. Based on the Mendelian error (ME) distribution, the threshold for rejection was set to 33 (Table S5). Next, the script was rerun to detect potential (new) parent-offspring combinations, using 60 and 30 ME thresholds for parent-parent-offspring (P–P–O) and parent-offspring (P–O) combinations, respectively. The threshold to accept the PPC relationship was set to 100. The iGraph package [29] in RStudio version 4.1.2 was used to visualize the results.
Linkage disequilibrium decay in the population was calculated as the correlation coefficient squared (r2) between SNP pairs, using the --r2 command in Plink [28]. After filtering [27], LD-pruning (command: --indep-pairwise 10 3 0.5) was conducted, and 5278 SNPs remained for analysis. Additionally, the LOESS (locally estimated scatterplot smoothing) [30] smooth curve was computed for all r2 values for the pairs of SNPs within a 5 kb distance.
2.4. Diversity Assessment
After removing duplicate, triploid, and poor-quality accessions, the genetic diversity of the 296 diploid accessions remaining was estimated using the software Core Hunter 3 [31]. From an operational point of view, the germplasm collection size was restricted by the limited planting plot size available. In order to quickly screen germplasm collections for desirable traits or identify QTLs via association mapping, the creation of core collections has proven to be a useful tool [32,33]. Genome-wide information has often been used when creating these collections. For evaluating the genetic diversity, we compared two genetic distance-based criteria (A–NE, accession to nearest entry; and E–NE, entry to nearest entry) introduced by Odong et al. [34] to evaluate two important core collection types (CC–I and CC–X). Using the average distance between accessions and the nearest entry (A–NE) criterion that works to minimize this value, the CC–I is designed to evenly represent the diversity [34]. The CC–X is designed to represent the extremes of the full collection. Samples with the greatest genetic distance from one another are added to the CC–X collection during creation by maximizing the E–NE criterion [34]. The Modified Rogers genetic distance [35] was used in the core collection construction. To assess overall genetic diversity, Shannon’s allelic diversity index (SH) and the proportion of heterozygous loci expected (HE) were calculated.
2.5. Population Structure and Genetic Relatedness
Accessions were stratified into 8 groups based on geographical regions and species. There were five M. domestica groups and the countries within the group “International G1” were the Czech Republic, Germany, the Netherlands, the UK, France, and Italy. The countries in the group “International G2” were Canada, the USA, New Zealand, Australia, Japan, and China, and those in “International G3” were Russia, Poland, and the Baltic countries. Norwegian heirloom cultivars were congregated as “Heritage”, cultivars from the other Nordic countries were labeled “Nordic”, and accessions from the Norwegian breeding program were considered “Selections.” There were two groups containing other Malus species: (1) “M. sieversii” with M. sieversii and M. kirghisorum accessions, and (2) “M. spp.” with Malus baccata (L.) Borkh., Malus × zumi (Matsum.) Rehder, Malus × purpurea (A. Barbier) Rehder, Malus × robusta (Carrière) Rehder, Malus × moerlandsii J. Door, and Malus x adstringens Zabel accessions.
For structural analysis, the initial genotype file was filtered using R, allowing a maximum of 10% missing data per accession and locus, and allowing SNPs with MAF > 0,05. After filtering, 5278 SNPs, 296 samples were used in the statistical analysis conducted using clustering (model-based) as implemented in STRUCTURE v.2.3.4 [36,37,38,39]. First, a single-replicate analysis was run with 1–10 subpopulations (K) to determine the correct settings. Based on the initial run, five independent replicates were then performed, with a 15,000 burn-in and 50,000 run-length for K 1 to 5. Next, to collate the results generated by STRUCTURE, the most probable subpopulation number (accurate K-value) was estimated using the method [40] implemented by the program STRUCTURE HARVESTER [41]. Accessions were assigned to the cluster to which they had the highest relationship coefficient, with a probability of ≥0.80 [16,42,43] considered to be a strong assignment to a cluster. A Principal Component Analysis (PCA) was conducted and visualized with the R package FactoExtra [44].
In addition to STRUCTURE, we deployed K-means clustering to infer the number of distinct genetic groups and assign samples to these groups. Using clustering algorithms implemented in the R-package “adegenet” [45], we ran 100 K-means clustering operations, each iterated 100 times, recording the most likely K per run. Based on the most frequently (>75%) recorded K, we inferred five distinct groups. Using the implementation of Ward’s algorithm, we ran a final hierarchical clustering to assign each of the samples to one of the inferred groups. These group assignments we used in subsequent analyses. We used Adegenet’s implementation of discriminant analysis of principal components (DAPC) to evaluate the distinctiveness of the previously inferred groups, estimating the posterior probability as implemented by applying a 75% majority rule. By investigating the eigenvalues of the SNPs, we determined their individual contribution to the separation of the samples in the first two components of the DAPC. Finally, we performed neighbor-joining analyses, using the implementation of the R-package “ape” [46], bootstrapping the data set 1000 times by randomly sampling and replacing SNPs. Bootstrap support for the resulting phylogram was re-rooted at the node, representing the most recent common ancestor.
3. Results
3.1. Quality Control
The B-allele frequency histograms of most of the accessions had distinct heterozygous and homozygous peaks with barely any occurrences between peaks in Genome Studio, indicating a good sample quality without contamination [25]. The results were confirmed by the frequency plots (Figure S5) generated using a method by Chagné et al. [27]. Four ornamental cultivars and one heritage cultivar had samples of inadequate quality and were removed from further analysis. After quality filters, 12,517 SNPs were approved, and 30.8% of the SNPs were regarded as robust. Of the 2352 discarded SNPs; 199 failed, 824 were monomorphic, 726 were shifted homozygotes, and 603 were failed null-alleles.
3.2. Relatedness and Ploidy Level
The B-allele frequency plots [27] and the B-allele frequency histograms in GS, allowed for the identification of accession ploidy. In our data, nineteen accessions were identified as triploid cultivars (Table S1) where some were previously known (e.g., ‘Gravenstein’ and ‘Bramley’s Seedling’). Some cultivars, however, were not previously identified as triploids (e.g., ‘Riskedal’ and ‘Skredsvigeple’).
The “Reproducibility and Heritability” reported in GS and calculated IBD among all accession pairs, identifying 27 pairs sharing a clonal relationship, indicating potentially synonymous cultivars, or mislabeling. All expected duplicates were recognized, such as color sports (e.g., ‘Aroma’, ‘Aroma Husabø’, and ‘Aroma Fagravoll’), and several unexpected duplicates were also identified (e.g., ‘Leiknes’ and ‘Kviteple’). The true-to-type individuals were discovered based on an evaluation of their morphological characters. Duplicate accessions were not included in the downstream analysis. After removing the duplicates, the remaining 311 samples were reanalyzed for pairwise IBD to find putative first-degree relationships, such as parent-offspring relationships and full siblings. The analysis resulted in 195 accessions, with one or more first-degree relationships in the NAC. The accessions with the largest number of first-degree relationships were ‘Discovery’ (30), ‘Golden Delicious’ (14), and ‘Aroma’ together with its known offspring ‘ARX49-18′, having altogether 23 first-degree relationships in the NAC (Figure 1).
3.3. Possible Parents
After removing triploids and duplicates in the collection, the remaining accessions were screened for possible parent-offspring relationships in the collection. The parents used in the breeding program were verified and are not included in Table 1. The full table is provided in Table S4. The cultivars with the highest number of possible parent-offspring relationships were ‘Granat’ (5), ‘Rosenstrips Hardanger’ (4), ‘Torstein’ (4), and ‘Høyneseple’ (4). The number of possible parent-offspring relationships was in line with the number of first-degree relationships estimated from the IBD values for most cultivars (Table S6). Most of the offspring were Norwegian heritage cultivars, with little to no previous pedigree information.
3.4. Pedigree
A putative pedigree based on previous genotyping studies [9,16,18,19,47,48,49] and historical records [50,51] was constructed and an R-script [25] was used to analyze for pedigree errors. Incorrectly annotated parents (nine instances; Table S5) were filtered out and the pedigree was reanalyzed for possible parent-offspring combinations.
3.5. LD
The SNPs (12,517) that passed the quality filters [27] were used for pairwise comparisons with an average distance of 456 kb. The LD was calculated using 115,485 pairwise comparisons for SNPs < 1000 kb apart with an ~456 kb average inter-SNP distance to find the extent of LD decay within the germplasm collection (Figure 2). Between these, there were 3363 SNP pairs that were <1500 bp apart, with an ~653 bp average distance. Within the distance of 1500 bp, 2202 SNPs were in low LD (<0.2 r2) and only 6% were in high LD (>0.8 r2). The distribution of the SNPs in high LD (r2 > 0.8) had an average distance of 632 bp (median of 511 bp).
3.6. Genetic Diversity
Core Hunter 3, under the average entry-to-nearest-entry distance (EN) and accession-to-nearest-entry (A–NE) optimization objective as well as Nei’s expected heterozygosity (He), was used to conduct a precise core collection selection. Modified Rogers’ distance was used to compute pairwise distances between accessions [35]. Starting with a selection of ten individuals and gradually increasing up to the entire number of accessions available, we ran different scenarios to capture changes in frequency-based characteristics when a particular number of accessions were selected for the core collection (Figure 3). There were frequency-based statistics for all scenarios (Table S2).
Two core collections were created, type 1 (CC–I) and type 2 (CC–X) (Table S2). The two collections consisted of 100 accessions each. The A–NE criterion of the type 1 collection was minimized to 0.204, and the results showed variation within ± 6.80 × 10⁻⁶. The type 2 core collection’s E–NE criterion was maximized to 0.392 and the results showed variation within ± 1.40 × 10⁻⁵. Both cores include accessions representing all clusters from the genetic structure analysis (Table 2). There were minor differences between the two criteria for sampling, however, 10% more Norwegian selections and 10% fewer Heritage accessions were sampled in the CC–X type than in the CC–I type.
3.7. Genetic Structure
In the PCA of the accessions in the NAC (Figure 4), the first two principal components explained 9.3% of the total variance in the SNP markers. The differentiation between M. sieversii and M. domestica, with a clustering of M. sieversii on the right side of the plot, was shown in the first principal component. Similarly, a slight separation could be observed between the Norwegian heirloom cultivars (“Heritage”) and the Norwegian selections (“Selections”) and internationally known cultivars (“G1 and G2”) in the opposite direction, with the international accessions located on the right side of the plot. The plot indicates a distribution in a primitive direction, towards the main progenitor species (“M. sieversii”), of the Norwegian heirloom cultivars (“Heritage”) and Eastern European cultivars (“G3”).
A weak latitudinal decline in the M. domestica accessions, with the international accessions (G1 and G2) and Norwegian selections placed towards the opposite extremes, was displayed by the second principal component. There seemed to be almost no separation between the European cultivars (G1) and the cultivars from North America, Oceania, and East Asia (G2).
For the STRUCTURE analysis, the initial genotype filtering resulted in 13105 SNPs. The analysis revealed that two was the most probable subpopulation number (Figure S1). The genotypes’ mean ancestry proportion regarding the inferred clusters was 0.93 at ΔK = 2, and 167 genotypes (48%) were identified as being strongly associated with a group. After LD-pruning, 5279 SNPs were used for the STRUCTURE analysis, also resulting in the most likely number of subpopulations being two (Figure S2). When running the analysis without the 23 M. Sieversii accessions, the most probable subpopulation number was four, with a ΔK value equal to 217 (Figure S3).
The accession assignment in STRUCTURE for ΔK = 2 resulted in one subpopulation with international cultivars and selections from the Norwegian breeding program, and a second subpopulation with Norwegian heritage cultivars and M. sieversii accessions. A total of 176 genotypes were classified as admixed as they were not clearly placed in these groups (Q < 0.8). Although not significant, accession assignment to the genetic clusters (GC) results for ΔK = 5 could be extracted from STRUCTURE: GC1–accessions belonging to “G1” and “G2” (N = 9); GC2–M. sieversii accessions (N = 18); GC3–accessions belonging to “G2” (N = 9); GC4–accessions from the breeding program (“Selections”), including the known parent cultivars of ‘Discovery’ and ‘Aroma’(N = 19); and GC5–Norwegian heirloom cultivars (“Heritage”) (n= 25). Meanwhile, 216 accessions were classified as admixed (Figure 4). The multivariate method DAPC resulted in equivalent results to the PCA. K-means clustering of the principal components inferred five clusters as being the model with the most support (Figure 5). The loading plots (Supplementary Figure S7), with a magnitude of the influence of each SNP on the separation of the groups, showed even distribution across the genome.
4. Discussion
The high throughput of the second-generation technologies has reduced consumable costs and sequencing runs. Traditional cytogenetic methods for karyotyping, such as SSR markers, have been replaced by methods such as high-density SNP arrays for genome-wide assessment of allelic variation [52]. In this study, we used the medium-density SNP data set available from the Illumina® Apple 20K array to investigate the genetic structure, relatedness, and diversity in Norway’s largest apple collection.
4.1. Quality Check, Relatedness, and Ploidy Level
In principle the SNP curation method described by Vanderzande et al. [25], including cluster parameter settings from ASSIsT [26], is designed for pedigreed germplasm; thus, it is not optimal for use in a diverse collection as it fails to call null alleles in such germplasms. Howard et al. [53] developed 10,295 robust SNPs that represent 57% of the initial SNPs on the array and many excluded SNPs that showed null alleles. In our study, 12,478 SNPs passed filtering following the Chagné et al. [27] method and 8935 were present in the robust set developed by Howard et al. [53]. After pruning for LD, only 5278 SNPs remained.
The high SNP quality led to Gen Call scores higher than the 0.15 threshold and B-allele frequency plots indicating mostly adequate quality. Only five genotypes (1%) did not pass the filter requirements. The DNA concentrations and DNA purity for all samples were tested and found to be at the manufacturers’ recommendations, and no clear explanation was found for the lower performance of these accessions. Four of these genotypes were ornamental cultivars (M. baccata, Malus × adstringens, Malus × moerlandsii, Malus × zumi). Thus, a plausible reason could be compatibility issues between Malus domestica, on which the array is based, and other Malus species. To confirm whether the low call rate was due to the DNA sample or to the genotype itself, new samples of these accessions should be genotyped.
The error threshold of pairwise values ranging between 0.483 to 0.539 IBD for putative first-degree relationships was chosen based on well-known first-degree relationships in the collection. Theoretically, an 0.5 IBD would be expected for any true parent-offspring or full-sib relationships. The variation could be an indication of Mendelian sampling variance and could be due to the inheritance of random samples of alleles from both parents [54].
We found the Norwegian Apple Collection to contain 296 diploid (94%) and 19 triploid (6%) accessions. The triploid frequency was lower than what was reported for the collections in Sweden and Denmark (10 and 19%, respectively). A low triploid frequency was expected, as our collection does not consist of heritage cultivars only, but also breeding selections with no presence of triploids. When comparing ploidy levels with those obtained by Gasi et al. [9] using an SSR analysis of the same accessions, we found fourteen inconsistent cases (Table S7). Remarkably, ‘Gravenstein,’ was classified as diploid by Gasi et al. [9]; meanwhile, it is quite well-documented [18,49,55], both genetically and morphologically, that ‘Gravenstein’ is a triploid cultivar.
Equally, the NAC contained 92% unique accessions, which is similar to what was found in the collections in Sweden, Belgium, and Denmark (86, 79, and 85%, respectively) [18,20,49]. Expected duplicates, such as color sports, and several unexpected synonymous accessions were also identified. These accessions were classified to be either (1) propagation (‘M9′ and ‘Oster’), planting, or labeling mistakes, or (2) something to be given a new name because the identity of an apple tree has been lost. Examples of misclassified accessions are ‘Søgneeple’, which in our collection is not an independent cultivar, but a sport of ‘Ingrid Marie’, or incorrectly-labeled accessions, such as ‘Rondestveit’ and ‘Riskedal’. The true-to-type accessions were determined based on an examination of morphological traits.
4.2. Possible Parents and Pedigree
The elimination of some stipulated relationships was possible by using a parent-offspring test for Mendelian inconsistent errors. For example, the ‘Linda’ (not identical to the Canadian cultivar ‘Linda’) in this collection is a chance seedling discovered in 1965 by Helge Børve in Ullensvang and was speculated to be the offspring of ‘James Grieve’, but giving our SNP marker data, these cultivars evidently did not share a parent-offspring relationship. Instead, the SNP analysis identifies ‘Transparent Blanche’ and ‘Granat’ as the parents. According to tradition, the origin of the cultivar ‘Martaeple’ (synonym ‘Røeneple’) is said to be a seed from an American apple sown by Marta Lillefosse (1870–1950) in Åtranes, Strandebarm (around 1915), which is not supported by our data, where ‘Lærdalseple’ and ‘Torstein’ are suggested as parents. If ‘Torstein’ is one of the parents, it means that it cannot be from an American apple. There is, however, another possible source of error. The graft wood of ‘Martaeple’ was collected from an old tree based on a description of where it was planted, with no one on site ensuring it was the correct tree at the right place during collection. A description of the fruit does anyhow fit. A surprising result, yet possible, was the suggested offspring- parent relationship between ‘Pederstrup’ and ‘Torstein.’ The origin of ‘Torstein’ is not fully understood. Stedje and Skard [51] suggested it was imported as graft wood from Denmark. To gain knowledge, the SNP profile of ‘Torstein’ should be checked against old Danish cultivars to see if it is synonymous with any of the accessions.
4.3. LD
Apples have a rapid rate of LD-decay [23], making genome-wide association studies particularly challenging, especially when considering the heterozygous nature of apples and their recent whole genome duplication. The fast LD-decay we observed in the Norwegian apple population is like the one studied in similar collections [56,57]. We used 6938 SNPs that passed quality filters [27], and according to the reported genome size (742.3Mb), they were distributed with an average distance of 107 kb. The total number of pairwise comparisons less than 160 kb apart was lower in this study (24,751) than in a study of a Danish apple diversity collection [18] which had 34,563 pairwise comparisons. Reasons for this variation could be the genotyping methods applied or the quality filter settings prior to the LD decay estimation. The number of SNP pairs that were <1500 bp apart was similar, but the average distance (~653 bp) was higher in our study than in a study by Larsen et al. [18] where the average was ~246 bp. The inter-SNP distance of SNPs in high LD (r2 > 0.8), were farther apart (~632 bp) than in a similar study of an apple diversity collection [57] where it was reported that very few SNPs had high LD when the inter-SNP distance was >100 bp. However, with only 6% of SNPs in high LD at this distance, no conclusion can be drawn. The lack of a true founder population is likely causing the rapid LD decay we observe in apples, resulting in high species diversity, as is common in many perennial fruits [57,58,59,60]. As the extent of LD determines the required number of SNPs and the mapping resolution, the amount of LD between loci is important for the success of genetic studies, such as GWAS [59]. However, the benefit of genomic analyses of diverse collections is the possibility of uncovering allelic diversity that would otherwise be ignored in populations deriving from few founders. The possibility to mine useful alleles from diverse populations holds great promise in contributing to future apple improvement, although the prediction accuracies are likely to be lower [56].
4.4. Genetic Structure
A large degree of admixture was observed when considering the results from the structural analysis, and the first two principal components explained little of the population structure. K-means clustering separated the NAC into five putative groups (Figure 4), that corresponded predominantly with geographic regions, species, and known pedigree (Supplementary Figure S6). The putative grouping of the five clusters was in accordance with the average number of clusters found in other studies evaluating germplasm population structure [11,12,61,62].
Only two subpopulations were identified when analyzing the population structure with STRUCTURE and STRUCTURE HARVESTER (Figure 4). The results derived from using these software options are consistent with the findings from other Nordic apple collections with Danish, Swedish, and Finnish cultivars [10,11,49]. The ΔK values found in this study are like those of Liang et al. [33] and Urrestarazu et al. [63], with ΔK > 100, yet higher than those of the other Nordic apple germplasm collections with ΔK < 1.5 [11,49]. The high number of genotypes (73% when ΔK = 5) without a strong affinity to a specific group, is reflected in the high number of accessions in admix.
STRUCTURE is a Bayesian modeling approach with prior assumptions of the data: the absence of genetic drift, ancestral populations in Hardy–Weinberg and linkage equilibrium, and even sampling among populations, while the PCA and DAPC approaches are model-free methods for determining population structure [39,64]. The data used in this study break with some of these assumptions. The sampling was uneven, with most of the accessions in the collection originating from Norway; hence, one cannot assume Hardy–Weinberg equilibrium. STRUCTURE and the Evanno method [40,41] are conservative, tend to underestimate the number of subpopulations, and will merge subpopulations represented by smaller numbers when working with data from unbalanced designs [65].
Another aspect that might influence the STRUCTURE analysis and its ability to identify the “true” number of clusters is the presence of a hierarchical substructure in parts of the data set. Janes et al. [66] found that even when more subpopulations are present, ΔK frequently identifies ΔK = 2 as the top level of the hierarchical structure. In our case, the accession assignment in ΔK = 2 corresponds with the grouping seen in the PCA and DAPC, showing that the strongest differentiation is between wild and domesticated samples. However, the PCA and DAPC reveal a substructure among the domesticated samples that STRUCTURE fails to identify. A possible explanation is the lower hierarchical substructures being overshadowed by the large differentiation of wild and domesticated samples [66]. When only the domesticated samples in our data were used in the STRUCTURE analysis, ‘four’ was selected as the optimal number of clusters, supporting the theory of the wild samples concealing the lower subpopulations present.
The heirloom cultivars in the NAC descend from a narrow geographical region separated by fiords and mountains far from the center of the dispersal of the cultivated apple. However, several cities in Norway were part of important trade routes between monasteries, and later, the Hanseatic trade route, facilitating an exchange of apple genotypes. The Norwegian heirloom cultivars in GC5 developed under selection pressure from distinguished climatic conditions as well as cultural preferences from the local farming communities, characteristic of the fruit districts in Norway. An indication that the population structure within the domesticated apple is at least partially due to differences in origin was shown with the primary axis of genetic structure (PC1) distinguishing heirloom Norwegian cultivars from North American, Asian, and European cultivars (G1 and G2) (Figure 4).
4.5. Genetic Diversity
Only diploid accessions were considered in the analysis for genetic diversity. Triploid plants are considered an evolutionary dead-end since they give rise to aneuploid gametes with low fertility [67]. Hence, diversity conserved in polyploids has a limited degree of impact as a genetic resource, as triploids are less efficient as parents. Genetic diversity was not a criterion in the conservation approaches used for selecting germplasm for the NAC, and unintentional redundancies were therefore anticipated. Regarding the diversity parameters analyzed, the results are conflicting. The Shannon’s allelic diversity index (SH) was higher (10.02) than in similar studies [49,68] that have values between 1.78–4.47, indicating high genetic diversity in the NAC. The SH index independently considers all allele frequencies, regardless of the locus (marker) to which the allele belongs. Hence, SH is a suitable criterion for core collections of type CC–I, as the best core collection should be the one with the maximum attainable value [34]. Yet the second diversity parameter, the mean expected heterozygosity (He), is lower than it is in comparable studies of apples using simple sequence repeat (SSR) markers with He-values ranging from 0.75 to 0.81 [11,13,32,49,61], which is unexpected considering the life history traits of the species. The diversity metrics presented in this study, however, should be interpreted with some caution. The SNP chip probes’ biallelic nature will hide diversity that would be observed using methods not restricted to two alleles [69]. This ascertainment bias is not present in methods allowing for the inclusion of rare alleles, such as SSR markers and genotype-by-sequencing [69].
In order to quickly screen germplasm collections for desirable traits, core collections have proven to be a useful tool [65,70,71]. Ideally, an optimal core collection would be representative of the whole collection. Both those reflecting taxonomic classification and those reflecting the geographic origin present can be of a size that can easily be managed and distributed, and not contain redundant accessions [34]. It has been demonstrated that arbitrarily picking collection members results in CC–I and CC–X collections that are less representative than using distance-based criteria, such as the A–NE and E–NE criteria [34]. The CC–I and CC–X collections created in this research represent the diversity of the whole collection with only a few accessions included. In many aspects, these two collections fit the description of an optimal core collection. All the geographic origins of the cultivars within the collection and the genetic clusters from the structural analysis (Table 2) are represented within these two core collections. The sizes of these collections are reasonable for maintenance and there are no redundant accessions included. Compared to the prior core collection, these core collections will be easier to distribute to interested researchers and breeders.
5. Conclusions
Germplasm collections provide valuable resources, representing diversity both among commercial cultivars and across the genus. The 20 K SNP array analysis in this study provided robust information regarding diversity, clonal relationships, putative ploidy levels, and kinship within the collection. Such high-throughput SNP genotyping techniques are useful for GWAS or Genomic Selection where thousands of markers are needed [72]. Given its considerable geographic origins, the collection exhibits a clear genetic structure, yet little relatedness among the accessions. This study highlights factors that may influence STRUCTURE and the Evanno method into yielding conservative results, potentially merging subpopulations represented by smaller numbers, underestimating the number of subpopulations, and reducing its ability to identify the “true” number of clusters.
The current set of genotypic data adds to the historic data of the NAC, showing a high phenotypic variability for important traits, such as fruit quality, phenology, and biotic and abiotic stress resistance. Several of the Norwegian heritage cultivars, such as ‘Haugmann’, are very winter-hardy. Earliness has been an important goal in the Norwegian Apple Breeding Program since the very beginning in 1984, and historic phenotypic data suggest a high variance in the germplasm contained in the NAC. Earlier imports of apple cultivars and random pollination events have created a gene pool of heritage cultivars, adapted to local climate conditions, and facilitated a considerable level of diversity.
The core collections developed for the NAC will improve its use and contribute valuable traits for the development of novel apple cultivars. The next research steps include further characterization of the collection phenotypically, validation of important SNPs found in this study, and validation of shared accession identities across the Nordic germplasm collections.
Supplementary Materials
The following supporting information can be downloaded at: https://www.mdpi.com/article/10.3390/horticulturae9050575/s1, Figure S1: Structure of the NAC determined using STRUCTURE; Figure S2: Structure of the NAC as determined by STRUCTURE after LD-pruning; Figure S3: Structure of the NAC as determined by STRUCTURE excluding all Malus Sieversii accessions; Figure S4: Structure of the NAC as determined using principal component analysis; Figure S5: B-allele frequency for each SNP plotted against its genomic position for all samples; Table S1: List of samples used for downstream analysis including name of accession, ploidy level and sampling location; Table S2: Full list of accessions included in the two core collections; Table S3: List of filtered accessions in the NAC included metadata; Table S4: List of possible non-directed parent-offspring combinations within the NAC; Table S5: List of predefined parent-offspring relationships tested within the NAC; Table S6: Global pairwise estimates of IBD (PI_HAT) within the NAC.; Table S7: Inconsistencies in ploidy between SSR and SNP analysis; Figure S6: Sample assignment DAPC analysis; Figure S7: Loading plots DAPC analysis.
Author Contributions
Conceptualization, L.G., M.A., D.R., S.H.H., J.D. and K.A.G.; methodology and formal analysis, L.G., M.S., J.D., D.R. and M.A.; writing—original draft preparation L.G.; writing—review and editing L.G., M.A., D.R., M.S., K.R., S.H.H., J.D. and K.A.G.; project administration S.H.H.; and funding acquisition; S.H.H., L.G. and M.A. All authors have read and agreed to the published version of the manuscript.
Funding
This research was funded by a PhD scholarship from the Research Council of Norway (Project nr. 322792–Genomic-based breeding technology for high quality apples in a Nordic climate) and a generous grant from Sparebankstiftinga Sogn og Fjordane.
Institutional Review Board Statement
Not applicable.
Informed Consent Statement
Not applicable.
Data Availability Statement
SNP data is available from NJØS at request.
Acknowledgments
We are thankful to Susanne Windju and Espen Sørensen for fruitful discussions and valuable help during data curation and to Kurab Røen, Anete Busa, Anne Sigrid Skjerdal, Sigurd Molland, Sverre Moe, Morten Fosse and Wenche Johansen for skillful technical assistance in the laboratory and in the field.
Conflicts of Interest
The authors declare that they have no known competing commercial interests or personal relationships that could have appeared to influence the work reported in this paper.
References
- Oye, I. Middelalderbyenes Agrare Trekk; Bryggen Museum: Bergen, Norway, 1998; 80p. [Google Scholar]
- Velasco, R.; Zharkikh, A.; Affourtit, J.; Dhingra, A.; Cestaro, A.; Kalyanaraman, A.; Fontana, P.; Bhatnagar, S.K.; Troggio, M.; Pruss, D. The genome of the domesticated apple (Malus × domestica Borkh.). Nat. Genet. 2010, 42, 833–839. [Google Scholar] [CrossRef] [Green Version]
- Duan, N.; Bai, Y.; Sun, H.; Wang, N.; Ma, Y.; Li, M.; Wang, X.; Jiao, C.; Legall, N.; Mao, L. Genome re-sequencing reveals the history of apple and supports a two-stage model for fruit enlargement. Nat. Commun. 2017, 8, 249. [Google Scholar] [CrossRef] [PubMed]
- Juniper, B.E.; Mabberley, D. The Story of the Apple; The Timber Press: Portland, OR, USA, 2006; Volume 47. [Google Scholar]
- Fotirić Akšić, M.; Cerović, R.; Hjeltnes, S.H.; Meland, M. The Effective Pollination Period of European Plum (Prunus domestica L.). Cultiv. West. Norway. Hortic. 2022, 8, 55. [Google Scholar] [CrossRef]
- Ikase, L. Results of fruit breeding in Baltic and Nordic states. In Proceedings of the 25th Congress of the Nordic Association of Agricultural Scientists (NJF) Nordic View to Sustainable Rural Development, Riga, Latvia, 16–18 June 2015. [Google Scholar]
- Hammer, K.; Arrowsmith, N.; Gladis, T. Agrobiodiversity with emphasis on plant genetic resources. Naturwissenschaften 2003, 90, 241–250. [Google Scholar] [CrossRef] [PubMed]
- Hjeltnes, S.H. Norske Klonarkiv i Frukt; Norsk Fruktmuseum og Skog og Landskap: Ås, Norway, 2008; p. 51. [Google Scholar]
- Gasi, F.; Kanlić, K.; Stroil, B.K.; Pojskić, N.; Asdal, Å.; Rasmussen, M.; Kaiser, C.; Meland, M. Redundancies and genetic structure among ex situ apple collections in Norway examined with microsatellite markers. HortScience 2016, 51, 1458–1462. [Google Scholar] [CrossRef] [Green Version]
- Garkava-Gustavsson, L.; Mujaju, C.; Sehic, J.; Zborowska, A.; Backes, G.M.; Hietaranta, T.; Antonius, K. Genetic diversity in Swedish and Finnish heirloom apple cultivars revealed with SSR markers. Sci. Hortic. 2013, 162, 43–48. [Google Scholar] [CrossRef]
- Larsen, B.; Toldam-Andersen, T.B.; Pedersen, C.; Ørgaard, M. Unravelling genetic diversity and cultivar parentage in the Danish apple gene bank collection. Tree Genet. Genomes 2017, 13, 14. [Google Scholar] [CrossRef]
- Lassois, L.; Denancé, C.; Ravon, E.; Guyader, A.; Guisnel, R.; Hibrand-Saint-Oyant, L.; Poncet, C.; Lasserre-Zuber, P.; Feugey, L.; Durel, C.-E. Genetic diversity, population structure, parentage analysis, and construction of core collections in the French apple germplasm based on SSR markers. Plant Mol. Biol. Rep. 2016, 34, 827–844. [Google Scholar] [CrossRef] [Green Version]
- Marconi, G.; Ferradini, N.; Russi, L.; Concezzi, L.; Veronesi, F.; Albertini, E. Genetic characterization of the apple germplasm collection in central Italy: The value of local varieties. Front. Plant Sci. 2018, 9, 1460. [Google Scholar] [CrossRef] [Green Version]
- Patocchi, A.; Fernández-Fernández, F.; Evans, K.; Gobbin, D.; Rezzonico, F.; Boudichevskaia, A.; Dunemann, F.; Stankiewicz-Kosyl, M.; Mathis-Jeanneteau, F.; Durel, C.E. Development and test of 21 multiplex PCRs composed of SSRs spanning most of the apple genome. Tree Genet. Genomes 2009, 5, 211–223. [Google Scholar] [CrossRef] [Green Version]
- Routson, K.J.; Reilley, A.A.; Henk, A.D.; Volk, G.M. Identification of historic apple trees in the Southwestern United States and implications for conservation. HortScience 2009, 44, 589–594. [Google Scholar] [CrossRef] [Green Version]
- Urrestarazu, J.; Denancé, C.; Ravon, E.; Guyader, A.; Guisnel, R.; Feugey, L.; Poncet, C.; Lateur, M.; Houben, P.; Ordidge, M. Analysis of the genetic diversity and structure across a wide range of germplasm reveals prominent gene flow in apple at the European level. BMC Plant Biol. 2016, 16, 130. [Google Scholar] [CrossRef] [PubMed]
- Van Treuren, R.; Kemp, H.; Ernsting, G.; Jongejans, B.; Houtman, H.; Visser, L. Microsatellite genotyping of apple (Malus × domestica Borkh.) genetic resources in the Netherlands: Application in collection management and variety identification. Genet. Resour. Crop Evol. 2010, 57, 853–865. [Google Scholar] [CrossRef] [Green Version]
- Larsen, B.; Gardner, K.; Pedersen, C.; Ørgaard, M.; Migicovsky, Z.; Myles, S.; Toldam-Andersen, T.B. Population structure, relatedness and ploidy levels in an apple gene bank revealed through genotyping-by-sequencing. PLoS ONE 2018, 13, e0201889. [Google Scholar] [CrossRef] [PubMed] [Green Version]
- Muranty, H.; Denancé, C.; Feugey, L.; Crépin, J.-L.; Barbier, Y.; Tartarini, S.; Ordidge, M.; Troggio, M.; Lateur, M.; Nybom, H. Using whole-genome SNP data to reconstruct a large multi-generation pedigree in apple germplasm. BMC Plant Biol. 2020, 20, 2. [Google Scholar] [CrossRef] [Green Version]
- Vanderzande, S.; Micheletti, D.; Troggio, M.; Davey, M.W.; Keulemans, J. Genetic diversity, population structure, and linkage disequilibrium of elite and local apple accessions from Belgium using the IRSC array. Tree Genet. Genomes 2017, 13, 125. [Google Scholar] [CrossRef]
- Chagné, D.; Crowhurst, R.N.; Troggio, M.; Davey, M.W.; Gilmore, B.; Lawley, C.; Vanderzande, S.; Hellens, R.P.; Kumar, S.; Cestaro, A. Genome-wide SNP detection, validation, and development of an 8K SNP array for apple. PLoS ONE 2012, 7, e31745. [Google Scholar] [CrossRef] [Green Version]
- Bianco, L.; Cestaro, A.; Sargent, D.J.; Banchi, E.; Derdak, S.; Di Guardo, M.; Salvi, S.; Jansen, J.; Viola, R.; Gut, I. Development and validation of a 20K single nucleotide polymorphism (SNP) whole genome genotyping array for apple (Malus × domestica Borkh). PLoS ONE 2014, 9, e110377. [Google Scholar] [CrossRef] [Green Version]
- Bianco, L.; Cestaro, A.; Linsmith, G.; Muranty, H.; Denancé, C.; Théron, A.; Poncet, C.; Micheletti, D.; Kerschbamer, E.; Di Pierro, E.A. Development and validation of the Axiom® Apple480K SNP genotyping array. Plant J. 2016, 86, 62–74. [Google Scholar] [CrossRef] [Green Version]
- Peace, C.P.; Bianco, L.; Troggio, M.; Van de Weg, E.; Howard, N.P.; Cornille, A.; Durel, C.-E.; Myles, S.; Migicovsky, Z.; Schaffer, R.J. Apple whole genome sequences: Recent advances and new prospects. Hortic. Res. 2019, 6, 59. [Google Scholar] [CrossRef] [Green Version]
- Vanderzande, S.; Howard, N.P.; Cai, L.; Da Silva Linge, C.; Antanaviciute, L.; Bink, M.C.; Kruisselbrink, J.W.; Bassil, N.; Gasic, K.; Lezzoni, A. High-quality, genome-wide SNP genotypic data for pedigreed germplasm of the diploid outbreeding species apple, peach, and sweet cherry through a common workflow. PLoS ONE 2019, 14, e0210928. [Google Scholar] [CrossRef] [PubMed] [Green Version]
- Di Guardo, M.; Micheletti, D.; Bianco, L.; Koehorst-van Putten, H.J.; Longhi, S.; Costa, F.; Aranzana, M.J.; Velasco, R.; Arús, P.; Troggio, M. ASSIsT: An automatic SNP scoring tool for in-and outbreeding species. Bioinformatics 2015, 31, 3873–3874. [Google Scholar] [CrossRef] [PubMed] [Green Version]
- Chagné, D.; Kirk, C.; Whitworth, C.; Erasmuson, S.; Bicknell, R.; Sargent, D.J.; Kumar, S.; Troggio, M. Polyploid and aneuploid detection in apple using a single nucleotide polymorphism array. Tree Genet. Genomes 2015, 11, 94. [Google Scholar] [CrossRef]
- Purcell, S.; Neale, B.; Todd-Brown, K.; Thomas, L.; Ferreira, M.A.R.; Bender, D.; Maller, J.; Sklar, P.; de Bakker, P.I.W.; Daly, M.J.; et al. PLINK: A toolset for whole-genome association population-based linkage analysis. Am. J. Hum. Genet. 2007, 81, 559–575. [Google Scholar] [CrossRef] [PubMed] [Green Version]
- Csardi, G.; Nepusz, T. The igraph software package for complex network research. InterJournal Complex Syst. 2006, 1695, 1–9. [Google Scholar]
- Cleveland, W.S. Robust locally weighted regression and smoothing scatterplots. J. Am. Stat. Assoc. 1979, 74, 829–836. [Google Scholar] [CrossRef]
- De Beukelaer, H.; Davenport, G.F.; Fack, V. Core Hunter 3: Flexible core subset selection. BMC Bioinform. 2018, 19, 203. [Google Scholar] [CrossRef]
- Boccacci, P.; Aramini, M.; Ordidge, M.; van Hintum, T.J.; Marinoni, D.T.; Valentini, N.; Sarraquigne, J.-P.; Solar, A.; Rovira, M.; Bacchetta, L. Comparison of selection methods for the establishment of a core collection using SSR markers for hazelnut (Corylus avellana L.) accessions from European germplasm repositories. Tree Genet. Genomes 2021, 17, 48. [Google Scholar] [CrossRef]
- Liang, W.; Dondini, L.; De Franceschi, P.; Paris, R.; Sansavini, S.; Tartarini, S. Genetic diversity, population structure and construction of a core collection of apple cultivars from Italian germplasm. Plant Mol. Biol. Report. 2015, 33, 458–473. [Google Scholar] [CrossRef]
- Odong, T.L.; Jansen, J.; van Eeuwijk, F.A.; van Hintum, T.J.L. Quality of core collections for effective utilisation of genetic resources review, discussion and interpretation. Theor. Appl. Genet. 2013, 126, 289–305. [Google Scholar] [CrossRef] [Green Version]
- Rogers, J.S. Deriving phylogenetic trees from allele frequencies: A comparison of nine genetic distances. Syst. Biol. 1986, 35, 297–310. [Google Scholar] [CrossRef]
- Falush, D.; Stephens, M.; Pritchard, J.K. Inference of population structure using multilocus genotype data: Linked loci and correlated allele frequencies. Genetics 2003, 164, 1567–1587. [Google Scholar] [CrossRef] [PubMed]
- Falush, D.; Stephens, M.; Pritchard, J.K. Inference of population structure using multilocus genotype data: Dominant markers and null alleles. Mol. Ecol. Notes 2007, 7, 574–578. [Google Scholar] [CrossRef] [PubMed]
- Hubisz, M.J.; Falush, D.; Stephens, M.; Pritchard, J.K. Inferring weak population structure with the assistance of sample group information. Mol. Ecol. Resour. 2009, 9, 1322–1332. [Google Scholar] [CrossRef] [Green Version]
- Pritchard, J.K.; Stephens, M.; Donnelly, P. Inference of population structure using multilocus genotype data. Genetics 2000, 155, 945–959. [Google Scholar] [CrossRef]
- Evanno, G.; Regnaut, S.; Goudet, J. Detecting the number of clusters of individuals using the software structure: A simulation study. Mol. Ecol. 2005, 14, 2611–2620. [Google Scholar] [CrossRef] [Green Version]
- Earl, D.A.; VonHoldt, B.M. Structure Harvester: A website and program for visualizing Structure output and implementing the Evanno method. Conserv. Genet. Resour. 2012, 4, 359–361. [Google Scholar] [CrossRef]
- Breton, C.; Pinatel, C.; Medail, F.; Bonhomme, F.; Berville, A. Comparison between classical and Bayesian methods to investigate the history of olive cultivars using SSR-polymorphisms. Plant Sci. 2008, 175, 524–532. [Google Scholar] [CrossRef]
- Marra, F.; Caruso, T.; Costa, F.; Di Vaio, C.; Mafrica, R.; Marchese, A. Genetic relationships, structure and parentage simulation among the olive tree (Olea europaea L. subsp. europaea) cultivated in Southern Italy revealed by SSR markers. Tree Genet. Genomes 2013, 9, 961–973. [Google Scholar] [CrossRef]
- Kassambara, A.; Mundt, F.; Package ‘Factoextra’. Extract and Visualize the Results of Multivariate Data Analyses. 2017. Available online: https://rpkgs.datanovia.com/factoextra/index.html (accessed on 21 January 2022).
- Jombart, T.; Ahmed, I. adegenet 1.3-1: New tools for the analysis of genome-wide SNP data. Bioinformatics 2011, 27, 3070–3071. [Google Scholar] [CrossRef] [Green Version]
- Paradis, E.; Schliep, K. ape 50: An environment for modern phylogenetics evolutionary analyses in R. Bioinformatics 2018, 35, 526–528. [Google Scholar] [CrossRef] [PubMed]
- Evans, K.; Patocchi, A.; Rezzonico, F.; Mathis, F.; Durel, C.E.; Fernandez-Fernandez, F.; Boudichevskaia, A.; Dunemann, F.; Stankiewicz-Kosyl, M.; Gianfranceschi, L. Genotyping of pedigreed apple breeding material with a genome-covering set of SSRs: Trueness-to-type of cultivars and their parentages. Mol. Breed. 2011, 28, 535–547. [Google Scholar] [CrossRef] [Green Version]
- Patzak, J.; Paprštein, F.; Henychová, A.; Sedlák, J. Genetic diversity of Czech apple cultivars inferred from microsatellite markers analysis. Hortic. Sci. 2012, 39, 149–157. [Google Scholar] [CrossRef] [Green Version]
- Skytte af Sätra, J.; Troggio, M.; Odilbekov, F.; Sehic, J.; Mattisson, H.; Hjalmarsson, I.; Ingvarsson, P.K.; Garkava-Gustavsson, L. Genetic Status of the Swedish Central collection of heirloom apple cultivars. Sci. Hortic. 2020, 272, 109599. [Google Scholar] [CrossRef]
- Okie, W.R. Register of New Fruit and Nut Varieties Brooks and Olmo List 38. HortScience 1997, 32, 785–805. [Google Scholar] [CrossRef] [Green Version]
- Stedje, P.; Skard, O.M. Norsk Pomologi. 1: Epler ed. Det Norske Hageselskap; Grøndahl og Søns Forlag: Oslo, Norway, 1943; Volume 2, 497p. [Google Scholar]
- Le Scouarnec, S.; Gribble, S.M. Characterising chromosome rearrangements: Recent technical advances in molecular cytogenetics. Heredity 2012, 108, 75–85. [Google Scholar] [CrossRef]
- Howard, N.P.; Troggio, M.; Durel, C.-E.; Muranty, H.; Denancé, C.; Bianco, L.; Tillman, J.; van de Weg, E. Integration of Infinium and Axiom SNP array data in the outcrossing species Malus × domestica and causes for seemingly incompatible calls. BMC Genom. 2021, 22, 246. [Google Scholar] [CrossRef]
- Bonk, S.; Reichelt, M.; Teuscher, F.; Segelke, D.; Reinsch, N. Mendelian sampling covariability of marker effects and genetic values. Genet. Sel. Evol. 2016, 48, 36. [Google Scholar] [CrossRef] [Green Version]
- Harrison, K. Mouldy core in Gravenstein apples. Sci. Agric. 1935, 15, 358–369. [Google Scholar] [CrossRef]
- McClure, K.A.; Gong, Y.; Song, J.; Vinqvist-Tymchuk, M.; Campbell Palmer, L.; Fan, L.; Burgher-MacLellan, K.; Zhang, Z.; Celton, J.-M.; Forney, C.F.; et al. Genome-wide association studies in apple reveal loci of large effect controlling apple polyphenols. Hortic. Res. 2019, 6, 107. [Google Scholar] [CrossRef] [Green Version]
- Migicovsky, Z.; Gardner, K.M.; Money, D.; Sawler, J.; Bloom, J.S.; Moffett, P.; Chao, C.T.; Schwaninger, H.; Fazio, G.; Zhong, G.-Y.; et al. Genome to Phenome Mapping in Apple Using Historical Data. Plant Genome 2016, 9, plantgenome2015-11. [Google Scholar] [CrossRef] [PubMed]
- Khan, M.A.; Korban, S.S. Association mapping in forest trees and fruit crops. J. Exp. Bot. 2012, 63, 4045–4060. [Google Scholar] [CrossRef] [PubMed] [Green Version]
- Myles, S.; Chia, J.-M.; Hurwitz, B.; Simon, C.; Zhong, G.Y.; Buckler, E.; Ware, D. Rapid genomic characterization of the genus Vitis. PLoS ONE 2010, 5, e8219. [Google Scholar] [CrossRef] [PubMed] [Green Version]
- Flint-Garcia, S.A.; Thornsberry, J.M.; Buckler, E.S., IV. Structure of linkage disequilibrium in plants. Annu. Rev. Plant Biol. 2003, 54, 357–374. [Google Scholar] [CrossRef] [Green Version]
- Meland, M.; Aksic, M.F.; Frøynes, O.; Konjic, A.; Lasic, L.; Pojskic, N.; Gasi, F. Genetic Identity and Diversity of Apple Accessions within a Candidate Collection for the Norwegian National Clonal Germplasm Repository. Horticulturae 2022, 8, 630. [Google Scholar] [CrossRef]
- Migicovsky, Z.; Gardner, K.M.; Richards, C.; Thomas Chao, C.; Schwaninger, H.R.; Fazio, G.; Zhong, G.-Y.; Myles, S. Genomic consequences of apple improvement. Hortic. Res. 2021, 8, 9. [Google Scholar] [CrossRef]
- Urrestarazu, J.; Miranda, C.; Santesteban, L.G.; Royo, J.B. Genetic diversity and structure of local apple cultivars from Northeastern Spain assessed by microsatellite markers. Tree Genet. Genomes 2012, 8, 1163–1180. [Google Scholar] [CrossRef]
- Frichot, E.; Mathieu, F.; Trouillon, T.; Bouchard, G.; François, O. Fast and efficient estimation of individual ancestry coefficients. Genetics 2014, 196, 973–983. [Google Scholar] [CrossRef] [Green Version]
- Zurn, J.D.; Hummer, K.E.; Bassil, N.V. Exploring the diversity and genetic structure of the US National Cultivated Strawberry Collection. Hortic. Res. 2022, 9, uhac125. [Google Scholar] [CrossRef]
- Janes, J.K.; Miller, J.M.; Dupuis, J.R.; Malenfant, R.M.; Gorrell, J.C.; Cullingham, C.I.; Andrew, R.L. The K = 2 conundrum. Mol. Ecol. 2017, 26, 3594–3602. [Google Scholar] [CrossRef] [Green Version]
- Otto, S.P.; Whitton, J. Polyploid incidence and evolution. Annu. Rev. Genet. 2000, 34, 401–437. [Google Scholar] [CrossRef] [PubMed] [Green Version]
- Beukelaer, H.D.; Smýkal, P.; Davenport, G.F.; Fack, V. Core Hunter II: Fast core subset selection based on multiple genetic diversity measures using Mixed Replica search. BMC Bioinform. 2012, 13, 312. [Google Scholar] [CrossRef] [PubMed] [Green Version]
- Geibel, J.; Reimer, C.; Weigend, S.; Weigend, A.; Pook, T.; Simianer, H. How array design creates SNP ascertainment bias. PLoS ONE 2021, 16, e0245178. [Google Scholar] [CrossRef] [PubMed]
- Byrne, P.F.; Volk, G.M.; Gardner, C.; Gore, M.A.; Simon, P.W.; Smith, S. Sustaining the future of plant breeding: The critical role of the USDA-ARS National Plant Germplasm System. Crop Sci. 2018, 58, 451–468. [Google Scholar] [CrossRef] [Green Version]
- Langridge, P.; Waugh, R. Harnessing the potential of germplasm collections. Nat. Genet. 2019, 51, 200–201. [Google Scholar] [CrossRef] [PubMed]
- Ingvarsson, P.K.; Street, N.R. Association genetics of complex traits in plants. New Phytol. 2011, 189, 909–922. [Google Scholar] [CrossRef]
Figure 1.
First-degree and clonal relationships within the NAC: (a) A first-degree relationship network between accessions. Accessions with a minimum of one first-degree relationship (n = 195) are included. Accessions are denoted by a dot and lines represent first-degree relationships; (b) count of first-degree relationships for the accessions within the NAC (n = 347).
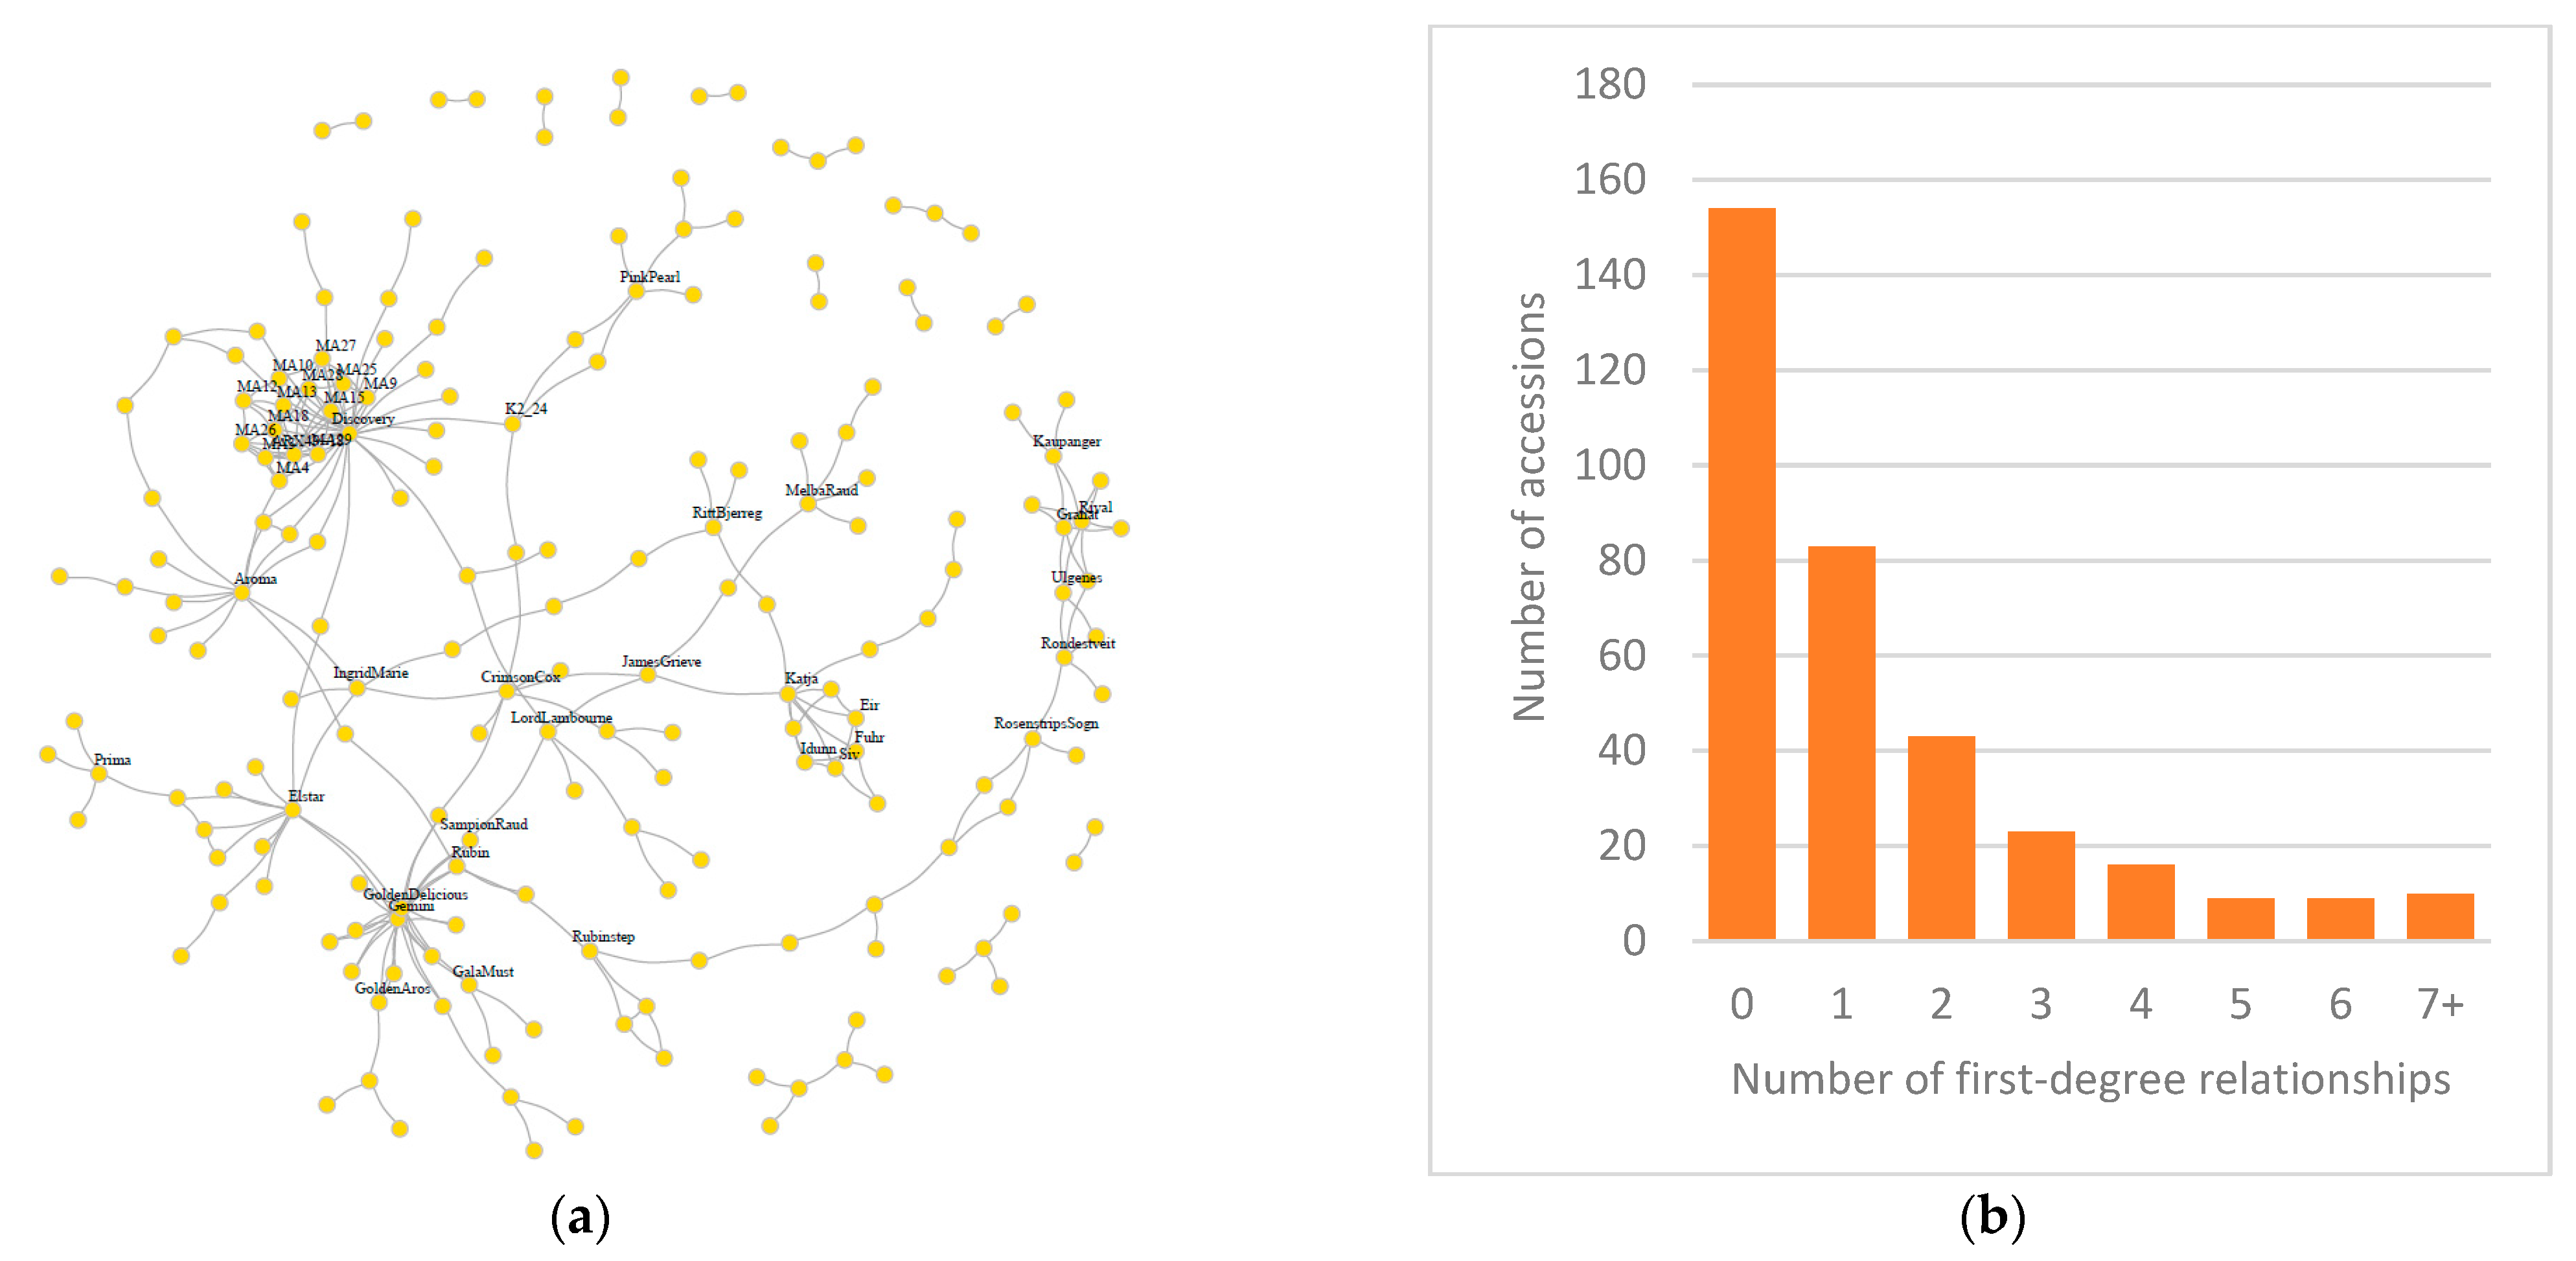
Figure 2.
Linkage disequilibrium (LD) decay in a Norwegian apple population: (a) Using comparisons of inter-SNP distances up to 1 Mb when calculating LD decay; (b) Using comparisons of inter-SNP distances up to 1500 bp when calculating LD decay. The LOESS method was used to calculate smoothed fitted lines.
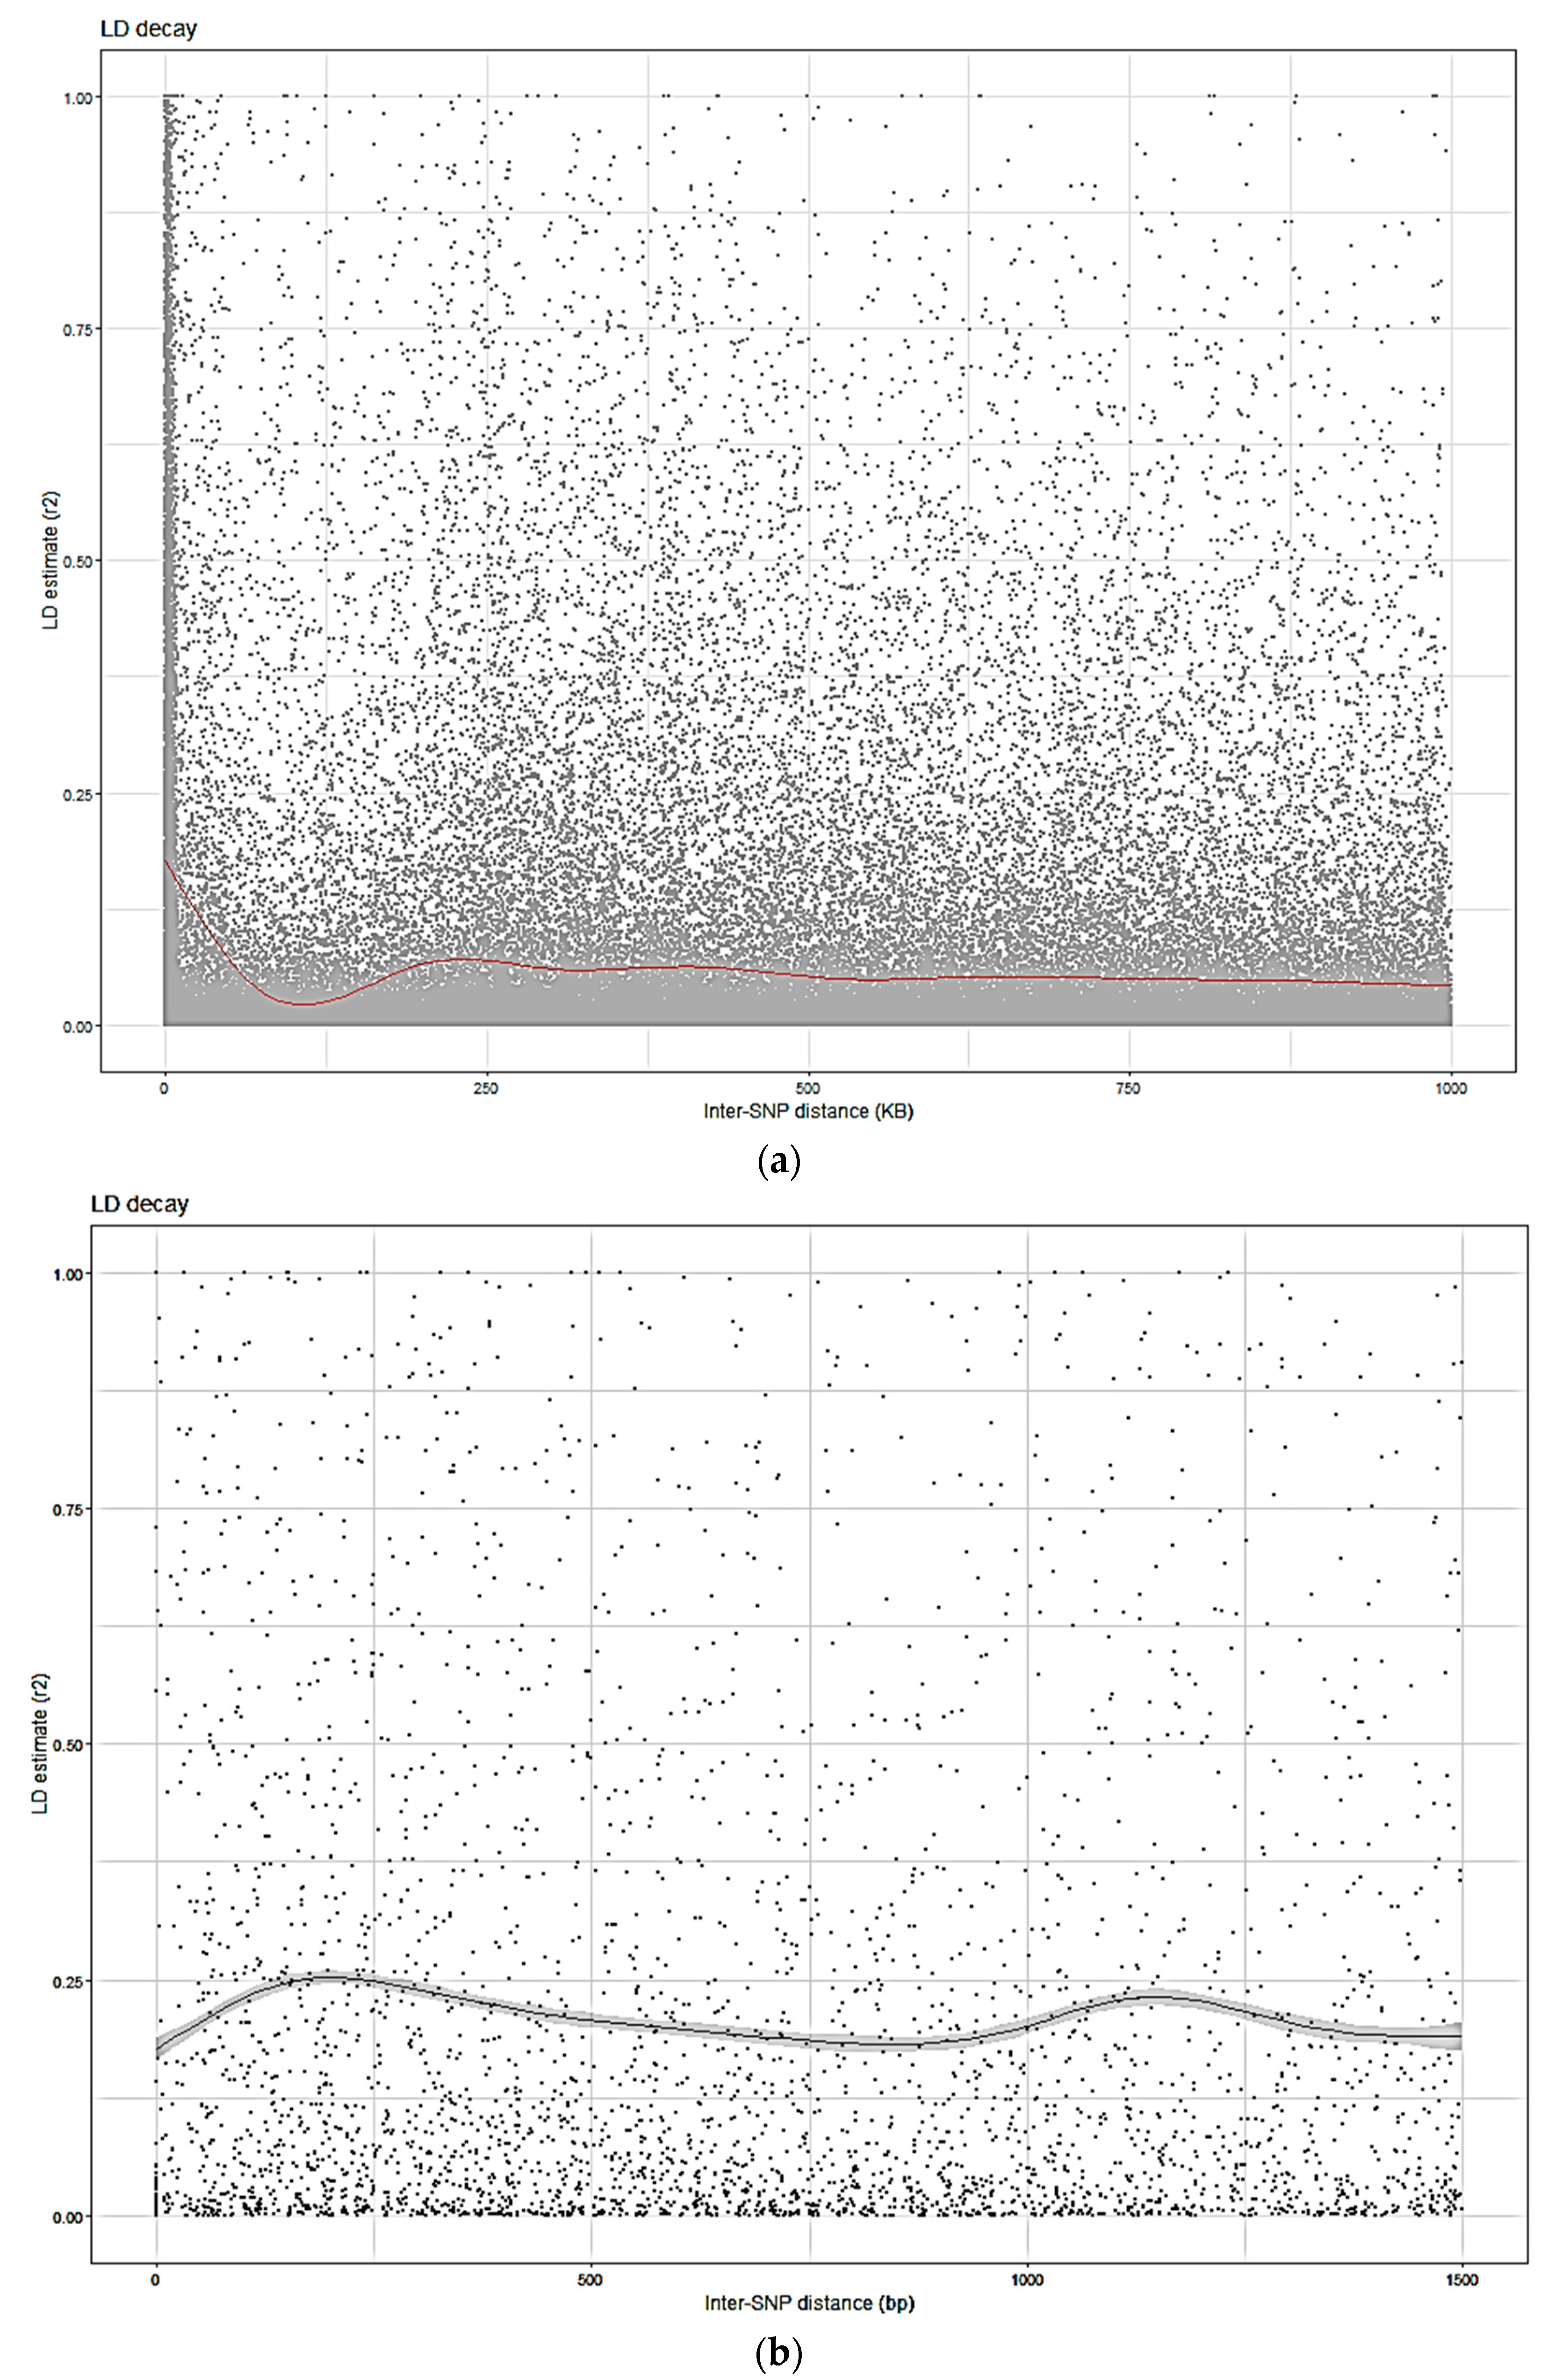
Figure 3.
Frequency-based statistics: Nei’s expected heterozygosity (He), entry-to-nearest-entry (E–NE), and accession-to-nearest-entry (A–NE) distance optimization for various core collection sample sizes.
Figure 3.
Frequency-based statistics: Nei’s expected heterozygosity (He), entry-to-nearest-entry (E–NE), and accession-to-nearest-entry (A–NE) distance optimization for various core collection sample sizes.

Figure 4.
Analysis showing population structure for the Norwegian Apple Collection (NAC): (a). Principal components analysis (PCA) with the percent variance explained by PCs indicated in parentheses. For the PCA plot, the accessions were divided into clusters based on origin (Section 3.7); (b) The STRUCTURE analysis of 296 accessions with five putative genetic clusters and distribution of accessions based on origin (Section 3.7) in these five subpopulations.
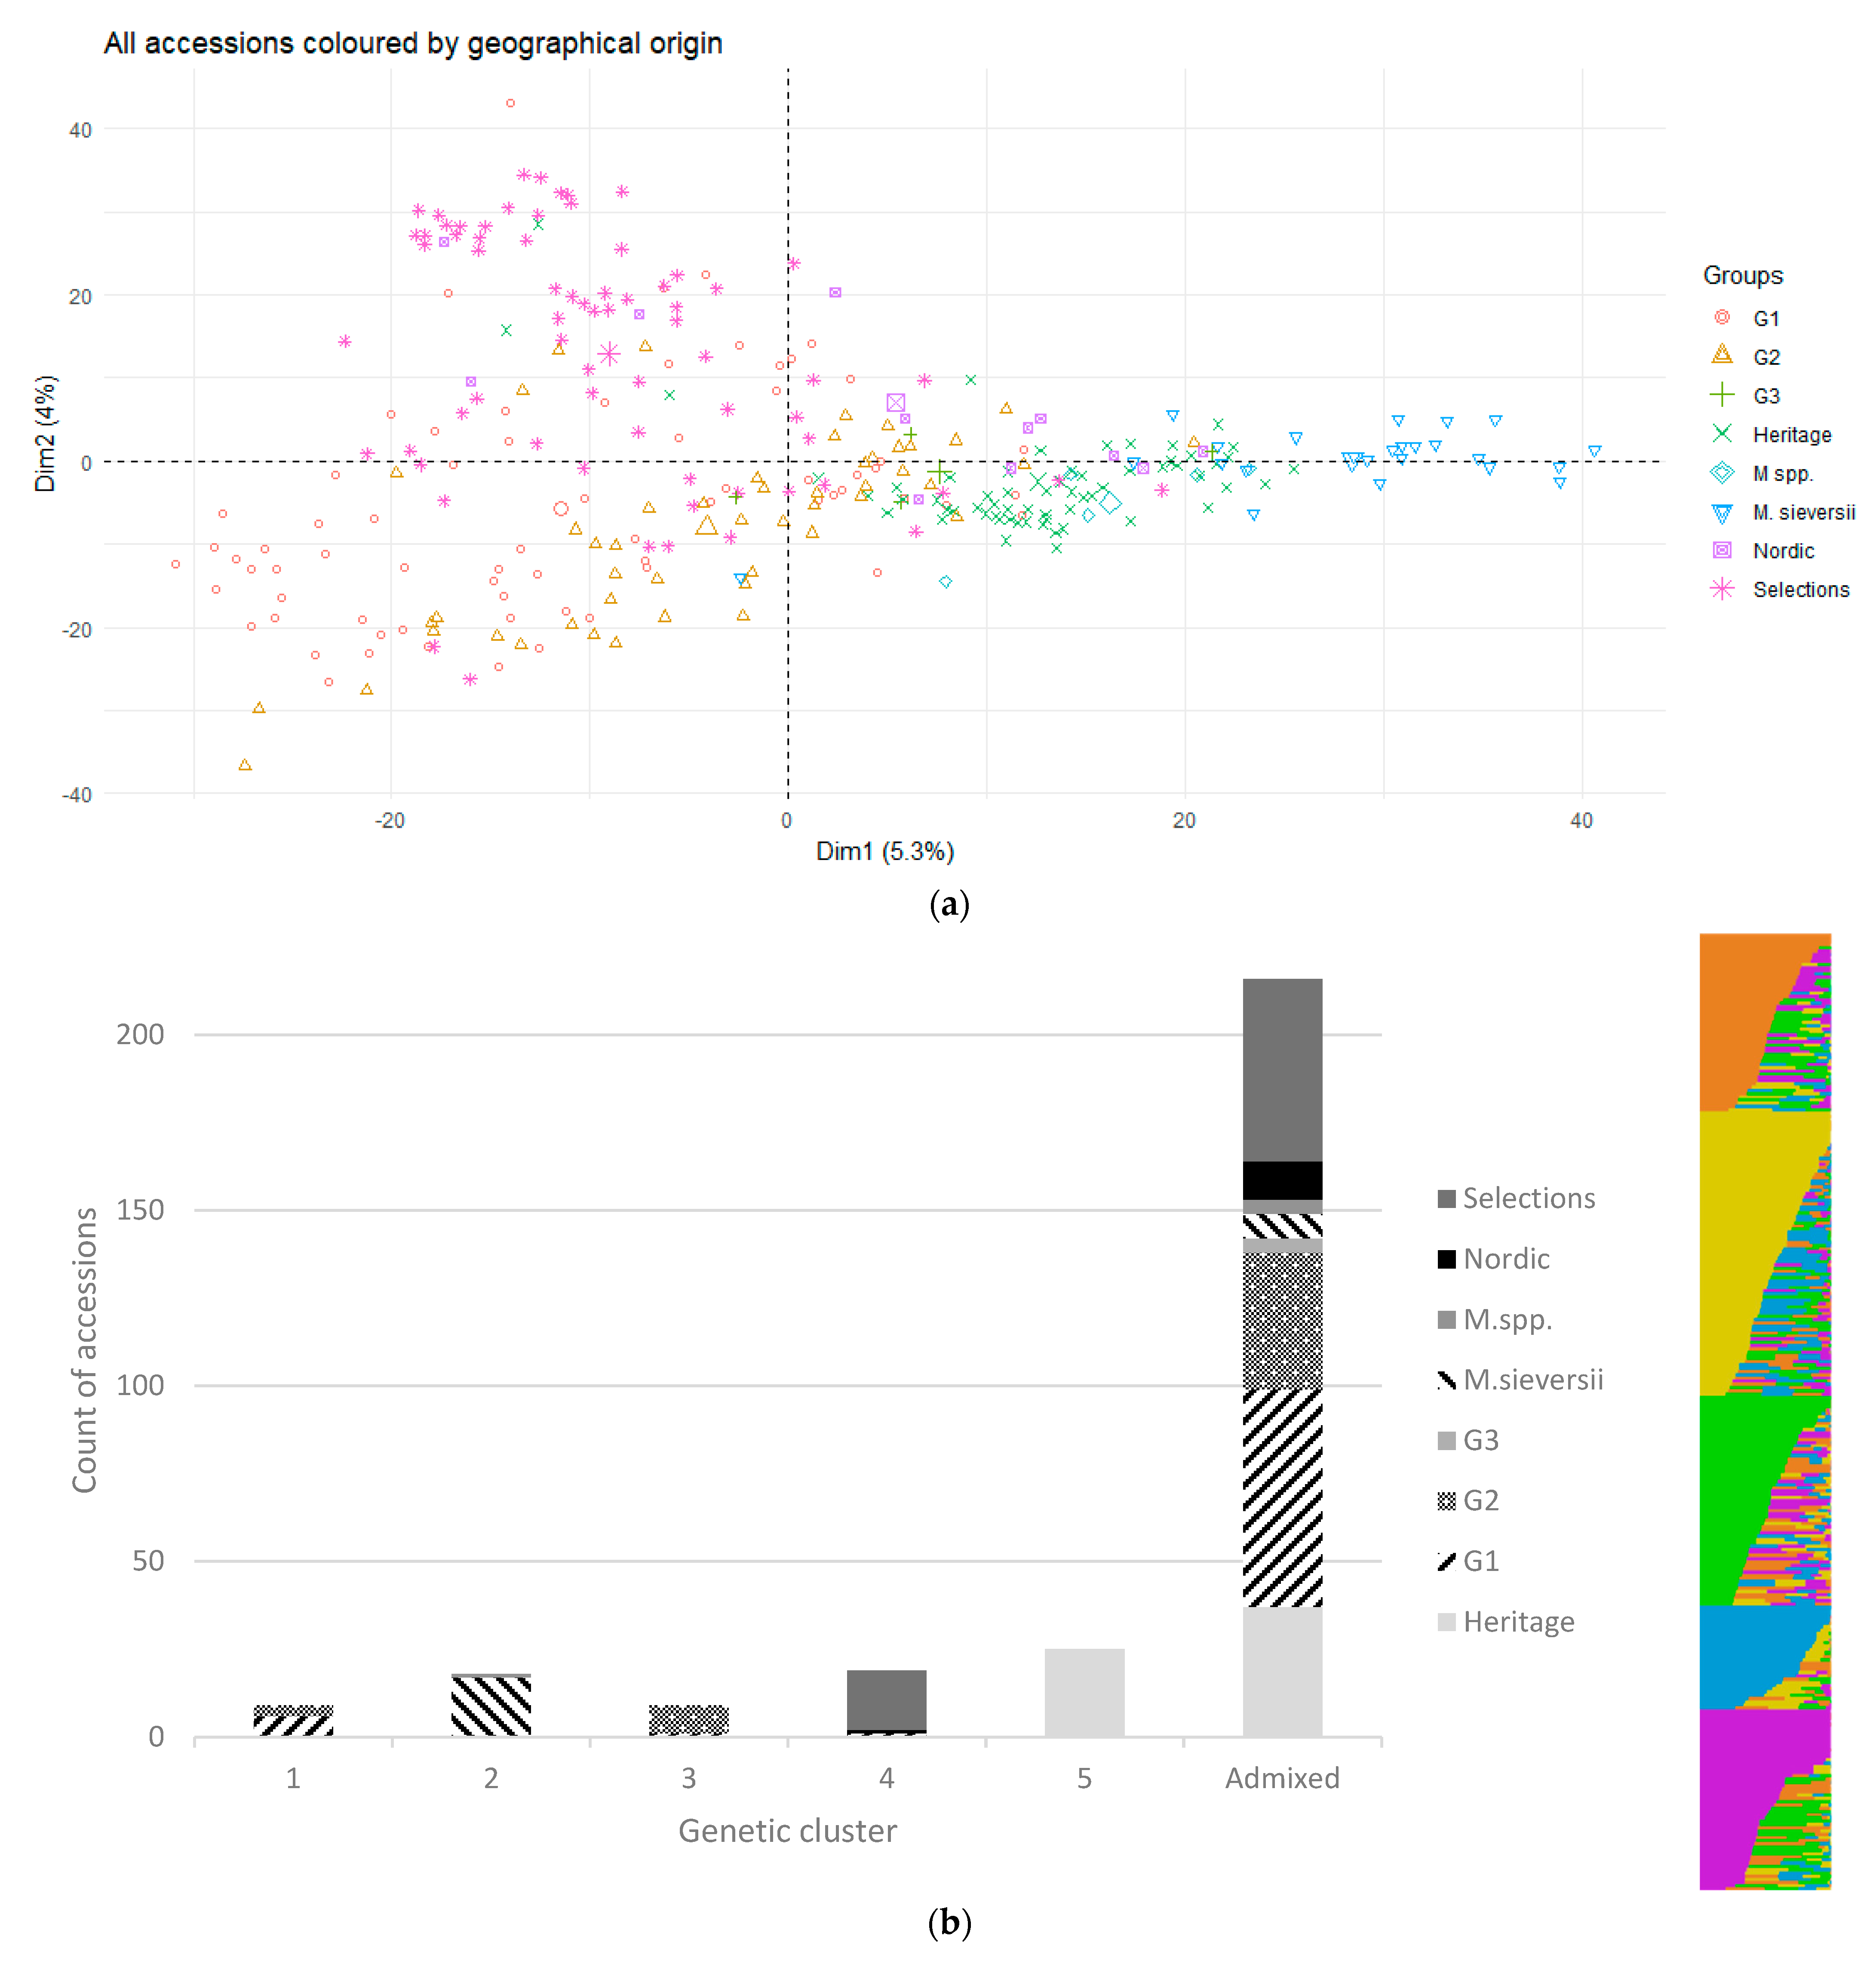
Figure 5.
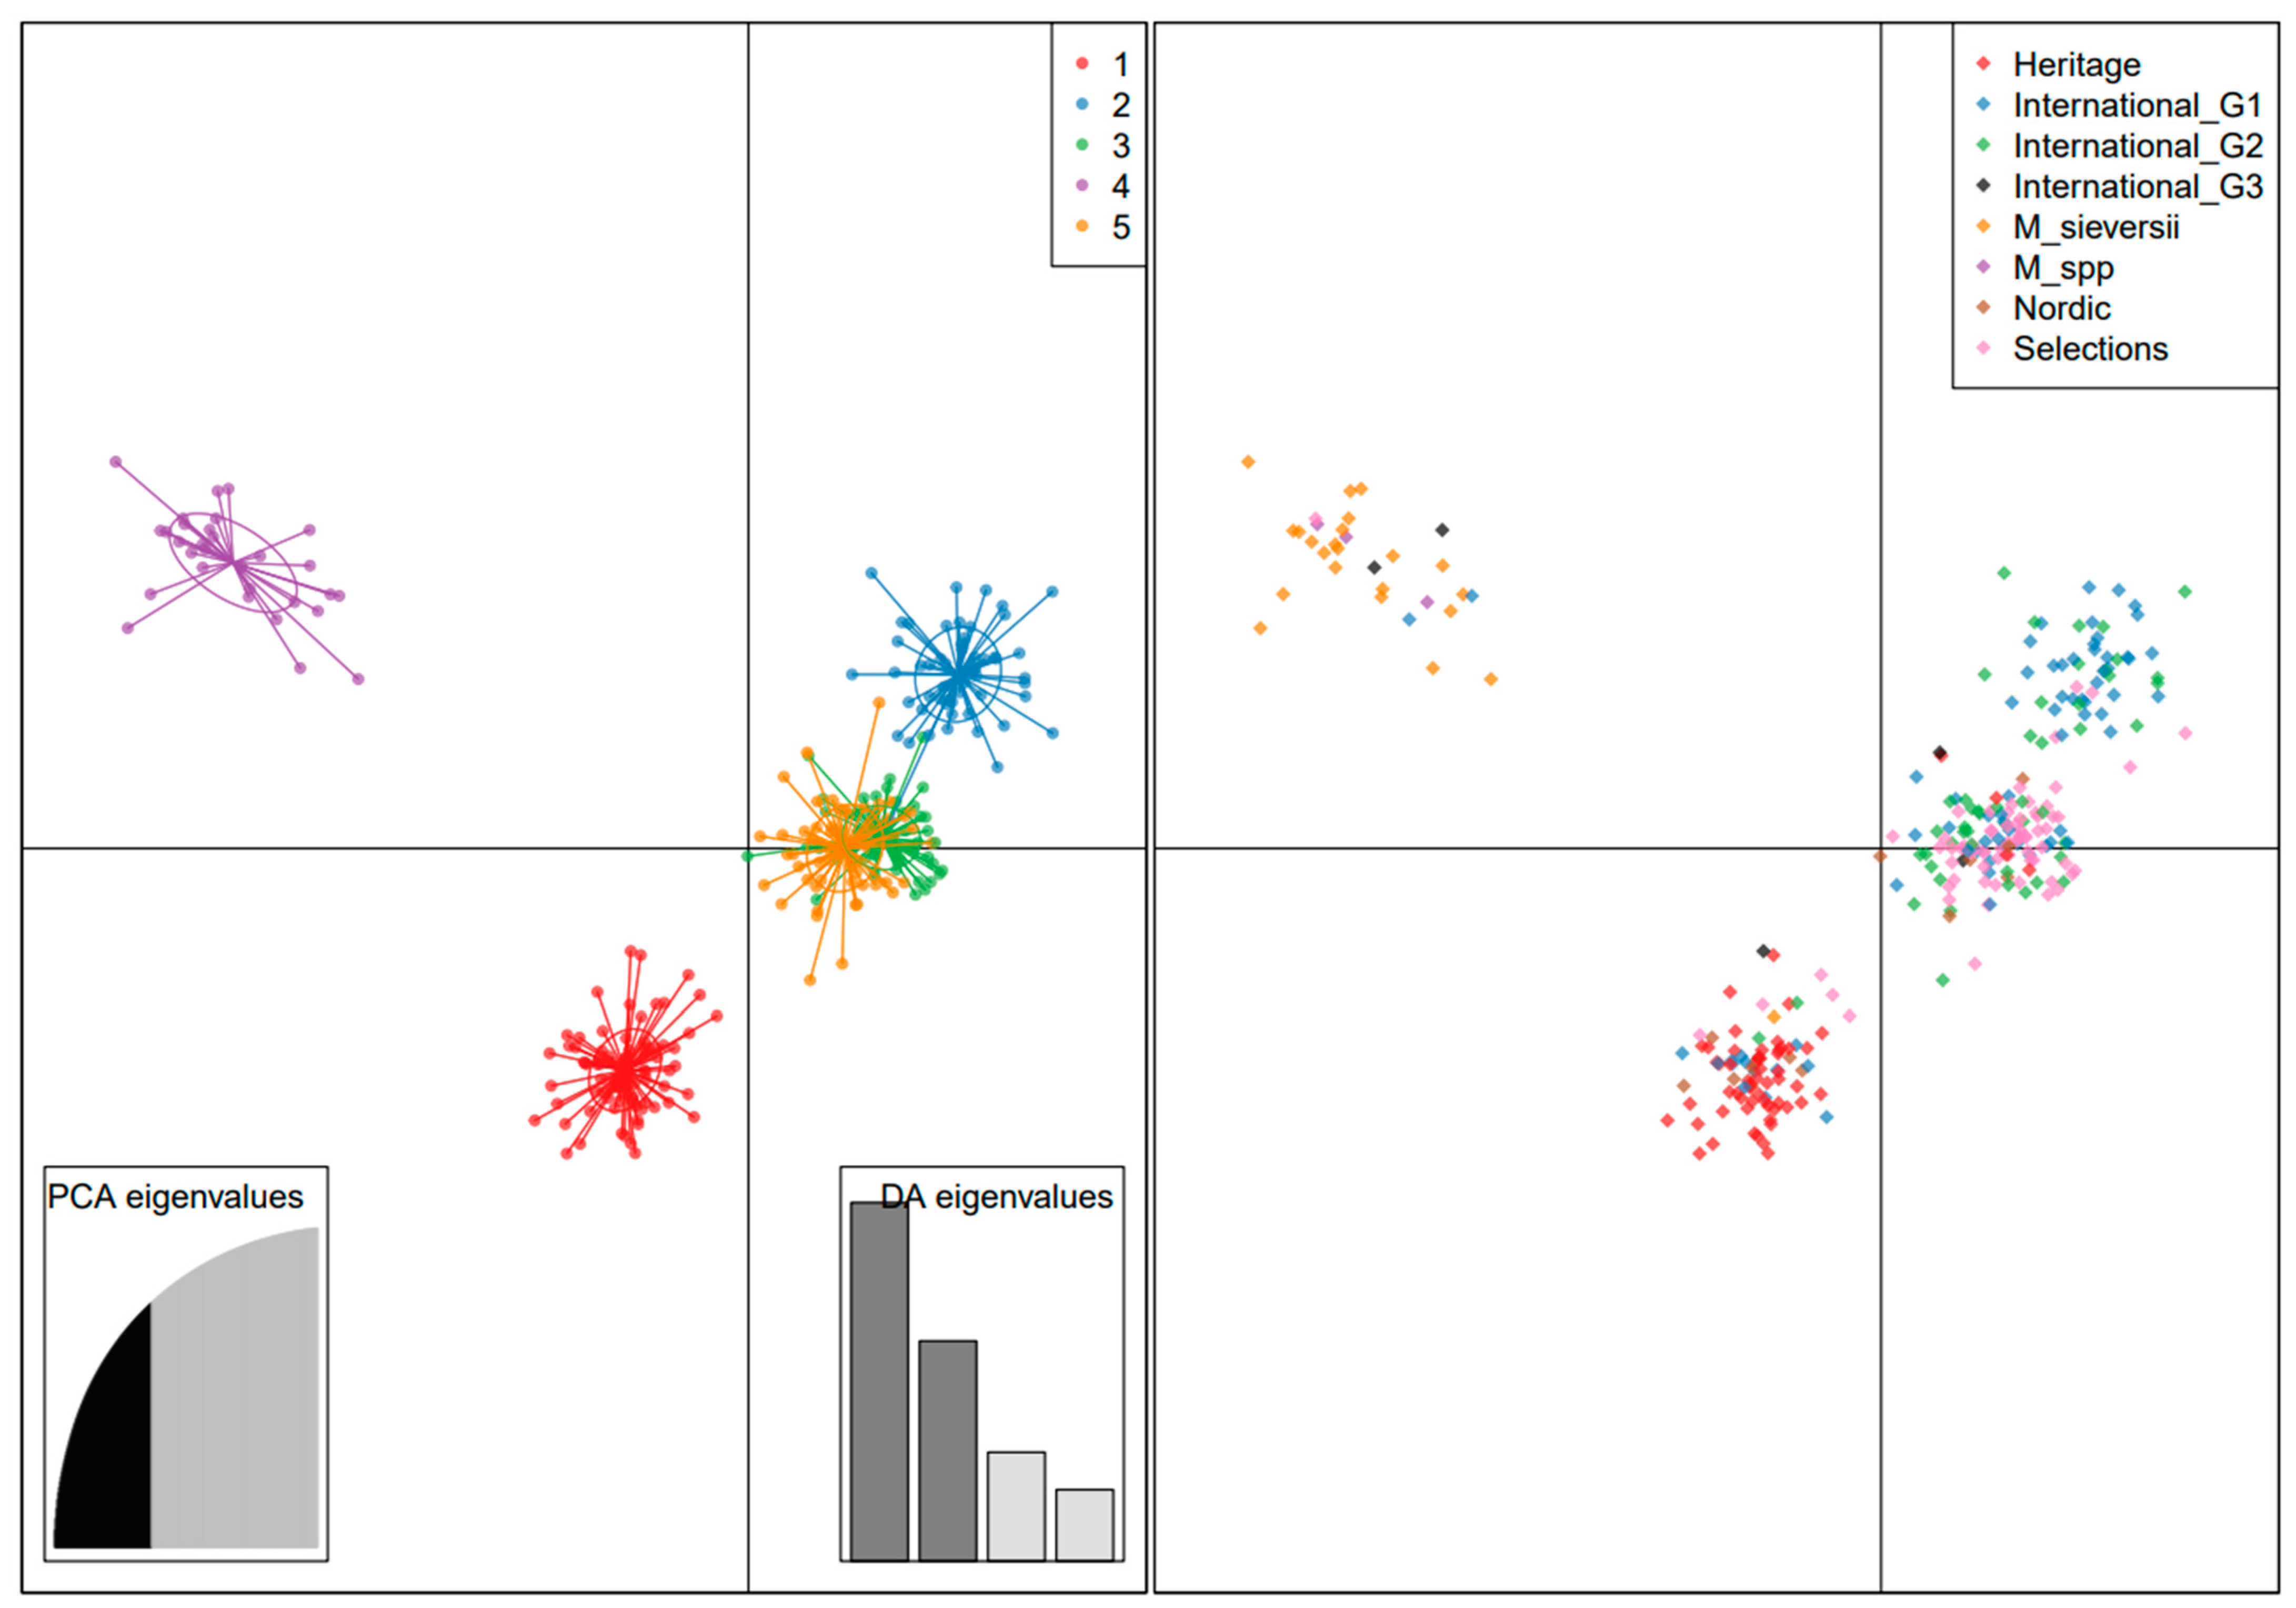
A DAPC of the NAC with the value of clusters (K) as an inference of the number of subpopulations in the collection. In the left pane, the cluster (4) colored in purple, contains M sieversii accessions, and the red-colored cluster (1) contains Norwegian Heritage accessions and a few older European cultivars. The blue-colored cluster (2) contain International G1 and G2 cultivars; meanwhile, the two clusters in the center contain accessions from the Norwegian breeding program including parents used for crossing (3, green color), and International G2 cultivars (5, orange color).
Figure 5.
A DAPC of the NAC with the value of clusters (K) as an inference of the number of subpopulations in the collection. In the left pane, the cluster (4) colored in purple, contains M sieversii accessions, and the red-colored cluster (1) contains Norwegian Heritage accessions and a few older European cultivars. The blue-colored cluster (2) contain International G1 and G2 cultivars; meanwhile, the two clusters in the center contain accessions from the Norwegian breeding program including parents used for crossing (3, green color), and International G2 cultivars (5, orange color).

Table 1.
Possible parent-offspring relationships in the NAC.
| Offspring | PosPar1 | PosPar2 | Age Offspring | Age Parent 1 | Age Parent 2 |
|---|---|---|---|---|---|
| ‘Bøtuneple’ | ‘Rosenstrips Sogn’ | Unknown | 1781 | ||
| ‘Crimson Cox’ | ‘Steinkyrkje’ | 1825 | 1700/1800 | ||
| ‘Ekely’ | ‘Rosenstrips Hard.’ | 1907 | 1781 | ||
| ‘Enestående’ | ‘Høyneseple’ | Unknown | 1800 | ||
| ‘Filippa’ | ‘Flaske-eple’ | 1880 | 1700 | ||
| ‘Rosenstrips Sogn’ | ‘Fuhr’ | ‘Torstein’ | 1781 | 1660 | 1760 |
| ‘Furuholm’ | ‘Sävstaholm’ | Unknown | 1830 | ||
| ‘Hindals Dronning’ | ‘Worcester Pearmain’ | Unknown | 1874 | ||
| ‘Håkonseple’ | ‘Lærdalseple’ | ‘Torstein’ | 1905 | Unknown | 1760 |
| ‘Tolleivseple’ | ‘Kaupanger’ | Unknown | 1700 | ||
| ‘Tormod’ | ‘Kaupanger’ | Unknown | 1700 | ||
| ‘Langballe’ | ‘Franskar’ | 1870 | 1790 | ||
| ‘Leiknes’ | ‘Granat’ | 1890 | Unknown | ||
| ‘Linda’ | ‘Granat’ | ‘Transp. Blanche’ | 1970 | Unknown | 1800 |
| ‘Løeple’ | ‘Høyneseple’ | ‘Lærdalseple’ | 1925 | 1800 | Unknown |
| ‘Martaeple’ | ‘Lærdalseple’ | ‘Torstein’ | 1915 | Unknown | 1760 |
| ‘Mostereple’ | ‘Høyneseple’ | - | 1800 | ||
| ‘Prins’ | ‘Granat’ | 1860 | Unknown | ||
| ‘Sukkereple’ | ‘Høyneseple’ | Unknown | 1800 | ||
| ‘Teigeple’ | ‘Rosenstrips Hard.’ | Unknown | 1781 | ||
| ‘Pederstrup’ | ‘Torstein’ | 1850 | 1760 | ||
| ‘Tveiteple’ | ‘Granat’ | ‘Rosenstrips Hard.’ | 1925 | Unknown | 1781 |
| ‘Ulgenes’ | ‘Granat’ | ‘Rosenstrips Hard.’ | Unknown | 1781 |
Table 2.
Comparison of the Norwegian Apple Collection as separated by genetic clusters from structural analysis (Figure 4). The number of accessions included in the two core collections is shown.
Table 2.
Comparison of the Norwegian Apple Collection as separated by genetic clusters from structural analysis (Figure 4). The number of accessions included in the two core collections is shown.
| Core Collection Type | ||
|---|---|---|
| Structure Group | CC–I (A–NE) | CC–X (E–NE) |
| Selections | 15 | 25 |
| Heritage | 22 | 12 |
| International_G1 | 24 | 25 |
| International_G2 | 17 | 20 |
| International_G3 | 5 | 4 |
| M. sieversii | 6 | 7 |
| M.spp. | 3 | 2 |
| Nordic | 8 | 5 |
| Whole Core Collection | 100 | 100 |
Disclaimer/Publisher’s Note: The statements, opinions and data contained in all publications are solely those of the individual author(s) and contributor(s) and not of MDPI and/or the editor(s). MDPI and/or the editor(s) disclaim responsibility for any injury to people or property resulting from any ideas, methods, instructions or products referred to in the content. |
© 2023 by the authors. Licensee MDPI, Basel, Switzerland. This article is an open access article distributed under the terms and conditions of the Creative Commons Attribution (CC BY) license (https://creativecommons.org/licenses/by/4.0/).
Share and Cite
MDPI and ACS Style
Gilpin, L.; Røen, D.; Schubert, M.; Davik, J.; Rumpunen, K.; Gardli, K.A.; Hjeltnes, S.H.; Alsheikh, M. Genetic Characterization of the Norwegian Apple Collection. Horticulturae 2023, 9, 575. https://doi.org/10.3390/horticulturae9050575
AMA Style
Gilpin L, Røen D, Schubert M, Davik J, Rumpunen K, Gardli KA, Hjeltnes SH, Alsheikh M. Genetic Characterization of the Norwegian Apple Collection. Horticulturae. 2023; 9(5):575. https://doi.org/10.3390/horticulturae9050575
Chicago/Turabian StyleGilpin, Liv, Dag Røen, Marian Schubert, Jahn Davik, Kimmo Rumpunen, Kristina Alme Gardli, Stein Harald Hjeltnes, and Muath Alsheikh. 2023. "Genetic Characterization of the Norwegian Apple Collection" Horticulturae 9, no. 5: 575. https://doi.org/10.3390/horticulturae9050575
Note that from the first issue of 2016, this journal uses article numbers instead of page numbers. See further details here.