Article

A Survey of Key Methods, Traits, Parameters, and Conditions for Measuring Texture in Cranberry (Vaccinium macrocarpon Ait.)

1
Department of Horticulture, University of Wisconsin-Madison, 1575 Linden Dr., Madison, WI 53706, USA
2
Department of Viticulture and Enology, University of California Davis, One Shields Avenue, Davis, CA 95616, USA
3
Department of Agronomy, University of Wisconsin-Madison, 1575 Linden Dr., Madison, WI 53706, USA
4
USDA-ARS, Vegetable Crops Research Unit, Department of Horticulture, University of Wisconsin-Madison, 1575 Linden Dr., Madison, WI 53706, USA
5
USDA-ARS, Vegetable Crops Research Unit, Department of Food Science, University of Wisconsin-Madison, 1605 Linden Dr., Madison, WI 53706, USA
6
Fondazione Edmund Mach—Research and Innovation Centre Italy, Via Edmund Mach, 1, 38098 San Michele All’adige, TN, Italy
7
Department of Horticultural Science, Plants for Human Health Institute, North Carolina State University, NC Research Campus, 600 Laureate Way, Kannapolis, NC 28081, USA
*
Authors to whom correspondence should be addressed.
Horticulturae 2023, 9(4), 479; https://doi.org/10.3390/horticulturae9040479
Submission received: 3 January 2023 / Revised: 24 March 2023 / Accepted: 27 March 2023 / Published: 11 April 2023
(This article belongs to the Section Postharvest Biology, Quality, Safety, and Technology)

Abstract

:
In the cranberry (Vaccinium macrocarpon Ait.) industry, the textural properties and firmness of the fruit are priority traits for producing processed products, such as sweetened dried cranberry (SDC), which have gained popularity in recent years. However, there is currently no reliable methodology for screening these traits in breeding programs. In this study, we examine the key methodologies, textural traits, parameters, and conditions that are necessary to accurately and efficiently measure the texture of cranberry fruit. Double compression, single compression, puncture, shearing and Kramer shear cell methodologies were successfully implemented in cranberry, resulting in a total of 47 textural features. These features allowed the evaluation of the texture of the cranberry fruit based on key factors such as flesh, structure, and skin. This study also examined factors than can affect the performance of texture measurements, including the optimal sample size, storage time, fruit texture-size correlation, fruit temperature and orientation, optimal speed/strain combinations, and the effect of probe diameter. The results of the study suggests that certain texture traits of the compression and puncture methodologies could potentially be used to test varieties and aid in breeding programs.

1. Introduction

The American cranberry (Vaccinium macrocarpon Ait.) is a native North American fruit crop with growing popularity due to its nutraceutical potential [1,2,3,4]. Cranberry phytochemicals have been associated with a wide variety of health benefits including improvement of digestive and urinary tract health, cancer prevention as well as reduction of cardiometabolic risk factors [5,6,7,8]. The dissemination of these attributes of this super fruit has led to a steady increase in cranberry production in the US over the past two decades, and as a result, current production is almost double what it was in 1990 [9]. As the cranberry supply has often exceeded demand, cranberry breeders have begun to shift their focus from improving yield to improving fruit quality, which has become increasingly important for the cranberry industry in recent decades [10]. In particular, texture is one of the most critical attributes of cranberry fruit, especially due to growing popularity and production of sweetened dried cranberries (SDC), which is one of the most profitable products in the industry [11,12]. Although texture is currently one of the priority traits in cranberry, the progress of research and breeding efforts in this regard have been limited due to the lack of a consensus methodology for evaluating this trait.
As has been reported in other species [13,14,15,16], setting up texture measurement procedures is challenging due to the great variety of factors that can affect the performance of the tests. These factors include those related to fruit characteristics such as shape, size, uniformity, as well as handling and other preparation before measurements. For instance, the firmness of an apple can vary by 0.5% for every degree in temperature change at the time of the measurement, while the firmness of a raspberry can change by more than 2.5% per degree [17]. On the other hand, there are several instruments and accessories that operate on different principles, but that need to be optimized and calibrated to provide reliable measurements. Maury et al., demonstrated that combinations of speed and strain can influence the accuracy of grape texture measurement when monitoring their ripening process using a double compression test [14]. In other species such as strawberry, it has even been reported that the methods and firmness traits can be affected differently by the size of the fruit, which can lead to biased measurements [16]. Thus, the selection of the appropriate measurement methods, traits, parameters, and conditions is crucial to obtain accurate and reproducible results during texture analysis.
Some studies have explored the firmness attributes of raw and processed cranberry fruits, which have been based primarily on compression, as well as puncturing and cutting to a lesser extent [12,18,19,20,21,22,23,24]. However, these studies have not used optimized or consensus methodologies, and have employed different conditions and criteria to evaluate the firmness. For example, Foney [18] performed the measurements using a FirmTech1 instrument (Bio-Works, Stillwater, OK, USA), on the other hand, while Jamaly et al. [19], Diaz-Garcia et al. [20], Zielinska et al. [21], Liu et al. [22] y shamaei et al. [23] used different versions of texture analyzers, while Gorzelany et al. [24] used a Zwick/Roell 2010 testing machine (ZwickRoell GmbH & Co., KG, Ulm, Germany). Additionally, each study made measurements using different settings for parameters such as force, strain, and speed of the probe. Although these studies have provided valuable information on the texture of this crop, the feasibility of these evaluations as a phenotyping method for breeding purposes as in other species [16,25,26,27,28] has not been explored. While modern texture analyzers can provide accurate measurements on cranberry, their application and potential remain limited as long as measurements are not taken under consistent, optimal conditions.
In this study, we analyze the key methods, traits, parameters, and conditions for measuring texture in cranberry in order to contribute to the development of a consensus methodology for this crop. We evaluated previously used methods (compression, puncture and shearing) and those used for the first time in cranberry (Kramer shear cell) by testing three different cranberry cultivars with varying levels of fruit firmness (soft, medium, and hard). Our analysis of the different factors that affect the performance of the texture measurement provided valuable insights about the appropriate conditions to obtain accurate and reproducible results. Additionally, our results indicated that the compression (non-destructive) and puncture (destructive) methods are the most promising candidates for use as a standard method and should be further evaluated in future studies based on the information reported in this study. These findings represent an important reference for optimizing current firmness measurement protocols and for developing a standard methodology for cranberry, especially for phenotyping purposes in the breeding programs.

2. Materials and Methods

2.1. Harvesting and Processing of Fruits

To cover the full spectrum of cranberry firmness in each experiment, we used three cranberry cultivars with soft (Yellow bell and BG), medium (Sundance and Stevens) and firm (Granite red, Pilgrim king, M34 and A9) fruits as previously reported by Diaz-Garcia et al. [20]. All cultivars used in this study are established in commercial beds and individual experimental plots at the Valley Corporation cranberry farm in Tomah, WI where they are maintained under conventional cranberry management conditions. The use of the cultivars depended on the availability of the fruits as indicated in Table 1. Ripe fruits were randomly hand-harvested from the mid-canopy of the plant in the lots of each cultivar on 12 September 2018. On the same day of harvest, we selected only undamaged fruit and stored at 4 °C, or as required by the specific test. Additionally, the size of the fruits was measured using the GiNA software for Horticultural Phenotyping [29] before conducting texture measurements when required by the trial.

2.2. Texture Evaluation

For all tests, texture was measured as described below, unless otherwise specified in Table 1. Texture measurements were conducted within the first week after harvest to avoid significant changes due to storage. One hour before measurement, the fruit were removed from the refrigerator to reach room temperature (approximately 22 °C) and were subsequently measured on their equatorial side. Texture was measured using a texture analyzer (TA. XTPlus Connect, Textural Technologies, Hamilton, MA, USA) with the specific probes and parameters for each test as described below which were defined based on previous studies [20], information provided by the processing industry as well as preliminary tests carried out in the laboratory. The double compression test used a 3-inch diameter compression plate and was run using a 10 mm·s−1 pre-test speed, 2 mm·s−1 test speed, and 10 mm·s−1 post test speed. Each fruit was compressed twice to a strain (percent of initial height) of 10%. In particular, to evaluate the effect of the speed/strain couple, additional combinations of these parameters were evaluated as described in Table 2. For single compression, measurements were taken under the same conditions as double compression but using a maximum strain of 50%, fracturing most of the fruits tested. The puncture test was performed using a 2 mm diameter flat puncture probe and was run with a 10 mm·s−1 pre-test speed, 2 mm·s−1 test speed, and 10 mm·s−1 post-test speed, penetrating each berry to a depth of 5 mm. On the other hand, when the effect of puncture probe diameter was analyzed, the tests were run with the same parameters using three different diameter probes (Table 1). The shearing test used a 45° beveled blade and used an 8 mm·s−1 test speed and 15 mm·s−1 post-test speed. Each berry was cut until the blade reached 2 mm from the base platform. The Kramer shear cell test was performed using a 5-blade cell that moved a distance of 60 mm with 3 mm·s−1 test speed and 10 mm·s−1 post-test speed.
The texture traits listed in Table 3 were obtained from the force deformation profile generated by the different texture measurement methods or from previous studies cited below. The double compression or texture profile analysis (TPA) method texture was analyzed using the force/distance, force/time, force/strain and stress/strain profiles. For the stress/strain curve, stress was calculated according to Grotte et al. [30]. The TPA parameters that correspond to indices of hardness, cohesiveness and gumminess of the texture profile analysis are also indicated in Table 3 [13,14,28,31,32]. Hardness is expressed as the maximum force during compression, cohesiveness corresponds to the ratio of the work associated with the area under the curve to the maximum force of the second compression over that of the first compression, and gumminess corresponds to the product of hardness x cohesiveness. Additionally, the maximum contact force and apparent modulus of elasticity texture traits were calculated, which have shown to be effective for determining the texture of berry-like fruits [33,34,35]. Traits resulting from the puncture, shearing, Kramer shear cell and single compression tests were generated from the force over distance curves. The apparent modulus of elasticity was also calculated for the puncture method according to ASABE [35].

2.3. Tests Procedure and Statistical Analysis

2.3.1. Determination of the Optimal Sample Size for Texture Evaluation in Cranberry (Vaccinium macrocarpon Ait.) Fruits

For all methods, the optimal sample size and repeatability associated with each texture trait was determined by calculating the coefficient of variation using 300 fruits from our three cultivars (Table 1). To calculate the coefficient of variation of the different sample sizes, the data were randomly extracted and distributed equally among the cultivars in the database, and an average of 50 iterations was reported. By plotting the coefficient of variation versus the sample size, the optimal sample size was determined when the curve became stable.

2.3.2. Effect of Storage Time on Fruit Firmness

To determine the effect of storage time on cranberry firmness, 100 fruits of three different cultivars were evaluated on four different dates as indicated in Table 1. For this test, only maximum force was considered as it is commonly used to assess firmness in this crop. Since it has been reported that the quality attributes of fresh cranberry fruits are not compromised during the first month of storage [21], the first firmness measurement for this trial was taken up to 31 days after harvest. For each cultivar, the mean values of the 100 fruits were calculated for each date and used to fit a linear model. The intercept of the linear model for each cultivar was considered to be the initial firmness value representing 100% firmness from which the percentages of the other storage dates were derived.

2.3.3. Influence of Fruit Size on Texture Traits

The fruit texture-size relationship and the effect of fruit size on the performance of texture traits to differentiate between cultivars were evaluated by performing a correlation and Tukey’s honestly significant difference (HSD) analysis, respectively. To perform this evaluation, texture and external appearance measurements were taken individually for 100 fruits of three cultivars that differed in both texture and fruit size (Table 1). Texture was evaluated using the double compression, puncture and shearing tests and the external appearance of the fruit was evaluated using GiNA [29]. For this test two batches of fruits that differ in their fruit size homogeneity between cultivars were considered. The first batch of fruits (heterogeneous in fruit size between cultivars) corresponds to the original sample and the second batch (homogeneous in fruit size between cultivars) corresponds to a filtered subsample based on the GiNA data composed of 50 fruits for cultivar without significant fruit size differences between them (at p = 0.05). The results of the correlation and Tukey’s HSD tests were compared between the two fruit batches to determine differences due to the effect of berry size.

2.3.4. Temperature Effect on Fruit Texture Evaluation

To test the effect of temperature on cranberry fruit texture evaluation, two sets of double compression tests were run on three different cultivars (Table 1). For each cultivar, two batches of 50 fruits in good condition were stored in a refrigerator at 7.77 °C. The first batch was measured immediately after removing it from the refrigerator at 7.77 °C, and for the second one, the fruit were left to get room temperature (21.66 °C). The temperature of the fruits was monitored at all times to ensure that all samples were measured at the desired temperature. The percentage change of texture traits per degree temperature increase was calculated using the firmness-temperature coefficient (FT) according to Bourne [17]. Mean and coefficient of variation were also calculated to make a more complete comparison of texture measurements at both temperatures. A Tukey test was also performed to determine if the values were significantly different between the temperatures for each trait (p > 0.05). Additionally, the ability to detect differences between cultivars due to the values of texture traits was evaluated by a Tukey’s HSD test.

2.3.5. Influence of Fruit Orientation on Fruit Texture Evaluation

The influence of the fruit orientation on the texture measurement using a double compression method was examined in our three cultivars (Table 1). For half of the fruit from each cultivar, the texture along the equatorial diameter was measured (as it is usually done in cranberry), while for the remaining half, the measurements were recorded along the polar diameter of the fruit. To evaluate the texture in the polar diameter, the fruit were placed with their stem or calyx touching the base plate of the texture analyzer. If the fruit could not stand lengthwise on its own it was loosely held (not squeezed) with forceps while it was tested to keep it upright. For all the texture traits, the measurements of both tests were compared by calculating the means and coefficient of variation. Additionally, the ability of the parameters to detect texture differences due to the cultivars was evaluated by a Tukey’s HSD test and the results of the two tests were compared.

2.3.6. Optimization of the Speed/Strain Couple for the Double Compression Test

In order to determine the optimal speed/strain couple for the double compression method, a central composite design experiment was carried out on a set of three cultivars ranging in firmness (Table 1). Samples of fifty fruits from each cultivar were run through double compression tests which covered a range of test speeds (1–15 mm·s−1) and strains (5% to 40%) (Table 2). This central composite design contains four factorial points [(3.05 mm·s−1,10%), (12.95 mm·s−1, 10%), (3.05 mm·s−1, 35%) and (12.95 mm·s−1, 35%)], four axial points [(8 mm·s−1, 5%), (1 mm·s−1, 22.5%), (15 mm·s−1, 22.5%) and (8 mm·s−1, 40%)], and five center points [(8 mm·s−1, 22.5%)]. For each speed/strain couple, the texture values of the three cultivars were analyzed with an ANOVA test and Fisher’s values were used to analyze the experimental design to determine the optimal measurement conditions of each texture trait. Thus, for each trait the optimal speed/strain couple corresponded to the couple that yielded the highest Fisher value as a result of its greater dependence on the differences in texture values due to the cultivars. The second order regression model used for this analysis was
y i j = β 0 + β 1 x 1 i + β 2 x 2 i + β 3 x 1 i 2 + β 4 x 2 i 2 + β 5 x 1 i x 2 i + ε i j
with y as the observed Fisher value,   x 1 as speed, x 2 as strain, ε as residual error, i as the index for observations and j as the index for replications of an observation.

2.3.7. Probe Diameter Effect on Texture Measurement with the Puncture Method

The effect of the probe diameter on the texture measurements of the puncture method was evaluated using 2, 5 and 7 mm diameter probes in three cranberry cultivars (Table 1). The puncture test was performed with a puncture depth of 5 mm and was run with a 10 mm·s−1 pre-test speed, 2 mm·s−1 test speed and 10 mm·s−1 post-test speed. The texture measurements of different probe diameters were analyzed and compared by performing a Tukey’s HSD test and the calculation of the coefficient of variation.

3. Results

3.1. Evaluated Methodologies

To evaluate the usefulness of different methodologies available for measuring texture in cranberry, five methodologies were considered in this study. The double compression, single compression, puncture, shearing and Kramer shear cell methodologies were successfully implemented producing a total of 47 texture features (Table 3). This large number of parameters allows the evaluation of the texture of the cranberry fruit based on factors that are determinants such as the flesh, structure and skin of the fruit. Additionally, some textural traits that are calculated considering the size of the berry, such as the apparent modulus of elasticity, maximum contact pressure and those based on stress, were also reported.

3.2. Sample Size and Texture Traits Repeatability

For all methodologies, the optimal sample size was determined by plotting the coefficient of variation against samples of different sizes, and, because the results were very similar between the texture traits of each methodology, only two traits are shown for each one in Figure 1. The sample size required is also similar between methodologies since for all of them, the curves become stable with around 30 fruits or 30 loads. Therefore, our results indicate that a sample size of n = 30 is adequate to use in the texture measurement methodologies used for cranberry. According to Table S1, coefficient of variation values indicated good reproducibility for Kramer shear cell texture traits (6.71 to 7.5) and average reproducibility for shearing (18.71 to 27.84) and puncture (13.21 to 25.83). On the contrary, the coefficient of variation varied widely for the compression methods, from 11.56 to 63.05 and from 3.20 to 41.83 for single and double compression, respectively. For the double compression methodology, the traits obtained for the graphs of Force (N)/Distance, Force (N)/Deformation (%) and Force (N)/Time (s) showed average values of coefficient of variation, between 20 and 30%. For other traits not dependent on the graphs, such as M.dist1, M.dist2 and p.deform, the coefficient of variation values were less than 14%, which represents good reproducibility.

3.3. Storage Time

Firmness continuously decreased during storage for all cultivars (Table 4, Figure 2). As shown in Table 4, the trend in the firmness decrease for medium and hard cultivars was gradual and comparable to each other compared to the soft cultivar. In general, results suggest that storage within the first 31 days does not affect fruit firmness considerably. In this first storage period, the soft cultivar better maintained firmness, as it only decreased by about 2% compared to the hard and medium cultivars, which decreased by 6.2 and 9.08%, respectively. However, the medium and hard cultivars better maintained firmness at the end of storage as they lost 57.37 and 57.46% of their initial firmness compared to the soft cultivar which lost up to 78.6%.

3.4. Correlations between Traits of Texture and Fruit Size

Correlation analysis performed with data collected from 300 randomly harvested fruits of soft, medium, and hard cultivars revealed that the relationship between texture and fruit size traits varies between methodologies (Table 5). The parameters measured by the double compression methodology showed stronger correlations with fruit size, mostly positive correlations. For example, texture traits related to maximum distance, area under the curve of the force/distance graph, and the slopes of the force/strain graph showed the highest positive correlations with fruit width, 09.2–0.94, 0.85, and 0.82–0.83, respectively. Furthermore, the correlations varied within the different categories of double compression traits, particularly, in those traits related to strain showed lower and even negative correlations. Puncture and shearing showed both positive and negative correlations and traits related to fruit deformation had negative correlations with fruit size. In particular, the texture traits P_DR (puncture) and S_DF (shearing) showed the strongest negative correlations with fruit width, 0.6 and 0.61 respectively. When the correlation was performed on the subsample of fruits of the same size (homogeneous sample, no significant differences, p < 0.05), the correlations decreased, but the trend previously observed with the heterogeneous sample was maintained (Table 5).

3.5. Methodology and Trait Cultivar Firmness Differentiation

The results of the Tukey’s HSD test on the heterogeneous sample showed that most of the traits from the three methodologies were able to detect significant differences between cultivars. However, some of the traits from the double compression methodology, particularly those related to cohesiveness, had a low detection capacity. Overall, the number of significant differences detected decreased when performing the correlation analysis on fruit of homogeneous size between cultivars (Table 5). Interestingly, the number of differences detected between cultivars decreased considerably for the double compression traits obtained from the stress/strain graph, which had a low correlation with fruit size characteristics. On the other hand, the puncture traits were the ones that best maintained their ability to detect differences between cultivars, while the differences detected by the shearing traits decreased.

3.6. Effect of Temperature on the Double Compression Test

Most of the traits related to firmness decreased with increasing temperature (Figure 3, Table S2). On the contrary, the traits related to the area under the curve of the second compression, deformation, cohesiveness and gumminess increased. In general, a decrease in the coefficient of variation was observed with increasing temperature for almost all texture traits, indicating that more accurate measurements were obtained at higher temperatures. The coefficient of variation decrease ranged from 7.4% to 24.89% for the MCP1 and p.strain traits, respectively. On the other hand, the coefficient of variation increased with increasing temperature for a few traits, ranging from 0.84% to 104.76% for M_dist.1 and sp2, respectively. The significant differences detected by Tukey’s HSD tests between the three cultivars were very consistent between both temperatures. Only three traits, dW1, TW1 and Rpp, detected more significant differences in the tests carried out at 7.77 °C, indicating that it is possible to capture greater variation due to cultivars with lower temperatures for those traits. Significant p-values of the Tukey test between temperatures were obtained exclusively for the traits that correspond to the measure of an object cohesiveness, which suggests that this type of texture trait is sensitive to the temperature of the fruit when it is measured. For most of the traits, a negative firmness-temperature coefficient was obtained due to the decrease in firmness with increasing temperature. In addition, coefficients with a positive sign were also obtained, especially for those traits that increased their values in the high temperature as mentioned above (Figure 3). The change in the texture traits due to temperature varied widely regardless of its sign, ranging from 0.01% to 0.95 for tRfp and sp1, respectively.

3.7. Effect of Fruit Orientation on the Double Compression Test

As expected, the texture values were different between the measurements taken on the equatorial and polar sides of the fruits (Table 6). The means of the traits were higher when measuring the fruits on their polar side and, according to the Welch’s two sample tests between orientations, there were significant differences for all the traits except those related to cohesiveness. Measurements on the polar side of the fruit showed higher coefficient of variation for almost all traits, indicating greater heterogeneity in these measurements. The change in the number of significant differences detected between cultivars varied for the different traits. In particular, the maximum force parameter (h1), currently used to measure firmness in cranberry, decreased in its ability to detect differences between cultivars when the fruits were measured on their polar side.

3.8. Optimization of the Speed/Strain Couple for the Double Compression Test

The F values obtained from the ANOVA performed to discriminate between cultivars for each trial ranged from 0.01 to 43.62, showing a wide variety of responses of the texture traits to the effect of the coupled speed/strain (Table S3). Two traits of the stress/strain graph (pr1 and sp2) and one obtained independently from the graphs (MCP1) obtained the highest values of F, while traits of the force/strain graphs (W2), force/time (tRf) and independent of the type of graphs (AMOE2) obtained the lowest F values. Significant differences between cultivars were obtained for most of the traits with the different speed/strain couples, indicating that the values of the tests were influenced by the effect of the genotypes. Cohesiveness traits were the exception, as they only had significant differences in a few trials. The F values obtained for all trials were used as the response variable analyzed in the Box-Wilson central composite design and the optimum for speed/strain couple was determined by trait (Table 7). The optimal speed/strain couple varied between different traits, but it can be seen that for the traits associated with force, the optimal speed is around 8.5 and 9.5 mm·s−1 with a strain percentage of around 5%. On the other hand, for the traits associated with deformation and the stress/strain graph, the optimal values of speed were mainly around 12 mm·s−1, while the optimal percentage of strain was high, around 20 and 30%. Table 7 also shows that, for several traits, the best response is obtained with medium to high velocity values, while low strain values predominate.

3.9. Comparison of Different Probe Diameters for Texture Measurement Using the Puncture Method

Tukey’s HSD performed between cultivar samples showed that the puncture method traits had little ability to detect differences in firmness between cultivars evaluated (Figure S2). The trials with the different probe diameters showed no obvious improvements or trends between the different traits. Almost all the texture traits only detected 2 significant differences between the three cultivars except for the apparent modulus of elasticity, which was able to detect all the possible differences with the 7 mm diameter probe. The process of compression using the 7 mm diameter probe is similar to that of the double compression test due to similar contact areas of the probes with the fruit—this indicates an improvement in the results when measuring firmness under these conditions. The coefficient of variation had a different response associated with the probe diameters between the different traits. For example, for P_DR and P_W the coefficient of variation decreased as probe diameter increased, indicating greater homogeneity of measurements with wider probe diameter. On the other hand, the coefficient of variation was lower for the thinnest and thickest probes (2 mm and 7 mm) for P_Max and P_AMOE, showing that the intermediate probe size (5 mm) produced less homogeneous results.

4. Discussion

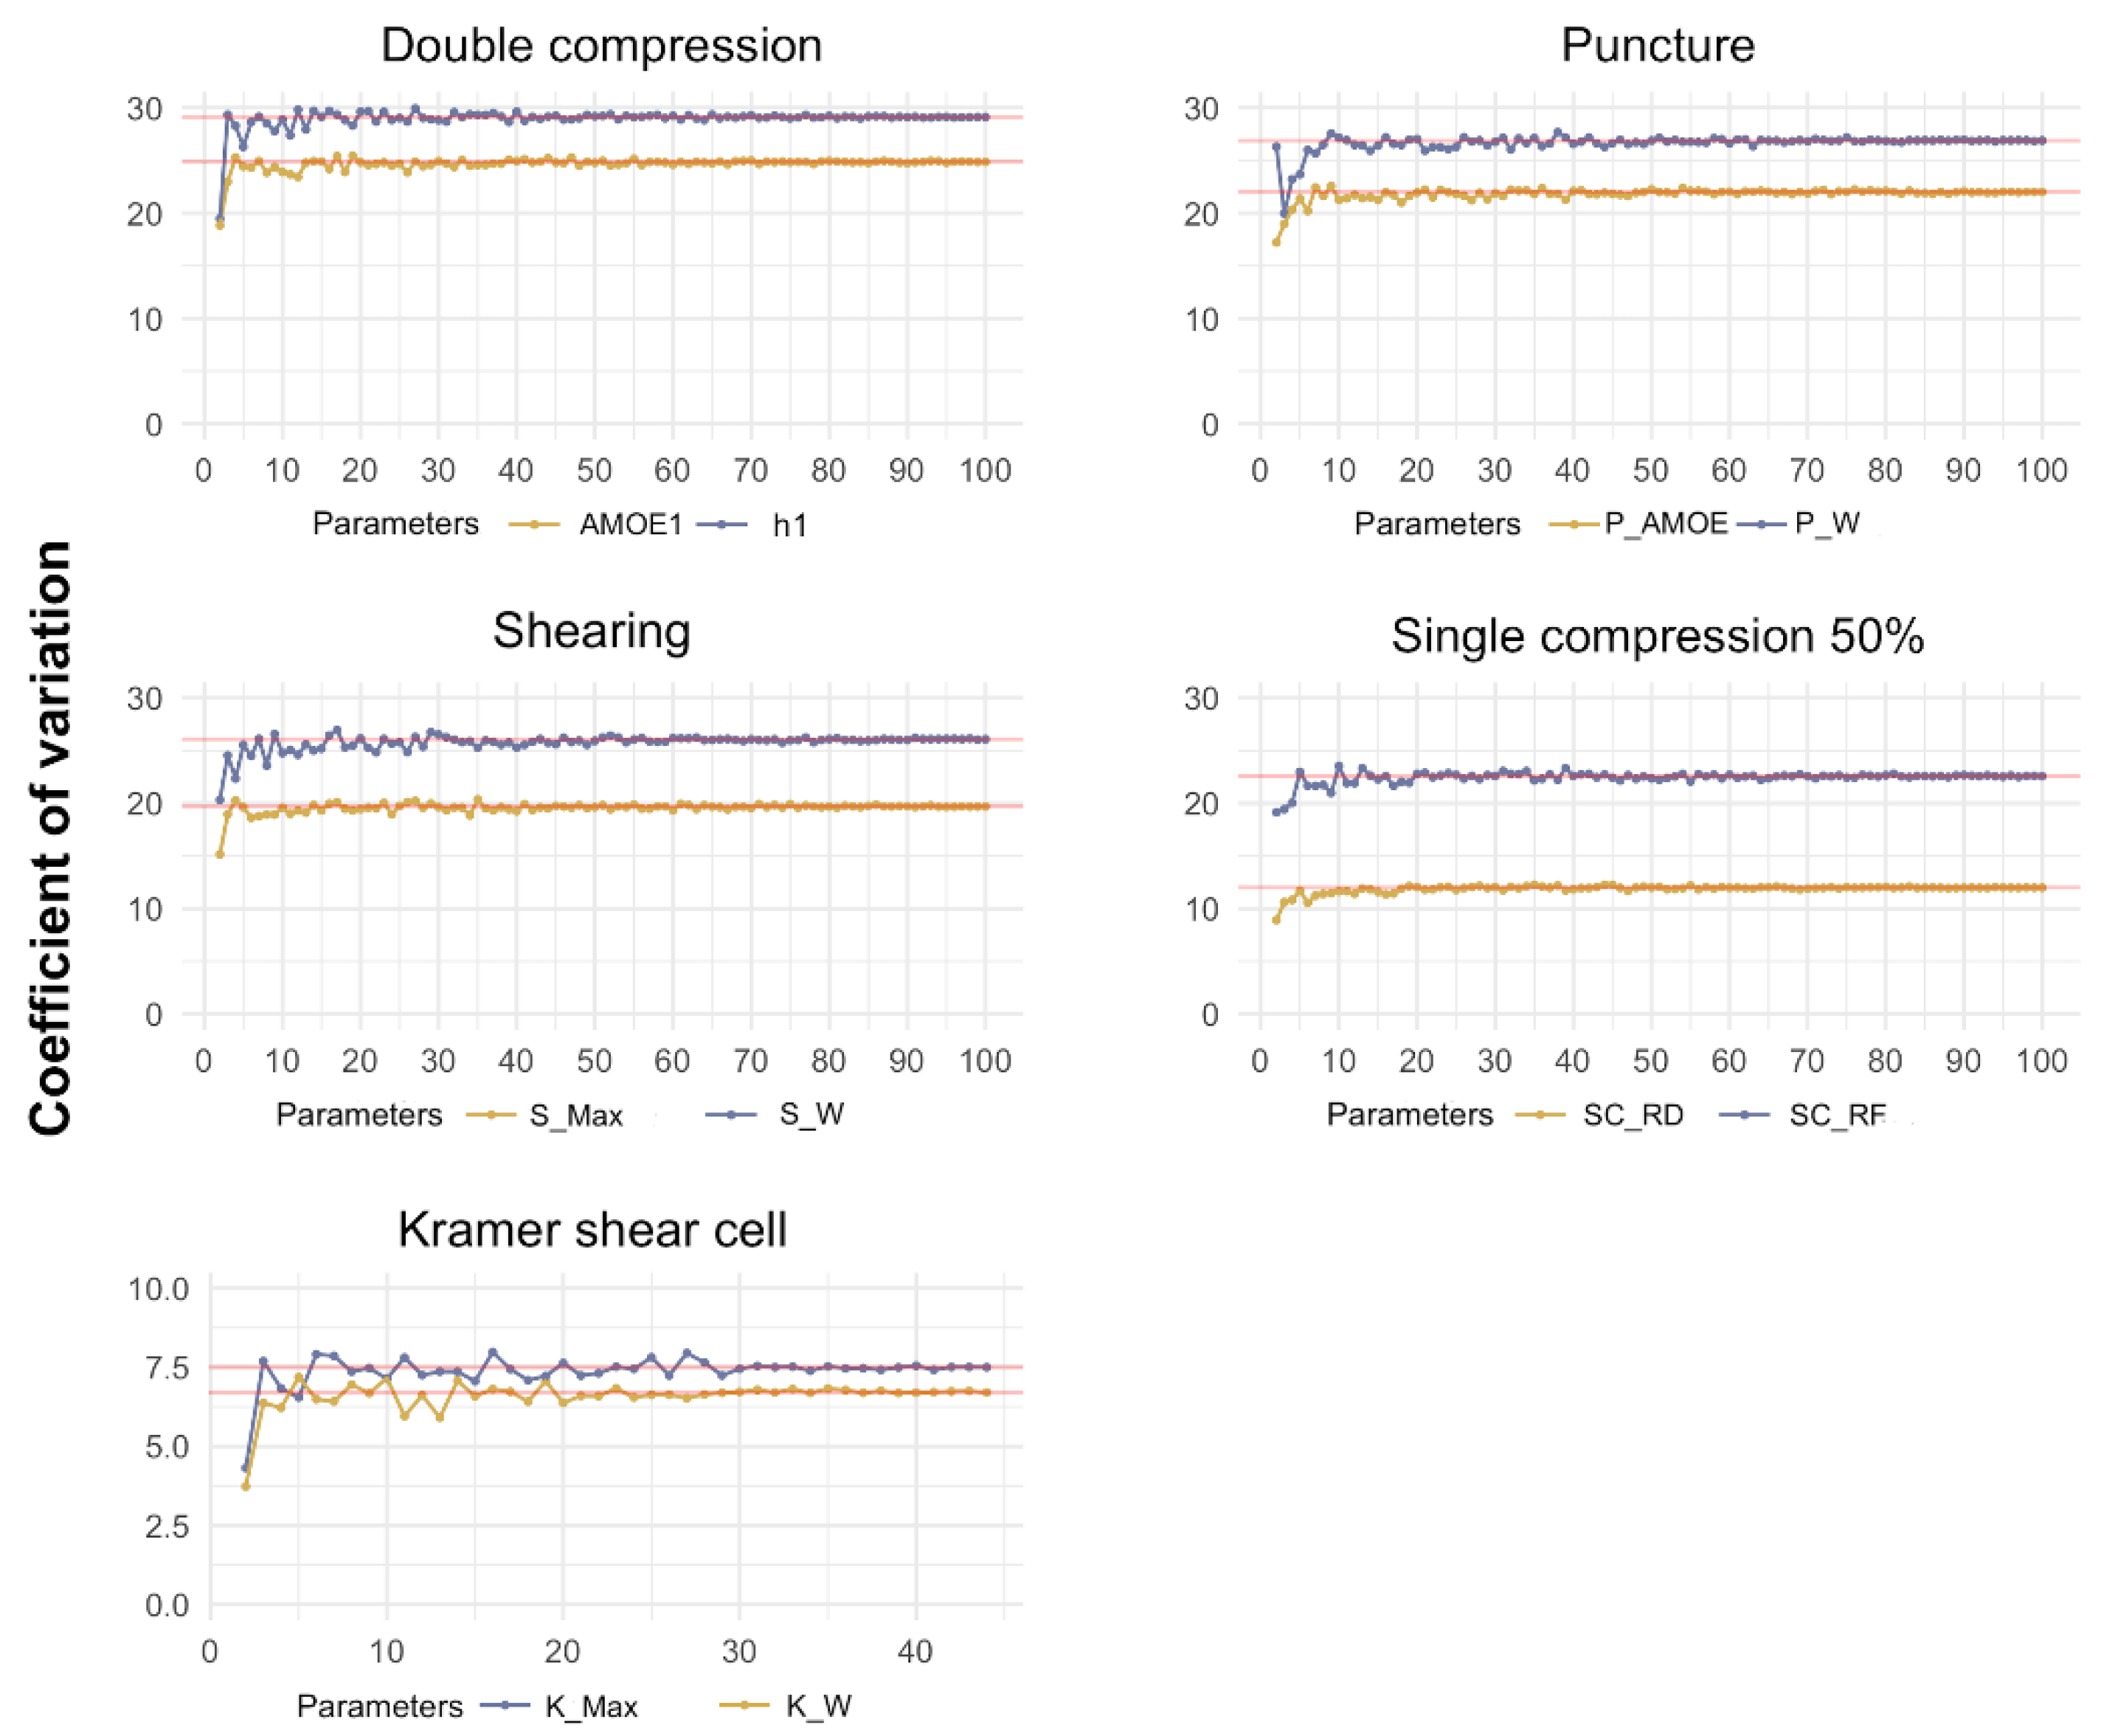
Although fruit firmness is a priority trait for the cranberry industry and breeding programs, no standard methodology has been established to assess texture in cranberry. In this study, we analyze the most relevant factors for a correct evaluation of cranberry fruit texture in methodologies previously used in this crop (compression, puncture, shearing), and those explored for the first time (Kramer shear cell). Our results suggest that a sample size of n ≥ 30 is preferred to achieve good precision of texture measurements for all methodologies considered (Figure 1). The sample size suggested in this study is higher than that previously used for raw cranberry fruits by Forney [18], Diaz-Garcia et al. [20], Zielinska et al. [21] and Liu et al. [23] (from 15 to 25 fruits) but less than sample size used by Jamaly et al. (n = 50) [19]. In addition, the suggested sample size is different from that used in the industry which can be as low as n = 5 or as high as n = 50 per batch. It should be noted that the coefficients of variation reported were calculated using a sample of soft, medium, and firm cultivars, which represent a wide range of firmness and accurately reflect the heterogeneous conditions of the samples processed in the industry. While coefficients of variation varied considerably between methodologies and texture traits, most were around 20%, which is common in native foods and ensures reliable and reproducible results for most traits [13] (Table S1). In particular, the traits of the Kramer shear cell methodology showed the lowest coefficient of variation (6.71 and 7.50) most likely because dozens of fruits were subjected to a single measurement. However, the number of fruits needed (30 loads) to achieve good repeatability makes it an unfeasible method. Therefore, the Kramer shear cell test was discarded for the following analyses.
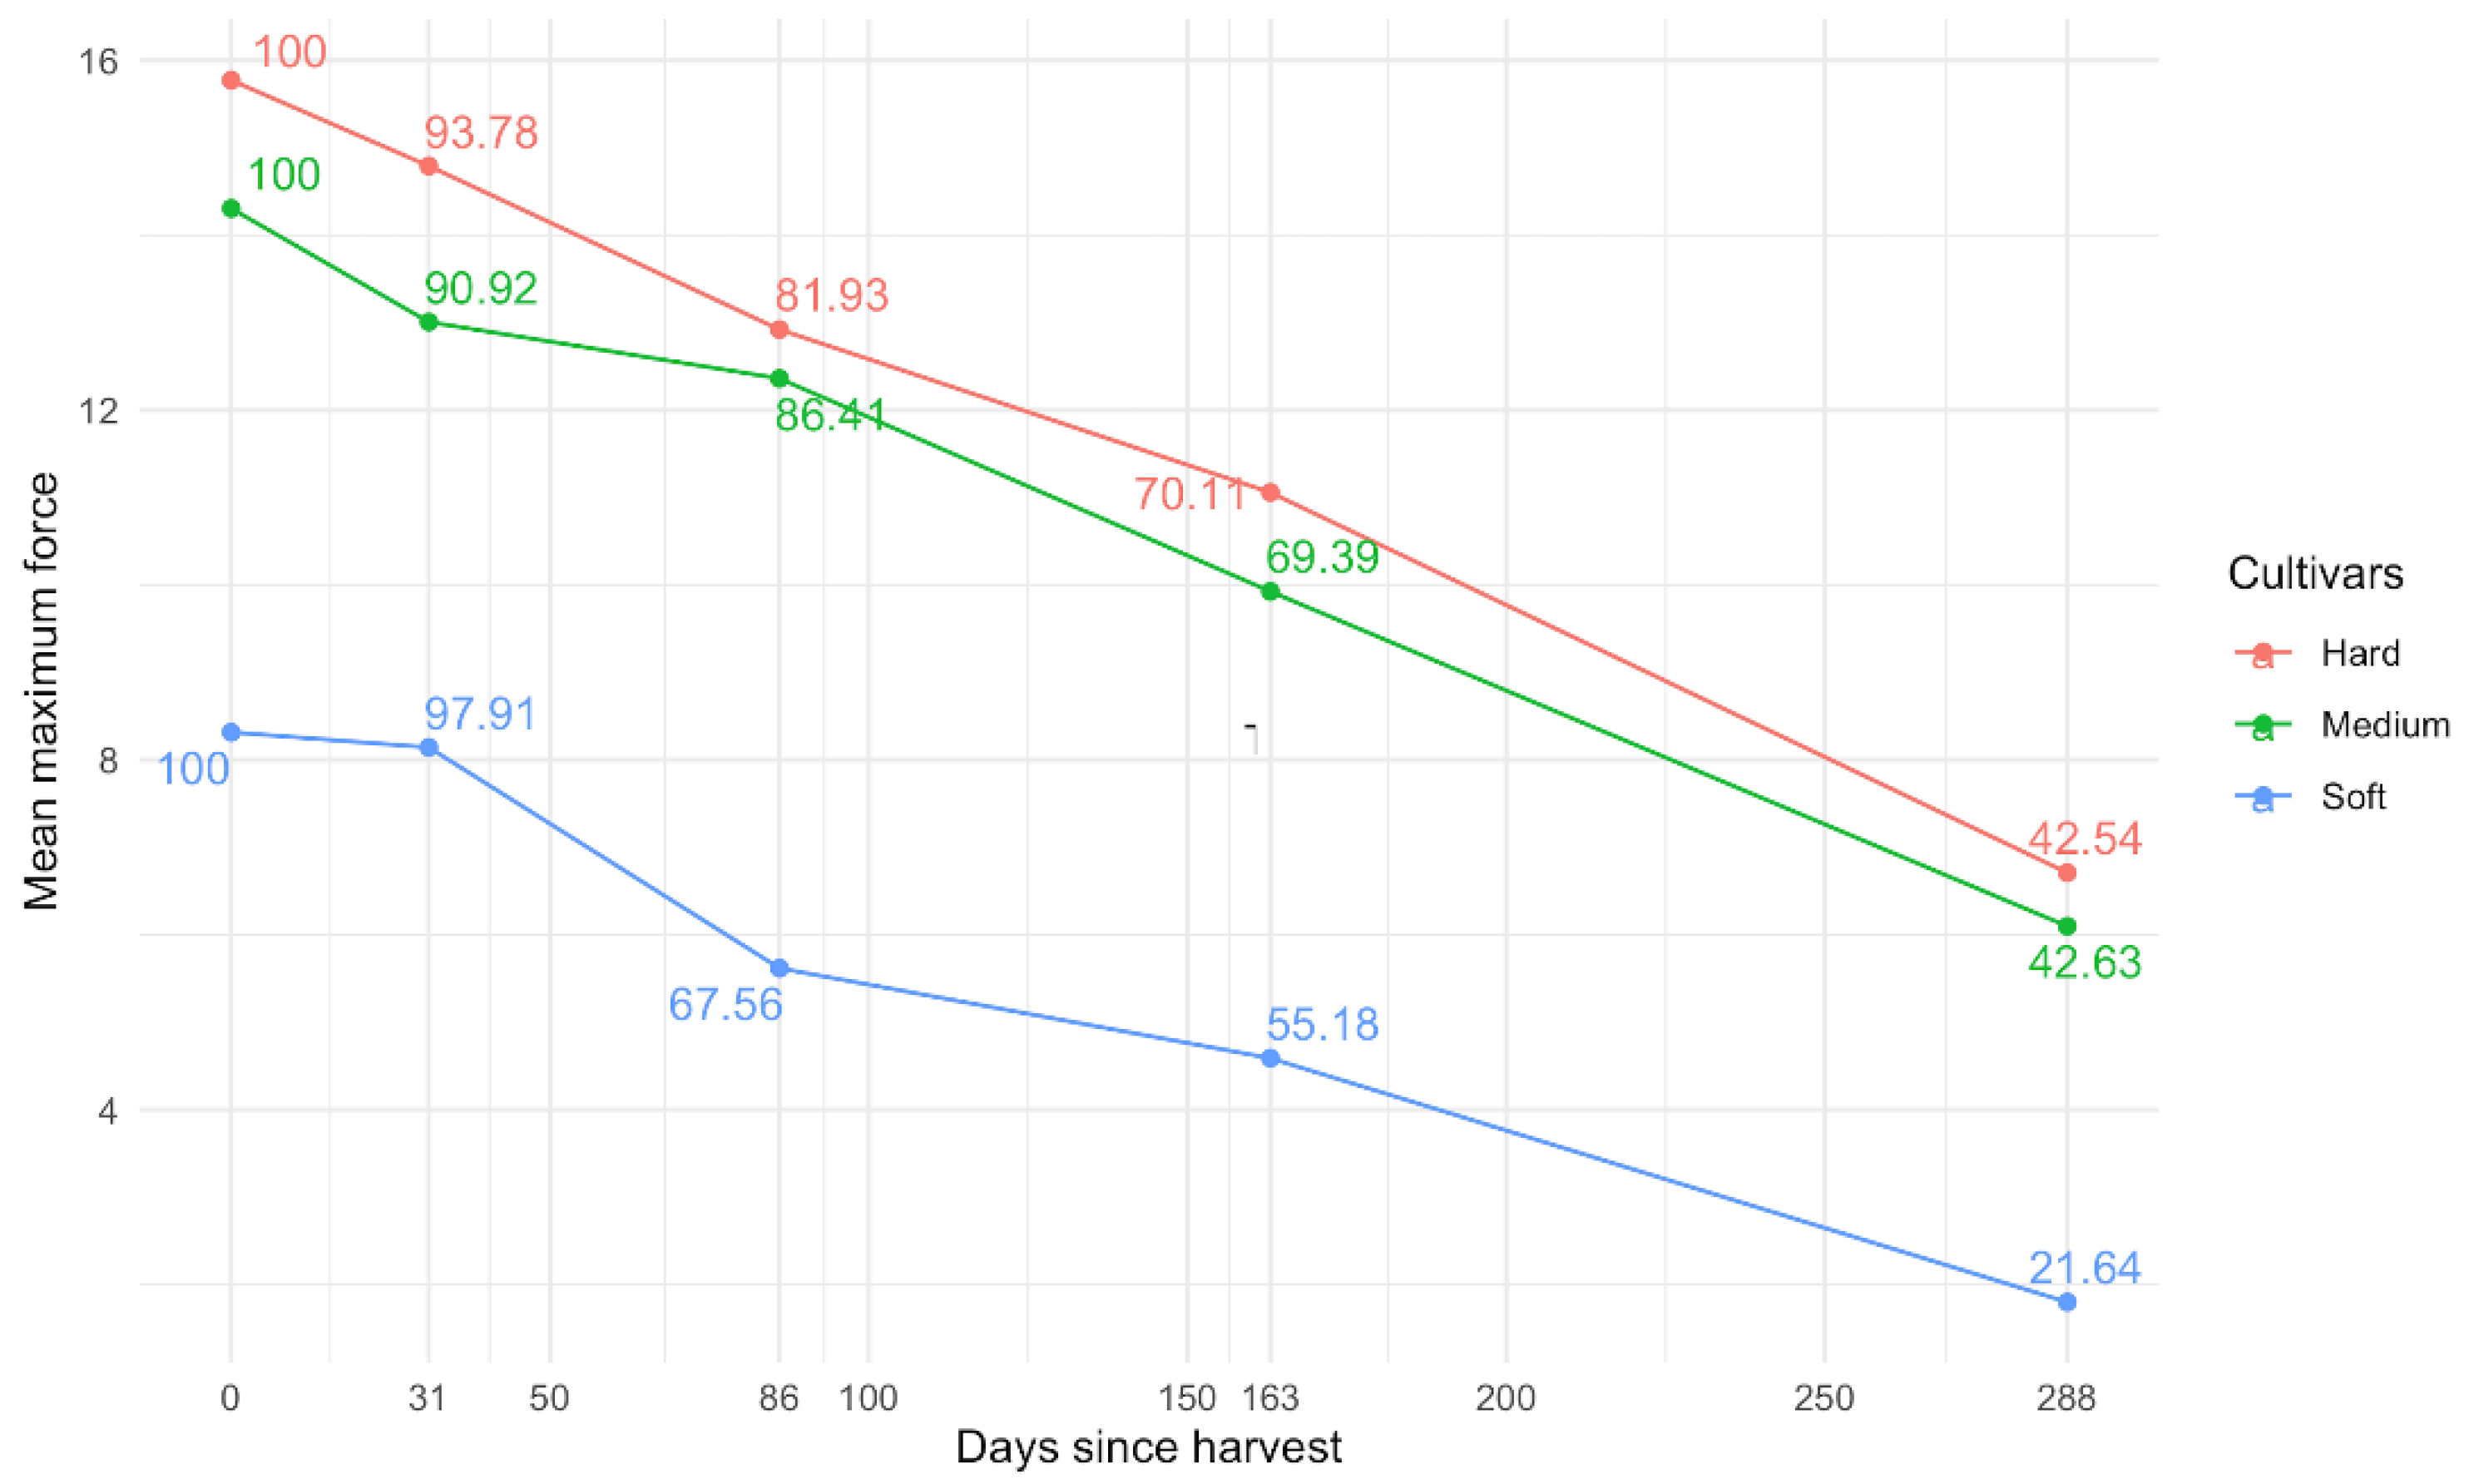
The change in firmness during storage has important implications for industry as well as for research, especially in the breeding process where scalability is key. As shown in Figure 2, the first month offers a good time frame to measure fruit firmness, as firmness decline remains relatively low. These results are consistent with previous reports [18,21], although other studies based on parameters related to elasticity and deformation showed more dramatic changes [24]. In order to process a large number of samples, we suggest recording the measurement dates and process the samples based on an experimental design in order to take into account the storage time and loss of firmness through modeling. Remarkably, our results show that the trend of firmness during storage depends considerably on the cultivar as has been shown for other attributes of fruit quality and marketability, which has implications for management during storage and decision making for fruit evaluation [36].
Berry size can differently affect the calculation of texture traits such that some traits are more prone to biased values. This relationship between size and fruit texture was evaluated with three cultivars that vary in both firmness and size (Table 5). The texture traits of the compression-based methodology showed stronger positive correlations, especially those related to force. The correlations of the maximum force traits (h1 and h2), which are widely used in cranberry, indicated that the larger the fruit, the firmer it is, as reported by Diaz-Garcia et al. [20] and contrasting with the findings for similar fruits such as blueberry [37]. On the other hand, the traits related to elasticity, cohesiveness and stress generally showed lower correlations. In particular, the persistently low correlations between the traits related to cohesiveness and fruit size may indicate that resistance to internal structure damage is largely independent of berry size. The correlations for the puncture and shearing methodologies were varied, and remarkably, the traits involving fruit destruction were negatively correlated with fruit size. To exhaustively evaluate the correlations between texture and fruit size, we subsampled fruits with homogeneous size (no significant difference, p < 0.05) from each cultivar’s original heterogeneous sample. Although the correlations between size and fruit texture decreased, the previously observed trends were maintained, indicating that these traits depend substantially on the size of the berry.
To evaluate the effect of berry size on the ability of textural traits to discriminate between cultivars, a comparison of the significant differences detected between the homogeneous and heterogeneous samples was made (Table 5). In general, the number of significant differences detected decreased when using the homogeneous fruit subsample between cultivars, although some traits with high correlations such as maximum force and those related to slope maintained their performance. Interestingly, some traits that are calculated considering the size of the fruit (e.g., apparent modulus of elasticity, maximum contact pressure, and traits associated with stress), and have a low correlation, showed that their ability to detect differences between cultivars depended on the berry size. Similar results were obtained for the texture traits derived from the stress/strain graph in a study carried out on grapes [14], in which it was shown that there was no improvement in the results expressed in stress compared to those expressed in force. The puncture showed good performance to discriminate between cultivars, suggesting that the integration of skin in the evaluation of texture is crucial to obtain more representative measurements, as has been shown in other species [28,38]. Therefore, the puncture method is a potential candidate for a standard texture methodology for cranberry. Conversely, the shearing method is not a good candidate since it is not a good cultivar discriminator. These findings show that, even though some traits such as those related to slopes and the maximum force for double compression, show strong correlations, they are able to obtain reliable results. The high correlation shown by texture traits with good performance in detecting differences between cultivars may indicate that there is a genuine correlation between berry size and these texture attributes. It is important to mention that the value of the correlations can be inflated because the cultivars used for this analysis showed a firmness gradient associated with a size gradient in the same direction. Further analysis with cultivars representing greater variation in firmness and size will be required.
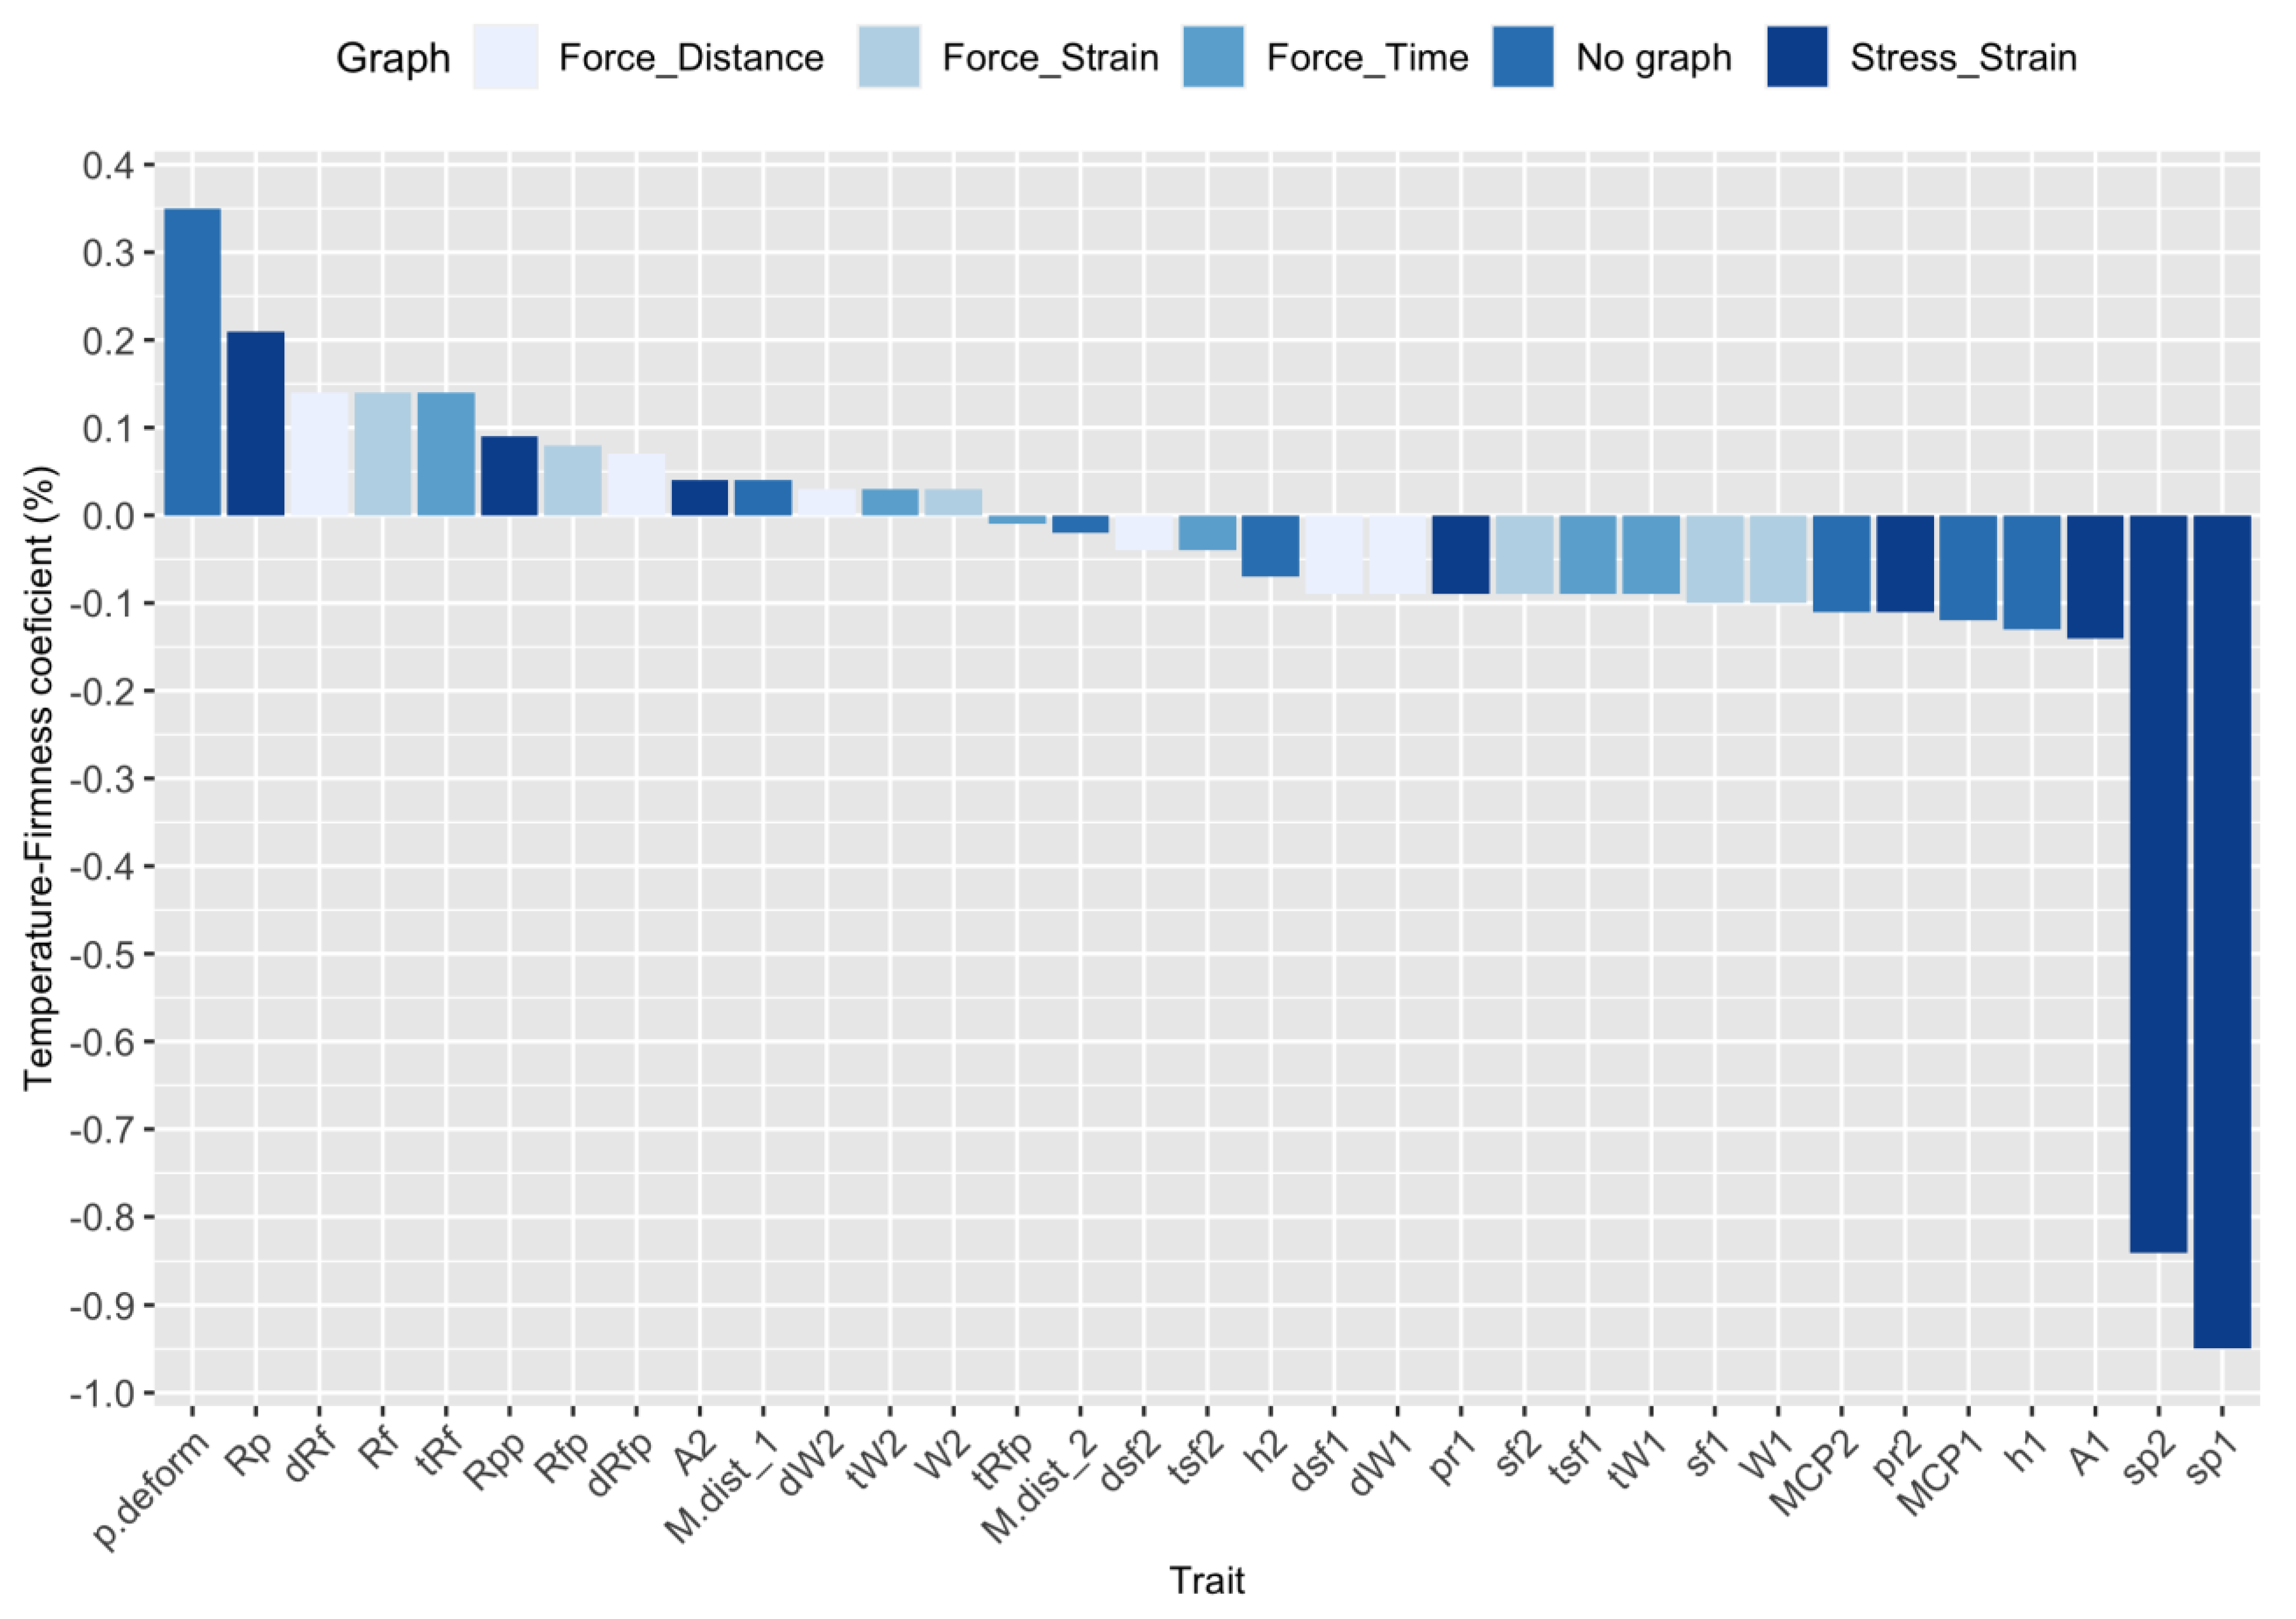
Although the compression method has been widely used in cranberry, the appropriate conditions and parameters for its implementation have not been reported. Some of the most influential factors in the execution of this method were evaluated, such as the fruit temperature and orientation, and the optimal speed/strain combinations. Similar to other raw fruits [17], cranberry texture parameters decreased as fruit temperature increased and, interestingly, the temperature-firmness coefficient varied widely among parameters ranging from 0.01 to 0.95% for tRfp and sp1, respectively (Figure 3, Table S2). These results demonstrate that, depending on the texture trait of interest, temperature control at the time of measurement can be a crucial point to obtain reproducible data. As shown in Figure 3, measurements related to deformation, cohesiveness, and gumminess increased at higher temperatures, in contrast to the rest of the traits. It is worth mentioning that, due to the nature of the physical characteristics evaluated, the traits related to deformation should be considered as a measure of softness rather than firmness. Although the number of significant differences detected between cultivars for each temperature were very similar, the slight increase in low temperature may be due to a better control of the change in firmness when keeping the fruits in refrigeration (Table S2).
Because cranberry fruits are traditionally measured on their equatorial side, the firmness values taken on the polar side are unknown and could potentially provide additional information due to the unique internal structure of the fruits (Figure S1). The results showed that higher values are obtained for all the texture traits when measuring the fruits on the polar side as has been reported in other fruit species with marked differences such as apple [39] and grapefruit [40] (Table 6). In addition, the measurements taken on the polar side showed higher coefficients of variation, which could be due in large part to the instability of the fruits at the time of measurement, which makes it an unfeasible procedure. Welch’s two sample t-test showed significant differences for all the traits (except those related to cohesiveness) between both orientations, which suggests that the resistance of the internal structure is similar when the fruit is compressed in both orientations. The change in the number of significant differences detected between cultivars varied for the traits. In particular, the maximum force trait (h1) had a decreased ability to detect differences between cultivars when the fruits were measured on their polar side.
Because current cranberry breeding efforts are focused on fruit firmness, it is desirable that phenotyping methodologies can distinguish firmness gradients between cultivars. The Box-Wilson central composite design revealed that speed/strain couples have an important effect on the ability to discriminate between cultivars according to their texture for each trait (Table 7, Table S3). The response of the traits to the speed/strain couples was varied; most force traits perform best with a strain percentage of 5%, while 20% or more strain is better for stress traits. This difference in optimal strain values implies that favoring the conditions for one trait limits the performance of the other, and that this information should therefore be considered, depending on the texture traits that are desired. A similar test carried out on grapes [14] showed a different relationship between the strain requirements for the force and stress traits, with the force traits being the ones with the highest requirement. Despite the similarities of the cranberry and grape fruits the optimal values of speed and strain for the textural traits were very different, probably due to differences in internal structure and composition of the fruit (e.g., content of water).
A first exploration of the puncture method in cranberry showed that the diameter of the probe did not have an important effect on the performance of this method (Figure S2). It is worth mentioning that the puncture method showed better results to detect differences between cultivars in the fruit texture-size correlation analysis and that this discrepancy may be due to the use of different cultivars in these tests. It will be necessary to carry out additional tests that include a greater variety of probe diameters as well as consider important factors of the test such as the speed of execution.

5. Conclusions

This study provides the first relevant information on key methodologies, traits, parameters, and conditions for fruit textural measurements in cranberry, for both research and industry. The information provided in this study will help optimize current cranberry texture measurement protocols and design new strategies for this purpose. This groundwork exploration allowed us to identify textural traits of the double compression method, such as the maximum force and those related to slopes (which are indicators of the degree of elasticity), as potential candidates to be used as varietal markers due to their consistency in differentiating among the cultivars evaluated. Furthermore, the textural traits of the puncture method represent another valuable option for cranberry texture evaluation focused on cultivar differentiation. Both methods, compression and puncture, methods are complementary in evaluating the texture of cranberry fruits since this attribute is mainly defined by the flesh, internal structure, and skin of the fruit. Additional efforts will be necessary to define a consensus methodology for firmness measurement in cranberry based on considerations reported in this research.

Supplementary Materials

The following supporting information can be downloaded at: https://www.mdpi.com/article/10.3390/horticulturae9040479/s1.

Author Contributions

Conceptualization, J.Z., M.I. and L.D.-G.; Methodology, H.L.-M., M.P. and L.D.-G.; Software, H.L.-M. and M.A.T.-M.; Validation, H.L.-M., I.B., M.A.T.-M., F.d.L.T. and J.L.; Formal Analysis, H.L.-M. and M.P.; Investigation, H.L.-M., M.P. and M.A.T.-M.; Resources, J.Z., J.M. and S.I.; Data Curation, H.L.-M.; Writing—Original Draft Preparation, H.L.-M.; Writing—Review & Editing, H.L.-M., L.D.-G., F.d.L.T., I.B., J.L., S.I., L.G., M.I. and J.Z.; Visualization, H.L.-M. and M.A.T.-M.; Supervision, J.Z.; Project Administration, J.Z., M.I., A.A., J.M. and S.I.; Funding Acquisition, J.Z., M.I., A.A. and L.G. All authors have read and agreed to the published version of the manuscript.

Funding

This project was supported by USDA-ARS (project no. 5090-21220-004-00-D provided to J.Z.); USDA NIFA (project no. 2019-51181-30015; VacciniumCAP); Ocean Spray Cranberries, Inc.; Wisconsin Cranberry Growers Association; and Cranberry Institute.

Data Availability Statement

Not applicable.

Acknowledgments

The authors also thank the anonymous reviewers who helped enhance the quality of this paper. J.Z. would like to express his gratitude through Ps 136:1.

Conflicts of Interest

The authors declare no conflict of interest.

References

  1. Vorsa, N.; Polashock, J.; Cunningham, D.; Roderick, R.; Howell, A. Evaluation of Fruit Chemistry in Cranberry Germplasm: Potential for Breeding Varieties with Enhanced Health Constituents. Acta Hortic. 2000, 574, 215–219. [Google Scholar] [CrossRef]
  2. Neto, C.C. Cranberry and Its Phytochemicals: A Review of In Vitro Anticancer Studies. J. Nutr. 2007, 137, 186–193. [Google Scholar] [CrossRef] [PubMed] [Green Version]
  3. Khalil, R.R.; Mohammed, E.T.; Mustafa, Y.F. Various promising biological effects of cranberry extract: A review. Clin. Schizophr. 2021, 15, 1–9. [Google Scholar] [CrossRef]
  4. Faheem, S.A.; Saeed, N.M.; El-Naga, R.N.; Ayoub, I.M.; Azab, S.S. Hepatoprotective effect of cranberry nutraceutical extract in non-alcoholic fatty liver model in rats: Impact on insulin resistance and Nrf-2 expression. Front. Pharmacol. 2020, 11, 218. [Google Scholar] [CrossRef] [Green Version]
  5. Vattem, D.A.; Ghaedian, R.; Shetty, K. Enhancing health benefits of berries through phenolic antioxidant enrichment: Focus on cranberry. Asia Pac. J. Clin. Nutr. 2005, 14, 120–130. [Google Scholar] [PubMed]
  6. Camesano, T.A.; Liu, Y.; Pinzon-Arango, P.A. Cranberry prevents the adhesion of bacteria: Overview of relevant health benefits. Agro. Food Ind. Hi Tech 2007, 18, 24–27. [Google Scholar]
  7. Howell, A.B. Update on health benefits of cranberry and blueberry. In ISHS Acta Horticulturae: IX International Vaccinium Symposium, Corvallis, OR, USA, 13 July 2008; Hummer, K.E., Ed.; International Society for Horticultural Science: Leuven, Belgium, 2009; Volume 810, pp. 779–785. [Google Scholar] [CrossRef]
  8. Zhao, S.; Liu, H.; Gu, L. American cranberries and health benefits—An evolving story of 25 years. J. Sci. Food Agric. 2020, 100, 5111–5116. [Google Scholar] [CrossRef]
  9. Kramer, J.; Simnitt, S.; Calvin, L. Fruit and Tree Nuts Outlook; U.S. Department of Agriculture, Economic Research Service: Washington, DC, USA, 2020; pp. 1–45. [Google Scholar]
  10. Vorsa, N.; Zalapa, J. Domestication, Genetics, and Genomics of the American Cranberry. Plant Breed. Rev. 2019, 43, 279–315. [Google Scholar] [CrossRef]
  11. Gallardo, R.K.; Klingthong, P.; Zhang, Q.; Polashock, J.; Atucha, A.; Zalapa, J.; Rodriguez-Saona, C.; Vorsa, N.; Iorizzo, M. Breeding Trait Priorities of the Cranberry Industry in the United States and Canada. HortScience 2018, 53, 1467–1474. [Google Scholar] [CrossRef] [Green Version]
  12. Kovacev, K.; Hughes, B.; Smith, J.S. Polyphenol stability and physical characteristics of sweetened dried cranberries. Foods 2020, 9, 551. [Google Scholar] [CrossRef]
  13. Bourne, M. Food Texture and Viscosity: Concept and Measurement, 2nd ed.; Academic Press: Cambridge, MA, USA, 2002; pp. 1–32. ISBN 9780080491332. [Google Scholar]
  14. Maury, C.; Madieta, E.; Le Moigne, M.; Mehinagic, E.; Siret, R.; Jourjon, F. Development of a mechanical texture test to evaluate the ripening process of Cabernet Franc grapes. J. Texture Stud. 2009, 40, 511–535. [Google Scholar] [CrossRef]
  15. Jackman, R.L.; Marangoni, A.G.; Stanley, D.W. Measurement of tomato fruit firmness. HortScience 1990, 25, 781–783. [Google Scholar] [CrossRef] [Green Version]
  16. Døving, A.; Måge, F. Methods of testing strawberry fruit firmness. Acta Agric. Scand. B Soil 2002, 52, 43–51. [Google Scholar] [CrossRef]
  17. Bourne, M.C. Effect of temperature on firmness of raw fruits and vegetables. J. Food Sci. 1982, 47, 440–444. [Google Scholar] [CrossRef]
  18. Forney, C.F. Optimizing the storage temperature and humidity for fresh cranberries: A reassessment of chilling sensitivity. HortScience 2008, 43, 439–446. [Google Scholar] [CrossRef]
  19. Jamaly, R.; Parent, S.É.; Parent, L.E. Fertilization and soil nutrients impact differentially cranberry yield and quality in eastern Canada. Horticulturae 2021, 7, 191. [Google Scholar] [CrossRef]
  20. Diaz-Garcia, L.; Rodriguez-Bonilla, L.; Phillips, M.; Lopez-Hernandez, A.; Grygleski, E.; Atucha, A.; Zalapa, J. Comprehensive Analysis of the Internal Structure and Firmness in American Cranberry (Vaccinium Macrocarpon Ait.) fruit. PLoS ONE 2019, 14, e0222451. [Google Scholar] [CrossRef] [Green Version]
  21. Zielinska, M.; Markowski, M.; Zielinska, D. The Effect of Freezing on the Hot Air and Microwave Vacuum Drying Kinetics and Texture of Whole Cranberries. Dry Technol. 2019, 37, 1714–1730. [Google Scholar] [CrossRef]
  22. Shamaei, S.; Emam-Djomeh, Z.A.H.R.A.; Moini, S. Ultrasound-assisted osmotic dehydration of cranberries: Effect of finish drying methods and ultrasonic frequency on textural properties. J. Texture Stud. 2012, 43, 133–141. [Google Scholar] [CrossRef]
  23. Liu, Z.L.; Staniszewska, I.; Zielinska, D.; Zhou, Y.H.; Nowak, K.W.; Xiao, H.W.; Pan, Z.; Zielinska, M. Combined hot air and microwave-vacuum drying of cranberries: Effects of pretreatments and pulsed vacuum osmotic dehydration on drying kinetics and physicochemical properties. Food Bioproc. Tech. 2020, 13, 1848–1856. [Google Scholar] [CrossRef]
  24. Gorzelany, J.; Belcar, J.; Kuźniar, P.; Niedbała, G.; Pentoś, K. Modelling of Mechanical Properties of Fresh and Stored Fruit of Large Cranberry Using Multiple Linear Regression and Machine Learning. Agriculture 2022, 12, 200. [Google Scholar] [CrossRef]
  25. Li, C.; Luo, J.; MacLean, D. A novel instrument to delineate varietal and harvest effects on blueberry fruit texture during storage. J. Sci. Food Agric. 2011, 91, 1653–1658. [Google Scholar] [CrossRef] [PubMed]
  26. Rajwana, I.A.; Khan, I.A.; Malik, A.U.; Saleem, B.A.; Khan, A.S.; Ziaf, K.; Anwar, R.; Amin, M. Morphological and biochemical markers for varietal characterization and quality assessment of potential indigenous mango (Mangifera indica) germplasm. Int. J. Agric. Biol. 2011, 13, 151–158. [Google Scholar]
  27. Tóth, A.M.; Zsófi, Z.; Veres, S. Cane Girdling Influence on the Berry Texture Properties of Three Table Grape Varieties. Horticulturae 2022, 8, 1101. [Google Scholar] [CrossRef]
  28. Giongo, L.; Ajelli, M.; Pottorff, M.; Perkins-Veazie, P.; Iorizzo, M. Comparative Multi-Parameters Approach to Dissect Texture Subcomponents of Highbush Blueberry Cultivars at Harvest and Postharvest. Postharvest Biol. Technol. 2022, 183, 111696. [Google Scholar] [CrossRef]
  29. Diaz-Garcia, L.; Covarrubias-Pazaran, G.; Schlautman, B.; Zalapa, J. GiNA, an Efficient and High-Throughput Software for Horticultural Phenotyping. PLoS ONE 2016, 11, e0160439. [Google Scholar] [CrossRef] [PubMed] [Green Version]
  30. Grotte, M.; Duprat, F.; Loonis, D.; Piétri, E. Mechanical properties of the skin and the flesh of apples. Int. J. Food Prop. 2001, 4, 149–161. [Google Scholar] [CrossRef]
  31. Friedman, H.H.; Whitney, J.E.; Szczesniak, A.S. The texturometer—a new instrument for objective texture measurement. J. Food Sci. 1963, 28, 390–396. [Google Scholar] [CrossRef]
  32. Breene, W.M. Application of texture profile analysis to instrumental food texture evaluation. J. Texture Stud. 1975, 6, 53–82. [Google Scholar] [CrossRef]
  33. Johnson, K.L. Contact Mechanics, 1st ed.; Cambridge University Press: Cambridge, UK, 1987; ISBN 978-0-521-34796-9. [Google Scholar]
  34. Bareš, J.; Lejčkova, K.; Patočka, K.; Blahovec, J. Role of Skin in Compression of Berry-like Fruits between Two Plates. Int. Agrophys 1994, 8, 381–387. [Google Scholar]
  35. ASABE. Compression Test of Food Materials of Convex Shape. ASAE S368.4 2000. Available online: https://elibrary.asabe.org/standards.asp (accessed on 17 December 2022).
  36. Wang, S.Y.; Stretch, A.W. Antioxidant capacity in cranberry is influenced by cultivar and storage temperature. J. Agric. Food Chem. 2011, 49, 969–974. [Google Scholar] [CrossRef] [PubMed]
  37. Chiabrando, V.; Giacalone, G.; Rolle, L. Mechanical behaviour and quality traits of highbush blueberry during postharvest storage. J. Sci. Food Agric. 2009, 89, 989–992. [Google Scholar] [CrossRef]
  38. Río-Segade, S.; Orriols, I.; Giacosa, S.; Rolle, L. Instrumental texture analysis parameters as winegrapes varietal markers and ripeness predictors. Int. J. Food Prop. 2011, 14, 1318–1329. [Google Scholar] [CrossRef]
  39. Guiné, R.P.F.; Andrade, S.; Correia, A.C.; Jordão, A.M.; Lopes, A.D.; Ferreira, D. Evaluation of textural properties in apples of regional varieties. Int. J. Food Prop. 2011, 14, 331–338. [Google Scholar] [CrossRef]
  40. Ashtiani, S.H.M.; Sadrnia, H.; Mohammadinezhad, H.; Aghkhani, M.H.; Khojastehpour, M.; Abbaspour-Fard, M.H. FEM-based simulation of the mechanical behavior of grapefruit under compressive loading. Sci. Hortic. 2019, 245, 39–46. [Google Scholar] [CrossRef]
Figure 1. Determination of the optimal sample size by plotting the coefficient of variation versus the sample size for the double compression, puncture, shearing, single compression and Kramer shear cell methods used in cranberry (Vaccinium macrocarpon Ait.) fruits. Only two traits are shown for each methodology. For double compression, puncture, shearing and single compression three hundred fruits were used to perform this graph and a zoom on the 100 first samples is presented here. For Kramer shear cell a total of 45 samples (loads) were used. For all methodologies, the samples were equally composed of fruits of the BG (soft), Sundance (intermediate) and M34 (hard) cultivars. AMOE1: Apparent modulus of elasticity 1; h1: 1st Maximum Force; P_AMOE: Apparent modulus of elasticity; P_W: Work; S_Max: Maximum force; S_W: Work; SC_RD: Rupture distance; SC_RF: Rupture force; K_Max: Max force; K_W: Work.
Horticulturae 09 00479 g001
Figure 2. Percentages of cranberry (Vaccinium macrocarpon Ait.) fruit firmness decreases for three cranberry cultivars with different levels of firmness stored at 4 °C on four different dates. The intercept of the linear models in Table 4 was considered as 100% firmness. A total of 100 fruits were measured on each of the four dates for each cultivar. Fruits of the Yellow bell, Sundance and Granite Red cultivars were considered as soft, intermediate and hard respectively. The values of maximum force correspond to the maximum force of the first peak of the double compression method (h1).
Horticulturae 09 00479 g002
Figure 3. Firmness-temperature coefficient calculated for texture parameters of the double compression method measured in fruit samples of three cranberry (Vaccinium macrocarpon Ait.) cultivars that vary in firmness at 7.77 and 21.66 °C. Features are colored according to the graph from which they were obtained. Yellow bell, Sundance and M34 cultivars were considered soft, intermediate and hard.
Horticulturae 09 00479 g003
Table 1. Description of the tests carried out on cranberry (Vaccinium macrocarpon Ait.) fruits to analyze the parameters and conditions that typically affect the measurement of texture in fruits.
TestFruits per Experimental UnitCultivars UsedMethodObservation
Sample size determination100, 15 gr for Kramer shear cellBG, Sundance, M34DC a, SC b, puncture, shearing and Kramer shear cell
Storage time effect100Yellow bell, Sundance, Granite redDC (only maximum force)Firmness measured at 31, 86, 163 and 288 dah c
Influence of fruit size on texture parameters100Yellow bell, Sundance, M34DC, puncture and shearingFruit size and texture measurements were tracked individually
Fruit temperature effect50Yellow bell, Sundance, M34DCMeasured at 7.77 and 21.66 °C
Fruit orientation effect50Yellow bell, Sundance, Granite redDCMeasured in its equatorial and polar diameter
Speed/strain couple optimization50BG, Stevens, A9DC13 speed/strain couples were evaluated
Probe diameter effect50Yellow bell, Sundance, Pilgrim KingPunctureProbe diameters 2 mm, 5 mm, and 7 mm were evaluated
a DC—Double compression. b SC—Single compression. c dah—Days after harvest. Soft fruit cultivars: Yellow Bell, BG; Intermediate fruit cultivars: Sundance, Stevens; Hard fruit cultivars: M34, Granite red, A9, Pilgrim King.
Table 2. Speed/strain couples evaluated to optimize the measurement of the double compression method in cranberry fruits (Vaccinium macrocarpon Ait.).
Test Speed (mm·s−1)Strain (%)
122.5
3.0510
3.0535
85
840
12.9510
12.9535
1522.5
822.5
822.5
822.5
822.5
822.5
Table 3. Texture traits generated in cranberry (Vaccinium macrocarpon Ait.) by the single compression, double compression, puncture, shearing and Kramer shear cell methods to evaluate texture in cranberry fruits.
Texture TraitAcronymUnitDescription
Puncture
Apparent modulus of elasticity P_AMOEPaThe slope of the force/distance curve divided by the surface area of the probe’s end
Maximum ForceP_MaxNThe highest force recorded during the test
Deformation at ruptureP_DRmmThe distance the probe travels between the first contact and the highest force
Work P_WmJThe area under the force/distance curve up until rupture
Shearing
Maximum ForceS_MaxNThe highest force recorded during the test
Deformation at fracture S_DFmmThe distance the probe travels between the first contact and the highest force
WorkS_WmJThe area under the the force/distance curve
Kramer shear cell
Max forceK_MaxNThe highest force measured during the test
WorkK_WmJthe area under the entire force/distance graph
Single compression
Rupture forceSC_RFNThe force needed to rupture the berry
Rupture distance SC_RDmmThe distance the fruit was compressed before rupture
Double compression
1st Maximum Forceh1NThe highest force recorded during the first compression
2nd Maximum Forceh2NThe highest force recorded during the second compression
1st Force/Distance Slopedsf1N/mmThe slope of the force/distance curve for the first compression
2nd Force/Distance Slopedsf2N/mmThe slope of the force/distance curve for the second compression
1st Force/Distance AreadW1MjThe area under the force/distance curve for the first compression
2nd Force/Distance AreadW2MjThe area under the force/distance curve for the second compression
Force/Distance CohesivenessdRf-dW2/dW1
Force/Distance GumminessdRfpNdRf × h1
1st Maximum distance M.dist_1MmThe maximum distance reached during the first compression
2nd Maximum distance M.dist_2mmThe maximum distance reached during the second compression
1st Force/Strain Slope (Modulus of Elasticity)Sf1NThe slope of the force/strain curve for the first compression
2nd Force/Stain Slope (Modulus of Elasticity)Sf2NThe slope of the force/strain curve for the second compression
1st Force/Strain AreaW1NThe area under the force/strain curve for the first compression
2nd Force/Strain AreaW2NThe area under the force/strain curve for the second compression
Force/Strain CohesivenessRf-W2/W1
Force/Strain GumminessRfpNRf × h1
Percent Deformedp.deform-The percent of the berry’s height that it has not regained after the first compression
1st Maximum Stresspr1paThe highest stress recorded during the first compression
2nd Maximum Stresspr2paThe highest stress recorded during the second compression
1st Stress/Strain Slope (Young’s modulus of elasticity)sp1paThe slope of the stress/strain curve for the first compression
2nd Stress/Strain Slopesp2paThe slope of the stress/strain curve for the second compression
1st Stress/Strain AreaA1paThe area under the stress/strain curve for the first compression
2nd Stress/Strain AreaA2paThe area under the stress/strain curve for the second compression
Stress/Strain Rp-A2/A1
Stress/Strain RpppaRp × pr1
1st Force/Time Slopetsf1N/sThe slope of the force/time curve for the first compression
2nd Force/Time Slopetsf2N/sThe slope of the force/time curve for the second compression
1st Force/Time AreaTW1N sThe area under the force/time curve for the first compression
2nd Force/Time AreaTW2N sThe area under the force/time curve for the second compression
Force/Time CohesivenessTRf-TW2/TW1
Force/Time GumminessTRfpNTRf × h1
1st Maximum Contact PressureMCP1paThe maximum contact pressure calculated for the first compression
2nd Maximum Contact PressureMCP2paThe maximum contact pressure calculated for the second compression
Apparent modulus of elasticity 1AMOE1PaThe slope of the force/distance curve divided by the surface area of the probe’s end
Apparent modulus of elasticity 2AMOE2PaThe slope of the force/distance curve divided by the surface area of the probe’s end
Table 4. Means and linear models of the maximum force trait at strain of 10% for fruits of three cranberry (Vaccinium macrocarpon Ait.) cultivars that vary in firmness stored at 4 degrees Celsius over time. A total of 100 fruits were measured on each of the four dates for each cultivar. Fruits of the Yellow bell, Sundance and Granite Red cultivars were considered as soft, intermediate and hard respectively. The values of maximum force correspond to the maximum force of the first peak of the double compression method (h1).
CultivarDays Since Harvest
0 a3186163288mAdjusted R-Squared
Soft8.3178.1435.6194.5891.799−0.0230.9405
Medium14.30713.00812.3629.9276.099−0.0270.9768
Hard15.77314.79312.92211.0596.710−0.0310.993
a Linear model intercept.
Table 5. Pearson coefficient of correlation for fruit size-textural and Tukey’s honestly significant difference (HSD) test grouping samples of heterogeneous (het) and homogeneous (hom) cranberry (Vaccinium macrocarpon Ait.) fruits in fruit size. The heterogeneous sample that corresponds to the original sample is composed of 100 fruits of each cultivar; cultivars with soft (Yellow bell), medium (Sundance), and firm (M34) fruits. The homogeneous sample was derived from the heterogeneous sample based on fruit size and is composed of 30 fruits of each cultivar (no significant differences between cultivars, p < 0.05). The tests were carried out for all the traits of the double compression, puncture, and shearing methodologies.
Double Compression
TraitsWidthLengthAreaPerimeterSkin SurfaceVolumeTukey HSD
Measurements Independent of Graph Type
hethomhethomhethomhethomhethomhethomhethom
h10.820.510.620.220.750.370.740.340.70.30.760.4333
h20.820.50.610.210.740.360.730.330.690.290.760.4133
MCP10.340.170.17−0.040.250.030.250.020.21−0.010.260.0632
MCP20.360.180.17−0.050.260.030.250.010.21−0.020.270.0732
M.dist_10.940.750.810.540.910.710.910.680.880.640.910.7632
M.dist_20.920.730.820.560.910.720.910.680.880.650.910.7620
p.deform0.440.160.230.010.330.070.330.060.290.040.350.133
AMOE10.360.190.09−0.190.22−0.070.21−0.10.16−0.140.24−0.0132
AMOE20.390.20.11−0.180.24−0.060.24−0.090.19−0.120.270.0132
Force (N)/Distance (mm) graph
dsf10.710.410.50.120.620.250.610.220.570.180.630.333
dsf20.70.40.490.10.610.240.60.210.560.170.620.2933
dW10.850.540.660.290.790.440.780.40.740.370.810.4832
dW20.850.550.660.260.790.420.780.390.740.350.810.4832
dRf0.20.140.12−0.090.1700.16−0.020.15−0.040.180.0522
dRfp0.810.510.610.180.730.340.720.310.690.270.750.4133
Force (N) Strain (%) graph
sf10.830.530.630.220.760.380.750.350.710.310.770.4433
sf20.820.520.620.210.750.370.740.330.70.290.760.4233
W10.80.460.610.230.730.360.720.330.680.30.740.432
W20.810.470.60.20.730.340.720.310.680.270.750.3933
Rf0.20.140.12−0.090.1600.16−0.030.15−0.050.170.0422
Rfp0.810.510.610.180.730.340.720.310.680.260.750.433
Force (N)/Time (seconds) graph
tsf10.710.410.50.110.620.250.620.220.570.180.630.333
tsf20.70.40.490.10.610.240.610.210.560.170.630.2933
tW10.770.430.60.290.720.390.70.370.670.350.740.4232
tW20.820.440.630.240.760.360.750.330.710.30.780.432
tRf0.110.120.09−0.110.1−0.030.1−0.050.1−0.060.10.0200
tRfp0.460.320.360.020.430.140.420.110.40.080.430.2132
Stress (N)/Strain (%) graph
pr10.340.170.17−0.050.250.030.250.010.21−0.010.260.0632
pr20.360.180.17−0.050.260.030.260.010.22−0.020.270.0732
sp1−0.30.08−0.29−0.07−0.3−0.01−0.31−0.03−0.29−0.04−0.280.0220
sp2−0.37−0.02−0.36−0.2−0.36−0.14−0.38−0.16−0.35−0.17−0.34−0.1120
A10.330.160.17−0.020.250.040.250.030.2100.260.0732
A20.350.160.18−0.030.260.040.260.020.2200.270.0632
Rp0.100.02−0.030.05−0.030.05−0.030.04−0.030.06−0.0220
Rpp0.340.160.17−0.050.250.020.250.010.21−0.020.260.0532
Puncture
TraitsWidthLengthAreaPerimeterSkin surfaceVolumeTukey HSD
hethomhethomhethomhethomhethomhethomhethom
P_AMOE0.610.280.38−0.030.50.10.490.070.450.040.530.1633
P_Max0.330.270.12−0.040.230.090.210.050.180.030.250.1533
P_DR−0.6−0.07−0.51−0.05−0.57−0.06−0.57−0.06−0.54−0.06−0.57−0.0623
P_W−0.10.17−0.21−0.06−0.170.04−0.180.01−0.19−0.01−0.150.0833
Shearing
TraitsWidthLengthAreaPerimeterSkin surfaceVolumeTukey HSD
hethomhethomhethomhethomhethomhethomhethom
S_Max0.260.010.290.120.280.090.290.10.280.10.260.0622
S_W0.710.330.750.430.760.440.760.440.770.440.740.4220
S_DF−0.61−0.27−0.420.05−0.53−0.07−0.52−0.02−0.48−0.01−0.55−0.1332
Table 6. Means, coefficient of variation, Tukey’s HSD and Welch’s two sample t-test of the comparison of texture measurements of double compression taken along and width of fruits in samples of 150 berries from three cranberry (Vaccinium macrocarpon Ait.) cultivars. The p-values of the Tukey tests between orientation are shown in column 8 and the significance is indicated with ‘**’ signifying a p-value between 0.01 and 0.001 and ‘***’ means a p-value less than 0.001. The 150 berries measured for each orientation came from a mixture of fruits from soft (Yellow bell), medium (Sundance), and hard (Granite red) cultivars.
TableMeanCoefficient of VariationDifferences Detected
WidthLengthWidthLengthWidthLengthp-Value
h113.7421.9628.0930.3332***
h215.0124.528.5829.7933***
MCP11.041.151427.1923**
MCP21.171.3414.9825.9423***
M.dist_11.581.9210.8712.9733***
M.dist_21.371.5510.5211.4632***
p.deform1.141.6814.0526.7523***
AMOE14.285.2516.3526.8233***
AMOE25.788.0417.9825.1732***
Force (N)/Distance (mm) graph
dsf18.4511.819.4926.1332***
dsf210.1115.0720.3124.5533***
dW110.2620.238.738.9533***
dW210.1120.0239.338.5933***
dRf0.980.992.687.95230.24
dRfp13.5421.8228.7730.9233***
Force (N)/Strain (%) graph
sf11.352.2828.3830.2232***
sf21.592.8529.2129.5533***
W163.31103.1528.832.3832***
W263.47104.3629.3231.5833***
Rf11.022.748.25230.09
Rfp13.7822.328.7730.9433***
Force (N)/Time (seconds) graph
tsf116.8423.5219.5126.1432***
tsf220.1330.0220.3424.5633***
TW15.1610.1538.6338.9133***
TW25.0910.0739.2338.5533***
tRf0.9912.797.96220.2
tRfp13.5521.8528.7730.9133***
Stress (N/)/Strain (%)
pr13.55414.127.4223***
pr23.994.6414.5826.5122***
sp10.110.343.4961.222***
sp20.130.7919.4232.4120***
A124.0426.8514.8329.7323**
A224.4827.4615.3228.5422***
Rp1.021.033.610.92220.21
Rpp3.614.1115.1528.0822***
Table 7. Predicted combinations of speed and strain which yield the highest Fisher values for ANOVA tests performed on texture measurements collected using different combinations of speed and strain for double compression tests run on cranberry fruit in a central composite design experiment for three cranberry (Vaccinium macrocarpon Ait.) cultivars that differ in firmness. Cultivars BG (soft), Stevens (intermediate) and A9 (hard) were used for this test.
h1h2MCP1MCP2M.dist_1M.dist_2p.deform
Speed (mm·s−1)8.918.691.091.16.238.732.58
Strain (%)5.155.0923.8320.795.595.133.41
AMOE1AMOE2dsf1dsf2dW1dW2dRf
Speed (mm·s−1)1.2113.7412.519.737.988.291.98
Strain (%)26.0332.339.235.5555.0131.16
dRfpsf1sf2W1W2RfRfp
Speed (mm·s−1)8.229.448.58.228.951.958.19
Strain (%)5.015.385.055.015.1631.055.01
tsf1tsf2tW1tW2tRftRfppr1
Speed (mm·s−1)11.799.529.5611.512.93121.08
Strain (%)7.855.435.457.4134.448.2323.66
pr2sp1sp2A1A2RpRpp
Speed (mm·s−1)1.0711.2213.721.4312.893.83.43
Strain (%)21.353832.3628.0410.136.4335.66
Disclaimer/Publisher’s Note: The statements, opinions and data contained in all publications are solely those of the individual author(s) and contributor(s) and not of MDPI and/or the editor(s). MDPI and/or the editor(s) disclaim responsibility for any injury to people or property resulting from any ideas, methods, instructions or products referred to in the content.

