Article

Fatty Acids and Minerals as Markers Useful to Classify Hass Avocado Quality: Ripening Patterns, Internal Disorders, and Sensory Quality

1
Research Unit ITAV: Innovaciones Tecnológicas para Agregar Valor a Recursos Agrícolas, Centro de Investigación La Selva, Corporación Colombiana de Investigación Agropecuaria-Agrosavia, Km. 7, vía Rionegro—Las Palmas, Sector Llanogrande, Rionegro 054048, Antioquia, Colombia
2
Centro de Investigación Palmira, Corporación Colombiana de Investigación Agropecuaria-Agrosavia, Diagonal a la Intersección de la Carrera 36A con Calle 23, Palmira 763531, Valle del Cauca, Colombia
*
Author to whom correspondence should be addressed.
Horticulturae 2023, 9(4), 460; https://doi.org/10.3390/horticulturae9040460
Submission received: 2 March 2023 / Revised: 28 March 2023 / Accepted: 30 March 2023 / Published: 4 April 2023

Abstract

:
Hass avocado quality varies by origin, season, and production practices. However, there is a lack of methodologies to guarantee that fruit reaching the market has consistent quality. The aim of this work was to identify predictive markers for quality management. Fruit samples produced under different nutrient management, elevation, date-to-harvest, and growth cycle conditions were analyzed. Dry matter, oil content, internal disorders, sensory attributes, minerals, and fatty acids were evaluated as quality variables. The results highlighted soil and weather differences among orchards. Nutrient management practices based on index balancing in some samples increased both productivity and fruit size. High variability was observed in the dry matter related to the age of the fruit at harvest. Ripening heterogeneity was very large in low-elevation orchards where the fruit was picked relatively early. High flesh mineral contents delayed fruit ripening. At low growing temperatures, more oleic and linoleic acids were present in fruits. The sensory texture and taste descriptors were affected by the fruit age and related to the flesh composition. Logistic, PLS-DA, and biplot models effectively represented the variabilities in the ripening pattern, composition, and sensory profile of avocado fruits and allowed the samples to be grouped according to the internal fruit quality.

1. Introduction

Hass avocado consumption is increasing globally due to the demand for healthy and exotic flavors. Avocado consumption is led by the US with 4–7 kg per-capita consumption, followed by Canada, EU27 West, and EU27+UK [1]. This consumption trend can increase with a rise in Asian countries. Hass avocado-producing countries should conduct more research to achieve profitable productivity and internal quality that allows them to compete with fruit in destination markets. Effective nutrient management and agroecological characterization are essential for high-quality fruit and increased productivity in avocado orchards [2,3,4].
The marketing of ‘Hass’ avocados is limited by postharvest disorders, causing vast losses when the fruit is rejected for not meeting quality standards. Challenges include ripening heterogeneity, internal disorders, and sensory quality. Previous research has relied on univariate approaches to address the quality of Hass avocados and flesh mineral composition [5,6,7]. However, this approach limits the understanding of a phenomenon that is multivariate.
Heterogeneity in ripening has been focused on as a main logistical factor [8] but has not been associated with an increase in internal problems when avocado fruits require longer durations to ripen. Although fruit can ripen without internal disorders, such fruit does not always have high sensory quality [9].
Studies performed in the sensory area have implemented acceptance tests mainly with a focus on postharvest or breeding [10]. Other studies have proposed the content of fatty acids as a marker of origin [11]. However, metabolism during fruit growth limits the application of such methods to countries with highly contrasting production conditions, such as certain regions in Chile, Mexico, and Colombia. In addition, few works have sought to determine the relationships between fatty-acid profiles and the sensory quality of avocado fruit.
Multivariate studies are needed to address avocado quality, including internal and sensory aspects, to ensure consistency across destination markets. Agronomic management programs should guarantee productivity without compromising fruit quality. Harvest indices such as dry matter and oil content do not distinguish high or low postharvest quality. Nondestructive techniques often follow a univariate approach and cannot identify regions with differentiated fruit qualities. Multivariate studies can help determine how to manage regions according to market demands. Therefore, the aim of this work was to develop a methodology for evaluating the ripening pattern, internal disorders, flesh composition, and sensory quality of Hass avocados and to determine predictive quality markers to manage it.

2. Materials and Methods

2.1. Field Conditions

In the municipalities of Morales (orchard R) and El Tambo (orchard N) in Cauca, Colombia, fifteen commercial fruit-bearing 15-year-old ‘Hass’ avocado trees grafted on seed rootstock (possibly of the Antillean ecological group) were selected. Another previously analyzed, orchard EB located in Antioquia, Colombia, was used as a quality reference orchard because it produces fruit with a high internal quality consistently during the different studied harvest seasons [9].
In the same year in each orchard, trees with different flowering intensities are often present. In this work, trees were selected due to their high flowering level, vigor, and good phytosanitary status. For the R and N orchards, the study was conducted over two harvest cycles, the first corresponding to the intermediate flowering period with anthesis in August 2020 and the second corresponding to the main flowering period with anthesis in March 2021 (Figure 1). All the orchards had a density of 204 trees/Ha.
Climatic conditions were monitored during two consecutive years with a weather station (Watch Dog 2900ET; Spectrum Technologies, Plainfield, IL, USA); the following weather variables were recorded: the daily wind speed, rainfall, relative humidity, sunshine, and maximum, minimum, and average air temperatures. The recorded climatic variables were used to determine the water balance and the high and low rain seasons according to the daily reference evapotranspiration (ETo) based on the FAO (Food and Agriculture Organization) Penman–Monteith method [12].
The nutrient status and management were diagnosed and oriented by the Balanced Indices of Kenworthy (BIK) [13] for the orchards located in the department of Cauca in August 2020 (Figure 1). Nutrient removal with a 20-ton target yield was used to calculate the fertilization plan from the data obtained by Salazar-García and Lazcano-Ferrat [3]. The optimum doses of the nutrients were calculated from the soil fertility, the amount of nutrient removal for each element with a planned yield, and the fertilizer efficiency. The annual nutrient units (g) applied per tree were N (504.9), P2O5 (336.6), K2O (656.9), CaO (22.9), MgO (48.2), and B (4.2). Soil-applied fertilizer was distributed evenly around the drip line of the tree, and fertilizer was applied monthly. The orchard was managed under standard practices by the farmer with the exception of trees fertilized with the plan management based on the BIK. The nutrient management by the farmer was higher, with applications per tree every two months in the following doses during the same year (g): N (236.6), P2O5 (530), K2O (350), CaO (76.5), MgO (14).
Soil chemical analyses of the top 45 cm layer were performed at the beginning of the experiment, and the results were used to calculate the nutrient supply capacity of the soil. To determine the plant nutrient status, fifty leaves from the vegetative growth were collected from trees at a height of 1.5 m every two months during the two consecutive years of study and washed, oven-dried to a constant mass, and sent to the laboratory at the “Corporación Colombiana de Investigación Agropecuaria” AGROSAVIA for mineral nutrient analysis.
The yield (kilogram/tree) and the number of fruits per tree were determined at the time of harvest during the two flowering cycles. The masses of a hundred randomly selected fruits from trees with high crop loads were collected and used to calculate the total number of fruits per tree. The harvested fruit were then classified according to the Codex Alimentarius standard (Codex Stand 197, [14]) with the following packing carton sizes (range in grams per fruit): size 10 (364–462), size 12 (300–371), size 14 (258–313), size 16 (227–274), size 18 (203–243), size 20 (184–217), size 22 (165–196), size 24 (151–175), size 26 (144–157), size 28 (134–147), size 30 (123–137), and size 32 (80–123).

2.2. Postharvest Quality

2.2.1. Sampling

In each orchard, a sample of 150 fruits per nutrient management strategy was taken for each harvest cycle (Figure 1). As described before, one sample was taken from the EB orchard for comparison with the R and N orchard results. Ten fruits per tree were harvested when they reached the dry matter (DM) value at commercial maturity employed by the grower according to the practices of the packing houses. As the DM varies by the production region, the fruit development time was established for each orchard. R1 (176 days), N1 (162 days), R2 and N2 (173 days), and EB (226 days). The fruits were harvested manually with previously disinfected pruning shears, leaving a 5 mm peduncle [15]. Fruit was harvested between 8:00 and 10:00 h from the outer 0.5 m of the canopy, between 1.5 and 3.0 m above ground, and at random from each quadrant of the tree. The DM and oil content (OC) were analyzed according to the AOAC methods (American Organization of Analytical Chemists, No. 934.01 and 963.15, respectively) [16].

2.2.2. Storage and Ripening

The samples were disinfected following the packing house practices and the methods reported by Hofman et al. (2003) [5]. The fruits were immersed in a prochloraz solution of 0.05% w/v (Mirage 45 ADAMA ANDINA, Pavullo, Italy) for 30 s. Then, the samples were dried at room temperature and packed into corrugated cardboard boxes. The fruits were stored for 2 weeks, simulating European market export conditions (at 5 °C/90% relative humidity (RH), Memmert HPP 110, Schwabach, Germany).
After that, the fruit was ripened (20 °C/90% RH, Memmert HPP 110). Ripening ended when fruits reached a rating of 5 according to White et al. (2009), corresponding to the firmness range from 8 to 12 N, as measured in the fruit’s equatorial zone using a TA-XT Plus texture analyzer (Texture Technologies Corp., New York City, NY, USA) equipped with a 30-kg load cell [17]. Each day, two measurements were performed on unpeeled fruit with a stainless-steel compression plate (P/75.75-mm diameter).

2.2.3. Some Fruit Postharvest Quality Analysis

  • Internal defects or disorders
Internal defects were evaluated by cutting fruits longitudinally in half, and the damage was identified as described in the international quality manual [17]. The internal disorder incidence (damage frequency in the sample) and severity (percentage of the flesh surface area affected) were evaluated. The internal disorders evaluated were stem end rot, body rot, vascular browning, flesh discoloration, and flesh bruising.
  • Sensory analysis
The method used involved a sensory profile developed through a multidimensional approach [18]. Fruits without internal damage were cut longitudinally in two halves, and the seeds were removed. At the equatorial fruit zone, a cube (2 cm3 each) was taken and placed into a 30-cm3 plastic dish labeled with a random three-digit number. The test was then performed by a trained panel of 10 judges (male and female, 25 to 55 years old). The panelists consisted of personnel from the La Selva Agrosavia researcher center (Rionegro, Antioquia, Colombia). Five training sessions were performed to familiarize panelists with avocado quality attributes to identify the sensory intensity of descriptors and evaluate the sensory scale following the ISO standard [18]. The judges were selected based on their sensory acuity for basic characteristics (basic tastes, odors, and textures) and their ability to discriminate among products.
For treatment (see Figure 1), 32 ripened Hass avocado fruits were evaluated. The descriptors were selected based on previous works [9] and preliminary tests to verify the consensus of the panel about the Hass avocado sensory descriptors corresponding to the quality profile. The descriptors evaluated by panelists were fresh appearance, green color, yellow color, herbal smell, sweet taste, acidic taste, bitter taste, coconut sensation, nutty sensation, astringent sensation, oily sensation, hard texture, fibrous texture, lumpy texture, flux texture, and general quality. In general, those descriptors represent appearance, smell, taste, texture, and general quality attributes evaluated on a scale from 0 to 5. Panelists were also instructed to take a bite of cracker and drink some water to rinse their palate between each sample [19].
The sensory analysis was performed in the laboratory at the postharvest and agrofood processing pilot plant facilities (Agrosavia La Selva Research Center, Rionegro, Antioquia Colombia).
  • Flesh mineral content
The analysis was performed following the procedure published by Escobar et al. [20]. Briefly, the flesh was dried at 70 °C in a forced convection oven (Memmert UF 110) until a constant weight was attained. Then, the samples were hydrolyzed, and the mineral content (K, Ca, Mg, S, and Na) was analyzed with an inductively coupled plasma (ICP) emission spectrometer (Thermo Scientific iCAP 6500 duo, Waltham, MA, USA). Atomic absorption spectroscopy (AAS, Agilent Technologies FS 240) was used to analyze the P, Fe, Cu, Mn, and Zn contents. The B content was determined in a spectrophotometer UV—VIS (Thermo Scientific Spectronic Genesys 10 S) at a wavelength of 430 nm following the methods of McKean [21].
  • Fatty acid methyl esters (FAMEs)
The FAME profile was identified and quantified according to AOAC 996.06 [16]. The extracted total fat (TF) was methylated to fatty acid methyl esters using BF3 in methanol. FAMEs were quantitatively measured by gas chromatography and a flame ionization detector (GC-FID) (Thermo Trace 1300) against the C11:0 internal standard.

2.3. Statistical Analysis

The homoscedasticity and normality of the obtained data were analyzed to determine whether parametric or nonparametric tests should be applied. The fruit-ripening heterogeneity was analyzed using the nonparametric Kruskal–Wallis test. After that, Dunn’s multiple-comparisons test was applied with a Bonferroni correction (p < 0.05). For the incidence of internal disorders, descriptive analyses of the qualitative data were used. Then, the relative frequency was analyzed by a k proportion test using a Chi-square test (α = 0.05).
The disorder severity was analyzed by a Kruskal–Wallis test. The incidence of internal disorders was modeled through nonlinear regression using a logistic model (confidence interval 95%). Multivariate data of minerals and FAME flesh composition were analyzed by unsupervised (PCA) and supervised (PLS-DA) analysis methods. Sensory product characterization was performed to identify which descriptors best discriminated a set of fruits according to the orchard-specific nutrient management program and the growing cycle. For each descriptor, an ANOVA model was applied to check whether the scores given by the assessors differed significantly (XLSTAT 2022.2.1 Addinsoft, Paris, France).

3. Results

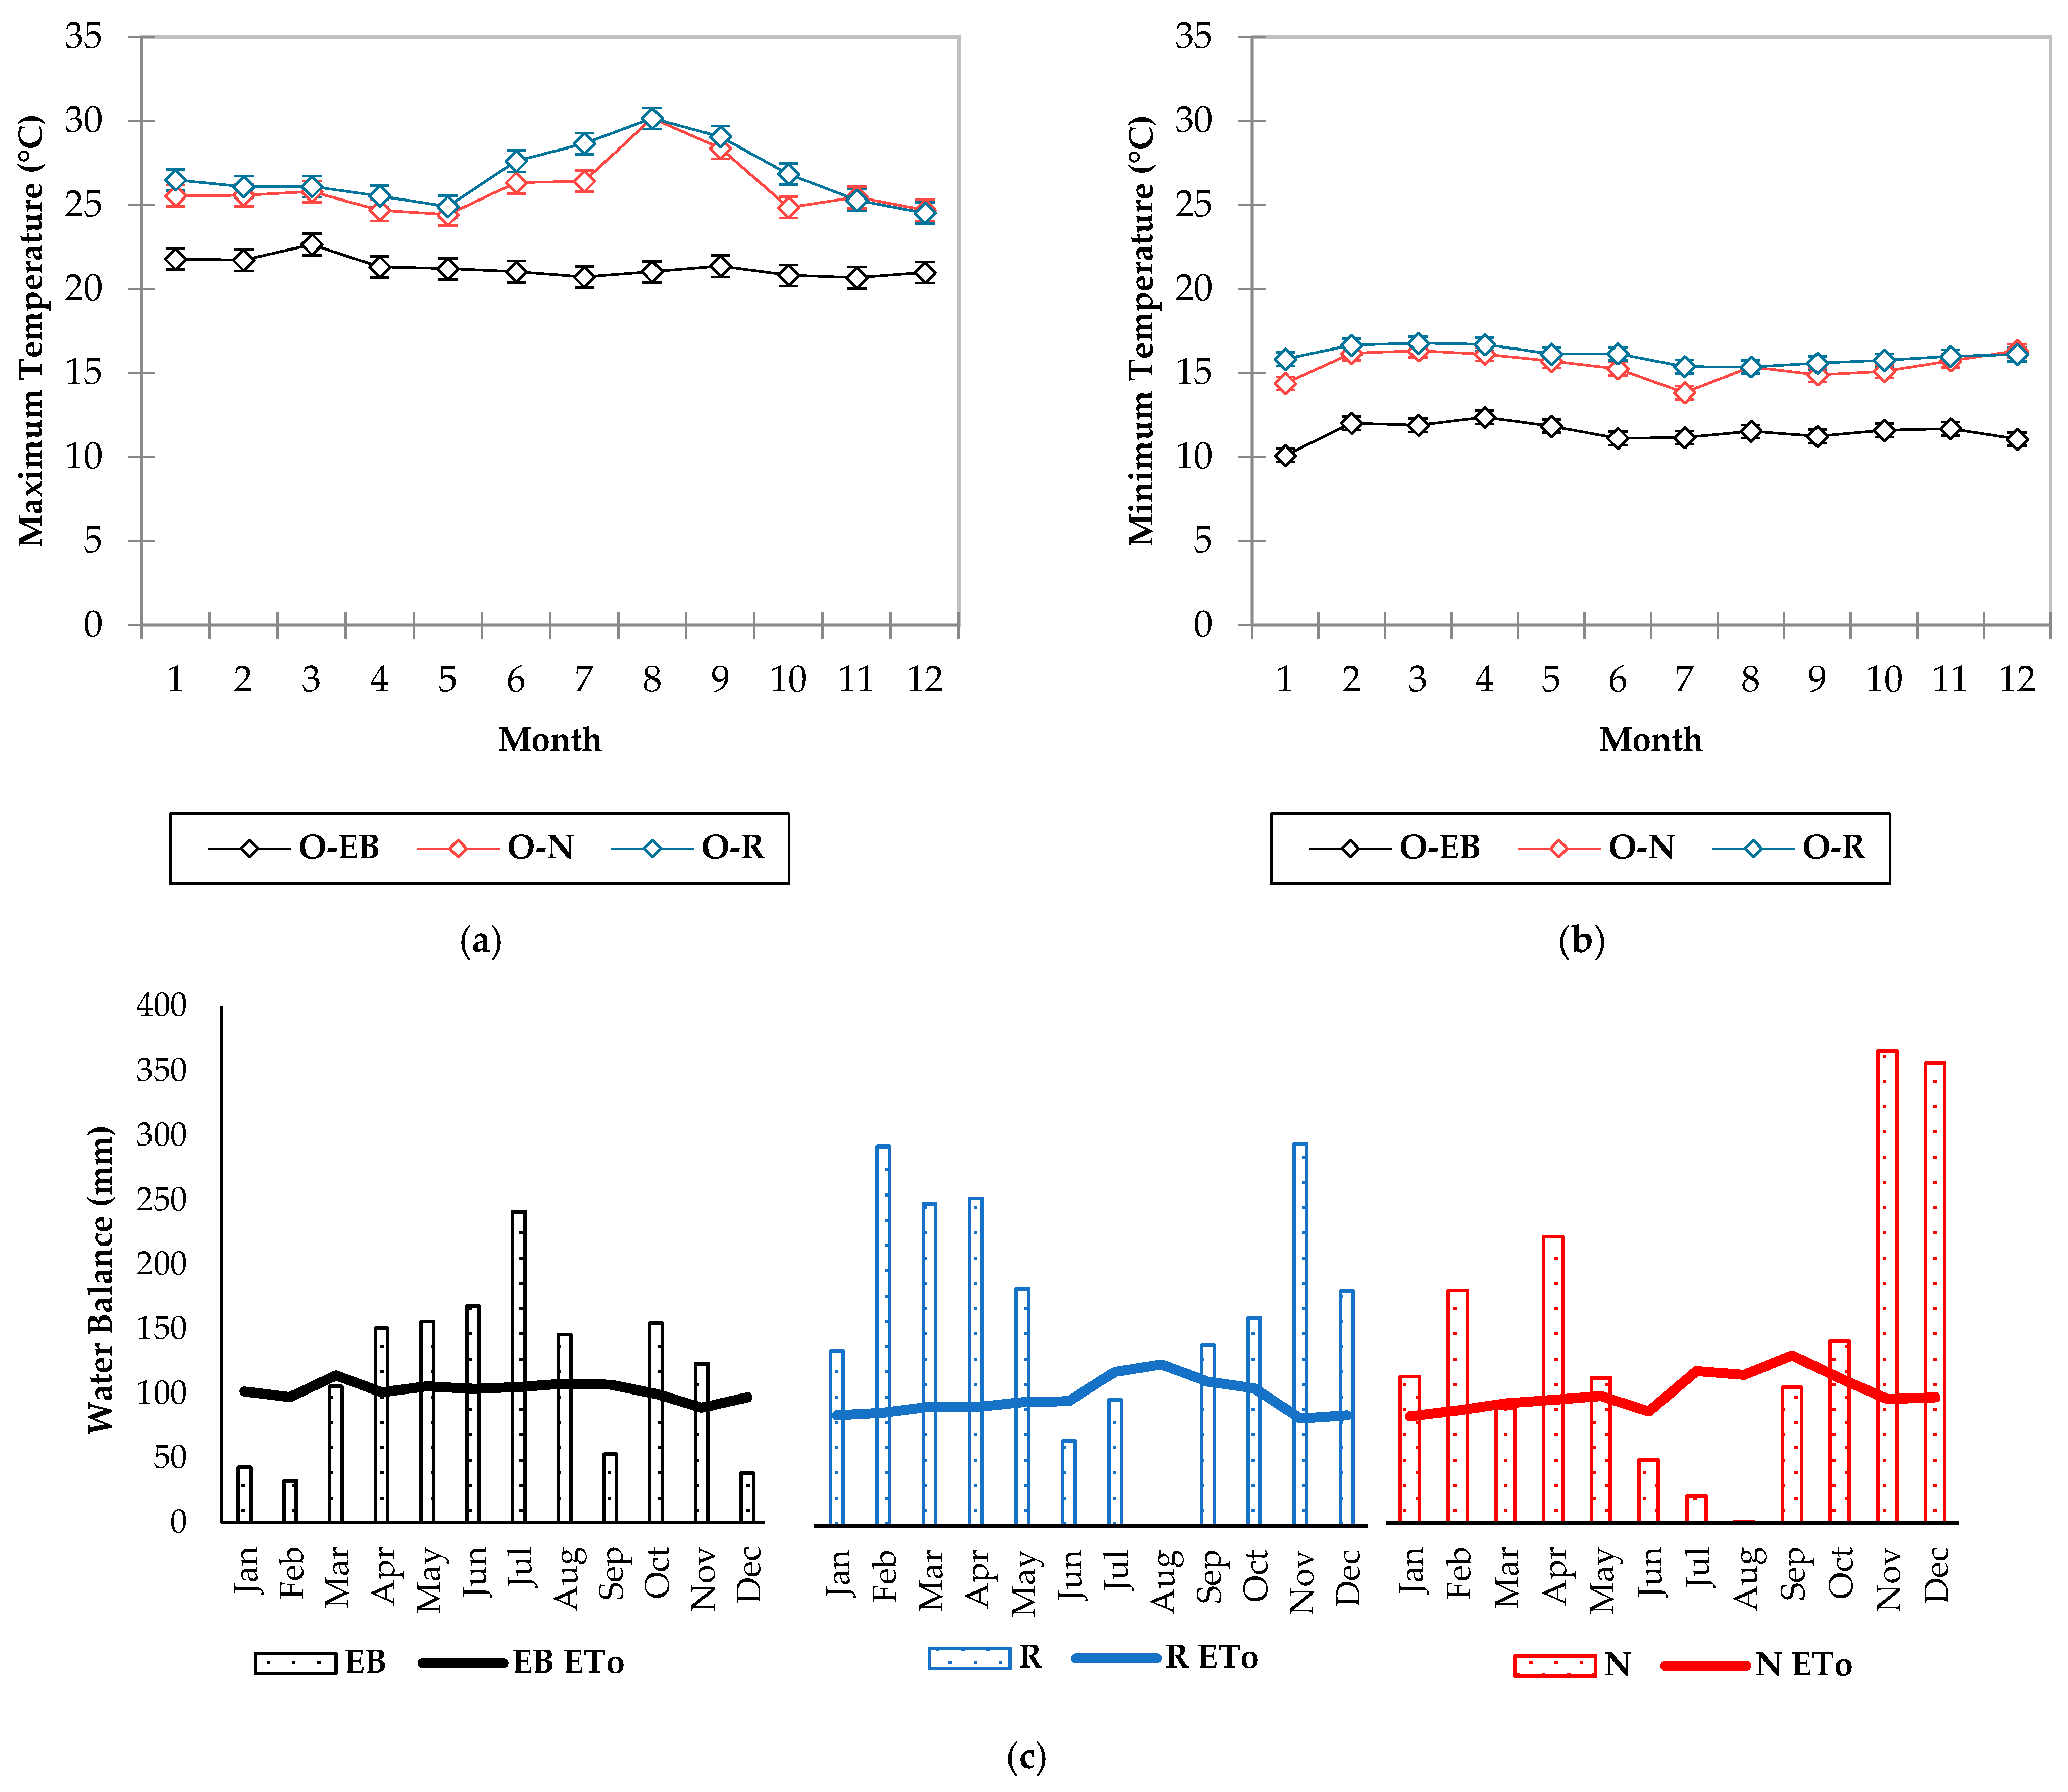
3.1. Field Conditions

The experimental avocado zones of R and N in the department of Cauca are located at elevations of 1600 and 1708 m.a.s.l, respectively. The reference orchard EB is located in the department of Antioquia at an elevation of 2464 m.a.s.l. The variations in climatic conditions among the EB, R, and N orchards were registered (Figure 2). Significant differences of approximately 5 °C were observed in the maximum and minimum temperatures among the R, N, and EB orchards (Figure 2a,b).
The cumulative annual precipitation totals were 2060 mm, 1795 mm, and 1411 mm in the R, N, and EB study areas, respectively, with a differential monthly distribution pattern throughout the year. An average of 211 mm of precipitation was recorded in the high-rain seasons from January to May and from October to December, while 61 mm of precipitation was recorded in the low-rain season from June to September in both R and N. A variation was reported in the precipitation distribution pattern in the EB location. A low-rain season occurred in January, February, September, and December, with 42 mm of precipitation falling (Figure 2c).
The soil characteristics in the experimental zones located in the Cauca region showed a sandy loam texture and pH conditions between moderate to hard acidic (Table 1). The electrical conductivity values indicated that these are salt-free soils, in addition to having high organic matter (OM) contents, indicating a high nitrogen availability.
The cation exchange capacity (CEC) showed values less than 10 meq/100 g, indicating the very poor ability of the soil to exchange nutrients such as calcium, magnesium, sodium, and potassium. These characteristics should be explained by the loamy-sandy texture of this kind of soil (Table 1). Some of these characteristics are common for the EB orchard, but the contents of mineral nutrients such as Ca, Mg, P, and minor elements were within the normal concentration ranges.
Two flowering periods were recorded in two consecutive years, characterized as the intermediate flowering period or cycle 1 (July September) and the main flowering period or cycle 2 (February-April); these flowering periods peaked with the largest proportion of flowers in anthesis in August and March, respectively.
The harvest from the intermediate flowering period was recorded in April, and that from the main flowering period was recorded in November 2021. An increase in the per-tree yield was registered in the harvest from the main flowering period with a nutrient management program based on the BIK standards. The wide standard error recorded in all treatments reflects the variation in the per-tree crop yield due to variations in the flowering intensity (Figure 3).
In accordance with the Codex Alimentarius standard [14], the fresh fruit weight at harvest showed an increase in the percentage of fruits from size 22 (165–196 g) in both the R and N orchards (Figure 4a) with the nutrient management program based on the BIK standards [13]. In the N orchard, no effect of nutrient management on improving the fruit weight from the intermediate flowering period was observed (Figure 4b).

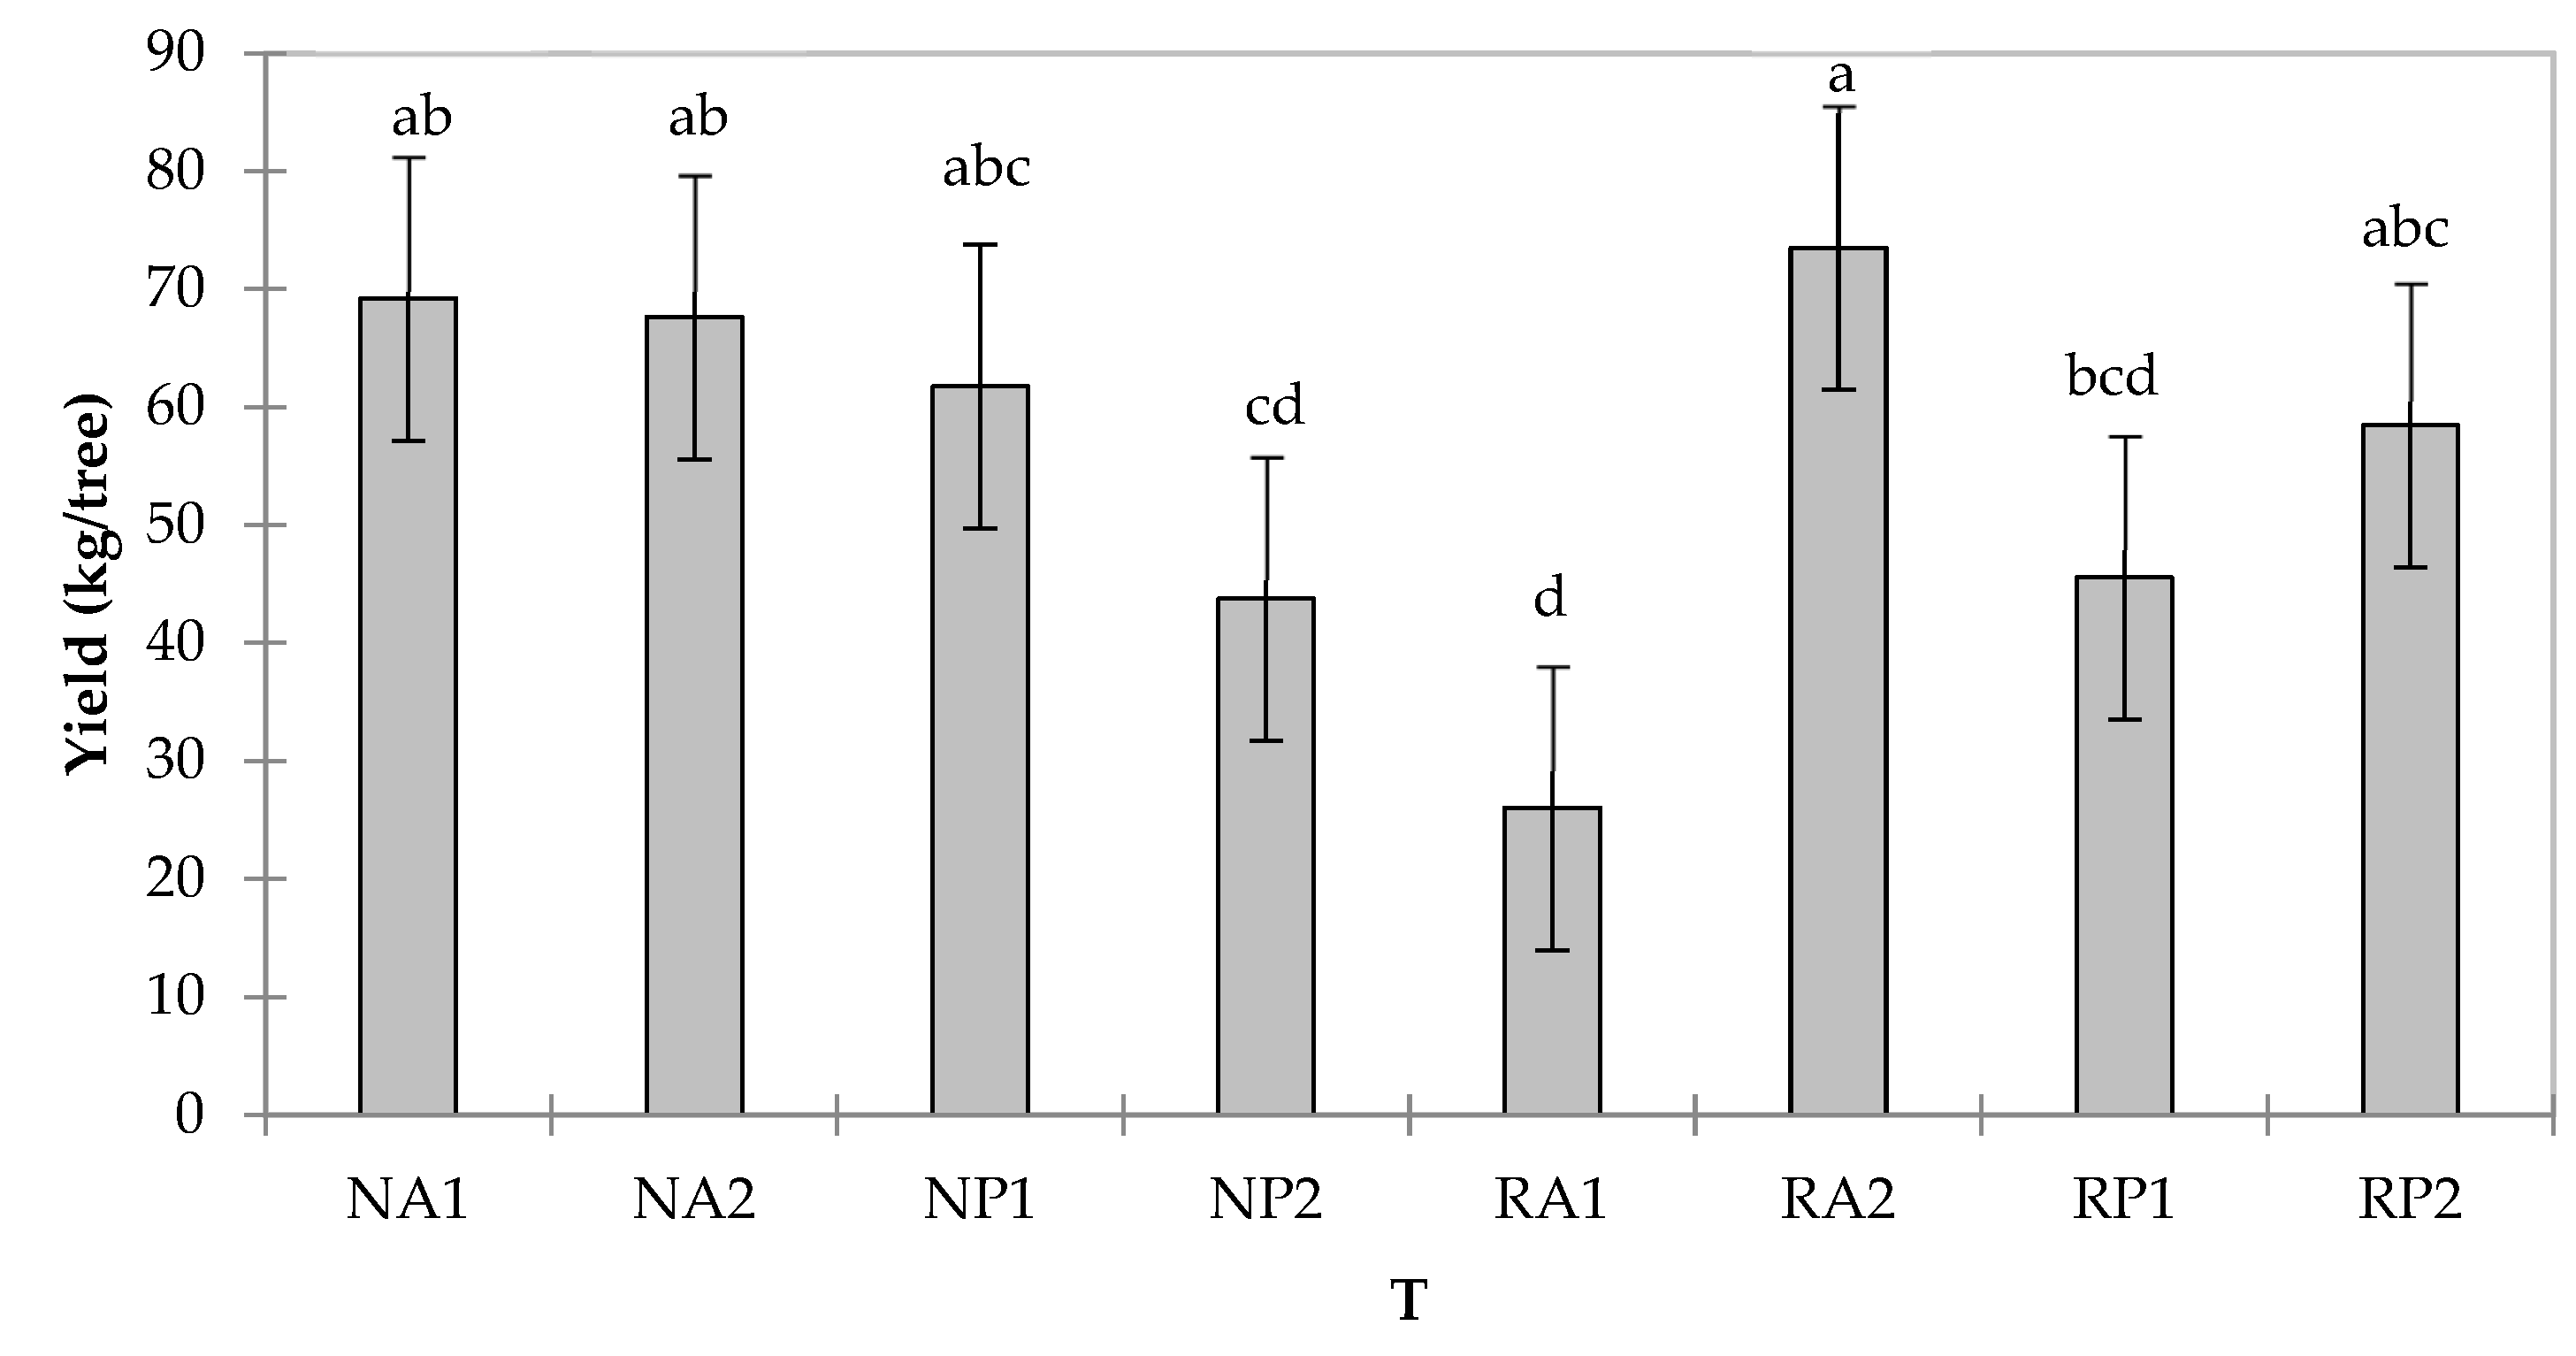
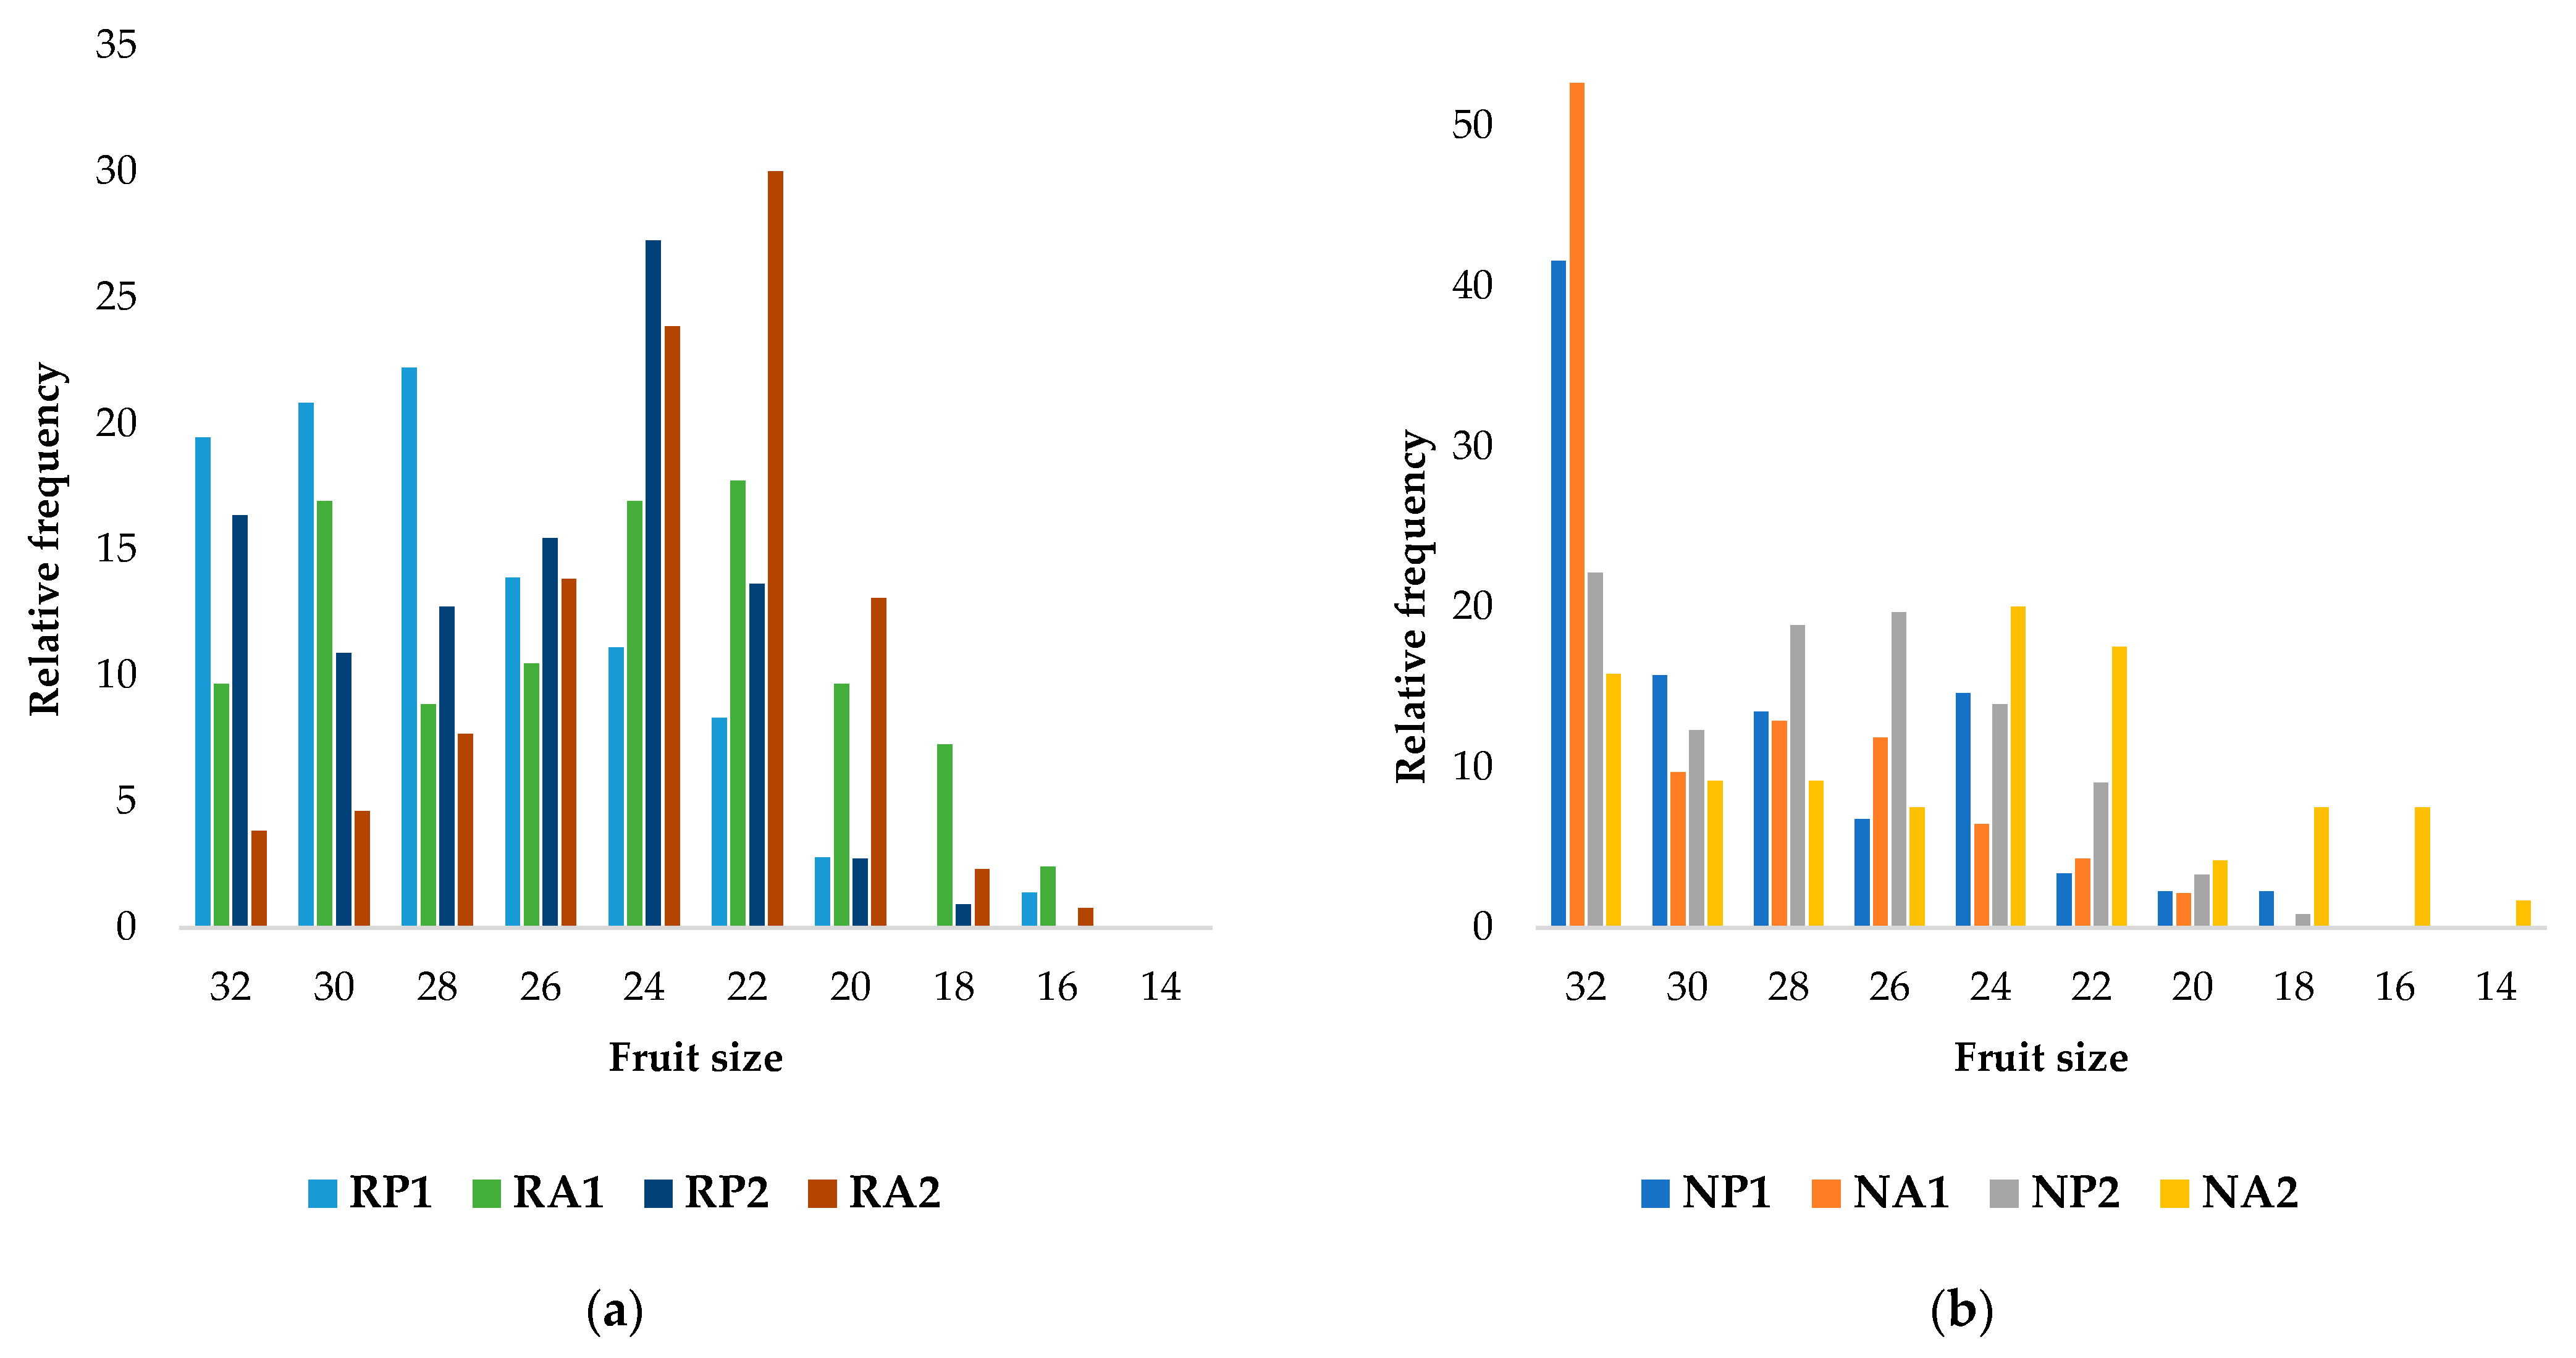
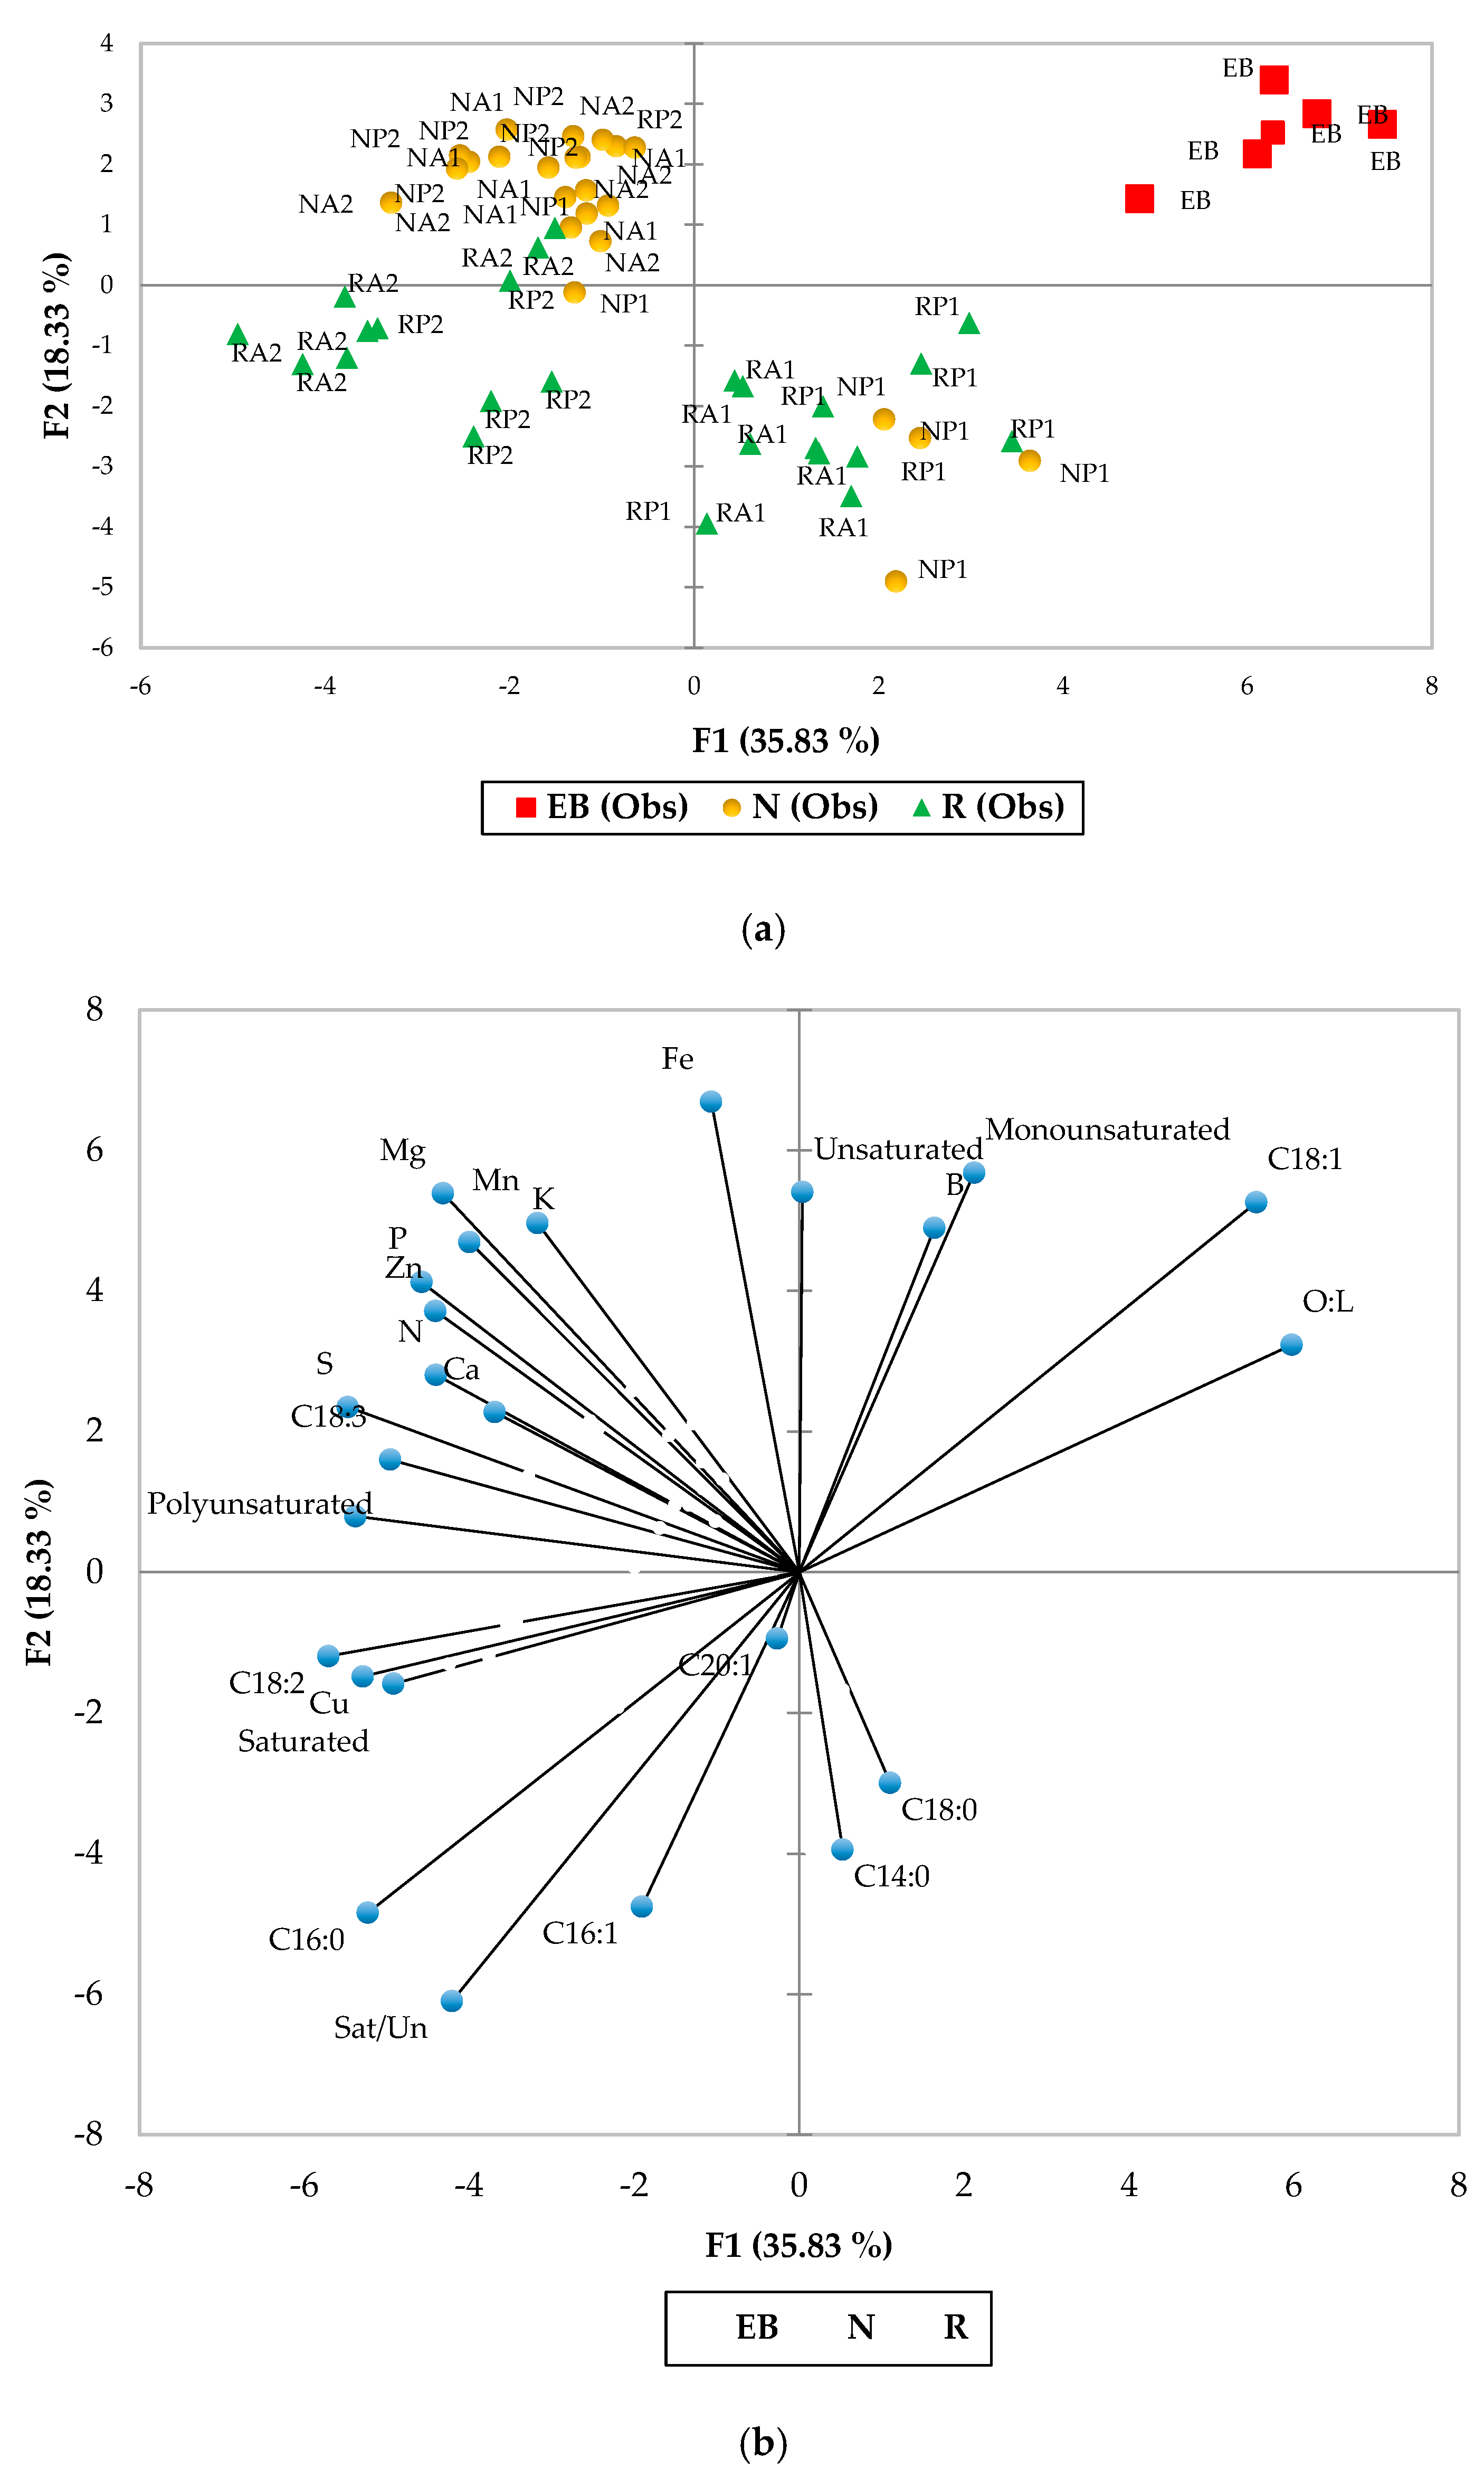
3.2. Postharvest Quality

In Figure 5, the Hass avocado ripening heterogeneity is shown. The harvest index (DM or fruit development time) has a greater impact on the ripening pattern of Hass avocados than either the nutrient management program or the growing season cycle does. The orchard located above 2400 m.a.s.l had shorter ripening ranges than the orchards situated at elevations below 1710 m.a.s.l. At high elevations, the development of fruit is slower than at low elevations because of the temperature differences (approximately 5 °C) among the N, R, and EB orchards (Figure 2a,b).
In terms of fruit development time, differences of at least 50 days were observed (Figure S1). In other words, the growers at low elevations harvested their fruit earlier than those at high elevations. Moreover, the mineral accumulations in the R and N orchards were larger than those in EB, as will be discussed later. Even though the EB orchard had a high range of variability at harvest (Figure S1), its softening pattern occurred faster. Therefore, other preharvest factors must influence the ripening heterogeneity pattern, and the need thus exists to include not only classical harvest indices but also other quality markers when predicting the robustness of fruit to exportation.
The incidence rates of internal disorders and the corresponding severity were higher in the N and R orchards than in the EB orchard (Figure S2a). Nutrient management A (BIK) reduced the incidence of disorders, but there was no significant difference from grower management (Table S1). Moreover, the disorder severity was lowest at the EB orchard (Table S2). This is contrary to the literature that reports that at high DM contents, the highest severity of flesh damage occurs. Therefore, these results confirm that internal damage appears when fruits take a long time to reach the RTE stage. For the N and R orchards, the mineral contents impeded the Hass avocado ripening pattern, as discussed above, and promoted the increased incidence and severity of internal disorders as the DTRE was lengthened (Figure S3).
Vascular browning was the main internal disorder found (37–76%), and the N and R orchards had the highest occurrence rates of this disorder (Figure S4a, Table S3). Stem end rot was the second most common internal disorder in the samples (6–46%), for which the EB orchard had the lowest incidence rate. Flesh discoloration (FD), flesh bruising (FB), flesh rots, and body rots were found in the samples with low relative incidence frequencies.
For both growth cycles, the percentages of internal damage severity at the R and N orchards were higher than 20% (Figures S5 and S6). The severity increased after the 8 DRTE (days to ready-to-eat) and, in many cases, exceeded the control limit and could affect the consumer acceptance of fruit in the international market [22] because of the disorder severity [23].
The principal component analysis (PCA) results of the flesh mineral and fatty acid contents are shown in Figure 6. The score plot shows that the orchards were effectively grouped according to their composition. In Figure 6b, the loading plot shows that the N orchard had the highest B, N, Zn, and S contents, except for four samples in growth cycle 1 with nutrient management of the grower, which showed low values of these minerals. The R orchard had more Mg, Ca, Cu, and Mg, especially during growth cycle 2. This could be the cause of a reduction in internal quality (increased internal disorders and reduced sensory quality), as will be discussed. The EB orchard had intermediate quantities of B, Fe, and Mn even though it had the highest fruit development time and OC.
The samples far from the EB grouping had low internal quality, high ripening heterogeneity, and even lower sensory quality, as will be shown later. Descriptive statistics of the flesh mineral composition for each orchard are presented in Table S4. These EB mineral contents could be used as a reference to determine Hass avocado heterogeneity and internal quality. Moreover, the results show that despite growing season 2 having low harvest indices, the mineral contents were high at this time. The PLS-DA analysis shows that the principal discriminant variables between orchards indicate that K, N, B, P, and S correspond to the first factor and B, Cu, S, N, and K correspond to the second factor (Figure 7).
As a grouping factor, the localities or orchards were well classified with the PLS-DA analysis using fatty acid compositions as regressor variables. The fatty acid proportions found in each orchard are shown in Table 2. The orchard EB FAME proportion showed significant differences compared to the Cauca orchards (R and N). EB fruits had less saturated fat associated with the fatty acids C16:0 and C16:1, while the C18:1 proportion was significantly higher in the EB orchard. Therefore, the univariate approach confirms that the FAME content is a marker useful for classifying fruits, and as will be discussed, FAMEs have a great impact on sensory quality and are related to fruit age.
Factors 1 and 2 explain 80% of the variance observed in the Y variables (orchards), and with three factors, the model has good robustness with regards to both prediction and stability (R2 Calibration = 0.889, SEC = 0.106, RMSEC = 0.101, R2 = 0.821 SECV = 0.122, RMSECV = 0.120). Therefore, the model could be useful for identifying whether new samples have a composition similar or not to the EB samples (colored in red and defined as an ellipse quality in Figure 7a).
The classification models found were:
F(EB) = (0.65 + 1.42 × 10⁻³ × Saturated) + (2.6 × 10⁻³ × monounsaturated) + (4.80 × 10⁻³ × Polyunsaturated) + (2.68 × 10⁻³ × Unsaturated) − (0.10 × Sat/Un) − (5.48 × 10⁻² × C14:0) − (9.35 × 10⁻³ × C16:0) − 3.06 × 10⁻² × C16:1) + (1.86 × 10⁻² × C18:0) + (4.45 × 10⁻³ × C18:1) + (6.73 × 10⁻³ × C18:2) − 0.18 × C18:3) + (5.5042 × 10⁻² × C20:1) + (3.89 × 10⁻² × O:L) − (0.39 × N) − (0.42 × P) + (8.58 42 × 10−2 × K) − (1.87 × Ca) + (1.87 × Mg) − (5.12 × S) − (3.81 × 10⁻³ × Fe) − (2.86 × 10⁻² × Cu) + (8.61 × 10⁻² × Mn) − (1.62 × 10⁻² × Zn) + (1.66 × 10⁻³ × B).
F(N) = −1.21 − (1.12 × 10⁻² × Saturated) − (4.11 × 10⁻³ × monounsaturated) − (8.81 × 10⁻³ × Polyunsaturated) − (4.42 × 10⁻³ × Unsaturated) − (0.25 × Sat/Un) − (2.31 × 10⁻² × C14:0) − (7.02 × 10⁻⁴ × C16:0) + (2.58 × 10⁻² × C16:1) + (0.047 × C18:0) − (1.11 × 10⁻³ × C18:1) − (6.49 × 10⁻³ × C18:2) + (8.75 × 10⁻² × C18:3) + (0.20 × C20:1) − (2.72 × 10⁻² × O:L) + (0.63 × N) + (1.85 × P) + (0.37 × K) + (7.24 × Ca) − (1.11 × 10⁻² × Mg) + (3.67 × S) + (0.014 × Fe) − (4.63 × 10⁻² × Cu) − (7.47 × 10⁻² × Mn) + (1.99 × 10⁻² × Zn) + (1.028 × 10⁻² × B)
F(R) = (1.56 + 9.77 × 10⁻³ × Saturated) + (1.54 × 10⁻³ × monounsaturated) + (4.01 × 10⁻³ × Polyunsaturated) + (1.74 × 10⁻³ × Unsaturated) + (0.35 × Sat/Un) + (7.79 × 10⁻² × C14:0) + (1.00 × 10⁻²) × C16:0) + (4.76 × 10⁻³ × C16:1) − (6.54 × 10⁻² × C18:0) − (3.35 × 10⁻³ × C18:1) − (2.40 × 10⁻⁴ × C18:2) + (9.22 × 10⁻² × C18:3) − (0.26 × C20:1) − (1.18 × 10⁻² × O:L) – (0.24 × N) − (1.43 × P) − (0.46 × K) − (5.37 × Ca) − (1.85 × Mg) + (1.46 × S) − (1.02 × 10⁻² × Fe) + (7.49 × 10⁻² × Cu) − (1.14 × 10⁻² × Mn) − (3.69 × 10⁻³ × Zn) − (1.19 × 10⁻² × B)
These models could allow us to predict the internal fruit quality and guarantee the mineral and fatty acids composition necessary to produce a robust fruit for the international supply chain of fresh fruit.
The quality of Hass avocado fruits must be qualified not only as the absence of internal disorders but also as an optimal sensory profile related to the origin (country, region, etc.), rootstock, management, and harvest practices, among other factors. A multivariate profile indicating the orchards, growing season, and nutrient management factors is shown in Figure 8.
The results show that the sensory descriptors related to high general quality are coconut sensation, hazelnut sensation, flux texture, and creamy sensation (oily sensation), and the means adjusted for these descriptors were high in EB, RA1, and RP1 tests (Figure 8).
Therefore, as discussed before, the composition has an impact on the overall Hass avocado fruit quality, and the “quality ellipse” established (Figure 7a) in the flesh mineral composition indicates that the oleic content and oleic: linoleic relationship are in accordance with the sensory quality profile. High mineral content is related to hard or firm, lumpy and fibrous textures, astringent sensations, and sweet, acid, and bitter tastes, effectively explaining how the sensory profile is related to the RP1, NA1, and NP1 samples. Growing cycle 2 had a low intensity in almost all of the descriptors, and the factor-2 fruits of the biplot showed a hard and fibrous texture with a high green color (Factor 2) and poor development of the discriminant descriptors related to a high sensory quality (Figure 8).
Moreover, the mineral composition and the internal and sensory quality of fruits are affected by the fatty acid composition. The EB orchard had a high oleic acid content and a strong O:L (oleic: linoleic) relationship (Figure 6 and Figure 7). The R and N orchards had greater saturated fatty acid contents (myristic, palmitic, and stearic acids).
One difference between the R and N orchards was that unsaturated fatty acids were more abundant in fruits grown in the R orchard. The variability found in the fatty acid composition between orchards was well-represented by the PLS-DA analysis (Figure 7). These results explain the differences found in the sensory analysis. The samples with more unsaturated (EB and R) fatty acids (oleic, linoleic, linolenic, and palmitoleic acids) had the highest sensory quality (creamy sensation, flux texture, and hazelnut and coconut sensations).

4. Discussion

As a common characteristic in avocado-producing areas in Colombia, a bimodal rainfall distribution pattern is presented [24,25,26,27,28], as was registered in the studied avocado-producing area of Cauca. In this region, the high rainy season registered from January to May supplies the necessary water for nutrient mobility during the main flowering period. However, the intermediate flowering matches the low rainy season recorded from June to September. The flowering phase and initial fruit growth are highly demanding in terms of water and nutrients, and stress factors resulting from these two resources can increase the abscission of flowers and set fruits and can affect fruit growth [29,30,31,32,33,34]. Herein, in the experimental orchards in Cauca, the nutrient management program based on BIK supplied nutrients monthly, but the low water availability in the low rainy seasons potentially limited the transport of these nutrients to the plants during critical periods of high demand within the intermediate flowering period.
The soils in Cauca orchards showed a low capacity to exchange nutrients such as calcium, magnesium, sodium, and potassium. Previous reports showed a relationship between the nutritional condition of avocado trees and the availability of elements in the soil [35], and some characteristics, such as acidic pH values, low levels of organic matter, and high to very high levels of Cu, Fe, K, Ca, B, and Zn, lead to deficit concentrations of nutrients in the leaves [34]. BIK is a widely used tool for diagnosing the nutrimental status of Hass avocado trees [36,37].
In the methodology adopted herein, we considered an optimum standard value corresponding to each mineral nutrient in trees with yields exceeding 85 kg per tree and obtain the standard deviation for each nutrient in this population of trees. Using this tool to orientate nutrient management in the orchards of the Cauca region, yield increases of 55% and 26% in N and R orchards, respectively, were recorded in the harvest from the main flowering period. Additionally, improvements in fruit weight were recorded. The results shown herein are in accordance with the reports of Salazar-García and Lazcano-Ferrat, who oriented nutrient management based on the BIK methodology and increased fruit calibers with sizes greater than 170 g by 72% of the orchard yield, using specific fertilization with doses calculated for each nutrient throughout the growth cycle of the Hass avocado [4].
Ripening heterogeneity has been reported as a severe logistical problem for marketers and results in the fruits of inconsistent quality being delivered to consumers. This phenomenon is the result of the complex avocado fruit physiology and preharvest and postharvest factors [8]. Rapid softening during ripening has been associated with C7 sugars, organic acids, and the lauric acid, stearic acid, and oleic acid contents.
Therefore, avocado-producing countries with high variability face challenges due to the primary and secondary metabolites of Hass avocados produced during fruit development being affected by the climate, harvest practices, rootstock, etc. [8,38]. Moreover, the preharvest factors and harvest indices are variable in Colombian conditions [39]. In practice, the harvest begins in low-elevation regions at a DM value close to 23%. Our results agree with those of Fuentealba et al.: at low DM values, more ripening heterogeneity occurs [40].
This is because the biological age of the fruit does not guarantee the quantity of fatty acids or other metabolites that soften the flesh. Therefore, in Cauca orchards, growers must increase their development time to ensure adequate Hass avocado ripening.
The flesh mineral content has an effect on delaying the firmness of mesocarp softness because some elements are present and associated with the cell wall structure. Previously, nutrition has been reported to play an important role in postharvest Hass avocado quality. The effect on the internal quality of some minerals has been discussed separately, as briefly described below. High levels of calcium in avocado fruits have been associated with a delay in ripening due to the effects on respiration, the impedance of the ethylene peak, greater firmness after storage, and reduction in internal defects (stem end rot, body rot, vascular browning flesh discoloration, etc.) [41]. An excess of nitrogen fertilization induces the activation of cytokinins that inhibit the production of ethylene and ABA [42], making fruit more vulnerable to fungal pathogen attack [43] and more susceptible to postharvest rot and vascular browning.
Similar to cell wall-associated calcium, boron differences might be another factor contributing to the observed ripening heterogeneity because 95% of the flesh B content is present in the cell wall and acts as a bridge between the cell wall and membrane [8]. In contrast, B-deficient tissues have greater PPO activity and accumulate more phenolic compounds, the substrates for PPO-mediated browning reactions. Increasing the K supply beyond the minimum required value may lead to K-induced deficiencies of Ca and Mg, which could cause increased diffuse discoloration and body rot severity. Attention has been given to the balance between Mg, Ca, and K cations in the fruit, as this balance seems to be more strongly associated with avocado fruit quality than the Mg content alone [7].
According to Rooyen and Bower, copper is known to activate a group of oxidizing enzymes, such as polyphenol oxidase, monophenol oxidase, laccase, and systems of oxidizing ascorbic acid [39,44]. Copper acts as a catalyst for the enzymatic systems that lead to enzymatic browning and is thought to be interrelated with zinc in various oxidation-reduction reactions. Zinc is often coordinated with copper in the various oxidation-reduction reactions that lead to browning. For the other minerals, there is a lack of knowledge of their roles in affecting the internal quality of Hass avocado fruits.
The approaches of past studies aimed to find a simple relationship (linear or nonlinear) between mineral contents and internal disorders. However, our results show that no one mineral plays the main role in affecting the internal quality of Hass avocado fruits, and the associated variabilities could be well-represented in a multivariate approach. PCA and PLS-DA were very useful because the confidence of the ellipse of the high-quality group (EB) allowed the identification of multiple vectors (variables) that cause heterogeneity, internal quality, and sensory profile differences related to the flesh composition.
After the internal disorders, the other quality challenge of Hass avocado origins is obtaining a sensory quality that is satisfactory to consumer expectations. Therefore, high sensory quality could serve as a competitive strategy to improve the success of certain avocado origins in the international market, especially in emerging avocado markets. Studies have found that the harvest season has an effect on the sensory quality of avocado fruits.
Arpaia et al. reported that likeability increased with an advancing harvest date (DM content), and their research was performed with preference sensory tests [45]. Rodríguez et al. employed a sensory profile test and showed that the discriminant descriptors related to unmature fruit were green, bitter, acid, spicy taste, and sensations, whereas flux texture, oily taste, oily texture, and sweet taste were descriptors found in fruits at high DM contents [9].
The results of this work confirmed that harvest practices had an important impact on the Hass avocado fruit quality profile. The main issue under field conditions is that farmers do not have nondestructive equipment or lack knowledge regarding what markers to measure to sort fruit and guide the harvest decisions to guarantee the robustness and sensory quality of the fruit at the destination market [46,47]. Our results show that the sensory descriptors change among localities and growth cycles and could be explained as discussed above with regards to the flesh mineral and FAME composition.
There is no information that reports the role of the mineral contents on the sensory quality of Hass avocado fruits. However, the role of the fruit mineral composition on fruit softness and mesocarp discoloration in ‘Pinkerton’ avocado fruits was studied by Rooyen and Bower, who published mineral concentrations related to low, medium, and high risks of developing internal flesh disorders [39]. The results of this work contribute not only to reporting optimal mineral ranges for reducing internal damage but also to improving the sensory profile of Hass avocados.
The flesh–fatty acid relationship is influenced by the temperature of the localities or regions where the Hass avocado is produced. This phenomenon has been found in many Hass avocado-producing countries around the world. Some studies have reported that Hass avocados produced in regions with low temperatures had greater oil contents and higher proportions of oleic acid than those grown in high-temperature areas. In contrast, fruits grown in high-temperature regions had more palmitic acid [48,49]. Ferreyra et al. found that the fatty acid proportion changed with elevation in Chile [41].
The authors reported that high oleic acid contents were related to the maximum mean temperature. Therefore, different studies have postulated the fatty acid profile as a biomarker of fruit origin. However, high variabilities exist in avocado-producing countries such as México, Colombia, Chile, and Peru, thus making such classifications difficult. The EB locality has an oleic acid content similar to the cool regions or farms from South Africa [49], New Zealand [48], and Chile [41,49], whereas the low-elevation orchard has a FAME profile similar to producing localities in Peru; Spain [50]; and California, USA [51]. Fruits grown at the R orchard at both nutrient management levels had more palmitoleic acid than fruits of other international origins (low and high elevation or temperature) and were similar to the avocados produced in Florida, USA [52]. There is a lack of information relating the fatty acid profile to the sensory quality. In this work, it is clear that the sensory analysis was influenced by the proportion of fatty acids in the samples, especially with regards to unsaturated fats.
The mouth sensory texture perception could be associated with a change in the mesocarp tissue due to enzymatic (polygalacturonase and cellulase) action during fruit ripening and the mineral and fatty acid compositions. The parenchyma tissue contains oil bodies as a finely dispersed emulsion surrounded by a thin cellulose wall [53], whereas idioblasts are specialized cells containing large oil sacs covered by a thick cellular wall.
During Hass avocado ripening, the degradation of parenchyma cell walls and the release of some oil bodies in emulsion form occur [54]. Despite the importance of the role of fatty acids in Hass avocado composition and quality, few studies have reported the role of nutrient management in modulating fatty acids. This work contributes to identifying the quality markers related to nutrient management under field conditions. Our results show the importance of having a robust fruit flesh composition, and it is necessary to consider rootstock selection, nutrition management, and orchard location to guarantee consistent quality to consumers.
It is necessary to increase the knowledge on the development of nondestructive devices, NIR applications, or other technologies focused on analyzing the discriminant biomarkers found in this work to predict the integral quality of Hass avocados and their shelf life before export. These strategies could reduce postharvest losses and satisfy consumer expectations worldwide.

5. Conclusions

Nutrient BIK management increased the fruit sizes and yields without affecting the postharvest quality. Differences in growing temperatures among localities influenced the fruit compositions, especially the fatty acid composition and postharvest internal quality. The fruit produced at low temperatures had relatively high oleic acid contents, while fruits from orchards at high growing temperatures had more palmitic, palmitoleic, and stearic fatty acids and more internal disorders. Fruits harvested at more development days ripened faster and thus had reduced internal disorder incidence rates and severities.
The multivariate approach allowed us to find a robust model for representing and following the variability in the postharvest internal avocado fruit quality independently of the harvest season, locality, and nutrient management. The PLS-DA model could be a powerful tool for classifying the internal quality of fruits in avocado-producing countries. Therefore, in countries with highly variable growing conditions and production practices, the use of destructive analyses and multivariate data analyses could reduce the heterogeneity and allow the shipment of fruits with better internal quality to the international market.

Supplementary Materials

The following supporting information can be downloaded at https://www.mdpi.com/article/10.3390/horticulturae9040460/s1. Figure S1: Variability in the dry matter (DM) content of Hass avocado fruits during harvest cycles. Figure S2: Percentage of incidence (a) and severity (b) of internal disorders. Figure S3: Logistic regression analysis of internal disorder incidence. Figure S4: Incidence of internal disorders in avocado: relative frequency in vascular browning (a), stem end rot (b), flesh discoloration (c), flesh bruising (d), flesh rots (e), and body rots (f). Figure S5: Severity of internal disorders through Hass avocado ripening for growing cycle 1 of 2021. Figure S6: Severity of internal disorders through Hass avocado ripening for growing cycle 2 of 2021. Table S1: K proportion test results regarding the incidence of internal disorders (Marascuilo procedure). Table S2: Kruskal—Wallis two-tailed test results regarding disorder severity (multiple pairwise comparisons using Dunn’s procedure with Bonferroni correction). Table S3: K proportion test results regarding the incidence of internal disorders (Marascuilo procedure comparison). Table S4: Descriptive statistics of the flesh mineral composition of Hass avocados at the RTE (ready-to-eat) stage.

Author Contributions

P.R.: Conceptualization, Methodology, Data curation, Writing—original draft, Formal analysis, Supervision, Project administration, Funding acquisition. I.S.: Methodology, Formal analysis, Writing—original draft. J.V.: Methodology, Writing—original draft. A.R.: Conceptualization, Methodology, Funding acquisition, Writing—original draft. All authors have read and agreed to the published version of the manuscript.

Funding

This research and the APC have been funded by the Sistema General de Regalías-SGR of the Department of Cauca (Colombia), under the Special Cooperation Agreement for Research No. 068 of 08/10/2018. The OCAD of the FCTeI designated the Corporación Colombiana de Investigación Agropecuaria-Agrosavia as the executing public entity of the project identified with the BPIN code 2018000100010 called “Development and validation of technologies to increase the productivity of the Hass Avocado crop in the Department of Cauca”.

Institutional Review Board Statement

Not applicable.

Informed Consent Statement

Not applicable.

Data Availability Statement

The data that support the findings of this study are available from the corresponding author upon reasonable request.

Acknowledgments

The authors express their gratitude to the orchard growers, the support team, and the pilot plant of the La Selva and Palmira Research Centers (Agrosavia) for their support in the technical execution of this study and to the Department of Cauca (Colombia) for financial funding.

Conflicts of Interest

The authors declare no conflict of interest. The funders had no role in the design of the study; in the collection, analyses, or interpretation of data; in the writing of the manuscript; or in the decision to publish the results.

References

  1. Anonymous. Avocado—World Statistics—Summer 2021 and Winter 2021–2022. Frutitrop Online 2022, 283, 98–110. [Google Scholar]
  2. Selladurai, R.; Awachare, C.M. Nutrient Management for Avocado (Persea Americana Miller). J. Plant Nutr. 2020, 43, 138–147. [Google Scholar] [CrossRef]
  3. Salazar, S.; Lazcano, I. Identifiying Fruit Mineral Removal Differences in Four Avocado Cultivars. Better Crop. Int. 2001, 15, 28–31. [Google Scholar]
  4. Salazar, S.; Lazcano, I. La Fertilizacion En “Sitio Especifico” Incrementa Los Rendimientos Y El Tamaño De La Fruta Del Aguacate En Mexico. Actas V Congr. Mund. Aguacate 2003, 35, 373–379. [Google Scholar]
  5. Hofman, P.J.; Vuthapanich, S.; Whiley, A.W.; Klieber, A.; Simons, D.H. Tree Yield and Fruit Minerals Concentrations Influence “Hass” Avocado Fruit Quality. Sci. Hortic. 2002, 92, 113–123. [Google Scholar] [CrossRef]
  6. Hofman, P. (Ed.) Optimising the Posharvest Qualities of Hass Avocado through Improved Calcium Nutrition, 1st ed.; Horticultural Australia Ltd: Sydney, Australia, 2007; ISBN 0734114389. [Google Scholar]
  7. Joyce, D.C. Improved Fruit Quality and Robustness in Avocado Supply Chains (Mineral Nutrition), 7th ed.; Horticulture Innovation: Sydney, Australia, 2021; ISBN 9780734146854. [Google Scholar]
  8. Hernández, I.; Fuentealba, C.; Olaeta, J.A.; Lurie, S.; Defilippi, B.G.; Campos-Vargas, R.; Pedreschi, R. Factors Associated with Postharvest Ripening Heterogeneity of “Hass” Avocados (Persea Americana Mill). Fruits 2016, 71, 259–268. [Google Scholar] [CrossRef] [Green Version]
  9. Rodríguez-Fonseca, P.E.; Martínez-álvarez, O.L.; Ocampo-Arango, C.M.; Ardila-Castañeda, M.P.; Escobar-Calderón, J.V. Effect of Harvest Index and Storage Duration on Sensory Quality of Hass Avocado Grown in Colombia. DYNA 2021, 88, 131–139. [Google Scholar] [CrossRef]
  10. Hausch, B.J.; Arpaia, M.L.; Campisi-Pinto, S.; Obenland, D.M. Sensory Characterization of Two California-Grown Avocado Varieties (Persea Americana Mill.) over the Harvest Season by Descriptive Analysis and Consumer Tests. J. Food Sci. Wiley 2021, 86, 4134–4147. [Google Scholar] [CrossRef]
  11. Donetti, M.; Terry, L.A. Biochemical Markers Defining Growing Area and Ripening Stage of Imported Avocado Fruit Cv. Hass. J. Food Compos. Anal. 2014, 34, 90–98. [Google Scholar] [CrossRef]
  12. Allen, R.G.; Pruitt, W.O.; Wright, J.L.; Howell, T.A.; Ventura, F.; Snyder, R.; Itenfisu, D.; Steduto, P.; Berengena, J.; Yrisarry, J.B.; et al. A Recommendation on Standardized Surface Resistance for Hourly Calculation of Reference ETo by the FAO56 Penman-Monteith Method. Agric. Water Manag. 2006, 81, 1–22. [Google Scholar] [CrossRef]
  13. Kenworthy, A. Leaf Analysis as an Aid in Fertilizing Orchards. In Soil Testing and Plant Analysis; Walsh, L.M., Beaton, J.D., Eds.; Soil Science Society of America: Madison, WI, USA, 1973; pp. 381–392. [Google Scholar]
  14. FAO Codex Alimentarius CXS-197-1995; Normas Internacionales de Los Alimentos. IFFO: London, UK, 1995; pp. 3–4.
  15. Waissbluth, R.J.; Valenzuela, J. Determinación del porcentaje mínimo de materia seca para autorizar la cosecha de paltas cv. Hass para ser exportadas. In Proceedings of the VI World Avocado Congress, Viña del Mar, Chile, 12–16 November 2007; pp. 957–978. [Google Scholar]
  16. AOAC. Official Method of Analysis, 18th ed.; AOAC: Washington, DC, USA, 2005. [Google Scholar]
  17. White, A.; Woolf, A.; Hofman, P.; Arpaia, M.L. The International Avocado Quality; Postharves, White, A., Woolf, A., Research, P.F., Hofman, P., Fisheries, Q.P.I., Arpaia, M.L., Eds.; Plant & Food Research: Auckland, New Zealand, 2009. [Google Scholar]
  18. ISO (4121); Sensory Analysis-Guidelines for the Use of Quantitative Response Scales. Sensory Analysis. Technical Committee, I. 34/SC 12. ISO: Geneva, Switzerland, 2003; Volume 34.
  19. Obenland, D.; Collin, S.; Sievert, J.; Negm, F.; Arpaia, M.L. Influence of Maturity and Ripening on Aroma Volatiles and Flavor in ‘Hass’ Avocado. Postharvest Biol. Technol. 2012, 71, 41–50. [Google Scholar] [CrossRef]
  20. Escobar, J.V.; Cortés, M.; Correa, G.; Rondón, T.; Rodríguez, P. ‘Hass’ Avocado Internal Disorders under Simulated Export Conditions and Its Relationship with Flesh Mineral Content and Preharvest Variables. Horticulturae 2021, 7, 77. [Google Scholar] [CrossRef]
  21. Mckean, S. Thinking with the Saint: The Miracle of Saint Januarius of Naples and Science in Early Modern Europe. Early Sci. Med. 1993, 19, 133–173. [Google Scholar] [CrossRef]
  22. Gamble, J.; Harker, F.R.; Jaeger, S.R.; White, A.; Bava, C.; Beresford, M.; Stubbings, B.; Wohlers, M.; Hofman, P.J.; Marques, R.; et al. The Impact of Dry Matter, Ripeness and Internal Defects on Consumer Perceptions of Avocado Quality and Intentions to Purchase. Postharvest Biol. Technol. 2010, 57, 35–43. [Google Scholar] [CrossRef]
  23. Matsui, T.; Kamata, T.; Koseki, S.; Koyama, K. Development of Automatic Detection Model for Stem-End Rots of ‘Hass’ Avocado Fruit Using X-Ray Imaging and Image Processing. Postharvest Biol. Technol. 2022, 192, 111996. [Google Scholar] [CrossRef]
  24. Eslava, J. Some Particular Climatic Features of the Colombian Pacific Region. Atmósfera 1994, 17, 45–63. [Google Scholar]
  25. Mejia, F.; Mesa, O.; Poveda, G.; Velez, J.; Hoyos, C.; Mantilla, R.; Barco, J.; Cuartas, A.; Montoya, M.; Botero, B. Distribución Espacial y Ciclos Anual y Semianual de La Precipitación En Colombia. DYNA 1999, 127, 7–26. [Google Scholar]
  26. León, G.E.; Zea, J.A.; Eslava, J.A. Circulación General Del Tropico y La Zona de Confluencia Intertropical En Colombia. Meteorol. Colomb. 2000, 1, 31–38. [Google Scholar]
  27. Poveda, G.; Vélez, J.I.; Mesa, O.J.; Cuartas, A.; Barco, J.; Mantilla, R.I.; Mejía, J.F.; Hoyos, C.D.; Ramírez, J.M.; Ceballos, L.I.; et al. Linking Long-Term Water Balances and Statistical Scaling to Estimate River Flows along the Drainage Network of Colombia. J. Hydrol. Eng. 2007, 12, 4–13. [Google Scholar] [CrossRef] [Green Version]
  28. Poveda, G.; Álvarez, D.M.; Rueda, Ó.A. Hydro-Climatic Variability over the Andes of Colombia Associated with ENSO: A Review of Climatic Processes and Their Impact on One of the Earth’s Most Important Biodiversity Hotspots. Clim. Dyn. 2011, 36, 2233–2249. [Google Scholar] [CrossRef]
  29. Whiley, A.W.; Chapman, K.R.; Saranah, J.B. Water Loss by Floral Structures of Avocado (Persea Americana Cv. Fuerte) during Flowering. Aust. J. Agric. Res. 1988, 39, 457–467. [Google Scholar] [CrossRef] [Green Version]
  30. Blanke, M.M.; Lovatt, C.J. Anatomy and Transpiration of the Avocado Inflorescence. Ann. Bot. 1993, 71, 543–547. [Google Scholar] [CrossRef]
  31. Lahav, E.; Whiley, A.W.; Turner, D.W. Irrigation and Mineral Nutrition. In Avocado: Botany, Production and Uses; Schaffer, B., Wolstenholme, B.N., Whiley, A.W., Eds.; CABI: London, UK, 2013; pp. 301–341. [Google Scholar]
  32. Schaffer, B.; Gil, P.; Mickelbart, M.V.; Whiley, A.W. Ecophysiology. In Avocado: Botany, Production and Uses; Schaffer, B., Wolstenholme, B.N., Whiley, A.W., Eds.; CABI: London, UK, 2013; Volume 1, pp. 168–199. ISBN 9788578110796. [Google Scholar]
  33. Silber, A.; Naor, A.; Cohen, H.; Bar-Noy, Y.; Yechieli, N.; Levi, M.; Noy, M.; Peres, M.; Duari, D.; Narkis, K.; et al. Avocado Fertilization: Matching the Periodic Demand for Nutrients. Sci. Hortic. 2018, 241, 231–240. [Google Scholar] [CrossRef]
  34. Cantuarias-Avilés, T.; da Silva, S.R.; Angolini, S.F.; do Amaral Brogio, B.; Baptista, E.G.; Micheletti, L.B. Water Status and Productivity of “Hass” Avocado Trees in Response to Supplemental Irrigation during Winter. Pesqui. Agropecu. Bras. 2019, 54, e00237. [Google Scholar] [CrossRef]
  35. García-martínez, R. Yield, Quality and Post-Harvest Behavior of ‘Hass’ Avocado Fruits of Orchards with Different Fertilization. Rev. Mex. Cienc. Agrícolas 2021, 12, 205–218. [Google Scholar] [CrossRef]
  36. Maldonado-Torres, R.; Álvarez-Sánchez, M.E.; Almaguer-Vargas, G.; Barrientos-Priego, A.F.; García-Mateos, R. Estándares Nutricionales Para Aguacatero ‘HASS’. Rev. Chapingo Ser. Hortic. 2007, 13, 103–108. [Google Scholar] [CrossRef]
  37. Mariscal, J.L.C.; Sánchez, M.E.Á.; Torres, R.M.; Gustavo, A.V. Aplicación de Abonos Orgánicos En El Rendimiento y Desarrollo Radicular En El Cultivo de Aguacate. Rev. Mex. De Cienc. Agrícolas 2020, 11, 263–274. [Google Scholar]
  38. Medina-Carrillo, R.E.; Salazar-García, S.; Bonilla-Cárdenas, J.A.; Herrera-González, J.A.; Ibarra-Estrada, M.E.; Álvarez-Bravo, A. Secondary Metabolites and Lignin in ‘Hass’ Avocado Fruit Skin during Fruit Development in Three Producing Regions. HortScience 2017, 52, 852–858. [Google Scholar] [CrossRef]
  39. Rooyen, V.Z.; Bower, J.P. The Role of Fruit Mineral Composition on Fruit Softness and Mesocarp Discolouration in “Pinkerton” Avocado (Persea Americana Mill.). J. Hortic. Sci. Biotechnol. 2005, 80, 793–799. [Google Scholar] [CrossRef]
  40. Fuentealba, C.; Hernández, I.; Olaeta, J.A.; Defilippi, B.; Meneses, C.; Campos, R.; Lurie, S.; Carpentier, S.; Pedreschi, R. New Insights into the Heterogeneous Ripening in Hass Avocado via LC–MS/MS Proteomics. Postharvest Biol. Technol. 2017, 132, 51–61. [Google Scholar] [CrossRef]
  41. Ferreyra, R.; Sellés, G.; Saavedra, J.; Ortiz, J.; Zúñiga, C.; Troncoso, C.; Rivera, S.A.; González-Agüero, M.; Defilippi, B.G. Identification of Pre-Harvest Factors That Affect Fatty Acid Profiles of Avocado Fruit (Persea Americana Mill.) Cv. ‘Hass’ at Harvest. S. Afr. J. Bot. 2016, 104, 15–20. [Google Scholar] [CrossRef]
  42. Ferguson, I.; Volz, R.; Woolf, A. Preharvest Factors Affecting Physiological Disorders of Fruit. Postharvest Biol. Technol. 1999, 15, 255–262. [Google Scholar] [CrossRef]
  43. Drori, N.; Kramer-Haimovich, H.; Rollins, J.; Dinoor, A.; Okon, Y.; Pines, O.; Prusky, D. External PH and Nitrogen Source Affect Secretion of Pectate Lyase by Colletotrichum Gloeosporioides. Appl. Environ. Microbiol. 2003, 69, 3258–3262. [Google Scholar] [CrossRef] [Green Version]
  44. Van Rooyen, Z.; Bower, J.P. The Role of Fruit Mineral Composition, Phenolic Concentration and Polyphenol Oxidase Activity on Mesocarp Discolouration in ‘Pinkerton’. S. Afr. Avocado Grow. Assoc. Yearb. 2003, 26, 72–75. [Google Scholar]
  45. Arpaia, M.L.; Collin, S.; Sievert, J.; Obenland, D. Influence of Cold Storage Prior to and after Ripening on Quality Factors and Sensory Attributes of ‘Hass’ Avocados. Postharvest Biol. Technol. 2015, 110, 149–157. [Google Scholar] [CrossRef]
  46. Rodriguez, P.; Henao, J.C.; Correa, G.; Aristizabal, A. Identification of Harvest Maturity Indicators for ‘Hass’ Avocado Adaptable to Field Conditions. Horttechnology 2018, 28, 815–821. [Google Scholar] [CrossRef] [Green Version]
  47. Metlenkin, D.A.; Platov, Y.T.; Platova, R.A.; Zhirkova, E.V.; Teneva, O.T. Non-Destructive Identification of Defects and Classification of Hass Avocado Fruits with the Use of a Hyperspectral Image. Agron. Res. 2022, 20, 326–340. [Google Scholar] [CrossRef]
  48. Rozenstvet, O.A.; Saksonov, S.V.; Filin, V.R.; Dembitsky, V.M. Seasonal Changes of Lipid Content in the Leaves of Some Ferns. Physiol. Plant. 2000, 113, 59–63. [Google Scholar] [CrossRef]
  49. Kaiser, C.; Wolstenholme, B.N. Aspects of Delayed Harvest of “Haas” Avocado (Persea Americana Mill.) Fruit in a Cool Subtropical Climate. I.Fruit Lipid and Fatty Acid Accumulation. J. Hortic. Sci. 1994, 69, 437–445. [Google Scholar] [CrossRef]
  50. Pedreschi, R.; Hollak, S.; Harkema, H.; Otma, E.; Robledo, P.; Westra, E.; Somhorst, D.; Ferreyra, R.; Defilippi, B.G. Impact of Postharvest Ripening Strategies on ‘Hass’ Avocado Fatty Acid Profiles. South Afr. J. Bot. 2016, 103, 32–35. [Google Scholar] [CrossRef]
  51. Hausch, B.J.; Arpaia, M.L.; Kawagoe, Z.; Walse, S.; Obenland, D. Chemical Characterization of Two California-Grown Avocado Varieties (Persea Americana Mill.) over the Harvest Season with an Emphasis on Sensory-Directed Flavor Analysis. J. Agric. Food Chem. 2020, 68, 15301–15310. [Google Scholar] [CrossRef] [PubMed]
  52. Pisani, C.; Ritenour, M.A.; Stover, E.; Plotto, A.; Alessandro, R.; Kuhn, D.N.; Schnell, R.J. Postharvest and Sensory Evaluation of Selected ‘Hass’ × ‘Bacon’ and ‘Bacon’ × ‘Hass’ Avocado Hybrids Grown in East-Central Florida. HortScience 2017, 52, 880–886. [Google Scholar] [CrossRef] [Green Version]
  53. Yang, S.; Hallett, I.; Rebstock, R.; Oh, H.E.; Kam, R.; Woolf, A.B.; Wong, M. Cellular Changes in “Hass” Avocado Mesocarp During Cold-Pressed Oil Extraction. J. Am. Oil Chem. Soc. 2018, 95, 229–238. [Google Scholar] [CrossRef]
  54. Cervantes-Paz, B.; Yahia, E.M. Avocado Oil: Production and Market Demand, Bioactive Components, Implications in Health, and Tendencies and Potential Uses. Compr. Rev. Food Sci. Food Saf. 2021, 20, 4120–4158. [Google Scholar] [CrossRef] [PubMed]
Figure 1. Schematic representation of the experimental design and postharvest quality analysis. Locality (orchard): R, N. BIK: Balanced Indices of Kenworthy. P: nutrient management of the farmer. A: Nutrient management based on the BIK. Harvest cycle: 1. Harvest from the intermediate flowering period. 2. Harvest from the main flowering period. FAMEs: fatty acid methyl esters. AAS: Atomic absorption spectroscopy. ICP: Inductively Coupled Plasma.
Horticulturae 09 00460 g001
Figure 2. Climate conditions of the Hass avocado experimental zones corresponding to the following variables: (a) maximum temperature; (b) minimum temperature; and (c) evapotranspiration. O-EB: Orchard EB. O-N: Orchard N. O-R: Orchard R. ETo: evapotranspiration.
Horticulturae 09 00460 g002
Figure 3. Yield (production average, kg/per tree) of Hass avocados in each orchard using 2 nutrient management practices during 2 production cycles. Different letters represent significant differences (p < 0.05) as determined using ANOVA and Tukey’s post hoc test. T: treatments. Orchard: N and R. P: nutrient management of the farmer. A: Nutrient management based on the BIK standards. Harvest cycles: 1. Harvest from the intermediate flowering period. 2. Harvest from the main flowering period.
Horticulturae 09 00460 g003
Figure 4. Fruit harvest size classification results according to the Codex Stand 197, 1995. (a) R orchard and (b) N orchard. P: Nutrient management of the farmer. A: Nutrient management program based on the BIK standards. 1. Harvest from the intermediate flowering period. 2. Harvest from the main flowering period.
Horticulturae 09 00460 g004
Figure 5. Ripening heterogeneity results of Hass avocados. Orchards: EB, N, and R. A: Nutrient management-based program on the Balanced Indices of Kenworthy (BIK) standards. P: Nutrient management of the farmer. 1. Harvest from the intermediate flowering period. 2. Harvest from the main flowering period. DRTE: Days to ready-to-eat. The crosses represent the mean values, the yellow dots indicate the minimum and maximum values, and the green dots and brown asterisks denote outliers.
Horticulturae 09 00460 g005
Figure 6. Principal component analysis (PCA) results of the mineral and FAME contents grouped by the samples: (a) Score plot; (b) Loading plots. Blue dots: active variables. Orchards: EB, N, and R. A: Nutrient management based on the Balanced Indices of Kenworthy (BIK). P: Nutrient management of the farmer. 1. Harvest from the intermediate flowering period. 2. Harvest from the main flowering period. Sat/Un (saturated and unsaturated relationship); C14:0 (myristic acid); C16:0 (palmitic acid), C16:1 (palmitoleic acid), C18:0 (stearic acid); C18:1 (oleic acid), C18:2 (linoleic acid), C18:3 (linolenic acid). C20:1 (arachidic acid), O:I (oleic and linoleic fatty acids relationship).
Horticulturae 09 00460 g006
Figure 7. Partial least squares discriminant analysis (PLS-DA) results of the fatty acid and mineral contents grouped by orchard: Score plot (a); and loading plots (b). R2 = 88.9 (3 factors). Orchards: EB, N, and R. A: Nutrient management based on the Balanced Indices of Kenworthy (BIK). P: Nutrient management of the farmer. 1. Harvest from the intermediate flowering period. 2. Harvest from the main flowering period. Sat/Un:(saturated and unsaturated relationship); C14:0 (myristic acid); C16:0 (palmitic acid), C16:1 (palmitoleic acid), C18:0 (stearic acid); C18:1 (oleic acid), C18:2 (linoleic acid), C18:3 (linolenic acid). C20:1 (arachidic acid), O:I (oleic and linoleic fatty acids relationship).
Horticulturae 09 00460 g007
Figure 8. Sensory profile of fruits from different orchards under different nutrient management (P and A) and growth cycle (1 and 2) conditions. Orchards: EB, N, and R. A: Nutrient management based on the Balanced Indices of Kenworthy (BIK). P: Nutrient management of the farmer. 1. Harvest from the intermediate flowering period. 2. Harvest from the main flowering period.
Horticulturae 09 00460 g008
Table 1. Ranges of chemical contents of the soils in the experimental avocado orchards.
MineralR
Min–Max
N
Min–Max
EB
Min–Max
Depth (cm)0.450.450.45
pH5.42 ± 0.105.50 ± 0.065.12 ± 0.05
EC (ds/m)0.33 ± 0.100.35 ± 0.061.05 ± 0.11
OM (%)12.36 ± 0.4714.85 ± 0.8812.53 ± 0.69
P *4.69 ± 0.725.45 ± 0.7037.79 ± 5.08
S *67.03 ± 7.475.13 ± 7.930.52 ± 1.83
Mg **0.97 ± 0.150.99 ± 0.041.64 ± 0.27
Ca **2.87± 0.403.90 ± 0.54.04 ± 0.61
K **0.62 ± 0.090.44 ± 0.120.62 ± 0.05
Na **0.09 ± 0.0030.08 ± 0.0080.10 ± 0.001
CEC **4.64 ± 1.005.29 ± 0.66.98 ± 0.82
B *0.22 ± 0.040.26 ± 0.030.33 ± 0.06
Mn *2.39 ± 0.302.19 ± 0.2013.05 ± 0.88
Cu *2.49 ± 0.900.69 ± 0.205.65 ± 0.41
Fe *101.95 ± 2.7280.20 ± 5.60309.32 ± 22.23
Zn *1.54 ± 0.203.76 ± 1.208.56 ± 1.35
Soil textureSLSLSL
R: Orchard R. N: Orchard N. EB: O Orchard EB. EC: electric conductivity. OM: organic matter. CEC: cation exchange capacity. SL: sandy loam. * = mg/kg, ** = meq/100 g.
Table 2. Composition of fatty acids (% fatty acids on the total fatty acid methyl ester—FAMEs—content) in the three localities studied.
Fatty AcidsOrchards
RNEB
Saturated27.531 ± 0.547 a24.465 ± 0.489 b19.017 ± 1.262 c
Monounsaturated57.093 ± 1.207 b57.062 ± 1.079 b71.453 ± 2.787 a
Polyunsaturated15.377 ± 0.482 a13.901 ± 0.431 a9.693 ± 1.114 b
Unsaturated72.469 ± 1.443 b70.963 ± 1.291 b81.148 ± 3.333 a
Sat/Un0.381 ± 0.008 a0.349 ± 0.007 a0.235 ± 0.018 b
C14:00.199 ± 0.046 a0.204 ± 0.041 a0.131 ± 0.107 a
C16:026.127 ± 0.327 a24.174 ± 0.293 b17.340 ± 0.756 c
C16:112.012 ± 0.243 a10.103 ± 0.217 b7.043 ± 0.561 c
C18:00.599 ± 0.118 a0.866 ± 0.106 a0.789 ± 0.274 a
C18:144.883 ± 0.548 c49.498 ± 0.490 b64.164 ± 1.265 a
C18:214.371 ± 0.337 a13.436 ± 0.302 a9.177 ± 0.779 b
C18:31.043 ± 0.035 a1.008 ± 0.031 a0.708 ± 0.080 b
C20:10.139 ± 0.015 a0.168 ± 0.013 a0.158 ± 0.034 a
O:L3.225 ± 0.117 c3.748 ± 0.105 b7.096 ± 0.271 a
Orchards: R; N, and EB. Sat/Un (saturated and unsaturated relationship); C14:0 (myristic acid); C16:0 (palmitic acid), C16:1 (palmitoleic acid), C18:0 (stearic acid); C18:1 (oleic acid), C18:2 (linoleic acid), C18:3 (linolenic acid). C20:1 (arachidic acid), O:I (oleic and linoleic fatty acids relationship). The same letter in each row represents that there are no statistical differences between orchards (Tukey test, p < 0.05). Results are the average (n = 40) ± standard error.
Disclaimer/Publisher’s Note: The statements, opinions and data contained in all publications are solely those of the individual author(s) and contributor(s) and not of MDPI and/or the editor(s). MDPI and/or the editor(s) disclaim responsibility for any injury to people or property resulting from any ideas, methods, instructions or products referred to in the content.

