Article

Development, Verification, and Analysis of Simple Mathematical Model of Lettuce Productivity under Different Light Conditions

Department of Biophysics, N. I. Lobachevsky State University of Nizhny Novgorod, 603950 Nizhny Novgorod, Russia
*
Author to whom correspondence should be addressed.
Horticulturae 2023, 9(12), 1259; https://doi.org/10.3390/horticulturae9121259
Submission received: 27 October 2023 / Revised: 17 November 2023 / Accepted: 22 November 2023 / Published: 23 November 2023
(This article belongs to the Special Issue LED Lighting to Control Plants’ Growth and Development)

Abstract

:
Lettuce is an important agricultural plant which is often cultivated under artificial illumination including light of light emitting diodes (LEDs). Spectrum and intensity of used illumination and duration of photoperiod can strongly influence a final lettuce biomass; their effects can be interacted. It means that search of optimal light conditions is complicated problem for experimental investigations because numerous combinations of light conditions should be analyzed. A mathematical model of lettuce productivity can provide the potential tool for intensification of this search; earlier, we preliminarily proposed the minimal model of lettuce productivity under the LED illumination. The aim of the current work was further development, verification, and analysis of the simple mathematical model of the lettuce productivity. Dry weight of a lettuce leaf rosette was used as the main variable of the model; its changes were described as function of difference between production of biomass through assimilation and its consumption through respiration. The model was quantitively parameterized and verified on basis of our previous experimental works devoted to influence of parameters of the LED illumination on lettuce characteristics. It was shown well correspondence between experimental and simulated results. Further analysis of the developed model predicted optimal illumination conditions of the lettuce cultivation. Particularly, it showed a positive influence of gradual and step increase of the light intensity on final biomass of cultivated lettuce plants. Thus, the developed model can be used as the tool for the theoretical prediction of optimal light conditions for the lettuce cultivation.

1. Introduction

Illumination conditions are an important factor to control plant productivity in greenhouses [1,2] because photosynthesis uses light as an energy source [3,4,5,6], can be regulated by parameters of illumination [7,8,9,10,11,12], and is suppressed by light with high intensity [13,14,15,16]. As a result, light emitting diodes (LEDs) providing light with specific narrow spectral bands and with controlled time regime and intensity are a perspective tool of the plant cultivation under artificial illumination [17,18]. There are numerous works (see, e.g., reviews [17,18,19]) devoted to investigation of influence of various conditions of illumination by LEDs on biomass, morphology, photosynthesis, biochemical composition, and other characteristics in different agricultural plants. However, effects of conditions of LED illumination on morphological, physiological, and biochemical characteristics of plants can be strongly varied and dependent on plant species and stages of their life cycle as well as on spectrum, intensity, and photoperiod of illumination [18]; the variability restricts using LEDs in the plant cultivation and requires extensive investigations of these effects under different illumination conditions in specific species and cultivars of plants.
Lettuce (Lactuca sativa L.), which is widely cultivated under artificial illumination, is the important object of the investigations of influence of illumination by LEDs on plant characteristics [20,21,22,23,24]; spectrum, intensity, and photoperiod of this illumination strongly influence lettuce plants. Particularly, it is known [20,21,22,25] that illumination with increased fraction of the blue light negatively influences the dry weight (DW), photosynthetic light use efficiency, and linear electron flow and positively influences the cyclic electron flow, content of chlorophyll and carotenoids, stomata conductance, and dark respiration; illumination with increased fraction of the red light induces opposite changes. Increasing light intensity stimulates the biomass production and photosynthetic CO2 assimilation (Ahv), increases carotenoid content and stomata conductance, and decreases the non-photochemical quenching of fluorescence and chlorophyll content [26,27,28]. Influence of photoperiod on lettuce plant is intricate: in accordance with few works (e.g., [29]), increasing photoperiod weakly influences the fresh weight (FW), DW and leaf area; in contrast, series of the works [28,30,31] shows that increasing photoperiod significantly increases these plant characteristics.
As a result, search of optimal illumination conditions for the lettuce cultivation can be restricted by necessity of analysis of great number of combinations of light characteristics (spectra, intensities, photoperiods, and, maybe, their long-term changes at the cultivation). The daily light integral (DLI), which is quantity of photons per area for one day, reflects both photoperiod and light intensity and can be linearly related to FW and DW in lettuce [32]; it means that DLI can be potentially used for prediction of the lettuce biomass production under different illumination conditions. However, more accurate analysis shows [30,32,33,34] that changes in the light intensity and photoperiod can influence the lettuce productivity at same DLI. Thus, development of approaches and tools for prediction of the plant productivity under different light conditions remains the topical problem for the lettuce cultivation.
Development of mathematical models of the lettuce productivity can provide this tool because the models can be used for fast analysis of efficiency of specific illumination conditions for the plant cultivation. There are number of mathematical models describing productivity of agricultural plants at different spatial scales [35,36,37,38,39,40]: individual plants, greenhouses, agro-ecosystems, and others. These models are often based on complex description of processes related to productivity (see, e.g., reviews [35] or [40]) including description of photosynthesis, respiration, biomass production, and leaf forming. Particularly, the Farquhar–von Caemmerer–Berry model [41,42,43], which is often used for simulation of the CO2 assimilation in various photosynthesizing systems (e.g., in leaves and canopy [44,45,46,47,48]) under action of different environmental factors (e.g., temperature [42,43,44,49,50]), is the important tool for productivity simulation [39,51,52,53].
However, using this model requires estimation of numerous parameters (e.g., the Farquhar–von Caemmerer–Berry model should be combined with the model of CO2 fluxes through stomata and through mesophyll [47,50,52]; i.e., specific parameters of both models should be estimated for simulation). It makes difficult parameterization of the model to describe plant of specific species (particularly, lettuce) and specific cultivars; as a result, using minimal photosynthetic models [31,54] and simple productivity descriptions seem to be more effective for development of theoretical tools of prediction of the lettuce biomass under different light conditions.
Earlier, we developed the simple model of the lettuce productivity (increasing DW and FW of leaf rosette), which qualitatively described influence of the light intensity and photoperiod on this productivity [31]. The model was based on description of the biomass production through photosynthesis and its consumption through respiration. However, the developed model did not consider series of important points [31] including values of light absorption by leaves, fraction of synthesized biomass distributed to roots, and transport of organic compounds from seeds to leaves. As a result, the developed model could not predict DW and FW of the leaf rosette in lettuce plants in quantitative manner [31].
Thus, the current work was devoted to further development of the simple model of the lettuce productivity under different light conditions (on example of LED illumination) including its additional parameterization (mainly, on basis of the work [31]), verification (on basis of the works [25,31]), and search of optimal LED light conditions for the lettuce cultivation. Both works investigated green-leaved lettuce (cultivar “Azart”) which was cultivated under the combined illumination by white, blue, and red LEDs. Excluding the illumination conditions, the lettuce cultivation was identical in both works (see [25,31]). Plants were grown in pots with mineral wool under about 25 °C and maximal irrigation; solution of fertilizer (the Medium Flora Series®, Terra Aquatica, Fleurance, France) was used for the plant irrigation. Several pots were removed from the experiments in 18th, 25th, and 32nd days to estimate of FW and DW of the leaf rosettes; DW was estimated after 6 h of drying at 100 °C. The green area per plant (S) was estimated on basis of photos of pots with lettuce plants.

2. Development of the Lettuce Productivity Model

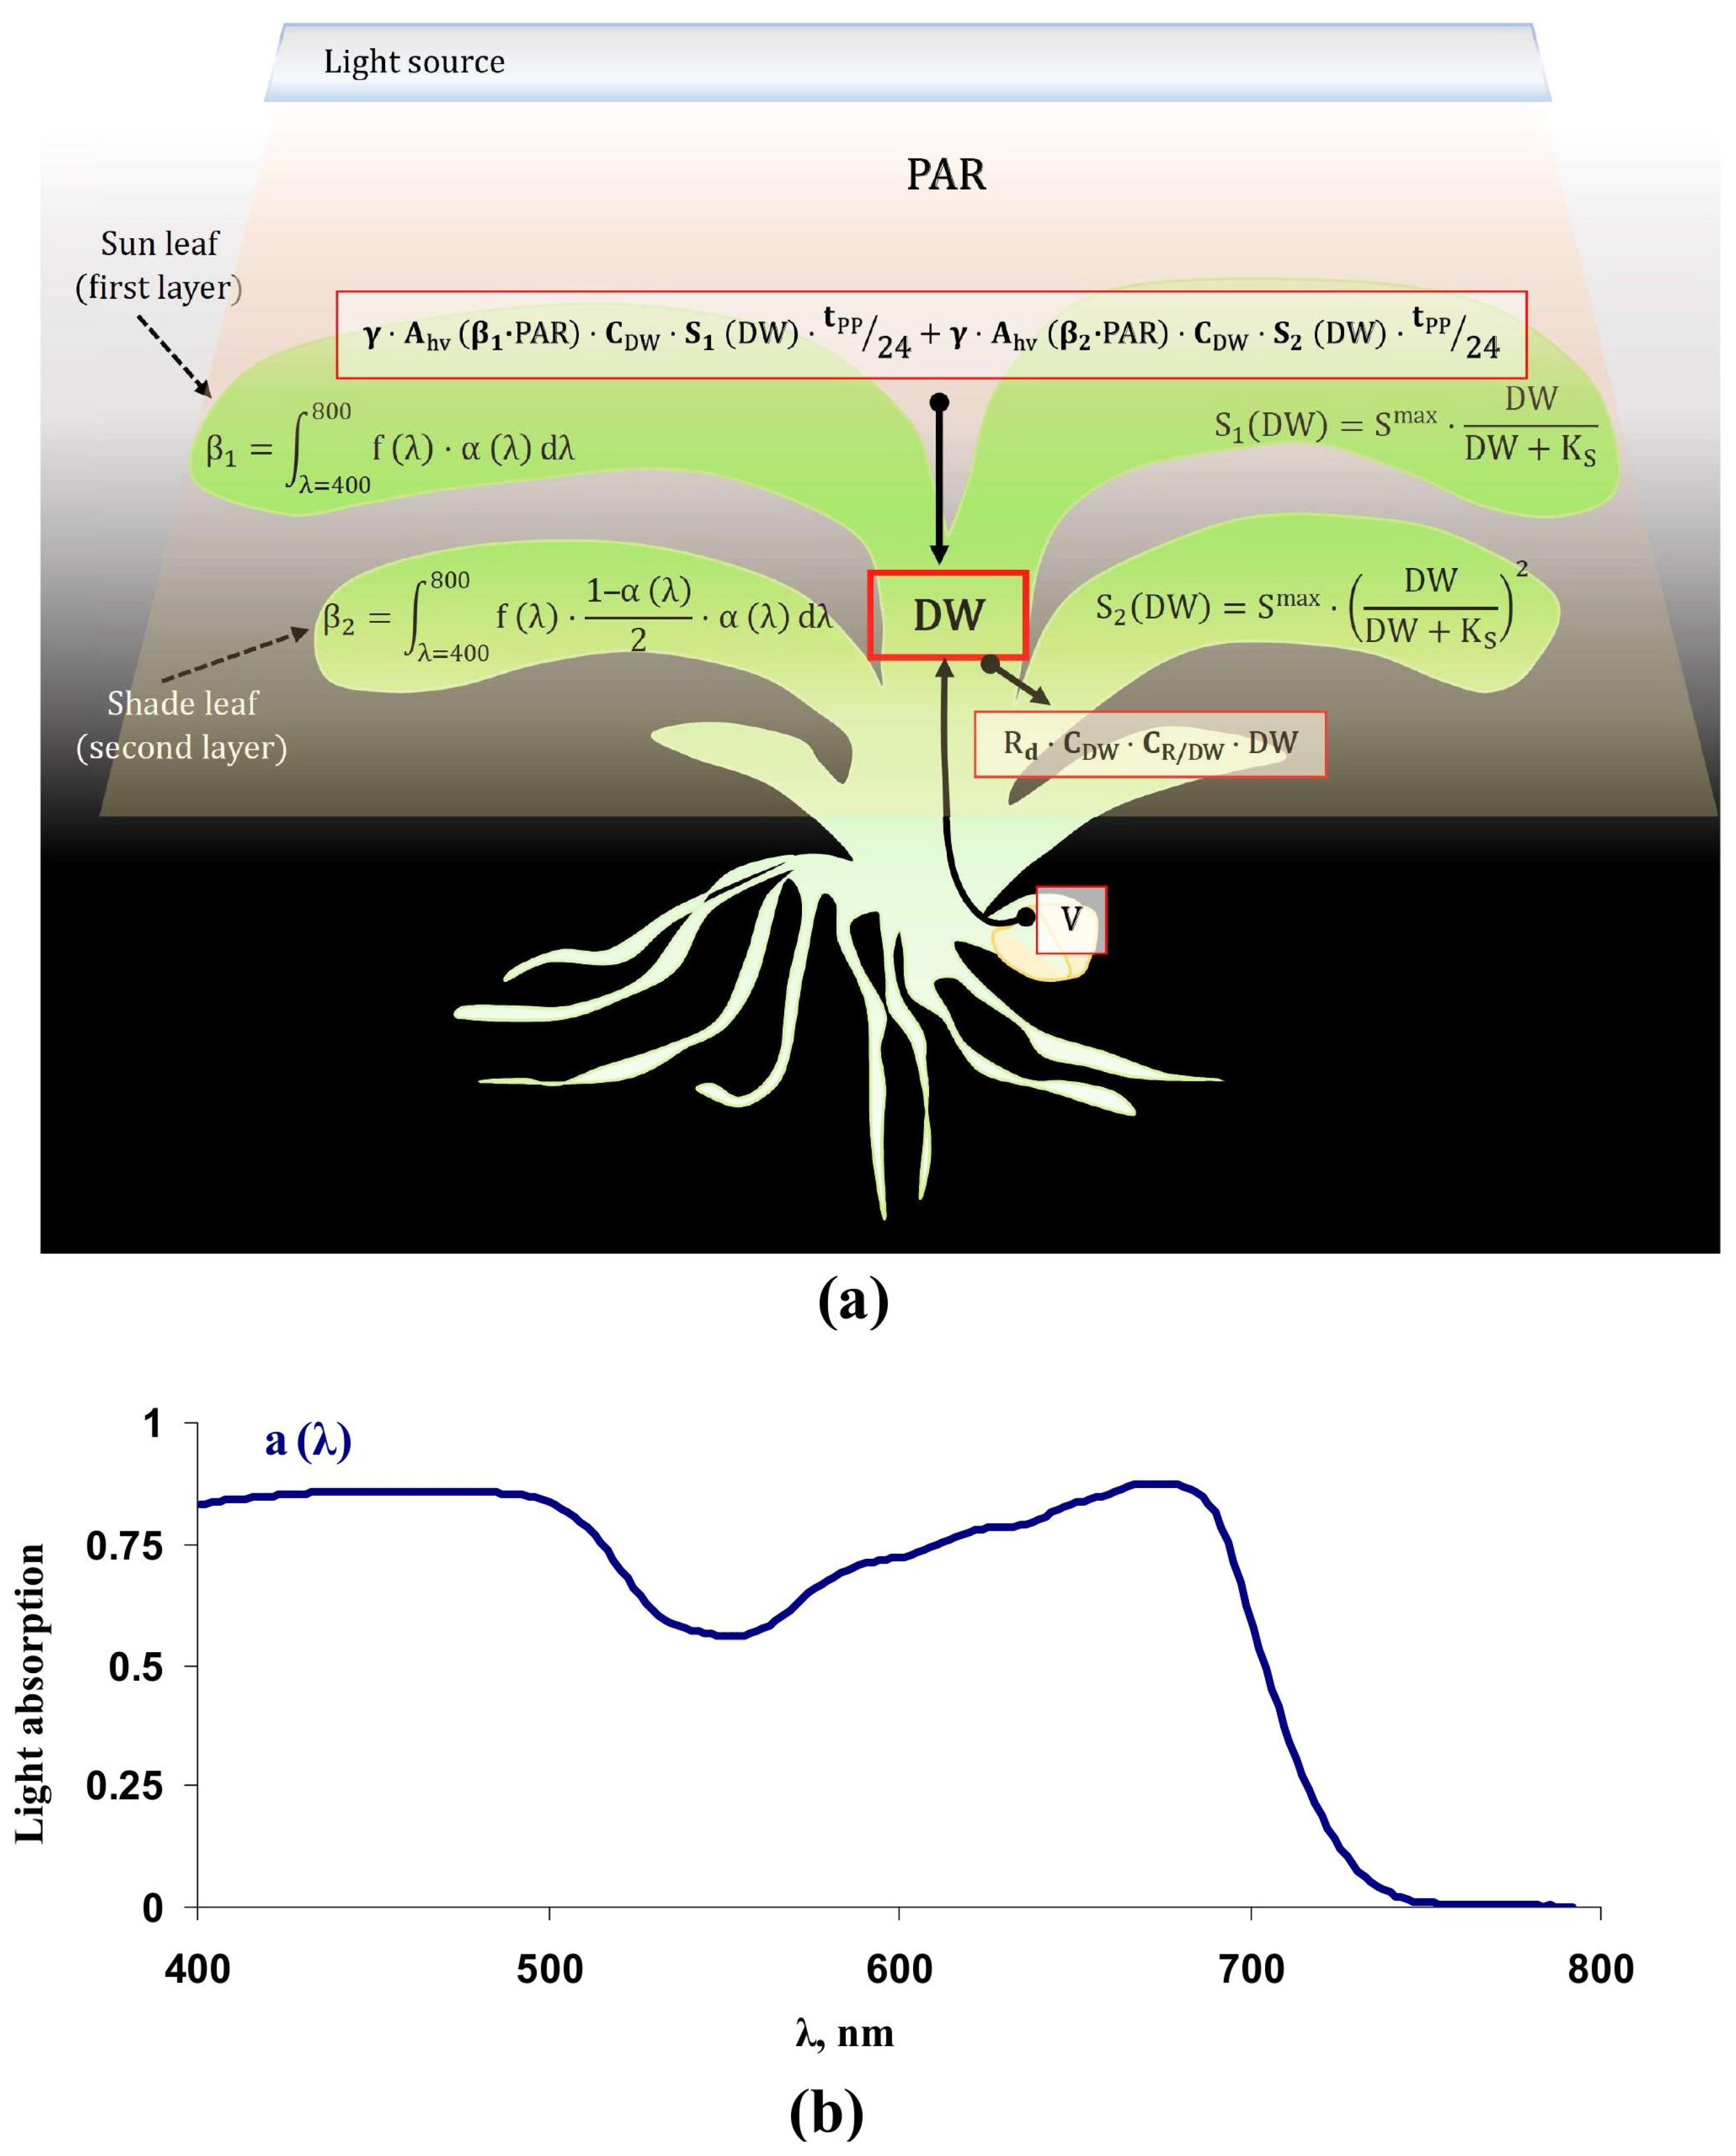
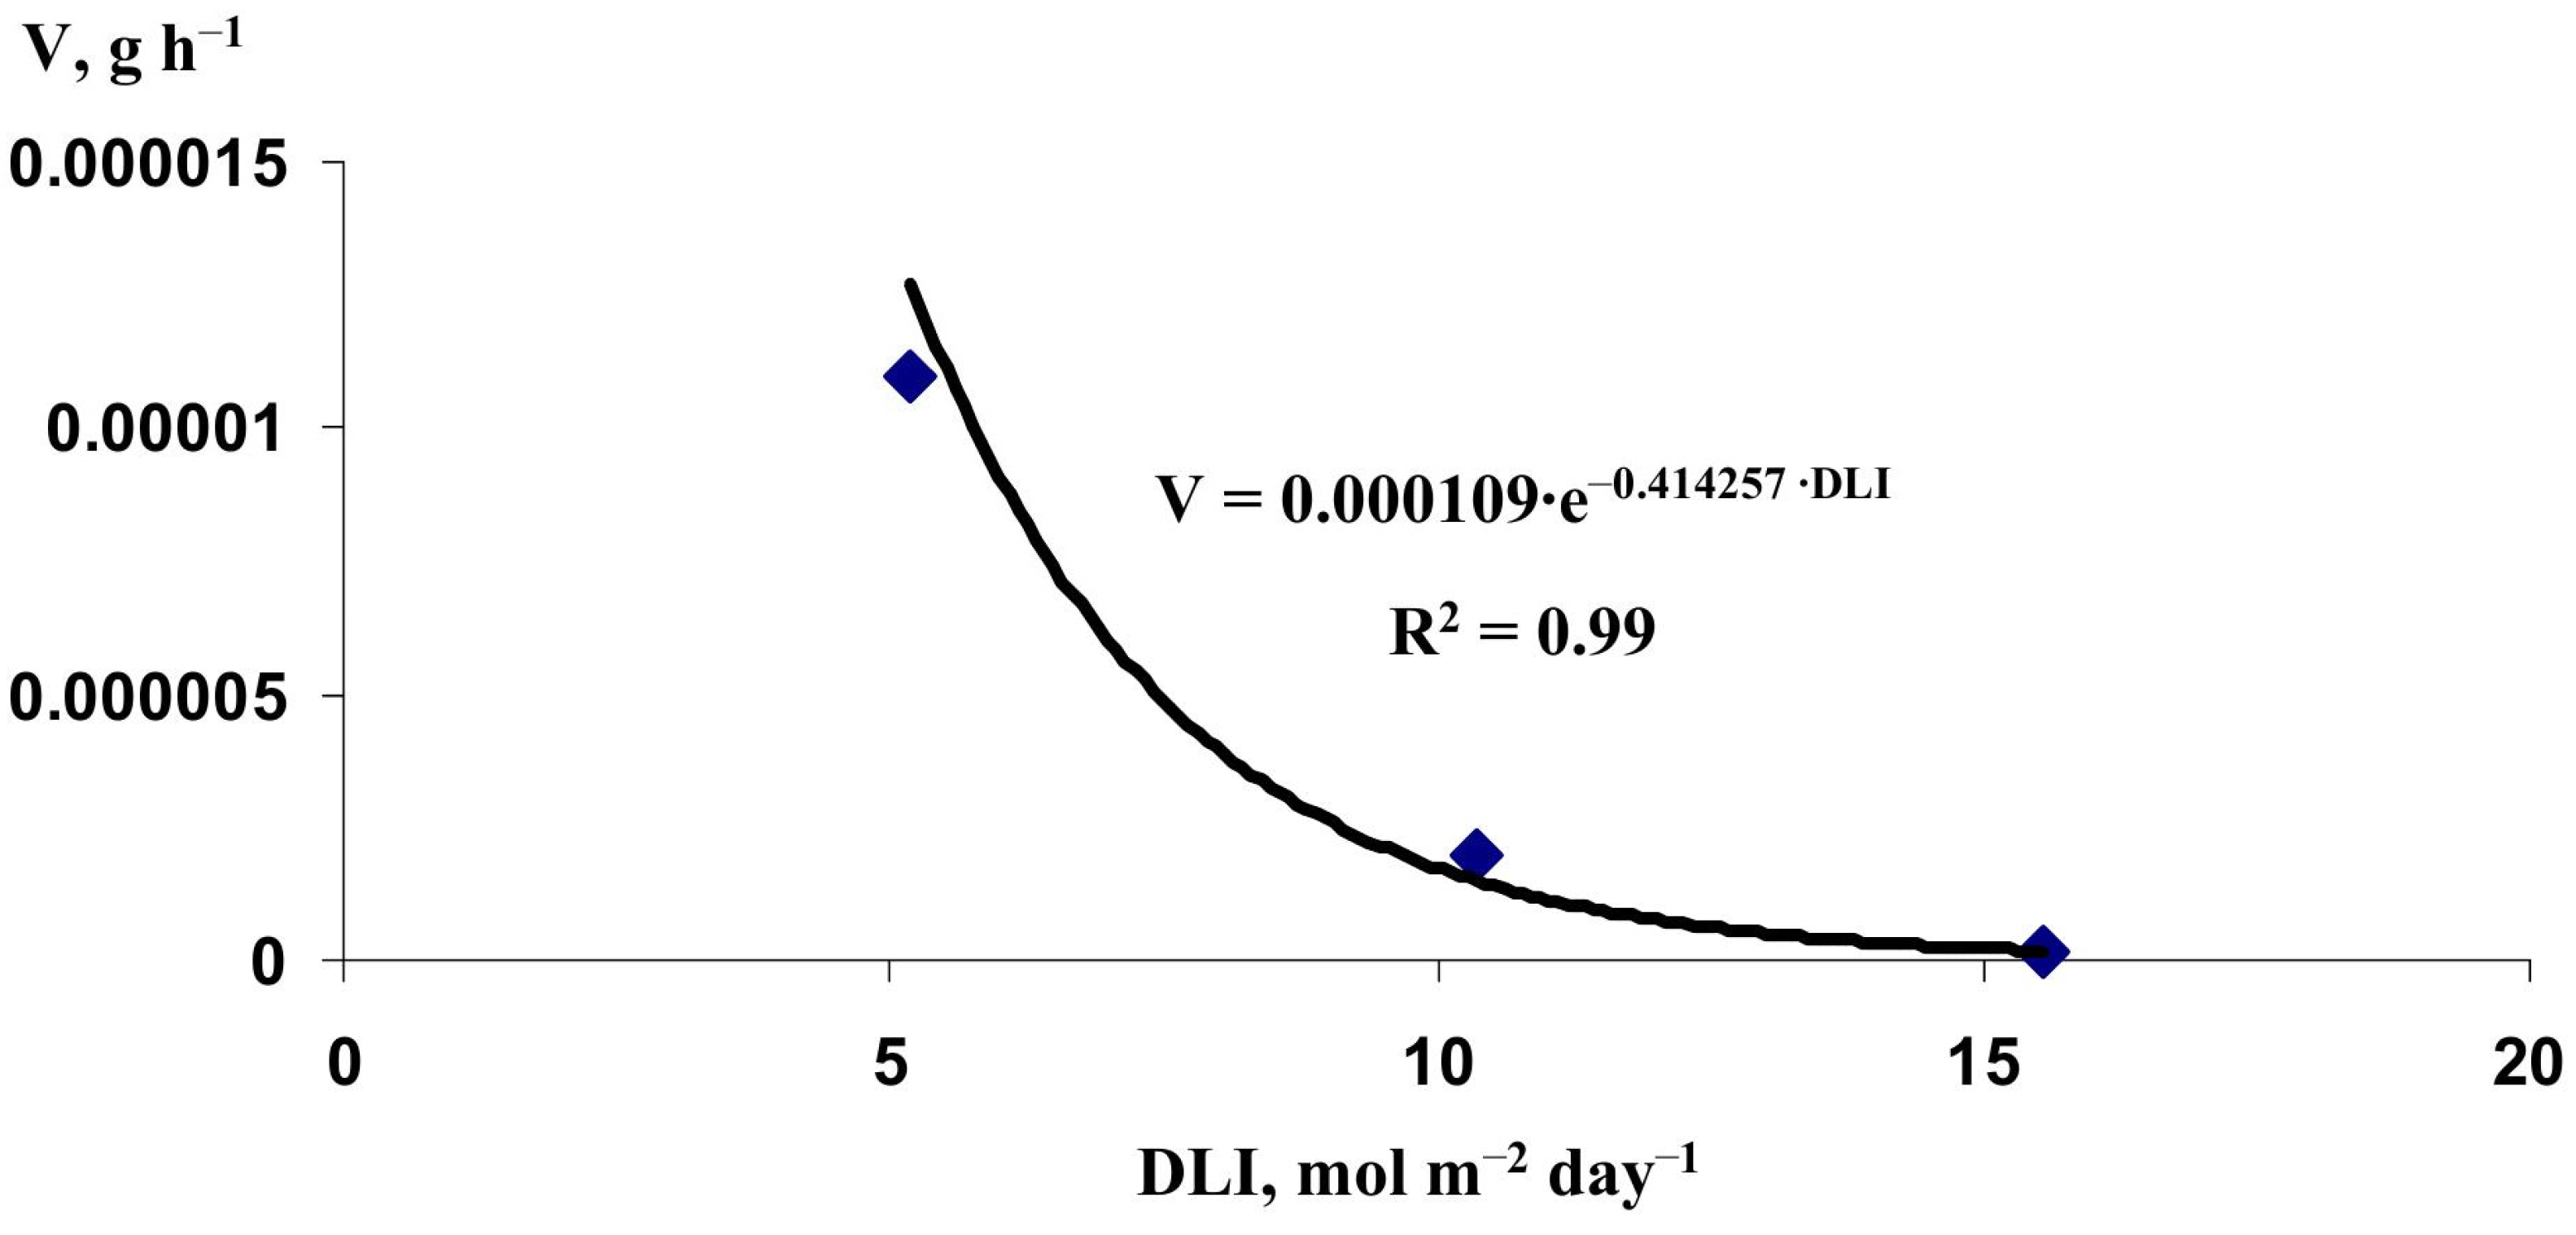
2.1. Equations and Parameterization of the Lettuce Productivity Model

Figure 1a shows the general scheme of the simple model of the productivity of the lettuce plant. Equation (1), which was based on the modified equation from [31], was used to describe dynamics of changes in the dry weight of the leaf rosette (DW) in the lettuce plants.
dDW dt = γ A hv ( β 1 PAR ) C DW S 1 ( DW ) t PP 24 + γ A hv ( β 2 PAR ) C DW S 2 ( DW ) t PP 24 + + V R d C DW C R / DW DW
where DW (g) was the dry weight of rosette of leaves, γ was the fraction of the produced DW distributed to the leaf rosette, CDW (g m2 s1 µmol−1 cm−2 h−1) was the proportionality constant for conversion of µmol m−2 s−1 (rates of the assimilation of CO2 or respiration) into g cm−2 h−1 (rates of the production or consumption of DW per 1 cm2), Ahv1·PAR) and Ahv2·PAR) were photosynthetic CO2 assimilation rates (µmol m−2 s−1) under the specific light intensity (PAR, µmol m−2 s−1) in the first and second layers of leaves, β1 and β2 were fractions of PAR absorbed by the first and second layers of leaves, S1 (DW) and S2 (DW) were areas (cm2) of the first and second layers of leaves, tPP (h) was photoperiod, 24 (h) was the duration of the full light-dark cycle, V (g h−1) was the DW production rate caused by the transport of organic compounds from seed to leaves, Rd (µmol m−2 s−1) was the dark respiration rate, CR/DW (cm2 g−1) was the proportionality constant for conversion of g cm−2 h−1 (rate of the DW consumption per 1 cm2) into h−1 (rate of the DW consumption per 1 g of DW).
S1 (DW) showed area of green leaves directly illuminated by the LEDs; it could be experimentally measured as the green area per plant (S) in the canopy photo [25,31]. This characteristic was based on the classical “sun–shade model” [39,45,55] describing the illumination of “sun” parts of canopy by direct light and illumination of “shade” parts by weak light transmitted through upper leaves. In accordance with our previous model [31], S1 (DW) was approximated by the standard equation from chemical kinetic:
S 1 ( DW ) = S max DW DW + K S
where Smax was the maximum S1, KS was value equaling to the DW at S1 (DW) = 0.5·Smax. Earlier, it was shown that Smax = 296 cm2 and KS = 0.72 g for the lettuce cultivar “Azart” [31].
Considering DW DW + K S as the probability of the leaf localization in the first layer (“sun” layer), probability of the leaf localization in the second layer (“shade” layer) could be described as ( DW DW + K S ) 2 ; as a result, Equation (3) was used for S2 (DW):
S 2 ( DW ) = S max ( DW DW + K S ) 2
Equations (4) and (5) were used for description of β1 and β2:
β 1 = λ = 400 800 f ( λ ) α ( λ ) d λ
β 2 = λ = 400 800 f ( λ ) 1 α ( λ ) 2 α ( λ ) d λ
where f(λ) was spectrum of illumination of the light source, α(λ) was spectrum of the leaf light absorption, λ was wavelength. All spectra were analyzed from 400 to 800 nm. 1 α ( λ ) 2 showed partion of light, which was transmitted through the first layer of leaves and acted on the leaves of the second layer. In accordance with our experimental works [25,31], two variants of spectrum of light source (combination of red, blue, and white LEDs with regulated intensity and time regime) were used: with increased intensity of red light (the “red” variant) and with increased intensity of blue light (the “blue” variant). The red variant, which was more effective for the lettuce cultivation [25], was used as the main variant of illumination for simulations. Red and blue f(λ) from the Figure 1b in [25] were used for simulations in the current work.
Figure 1b shows α(λ) in the lettuce leaves. The spectrum was measured by PolyPen RP 410 UVIS systems (Photon Systems Instruments, Drásov, Czech) in experiment, which was described in detail in our previous experimental work [31]. This spectrum of the leaf light absorption was used for simulations in the current work.
Thus, β1 and β2 equaling to 0.7739 and 0.0812 (red variant) or equaling to 0.7894 and 0.0776 (blue variant) were used in the current investigation. It should be noted that we did not analyze the third, fourth, and next layers of leaves because the light flow acted to these layers should be very weak. PAR equaled to 180 µmol m−2 s−1 [25,29,31] was used for the parameterization and verification of the productivity model.
Light dependence of the CO2 assimilation rate was described with using the standard equation from chemical kinetic in accordance with our previous work [31]:
A hv ( I ) = A hv max I I + K A
where Ahvmax was the maximum photosynthetic CO2 assimilation rate, KA was value equaling to I at Ahv(I) = 0.5·Ahvmax, I (intensity of the absorbed light) was β1·PAR or β2·PAR for the first or second leaf layer, respectively. In accordance with [31], KA = 516.5 µmol m−2 s−1 (after correction on light absorption by leaf) and Ahvmax = 12 µmol m−2 s−1.
Rd was assumed as constant [31]. Rd = 0.769 µmol m−2 s−1 was mainly used for simulation in the current work in accordance with [31]. To verify the model on basis of experimental results from the work [25], Rd = 0.592 µmol m−2 s−1 (red variant) and Rd = 0.987 µmol m−2 s−1 (blue variant) were used in accordance with this work; using these Rd was noted in captions of the corresponding figures and in the text.
γ could be noted on basis of ratio of the dry weights of root to the dry weight of shoot (DW (Root)/DW (Shoot)):
γ = 1 1 + DW ( Root ) / DW ( Shoot )
It should be noted that Equation (7) can have error (low measured γ) on the early stage of growth because DW (Root) can also include additional dry weight through transport of organic compounds from seed; with increasing plant biomass, this error is eliminated (the measured γ is increased). Work [56] showed that γ was increased to about 0.94 with increasing shoot and root dry weights; thus, γ = 0.94 was used for simulations in the current work.
CDW was approximately calculated on basis of experimental results of work [31] for 24 h photoperiod, in accordance with Equation (8):
C DW = Δ DW Δ S ( A hv Av R d Av ) 1 7 1 24
where ΔS and ΔDW were the average illuminated leaf area and change in DW for 1 week, respectively, AhvAv and RhvAv were the average CO2 assimilation and respiration for this week, 7 and 24 were coefficients for conversion of g cm−2 week−1 to g cm−2 h−1. It was shown that CDW = (3.177 ± 1.032)·10−5 g m2 s1 µmol−1 cm−2 h−1; CDW = 3.177·10−5 g m2 s1 µmol−1 cm−2 h−1 was used for simulations in the current work.
To simplify the model and minimize quantity of parameters, V was described as the constant or as the empirical function of DLI (see below); this parameter was small and influenced rate of the DW production on early stage of the lettuce cultivation, only.
Considering small influence of V on DW at the final stages of the lettuce cultivation, we derived Equation (9):
C R / DW = γ A hv ( β 1 PAR ) S 1 ( DW St ) + A hv ( β 2 PAR ) S 2 ( DW St ) R d DW St t PP 24
where DWSt was the stationary DW under specific light conditions. DWSt was not experimentally measured in our work. However, in accordance with [31], the maximal measured DW was 3.822 ± 0.625 g (i.e., it was ranged from 3.175 g to 4.425 g). It meant that CR/DW should be less than 199 (for DWSt > 4.425 g)–262 (for DWSt > 3.175 g) cm2 g−1. We assumed that CR/DW = 200 cm2 g−1 (that DWSt was about 4.425 g) for simulations in the current work.
In accordance with [31], FW was calculated with using Equation (10):
FW = C FW / DW DW
where CFW/DW was the proportionality coefficient. CFW/DW was calculated on basis of Table 1 in the work [31]; the averaged value of this parameter was 15.854 ± 1.315. As a result, CFW/DW = 15.854 was used for estimation of FW in the current work.
The developed model was numerically analyzed using the forward Euler method. Figure 2a shows experimental and simulated dynamics of increasing DW at 8, 16, and 24 h photoperiods. Experimental results from the work [31] were used to parameterize the model. The 180 µmol m−2 s−1 light intensity (red variant) and the basic rate of the dark respiration (Rd = 0.769 µmol m−2 s−1) were used for simulation in accordance with the work [31]. V was assumed to be constant; this parameter was separately fitted for each photoperiod.
It was shown that simulated dynamics of increasing DW were similar to experimental ones; determination coefficients were more than 0.75 for all simulated curves of DW changes. Particularly, the model-based dynamics well simulated influence of photoperiod on increasing DW: the 8 h photoperiod provided minimal plant productivity; in contrast, the 24 h photoperiod contributed to the maximal rate of the biomass production. It should be noted that increasing photoperiod and, therefore, DLI was accompanied by decreasing value of fitted V that showed decreasing transport of organic compounds from seeds to shoot.
Model-based analysis of increasing FW (Figure 2b) and the green area per plant (S), which corresponded to area of directly illuminated leaves of the lettuce plant (the first layer of leaves) (Figure 2c) also showed well similarity between experimental and simulated dynamics (R2 were more than 0.75) and strong influence of photoperiod on values of FW and S.
Figure 3 shows dependence of fitted V on value of DLI and its approximation by the exponential function. This exponential approximation well described values of V (R2 was 0.99) and could be used for further development of the model of the lettuce productivity under different light conditions.
Figure 4 shows dynamics of increasing DW, FW, and S simulated by the model with the exponential description of dependence of V on DLI (on basis of Figure 3); other model parameters were same to ones for Figure 2. These dynamics were also in a good accordance with experimental ones (R2 were more than 0.70), which were shown in Figure 2 (experimental results from the work [31] were used).
The last result showed that the model with the exponential approximation of dependence of V on DLI could be potentially used for analysis of influence of widely-varying light conditions on DW, FW, and S; i.e., it could be considered as initial verification of the developed model. However, an additional verification of this model on basis of another group of results was necessary step for the subsequent analysis.

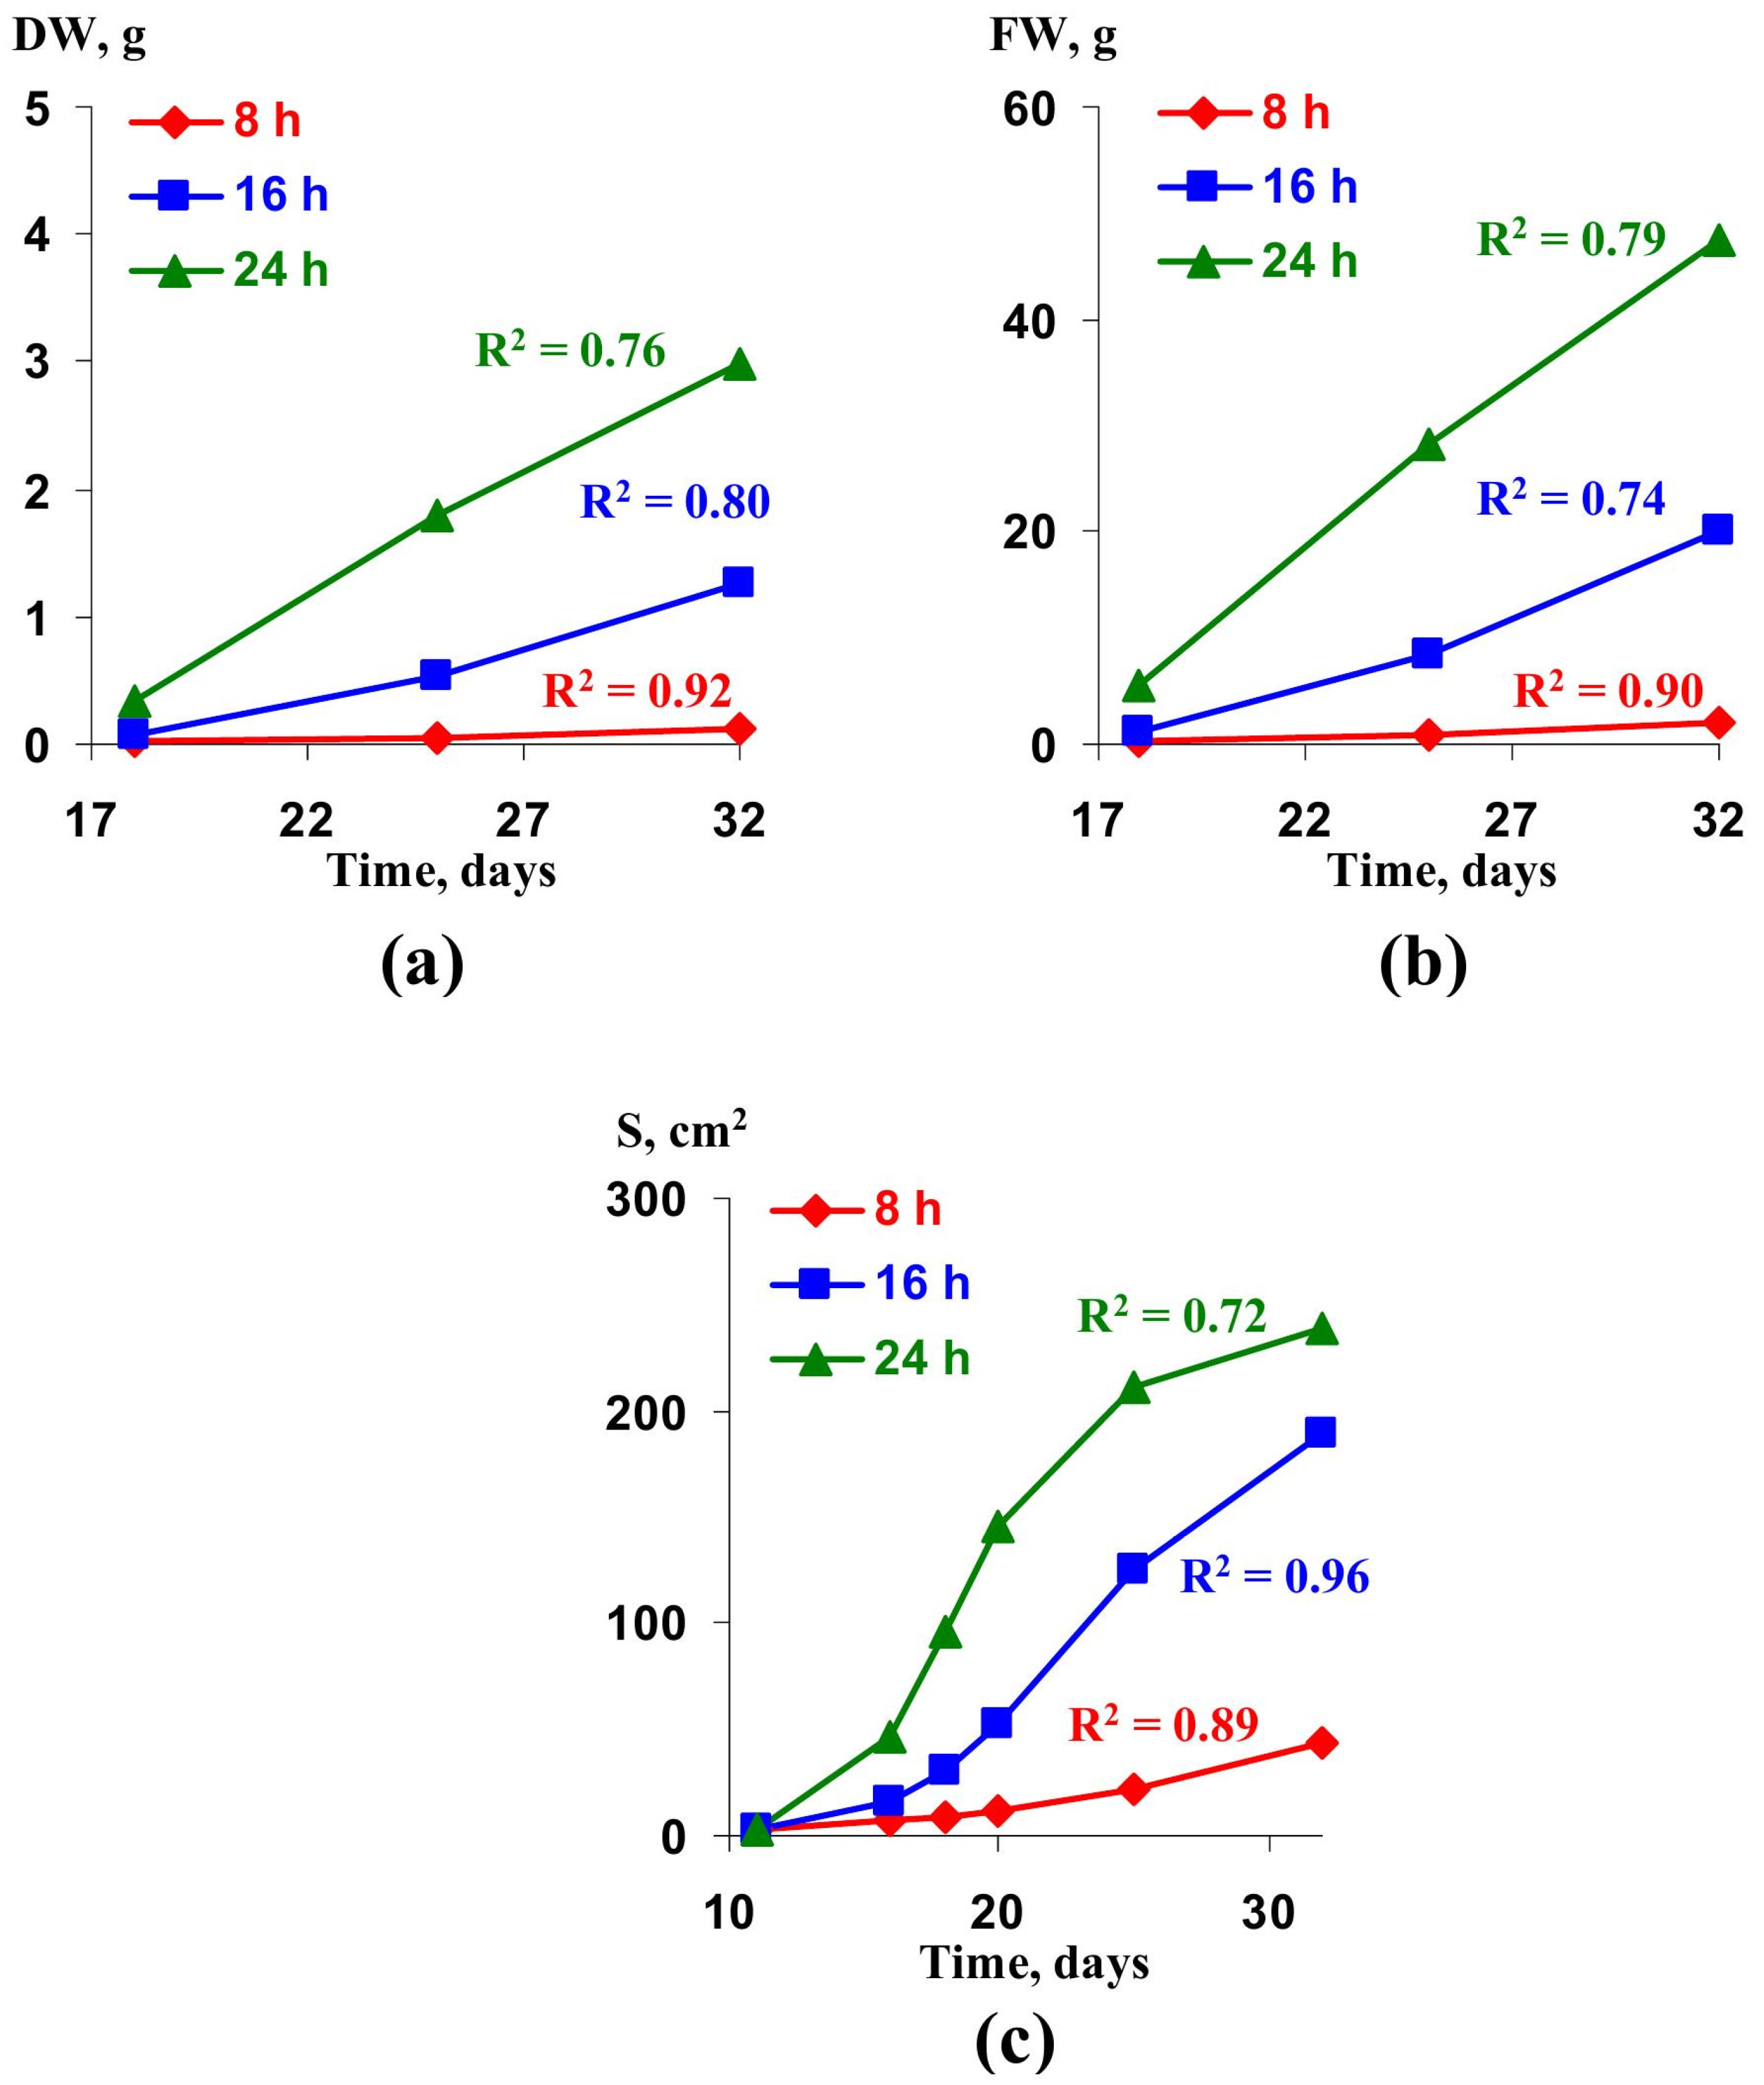
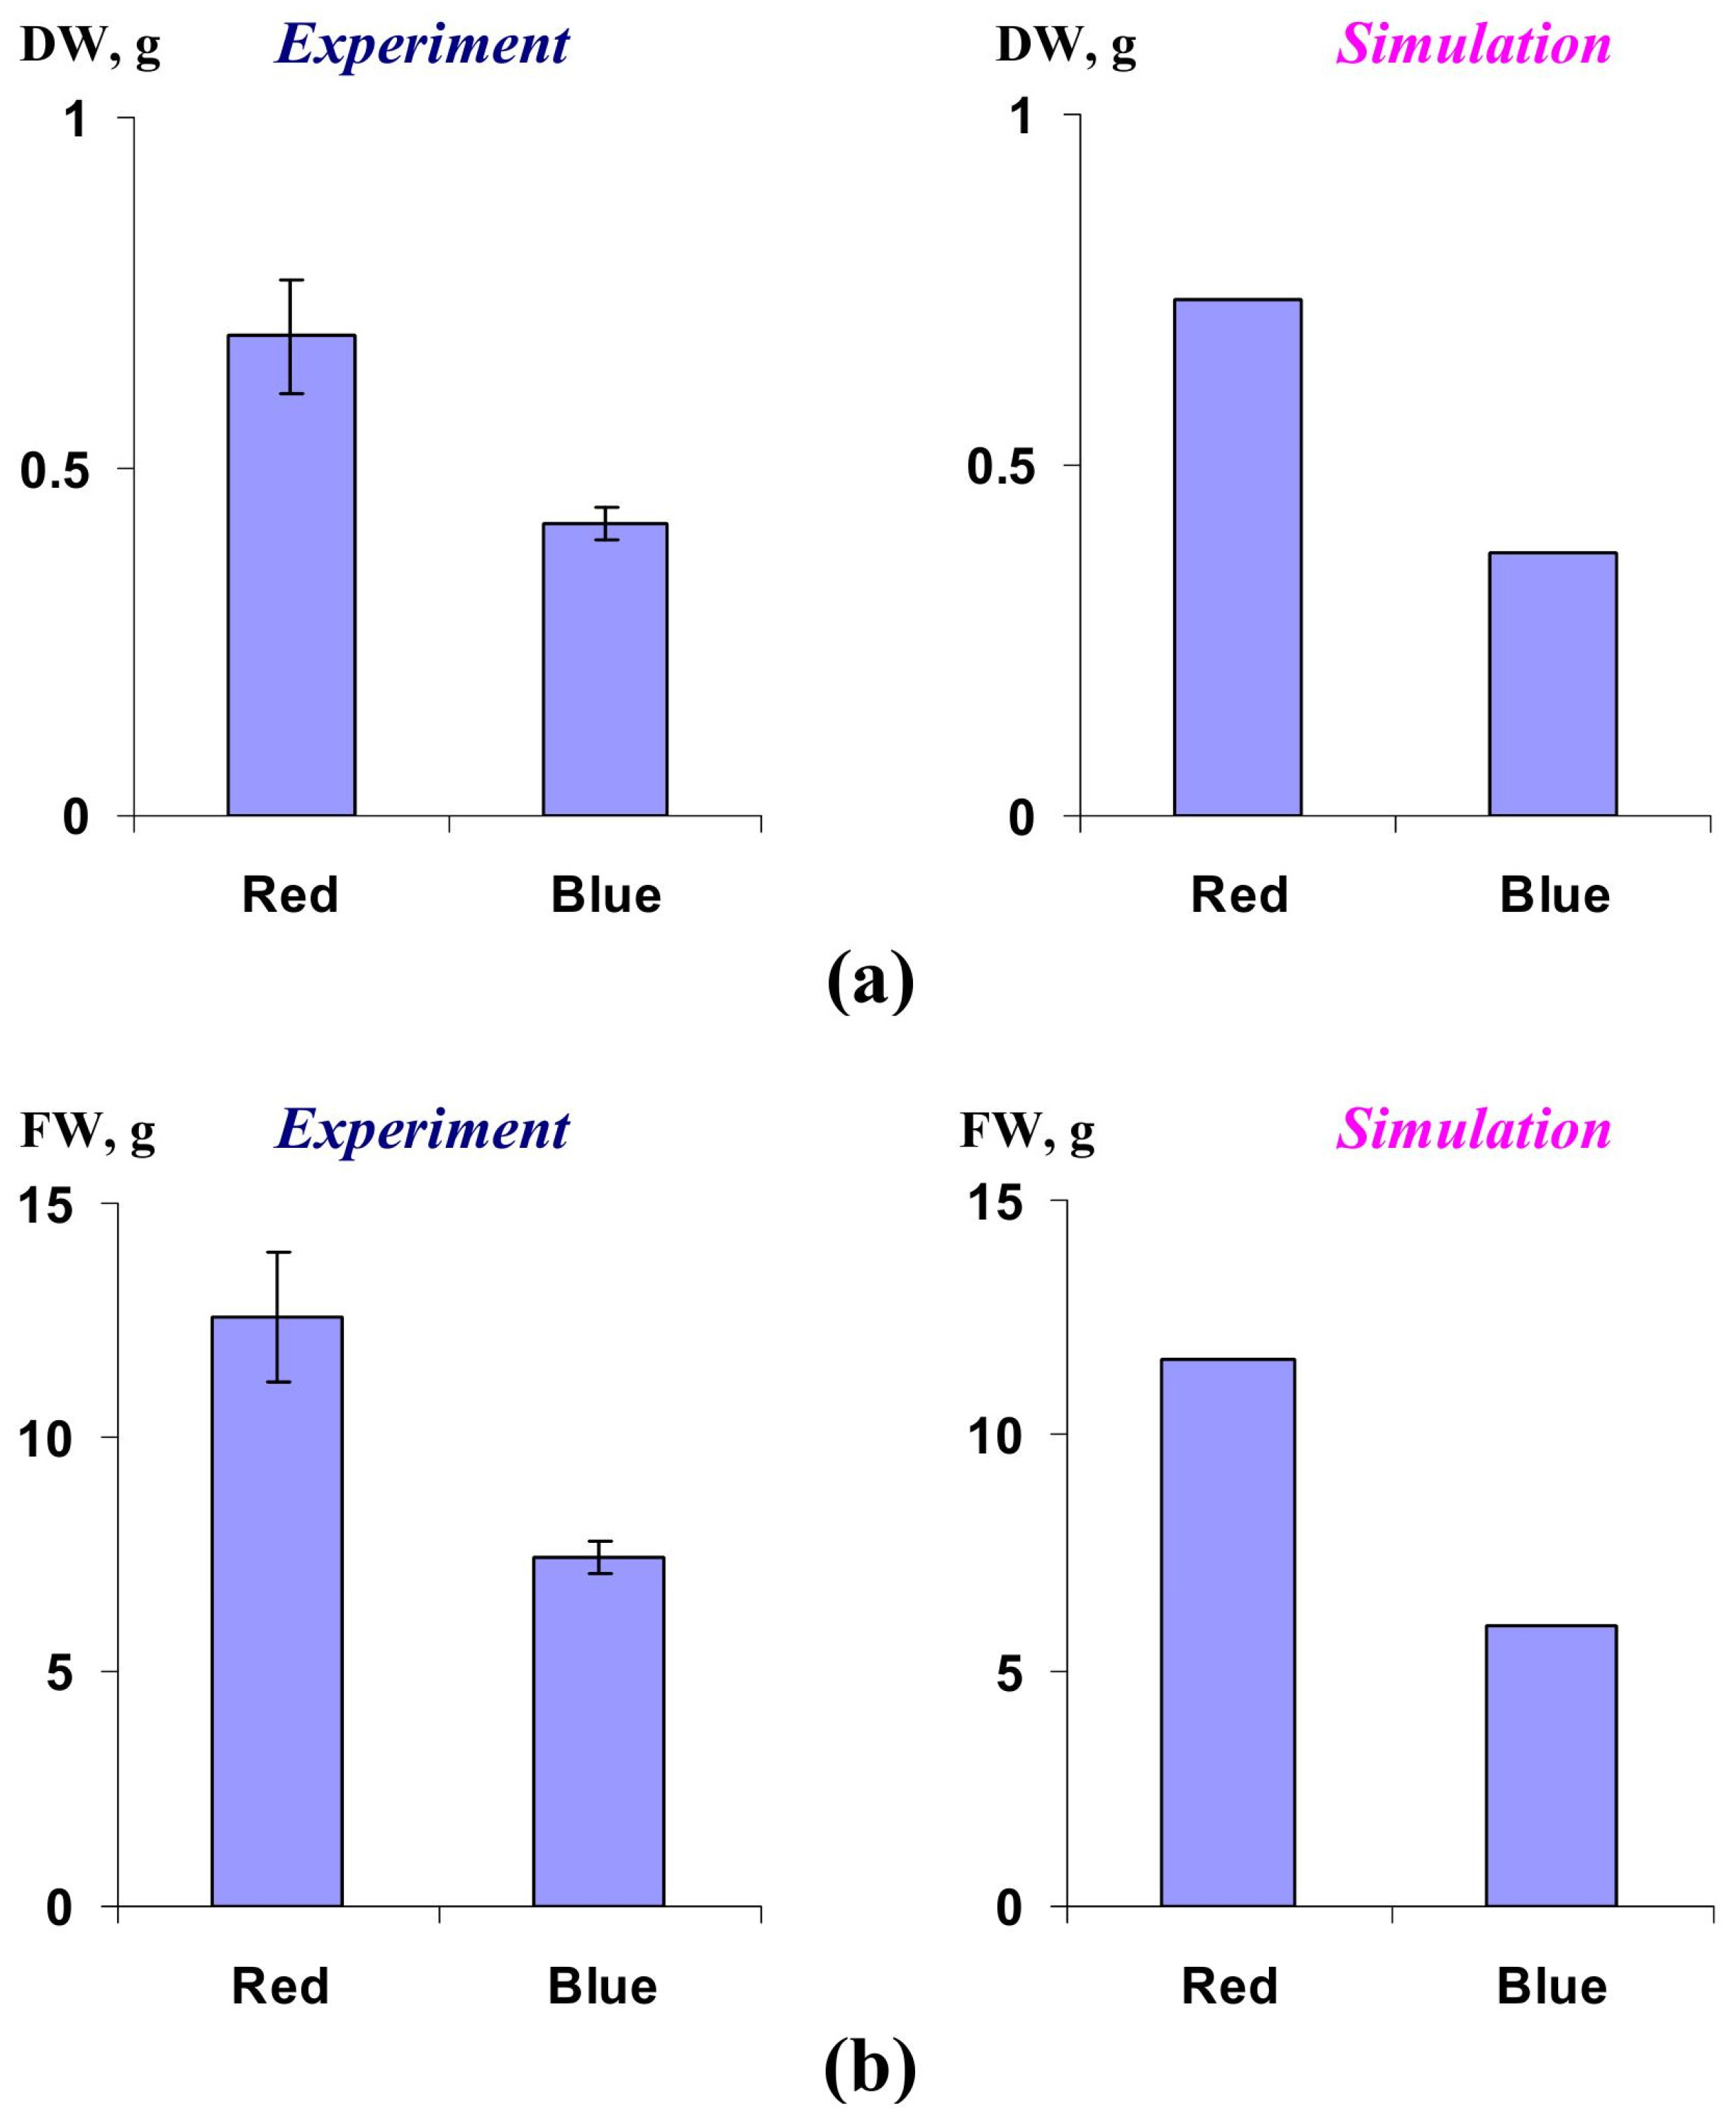
2.2. Verification of the Lettuce Productivity Model

Experimental results of our earlier work [25], which was devoted to analyzing influence of red and blue variants of illumination on the lettuce biomass, photosynthesis, respiration, and other characteristics, were used for the additional verification of the developed model of the lettuce productivity under different illumination conditions. Both variants of illumination were provided by light source, which included red, blue, and white LEDs. The red variant of illumination corresponded to the increased intensity of the red light; the blue variant of illumination corresponded to increased intensity of the blue light.
In accordance with [25], differences in the dark respiration were main reason of difference in DW, FW, and S in lettuce cultivated under blue and red variants of LED illumination. Considering this point, we used different Rd for red and blue variants (0.592 and 0.987 µmol m−2 s−1, respectively). β1 and β2 were additionally calculated for blue variant of illumination. Other parameters were not changed.
Figure 5 shows values of the dry and fresh weights of the lettuce plants after 25 days of cultivation under red and blue variants of illuminations. Experimental and simulated values of these parameters were quantitatively similar and showed that the red variant of illumination stimulated the lettuce productivity (it increased plant biomass); in contrast, the blue variant of illumination decreased this productivity.
Comparison between experimental and simulated dynamics of the green area per plants (Figure 6) supported this quantitatively similarity because determination coefficients for model-based curves were 0.85 (the red variant) and 0.81 (the blue variant).
These results showed that the developed model was verified and could be used for the further analysis of the lettuce productivity under different light conditions in quantitative manner (at least, for cultivar “Azart”). Additionally, this result supported our earlier supposition about the important role of Rd in influence of red and blue variants of illumination on productivity because changes in Rd (and weak changes in β1 and β2) were enough for imitation of experimental results.

3. Results

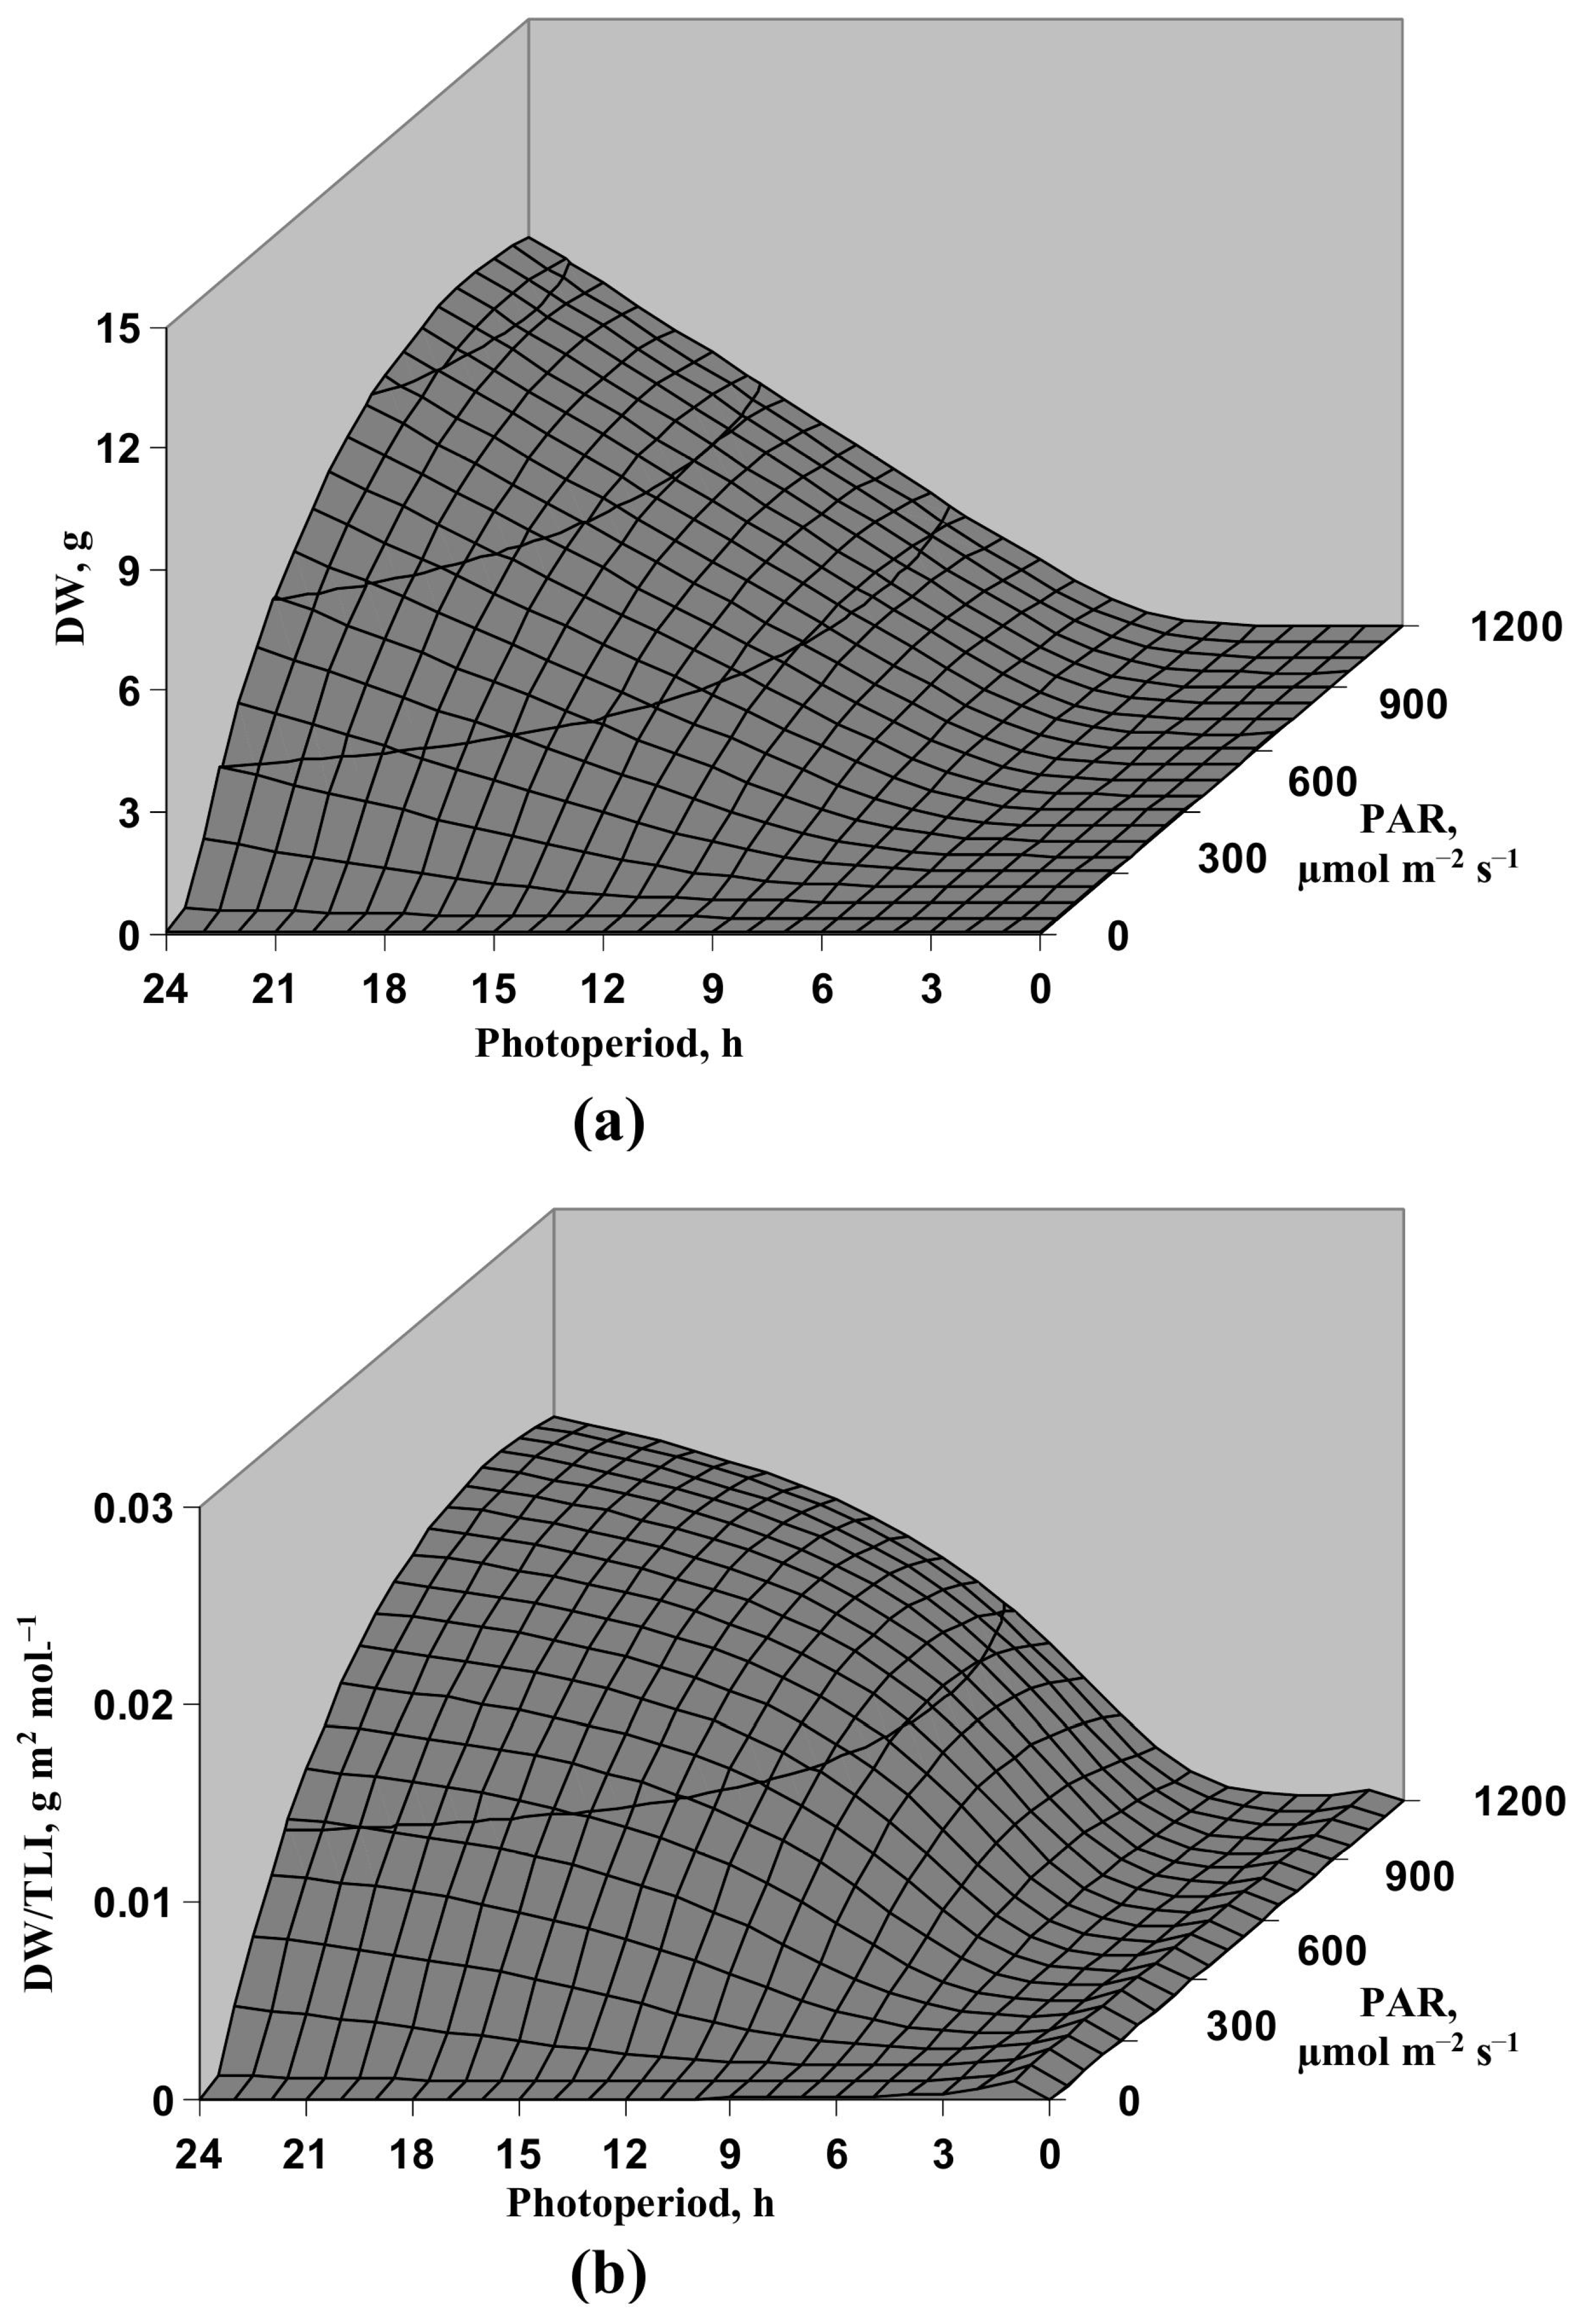
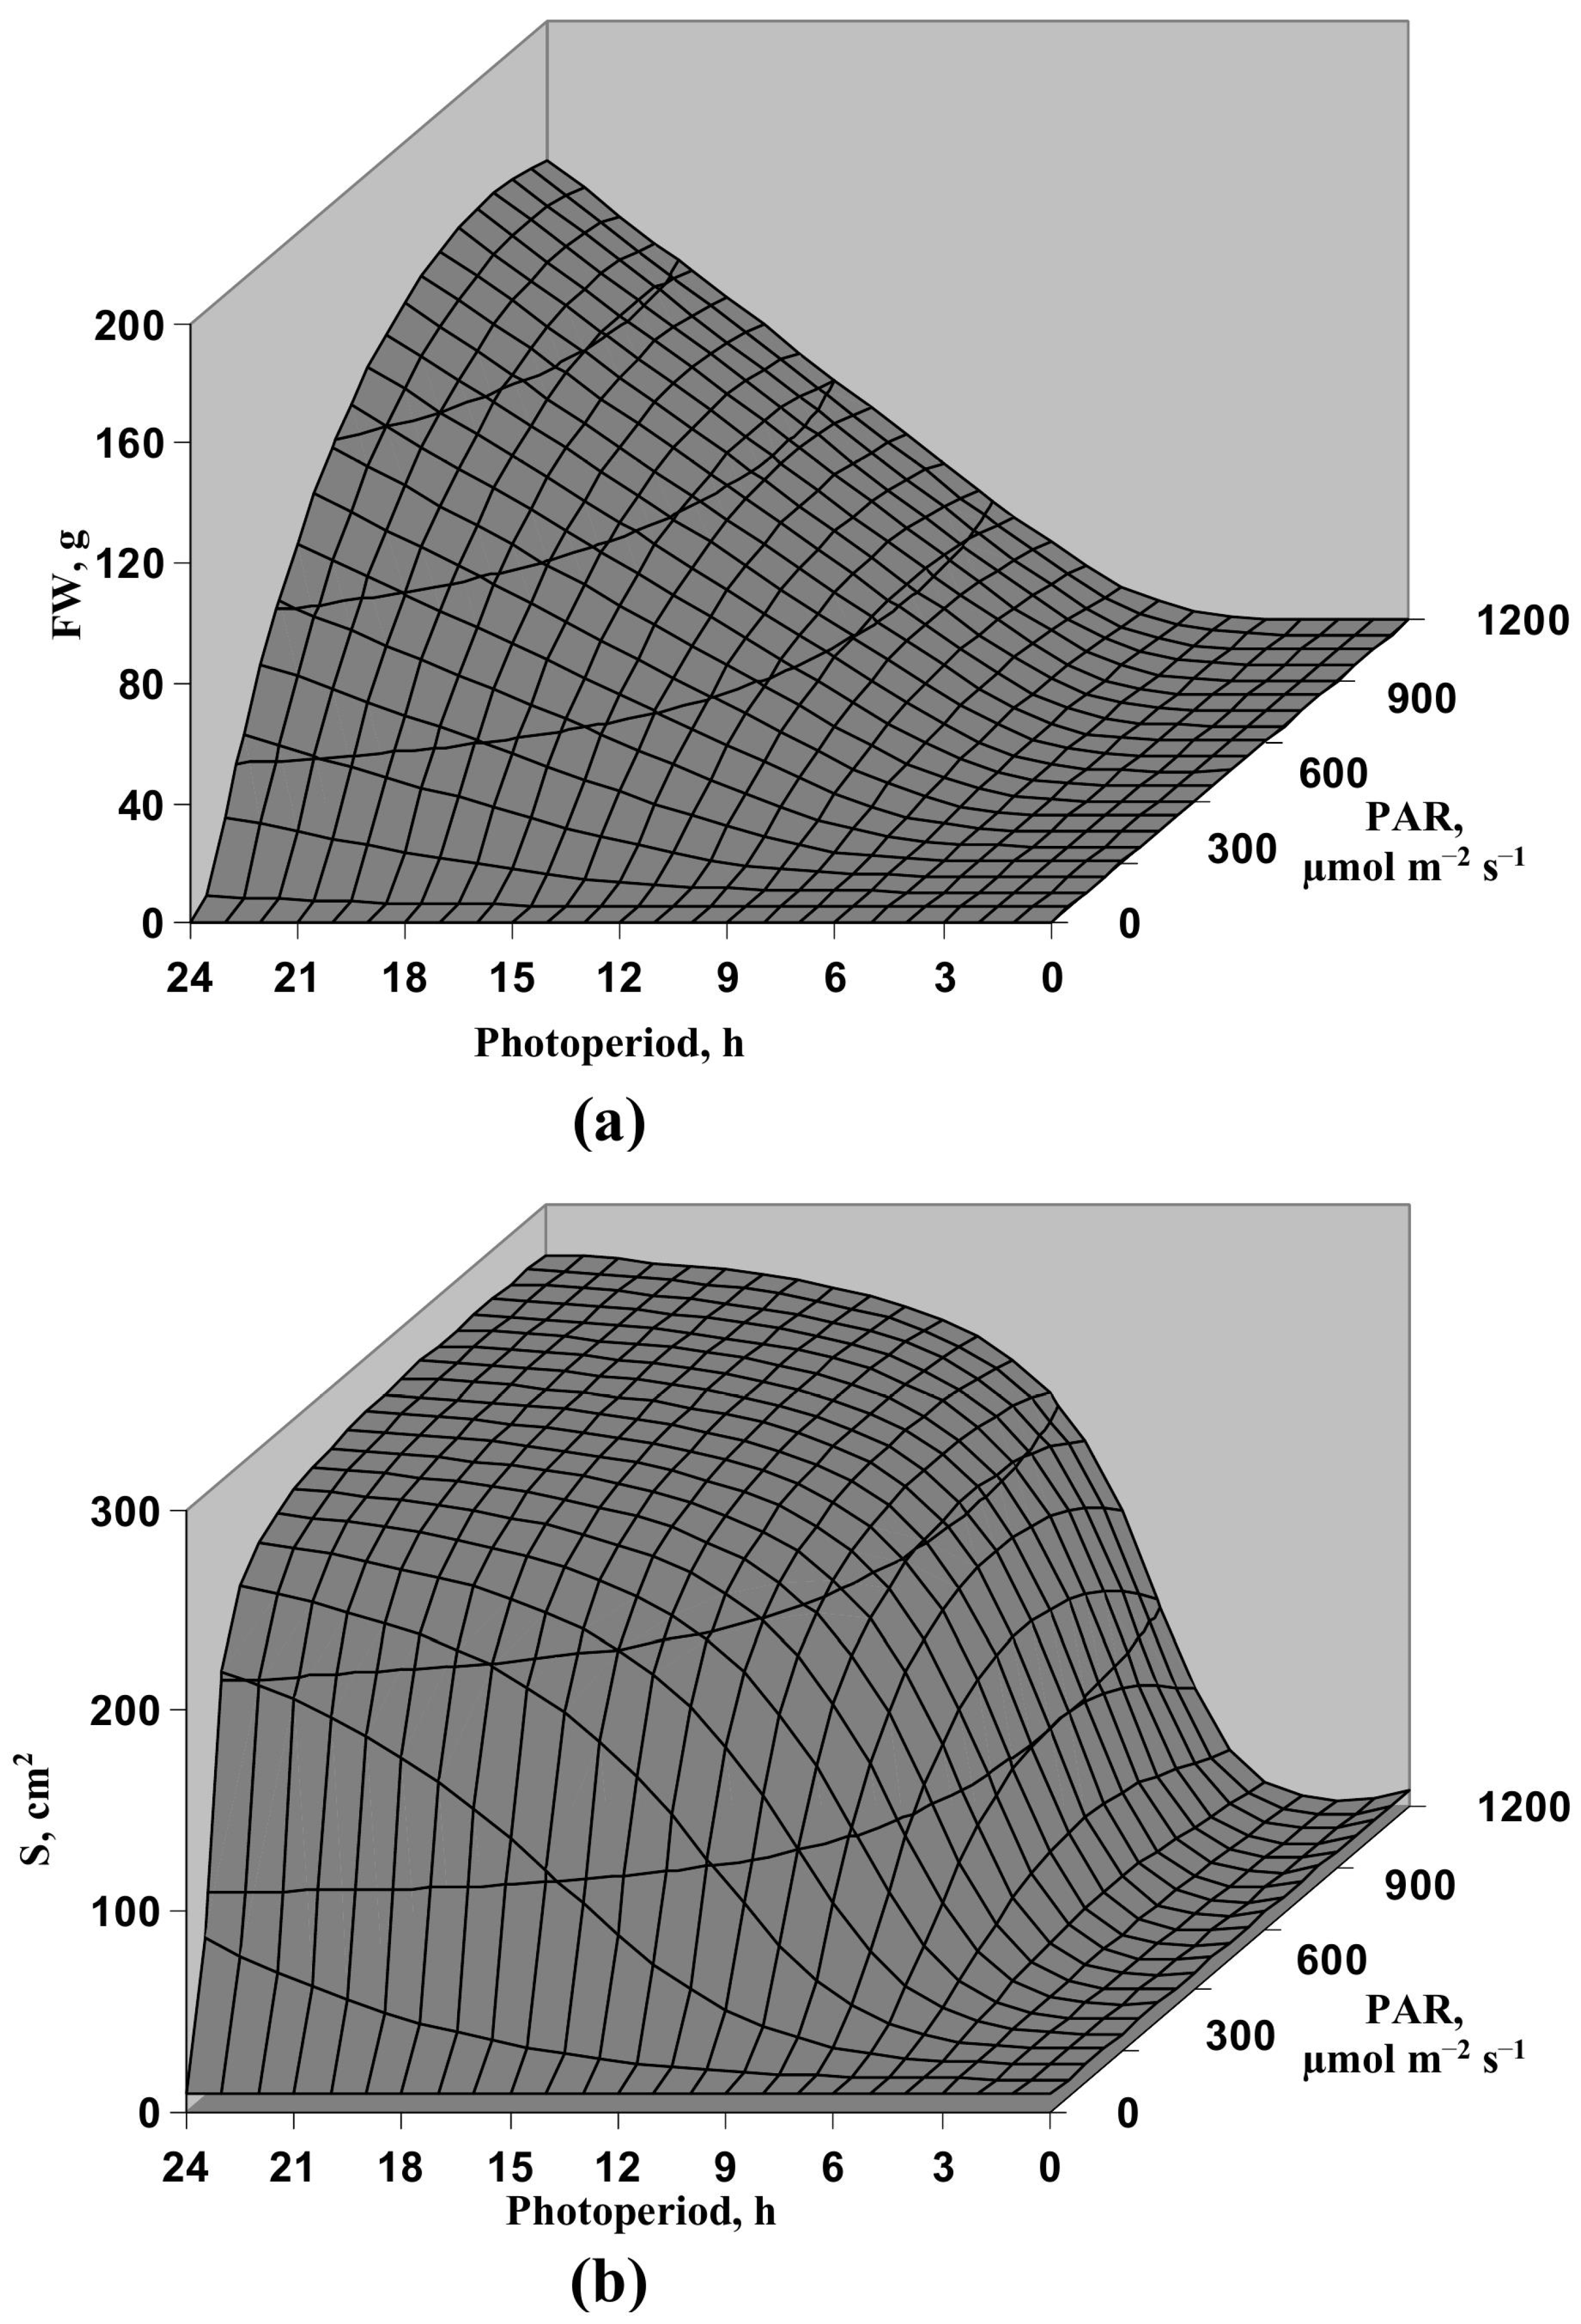
3.1. Model-Based Analysis of Influence of Light Intensity and Photoperiod on the Lettuce Productivity and Growth

Figure 7 and Figure 8 show simultaneous influence of the photoperiod and light intensity on investigated characteristics of productivity and growth. It was shown that increasing the photoperiod increased DW of the lettuce plant (Figure 7a); this effect was simulated under different light intensities. Increasing PAR also increased DW; saturation was observed under action of PAR > 600 µmol m−2 s−1. The maximal DW imitated by the model was about 10 g.
DW/TLI, where TLI was the total light integral for 32 days of the lettuce cultivation, was additionally analyzed to estimate influence of the photoperiod and light intensity on efficiency of the energy using (Figure 7b). It was shown that both increasing the photoperiod and light intensity increased DW/TLI; this increase had saturation at PAR > 600 µmol m−2 s−1 and tPP > 20 h. The maximal DW/TLI imitated by the model was about 0.02 g m2 mol−1.
Changes in FW (Figure 8a) were corresponded to changes in DW; the maximal FW was about 160 g. The green leaf area (Figure 8b) was also increased with increasing the photoperiod and light intensity; however, the saturation was formed at PAR > 300 µmol m−2 s−1 and tPP > 16 h. The maximal S was about 275 cm2.
Thus, analysis of the developed model supported influence of the photoperiod and light intensity on the lettuce productivity and growth and theoretically showed potential variants of illumination providing the maximal plant production or the maximal efficiency of the light using. Additionally, different dependences of investigated parameters on tPP and PAR supported different influence of the photoperiod and light intensity on the lettuce productivity showed in the experimental works [30,31,32,33,34].

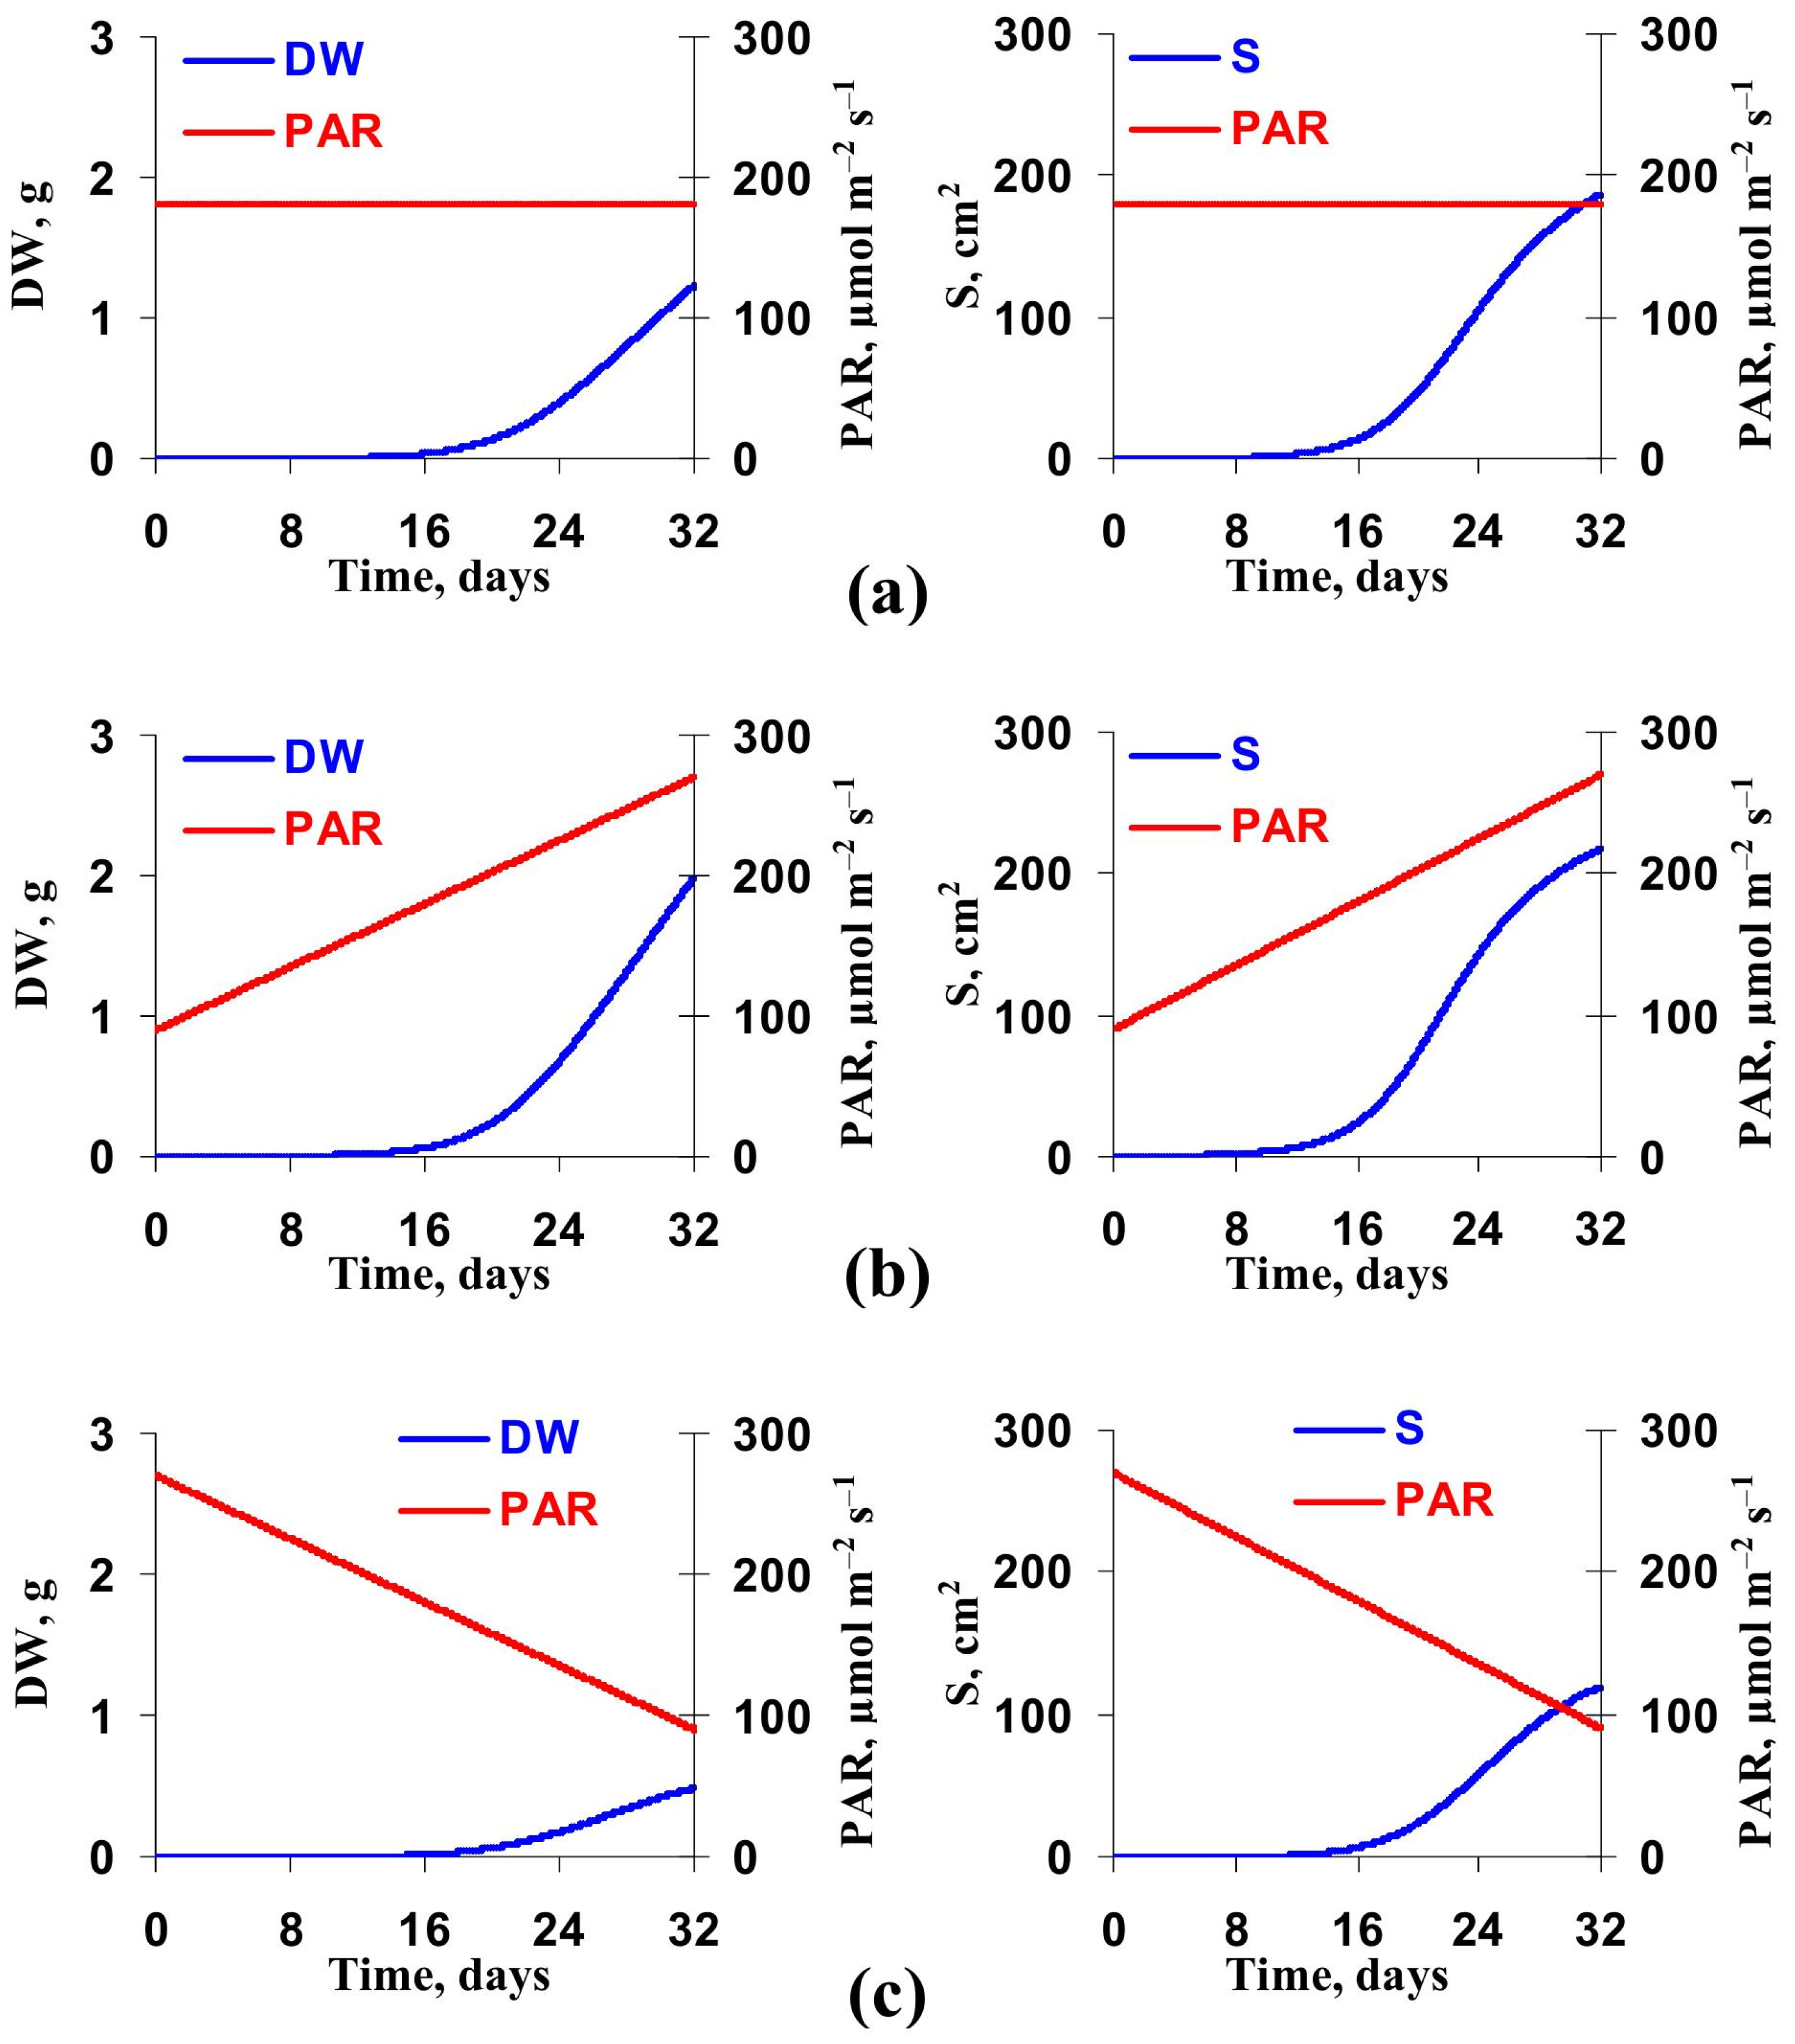
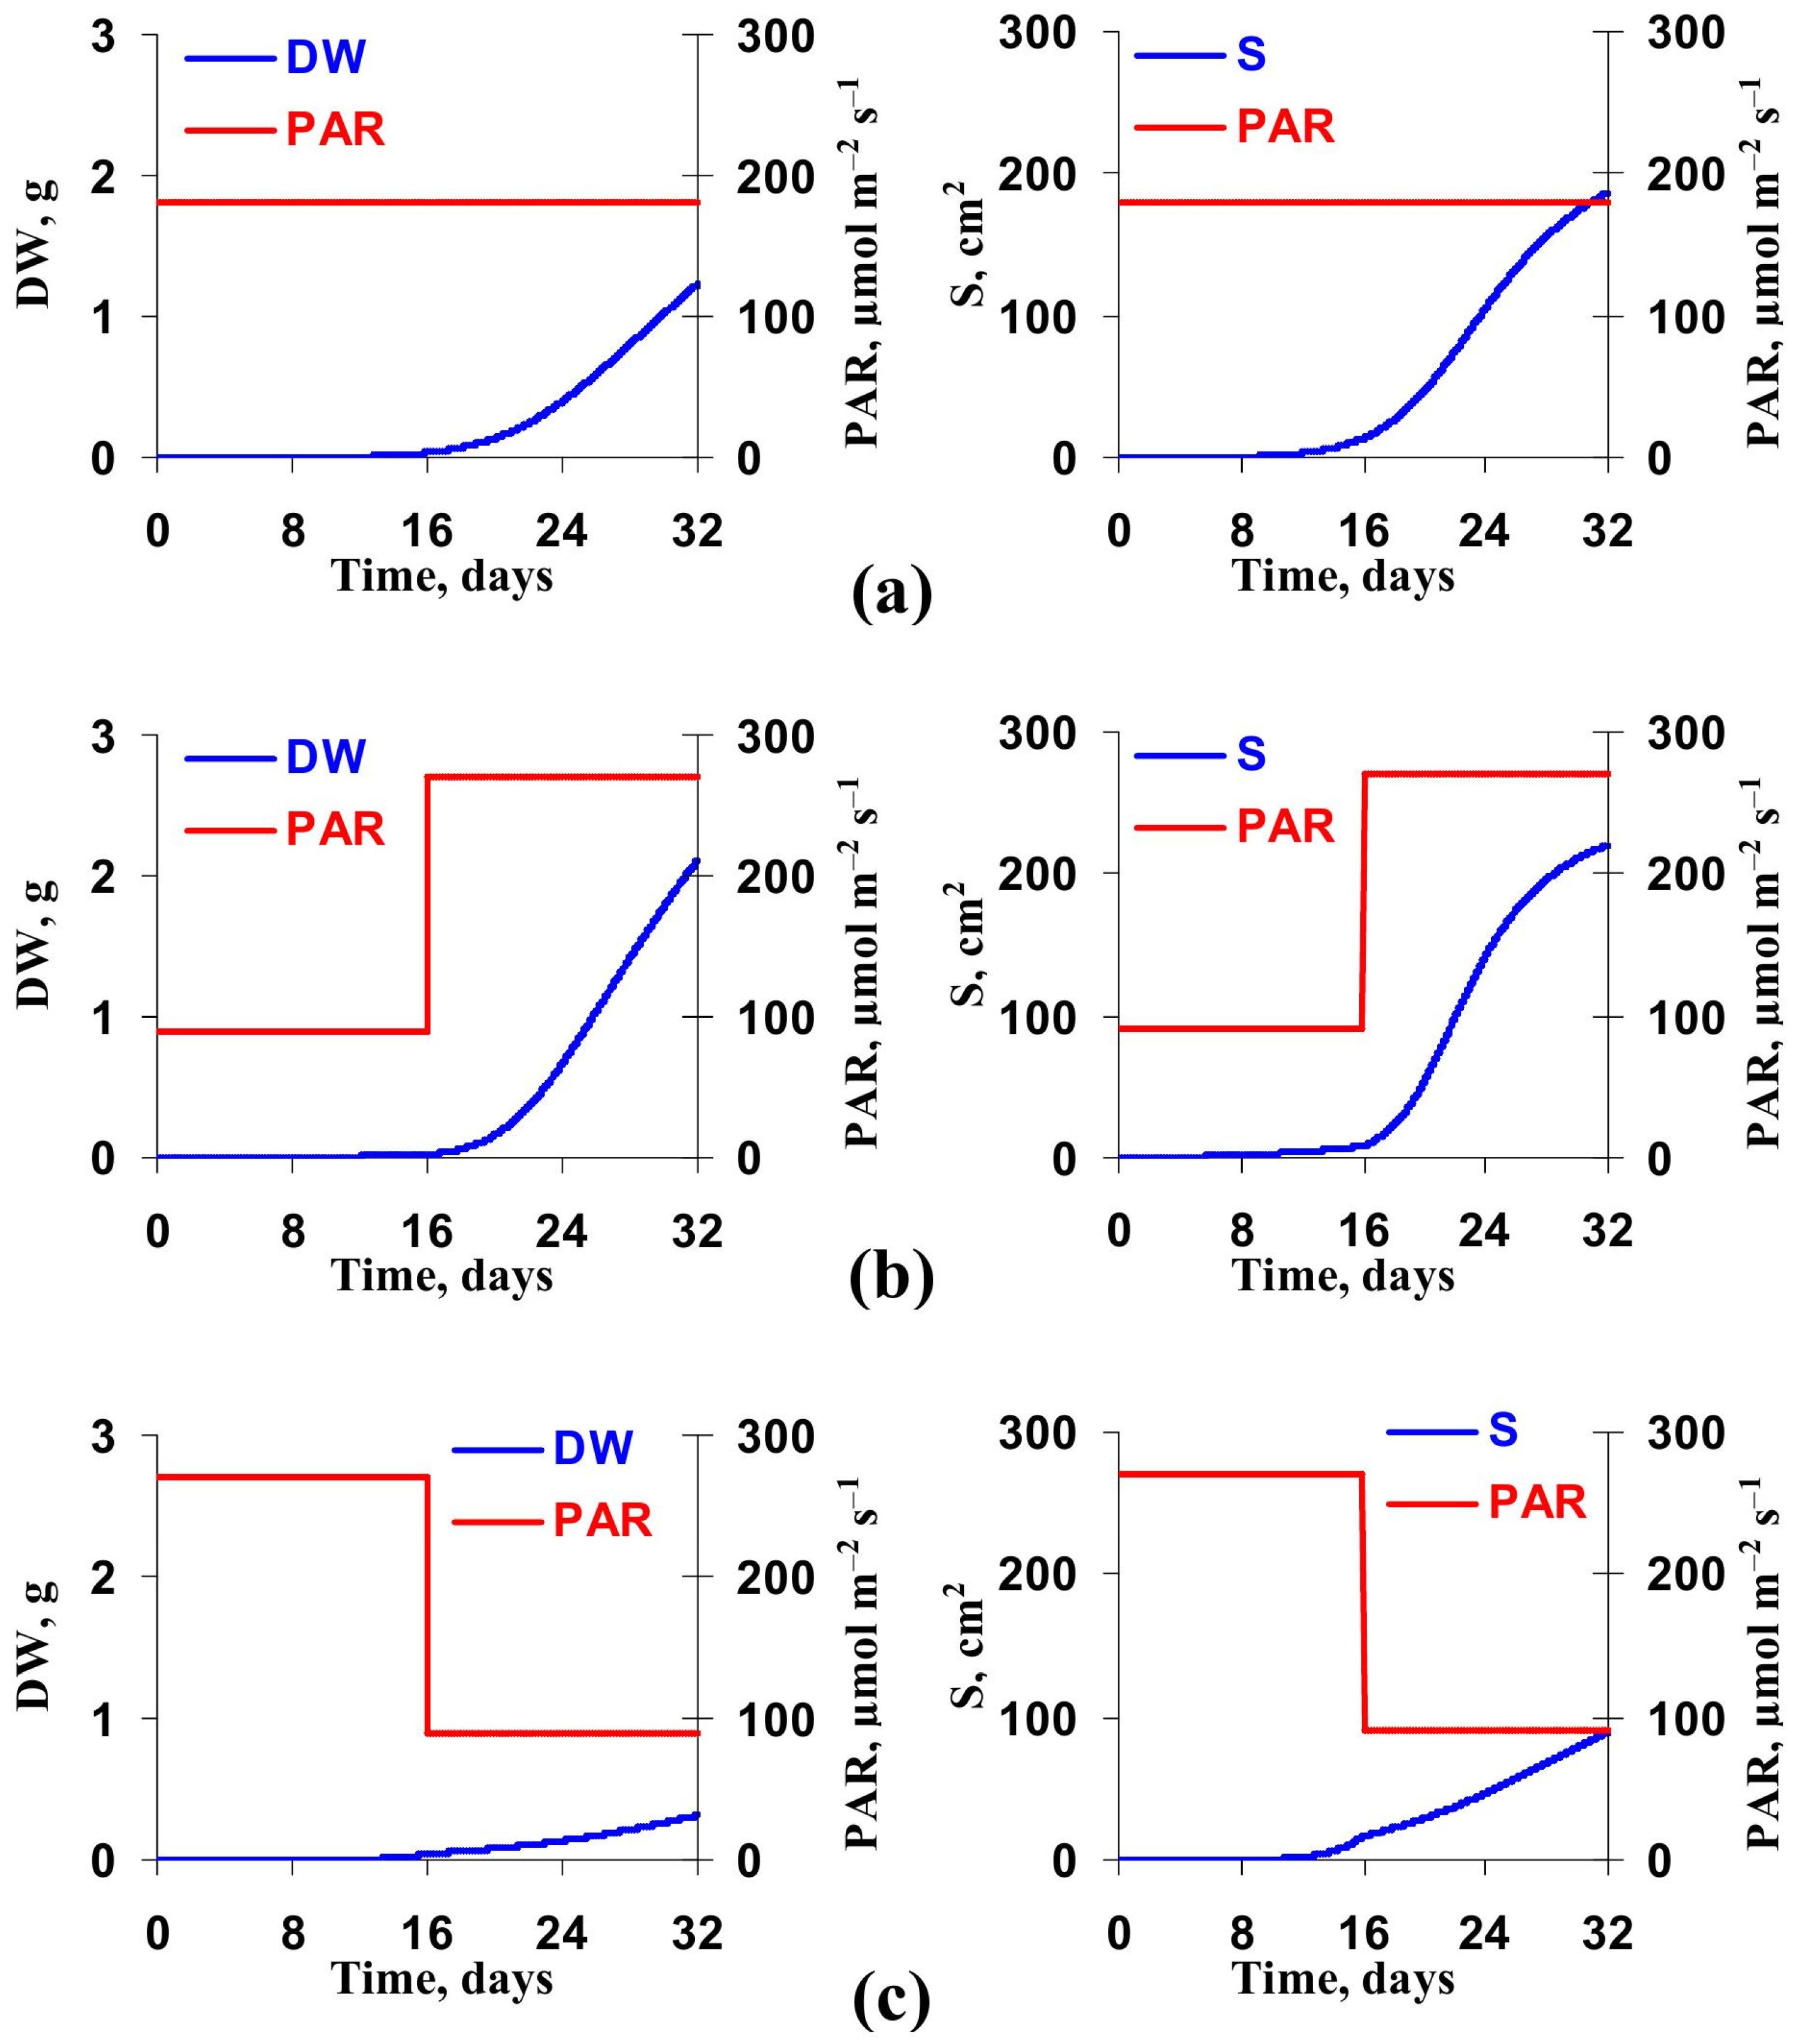
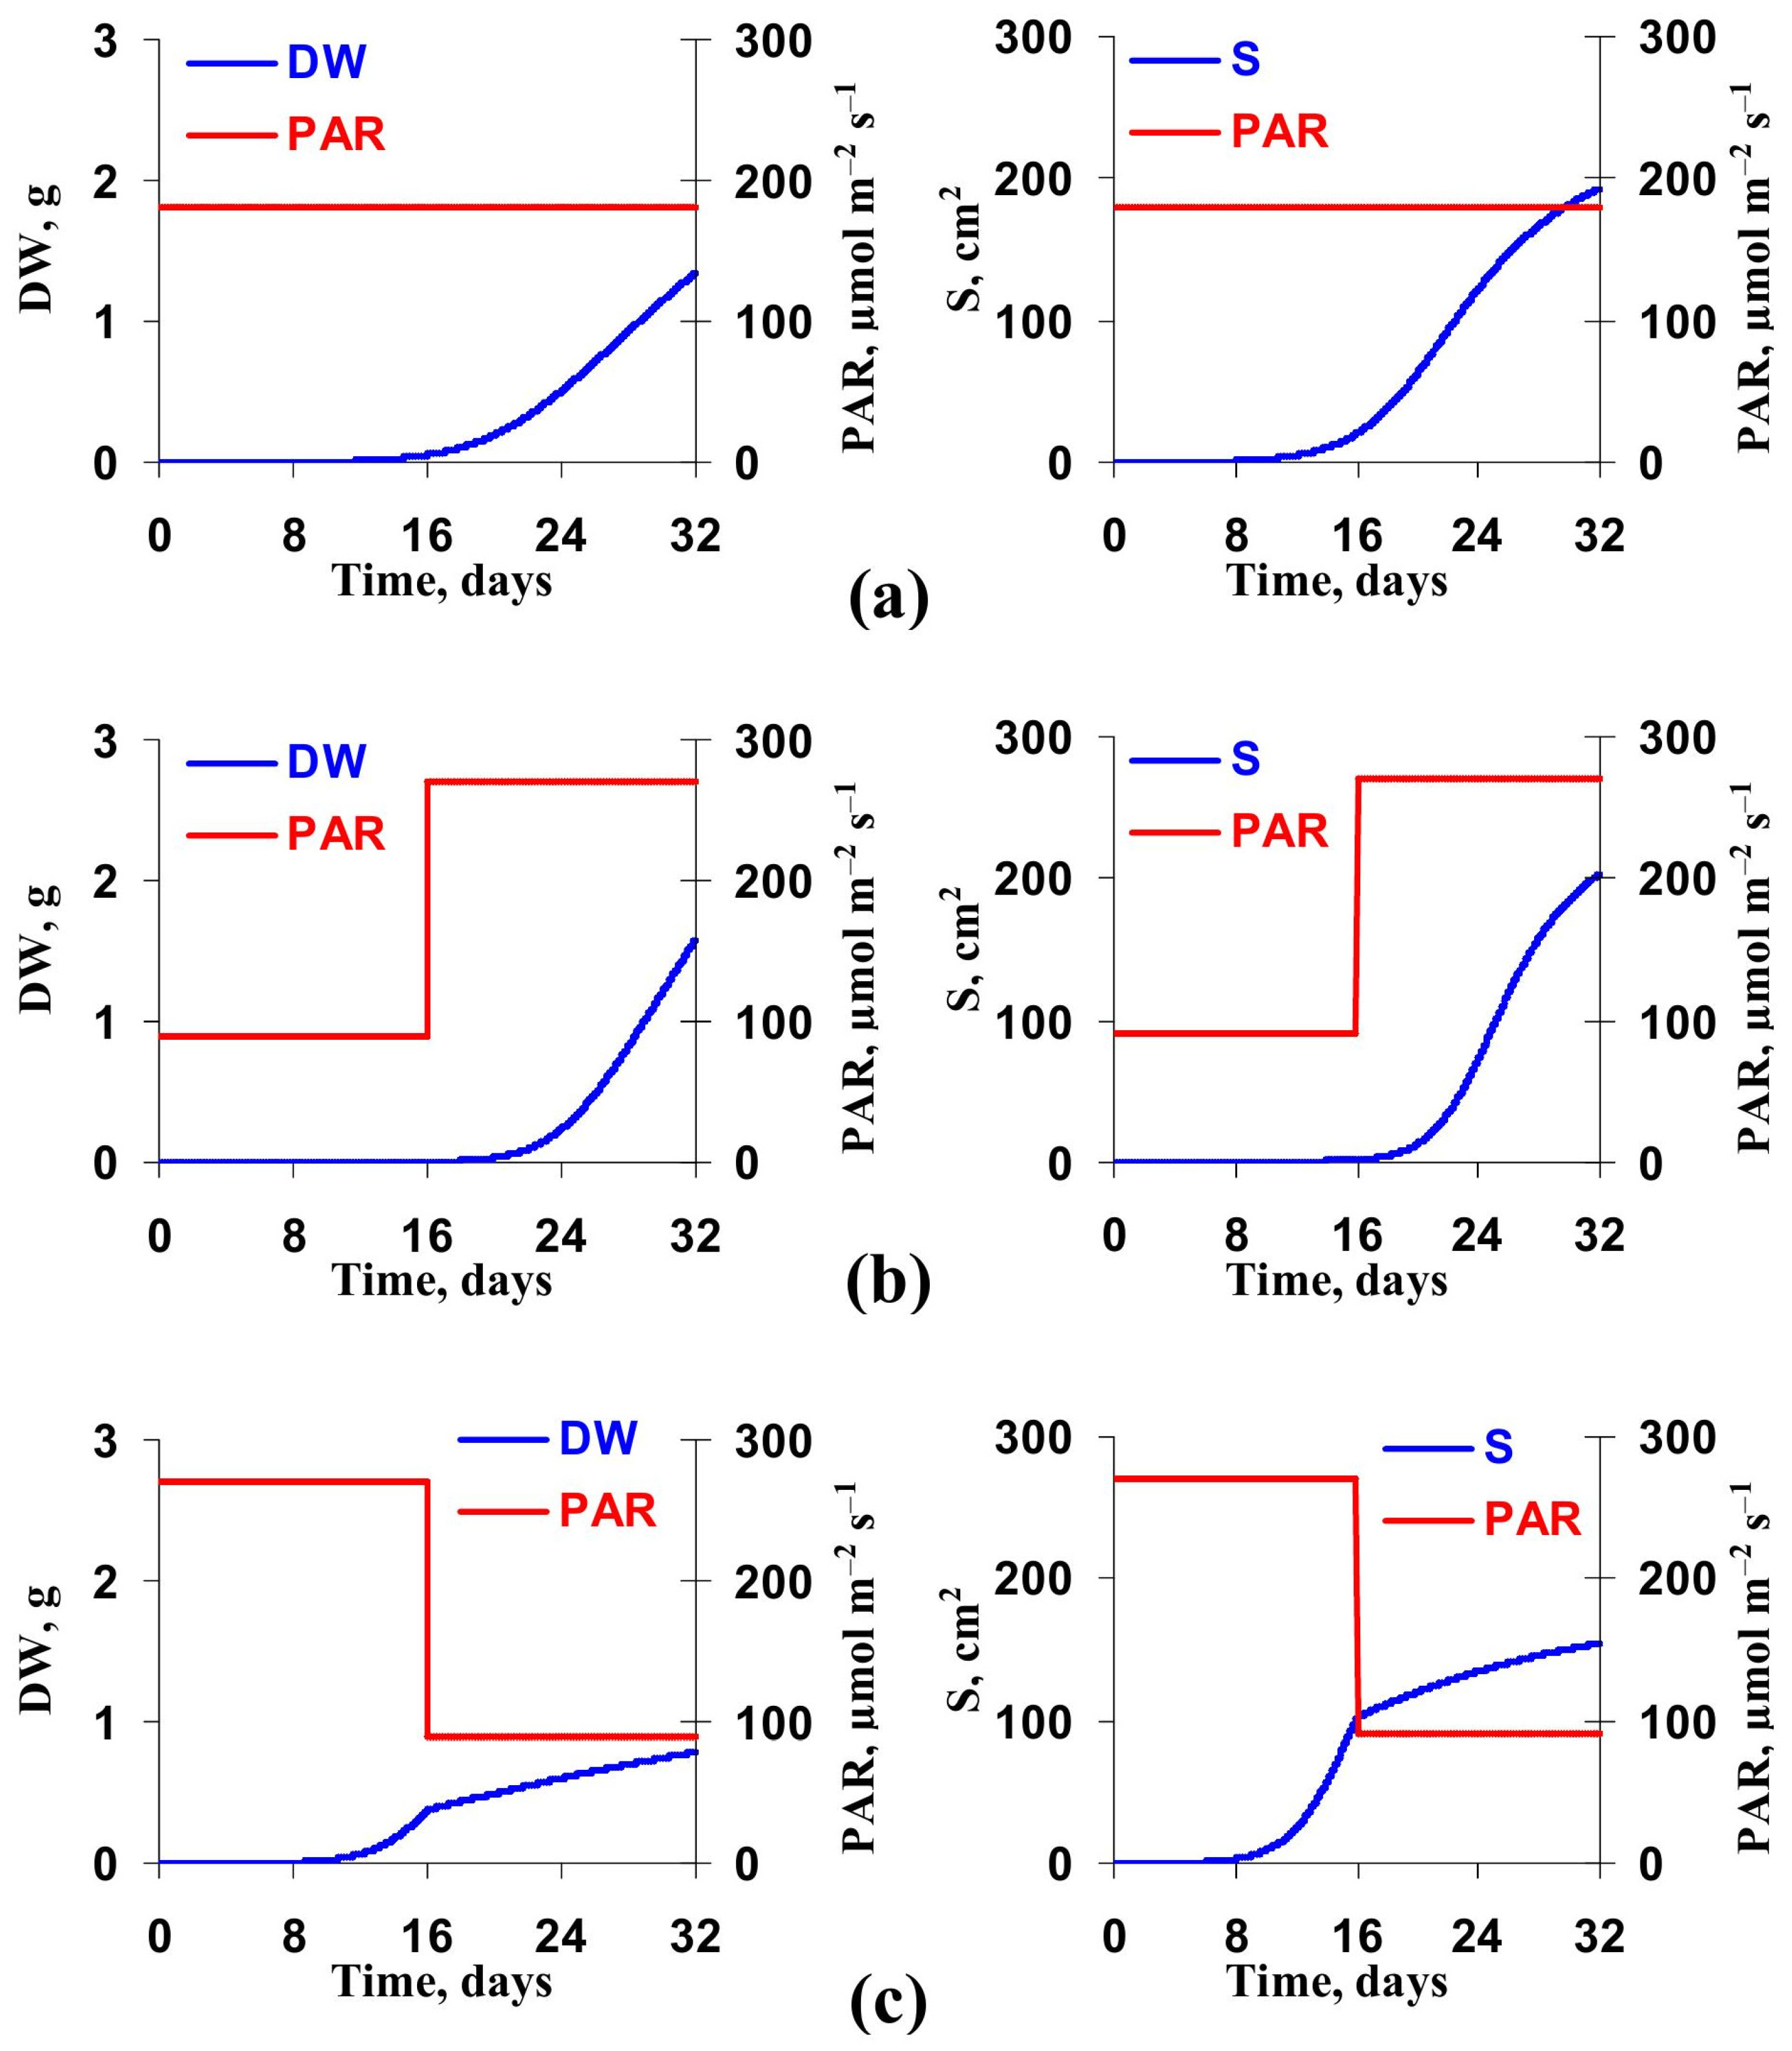
3.2. Model-Based Analysis of Influence of Changes in Light Intensity at Cultivation on the Lettuce Productivity and Growth

Potentially, optimization of the illumination at the lettuce cultivation can be also based on using time-dependent changes in the light intensity. To check this possibility, we analyzed influence of gradual increasing and decreasing PAR on the DW and S (Figure 9). The 16 h photoperiod and red variant of illumination were used. The average light intensity (180 µmol m−2 s−1) and average DLI (10.37 mol m−2 day−1) were same in all cases.
It was shown that gradual increasing PAR from 90 µmol m−2 s−1 to 270 µmol m−2 s−1 strongly increased DW and S of the lettuce plants in comparison with the action of constant PAR (Figure 9a,b). Relative values of the simulated final increasing were 61.5% (for DW) and 16.4% (for S). In contrast, gradual decreasing PAR from 270 µmol m−2 s−1 to 90 µmol m−2 s−1 strongly decreased DW and S of the lettuce plants in comparison with the action of constant PAR (Figure 9a,c). Relative values of the simulated final decreasing were 60.5% (for DW) and 36.1% (for S). These results were in a good accordance with the experimental work [57], which showed the positive influence of increasing the light intensity at the lettuce cultivation on the final DW and the negative influence of decreasing the light intensity on this characteristic.
There were two potential mechanisms of this effect: the high leaf area on the last stage of the lettuce cultivation (in accordance with [57]) and stimulation of V on the early stage of this cultivation through low initial DLI (in accordance with Figure 3). To check participation of these mechanisms, we analyzed influence of the light intensity changes at the constant V (Figure 10); other parameters were not changed. V was 2 × 10⁻⁶ g h−1 (in accordance with Figure 2b).
It was shown that magnitudes of these changes were lower (Figure 10) in comparison to corresponded magnitudes of changes simulated by the model with description of V by the exponential function (Figure 9). Relative values of the simulated final increase of DW and S in the lettuce plants under the gradual PAR increasing were 19.8% and 6.1%, respectively. Relative values of the simulated final decrease of DW and S in the lettuce plants under the gradual PAR decreasing were 26.6% and 11.2%, respectively. The absence of full elimination of influence of the light dynamics on the final DW and S at the constant V showed that both mechanisms could be participated in the revealed effect.
The gradual change in PAR is not technically simple; stepped increasing/decreasing the light intensity seems to be more suitable for using at the lettuce cultivation. Considering this point, we investigated influence of the stepped changes in PAR on dynamics of DW and S (the average PAR and DLI were not changed). It was shown (Figure 11) that the stepped increasing PAR from 90 µmol m−2 s−1 to 270 µmol m−2 s−1 increased DW and S; in contrast, the stepped decreasing PAR from 270 µmol m−2 s−1 to 90 µmol m−2 s−1 decreased DW and S.
Relative values of the simulated final increase of DW and S in the lettuce plants under the stepped PAR increasing were 71.7% and 18.2%, respectively. Relative values of simulated final decrease of DW and S in the lettuce plants under the stepped PAR decreasing were 74.5% and 51.8%, respectively. The results showed that the stepped increase of PAR was also effective for stimulation of the lettuce productivity at its cultivation under LED illumination.
Figure 12 shows influence of the stepped changes in PAR on DW and S at the constant V (the influence of DLI on this parameter was excluded). It was shown that magnitudes of changes were lower than these magnitudes simulated by the model with exponential approximation of V (Figure 11). Relative values of the simulated final increase of DW and S in the lettuce plants under the stepped PAR increasing were 17.5% and 5.5%, respectively. Relative values of simulated final decrease of DW and S in the lettuce plants under the stepped PAR decreasing were 41.6% and 19.9%, respectively. However, absence of the full elimination of these effects additionally showed that both potential mechanisms (changes in V and changes in S) could participate in the influence of long-term changes in PAR on productivity.
Thus, results of this section showed that long-term changes (gradual or stepped) in the light intensity at the lettuce cultivation can be tool to increase efficiency of this cultivation.

4. Discussion

The lettuce is the important agricultural plant which is often cultivated under artificial illumination [20,21,22,23,24,25]; blue, red, green, and white LEDs, and their combinations are widely-used light sources at this cultivation [20,24,25,58,59]. It is known that spectrum [20,21,22,25], intensity [26,27,28], and photoperiod [29,30,31,60] of LED illumination can strongly influence characteristic of lettuce plants including biomass, morphometry, parameters of photosynthesis and respiration, pigment content and others. It means that search of optimal combination of noted parameters of LED illumination has the important role for optimization of the lettuce cultivation.
The experimental search of the optimal light conditions can be restricted by large quantity of potential combinations of illumination parameters as well as by specific influence of combination of these parameters on different cultivars of lettuce plants. Particularly, green-leaved and red-leaved cultivars can have different dependences of productivity, morphometrical characteristics, and photosynthesis on spectrum, light intensity, and time regime of illumination [24,29,32]; light dependences of plant characteristics can be also differed between green-leaved cultivars [61].
Development and analysis of the mathematical model of the lettuce productivity (maybe, adapted to description of the specific cultivar) can be tool for fast search of optimal illumination conditions at the lettuce cultivation under artificial light [31]. There are mathematical models of productivity of agricultural plants at different spatial scales [35,36,37,38,39,40,62,63] which described photosynthesis (e.g., on basis of the Farquhar–von Caemmerer–Berry model [39,51,52,53]), respiration, biomass production, and leaf forming. However, complexity of these models makes difficult their adaptation to description of productivity of the lettuce plants and, especially, its specific cultivars.
An alternative way is based on development of simple descriptions of the lettuce productivity which can be parameterized for the lettuce plants and, maybe, specific cultivars. Earlier, we preliminary developed simple model of the lettuce productivity [31], which qualitatively simulated influence of the photoperiod and light intensity on the biomass (DW). The main result of the current work is modification and extended of this model, its parameterization for the lettuce cultivar “Azart” (on basis of results of the work [31]), and further verification of the model (on basis of results of the work [25]) which are shown the quantity similarity between experimental and simulated values of the dry weight, fresh weight, and area of directly illuminated leaves (the green area per plant) (Figure 2 and Figure 4). It is probable that the proposed procedure of the model parameterization can be used for other lettuce cultivars to provide the “cultivar-based” productivity models which will be tools of prediction of optimal illumination conditions for cultivation of these specific cultivars.
Additionally, verification of the developed model supports our earlier hypothesis [25] about mechanism of influence of red and blue variants of LED illumination on productivity of lettuce plants. Based on our experimental results, we supposed [25] that this influence is caused by the increased dark respiration under the increased blue light intensity and by the decreased dark respiration under the increased red light intensity. It is in an accordance with literature data [64] which shows that Rd is increased with increasing ratio of intensities of the blue and red light. The decreasing Rd under the red illumination can be related to the red-light induced activation of the phytochromes because this activation can suppress the respiratory enzymes including succinate dehydrogenase, subunits of the pyruvate dehydrogenase complex, cytochrome oxidase and fumarase [65]. The current analysis shows (Figure 5 and Figure 6) that changes in Rd in accordance experimental rates of the dark respiration [25] is a sufficient condition to imitate experimental results in quantitative manner; this point supports our hypothesis.
Complex analysis of influence of the photoperiod and light intensity of DW, DW/TLI, FW, and S (Figure 7 and Figure 8) shows potentially perspective conditions of the lettuce illumination to provide the maximal biomass (tPP = 24 h and PAR > 600 µmol m−2 s−1) or maximal efficiency of the light energy using (tPP > 20 h and PAR > 600 µmol m−2 s−1). The maximal DW of lettuce plants equaling to about 10 g is in accordance with the maximal dry weights of these plants showing in some works (6–8 g [24], 8.5–11 g [66], 8–10 g [67], and about 10 g [68]). It is important that dependences of the investigated characteristics on the photoperiod and light intensity can be differed; i.e., simultaneous changes in these parameters can increase or decrease the lettuce productivity under the same daily light integral. It is corresponded to experimental results [33,34,69] and results of our previous qualitative analysis [31] showing that the photoperiod influences biomass stronger than the light intensity.
The second result of analysis of the developed model shows that gradual or stepped increasing the light intensity at the lettuce cultivation increases the final dry weight of plants and area of directly illuminated leaves (the green area per plant) (Figure 9, Figure 10, Figure 11 and Figure 12). This result provides a potential method of additional increasing the lettuce productivity without changes in the total light integral for the cultivation time (i.e., without increasing the power consumption). The recent experimental work by Jin et al. [57] showed that this method can be potentially effective for the lettuce cultivation additionally supporting efficiency of our model. However, Jin et al. [57] experimentally investigated multi-stepped increasing PAR; analysis of the current model shows that two light intensities (the low PAR for the first half of cultivation and the high PAR for the second half of cultivation) are enough for stimulation of the lettuce productivity (Figure 11 and Figure 12). The one-stepped PAR increasing seems to be technically simpler.
Third, the current work theoretically shows two potential mechanisms of influence of the gradual and stepped PAR increasing on DW and S: (i) simultaneous increasing area of directly illuminated leaves (the green area per plant) and increasing the light intensity on last stages of the lettuce cultivation, and (ii) increasing the DW production rate, which is related to the transport of organic compounds from seed to leaves on early stages of the lettuce cultivation, caused by the low DLI on these stages. The first potential mechanism is in accordance with results of the work [57]; it is based on the simple relation between area of illuminated leaves and total productivity and seems to be probable. The second potential mechanism based on the hypothesis about regulation of initial transport of organic compounds from seed to leaves by DLI, which is corresponded with the exponential dependence of V on the DLI (Figure 3). The last mechanism is in accordance with the important role of DLI in the lettuce productivity [32,70], influence of DLI on numerous morphological, physiological, and biochemical characteristics [71], and necessity of the increased transport organic compounds from seed to leaves to form the enough area of leaves under the low DLI. However, the second mechanism is based on the additional assumption (influence of DLI on V); as a result, additional experimental and theoretical investigations of this mechanism are necessary in future.
Finally, there are several potential ways of further development of the proposed simple model of the lettuce productivity under the different light conditions. (i) Experimental checking the simulated results; particularly, investigation of the positive influence of the gradual and stepped light increasing on the lettuce productivity. (ii) Adaptation of the developed model to description of other lettuce cultivars. This way will contribute to additional verification of the model and can provide new tools for search of the optimal light conditions for cultivation of specific cultivars. (iii) Increasing accuracy of description of simulated process including using more detailed equations (e.g., the Farquhar–von Caemmerer–Berry [41,42,43]). This extended model can be potentially more effective for description of productivity under different conditions; however, procedure of the model parameterization can be more difficult in this case.
As a whole, the developed model (maybe, after its adaptation to specific lettuce cultivars) is the theoretical tool for the fast search of optimal illumination conditions for the lettuce cultivation in greenhouses. Considering that the greenhouse-based cultivation supports availability of the lettuce supply in winter and lettuce cultivation in extreme areas (e.g., Arctic area), the acceleration of the search of optimal illumination conditions has a great practical importance.

5. Conclusions

Illumination by LEDs are widely used for the lettuce cultivation in greenhouses and provides the year-round crop of this plant. However, experimental search of optimal light conditions for this cultivation is restricted by great quantity of combinations of illumination characteristics and necessity of specific light regimes for specific cultivars of lettuce. Development of mathematical models of the lettuce productivity and the model-based search of optimal illumination conditions is perspective way of minimization of influence of these restrictions.
The main result of the current work is development of the simple mathematical model of the lettuce productivity under different illumination conditions and demonstration of procedure of adaptation of this model for description of the specific lettuce cultivar (on the example of the cultivar “Azart”). Verification of the developed model supports its efficiency for the quantity description of the lettuce production. Additionally, the model-based theoretical analysis shows that gradual and stepped increasing of the light intensity at the lettuce cultivation can increase plant productivity without changes in the total light integral; i.e., this illumination regime can be used for increasing the energetic efficiency of illumination at the lettuce cultivation.
In future, the developed model will be adapted to describe productivity of other lettuce cultivars and, therefore, can be used to search of optimal illumination conditions for cultivation of these cultivars.

Author Contributions

Conceptualization, E.S. and V.S.; methodology, E.S., L.Y., Y.Z. and A.P.; software, E.S. and V.S.; investigation, E.S., L.Y., Y.Z. and A.P.; writing—original draft preparation, E.S. and V.S.; writing—review and editing, V.S.; supervision, V.S.; project administration, L.Y. All authors have read and agreed to the published version of the manuscript.

Funding

This research was funded by a grant from the Ministry of Science and Higher Education of the Russian Federation for large scientific projects in priority areas of scientific and technological development (subsidy identifier 075-15-2020-774).

Data Availability Statement

The data presented in this study are available upon request from the corresponding author.

Conflicts of Interest

The authors declare no conflict of interest. The funders had no role in the design of the study; in the collection, analyses, or interpretation of data; in the writing of the manuscript; or in the decision to publish the results.

References

  1. Landi, M.; Zivcak, M.; Sytar, O.; Brestic, M.; Allakhverdiev, S.I. Plasticity of photosynthetic processes and the accumulation of secondary metabolites in plants in response to monochromatic light environments: A review. Biochim. Biophys. Acta Bioenerg. 2020, 1861, 148131. [Google Scholar] [CrossRef] [PubMed]
  2. Ptushenko, O.S.; Ptushenko, V.V.; Solovchenko, A.E. Spectrum of light as a determinant of plant functioning: A historical perspective. Life 2020, 10, 25. [Google Scholar] [CrossRef] [PubMed]
  3. Allakhverdiev, S.I. Recent progress in the studies of structure and function of photosystem II. J. Photochem. Photobiol. B 2011, 104, 1–8. [Google Scholar] [CrossRef] [PubMed]
  4. Johnson, M.P. Photosynthesis. Essays Biochem. 2016, 60, 255–273. [Google Scholar] [CrossRef]
  5. Govindjee; Shevela, D.; Björn, L.O. Evolution of the Z-scheme of photosynthesis: A perspective. Photosynth. Res. 2017, 133, 5–15. [Google Scholar] [CrossRef]
  6. Stirbet, A.; Lazár, D.; Guo, Y.; Govindjee, G. Photosynthesis: Basics, history and modelling. Ann. Bot. 2020, 126, 511–537. [Google Scholar] [CrossRef]
  7. Joliot, P.; Joliot, A. Cyclic electron flow in C3 plants. Biochim. Biophys. Acta 2006, 1757, 362–368. [Google Scholar] [CrossRef]
  8. Tikkanen, M.; Grieco, M.; Nurmi, M.; Rantala, M.; Suorsa, M.; Aro, E.M. Regulation of the photosynthetic apparatus under fluctuating growth light. Philos. Trans. R. Soc. Lond. B Biol. Sci. 2012, 367, 3486–3493. [Google Scholar] [CrossRef]
  9. Ruban, A.V. Nonphotochemical chlorophyll fluorescence quenching: Mechanism and effectiveness in protecting plants from photodamage. Plant Physiol. 2016, 170, 1903–1916. [Google Scholar] [CrossRef]
  10. Kaiser, E.; Morales, A.; Harbinson, J. Fluctuating light takes crop photosynthesis on a rollercoaster ride. Plant Physiol. 2018, 176, 977–989. [Google Scholar] [CrossRef]
  11. Sukhova, E.; Khlopkov, A.; Vodeneev, V.; Sukhov, V. Simulation of a nonphotochemical quenching in plant leaf under different light intensities. Biochim. Biophys. Acta Bioenerg. 2020, 1861, 148138. [Google Scholar] [CrossRef] [PubMed]
  12. Sukhova, E.; Sukhov, V. Relation of photochemical reflectance indices based on different wavelengths to the parameters of light reactions in photosystems I and II in pea plants. Remote Sens. 2020, 12, 1312. [Google Scholar] [CrossRef]
  13. Murata, N.; Takahashi, S.; Nishiyama, Y.; Allakhverdiev, S.I. Photoinhibition of photosystem II under environmental stress. Biochim. Biophys. Acta 2007, 1767, 414–421. [Google Scholar] [CrossRef] [PubMed]
  14. Goh, C.-H.; Ko, S.-M.; Koh, S.; Kim, Y.-J.; Bae, H.-J. Photosynthesis and environments: Photoinhibition and repair mechanisms in plants. J. Plant Biol. 2012, 55, 93–101. [Google Scholar] [CrossRef]
  15. Tikkanen, M.; Aro, E.M. Integrative regulatory network of plant thylakoid energy transduction. Trends Plant Sci. 2014, 19, 10–17. [Google Scholar] [CrossRef]
  16. Murata, N.; Nishiyama, Y. ATP is a driving force in the repair of photosystem II during photoinhibition. Plant Cell Environ. 2018, 41, 285–299. [Google Scholar] [CrossRef]
  17. Rahman, M.M.; Field, D.L.; Ahmed, S.M.; Hasan, M.T.; Basher, M.K.; Alameh, K. LED illumination for high-quality high-yield crop growth in protected cropping environments. Plants 2021, 10, 2470. [Google Scholar] [CrossRef]
  18. Ma, Y.; Xu, A.; Cheng, Z.-M. Effects of light emitting diode lights on plant growth, development and traits a meta-analysis. Hort. Plant J. 2021, 7, 552–564. [Google Scholar] [CrossRef]
  19. Lazzarin, M.; Meisenburg, M.; Meijer, D.; van Ieperen, W.; Marcelis, L.F.M.; Kappers, I.F.; van der Krol, A.R.; van Loon, J.J.A.; Dicke, M. LEDs make it resilient: Effects on plant growth and defense. Trends Plant Sci. 2021, 26, 496–508. [Google Scholar] [CrossRef]
  20. Zha, L.; Liu, W.; Yang, Q.; Zhang, Y.; Zhou, C.; Shao, M. Regulation of ascorbate accumulation and metabolism in lettuce by the red:blue ratio of continuous light using LEDs. Front. Plant Sci. 2020, 11, 704. [Google Scholar] [CrossRef]
  21. Chen, X.L.; Li, Y.L.; Wang, L.C.; Guo, W.Z. Red and blue wavelengths affect the morphology, energy use efficiency and nutritional content of lettuce (Lactuca sativa L.). Sci. Rep. 2021, 11, 8374. [Google Scholar] [CrossRef] [PubMed]
  22. Izzo, L.G.; Mickens, M.A.; Aronne, G.; Gómez, C. Spectral effects of blue and red light on growth, anatomy, and physiology of lettuce. Physiol. Plant. 2021, 172, 2191–2202. [Google Scholar] [CrossRef] [PubMed]
  23. Razzak, M.A.; Asaduzzaman, M.; Tanaka, H.; Asao, T. Effects of supplementing green light to red and blue light on the growth and yield of lettuce in plant factories. Sci. Hort. 2022, 305, 111429. [Google Scholar] [CrossRef]
  24. Alrajhi, A.A.; Alsahli, A.S.; Alhelal, I.M.; Rihan, H.Z.; Fuller, M.P.; Alsadon, A.A.; Ibrahim, A.A. The effect of LED light spectra on the growth, yield and nutritional value of red and green lettuce (Lactuca sativa). Plants 2023, 12, 463. [Google Scholar] [CrossRef]
  25. Yudina, L.; Sukhova, E.; Mudrilov, M.; Nerush, V.; Pecherina, A.; Smirnov, A.A.; Dorokhov, A.S.; Chilingaryan, N.O.; Vodeneev, V.; Sukhov, V. Ratio of intensities of blue and red light at cultivation influences photosynthetic light reactions, respiration, growth, and reflectance indices in lettuce. Biology 2022, 11, 60. [Google Scholar] [CrossRef]
  26. Zhou, J.; Li, P.; Wang, J.; Fu, W. Growth, photosynthesis, and nutrient uptake at different light intensities and temperatures in lettuce. Hort. Sci. 2019, 54, 1925–1933. [Google Scholar] [CrossRef]
  27. Cammarisano, L.; Donnison, I.S.; Robson, P.R.H. The effect of red & blue rich LEDs vs fluorescent light on Lollo Rosso lettuce morphology and physiology. Front. Plant Sci. 2021, 12, 603411. [Google Scholar]
  28. Iqbal, Z.; Munir, M.; Sattar, M.N. Morphological, biochemical, and physiological response of butterhead lettuce to photo-thermal environments. Horticulturae 2022, 8, 515. [Google Scholar] [CrossRef]
  29. Smirnov, A.A.; Semenova, N.A.; Dorokhov, A.S.; Proshkin, Y.A.; Godyaeva, M.M.; Vodeneev, V.; Sukhov, V.; Panchenko, V.; Chilingaryan, N.O. Influence of Pulsed, Scanning and Constant (16- and 24-h) Modes of LED irradiation on the physiological, biochemical and morphometric parameters of lettuce plants (Lactuca sativa L.) while cultivated in vertical farms. Agriculture 2022, 12, 1988. [Google Scholar] [CrossRef]
  30. Shen, Y.Z.; Guo, S.S.; Ai, W.D.; Tang, Y.K. Effects of illuminants and illumination time on lettuce growth, yield and nutritional quality in a controlled environment. Life Sci. Space Res. 2014, 2, 38–42. [Google Scholar] [CrossRef]
  31. Yudina, L.; Sukhova, E.; Gromova, E.; Mudrilov, M.; Zolin, Y.; Popova, A.; Nerush, V.; Pecherina, A.; Grishin, A.A.; Dorokhov, A.A.; et al. Effect of duration of LED lighting on growth, photosynthesis and respiration in lettuce. Plants 2023, 12, 442. [Google Scholar] [CrossRef] [PubMed]
  32. Kelly, N.; Choe, D.; Meng, Q.; Runkle, E.S. Promotion of lettuce growth under an increasing daily light integral depends on the combination of the photosynthetic photon flux density and photoperiod. Sci. Hort. 2020, 272, 109565. [Google Scholar] [CrossRef]
  33. Elkins, G.; van Iersel, M.W. Longer photoperiods with the same daily light integral improve growth of rudbeckia seedlings in a greenhouse. HortScience 2020, 55, 573–580. [Google Scholar] [CrossRef]
  34. Weaver, G.; van Iersel, M.W. Longer photoperiods with adaptive lighting control can improve growth of greenhouse-grown ‘Little Gem’ lettuce (Lactuca sativa). HortScience 2020, 55, 1676–1682. [Google Scholar] [CrossRef]
  35. Bouman, B.A.M.; van Keulen, H.; van Laar, H.H.; Rabbinge, R. The ‘School of de Wit’ crop growth simulation models: A pedigree and historical overview. Agric. Syst. 1996, 52, 171–198. [Google Scholar] [CrossRef]
  36. Wu, A.; Song, Y.; van Oosterom, E.J.; Hammer, G.L. Connecting biochemical photosynthesis models with crop models to support crop improvement. Front. Plant Sci. 2016, 7, 1518. [Google Scholar] [CrossRef]
  37. Brilli, L.; Bechini, L.; Bindi, M.; Carozzi, M.; Cavalli, D.; Conant, R.; Dorich, C.D.; Doro, L.; Ehrhardt, F.; Farina, R.; et al. Review and analysis of strengths and weaknesses of agro-ecosystem models for simulating C and N fluxes. Sci. Total Environ. 2017, 598, 445–470. [Google Scholar] [CrossRef]
  38. Gu, S.; Zhang, L.; Yan, Z.; van der Werf, W.; Evers, J.B. Quantifying within-plant spatial heterogeneity in carbohydrate availability in cotton using a local-pool model. Ann. Bot. 2018, 121, 1005–1017. [Google Scholar] [CrossRef]
  39. Wu, A.; Doherty, A.; Farquhar, G.D.; Hammer, G.L. Simulating daily field crop canopy photosynthesis: An integrated software package. Funct. Plant Biol. 2018, 45, 362–377. [Google Scholar] [CrossRef]
  40. Sukhova, E.M.; Vodeneev, V.A.; Sukhov, V.S. Mathematical modeling of photosynthesis and analysis of plant productivity. Biochem. Suppl. Ser. A Membr. Cell Biol. 2021, 15, 52–72. [Google Scholar] [CrossRef]
  41. Farquhar, G.D.; von Caemmerer, S.; Berry, J.A. A biochemical model of photosynthetic CO2 assimilation in leaves of C 3 species. Planta 1980, 149, 78–90. [Google Scholar] [CrossRef] [PubMed]
  42. von Caemmerer, S.; Farquhar, G.; Berry, J. Biochemical model of C3 photosynthesis. In Photosynthesis in Silico; Laisk, A., Nedbal, L., Govindjee, Eds.; Advances in Photosynthesis and Respiration; Springer: Dordrecht, Germany, 2009; Volume 29, pp. 209–230. [Google Scholar]
  43. Bernacchi, C.J.; Rosenthal, D.M.; Pimentel, C.; Long, S.P.; Farquhar, G.D. Modeling the temperature dependence of C3. In Photosynthesis In Silico; Laisk, A., Nedbal, L., Govindjee, Eds.; Advances in Photosynthesis and Respiration; Springer: Dordrecht, Germany, 2009; Volume 29, pp. 231–246. [Google Scholar]
  44. Amthor, J.S. Scaling CO2-photosynthesis relationships from the leaf to the canopy. Photosynth. Res. 1994, 39, 321–350. [Google Scholar] [CrossRef] [PubMed]
  45. De Pury, D.G.G.; Farquhar, D.G. Simple scaling of photosynthesis from leaves to canopy without the errors of bigleaf models. Plant Cell Environ. 1997, 20, 537–557. [Google Scholar] [CrossRef]
  46. Buckley, T.N.; Farquhar, G.D. A new analytical model for whole-leaf potential electron transport rate. Plant Cell Environ. 2004, 27, 1487–1502. [Google Scholar] [CrossRef]
  47. Sukhova, E.; Ratnitsyna, D.; Gromova, E.; Sukhov, V. Development of two-dimensional model of photosynthesis in plant leaves and analysis of induction of spatial heterogeneity of CO2 assimilation rate under action of excess light and drought. Plants 2022, 11, 3285. [Google Scholar] [CrossRef] [PubMed]
  48. Sukhova, E.; Ratnitsyna, D.; Sukhov, V. Simulated analysis of influence of changes in H+-ATPase activity and membrane CO2 conductance on parameters of photosynthetic assimilation in leaves. Plants 2022, 11, 3435. [Google Scholar] [CrossRef]
  49. Bernacchi, C.J.; Bagley, J.E.; Serbin, S.P.; Ruiz-Vera, U.M.; Rosenthal, D.M.; Vanloocke, A. Modelling C3 photosynthesis from the chloroplast to the ecosystem. Plant Cell Environ. 2013, 36, 1641–1657. [Google Scholar] [CrossRef]
  50. Ratnitsyna, D.; Yudina, L.; Sukhova, E.; Sukhov, V. Development of modified Farquhar–von Caemmerer–Berry model describing photodamage of photosynthetic electron transport in C3 plants under different temperatures. Plants 2023, 12, 3211. [Google Scholar] [CrossRef]
  51. Pietsch, S.A.; Hasenauer, H. Photosynthesis within large-scale ecosystem models. In Photosynthesis in Silico; Laisk, A., Nedbal, L., Govindjee, Eds.; Advances in Photosynthesis and Respiration; Springer: Dordrecht, Germany, 2009; Volume 29, pp. 441–464. [Google Scholar]
  52. Yin, X.; Struik, P.C. Can increased leaf photosynthesis be converted into higher crop mass production? A simulation study for rice using the crop model GECROS. J. Exp. Bot. 2017, 68, 2345–2360. [Google Scholar] [CrossRef]
  53. Harbinson, J.; Yin, X. Modelling the impact of improved photosynthetic properties on crop performance in Europe. Food Energy Sec. 2022, 12, e402. [Google Scholar] [CrossRef]
  54. Zhou, J.; Wang, J.Z.; Hang, T.; Li, P.P. Photosynthetic characteristics and growth performance of lettuce (Lactuca sativa L.) under different light/dark cycles in mini plant factories. Photosynthetica 2020, 58, 740–747. [Google Scholar] [CrossRef]
  55. Hikosaka, K.; Kumagai, T.; Ito, A. Modeling canopy photosynthesis. In Canopy Photosynthesis: From Basics to Applications; Hikosaka, K., Niinemets, Ü., Anten, N., Eds.; Advances in Photosynthesis and Respiration (Including Bioenergy and Related Processes); Springer: Dordrecht, Germany, 2016; pp. 239–268. [Google Scholar]
  56. Lee, M.-J.; Son, K.-H.; Oh, M.-M. Increase in biomass and bioactive compounds in lettuce under various ratios of red to far-red LED light supplemented with blue LED light. Hortic. Environ. Biotech. 2016, 57, 139–147. [Google Scholar] [CrossRef]
  57. Jin, W.; Ji, Y.; Larsen, D.H.; Huang, Y.; Heuvelink, E.; Marcelis, L.F.M. Gradually increasing light intensity during the growth period increases dry weight production compared to constant or gradually decreasing light intensity in lettuce. Sci. Hort. 2023, 311, 111807. [Google Scholar] [CrossRef]
  58. Muneer, S.; Kim, E.J.; Park, J.S.; Lee, J.H. Influence of green, red and blue light emitting diodes on multiprotein complex proteins and photosynthetic activity under different light intensities in lettuce leaves (Lactuca sativa L.). Int. J. Mol. Sci. 2014, 15, 4657–4670. [Google Scholar] [CrossRef]
  59. Samuolienė, G.; Viršilė, A.; Miliauskienė, J.; Haimi, P.J.; Laužikė, K.; Brazaitytė, A.; Duchovskis, P. The physiological response of lettuce to red and blue light dynamics over different photoperiods. Front. Plant Sci. 2021, 11, 610174. [Google Scholar] [CrossRef] [PubMed]
  60. Zhang, X.; He, D.; Niu, G.; Yan, Z.; Song, J. Effects of environment lighting on the growth, photosynthesis, and quality of hydroponic lettuce in a plant factory. Int. J. Agric. Biol. Eng. 2018, 11, 33–40. [Google Scholar] [CrossRef]
  61. Bhuiyan, R.; van Iersel, M.W. Only extreme fluctuations in light levels reduce lettuce growth under sole source lighting. Front. Plant Sci. 2021, 12, 619973. [Google Scholar] [CrossRef]
  62. Sellers, P.J.; Dickinson, R.E.; Randall, D.A.; Betts, A.K.; Hall, F.G.; Berry, J.A.; Collatz, G.J.; Denning, A.S.; Mooney, H.A.; Nobre, C.A.; et al. Modeling the exchanges of energy, water, and carbon between continents and the atmosphere. Science 1997, 275, 502–509. [Google Scholar] [CrossRef]
  63. Weiss, M.; Troufleau, D.; Baret, F.; Chauki, H.; Prévot, L.; Olioso, A.; Bruguier, N.; Brisson, N. Coupling canopy functioning and radiative transfer models for remote sensing data assimilation. Agric. Forest Meteorol. 2001, 108, 113–128. [Google Scholar] [CrossRef]
  64. Hogewoning, S.W.; Trouwborst, G.; Maljaars, H.; Poorter, H.; van Ieperen, W.; Harbinson, J. Blue light dose-responses of leaf photosynthesis, morphology, and chemical composition of Cucumis sativus grown under different combinations of red and blue light. J. Exp. Bot. 2010, 61, 3107–3117. [Google Scholar] [CrossRef]
  65. Igamberdiev, A.U.; Eprintsev, A.T.; Fedorin, D.N.; Popov, V.N. Phytochrome-mediated regulation of plant respiration and photorespiration. Plant Cell Environ. 2014, 37, 290–299. [Google Scholar] [CrossRef] [PubMed]
  66. Palmer, S.; van Iersel, M.W. Increasing growth of lettuce and mizuna under sole-source LED lighting using longer photoperiods with the same daily light integral. Agronomy 2020, 10, 1659. [Google Scholar] [CrossRef]
  67. Kong, Y.; Nemali, K. Blue and far-red light affect area and number of individual leaves to influence vegetative growth and pigment synthesis in lettuce. Front. Plant Sci. 2021, 12, 667407. [Google Scholar] [CrossRef] [PubMed]
  68. Modarelli, G.C.; Paradiso, R.; Arena, C.; De Pascale, S.; Van Labeke, M.-C. High light intensity from blue-red LEDs enhance photosynthetic performance, plant growth, and optical properties of red lettuce in controlled environment. Horticulturae 2022, 8, 114. [Google Scholar] [CrossRef]
  69. Zhen, S.; Bugbee, B. Substituting far-red for traditionally defined photosynthetic photons results in equal canopy quantum yield for CO2 fixation and increased photon capture during long-term studies: Implications for re-defining PAR. Front. Plant Sci. 2020, 11, 581156. [Google Scholar] [CrossRef]
  70. Baumbauer, D.A.; Schmidt, C.B.; Burgess, M.H. Leaf lettuce yield is more sensitive to low daily light integral than kale and spinach. Hort. Sci. 2019, 54, 2159–2162. [Google Scholar] [CrossRef]
  71. Poorter, H.; Niinemets, Ü.; Ntagkas, N.; Siebenkäs, A.; Mäenpää, M.; Matsubara, S.; Pons, T. A meta-analysis of plant responses to light intensity for 70 traits ranging from molecules to whole plant performance. New Phytol. 2019, 223, 1073–1105. [Google Scholar] [CrossRef]
Figure 1. (a) Scheme of the simple model of the lettuce productivity. DW (g) is the dry weight of rosette of leaves. γ is the fraction of the produced DW distributed to the leaf rosette. CDW (g m2 s1 µmol−1 cm−2 h−1) is the proportionality constant for conversion of µmol m−2 s−1 (rates of the assimilation of CO2 or respiration) into g cm−2 h−1 (rates of the production or consumption of DW per 1 cm2). Ahv1·PAR) and Ahv2·PAR) are photosynthetic CO2 assimilation rates (µmol m−2 s−1) under the specific light intensity (PAR, µmol m−2 s−1) in the first and second layers of leaves, respectively. β1 and β2 are fractions of PAR absorbed by the first and second layers of leaves, respectively. f (λ) is spectrum of illumination of the light source. α (λ) is spectrum of the leaf light absorption. λ is wavelength. S1 (DW) and S2 (DW) are areas (cm2) of the first and second layers of leaves, respectively. Smax is the maximum S1 and S2. KS is value equaling to the DW at S1 (DW) = 0.5·Smax. tPP (h) is photoperiod. 24 (h) is the duration of the full light-dark cycle. V (g h−1) is the DW production rate caused by the transport of organic compounds from seed to leaves. Rd (µmol m−2 s−1) is the dark respiration rate. CR/DW (cm2 g−1) is the proportionality constant for conversion of g cm−2 h−1 (rate of the DW consumption per 1 cm2) into h−1 (rate of the DW consumption per 1 g of DW). (b) Spectrum of light absorption by the lettuce leaves (based on the experiment described in Yudina et al. [31]).
Horticulturae 09 01259 g001
Figure 2. Experimental and simulated dynamics of increasing the dry weight of the lettuce leaf rosette (DW) (a), its fresh weight (FW) (b), and green area per plant (S) (c) at 8, 16, and 24 h photoperiods (tPP). Experimental results from the work [31] were used. V was separately fitted for each photoperiod to maximize correspondence between the experimental and simulated DW; it was 1.1 × 10⁻⁵ g h−1 (tPP = 8 h), 2.0 × 10⁻⁶ g h−1 (tPP = 16 h), and 1.5 × 10⁻⁷ g h−1 (tPP = 24 h). The 180 µmol m−2 s−1 light intensity (red variant) was used. Rd was 0.769 µmol m−2 s−1. Simulated S was equaled to S1 (DW). R2 is the determination coefficient showing similarity between the simulated dependence and corresponded experimental one.
Horticulturae 09 01259 g002
Figure 3. Dependence of V on daily light integral (DLI) and exponential approximation of this dependence. Values of V from Figure 2 were used. DLI was calculated as PAR·tPP·0.0036. R is the determination coefficient for the exponential approximation.
Horticulturae 09 01259 g003
Figure 4. Simulated dynamics of increasing the dry weight of the lettuce leaf rosette (DW) (a), its fresh weight (FW) (b), and green area per plant (S) (c) at 8, 16, and 24 h photoperiods (tPP). V was calculated as function of DLI on basis of the exponential approximation (see Figure 3). The 180 µmol m−2 s−1 light intensity (red variant) was used. Rd was 0.769 µmol m−2 s−1. Simulated S was equaled to S1 (DW). R2 is the determination coefficient showing similarity between the simulated dependence and corresponded experimental one (see Figure 2).
Horticulturae 09 01259 g004
Figure 5. Experimental and simulated values of DW (a) and FW (b) after 25 days of the lettuce cultivation under red and blue variants of LED illumination. Experimental results from the work [25] were used. Rd = 0.592 µmol m−2 s−1 (the red variant) and Rd = 0.987 µmol m−2 s−1 (the blue variant) were used for the simulation. V was calculated as function of DLI on basis of the exponential approximation (see Figure 3). The 180 µmol m−2 s−1 light intensity was used.
Horticulturae 09 01259 g005
Figure 6. Experimental and simulated dynamics of S under red and blue variants of LED illumination. Experimental results from the work [25] were used. Rd = 0.592 µmol m−2 s−1 (the red variant) and Rd = 0.987 µmol m−2 s−1 (the blue variant) were used for the simulation. V was calculated as function of DLI on basis of the exponential approximation (see Figure 3). The 180 µmol m−2 s−1 light intensity was used. Simulated S was equaled to S1 (DW). R2 is the determination coefficient showing similarity between the simulated dependence and corresponded experimental one.
Horticulturae 09 01259 g006
Figure 7. Simulated values of DW (a) and DW/TLI (b) under the different photoperiod and light intensity (PAR) after 32 days of the lettuce cultivation. TLI is the total light integral for all cultivation time. V was calculated as function of DLI on basis of the exponential approximation (see Figure 3). The red variant of illumination was used. Rd was 0.769 µmol m−2 s−1.
Horticulturae 09 01259 g007
Figure 8. Simulated values of FW (a) and S (b) under the different photoperiod and light intensity (PAR) after 32 days of the lettuce cultivation. V was calculated as function of DLI on basis of the exponential approximation (see Figure 3). The red variant of illumination was used. Rd was 0.769 µmol m−2 s−1. Simulated S was equaled to S1 (DW).
Horticulturae 09 01259 g008
Figure 9. Simulated dynamics of DW and S under the constant PAR (a), gradual increasing PAR (b), and gradual decreasing PAR (c) at the lettuce cultivation. Photoperiod was 16 h. V was calculated as function of DLI on basis of the exponential approximation (see Figure 3). The average PAR was 180 µmol m−2 s−1 (red variant); the average DLI was 10.37 mol m−2 day−1. Rd was 0.769 µmol m−2 s−1.
Horticulturae 09 01259 g009
Figure 10. Simulated dynamics of DW and S under the constant PAR (a), gradual increasing PAR (b), and gradual decreasing PAR (c) at the lettuce cultivation. Photoperiod was 16 h. V was 2 × 10⁻⁶ g h−1 (in accordance with Figure 2b). The average PAR was 180 µmol m−2 s−1 (red variant); the average DLI was 10.37 mol m−2 day−1. Rd was 0.769 µmol m−2 s−1.
Horticulturae 09 01259 g010
Figure 11. Simulated dynamics of DW and S under the constant PAR (a), stepped increasing PAR (b), and stepped decreasing PAR (c) at the lettuce cultivation. Photoperiod was 16 h. V was calculated as function of DLI on basis of the exponential approximation (see Figure 3). The average PAR was 180 µmol m−2 s−1 (red variant); the average DLI was 10.37 mol m−2 day−1. Rd was 0.769 µmol m−2 s−1.
Horticulturae 09 01259 g011
Figure 12. Simulated dynamics of DW and S under the constant PAR (a), stepped increasing PAR (b), and stepped decreasing PAR (c) at the lettuce cultivation. Photoperiod was 16 h. V was 2 × 10⁻⁶ g h−1 (in accordance with Figure 2b). The average PAR was 180 µmol m−2 s−1 (red variant); the average DLI was 10.37 mol m−2 day−1. Rd was 0.769 µmol m−2 s−1.
Horticulturae 09 01259 g012
Disclaimer/Publisher’s Note: The statements, opinions and data contained in all publications are solely those of the individual author(s) and contributor(s) and not of MDPI and/or the editor(s). MDPI and/or the editor(s) disclaim responsibility for any injury to people or property resulting from any ideas, methods, instructions or products referred to in the content.

