Article

Establishment and Optimization of Flavonoid Extraction and Detection System for Hemerocallis

1
College of Horticulture, Shanxi Agricultural University, Taigu 030801, China
2
Datong Daylily Industrial Development Research Institute, Datong 037300, China
3
Guangling Country Reform and Economy Affairs Center, Guangling 037500, China
*
Author to whom correspondence should be addressed.
Horticulturae 2023, 9(11), 1233; https://doi.org/10.3390/horticulturae9111233
Submission received: 5 October 2023 / Revised: 3 November 2023 / Accepted: 13 November 2023 / Published: 15 November 2023
(This article belongs to the Topic Bioactive Substances, Pharmacognosy and Metabolomics)

Abstract

:
Hemerocallis is a characteristic vegetable with outstanding edible and medicinal value. Flavonoids are important bioactive components of Hemerocallis. To improve the extraction efficiency and detection accuracy of flavonoids from Hemerocallis, we established a high-performance liquid chromatography (HPLC) detection system, which can simultaneously detect multiple flavonoids. In addition to the previously developed organic solvent extraction method, an ultrasonic-assisted extraction technique that uses fewer samples was established to extract flavonoids from Hemerocallis. The extraction conditions of the ultrasonic-assisted extraction were optimized via a single-factor experiment and a response surface experiment. The HPLC system detected and determined the contents of rutin, isoquercetin, myricetin, quercetin, apigenin, and diosmetin from 70 Hemerocallis germplasm resources. In addition, we evaluated the antioxidant activity of flavonoids in Hemerocallis using DPPH free radical scavenging capacity with ascorbic acid (Vc) as a positive control. The results showed that the optimum conditions for the ultrasonic extraction process were as follows: sample weight of 0.25 g, ethanol volume fraction of 72%, ethanol volume of 2.5 mL, and ultrasonic extraction time of 17 min. Under these conditions, flavonoid extraction had a strong scavenging effect on DPPH. With the increase in the sample solutions’ concentrations, its antioxidant capacity was gradually enhanced, and the DPPH scavenging rate reached 70.2%. The optimized ultrasonic-assisted extraction technology can increase the total content of six flavonoids in day lily bud by 59.01%, especially the content of rutin (increased by 64.41%) in Hemerocallis flower buds. Among 70 Hemerocallis plant resources, we selected materials H0087 and H0059 with high and stable flavonoid content, with the total content of six substances being 4390.54 ug/g and 3777.13 ug/g. Thus, this study provides a reference for extracting and determining flavonoid contents in Hemerocallis materials. It also provides a theoretical basis for high-quality individual plant breeding.

1. Introduction

Hemerocallis, commonly known as day lily, is a perennial herb belonging to Hemerocallinae of the Aphoriaceae family. It contains 14 species, among which 11 are found in China thus making China the distribution center of Hemerocallis germplasm resources world-wide [1]. Hemerocallis has ornamental, nutritional, and medicinal values and is widely cultivated worldwide. Flavonoids, anthraquinones, terpenoids, naphthalene glycosides, phenylethanoid glycosides, lignans, and other compounds have been isolated and identified in Hemerocallis. These compounds have sedative, hypnotic, antidepressant, antioxidant, antitumor, liver protection, antibacterial, and insecticidal activities [2,3]. Flavonoids are widely used in treating diseases and food additives and are the main secondary metabolite in the day lily.
In recent years, researchers have been interested in a small number of natural compounds existing in plants, because they are beneficial to human health and have the characteristics of eco-friendliness [4]. Flavonoids, also known as bioflavonoids, have the basic chemical structure of C6-C3-C6 [5] and widely exist in Rutaceae [6], Labiatae [7] Leguminosae [8], Ginkgo biloba [9], and Compositae [10]. Flavonoids have phenolic hydroxyl, methoxy, methyl, isopentenyl, and other functional groups and can be divided into subclasses such as flavonalcohols, dihydroflavonoids, isoflavones, chalcones, and flavanols. Flavonoids obtained from buckwheat [11], soybean [12], and gingko [13] have demonstrated many medicinal functions, such as neuroprotection, antioxidation, antidepressant activities, and prevention of cardiovascular diseases [14,15]. Flavonoids are widely used because of their anti-oxidation, analgesic and anti-inflammatory effects and safe preclinical and clinical applications [16]. Furthermore, flavonoids have many applications in food industry, such as preservatives, pigments, and antioxidants, and in other industries, such as cosmetics and drugs [17]. Therefore, in order to improve the economic value of plants with high flavonoid contents, it is necessary to carry out research on the extraction and detection of flavonoid components in plants.
The Hemerocallis are rich in flavonoids. In particular, rutin, a typical flavonoid with antidepressant effect, has high content in Hemerocallis [18,19]. The method optimization for the extraction and detection of rutin and other related flavonoid components is an important basis for studies on the metabolism and transformation among different flavonoids in Hemerocallis.
Methods of extracting and detecting flavonoids from Hemerocallis have been built and reported. The extraction methods include high-pressure hot water extraction [20], organic solvent extraction [21], microwave-assisted extraction [22], high-voltage pulsed electric field extraction [23], supercritical fluid extraction [24], and ultrasonic-assisted extraction [25]. The detection methods include thin-layer chromatography [26], ultraviolet spectrophotometry [27], liquid chromatography [28], and nuclear magnetic resonance spectroscopy [29].
In this study, the ultrasonic-assisted extraction system was established and com-pared with the existing organic solvent extraction methods for extracting 70 Hemerocallis germplasm resources. The single factor and response surface experiments were used to optimize the different ultrasonic extraction conditions, and the DPPH method was applicated for exploring the antioxidant activity of flavonoids in Hemerocallis. The content of flavonoids in the 70 Hemerocallis germplasm resources was determined with an optimized extraction and detection technology. This experiment provided a basis for the extraction, determination, and analysis of flavonoids in Hemerocallis flower buds. The study also laid a foundation for screening flavonoid-rich Hemerocallis germplasm resources and developing new flavonoid-rich Hemerocallis cultivars.

2. Materials and Methods

2.1. Experimental Materials

The information on the 70 Hemerocallis germplasm resources is shown in Table S1. All germplasm resources were planted in the Hemerocallis Germplasm Resources Garden of Horticulture College of Shanxi Agricultural University, with the same planting conditions and management measures. Hemerocallis flower buds were collected 6 h before flowering and oven-dried at 55 °C to a constant weight, ground into powder with a plant tissue crusher, sieved with an 80-mesh sieve, and stored in a refrigerator at −40 °C for later use.

2.2. Equipment and Reagents

2.2.1. Instrument and Equipment

The equipment used included an electronic balance (CP213, Aohaosi Instrument Co., Ltd., Shanghai, China), dry oven (DHG-9070, Shanghai Yiheng Technology Co., Ltd., Shanghai, China), Eppendorf high-speed centrifuge (5430R, Eppendorf AG, Germany), numerical control ultra-sonic cleaner (KQ-100DE, Kunshan shumei ultrasonic instrument Co., Ltd., Kunshan, Jiangsu, China), U3000 ultraviolet spectrophotometer, Thermo Fisher UltiMate 3000 standard quaternary system liquid chromatograph, and Thermo Fisher Syncronis C18 column (4.6 mm × 250 mm × 5 m) (Thermo Fisher Scientific, Shanghai, China).

2.2.2. Reagents and Standards

The reagents used included sodium hydroxide, sodium nitrite, aluminum nitrate, ethanol (analytically pure), formic acid, methanol (analytically pure), acetonitrile, methanol (chromatographically pure), rutin, quercetin, apigenin, isoquercetin, myricetin, and diosmetin. These reagents were all purchased from Beijing Solaibao Technology Co., Ltd., Beijing, China. Scorbic acid (Vc) and 1,1-diphenyl-2-picrylhydrazyl (DPPH) were purchased from Sinopharm Group Chemical Reagent Co., Ltd., Shanghai, China. Trifluoroacetic acid was purchased from Tianjin kaitong chemical reagent Co., Ltd., Tianjin, China. Ultra-pure water was prepared with the Milli-Q ultrapure water system at Shanxi Agricultural University, Taigu, China.

2.3. Extraction Method

2.3.1. Organic Solvent Extraction

The organic solvent extraction method developed previously was used as the initial extraction method of flavonoids from Hemerocallis flower buds [30]. Briefly, 0.5 g of the sample was weighed into a 10 mL centrifuge tube, and 2 mL of leaching solution (methanol: water: formic acid: trifluoroacetic acid = 70:27:2:1) was added. The mixture was incubated in the dark for 24 h, with shaking every 12 h. Thereafter, the mixture was centrifuged at 12,000 rpm for 20 min, and the supernatant was filtered through a 0.45 μm filter membrane into an injection bottle. The filtrate was stored at −40 °C for high-performance liquid chromatography (HPLC) analysis.

2.3.2. Ultrasonic-Assisted Extraction

A total of 0.2 g of the sample powder was placed in a 10 mL centrifuge tube, followed by 2 mL of 70% ethanol, after which it was statically extracted for 2 h, ultrasonically extracted for 15 min, and centrifuged at 12,000 rpm for 20 min. The supernatant was filtered through a 0.45 μm filter membrane into an injection bottle. The filtrate was stored at −40 °C for high-performance liquid chromatography (HPLC) analysis. The frequency was 40 kHz, and the temperature was 25 °C in ultrasonic extraction. The optimum technological conditions can be optimized through a single factor experiment for the parameter of ultrasonic extraction. According to the optimum conditions, we extracted the flavonoid contents of the samples from Hemerocallis flower buds.

2.4. HPLC Analysis of Flavonoids in Hemerocallis Flower Buds

2.4.1. HPLC Conditions

Mobile phase A contained 2% formic acid water, while mobile phase B contained 100% acetonitrile. The conditions were 0–3 min for 92% A and 8% B, 23 min for 75% A and 25% B, 33–38 min for 60% A and 40% B, and 45 min for 92% A and 8% B. The detection wavelength was 350 nm, with a flow rate of 0.8 mL/min, a column temperature of 25 °C, and a sample injection volume of 10 μL.

2.4.2. Preparation of the Mixed Standard Solution

Rutin, isoquercetin, myricetin, quercetin, apigenin, and diosmetin were accurately weighed and dissolved in a leaching solution to make a single stock solution. The stock solution contained 2 mg/mL rutin, 0.5 mg/mL isoquercetin, 2 mg/mL myricetin, 0.1 mg/mL quercetin, 2 mg/mL apigenin, and 2 mg/mL diosmetin. Thereafter, 300 μL, 100 μL, 50 μL, 20 μL, 5 μL, and 20 μL of rutin, isoquercetin, myricetin, quercetin, apigenin, and diosmetin, respectively, were mixed in a 2 mL centrifuge tube to form the reference stock solution. An equal volume of leaching solution was then added to the tube containing the reference stock solutions and mixed well. The reference solution contained 0.3 mg/mL rutin, 0.05 mg/mL isoquercetin, 0.05 mg/mL myricetin, 1 μg/mL quercetin, 5 μg/mL apigenin, and 0.02 mg/mL diosmetin. The mixture was filtered into an injection bottle through a 0.45 μm filter membrane and stored at −40 °C for HPLC analysis.

2.4.3. Standard Curve Generation

Different amounts (2, 4, 6, 8, and 10 μL) of the mixed reference solution (obtained in Section 2.4.2) were used for the HPLC analysis using the chromatographic conditions stated in Section 2.4.1, and the peak area was recorded. The concentration (x, mg/mL) of the substance to be measured was set as the abscissa, and the peak area (y, mAU) as the ordinate of linear regression. The regression equation and linear range of each component were then obtained to calculate the substance content.

2.4.4. Extraction and Detection of the Flavonoid Content in Hemerocallis

Flavonoids from the flower buds of 70 Hemerocallis germplasm resources were extracted using organic solvent extraction. The content of six flavonoids in the extract was determined by HPLC. The sum content of the six flavonoids represented the total flavonoid content.

2.5. Optimization of the Ultrasonic-Assisted Extraction System for Extracting Flavonoids from Hemerocallis Flower Buds

2.5.1. Optimization of the Extraction System for Total Flavonoid Determination by Ultraviolet Spectrophotometry

In ultraviolet spectrophotometry, rutin content represented the total flavonoid content. Rutin reference substance (10 mg) was dissolved in 50 mL of 70% ethanol in a 50 mL volumetric flask to prepare a standard rutin solution with a mass concentration of 0.2 mg/mL. Thereafter, 5 mL of rutin standard sample stock solution was pipetted into a 10 mL centrifuge tube, and 0.3 mL of 5% NaNO2 solution was added. The mixture was vortexed and let stand for 4–6 min, then 0.3 mL of 10% Al(NO3)3 solution was added. The mixture was again vortexed and let stand for 4–6 min, then 4 mL of 4% NaOH solution was added. An equal volume of 70% ethanol was added and mixed well, and the mixture was left standing for 15 min. The absorbance was measured at the wavelength of 360 nm with an ultraviolet spectrophotometer.
Furthermore, 0, 0.5, 1.0, 2.0, 3.0, 4.0, and 5.0 mL of rutin standard were aliquoted into seven 10 mL centrifuge tubes numbered 1, 2, 3, 4, 5, 6, and 7, respectively. After adding NaNO2, Al(NO3)3, and NaOH solutions as described in the preceding paragraph, tube number 1 (without rutin) was used as the blank control for reference, and the absorbance was determined at 360 nm. The standard curve was generated with rutin mass concentration as abscissa (C, mg/mL) and absorbance value (A) as ordinate [31]. The regression equation y = 23.914x + 0.0666 (R2 = 0.9985) was obtained. The 0–0.1 mg/mL range of rutin mass concentration generated a good linear relationship between mass concentration and absorbance. Thereafter, 1 mL of the extraction solution was transferred into a 10 mL centrifuge tube, and a chromogenic agent was added. The absorbance value of the solution was determined, and the content of total flavonoids was calculated according to the following formula:
W = (C × F × V)/M
where W is the mass concentration of total flavonoids (mg/g), C is the concentration of total flavonoids in the extract (mg/mL), F is the dilution multiple, V is the volume of the extract (mL), and M is the mass of sample powder (g).

2.5.2. Single-Factor Experiment

The resource H0006 (‘Da Tong Huang Hua’) was used as the germplasm for flavonoid extraction using the ultrasonic-assisted method, in which ethanol was the extraction solvent. Single-factor experiments were set up to study four factors affecting the extraction efficiency of flavonoids, including sample weight, ethanol volume fraction, ethanol volume, and ultrasonic extraction time. Each factor was set at five levels. The sample weight gradient was 0.1 g, 0.2 g, 0.3 g, 0.4 g, and 0.5 g, while the gradient of ethanol volume fraction was 60%, 70%, 80%, 90%, and 100%. Moreover, the volume gradient of ethanol was 1 mL, 2 mL, 3 mL, 4 mL, and 5 mL, while the time gradient of ultrasonic extraction was 5 min, 10 min, 15 min, 20 min, and 25 min. The best conditions of the single-factor test were then determined based on the test results.

2.5.3. Response Surface Test

Three levels of the four factors were selected to design the response surface experiment based on the Box–Behnken Design (BBD) via the statistical analysis software Design Expert12.0. The optimal process parameters were obtained using the four main factors; sample weight (A), ethanol volume fraction (B), ethanol volume (C), and ultrasonic extraction time (D) served as the independent variables, and the total flavonoid content measured via spectrophotometer as the response value (Y).

2.5.4. Antioxidant Activity

The antioxidant capacity was determined via DPPH clearance test. We added 40 mg of DPPH to a 1000 mL volumetric flask and fixed the volume with anhydrous ethanol. The DPPH ethanol solution (0.04 mg/mL) was prepared and stored in the dark at 4 °C. The ‘H0006’ was selected for ultrasonic-assisted extraction, and we obtained sample solutions with different mass concentrations (0.05, 0.1, 0.2, 0.4, 0.8, 1.6, 3.2 mg/mL). We added 5 mL of DPPH ethanol solution into the 5 mL sample solutions, then the mixed solution reacted at 27 °C for 5 min under light protection. Absorbance was measured at 517 nm wavelength (A1). DPPH solution without flavonoid samples was used as blank control group (A0), and Vc solution with the same mass concentration was used as positive control group [32]. Calculation of DPPH radical scavenging rate:
D P P H   s c a v e n g i n g   r a t e = A 0 A 1 A 0 × 100 %

2.5.5. Ultrasonic-Assisted Extraction and HPLC Analysis of Flavonoid Content in Hemerocallis

Flavonoids from 70 flower buds of Hemerocallis were extracted using the optimized ultrasonic-assisted extraction method, and the content of six flavonoids in the extract was determined with HPLC.

2.6. Comparing of the Flavonoid Content Obtained via Ultrasonic-Assisted and Organic Solvent Extraction Methods

The contents of six flavonoids and total flavonoids obtained via organic solvent and ultrasonic-assisted extraction methods were compared and analyzed. Microsoft Excel 2016 (Redmond, WA, USA) was used for data collation, and Duncan’s new complex polar difference method was used for the significance test (p < 0.05).

3. Results

3.1. Determination and HPLC Analysis of Hemerocallis Flavonoids Obtained via Organic Solvent Extraction

3.1.1. Precision Test of HPLC

The mixed standard solution (1 mL) was injected into HPLC equipment six times continuously, and analysis was conducted using the chromatographic conditions stated in Section 2.4.1. The peak area was then recorded [33]. The relative standard deviation (RSD) values of the peak areas of rutin, isoquercetin, myricetin, quercetin, apigenin, and diosmetin were 0.15%, 0.76%, 0.48%, 0.32%, 1.29%, and 0.59%, respectively (n = 6), indicating that the precision of the instrument was good.

3.1.2. Stability Test of HPLC

H0006 sample solution (6 mL) was aliquoted into a brown injection bottle. The sample solution was measured, and the peak area was recorded at room temperature after 0, 2, 4, 8, 12, and 24 h [34]. The RSD values of the peak areas of rutin, isoquercetin, myricetin, quercetin, apigenin, and diosmetin were 0.91%, 0.52%, 0.39%, 0.46%, 0.68%, and 0.82%, respectively (n = 6). This indicated that the test solution was stable at room temperature for 24 h.

3.1.3. The Chromatographic Results of Mixed Standard and the Standard Curve Plot

The mixed standard solution and H0006 sample solution (1 mL) were used for HPLC analysis with the chromatographic conditions stated in Section 2.4.1, and the chromatogram was recorded (Figure 1). The retention times of rutin, isoquercetin, myricetin, quercetin, apigenin, and diosmetin were 23.417 min, 24.510 min, 29.370 min, 34.327 min, 38.013 min, and 38.903 min, respectively. The resolution was greater than 1, and the peaks were symmetrical and well separated.
The regression equations and linear ranges of the six flavonoids were drawn according to the method described in Section 2.4.3. The results are presented in Table S2.

3.1.4. The Content of Six Flavonoids Obtained by Organic Solvent Extraction

The contents of the six flavonoids are shown in Table S3. The contents of rutin, isoquercetin, myricetin, quercetin, apigenin, and diosmetin were different in the different germplasm resources. Among the 70 germplasm resources, H0144 had the highest total flavonoid content (3323.96 µg/g), while H0065 had the lowest (245.87 µg/g). Rutin content was the highest of the six flavonoids, accounting for 42.82–91.31%, while apigenin content was the lowest, accounting for 0.02–4.46%. H0144 had the highest rutin content (2942.88 µg/g), while H0065 had the lowest (105.28 µg/g), resulting in a difference of 2837.60 µg/g. Additionally, H0207 had the highest apigenin content (39.22 µg/g), while H0081 had the lowest (0.37 µg/g), resulting in a difference of 38.84 µg/g.

3.2. Optimization of the Single-Factor Experiment by Ultrasonic-Assisted Extraction Method

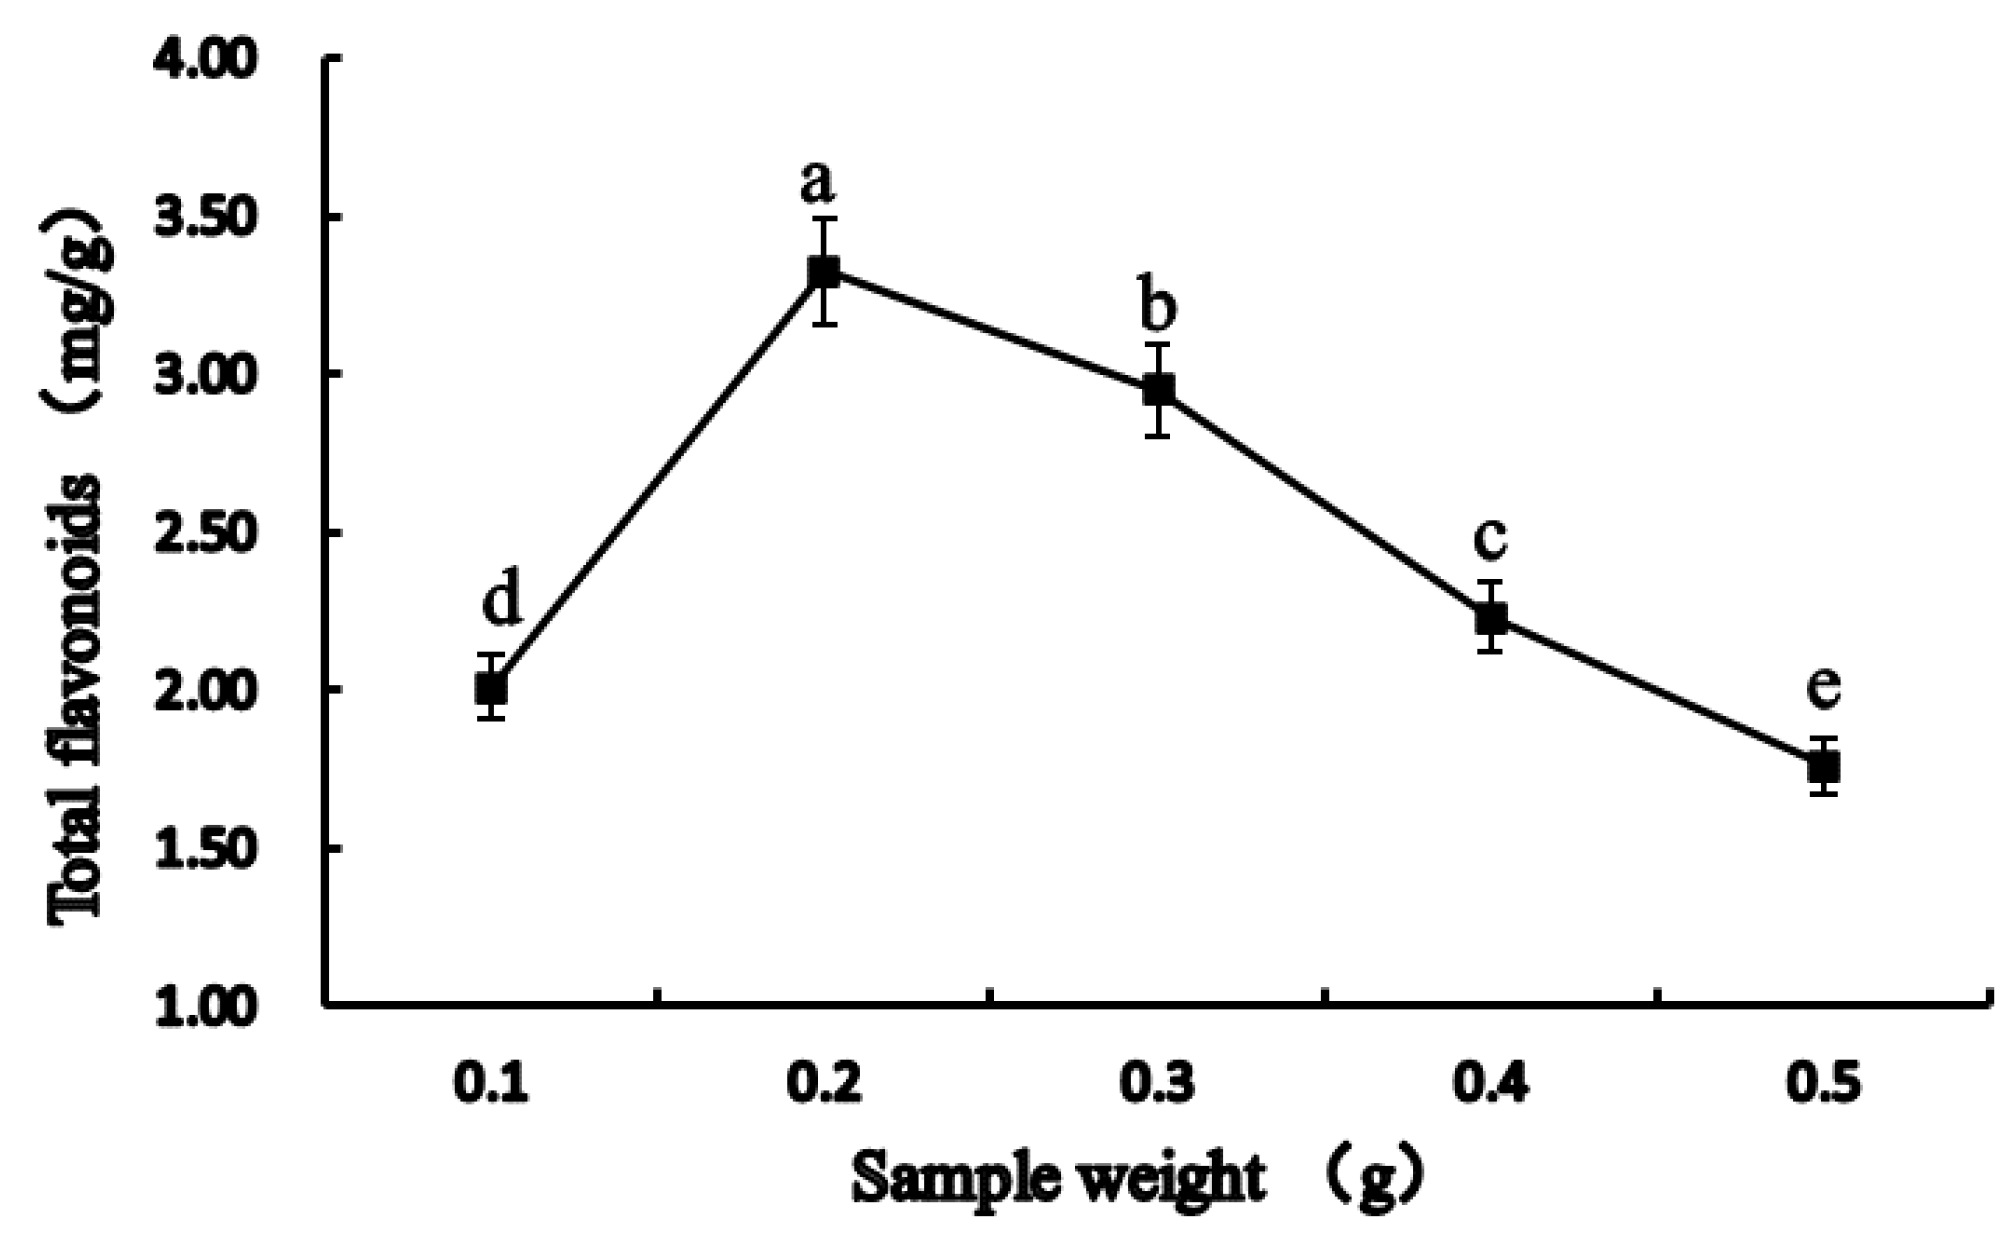
3.2.1. Effect of Sample Weight on Total Flavonoids Extraction

The single-factor test was conducted in triplicate using H0006 as a reference. The sample weight was set to five gradients (0.1–0.5 g), and 2 mL of 70% ethanol was added to each gradient set. The samples were left standing for 2 h and subjected to ultrasonic ex-traction for 20 min. The obtained total flavonoid content obtained is shown in Figure 2. The content of total flavonoids increased first and then decreased with the increase in sample weight. When the sample weight was 0.2 g, the content of total flavonoids was significantly higher (p < 0.05) (3.33 mg/g) than that of the other four gradients. Therefore, the total flavonoid content was the highest and the ultrasonic extraction effect was the best when the sample weight was 0.2 g.

3.2.2. Effect of Ethanol Volume Fraction on the Total Flavonoid Extraction

Five gradients (60–100%) were set for ethanol volume fraction in the single-factor experiment. The sample weight used was 0.2 g, and the ethanol volume was 2 mL. Ethanol with different volume fractions was added, and the mixture was left standing for 2 h, followed by a 20 min ultrasonic extraction. The content of total flavonoids is shown in Figure 3. The content of total flavonoids first increased and then decreased with the increasing ethanol volume fraction. When the ethanol volume fraction was 70%, the total flavonoid content was 3.33 mg/g, significantly higher than the other four gradients (p < 0.05). There-fore, the total flavonoid content was the highest and the ultrasonic extraction effect was the best when the volume fraction of ethanol was 70%.

3.2.3. Effect of Ethanol Volume on Total Flavonoids Extraction

The ethanol volume was set to five gradients (1–5 mL), and the sample weight and the ethanol volume used were 0.2 g and 70%, respectively. This was left standing for 2 h and later ultrasonically extracted for 20 min. The content of total flavonoids obtained is shown in Figure 4. The content of total flavonoids increased first and then decreased with the increasing ethanol volume. The content of total flavonoids was significantly higher (p < 0.05) (3.19 mg/g) when the volume of ethanol was 2 mL than in the other four gradients. The results showed that the total flavonoid content was the highest and the ethanol extraction effect was the best when the ethanol volume was 2 mL.

3.2.4. Effect of Ultrasonic Extraction Time on Total Flavonoids Extraction

The ultrasonic extraction time was set to five gradients (5–25 min), and the sample weight and ethanol volume were 0.2 g and 2 mL, respectively. The ethanol volume fraction was 70%, and the gradient ultrasound was performed after the sample was left standing for 2 h. The content of total flavonoids obtained is shown in Figure 5. The content of total flavonoids increased first and then decreased with the increasing ultrasonic extraction time. When ultrasonic extraction was conducted for 15 min, flavonoids were gradually dissociated, and the content of total flavonoids was significantly higher (p < 0.05) (3.03 mg/g). Thus, the total flavonoid content was the highest and the ultrasonic extraction effect was the best at 15 min.
In summary, the optimum extraction conditions for total flavonoids were as follows: sample weight of 0.2 g, ethanol concentration of 70%, ethanol volume of 2 mL, and ultra-sonic extraction time of 15 min. The response surface experiment was designed to further optimize the extraction conditions.

3.3. Response Surface Test

3.3.1. Response Surface Experimental Design

The response surface experiment was based on the Box–Behnken Design (BBD). Three levels of four factors were determined in the response surface test based on the results of the single-factor test, as shown in Table S4. The response surface test was designed using the software Design-Expert 12.0, and the design scheme of the response surface test is shown in Table S5. The experimental data were fitted using multiple regression, and the regression equation with the total flavonoids as the response value was obtained as follows:
Total flavonoids content = 4.38 − 0.47 A + 0.18 B − 0.19 C + 0.30 D − 0.20 AB − 0.47 AC − 0.33 AD − 0.20 BC − 0.20 BD − 0.25 CD − 0.60 A2 − 0.89 B2 − 0.71 C2 − 0.64 D2.

3.3.2. The Response Surface Test and Variance Analysis

The results of the variance analysis of the regression equation in Section 3.3.1 are shown in Table 1. According to ANOVA analysis, the model p < 0.001 (extremely significant) and Lack of Fit p = 0.0632 > 0.05 (not significant) showed that the equation had a good fitting to the experiment and the experimental error was small. The correlation coefficient (R2) was 0.9907, while the adjustment coefficient (Adj.R2) was 0.9814. The two values were close, showing that the model adjusted the experimental data reasonably. This also indicated that the model had a good fitting degree, and only 1.9% of the total variation could not be explained by the model [35]. Moreover, the coefficient of variation (CV) was 3.16%, suggesting that the model had good reproducibility and could optimize the extraction conditions for total flavonoids from Hemerocallis [36].

3.3.3. The Content of Six Flavonoids in Hemerocallis Obtained by Ultrasonic-Assisted Extraction

Based on the differences in the significance level of each factor, the effect of the four factors on the total flavonoids was very significant (p < 0.01). The interaction terms AB, AC, BC, and BD and quadratic terms A2, B2, C2, and D2 of the four factors significantly affected the total flavonoids (p < 0.01). The response values of the interaction among the factors were inconsistent, showing that the relationship between the response surface and independent variables was not linear [37].
The results of the response surface and contour line are shown in Figure 6. The 3D map and 2D contour map of the response surface could visualize the regression model. Figure 6 clearly shows the effect of multiple independent variables on the total flavonoids and the sensitivity of total flavonoid content to the changes in different independent variables. In the contour map, the values on each curve are the same; however, when the values are closely arranged, the two factors appear to greatly influence the response values [38]. For the response surface diagram, the steeper the surface, the more significant the influence of this factor on the response value. When the factors other than the two independent variables were unchanged, the influence of two interactive independent variables on the total flavonoid content could be seen from the curved surface of the response surface diagram. The contour map corresponded to the response surface map. The curve center, the red part, had the largest corresponding response value, while the farthest part from the center had the smallest corresponding response value [39].
Figure 6a shows the effect of the interaction between sample weight and ethanol volume on the total flavonoid content. The steep 3D curve shows that the sample weight and ethanol volume greatly influenced the total flavonoid content. The contour line in the two-dimensional contour map is oval, indicating that the interaction between the two factors was very significant, consistent with the analysis of variance results. The total flavonoid content could reach the maximum when the sample weight was 0.2–0.3 g and the volume of ethanol was 1.7–2.7 mL. The contour map also shows that keeping the ethanol volume constant and the sample weight too high could reduce the extraction rate of total flavonoids.
Figure 6b shows the effect of the interaction between sample weight and ultrasonic extraction time on the total flavonoid content. The steep 3D graph shows that the sample weight and ultrasonic extraction time greatly influenced the total flavonoid content. Moreover, the oval contour line in the two-dimensional contour map shows that the interaction between the two factors was very significant, consistent with the analysis of variance results. The total flavonoid could reach the maximum when the sample weight was 0.2–0.3 g and the ultrasonic time was 14–19 min. The contour map also shows that keeping the ultrasonic extraction time unchanged and the sample weight too high could be conducive to the extraction of total flavonoids. For the rest of the pictures, please refer to the Supplementary Material Figure S1 for details.
The optimum extraction conditions of total flavonoids from Hemerocallis were obtained using the software Design-Expert 12.0. When the sample weight was 0.238 g, the ethanol volume fraction was 71.65%, and the ethanol volume and the ultrasonic extraction time were 2.256 mL and 16.703 min, respectively, the predicted total flavonoid content in the H0006 flower buds could reach the maximum value of 4.60 mg/g.
For the convenience of practical operation, the optimum extraction conditions were simplified as follows: sample weight of 0.25 g, ethanol volume fraction of 72%, ethanol volume of 2.5 mL, and ultrasonic extraction time of 17 min. The average content of total flavonoids in the H0006 flower buds was 4.46 mg/g, which was closer to the predicted value. The value also showed that the regression model obtained by this response surface method had certain reliability.

3.3.4. Evaluation of Antioxidant Activity of Flavonoids

The scavenging ability of DPPH showed a trend of first increasing and then stabilizing with the increase in flavonoid contents in Hemerocallis (Figure 7). The DPPH scavenging rate reached the maximum when the concentration of sample solution reached 1.6 mg/mL, and then remained stable. The maximum DPPH scavenging rate of flavonoids and Vc (positive control) were 70.2% and 98.6%, respectively. The result showed that the flavonoids of Hemerocallis had a certain ability to eliminate DPPH, and in a certain range, the scavenging ability was positively correlated with the concentration of the sample solution from flavonoids extraction.

3.3.5. The Content of Six Flavonoids in Hemerocallis Obtained by Ultrasonic-Assisted Extraction

The flavonoid content data in Table S6 show that, among the 70 germplasm resources, H0087 had the highest total flavonoid content (4390.54 µg/g), while H0065 had the lowest (381.54 µg/g). The flavonoid content difference between the two materials was 4009.00 µg/g. Furthermore, rutin was the most abundant among the six flavonoids, and H0191 had the highest (3640.16 µg/g) rutin content, while H0065 had the lowest (198.47 µg/g). The rutin content difference between the two materials was 3441.69 µg/g. Apigenin content was the lowest among the six flavonoids; its highest content (57.40 µg/g) was in H0021, while the lowest (0.27 µg/g) was in H0004. The apigenin content difference between the two materials was 57.14 µg/g. The total flavonoid contents in H0059, H0086, and H0087 were higher under the two extraction methods (ultrasonic-assisted extraction and organic solvent extraction), showing that the three materials have high flavonoid contents. Since the total flavonoid and rutin contents of H0087 ‘Zi Quan’ and H0059 ‘Da Huang Hua Za’ obtained using the two extraction methods were high, the two materials could be used as high-quality germplasm resources for cross-breeding.

3.4. Comparison of the Contents of the Six Flavonoids Obtained Using the Two Extraction Methods

After extracting flavonoids via ultrasonic-assisted extraction (Table 2), the total flavonoid content increased in 68 varieties, among which 65 varieties had a significant increase, with a range of 0.03–240.21%. Similarly, rutin content increased in 68 varieties, among which 67 varieties had a significant increase, with a range of 2.13–293.24%. Among the 56 varieties with increased detection values of isoquercetin, 52 varieties had a significant increase, with a range of 3.02–717.07%. Moreover, among the five varieties with increased myricetin content, four varieties had a significant increase, with a range of 5.63–73.97%. The content of quercetin increased in 25 varieties, among which 22 varieties had a significant increase, with a range of 4.33–854.37%. The detection value of apigenin content increased in 42 varieties, among which 39 varieties exhibited a significant increase, with a range of 3.46–3125.44%. Additionally, the detection value of diosmetin content increased in 56 varieties, of which 51 varieties had a significant increase, with a range of 3.75–2369.68%. Rutin, isoquercetin, apigenin, and diosmetin contents were significantly increased in most materials, indicating that the ultrasonic-assisted extraction method was more suitable for the extraction of these four flavonoids. However, myricetin and quercetin contents only increased in a few materials, indicating that the ultrasonic-assisted extraction method was not as good as the organic solvent extraction method.

4. Discussion

The organic solvent extraction method involves soaking sample powder in an organic solvent for a certain period. Cold soaking does not need heating, but it is time-consuming and inefficient. Conversely, the reflux method has high efficiency but requires heating, which can easily degrade unstable bioactive substances [40]. Therefore, appropriate extraction methods that favor the physical and chemical properties of different substances should be considered. Common organic solvents include methanol, ethanol, acetone, ethylacetate, and ether. Ethanol is less toxic, less harmful, economical, and practical, and the most commonly used [41]. Thus, ethanol was selected as the extraction solvent for this study. Ultrasonic-assisted extraction is a common extraction method for flavonoids, which mainly uses the cavitation of ultrasonic waves in liquid to accelerate the extraction of components from plants [42]. Wei Wang et al. [37] extracted flavonoids from Hemerocallis fulva leaves with ultrasound-assisted extraction and obtained an optimal ethanol concentration of 70.2%. Ultrasound synergized electrostatic field extraction was used to extract total flavonoids from day lily, with ethanol as the extraction solvent, and it had an optimum extraction rate of 1.536% [43].
Through analysis and comparison, we found that ultrasonic extraction could save extraction time, improve the extraction rate, and enhance the utilization rate of raw materials. The four factors in the single-factor experiment were sample weight, ethanol volume fraction, ethanol volume, and ultrasonic extraction time. The total flavonoid content increased first and then decreased with the increase in any of the four factors. For example, the total flavonoid content first increased and then decreased with the increase in ethanol volume fraction. The reason could be that flavonoids, being typical organic compounds, are easily soluble in organic reagents such as ethanol; thus, the extraction rate would increase with ethanol concentration. When the ethanol concentration is too high, fat-soluble substances, such as pigment in peels, are deposited in the extraction solvent and occupy the dissolution space of flavonoid molecules, reducing the extraction rate [36]. In this study, the total flavonoid content increased initially and then decreased with the increasing ethanol volume. This could be because an increase in the solvent amount increases the diffusion pressure of the system, enabling flavonoid molecules to diffuse into the solvent as much as possible, thus increasing the yield. When the solvent amount is too high, impure molecules are also dissolved, enabling them to compete with flavonoid molecules for the dissolution space, thus reducing the extraction rate [44]. In this study, the total flavonoid content decreased with the extension of ultrasonic extraction time. This might be because the structure of flavonoids is destroyed when the ultrasonic extraction time is prolonged, forming an unstable structure that is easily degraded [45]. Therefore, the sample weight of 0.2 g, ethanol volume fraction of 70%, ethanol volume of 2 mL, and ultrasonic extraction time of 15 min were more suitable extraction conditions for flavonoids from Hemerocallis.
The extraction efficiency of flavonoids is different under the different extraction methods. Phenols were extracted from day lily using different extraction methods, among which ultrasonic-assisted ethanol extraction (UE) had the highest extraction rate and the best extraction effect [46]. In the present study, rutin accounted for 42.82–91.31% of the total flavonoids (before optimization), among which only two materials accounted for more than 90%. After optimizing the extraction, the proportion of rutin in the total flavonoids increased to 52.02–95.51%, and the number of germplasm resources with rutin content above 90% reached 16. This could be because the total flavonoid content measured with the UV spectrophotometry was used as the evaluation standard in the single-factor optimization experiment, where the total flavonoid content was represented by rutin content. Therefore, the optimization results of the single-factor experiment tended to be more biased towards the rutin extraction, thus increasing rutin content. The ultrasonic-assisted extraction method increased the rutin, isoquercetin, apigenin, and diosmetin contents in 68, 56, 42, and 56 materials, respectively. This indicated that ultrasonic-assisted extraction was suitable for extracting the four flavonoids. However, the extraction content of myricetin decreased, probably because myricetin is an unstable compound and may be degraded during heating. Adding ice cubes during the ultrasonic process can prevent an excessive rise in temperature. In general, the total flavonoid content extracted from Hemerocallis was improved with ultrasonic-assisted extraction. Compared with organic solvent extraction, ultrasonic-assisted extraction was time-saving, raw material-saving, and simple to operate. Therefore, the ultrasonic-assisted extraction method is suitable for extracting Hemerocallis flavonoids, especially rutin.
In previous studies, Zhilin Hao et al. [47] used ultrasonic ethanol to extract phenolic compounds, using 50 g of the sample, 300 mL of solvent, and ultrasonic extraction for 120 min. Wei Wang et al. [30] used ultrasonic ethanol to extract flavonoids from Hemerocallis fulva leaves. They used 20 g of Hemerocallis fulva leaf powder for extraction and ultrasonic extraction for 15 min. Mengyang Hou et al. [48] used ultrasonic ethanol to extract total flavonoids from Pteris cretica. They used 5 g of the sample, the ethanol concentration was 56.7%, and the ultrasonic time was 46 min. Zhiting Liu et al. [46] used ultrasonic ethanol to extract flavonoids from Portulaca oleracea. They used 1 g of purslane powder and ultrasonic extraction for 30 min. Liao Jianqing et al. [49] used ultrasound assisted extraction of flavonoids from peanut shells and used 5 g of peanut shell powder as the extraction material, with an ultrasonic extraction time of 80 min. Comparsed with the above studies, on the basis of satisfying the analysis purpose, the sample dosage and ultrasonic extraction time of the extraction method described in this study are significantly less than that of the previous studies. The method in this study is suitable for the needs of trace and rapid extraction and detection of a large number of samples.

5. Conclusions

In this study, ultrasonic-assisted extraction technology was used to successfully ex-tract six Hemerocallis flavonoids and establish an HPLC detection system for the extracted flavonoids. The optimum extraction scheme was obtained via a single-factor experiment combined with the response surface method. The optimum extraction conditions were a sample weight of 0.25 g, ethanol volume fraction of 72%, ethanol volume of 2.5 mL, and ultrasonic extraction time of 17 min. The scavenging ability of DPPH showed that the flavonoid components of Hemerocallis with ultrasonic-assisted extraction process had certain antioxidant activity, and the highest scavenging ability reached 70.2%. The six flavonoids detected via HPLC from the flower buds of 70 Hemerocallis species included rutin, isoquercetin, myricetin, quercetin, apigenin, and diosmetin. The results showed that the flavonoid contents of the 70 Hemerocallis species were quite different. The ultrasonic extraction method significantly increased the total and rutin contents of the six flavonoids, and among the 70 species, H0087 ‘Zi Quan’ and H0059 ‘Da Huang Hua Za’ had the highest flavonoid contents. This experiment provides a basis for extracting, determining, and analyzing flavonoids in the Hemerocallis flower buds. The study also lays a foundation for screening Hemerocallis germplasm resources rich in flavonoids and developing new Hemerocallis varieties with high flavonoid contents.

Supplementary Materials

The following supporting information can be downloaded at: https://www.mdpi.com/article/10.3390/horticulturae9111233/s1. Table S1: List of plant materials; Table S2: Regression equation and linear range; Table S3: The flavonoid content obtained via organic solvent extraction; Table S4: Factor design coding table; Table S5: Response surface design; Table S6: The flavonoid content obtained via ultrasonic-assisted extraction; Figure S1: Response surface map of the total flavonoids extracted from Hemerocallis.

Author Contributions

Conceptualization, W.Z., G.X. and S.L.; Data curation, J.S. and N.X.; Formal analysis, J.S., W.Y. and X.Z.; Funding acquisition, F.H., Y.W. and S.L.; Investigation, J.S., M.J., L.Z., C.L. and Y.W.; Methodology, W.Z., F.H. and S.L.; Resources, X.Z.; Software, J.S., N.X. and W.Y.; Validation, J.S.; Writing—original draft, J.S.; Writing—review and editing, F.H., Y.W., G.X. and S.L. All authors have read and agreed to the published version of the manuscript.

Funding

This research was funded by the Key Research and Development Program Project of Shanxi Province (202102140601009), the Biological Breeding Engineering Project of Shanxi Agricultural University (YZGC122), the National Key Research and Development Program Project (2021YFD1600301-2), and the Science and Technology Innovation Project of Colleges and Universities in Shanxi Province (2019L0375).

Data Availability Statement

Data is contained within the article.

Acknowledgments

I would like to express my gratitude to all those who helped me during the writing of this thesis. I gratefully acknowledge to help of my supervisor, Li Sen, who has offered me valuable suggestions for academic studies. In the preparation of the thesis. Li dedicated substantial time to review through each draft and provided me with inspiring advice. All authors have read and agreed to the published version of the manuscript.

Conflicts of Interest

The authors declare no conflict of interest.

References

  1. Stevens, P. Angiosperm Phylogeny Website; Missouri Botanical Garden: St. Louis, MO, USA, 2020. [Google Scholar]
  2. Zhao, X.C.; Du, J.L.; Xie, Y.G.; Zhang, Y.; Jin, H.Z. Chemical constituents of the flowers of Hemerocallis minor. Chem. Nat. Compd. 2018, 54, 556–558. [Google Scholar] [CrossRef]
  3. Yu, L.; Yao, G.; Ma, W. Rhein: A novel potential antitumor drug. Chin. Pharm. J. 2016, 25, 321–328. [Google Scholar]
  4. Uwineza, P.A.; Waśkiewicz, A. Recent advances in supercritical fluid extraction of natural bioactive compounds from natural plant materials. Molecules 2020, 25, 3847. [Google Scholar] [CrossRef] [PubMed]
  5. Procházková, D.; Biochemistry, N. The capacity of antioxidant protection during modulated ageing of bean (Phaseolus vulgaris L.) cotyledons. 1. The antioxidant enzyme activities. Cell Biochem. Funct. 2007, 25, 87–95. [Google Scholar] [CrossRef] [PubMed]
  6. Wang, D.; Wang, J.; Huang, X.; Tu, Y.; Ni, K. Identification of polymethoxylated flavones from green tangerine peel (Pericarpium Citri Reticulatae Viride) by chromatographic and spectroscopic techniques. J. Pharm. Biomed. Anal. 2007, 44, 63–69. [Google Scholar] [CrossRef] [PubMed]
  7. Salin, O.; Törmäkangas, L.; Leinonen, M.; Saario, E.; Hagström, M.; Ketola, R.A.; Saikku, P.; Vuorela, H.; Vuorela, P.M. Corn mint (mentha arvensis) extract diminishes acute chlamydia pneumoniae infection in vitro and in vivo. J. Agric. Food Chem. 2011, 59, 12836–12842. [Google Scholar] [CrossRef]
  8. Fliegmann, J.; Furtwngler, K.; Malterer, G.; Cantarello, C.; Mithfer, A. Flavone synthase II (CYP93B16) from soybean (Glycine max L.). Phytochemistry 2010, 71, 508–514. [Google Scholar] [CrossRef]
  9. Cheng, S.Y.; Xu, F.; Wang, Y. Advances in the study of flavonoids in Ginkgo biloba leaves. J. Med. Plants Res. 2009, 3, 1248–1252. [Google Scholar]
  10. Abd-Alla, H.I.; Albalawy, M.A.; Aly, H.F.; Shalaby, N.M.M.; Shaker, K.H. Flavone composition and antihypercholesterolemic and antihyperglycemic activities of Chrysanthemum coronarium L. Z. Für Naturforschung C J. Biosci. 2014, 69, 199–208. [Google Scholar] [CrossRef]
  11. Matsui, K.; Walker, A.R. Biosynthesis and regulation of flavonoids in buckwheat. Breed. Sci. 2020, 70, 74–84. [Google Scholar] [CrossRef]
  12. Juan, M.Y.; Chou, C.C. Enhancement of antioxidant activity, total phenolic and flavonoid content of black soybeans by solid state fermentation with Bacillus subtilis BCRC 14715. Food Microbiol. 2010, 27, 586–591. [Google Scholar] [CrossRef] [PubMed]
  13. Hibatallah, J.; Carduner, C.; Poelman, M.C. In-vivo and in-vitro assessment of the free-radical-scavenger activity of Ginkgo flavone glycosides at high concentration. J. Pharm. Pharmacol. 2010, 51, 1435–1440. [Google Scholar] [CrossRef] [PubMed]
  14. Lin, Y.L.; Lu, C.K.; Huang, Y.J.; Chen, H.J. Antioxidative caffeoylquinic acids and flavonoids from hemerocallis fulva flowers. J. Agric. Food Chem. 2011, 59, 8789–8795. [Google Scholar] [CrossRef] [PubMed]
  15. Ma, T.; Sun, Y.; Wang, L.; Wang, J.; Wu, B.; Yan, T.; Jia, Y. An Investigation of the Anti-Depressive Properties of Phenylpropanoids and Flavonoids in Hemerocallis citrina Baroni. Molecules 2022, 27, 5809. [Google Scholar] [CrossRef]
  16. Ferraz, C.R.; Carvalho, T.T.; Manchope, M.F.; Artero, N.A.; Rasquel-Oliveira, F.S.; Fattori, V.; Verri, W.A., Jr. Therapeutic potential of flavonoids in pain and inflammation: Mechanisms of action, pre-clinical and clinical data, and pharmaceutical development. Molecules 2020, 25, 762. [Google Scholar] [CrossRef]
  17. Dias, M.C.; Pinto, D.C.; Silva, A.M. Plant flavonoids: Chemical characteristics and biological activity. Molecules 2021, 26, 5377. [Google Scholar] [CrossRef]
  18. Foudah, A.I.; Alqarni, M.H.; Alam, A.; Devi, S.; Salkini, M.A.; Alam, P. Rutin Improves Anxiety and Reserpine-Induced Depression in Rats. Molecules 2022, 27, 7313. [Google Scholar] [CrossRef]
  19. Anjomshoa, M.; Boroujeni, S.N.; Ghasemi, S.; Lorigooini, Z.; Amiri, A.; Balali-Dehkordi, S.; Amini-Khoei, H. Rutin via increase in the CA3 diameter of the hippocampus exerted antidepressant-like effect in mouse model of maternal separation stress: Possible involvement of NMDA receptors. Behav. Neurol. 2020, 2020, 4813616. [Google Scholar] [CrossRef]
  20. Zhang, S.Q.; Xi, J.; Wang, C.Z. High hydrostatic pressure extraction of flavonoids from propolis. J. Chem. Technol. Biotechnol. 2005, 80, 50–54. [Google Scholar]
  21. Duan, L.; Zhang, W.H.; Zhang, Z.H.; Liu, E.H.; Guo, L. Evaluation of natural deep eutectic solvents for the extraction of bioactive flavone c-glycosides from flos trollii. Microchem. J. 2018, 145, 180–186. [Google Scholar] [CrossRef]
  22. Zhou, T.; Xiao, X.; Li, G.; Cai, Z.W. Study of polyethylene glycol as a green solvent in the microwave-assisted extraction of flavone and coumarin compounds from medicinal plants. J. Chromatogr. A 2011, 1218, 3608–3615. [Google Scholar] [CrossRef] [PubMed]
  23. Hendrawan, Y.; Sabrinauly, S.; Hawa, L.C.; Argo, B.D.; Rachmawati, M. Analysis of the phenol and flavonoid content from basil leaves (Ocimum Americanum L.) extract using pulsed electric field (PEF) pre-treatment. Agric. Eng. Int. CIGR J. 2019, 21, 149–158. [Google Scholar]
  24. Numa, V.; Crampon, C.; Bellon, A.; Mouahid, A.; Badens, E. Valorization of food side streams by supercritical fluid extraction of compounds of interest from apple pomace. J. Supercrit. Fluids 2023, 202, 106056. [Google Scholar] [CrossRef]
  25. Zhang, G.; He, L.; Hu, M. Optimized ultrasonic-assisted extraction of flavonoids from Prunella vulgaris L. and evaluation of antioxidant activities in vitro. Innov. Food Sci. Emerg. Technol. 2011, 12, 18–25. [Google Scholar] [CrossRef]
  26. Swift, L.J. Thin-layer chromatographic-spectrophotometric analysis for neutral fraction flavones in orange peel juice. J. Agric. Food Chem. 1967, 15, 99–101. [Google Scholar] [CrossRef]
  27. Dong, S.F.; Han, L.Q.; Zhao, W.X.; Dong, H.B.; Liu, J.H. Analysis and study of total flavone and trace element in Carthmus tinctorius L. Guang Pu Xue Yu Guang Pu Fen Xi Guang Pu 2008, 28, 225–227. [Google Scholar]
  28. Sithisarn, P.; Rojsanga, P.; Sithisarn, P. Inhibitory effects on clinical isolated bacteria and simultaneous HPLC quantitative analysis of flavone contents in extracts from Oroxylum indicum. Molecules 2019, 24, 1937. [Google Scholar] [CrossRef]
  29. Wenkert, E.; Gottlieb, H.E. Carbon-13 nuclear magnetic resonance spectroscopy of flavonoid and isoflavonoid compounds. Phytochemistry 1977, 16, 1811–1816. [Google Scholar] [CrossRef]
  30. Cui, H.L.; Zhang, Y.Y.; Shi, X.L.; Gong, F.F.; Xiong, X.; Kang, X.P.; Li, S. The numerical classification and grading standards of daylily (Hemerocallis) flower color. PLoS ONE 2019, 14, e0216460. [Google Scholar] [CrossRef]
  31. Kirana, S.Y.; Febrianti, R.; Amananti, W. Determination of Total Flavonoid Content of Bajakah Tampala and Kalalawit Roots Using the Reflux. Indones. J. Chem. Sci. Technol. (IJCST) 2023, 6, 56–64. [Google Scholar] [CrossRef]
  32. Gulcin, İ.; Alwasel, S.H. DPPH radical scavenging assay. Processes 2023, 11, 2248. [Google Scholar] [CrossRef]
  33. Sarg, T.M.; Salem, S.A.; Farrag, N.M.; Abdel-Aal, M.M.; Ateya, A.M. Phytochemical and Antimicrobial Investigation of Hemerocallis fulva L. grown in Egypt+. Int. J. Crude Drug Res. 1990, 28, 153–156. [Google Scholar] [CrossRef]
  34. Yan, Z.; Yang, X.; Wu, J.; Su, H.; Chen, C.; Chen, Y. Qualitative and quantitative analysis of chemical constituents in traditional Chinese medicinal formula Tong-Xie-Yao-Fang by high-performance liquid chromatography/diode array detection/electrospray ionization tandem mass spectrometry. Anal. Chim. Acta 2011, 691, 110–118. [Google Scholar] [CrossRef] [PubMed]
  35. Garofulić, I.E.; Zorić, Z.; Pedisić, S.; Dragović Uzelac, V. Retention of polyphenols in encapsulated sour cherry juice in dependence of drying temperature and wall material. LWT-Food Sci. Technol. 2017, 83, 110–117. [Google Scholar] [CrossRef]
  36. Zhou, J.; Zhang, L.; Li, Q.; Jin, W.; Chen, W.; Han, J.; Zhang, Y. Simultaneous optimization for ultrasound-assisted extraction and antioxidant activity of flavonoids from Sophora flavescens using response surface methodology. Molecules 2018, 24, 112. [Google Scholar] [CrossRef]
  37. Wang, W.; Zhang, X.; Liu, Q.; Lin, Y.; Zhang, Z.; Li, S. Study on Extraction and Antioxidant Activity of Flavonoids from Hemerocallis fulva (Daylily) Leaves. Molecules 2022, 27, 2916. [Google Scholar] [CrossRef]
  38. Prabhu, D.; Prabhu, P.R.; Rao, P. Thermodynamics, adsorption, and response surface methodology investigation of the corrosion inhibition of aluminum by Terminalia chebula Ritz. extract in H3PO4. Chem. Pap. 2021, 75, 653–667. [Google Scholar] [CrossRef]
  39. Wang, G.H.; Zhang, B.X.; Nie, Q.X.; Li, H.; Zang, C. Optimal extraction of nuciferine and flavone from lotus leaf based on central composite design and response surface methodology. Zhongguo Zhong Yao Za Zhi Zhongguo Zhongyao Zazhi China J. Chin. Mater. Medica 2008, 33, 2332–2335. [Google Scholar]
  40. Ferro, M.; Seigneurin-Berny, D.; Rolland, N.; Chapel, A.; Salvi, D.; Garin, J.; Joyard, J. Organic solvent extraction as a versatile procedure to identify hydrophobic chloroplast membrane proteins. Electrophoresis 2000, 21, 3517–3526. [Google Scholar] [CrossRef]
  41. Yang, B.; Zhang, M.; Weng, H.; Xu, Y.; Zeng, L. Optimization of ultrasound assisted extraction (UAE) of Kinsenoside compound from Anoectochilus roxburghii (Wall.) Lindl by response surface methodology (RSM). Molecules 2020, 25, 193. [Google Scholar] [CrossRef]
  42. Zhang, L.F.; Liu, Z.L. Optimization and comparison of ultrasound/microwave assisted extraction (UMAE) and ultrasonic assisted extraction (UAE) of lycopene from tomatoes. Ultrason. Sonochem. 2008, 15, 731–737. [Google Scholar]
  43. Yang, R.F.; Geng, L.L.; Lu, H.Q.; Fan, X.D. Ultrasound-synergized electrostatic field extraction of total flavonoids from Hemerocallis citrina baroni. Ultrason. Sonochem. 2017, 34, 571–579. [Google Scholar] [CrossRef] [PubMed]
  44. Yang, C.; Gu, Y. Diffusion coefficients and oil swelling factors of carbon dioxide, methane, ethane, propane, and their mixtures in heavy oil. Fluid Phase Equilibria 2016, 243, 64–73. [Google Scholar] [CrossRef]
  45. Peanparkdee, M.; Patrawart, J.; Iwamoto, S. Effect of extraction conditions on phenolic content, anthocyanin content and antioxidant activity of bran extracts from Thai rice cultivars. J. Cereal Sci. 2019, 86, 86–91. [Google Scholar] [CrossRef]
  46. Liu, Z.T.; Zhang, Y.; Zhang, X.J.; Zhang, T.T.; Zhang, J.S.; Chen, X.Q. Optimization of ultrasound-assisted extraction of flavonoids from Portulaca oleracea L., the extraction kinetics and bioactivity of the extract. J. Appl. Res. Med. Aromat. Plants 2023, 37, 100512. [Google Scholar] [CrossRef]
  47. Hao, Z.; Liang, L.; Liu, H.; Yan, Y.; Zhang, Y. Exploring the Extraction Methods of Phenolic Compounds in Daylily (Hemerocallis citrina Baroni) and Its Antioxidant Activity. Molecules 2022, 27, 2964. [Google Scholar] [CrossRef]
  48. Hou, M.; Hu, W.; Wang, A.; Xiu, Z.; Shi, Y.; Hao, K.; Sun, J. Ultrasound-assisted extraction of total flavonoids from Pteris cretica L.: Process optimization, HPLC analysis, and evaluation of antioxidant activity. Antioxidants 2019, 8, 425. [Google Scholar] [CrossRef]
  49. Liao, J.; Guo, Z.; Yu, G. Process intensification and kinetic studies of ultrasound-assisted extraction of flavonoids from peanut shells. Ultrason. Sonochem. 2021, 76, 105661. [Google Scholar] [CrossRef]
Figure 1. Chromatogram generated using high-performance liquid chromatography (HPLC). 1. Rutin; 2. isoquercetin; 3. myricetin; 4. quercetin; 5. apigenin; 6. diosmetin. (a) A mixed solution of six standards. (b) Sample solution of H0006 obtained via organic solvent extraction.
Horticulturae 09 01233 g001
Figure 2. Effect of sample weight on the total flavonoid extraction. Note: a, b, c, d and e represent significant differences at the 0.05 significance level.
Horticulturae 09 01233 g002
Figure 3. Effect of ethanol volume fraction on the total flavonoid extraction. Note: a, b, c, d and e represent significant differences at the 0.05 significance level.
Horticulturae 09 01233 g003
Figure 4. Effect of ethanol volume on total flavonoid extraction. Note: a, b, c, and d represent significant differences at the 0.05 significance level.
Horticulturae 09 01233 g004
Figure 5. Effect of ultrasonic extraction time on total flavonoid extraction. Note: a, b, c, and d represent significant differences at the 0.05 significance level.
Horticulturae 09 01233 g005
Figure 6. Sample weight, ethanol volume fraction, ethanol volume, ultrasonic extraction time, contour map, and response surface map of the total flavonoids extracted from Hemerocallis. (a) Sample weight and ethanol volume. (b) Sample weight and ultrasonic extraction time.
Horticulturae 09 01233 g006
Figure 7. DPPH scavenging rate (%) of the flavonoids content of Hemerocallis.
Horticulturae 09 01233 g007
Table 1. Variance analysis of the regression model.
SourceSum of SquaresDegrees of FreedomMean SquareF-Valuep-Value
Model15.33141.09106.57<0.0001significant
A2.6412.64257.15<0.0001
B0.4010.4039.27<0.0001
C0.4410.4442.92<0.0001
D1.0511.05102.24<0.0001
AB0.1610.1615.580.0015
AC0.8710.8785.11<0.0001
AD0.4410.4442.41<0.0001
BC0.1610.1615.580.0015
BD0.1510.1514.810.0018
CD0.2610.2624.830.0002
A22.3212.32226.26<0.0001
B25.1915.19505.65<0.0001
C23.2513.25315.95<0.0001
D22.6512.65257.51<0.0001
Residual0.14140.01
Lack of Fit0.13100.015.200.0632not significant
Pure Error0.0140.00
Cor Total15.4728
R2 = 0.9907Adj R2 = 0.9814
C.V.% = 3.16
Table 2. Differences in the flavonoid contents obtained via two extraction methods.
NumberRutin (µg/g)Isoquercetin (µg/g)Myricetin (µg/g)Quercetin (µg/g)Apigenin (µg/g)Diosmetin (µg/g)
H000182.40 **142.42 **−11.59 **−7.22 **−1.08 *−3.97 **
H0004879.50 **28.60 **−8.40 **−4.61 **−1.92 **14.05 **
H0006752.72 **6.34 **−8.32 **−9.34 **4.69 **−2.63 **
H0015615.38 **−189.86 **−11.79 **10.84 **12.58 **30.55 **
H00192115.45 **−61.65 **−10.10 **−0.083.24 **14.16 **
H0021591.38 **−5.63 **−9.98 **−16.34 **55.62 **−5.33 **
H002443.96 *−0.35−13.64 **−29.58 **−3.81 **9.90 **
H0025327.62 **20.27 *−13.24 **−27.10 **−0.4014.98 **
H0026318.46 **21.13 **−8.27 **−7.47 **−0.840.62
H0034110.75 **1.75−8.83 **−15.26 **−1.00 **3.24 **
H003962.72 **−15.33 **−9.83 **−16.36 **0.44 **−20.36 **
H0056703.66 **39.15 **−8.82 **−9.93 **1.43 **−0.56
H00571702.13 **88.28 **−9.83 *−7.88 **−1.87 **23.52 **
H00581001.59 **112.17 **−2.89 **−0.43−0.90 **24.18 **
H0059550.41 **−14.852.37167.25 **3.81 **8.60 **
H0060186.67 **4.08 *12.13 **−7.60 **−2.21 **−0.86
H0061892.89 **53.59 **−8.75 **−4.99 **4.21 **1.19 *
H0062669.14 **28.00 **−9.61 **−25.02 **−2.88 **−13.38 **
H006593.19 **32.20 **−6.96 **5.723.90 **7.63 **
H00661187.78 **39.81 **−7.60 **−5.82 **−2.52 **7.71 **
H00701243.81 **36.47 **−8.42 **−8.46 **2.54 **28.71 **
H0071937.79 **30.72 **−10.21 **−17.42 **14.83 **71.25 **
H0072337.38 **37.47 **−6.92 **−19.31 **−5.10 **2.63
H0073488.41 **11.40 **−12.66 **−9.09 **3.87 **16.01 **
H0075634.58 **81.23 **−12.62 **−3.76 **6.42 **11.04**
H007651.51 **−7.12 **−8.77 **−19.39 **−0.65 **16.02 **
H00791069.82 **124.43−6.57 **−14.81 **−1.88 **1.67 **
H00811095.43 **85.28 **−4.86 *1.88 **0.21 **22.08 **
H0083293.34 **2.93 **−5.74 **9.08 **−0.65 **48.49 **
H0084808.58 **55.21 **−7.52 **17.62 **1.39 **7.73 **
H0085810.76 **133.51 **−7.31 **26.60 **3.53 **17.71 **
H00861102.36 **−295.26 **−7.04 **−16.40 **5.39 **28.56 **
H00871100.68 **343.76 **−7.97 **48.37 **2.07 **14.57 **
H00881085.94 **63.98 **−9.97 **−4.99 **2.25 **17.44 **
H0089547.08 **−51.63 **−8.97 **−11.08 **−3.59 **1.35 **
H00911239.87 **85.19 **−5.17 **−18.17 **−0.47 **16.86 **
H0092902.46 **93.16 **0.31 **−19.73 **1.87 **93.05 **
H0094995.74 **35.25 **2.38 **−6.83 *2.10 **−21.49 **
H0095960.26 **279.09 **−7.66 **111.23 **0.73 **−3.15 **
H0120849.07 **112.83 **−9.91 **−26.57 **1.59 **0.98 **
H0122602.21 **93.57 **−1.3043.85 **1.67 **−2.08 **
H0123624.16 **4.45 **−6.51 **−6.02 **0.78 **2.38 **
H0142948.45 **143.06 **−6.04 **22.34 **0.08187.18 **
H0143984.06 **19.85 **−1.98 **−8.20 **−4.22 **6.87 **
H0144243.47 **67.16 **−10.94 **−23.87 **−2.42 **−3.78 **
H0145476.54 **−69.00 **−8.98 **−3.05 **−4.18 **−3.08 **
H0160228.04 **4.76 **−9.27 **−3.68 **0.13 *−1.00 **
H01611051.03 **−1.77−7.77 **−3.62 **35.87 **2.48 **
H0162899.06 **102.31 **−7.93 **−2.76 **−2.52 **149.46 **
H0164378.81 **15.24 **−9.74 **1.64 **−0.79 **82.36 **
H0166343.13 **16.22 **−10.24 **−0.65−2.39 **71.06 **
H0167540.51 **37.97 **−5.50 **0.86−0.01134.11 **
H0170381.29 **38.96 **−7.89 **6.35 **0.91 *72.68 **
H0172506.77 **31.32 **−8.72 **6.25 **1.48 **9.95 **
H0173535.18 **23.73 **−5.49 **5.47 **0.88 **119.85 **
H0174417.86 **38.03 **−8.86 **8.85 **0.72 **9.66 **
H0178363.75 **718.11 **−10.72 **−13.20 **2.95 **7.26 **
H0179494.72 **47.75 **−9.39 **1.84 **1.43 **10.98 **
H01811368.60 **34.64 **−10.20 **−0.98 **3.60 **17.60 **
H0182402.46 **38.77 **−9.31 **4.33 **3.04 **4.74 **
H0186915.21 **152.63 **−8.42 **21.98 **1.04 **12.39 **
H018732.99 **−42.98 **−7.77 **1.65 **37.48 **2.22
H01901445.00 **−167.30 **−9.42 **−10.76 **0.91 **14.94 **
H01912038.34 **130.10 **−10.32 **46.24 **3.44 **76.87 **
H0192526.62 **20.04 **−8.74 **−1.18 **−3.19 **4.97 **
H0205972.48 **42.60 **−8.39 **−8.72 **5.79 **15.41 **
H0206827.41 **354.73 **−9.21 **38.29 **0.23 **5.05 **
H0207390.52 **85.30 **−11.18 **47.99 **−37.71 **9.19 **
H0209−63.30 **−38.13 **−10.42 **−0.57−0.62 **1.62 *
H0210−420.90 **41.37 **32.10 **24.56 **−4.84 **−9.56 **
GPD 268565254256
1 The values represent the content of ultrasonic-assisted extraction minus the content of organic solvent extraction. 2 Germplasm with positive differences * p < 0.05, ** p < 0.01.
Disclaimer/Publisher’s Note: The statements, opinions and data contained in all publications are solely those of the individual author(s) and contributor(s) and not of MDPI and/or the editor(s). MDPI and/or the editor(s) disclaim responsibility for any injury to people or property resulting from any ideas, methods, instructions or products referred to in the content.

