
Impact of Cover Cropping on Temporal Nutrient Distribution and Availability in the Soil


1
Citrus Research and Education Center, Soil, Water, and Ecosystem Sciences Department, University of Florida, 700 Experiment Station Rd, Lake Alfred, FL 33850, USA
2
Southwest Florida Research and Education Center, Horticultural Sciences Department, University of Florida, 2685 State Road 29 North, Immokalee, FL 34142, USA
3
Southwest Florida Research and Education Center, Soil, Water, and Ecosystem Sciences Department, University of Florida, 2685 State Road 29 North, Immokalee, FL 34142, USA
*
Author to whom correspondence should be addressed.
Horticulturae 2023, 9(10), 1160; https://doi.org/10.3390/horticulturae9101160
Submission received: 26 August 2023
/
Revised: 14 October 2023
/
Accepted: 19 October 2023
/
Published: 22 October 2023
(This article belongs to the Special Issue Fruit Tree Cultivation in Modern Orchards: Advancements, Innovations, Sustainability, and Optimal Fruit Production)
Abstract
:Cover cropping is a best management practice that can improve soil quality by reducing soil erosion, building soil organic matter (SOM), and improving soil nutrient availability. Southwest (SW) Florida citrus growers have the challenge of growing citrus in sandy soils characterized by low organic matter (<2%), extremely low water and nutrient-holding capacities, and high sand content (>90%), and therefore are looking for methods to improve SOM and nutrient retention and availability in sandy soils. A trial of two cover crop (CC) mixtures planted in the row middles (RM) of Huanglongbing-affected citrus ‘Valencia’ (Citrus sinensis (L.) Osbeck) orchards in sandy soils in SW Florida was conducted. This study explored how incorporating CCs in the RM of the orchards could affect soil ammonium (NH4+), soil nitrate (NO3−), exchangeable macronutrients, and SOM temporal availability. These parameters were measured under the tree canopy (UC) and within RM of two orchards: South Grove (SG) and North Grove (NG), both located in SW Florida. The two seeded CC mixtures were legume + non-legume (LG+NL) and non-legume (NL) and were compared to a control no-CC grower standard (GSC). Phosphorus, calcium, magnesium, and NH4+ were not statistically significantly different among treatments in either of the two sampling positions (UC and RM). Cover cropping significantly (p < 0.05) increased NO3−-N concentrations in the RM area of the citrus orchards after seven consecutive seasons (brassicas, legumes, and grasses) by 31% in the LG + NL and 29% in the NL with reference to the GSC. In addition to the significant increase in NO3−N, SOM significantly (p < 0.05) increased in the RM in the NG site only in both CCs treatments by 17% and 16% for LG + NL and NL treatments, respectively, compared with GSC.
1. Introduction
Cover crops (CCs) planted in the row middles of citrus orchards can help reduce soil erosion, attract beneficial insects (pollinators), suppress weeds (reduce weed seed bank), build soil organic matter, improve nutrient availability, increase soil water retention, and enhance soil microbial activities [1,2,3,4]. Cover cropping has gained popularity among citrus producers as different CCs can provide ecosystem services to agricultural systems. For example, legumes can create a symbiotic relationship with nitrogen-fixing microorganisms in the soil. This relationship is significant because it is estimated that a plant can obtain more than 60% of its N requirements from a biological origin, primarily ascribed to symbiotic relationships such as legumes–soil microorganisms [5].
Grasses can also be a beneficial addition to a CC mix. The pathway of photosynthesis for grasses influences CC growth. C3 grasses, for example, are better adapted to cooler climates, while C4 grasses can grow in high temperatures and arid conditions. The majority of warm-season grasses used as CCs are C4 grasses. However, the type of grass chosen for a CC mix should depend on the site-specific climatic conditions and soil type. Plants in the Brassicaceae family can also be part of a CC mix for perennial cropping systems. The main benefits provided by these plants are weed suppression and decreased soil compaction. The quantity of N and carbon (C) that a CC adds to perennial agricultural systems is determined by soil type, moisture, temperature, and microbial activity, as well as the CC species, residue quality, and environmental conditions [6,7]. Franzluebbers et al. [8] estimated that the amount of N in cowpea plants at seven weeks was double that of the plants at five weeks old, demonstrating the fast N accumulation capacity in the plants.
However, there is a lack of comprehensive understanding of the impact of cover cropping on temporal nutrient availability and distribution. Wang et al. [9] reported that cover cropping did not affect soil nutrient concentration after four years (NH4+ and P, 0–60 cm soil depth); however, cover cropping for 4 and 8 years significantly increased NO3−-N in the 40–60 cm soil layer, and cover cropping for 8 and 13 years increased soil total nitrogen, NH4+, SOM and P nutrient content in soil layer at 0–60 cm depth. There is little to no literature on the effect of cover cropping on temporal availability and nutrient distribution in sandy soils in citrus production with HLB-affected trees with subtropical conditions such as the ones in Florida.
Florida citrus producers have many production challenges, including very sandy soils with low water and nutrient-holding capacities [10]. The organic matter content of these soils is also extremely low, typically < 2% [11]. These characteristics make it difficult for citrus producers to retain water and nutrients within the root zone. Also, research has shown that Huanglongbing (HLB) disease, endemic to Florida citrus, causes a reduction in soil microbes that are key for N availability [12].
Soil health in citrus is more critical than ever because of the severe loss of roots on citrus trees due to HLB, also known as citrus greening. Cover crops could potentially improve citrus orchard soil health by enhancing the soil’s chemical, biological, and physical properties, which could have a positive impact on crop yield and overall citrus productivity [2,13].
One of the critical components of a healthy soil is the organic matter (SOM) content. The production of SOM is highly affected by soil microbial communities and activity, as well as soil C and N, water, pH, and plant species [14]. To improve SOM and therefore soil health, the USDA National Resource Conservation Service (NRCS) recommends: (1) keeping soil covered most of the year, (2) increasing plant diversity, and (3) reducing soil disturbance [15]. Points one and two above can be achieved by planting cover crops in row middles of citrus orchards.
Chemical, physical, and biological indicators can provide information on changes in soil health status [16]. Physical indicators include aggregate stability, soil crusts, water-holding capacity, and soil erosion. Chemical indicators include total N, soil electric conductivity, pH, and extractable potassium (K), calcium (Ca), magnesium (Mg), sodium (Na), and phosphorus (P). Finally, biological indicators can include microbial biomass (respiration), SOM, macrofauna abundance and diversity, and weed seed bank [14,17]. Changes in SOM can indicate an improvement in nutrient retention and a reduction in soil erosion. Changes in physical indicators such as bulk density and soil structure can indicate improvements in the soil water-holding capacity [18]. However, the time it takes to see changes in soil health indicators varies. Some soil indicator changes, such as microbial biomass and enzyme activities, will be noticed in the short-term (months). In contrast, other soil indicator changes take longer (years). Long-term soil indicators include bulk density, SOM, and soil total C [16].
Researchers have shown that CCs have the potential to increase nutrient availability and maintain or increase SOM levels, and therefore enhance soil health [2,4,19]. However, there is generally a lack of information on the impact of CC mixes (grasses, brassicas, and legumes) on perennial systems (e.g., citrus) in sandy soil conditions on nutrient availability and SOM.
This study aimed to evaluate the impact of two CC mixes: legumes + non-legume (legume, brassicas, and grasses) vs. non-legume (brassicas and grasses) planted in HLB-affected citrus orchard row middles on soil macronutrients and SOM. It was hypothesized that CC mixes would increase available macronutrients (ammonium-N (NH4+-N), nitrate-N (NO3−-N), P, K, Mg, and Ca) and SOM compared with row middles managed using the citrus grower standard practices (no-cover cropping along with herbicide applications and mowing).
2. Materials and Methods
2.1. Study Site
This study was conducted in two Southwest Florida commercial orange orchards (North Grove lat. 26.50865° N; long. 81.3898° W and South Grove lat. 26.426826° N, long. 81.226163° W). The distance between the orchards is approximately 32 km (Supplementary Figure S1) and both are in Collier County, Florida, USA. ‘Valencia’ (Citrus sinensis (L.) Osbeck) budded onto Swingle rootstock (Citrus paradisi Macf. × Poncirus trifoliata) trees that were planted in 1991. The climate of the experimental site is classified as tropical savanna [20], with the highest rainfall observed between June and October. Winter (November to February) and Spring (March to May) seasons are low in precipitation. Average rainfall for the ten days after CC planting is presented in Figure 1 using data obtained from the Florida Automated Weather Network (https://fawn.ifas.ufl.edu/data/, accessed on 20 August 2022). Cover crops at the two citrus orchards (hereafter referred to as North and South Grove) were planted approximately ten days apart. The average total rainfall, temperature, soil temperature (−10 cm), and evapotranspiration (ET) were calculated for the following time periods: 2018 (August to December), 2019 to 2021 (January to December), and 2022 (January to April) (Figure 2).
According to the United States Department of Agriculture, Natural Resource Conservation Service (USDA-NRCS), the soil in North Grove (NG) is classified as sandy and siliceous hyperthermic Arenic Alaquods [20,21]. This is an Immokalee fine sand with slopes between 0 and 2% and poorly drained, belonging to the order Spodosol [20,21] (Supplementary Figure S2). The soil at the South Grove (SG) experimental site is classified as loamy, active, and siliceous hyperthermic Grossarenic Endoaqualfs. This is a Holopaw fine sand of the order Alfisol. The slopes are between 0 and 2% and are poorly drained soils.
2.2. Experimental Design and Management
This field trial was conducted from August 2018 to September 2021. Treatments were arranged in a randomized block design with 12 replicates per treatment. Each replicate plot consisted of two beds with 52 citrus trees per bed. The row middle width was 3 m, and the distance from the end of the row middle to the trunk of the citrus tree was 2 m (Supplementary Figure S3). The spacing between trees within rows was 3.8 m and between rows was 7.3 m in the North Grove; spacing was 3.3 m between trees within rows and 6.7 m between rows in the South Grove. Two CC mixes were evaluated at each orchard: legume + non-legume (LG + NL; brassicas, legumes, and grasses) and non-legume only (NL; brassicas and grasses). The same species of non-legume CCs were used for both treatments (LG + NL and NL). The CCs were planted twice during the year, in the summer and fall seasons. Table 1 describes CC mixes, planting months, and seeding rates.
Cover crops were only planted in the row middles of the orchards using a no-till drill and appropriate row spacing (Supplementary Figure S3). A grower standard practice with no-cover crops was used as a grower standard control (GSC). The GSC followed standard grower practices for weed management: herbicide applications were made under the tree canopy and the row middles approximately every four months (0.84 kg active ingredient (a.i.) ha−1 paraquat (1,1′-dimethyl-4,4′-bipyridylium ion)). The CCs were terminated by mowing before every new planting. After CCs were mowed, the residues were incorporated through superficial tillage (John Deere rotavator (John Deere, Moline, IL, USA)) into the topsoil up to 10 cm soil depth. Both orchards followed commercial citrus production practices for fertilizer and irrigation [22]. The trees were irrigated with a 40.5 L h−1 micro-sprinkler (Maxijet, Dundee, FL, USA) emitter located at the soil surface 1 m from the trunk of the citrus trees. The water utilized for irrigation was fresh groundwater with no issues of salinity. Nitrogen fertigation was conducted for a total application of 260 kg N ha−1 year−1 (Diamond R Fertilizer, Winter Garden, FL, USA) using NH4NO3. Liquid fertilizer included calcium nitrate, potassium chloride, phosphoric acid, calcium sulfate, magnesium sulfate, and the micronutrients manganese, boron, zinc, and iron of sulfate or nitrate source. The row middles where the CCs were planted and the GSC were not fertilized or irrigated. The methods of this work are complementary to the papers published by [23,24]
2.3. Determination of Soil Nutrient Concentration
Baseline soil samples were collected prior to planting cover crops to determine soil nutrient concentrations (NH4+-N, NO3−-N, P, K, Mg, and Ca) and SOM in the row middles. Soil nutrient concentration and SOM were then measured annually (August 2019, 2020, and 2021). Soil samples were collected from 10 randomly selected trees/replicates in the row middles and 30 cm from the citrus tree trunk to provide two pooled soil samples for each replicate.
Soil samples were collected from 0–20 cm (top) to create a composite sample of about 0.45 kg. To prevent possible N losses, the collected soil samples were stored for transport on ice and then transferred to a freezer at the UF/IFAS Citrus Research and Education Center (CREC), where they remained until they were analyzed for total ·macronutrients (NH4+-N, NO3−-N, P, K, Mg, and Ca) following the methods outlined in UF/IFAS guidelines [21]. Ammonium-N and NO3−-N were determined using a 2 moles/L KCl extraction method [23], and extracts were measured on a flow injection analyzer (QuikChem 8500, Lachat Co., Aurora, CO, USA). Potassium, P, Mg, and Ca were analyzed using the Mehlich-3 (M-3) soil extraction method [22]. Mehlich-3 K, P, Mg, and Ca were measured using the Inductively Coupled Plasma (ICP)-Optimal Emission Spectrometer Optima 7000DV (Perkin Elmer Co., Akon, OH, USA). SOM was determined using the loss-on-ignition method [25].
2.4. Cover Crop Density Assessment
The density of CCs was measured in NG in March 2019, August 2019, July 2020, and September 2021. Similar measurements were performed in SG on the same dates except for the first sampling in March 2019, when no sampling was conducted due to poor germination of the CCs. A 1 m2 quadrant was randomly placed in the row middle of each plot to carry out the weed and CC counts. Weed and CC data were collected from 3 quadrants per replicate.
2.5. Statistical Analyses
Response variables were analyzed on a plot mean basis using linear mixed model methodology implemented in SAS® PROC GLIMMIX (SAS/STAT 15.1; SAS Institute, Cary, NC, USA). The site, CC, sampling date, and all two- and three-way interactions were considered fixed effects. Replicate within the site was the sole G-side random effect. The repeated nature of the experiment (measuring the same experimental unit over time) necessitated modeling the residual covariance structure. The unstructured covariance was chosen based on Akaike’s Information Criterion (AICC) and the residual plots. Irrespective of the F-test results, the three-way-interaction means were calculated, and CC treatments (legume, non-legume) were compared to each other and the untreated control using a simple t-test within each site × sampling date combination (p-values ≤ 0.05).
3. Results and Discussion
Cover cropping (LG + NL and LG treatments) significantly increased the soil NO3−-N concentration compared to GSC treatment only in the row middles in the North Grove site after three years (Figure 3). Planting NL and LG + NL also significantly increased SOM values compared to the GSC treatment only in the row middles of the North Grove site (Figure 4). However, there were no statistical differences in soil NH4+-N, P, K, Mg, and Ca concentrations for LG + NL, NL, and GSC for any of the site (North and South Grove) and sampling locations (tree canopy and row middle; Supplementary Figures S4–S8 and Table S1).
Our study found that planting cover crops (LG + NL and NL) increased NO3−-N concentrations in the row middle area of the citrus orchards after seven consecutive cover crop (brassicas, legumes, and grasses) plantings by 31% with the LG + NL treatment and 29% with the NL treatment compared with the GSC treatment (Figure 4). These increases were similar to those observed in N availability due to cover cropping with legumes and mixes of non-legume and legume cover crops [24]. In our study, the increase in NO3−-N was only observed in the row middles and not under the tree canopy. This could be because CCs were only planted in the row middles of the orchards, where the CCs provided enough N input compared with the GSC, which was characterized by abundant natural vegetation common in the area (weeds). However, in our study, cover cropping did not provide an increase in NH4+-N. This may be because N contributed by the cover crops could have been rapidly mineralized to NH4+-N and then to NO3−-N due to the favorable conditions for mineralization in these soils (high temperatures avg. above 25 °C and good moisture) [25].
Nitrate is the preferred N form absorbed by citrus [26,27]. Nitrogen is an essential macronutrient for citrus tree production that impacts tree growth, fruit yield, and quality, and it is one of the nutrients that is more absorbed and accumulated by citrus trees [28,29,30]. Adequate levels of N aid the tree in fighting abiotic and biotic stress [26,27,31,32,33]. The measured increase in NO3−-N in the row middles due to cover crops could potentially favor citrus tree performance. However, in this study, an increase in yield was not observed for any of the three seasons (2019–2020, 2020–2021, 2021–2022) [34]. A more in-depth study should be conducted to evaluate the correlation between citrus tree root length and nutrient uptake from row middles, as one of the main effects of HLB is the drastic root mass reduction, which could diminish the NO3−-N uptake in the row middles by the citrus trees.
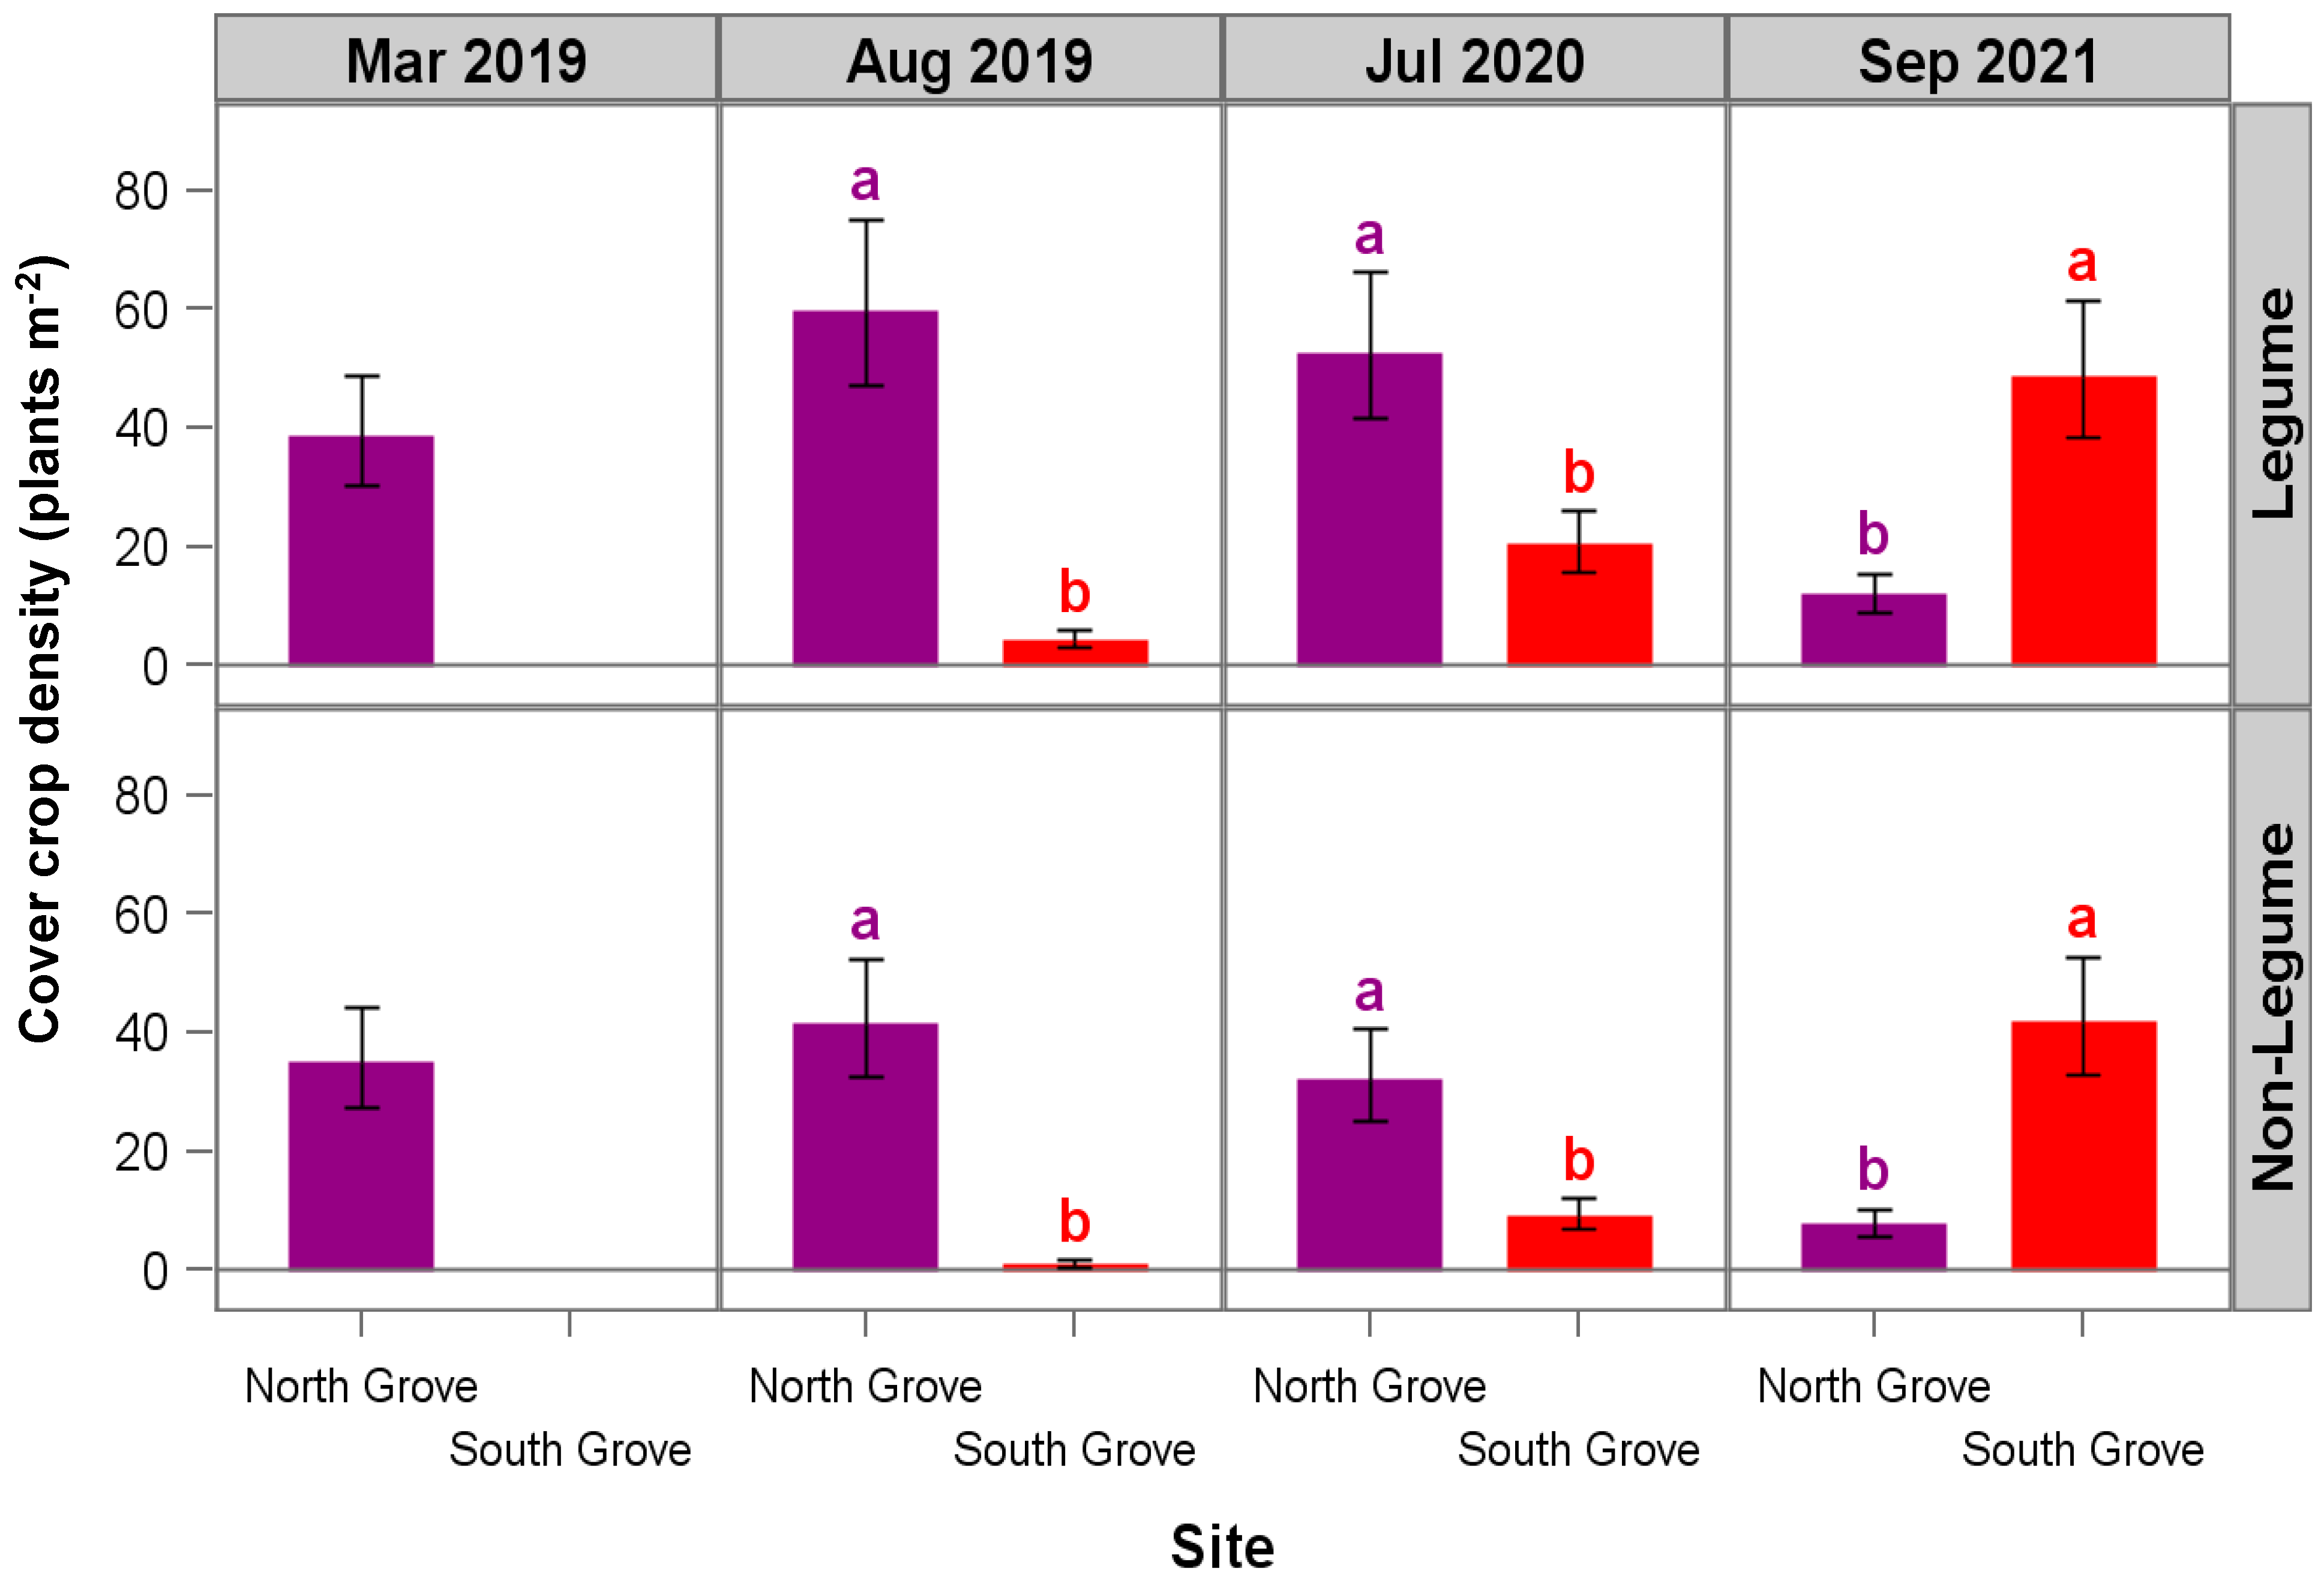
In addition to the significant increase in soil NO3−-N, we also measured an increase of SOM in the row middles in only the North Grove site for both CC treatments: 17% and 16% for LG + NL and NL treatments, respectively, compared with GSC (Figure 4). Steenwerth and Belina observed similar results in a vineyard intercropped with CCs where they measured an increase of SOM in the row middles of vineyards where CCs were planted [35]. Oliveira et al. observed a positive effect on SOM due to the incorporation of CCs (grasses and legumes) in the row middles of citrus orchards in Brazil [36]. Similarly, Repullo-Ruibérriz et al. found SOM increased due to cover crops in the row middles of olive orchards [37]. The increase in SOM in the row middles can be attributed to better CC germination and establishment as CC density for the majority of the study was significantly higher in NG compared to SG (Figure 5). This illustrates that CCs are not one-size-fits-all. Other factors that could have also influenced SOM increases with cover crop treatments could be the higher dry matter accumulation produced by the CCs, CCs plant root litter, an increase in residue diversity composition [38,39], and adequate rainfall, soil moisture, and temperature, which may have promoted faster decomposition. In general, the decomposition of CC material can be affected by soil temperature and water content present in the soil, CC species and age, management practices (e.g., termination method), soil type and texture, weather conditions, microbial activity and diversity, and residue placement [6,40,41,42,43,44].
Greater precipitation and cover crop biomass differences likely contributed to the increases in soil NO3−-N and SOM observed only at one of the sites (NG) compared with SG (Figure 1 and Figure 5). In addition to the differences in precipitation (Figure 1), low soil moisture [45], soil type, soil-to-seed contact at CC planting [46], grower management practices [47] (each site had different managers), and initial SOM content may have also played a role in the different results between the two locations. In particular, the SOM in NG was higher at the start of the trial compared to SG (Table 2), which could have contributed to the greater germination success in the NG.
4. Conclusions
This study demonstrated that CC mixtures of legumes, brassicas, and grasses increased NO3−-N concentrations by 29 to 31% (p ≤ 0.05) and SOM by 16 to 17% (p ≤ 0.01) compared with the grower standard in citrus row middles in Florida sandy soils after seven consecutive CC growing seasons. The increase in NO3−-N and SOM was only observed in one of the citrus orchards (NG) due to a lower CC germination in the second site (SG) that can be attributed to several abiotic and biotic differences at these locations.
This research provided valuable insight into multispecies of CCs that can be incorporated into citrus production in Florida sandy soils. Future research needs to be conducted to evaluate CC growth patterns by season in Florida sandy soils and the effects of CC species, seeding rate per species in the CC mixture, termination method, and incorporation.
Supplementary Materials
The following supporting information can be downloaded at: https://www.mdpi.com/article/10.3390/horticulturae9101160/s1, Figure S1: The geographic location of North Grove and South Grove. The approximate distance between groves is 32 km. Collier County, Immokalee, Florida, US. Source: National Oceanic and Atmospheric Administration (NOAA); Figure S2: Soil order for each site (North and South Grove). (A) North Grove soil order—Spodosol. (B) South Grove soil order—Alfisol. Source: United States Department of Agriculture (USDA)-Natural Resources Conservation Service (NRCS), Environmental Systems Research Institute, Inc. (Esri). Software: ArcGIS Pro version 3.0.1; Figure S3: North Grove site. Cover crops were only planted in the row middle area. The row middle width was 3 m, and the distance from the row middle to the trunk of the citrus trees was 2 m. Photo courtesy of Dr. Sarah Strauss and Dr. Antonio Castellano-Hinojosa; Figure S4: Soil ammonium-nitrogen concentration in the row middles and under the tree canopy in the North and South Groves. Treatments included legume (LG + NL), non-legume (NL), and no cover (control, no-cover cropped). Error bars represent 95% confidence limits based on 12 replicates. Treatments within a cell sharing a given letter are not statistically different at p ≤ 0.05 based on the least significant difference (LSD) (simple two-sample t-test); Figure S5: Soil phosphorus concentration in the row middles and under the tree canopy in the North and South Groves. Treatments include legume (LG + NL), non-legume (NL), and no cover (control, no-cover cropped). Error bars represent 95% confidence limits based on 12 replicates. Treatments within a cell sharing a given letter are not statistically different at p ≤ 0.05 based on the least significant difference (LSD) (simple two-sample t-test); Figure S6: Soil potassium concentration in the row middles and under the tree canopy in the North and South Groves. Treatments include legume (LG + NL), non-legume (NL), and no cover (control, no-cover cropped). Error bars represent 95% confidence limits based on 12 replicates. Treatments within a cell sharing a given letter are not statistically different at p ≤ 0.05 based on the least significant difference (LSD) (simple two-sample t-test); Figure S7: Soil magnesium concentration in the row middles and under the tree canopy in the North and South Groves. Treatments include legume (LG + NL), non-legume (NL), and no cover (control, no-cover cropped). Error bars represent 95% confidence limits based on 12 replicates. Treatments within a cell sharing a given letter are not statistically different at p ≤ 0.05 based on the least significant difference (LSD) (simple two-sample t-test); Figure S8: Soil calcium concentration in the row middles and under the tree canopy in the North and South Groves. Treatments include legume (LG + NL), non-legume (NL), and no cover (control, no-cover cropped). Error bars represent 95% confidence limits based on 12 replicates. Treatments within a cell sharing a given letter are not statistically different at p ≤ 0.05 based on the least significant difference (LSD) (simple two-sample t-test); Table S1: Analysis of variance (ANOVA) for P, Ca, Mg, NH4+-N, NO3−-N, and organic matter (OM) concentration in the soil.
Author Contributions
Conceptualization, M.B., R.G.K., S.L.S. and D.M.K.; methodology, M.B., R.G.K., S.L.S. and D.M.K.; statistical analysis, M.B.; writing—original draft preparation, M.B.; writing—review and editing, M.B., R.G.K., S.L.S. and D.M.K.; data visualization, M.B.; funding acquisition, S.L.S., D.M.K. and R.G.K. All authors have read and agreed to the published version of the manuscript.
Funding
This study was supported with funds from the Citrus Research and Development Foundation grant 18-059C and Tropicana grant #P0238082-209-2200.
Data Availability Statement
Raw data will be available by requesting them via email to [email protected].
Acknowledgments
The authors are grateful to E. Van Santen for his assistance with the statistical analysis. The authors also acknowledge that the abridged version of this paper was presented at the 136th Annual Meeting of the Florida State Horticultural Society on 12 June 2023 as paper # C-15. The support of the grower cooperators in southwest Florida is gratefully acknowledged. The authors would also like to thank the staff of the Southwest Florida Research and Education Center Soil Microbiology and Weed Science Laboratories and the Citrus Research and Education Center Water and Nutrient Management Laboratory for their help with data collection and sample processing.
Conflicts of Interest
The authors declare no conflict of interest. The funders had no role in the design of the study; in the collection, analyses, or interpretation of data; in the writing of the manuscript; or in the decision to publish the results.
References
- Chen, G.; Weil, R.; Hill, R. Effects of compaction and cover crops on soil least limiting water range and air permeability. Soil Till. Res. 2014, 136, 61–69. [Google Scholar] [CrossRef]
- Dabney, S.M.; Delgado, J.A.; Reeves, D.W. Using winter cover crops to improve soil and water quality. Commun. Soil Sci. Plant Anal. 2001, 32, 1221–1250. [Google Scholar] [CrossRef]
- De Baets, S.; Poesen, J.; Meersmans, J.; Serlet, L. Cover crops and their erosion-reducing effects during concentrated flow erosion. Catena 2011, 85, 237–244. [Google Scholar] [CrossRef]
- Wick, A.; Berti, M.; Lawley, L.; Liebig, M. Integration of annual and perennial cover crops for improving soil health. In Soil Health and Intensification of Agroecosystems; Al-Kaisi, M.M., Lowery, B., Eds.; Academic Press: Oxford, UK, 2017; pp. 127–150. [Google Scholar]
- Buscot, F.; Varma, A. Microorganisms in Soils: Roles in Genesis and Functions, 1st ed.; Springer: Berlin/Heidelberg, Germany, 2005. [Google Scholar]
- Baitsaid, A.; Schaffer, B.; Vargas, A.I.; Li, Y.; Liu, G. Effect of plant age on in soil decomposition and nitrogen content of sunn hemp tissue. Commun. Soil Sci. Plant Anal. 2018, 49, 2680–2688. [Google Scholar] [CrossRef]
- Stallings, A.M.; Balkcom, K.S.; Wood, C.W.; Guertal, E.A.; Weaver, D.B. Nitrogen mineralization from ‘AU Golden’ sunn hemp residue. J. Plant Nutr. 2017, 40, 50–62. [Google Scholar] [CrossRef]
- Franzluebbers, A.J.; Hons, F.M.; Zuberer, D.A. Long-term changes in soil carbon and nitrogen pools in wheat management systems. Soil Sci. Soc. Am. J. 1994, 58, 1639–1645. [Google Scholar] [CrossRef]
- Wang, Y.; Liu, L.; Tian, Y.; Wu, X.; Yang, J.; Luo, Y.; Li, H.; Kumar Awasthi, M.; Zhao, Z. Temporal and spatial variation of soil microorganisms and nutrient under white clover cover. Soil Tillage Res. 2020, 202, 104666. [Google Scholar] [CrossRef]
- Obreza, T.A.; Collins, M.E. Common Soils Used for Citrus Production in Florida; SL 193; University of Florida: Gainesville, FL, USA, 2008. [Google Scholar]
- Fares, A.; Dogan, A.; Abbas, F.; Parsons, L.; Obreza, T.; Morgan, K. Water balance components in a mature citrus orchard. Soil Sci. Soc. Am. J. 2008, 72, 578–585. [Google Scholar] [CrossRef]
- Zhou, Y.; Tang, Y.; Hu, C.; Zhan, T.; Zhang, S.; Cai, M.; Zhao, X. Soil applied Ca, Mg and B altered phyllosphere and rhizosphere bacterial microbiome and reduced Huanglongbing incidence in Gannan Navel Orange. Sci. Total Environ. 2021, 791, 148046. [Google Scholar] [CrossRef]
- Delgado, J.A.; Dillon, M.A.; Sparks, R.T.; Essah, S.Y.C. Decade of advances in cover crops: Cover crops with limited irrigation can increase yields, crop quality, and nutrient and water use efficiencies while protecting the environment. J. Soil Water Conserv. 2007, 62, 110A–117A. [Google Scholar]
- Henis, Y. Soil microorganisms, soil organic matter and soil fertility. In The Role of Organic Matter in Modern Agriculture; Chen, Y., Avnimelech, Y., Eds.; Springer: Dordrecht, The Netherlands, 1986; Volume 25. [Google Scholar]
- U.S. Department of Agriculture; Natural Resources Conservation Service (USDA-NRCS). Soil Health. 2021. Available online: https://www.nrcs.usda.gov/wps/portal/nrcs/main/soils/health/ (accessed on 4 January 2022).
- Tully, K.L.; McAskill, C. Promoting soil health in organically managed systems: A review. Org. Agric. 2019, 10, 339–358. [Google Scholar] [CrossRef]
- Soil Health Institute. Soil Health Indicators and Methods to Be Assessed. 2021. Available online: https://soilhealthinstitute.org/north-american-project-to-evaluate-soil-health-measurements/ (accessed on 8 August 2021).
- Hux, B.; DeLaune, P.; Schirmarcher, M.; Gentry, T.; Mubvumba, P. Winter cover crop impact on soil health and nutrients in Texas rolling plains dryland cotton. Agrosystems Geosci. Environ. 2023, 6, e20352. [Google Scholar] [CrossRef]
- Koppen, W. Das Geographisca System der Klimate. In Handbuch der Klimatologie; Koppen, W., Geiger, G., Eds.; Gebrüder Borntraeger Verlagsbuchhandlung: Stuttgart, Germany, 1936; pp. 1–44. [Google Scholar]
- USDA–NRCS. Web Soil Survey. 2015. Available online: https://websoilsurvey.sc.egov.usda.gov/App/WebSoilSurvey.aspx (accessed on 9 October 2019).
- Obreza, T.A.; Zekri, M.; Hanlon, E.W. Soil and leaf tissue testing. In Nutrition of Florida Citrus Trees, 2nd ed.; Obreza, T.A., Morgan, K.T., Eds.; University of Florida: Gainesville, FL, USA, 2020; pp. 24–32. [Google Scholar]
- Hanlon, E.A.; Gonzalez, J.S.; Bartos, J.M. Mehlich-3 extractable P, K, Ca, Mg, Cu, Mn, Zn, and Fe. In IFAS Extension Soil Testing Laboratory (ESTL) and Analytical Research Laboratory (ARL) Chemical Procedures and Training Manual; University of Florida: Gainesville, FL, USA, 1997. [Google Scholar]
- Castellano-Hinojosa, A.; Kanissery, R.; Strauss, S.L. Cover crops in citrus orchards impact soil nutrient cycling and the soil microbiome after three years but effects are site-specific. Biol. Fertil. Soils 2023, 59, 659–678. [Google Scholar] [CrossRef]
- Castellano-Hinojosa, A.; Martens-Habbena, W.; Smyth, A.R.; Kadyampakeni, D.M.; Strauss, S.L. Short-term effects of cover crops on soil properties and the abundance of N-cycling genes in citrus agroecosystems. Appl. Soil Ecol. 2022, 172, 104341. [Google Scholar] [CrossRef]
- Hanlon, E.A.; Gonzalez, J.S.; Bartos, J.M. Potassium chloride (1 M) extractable NH4-N, NO3−-N, and Al. In IFAS Extension Soil Testing Laboratory (ESTL) and Analytical Research Laboratory (ARL) Chemical Procedures and Training Manual; University of Florida: Gainesville, FL, USA, 1997. [Google Scholar]
- Cambardella, C.; Gajda, A.; Doran, J.; Wienhold, B.; Kettler, T. Estimation of particulate and total organic matter by weight loss-on-ignition. In Assessment Methods for Soil Carbon; Lal, R., Kimble, J.M., Follet, R.J., Stewart, B.A., Eds.; CRC Press: Boca Raton, FL, USA, 2001; pp. 349–359. [Google Scholar]
- Abbasi, M.K.; Tahir, M.M.; Shah, A.H.; Batool, F. Mineral nutrient composition of different ecotypes of white clover and their nutrient credit to soil at Rawalkot Azad Jammu and Kashmir. Pak. J. Bot. 2009, 41, 41–51. [Google Scholar]
- O’Connell, S.; Shi, W.; Grossman, J.M.; Hoyt, G.D.; Fager, K.L.; Creamer, N.G. Short-term nitrogen mineralization from warm-season cover crops in organic farming systems. Plant Soil 2015, 396, 353–367. [Google Scholar] [CrossRef]
- Alva, A.K.; Tucker, D.P. Soils and citrus nutrition. In Citrus Health Management; Timmer, L.W., Duncan, L.W., Eds.; APS Press: St. Paul, MN, USA, 1999; pp. 59–71. [Google Scholar]
- Marcondes, J.; Lemos, E. Nitrogen metabolism in citrus based on expressed tag analysis. In Advances in Citrus Nutrition; Springer: Berlin/Heidelberg, Germany, 2012; pp. 245–255. [Google Scholar]
- Mattos, D., Jr.; Quaggio, J.; Cantarella, H.; Alva, A. Nutrient content of biomass components of Hamlin sweet orange trees. Sci. Agric. 2003, 60, 155–160. [Google Scholar] [CrossRef]
- Morgan, K.T.; Scholberg, J.M.S.; Obreza, T.A.; Wheaton, T.A. Size, biomass, and nitrogen relationships with sweet orange tree growth. J. Am. Soc. Hortic. Sci. 2006, 131, 149–156. [Google Scholar] [CrossRef]
- Kadyampakeni, D.M.; Morgan, K.T.; Schumann, A.W. Biomass, nutrient accumulation and tree size relationships for drip-and microsprinkler-irrigated orange trees. J. Plant Nutr. 2016, 39, 589–599. [Google Scholar] [CrossRef]
- Qin, W.; Assinck, F.; Heinen, M.; Oenema, O. Water and nitrogen use efficiencies in citrus production: A meta-analysis. Agric. Ecosyst. Environ. 2016, 222, 103–111. [Google Scholar] [CrossRef]
- Quaggio, J.; Souza, T.; Bachiega, Z.; Marcelli, B.; Mattos, D. Nitrogen-fertilizer forms affect the nitrogen-use efficiency in fertigated citrus groves. J. Plant Nutr. Soil Sci. 2014, 177, 404–411. [Google Scholar] [CrossRef]
- Brewer, M. Citrus Row-Middle Management Using Cover Crops for Suppressing Weeds and Improving Soil. Ph.D. Thesis, University of Florida, Gainesville, FL, USA, 2023. [Google Scholar]
- Steenwerth, K.; Belina, K. Cover crops enhance soil organic matter, carbon dynamics and microbiological function in a vineyard agroecosystem. Appl. Soil Ecol. 2008, 40, 359–369. [Google Scholar] [CrossRef]
- Oliveira, F.E.R.; Oliveira, J.M.; Xavier, F.A.S. Changes in soil organic carbon fractions in response to cover crops in an orange orchard. Rev. Bras. Cienc. Solo 2016, 40, e0150105. [Google Scholar] [CrossRef]
- Repullo-Ruibérriz de Torres, M.A.; Carbonell-Bojollo, R.M.; Moreno-García, M.; Ordóñez-Fernández, R.; Rodríguez-Lizana, A. Soil organic matter and nutrient improvement through cover crops in a Mediterranean olive orchard. Soil Tillage Res. 2021, 210, 104977. [Google Scholar] [CrossRef]
- Novara, A.; Minacapilli, M.; Santoro, A.; Rodrigo-Comino, J.; Carrubba, A.; Sarno, M.; Venezia, G.; Gristina, L. Real cover crops contribution to soil organic carbon sequestration in sloping vineyard. Sci. Total Environ. 2019, 652, 300–306. [Google Scholar] [CrossRef] [PubMed]
- Sainju, U.M.; Singh, B.P.; Whitehead, W.F. Long-term effects of tillage, cover crops, and nitrogen fertilization on organic carbon and nitrogen concentrations in sandy loam soils in Georgia, USA. Soil Tillage Res. 2002, 63, 167–179. [Google Scholar] [CrossRef]
- Abera, G.; Wolde-Meskel, E.; Bakken, L. Unexpected high decomposition of legume residues in dry season soils from tropical coffee plantations and crop lands. Agron. Sustain. Dev. 2014, 34, 667–676. [Google Scholar] [CrossRef]
- Gijsman, A.J.; Alarcón, H.F.; Thomas, R.J. Root decomposition in tropical grasses and legumes, as affected by soil texture and season. Soil Biol. Biochem. 1997, 29, 1443–1450. [Google Scholar] [CrossRef]
- Vieira, F.C.B.; Bayer, C.; Zanatta, J.A.; Mielniczuk, J.; Six, J. Building up organic matter in a subtropical pleudult under legume cover-crop-based rotations. Soil Sci. Soc. Am. J. 2009, 73, 1699–1706. [Google Scholar] [CrossRef]
- Boyd, N.; Van Acker, R. The effects of depth and fluctuating soil moisture on the emergence of eight annual and six perennial plant species. Weed Sci. 2003, 51, 725–730. [Google Scholar] [CrossRef]
- Roth, G.; Curran, W.; Dillon, C.; Houser, C.; Harkcom, W. Cover Crop Interseeder and Applicator; Pennsylvania State University: University Park, PA, USA, 2015. [Google Scholar]
- Wilson, M.; Baker, J.; Allan, D. Factors affecting successful establishment of aerially seeded winter rye. Agron. J. 2013, 105, 6–1868. [Google Scholar] [CrossRef]
Figure 1.
Average rainfall (mm) for the following ten days after cover crop (CC) planting. Cover crop planting was conducted ten days apart. Data were obtained from the Florida Automated Weather Network (https://fawn.ifas.ufl.edu/data/, accessed on 10 July 2022).
Figure 1.
Average rainfall (mm) for the following ten days after cover crop (CC) planting. Cover crop planting was conducted ten days apart. Data were obtained from the Florida Automated Weather Network (https://fawn.ifas.ufl.edu/data/, accessed on 10 July 2022).

Figure 2.
Average temperature (A), rainfall (B), soil temperature at 10 cm depth (C), and evapotranspiration (ET) (D). Averages were calculated as follows: 2018 (August to December), 2019 to 2021 (January to December), and 2022 (January to April) for both groves (North Grove and South Grove). Data were obtained from Florida Automated Weather Network (https://fawn.ifas.ufl.edu/data/, accessed on 20 July 2022).

Figure 3.
Soil nitrate–nitrogen concentration in the row middles and under the tree canopy in the North and South Groves. Treatments include legume + non-legume (LG + NL), non-legume (NL), and no cover (control, no-cover cropped). Error bars represent 95% confidence limits based on 12 replicates. Treatments within a cell sharing a given letter are not statistically different at p ≤ 0.05 based on the least significant difference (LSD) (simple two-sample t-test).
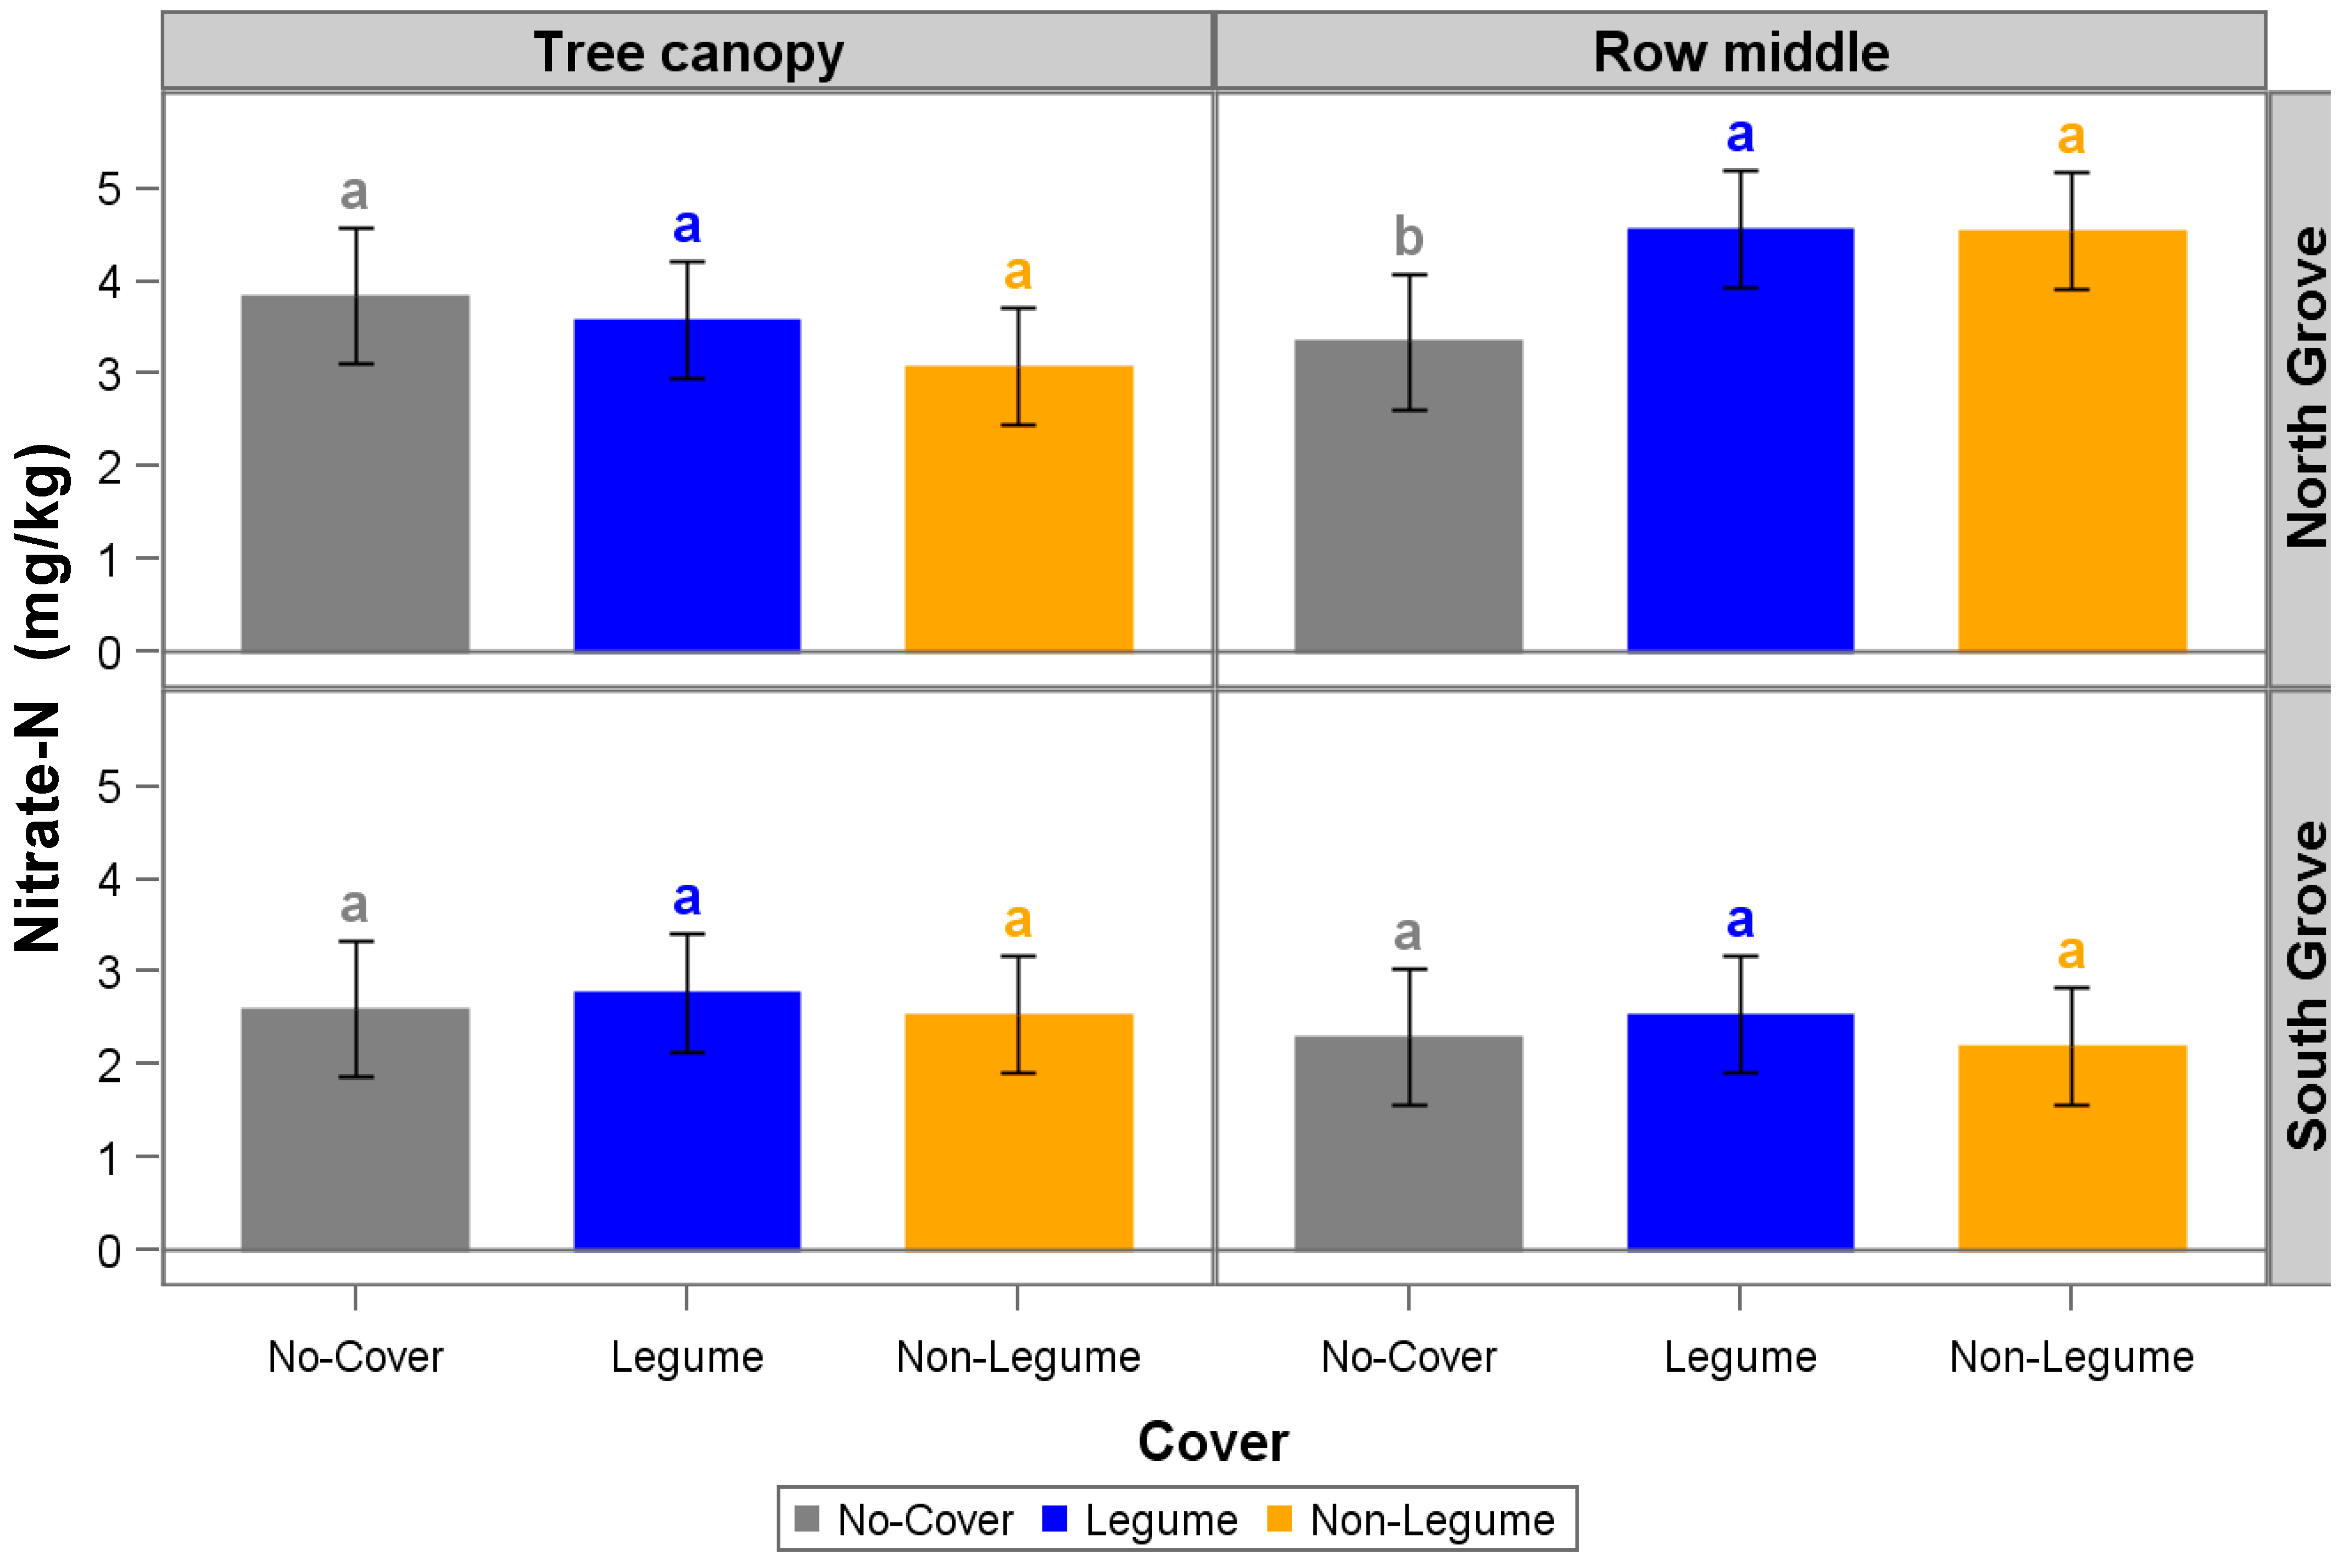
Figure 4.
Soil organic matter in the row middles and under the tree canopy in North and South Groves. Treatments include legume + non-legume (LG + NL), non-legume (NL), and no cover (control, no-cover cropped). Error bars represent 95% confidence limits based on 12 replicates. Treatments within a cell sharing a given letter are not statistically different at p ≤ 0.05 based on the least significant difference (LSD) (simple two-sample t-test).
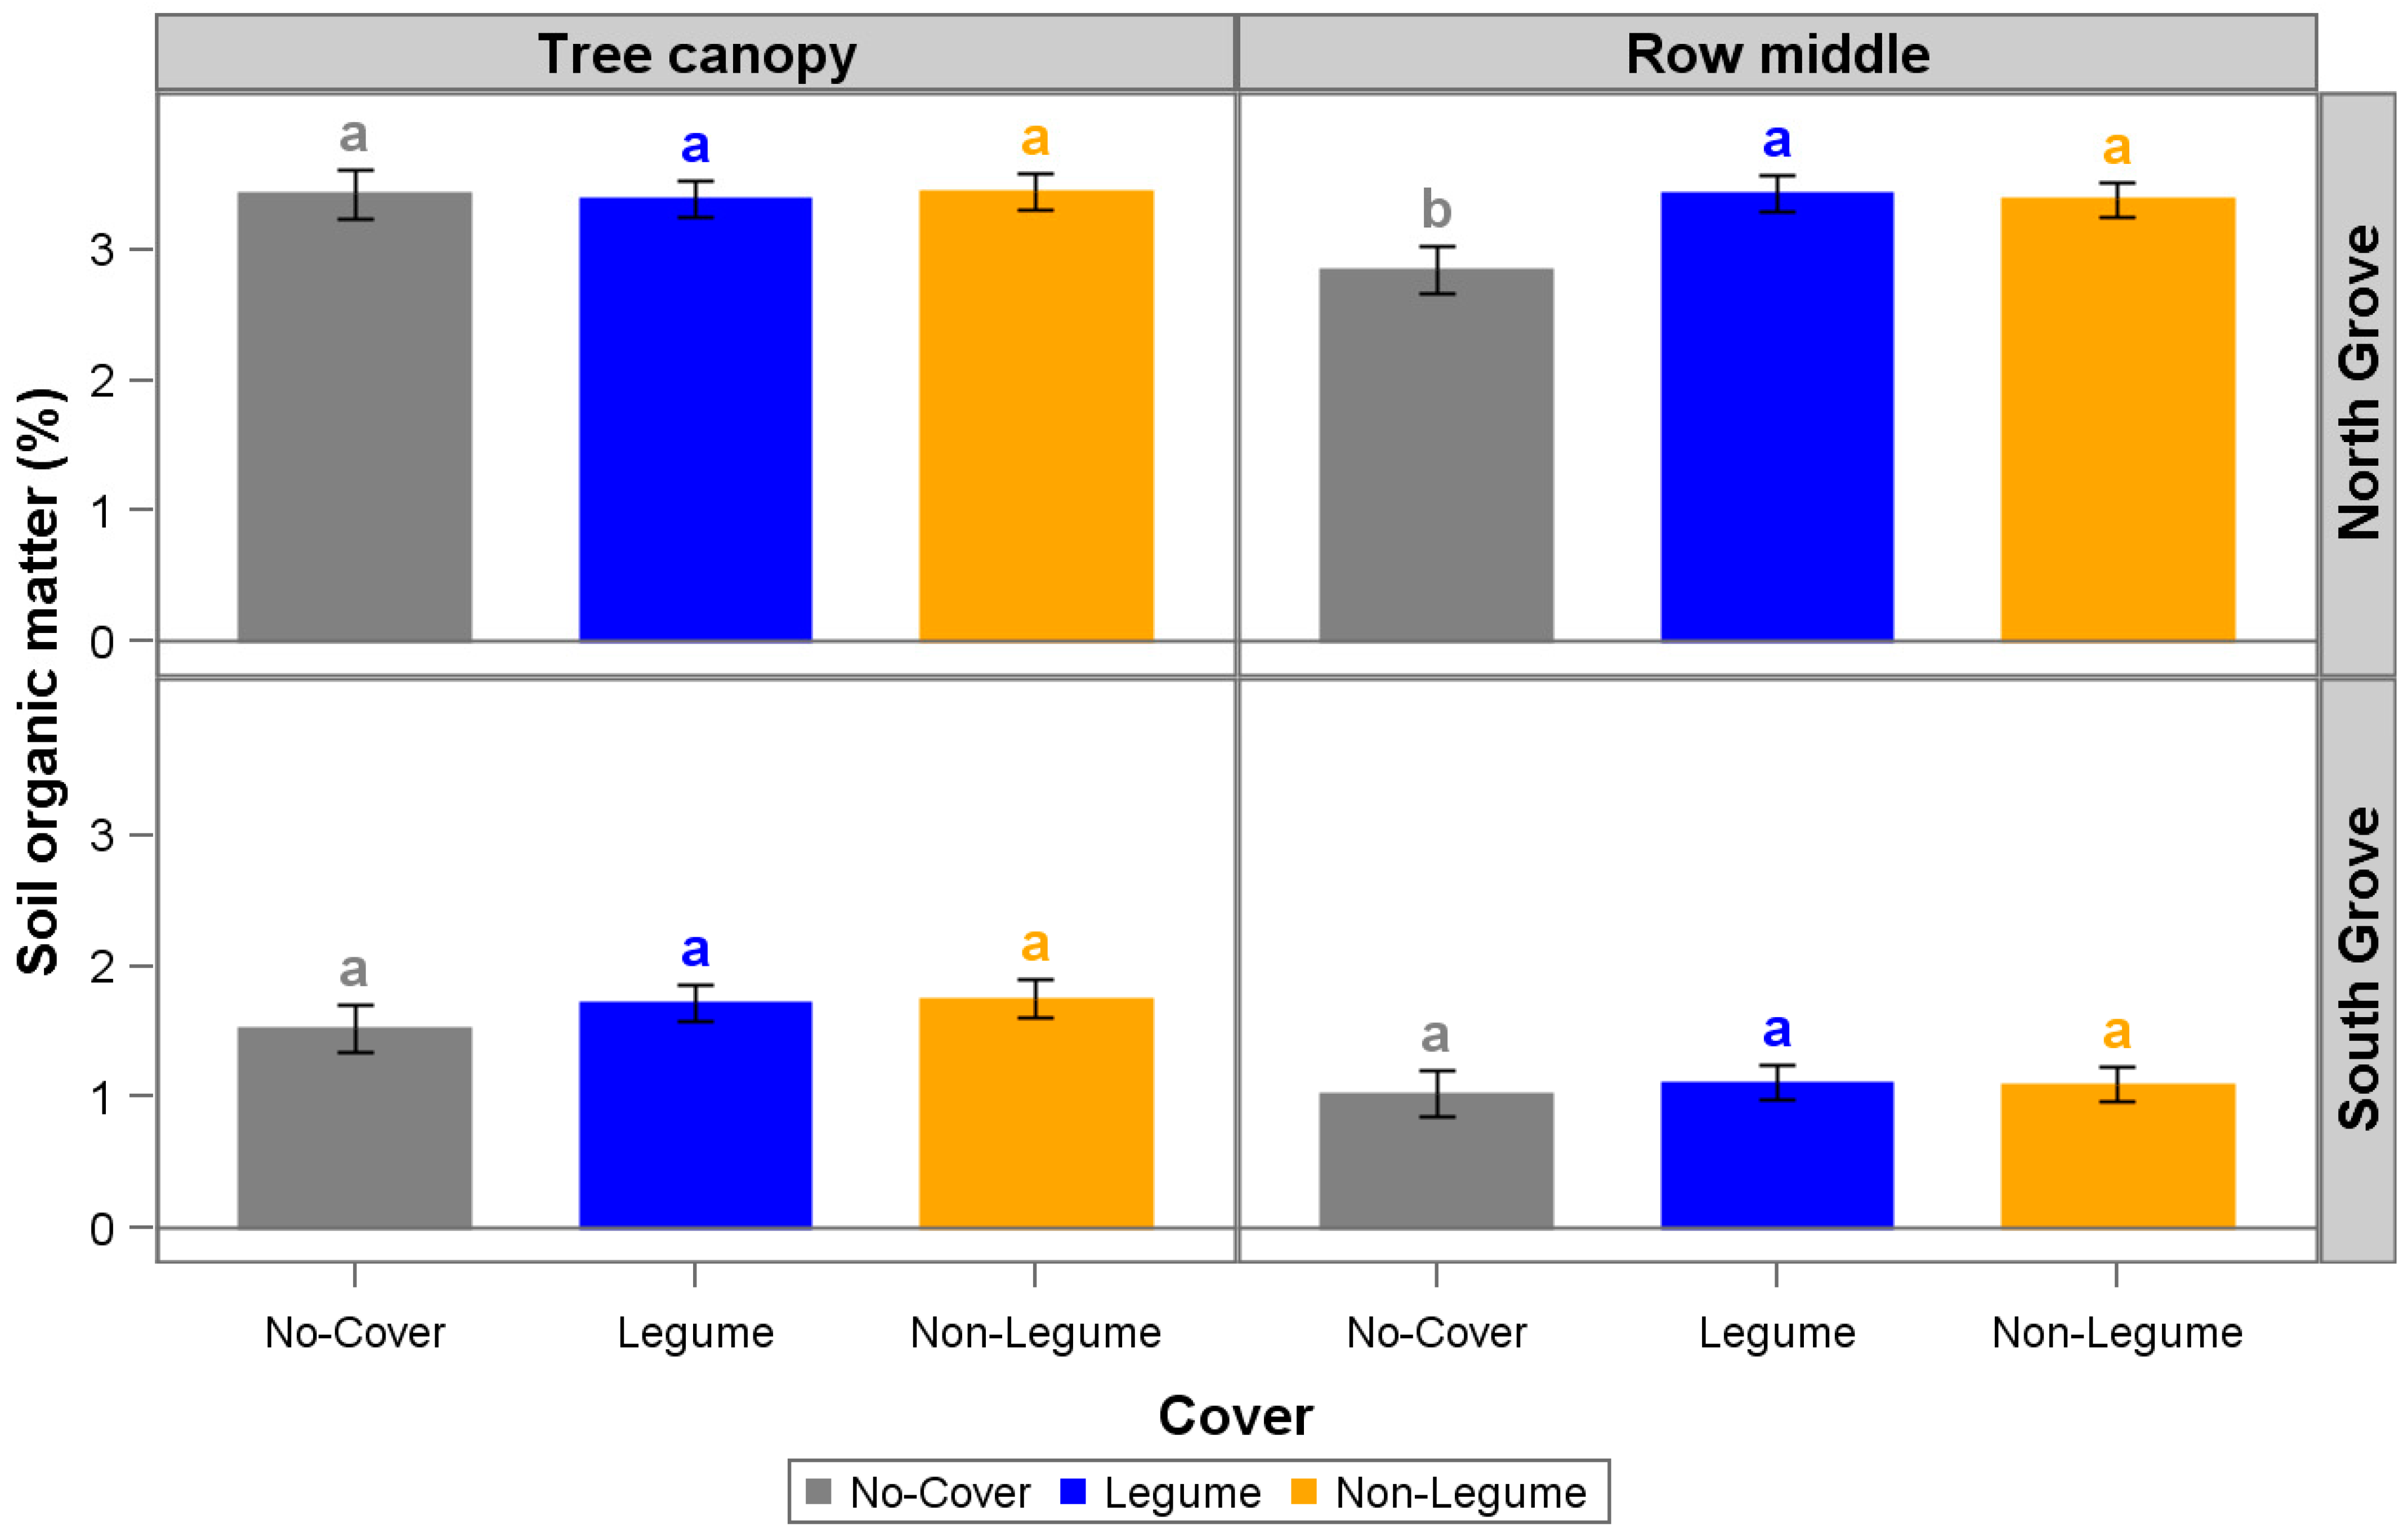
Figure 5.
Cover crop density in row-middles of HLB-affected trees in March and August 2019, July 2020, and September 2021. Treatments include legume + non-legume (LG + NL) and non-legume (NL). South Grove results for March 2019 are not shown due to a lack of germination of cover crops at this site. Error bars represent 95% confidence limits based on 12 replicates. Groves (North and South) within a cell sharing a given letter are not statistically different at p ≤ 0.05 based on the least squares difference (LSD) (simple two-sample t-test).

Table 1.
List of cover crops planted by season and total seeding rate. Two cover crop treatments were tested: a legume and non-legume mix (LG + NL) and a non-legume mix (NL). Cover crops were planted in 2018, 2019, 2020, and 2021 in summer/fall and spring seasons in the months indicated.
Table 1.
List of cover crops planted by season and total seeding rate. Two cover crop treatments were tested: a legume and non-legume mix (LG + NL) and a non-legume mix (NL). Cover crops were planted in 2018, 2019, 2020, and 2021 in summer/fall and spring seasons in the months indicated.
| Treatment | Category of Cover Crop § | October 2018 | January 2019 | June 2019 | November 2019 | May 2020 | November 2020 | June 2021 | November 2021 | Seeding Rate kg ha−1 |
|---|---|---|---|---|---|---|---|---|---|---|
| LG + NL | Legumes | Crotalaria juncea L., Sesbania grandiflora L. Poir., Alysicarpus vaginalis L. DC., Trifolium incarnatum L., Melilotus officinalis L. Lam | Helianthus annuus L., T. repens L., T. incarnatum L. | C. juncea L. | C. juncea L., S. grandiflora L., A. vaginalis L., T. incarnatum L., M. officinalis L. Lam | C. juncea L., S. grandiflora L., A. vaginalis L., T. incarnatum L., M. officinalis L. Lam | C. juncea L., Pisum sativum L. | C. juncea L., Vigna unguiculata L. Walp. | C. juncea L. | 50–100 |
| Non-legumes | Raphanus sativus L., Avena sativa L., Secale cereale L., Panicum miliaceum L. | R. sativus L., S. cereale L., Fagopyrum esculentum Moench | F. esculentum M., P. miliaceum L., Urochloa ramosa (L.) T. Q. Nguyen | R. sativus L., A. sativa L., S. cereale L., P. miliaceum L. | R. sativus L., A. sativa L., S. cereale L., P. miliaceum L. | R. sativus L., A. sativa L., S. cereale L. | F. esculentum M., Urochloa ramosa (L.) T. Q. Nguyen | R. sativus L., A. sativa L., S. cereale L. | 150–200 | |
| NL | Non-legumes | R. sativus L., A. sativa L., S. cereale L., P. miliaceum L. | R. sativus L., S. cereale L., F. esculentum M. | F. esculentum M., P. miliaceum L., Urochloa ramosa (L.) T. Q. Nguyen | R. sativus L., A. sativa L., S. cereale L., P. miliaceum L. | R. sativus L., A. sativa L., S. cereale L., P. miliaceum L. | R. sativus L., A. sativa L., S. cereale L. | F. esculentum M., Urochloa ramosa (L.) T. Q. Nguyen | R. sativus L., A. sativa L., S. cereale L. | 150–200 |
§ The cover crops (CCs) used were pre-mixed. The seeding rate used was the one suggested by the manufacturer of the planter and was 50–100 kg ha−1. Different pre-mixed CCs were used for each season.
Table 2.
Soil properties of two citrus orchards in Southwest Florida, USA, treated with cover crops legume + non-legume (LG + NL) and non-legume (NL) compared with the control non-cover cropped (GSC). Presented values are baseline soil sample measurements taken before seeding the cover crops (2018) and soil samples taken after seven consecutive cover cropping plantings (2021).
| Site | ||||||||||||
|---|---|---|---|---|---|---|---|---|---|---|---|---|
| North Grove | South Grove | |||||||||||
| Treatment | ||||||||||||
| Soil Properties | LG + NL | NL | GSC | LG + NL | NL | GSC | ||||||
| Baseline 2018 | 3-year 2021 | Baseline 2018 | 3-year 2021 | Baseline 2018 | 3-year 2021 | Baseline 2018 | 3-year 2021 | Baseline 2018 | 3-year 2021 | Baseline 2018 | 3-year 2021 | |
| NH4+-N (mg kg−1) | 6.2 | 6.3 | 5.6 | 4.7 | 4.6 | 4.61 | NA | 2.8 | NA | 3.3 | NA | 2.9 |
| NO3−-N (mg kg−1) | 2.2 | 7.6 | 2.6 | 7 | 2.3 | 4.9 | 2.7 | 1.8 | 2.8 | 1.1 | 3 | 1.2 |
| P (mg kg−1) | 950 | 360 | 909 | 477 | 869 | 441 | 79 | 59 | 88 | 55 | 91 | 53 |
| Ca (mg kg−1) | 4428 | 2457 | 3995 | 2672 | 3752 | 2758 | 576 | 921 | 524 | 549 | 703 | 700 |
| Mg (mg kg−1) | 337 | 254 | 316 | 245 | 313 | 246 | 50 | 44 | 48 | 43 | 57 | 45 |
| Organic Matter (%) | 2.88 | 3.41 | 2.79 | 3.39 | 2.29 | 2.5 | 0.7 | 1 | 0.8 | 0.9 | 0.7 | 1.1 |
NA: ammonium was not available.
Disclaimer/Publisher’s Note: The statements, opinions and data contained in all publications are solely those of the individual author(s) and contributor(s) and not of MDPI and/or the editor(s). MDPI and/or the editor(s) disclaim responsibility for any injury to people or property resulting from any ideas, methods, instructions or products referred to in the content. |
© 2023 by the authors. Licensee MDPI, Basel, Switzerland. This article is an open access article distributed under the terms and conditions of the Creative Commons Attribution (CC BY) license (https://creativecommons.org/licenses/by/4.0/).
Share and Cite
MDPI and ACS Style
Brewer, M.; Kanissery, R.G.; Strauss, S.L.; Kadyampakeni, D.M. Impact of Cover Cropping on Temporal Nutrient Distribution and Availability in the Soil. Horticulturae 2023, 9, 1160. https://doi.org/10.3390/horticulturae9101160
AMA Style
Brewer M, Kanissery RG, Strauss SL, Kadyampakeni DM. Impact of Cover Cropping on Temporal Nutrient Distribution and Availability in the Soil. Horticulturae. 2023; 9(10):1160. https://doi.org/10.3390/horticulturae9101160
Chicago/Turabian StyleBrewer, Miurel, Ramdas G. Kanissery, Sarah L. Strauss, and Davie M. Kadyampakeni. 2023. "Impact of Cover Cropping on Temporal Nutrient Distribution and Availability in the Soil" Horticulturae 9, no. 10: 1160. https://doi.org/10.3390/horticulturae9101160
Note that from the first issue of 2016, this journal uses article numbers instead of page numbers. See further details here.