Article

Estimation of Ascorbic Acid in Intact Acerola (Malpighia emarginata DC) Fruit by NIRS and Chemometric Analysis

by
Francisca Pereira de Moraes
1,
Rosangela Câmara Costa
2,
Camilo de Lelis Medeiros de Morais
3,
Fábio Gonçalves Macêdo de Medeiros
1,
Tássia Rayane Nascimento Fernandes
1,
Roberta Targino Hoskin
1,* and
Kássio Michell Gomes de Lima
2
1
Department of Chemical Engineering, Federal University of Rio Grande do Norte, Natal 59072-970, RN, Brazil
2
Biological Chemistry and Chemometrics, PPGQ, Institute of Chemistry, Federal University of Rio Grande do Norte, Natal 59072-970, RN, Brazil
3
School of Pharmacy and Biomedical Sciences, University of Central Lancashire, Preston PR1 2HE, UK
*
Author to whom correspondence should be addressed.
Horticulturae 2019, 5(1), 12; https://doi.org/10.3390/horticulturae5010012
Submission received: 10 December 2018 / Revised: 8 January 2019 / Accepted: 18 January 2019 / Published: 24 January 2019

Abstract

:
Acerola fruit is one of the richest natural sources of ascorbic acid ever known. As a consequence, acerola fruit and its products are demanded worldwide for the production of health supplements and the development of functional products. However, the analytical determination of ascorbic acid is time-consuming and costly. In this study, we show a non-destructive, reliable, and fast method to measure the ascorbic acid content in intact acerola, using near-infrared spectroscopy (NIRS) associated with multivariate calibration methods. Models using variable selection by means of interval partial least squares (iPLS) and a genetic algorithm (GA) were tested. The best model for ascorbic acid content, based on the prediction performance, was the GA-PLS method with second derivative spectral pretreatment, with a root mean square error of cross-validation equal to 22.9 mg/100 g, root mean square error of prediction equal to 46.3 mg/100 g, ratio of prediction to deviation equal to 8.0, determination coefficient for calibration equal to 0.98 and determination coefficient for prediction equal to 0.96. The current methodology, using NIR spectroscopy and chemometrics, is a promising and rapid tool to determine the ascorbic acid content of intact acerola fruit.

1. Introduction

Acerola (Malpighia emarginata DC.), also called the Barbados cherry or cherry-of-Antilles, has its origin traced to the Caribbean area, northern South America and Central America. This tropical fruit is known for its high concentration of health-relevant phytochemicals, mainly ascorbic acid [1]. The uniquely high concentration of ascorbic acid makes this fruit valuable for further use in other food products and creates a great potential market for acerola. In fact, significant market growth is expected for acerola extract. The global acerola extract market is expected to be worth 17.5 billion US dollars by 2026, due to rising global demand for natural bioactive-rich fruits and derivatives, such as acerola [2,3].
The determination of ascorbic acid in acerola fruit is usually performed by high-performance liquid chromatography (HPLC), HPLC tandem photodiode array and mass spectrometry (MS) detectors (HPLC–PDA–MS/MS), and electrochemical or titrimetric methods [4,5]. Although these analytical methods present high selectivity and sensitivity, there are some difficulties, such as the destruction of the sample, the need for specific reagents and bulky instrumentation that impairs in-field monitoring, as well as the generation of waste. In addition, some of the techniques, such as chromatography, require specialized personnel, which limits their application beyond the laboratory. Therefore, the development of non-destructive, reliable, accurate, fast and robust methods to measure the ascorbic acid content in intact acerola is highly desirable to ensure higher quality fruits to the market.
Near-infrared spectroscopy (NIRS) is an attractive analytical technique for measuring ascorbic acid [6,7] and other important quality parameters in horticultural products [8,9,10]. Other applications and some developments have been reviewed by Moreda et al. [11]. Briefly, the success of NIRS in food science and technology is due to minimum or no sample preparation, no waste generation, and low-cost when compared to conventional methods, while providing simultaneous analytical parameters or multi-components.
The use of appropriate chemometric tools for multivariate calibration is largely responsible for successful applications of the NIRS technique in intact fruits. The NIR spectrum is essentially composed of a large set of overtones and combination bands (O−H, C−H and N−H bonds), causing it to be highly convoluted. Multivariate calibration—such as partial least squares (PLS) [9], principal component regression (PCR) [12] artificial neural networks (ANN) [13], and least squares–support vector machines (LS–SVM)—and variable selection algorithms—such as interval partial least square (iPLS), and genetic algorithm (GA) [14]—are required to extract the information about quality attributes that remain unveiled in the NIR spectrum. Moreover, spectral pre-processing techniques applied before multivariate calibration are required to improve the signal-to-noise ratio of the spectral data and eliminate noise and undesired variations that can mask the signal of interest. Transformation techniques and their sequence depend on the NIR application itself, including a wide range of techniques, such as smoothing [9] and normalization [15,16]. Moreover, the proposal and development of any new analytical validation of a multivariate method is very important because it is the first step for the recognition of methods for official analysis, estimating some figures of merit (FOM) such as analytical selectivity, sensitivity, precision, accuracy, limit of detection and limit of quantification [17].
Herein, this paper presents the use of NIRS as a rapid and non-destructive method to predict ascorbic acid content in intact acerola (Malpighia emarginata DC.) fruit. PLS regression and variable selection algorithms (iPLS and GA) were used for the statistical analysis of the data and development of prediction models. Several methods, including smoothing, multiplicative scatter correction and the second derivative, were conducted and compared to obtain the appropriate model. Finally, the best performing model was submitted to a statistical elliptical joint confidence region (EJCR) test and validated by the calculation of FOMs, including selectivity, sensitivity, analytical sensitivity, precision and accuracy, limit of detection and limit of quantification.

2. Material and Methods

2.1. Fruit Material

Acerola fruits were purchased in the local market of Natal-RN-Brazil between December 2014 and January 2015. Acerola fruits with homogenous size and no evident injuries or illnesses were selected for this study. For the ascorbic acid and spectral measurements, 3 fruits were used per sample (306 acerola fruits, N = 102 samples). The selected acerola fruits were kept under controlled conditions (24–28 °C, humidity 60–80%) for at least 1 h prior to NIR spectral measurements. Acerola fruits in three different maturation stages were analyzed in this study. Here, the fruits were grouped into three different color groups (orange, red and purple). In doing this, our objective was to cover all the possible fruit variations in this study.

2.2. Reference Method for Ascorbic Acid and Morphological Properties

The method for the determination of ascorbic acid followed the modified titrimetric procedure described by Oliveira et al. [18] based on the Association of Official Agricultural Chemists (AOAC) standard methodology (AOAC 967.21), with the indicator 2,6-di-chlorophenol-indophenol (DCFI). A total of 0.5 g of sample was mixed with 50 mL of metaphosphoric acid and stirred for 3 min. The solution was used to titrate a mixture of 2 mL of DCFI with 18 mL of distilled water. The endpoint of titration was determined when the standard solution and the titrant reached the same color. The results were expressed in milligram per 100 g of fresh weight (mg/100 g FW). All analyses were performed in triplicate.
The fruit morphological characteristics (weight, diameter, average values) were also evaluated. The fruit weight was measured by an analytical balance, while the average diameter was determined using a digital caliper (INSIZE, 0–200 mm/0–8”, model n° 1112–200, Ohio, EUA).

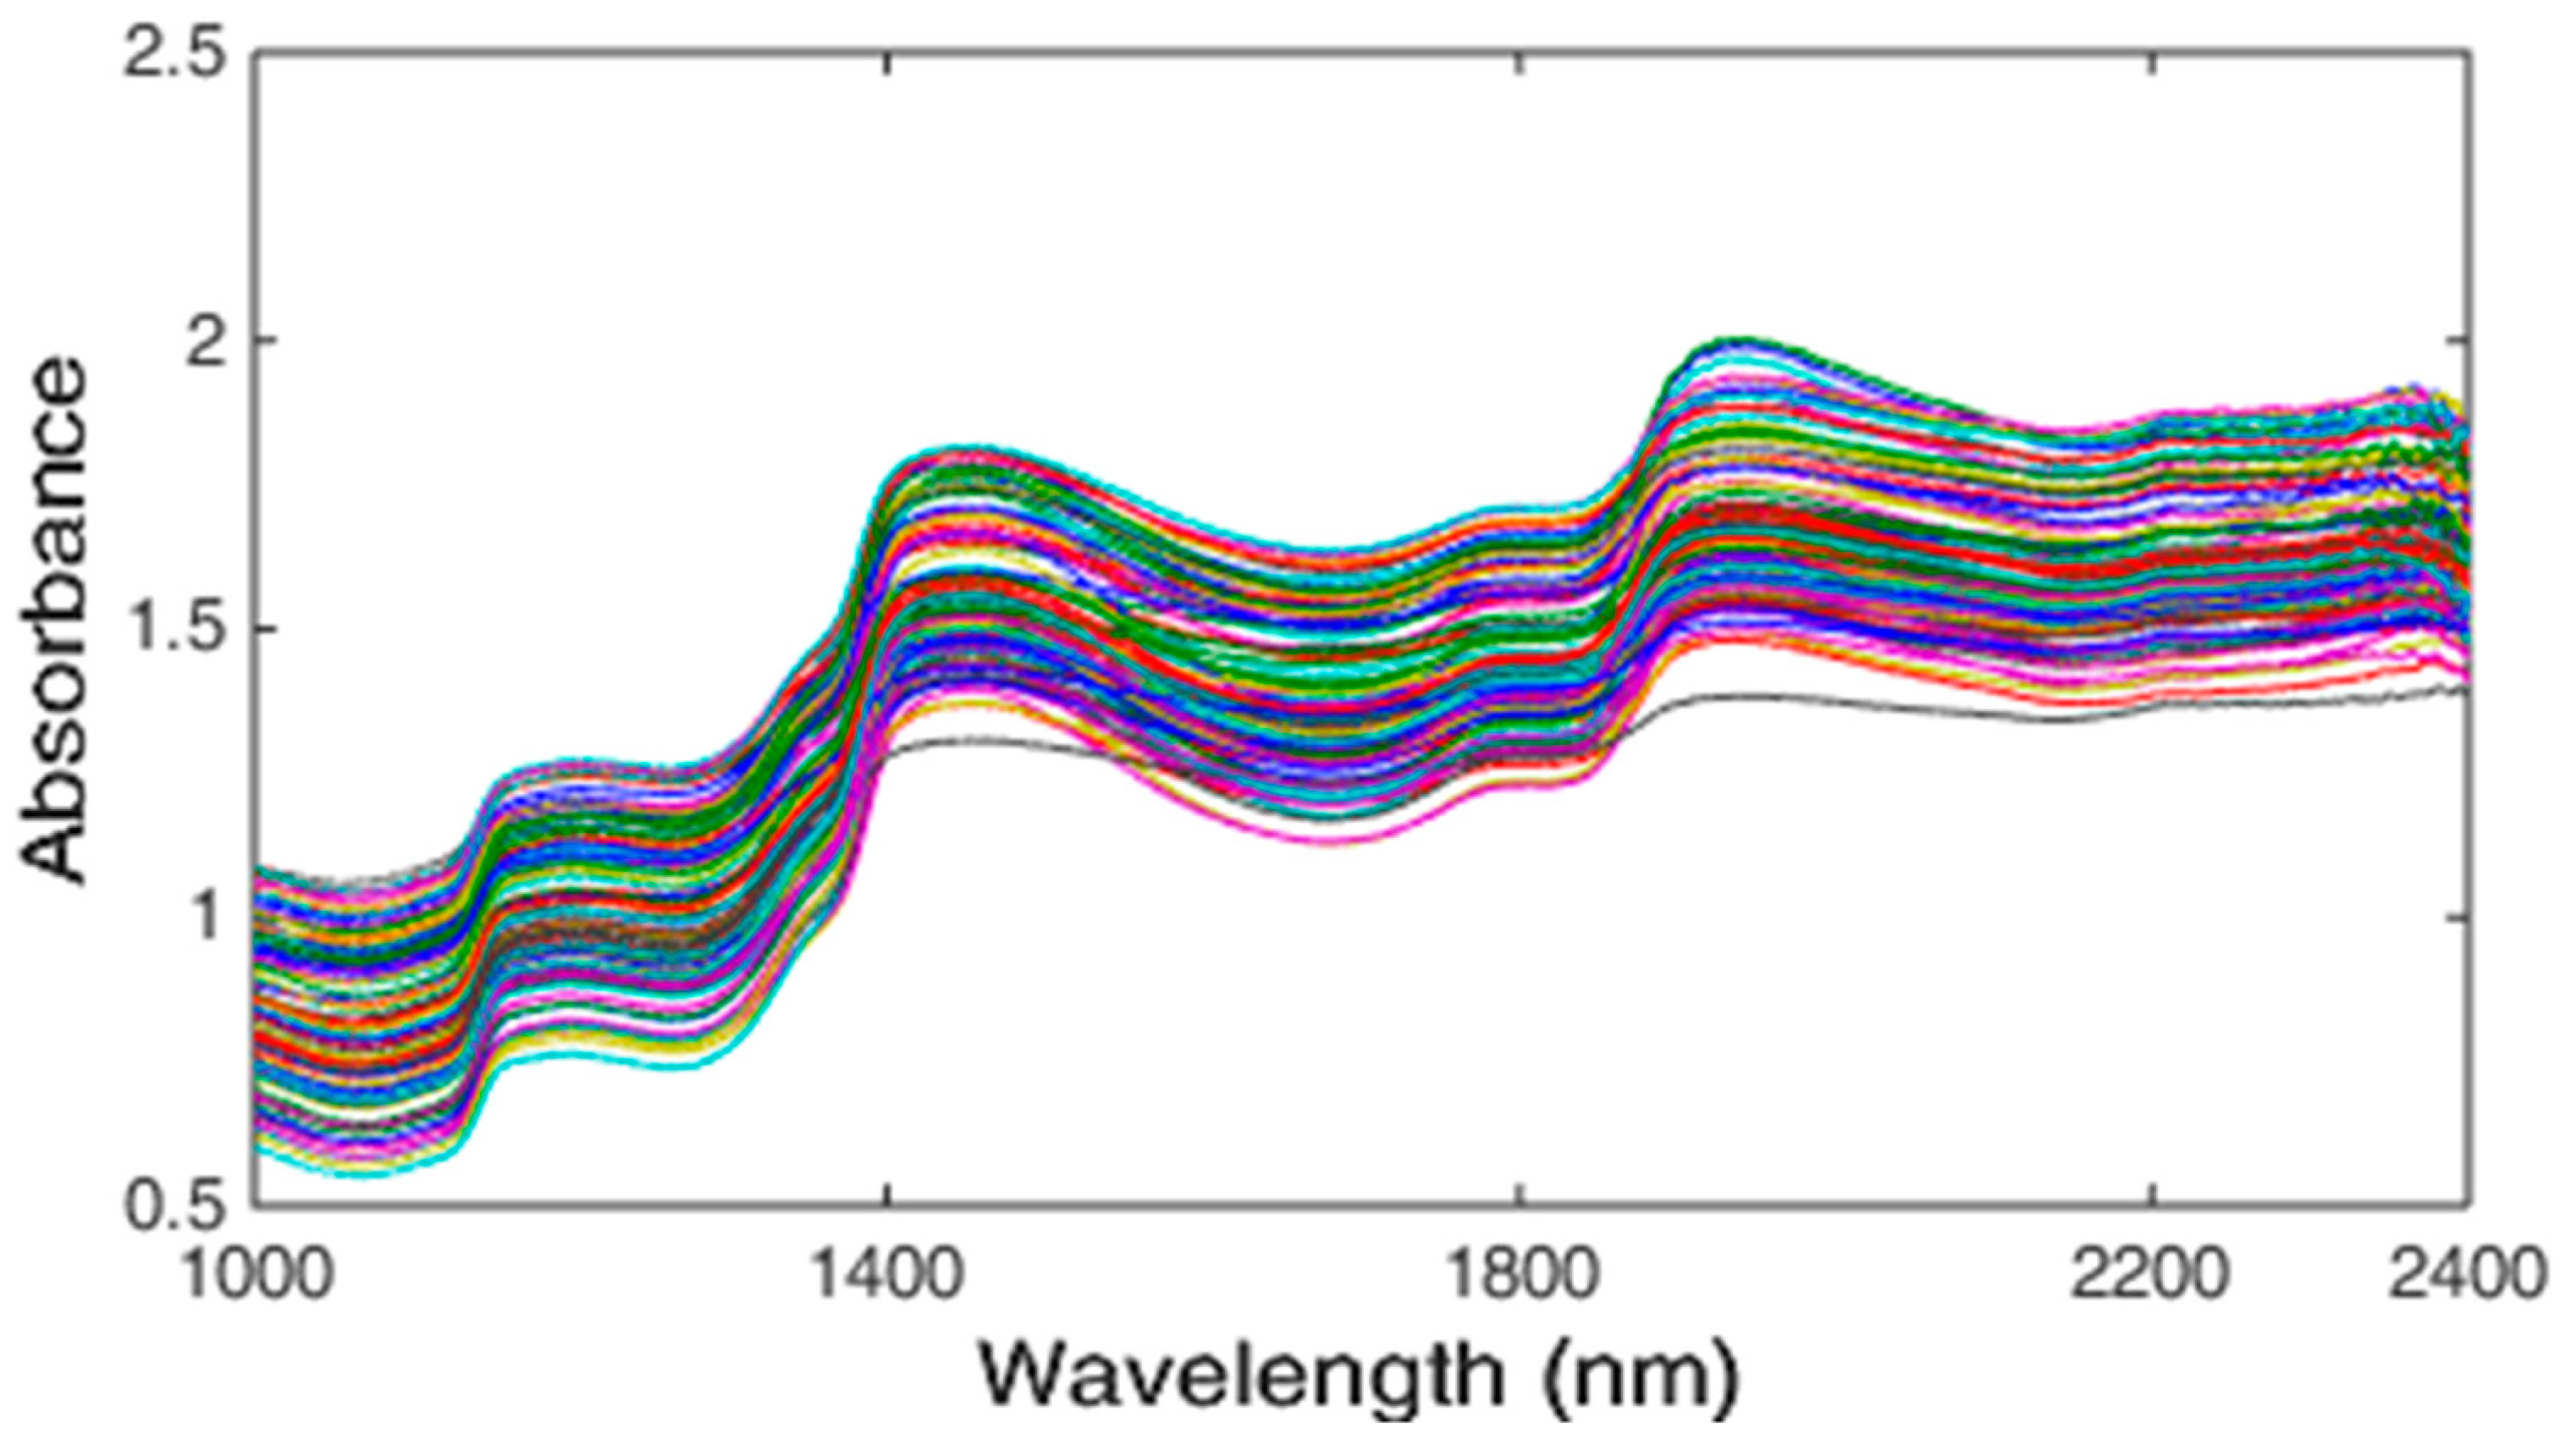
2.3. Near-Infrared Diffuse Reflectance Measurements

The spectra were collected for all samples in reflectance mode using a multi-purpose analyzer Antaris MX Fourier Transform near-infrared (FT-NIR) spectrometer (Thermo Fisher Scientific Inc., Waltham, MA, USA). The instrument was equipped with a NIR fiber optic probe, interferometer, cooled InGaAs detector, and a wide-band quartz halogen light source (50 W). The NIR spectra were obtained across the ranges 10,000–4166 cm−1 or 1000–2400 nm, and were recorded with a spectral resolution of 8 cm−1 (1.25 × 10⁶ nm) and an average of 32 scans. The time required to achieve a spectral measurement was 30 s. For the spectral measurements, 3 fruits were used per sample (306 acerola fruits, N = 102 samples). The average value from three different spectral measurement locations (two diameter readings and one reading taken bottom to top of the fruit) on each fruit was stored, and the mean spectrum was calculated for each sample.

2.4. Chemometric Analysis

The data pre-treatment and construction of chemometric models were implemented in MATLAB version R2014a (Math-Works, Natick, MA, USA). Comparisons were made between the PLS regression analysis, varying the pre-processing: The first and second derivatives with different windows width (3–71 points), multiplicative scattering correction (MSC) and Savitzky—Golay (SG) smoothing (3–71 points). PLS is a technique of multivariate calibration based on maximal covariance between the spectral matrix and the response vector, and considers the number of latent variables (LV) defined as the number of factors that explain the model [19,20]. In order to generate the prediction models for the ascorbic acid content, samples were grouped into two sets: 70% (N = 72) of samples for calibration and 30% (N = 30) for external validation, using the Kennard-–Stone algorithm [21].
Variable selection algorithms (iPLS and GA) were used for optimizing PLS models using a spectrum of variables with more relevant information. The predicted results for the calibration models developed by PLS, using the spectral regions selected by iPLS and GA, were compared to those found by PLS using the whole region. The calibration model accuracy was described by the coefficient of determination for the calibration data set ( R c 2 ) and validation data set ( R p 2 ), root mean square error of cross-validation (RMSECV), and root mean square error of prediction (RMSEP). In addition, the ratio of prediction to deviation value (RPD) was calculated [9,22] by dividing the standard deviation (SD) to the RMSECV or the RMSEP. RPD results below 1.5 indicated that the calibration was not useful. RPD values higher than 2 indicated that quantitative predictions were possible. An outlier test was applied based on the model data, NIR matrices and the experimental ascorbic acid values used for calibration and validation, in consideration of the number of latent variables. Outlier detection was conducted to improve model accuracy, removing samples with extreme values and high influence on the model, and eliminating un-modeled residues in the spectra and vector data responses. An EJCR was calculated to evaluate the slope and intercept for the reference regression at a 95% confidence interval. Finally, validating an analytical method demonstrated whether it fulfilled its intended purpose. Therefore, some figures of merit, such as analytical selectivity, sensitivity, precision, accuracy, limit of detection, limit of quantification were determined.

3. Results

3.1. Experimental Data

The number of samples (N), minimum (Min), maximum (Max), median and standard deviation (SD) for ascorbic acid content, and fruit morphological characteristics (diameter and weight) are presented in Table 1.
Figure 1 shows the measured acerola absorbance spectra of all samples in the region between 1000 and 2400 nm.

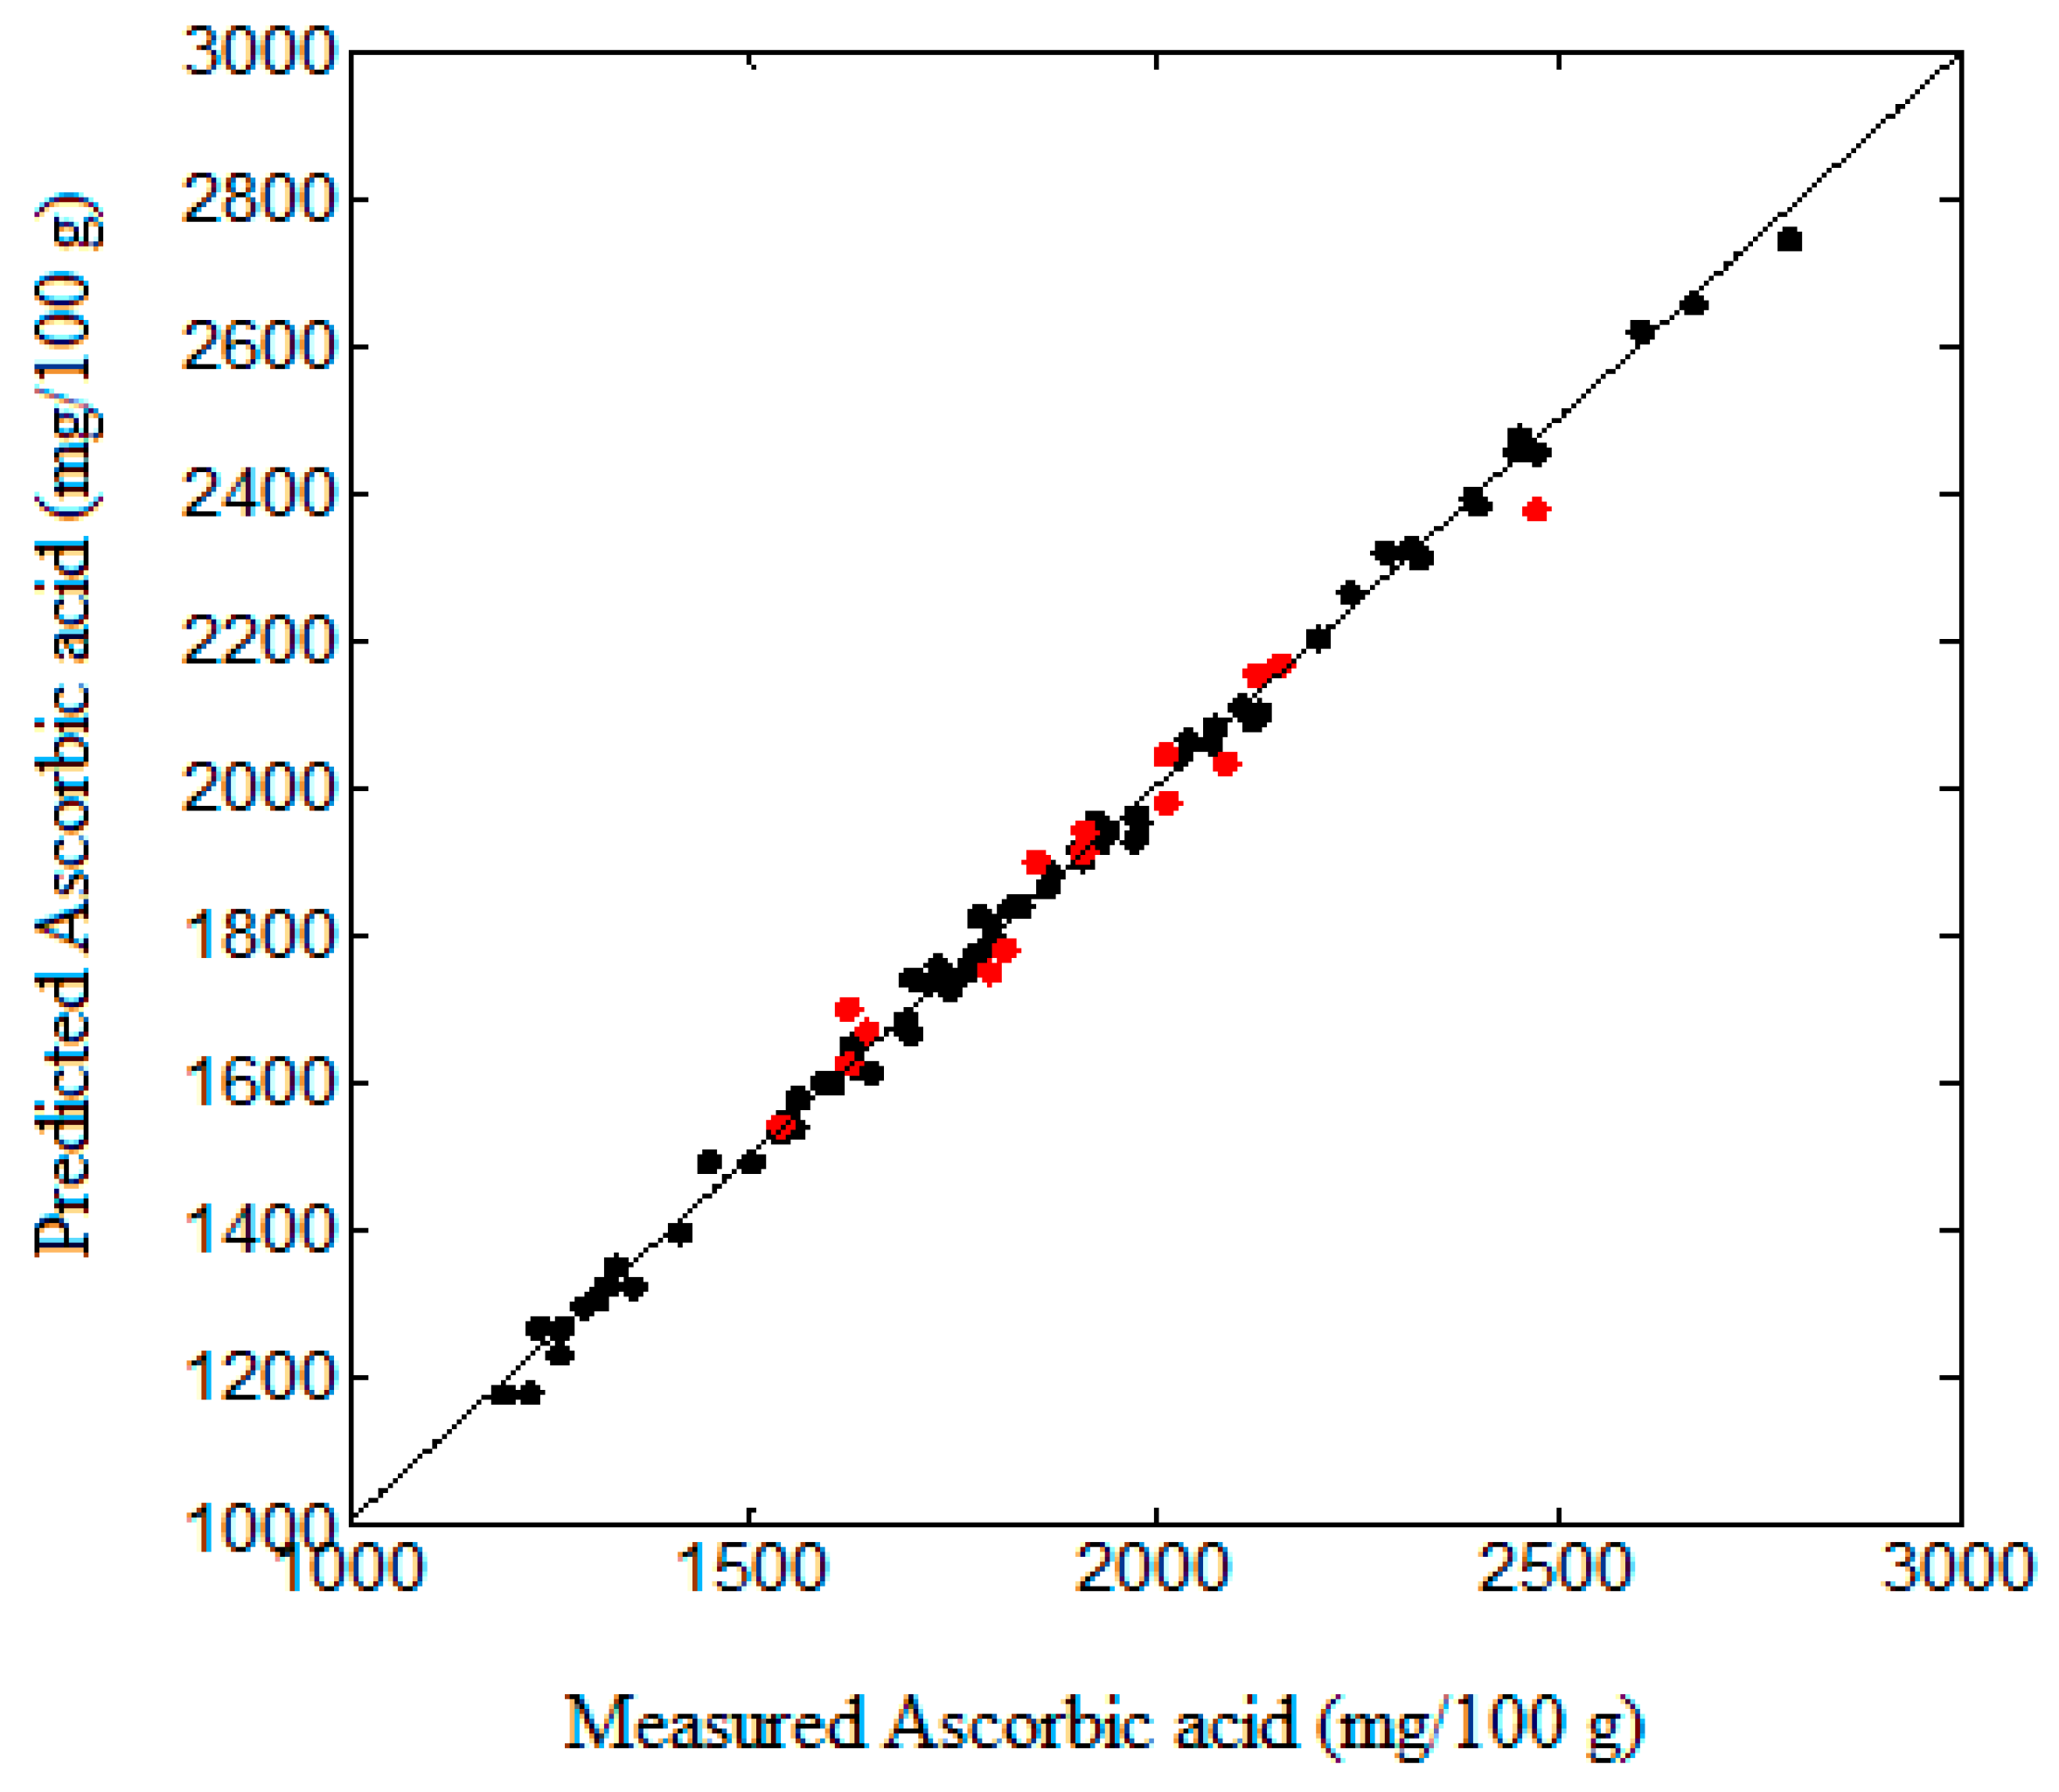
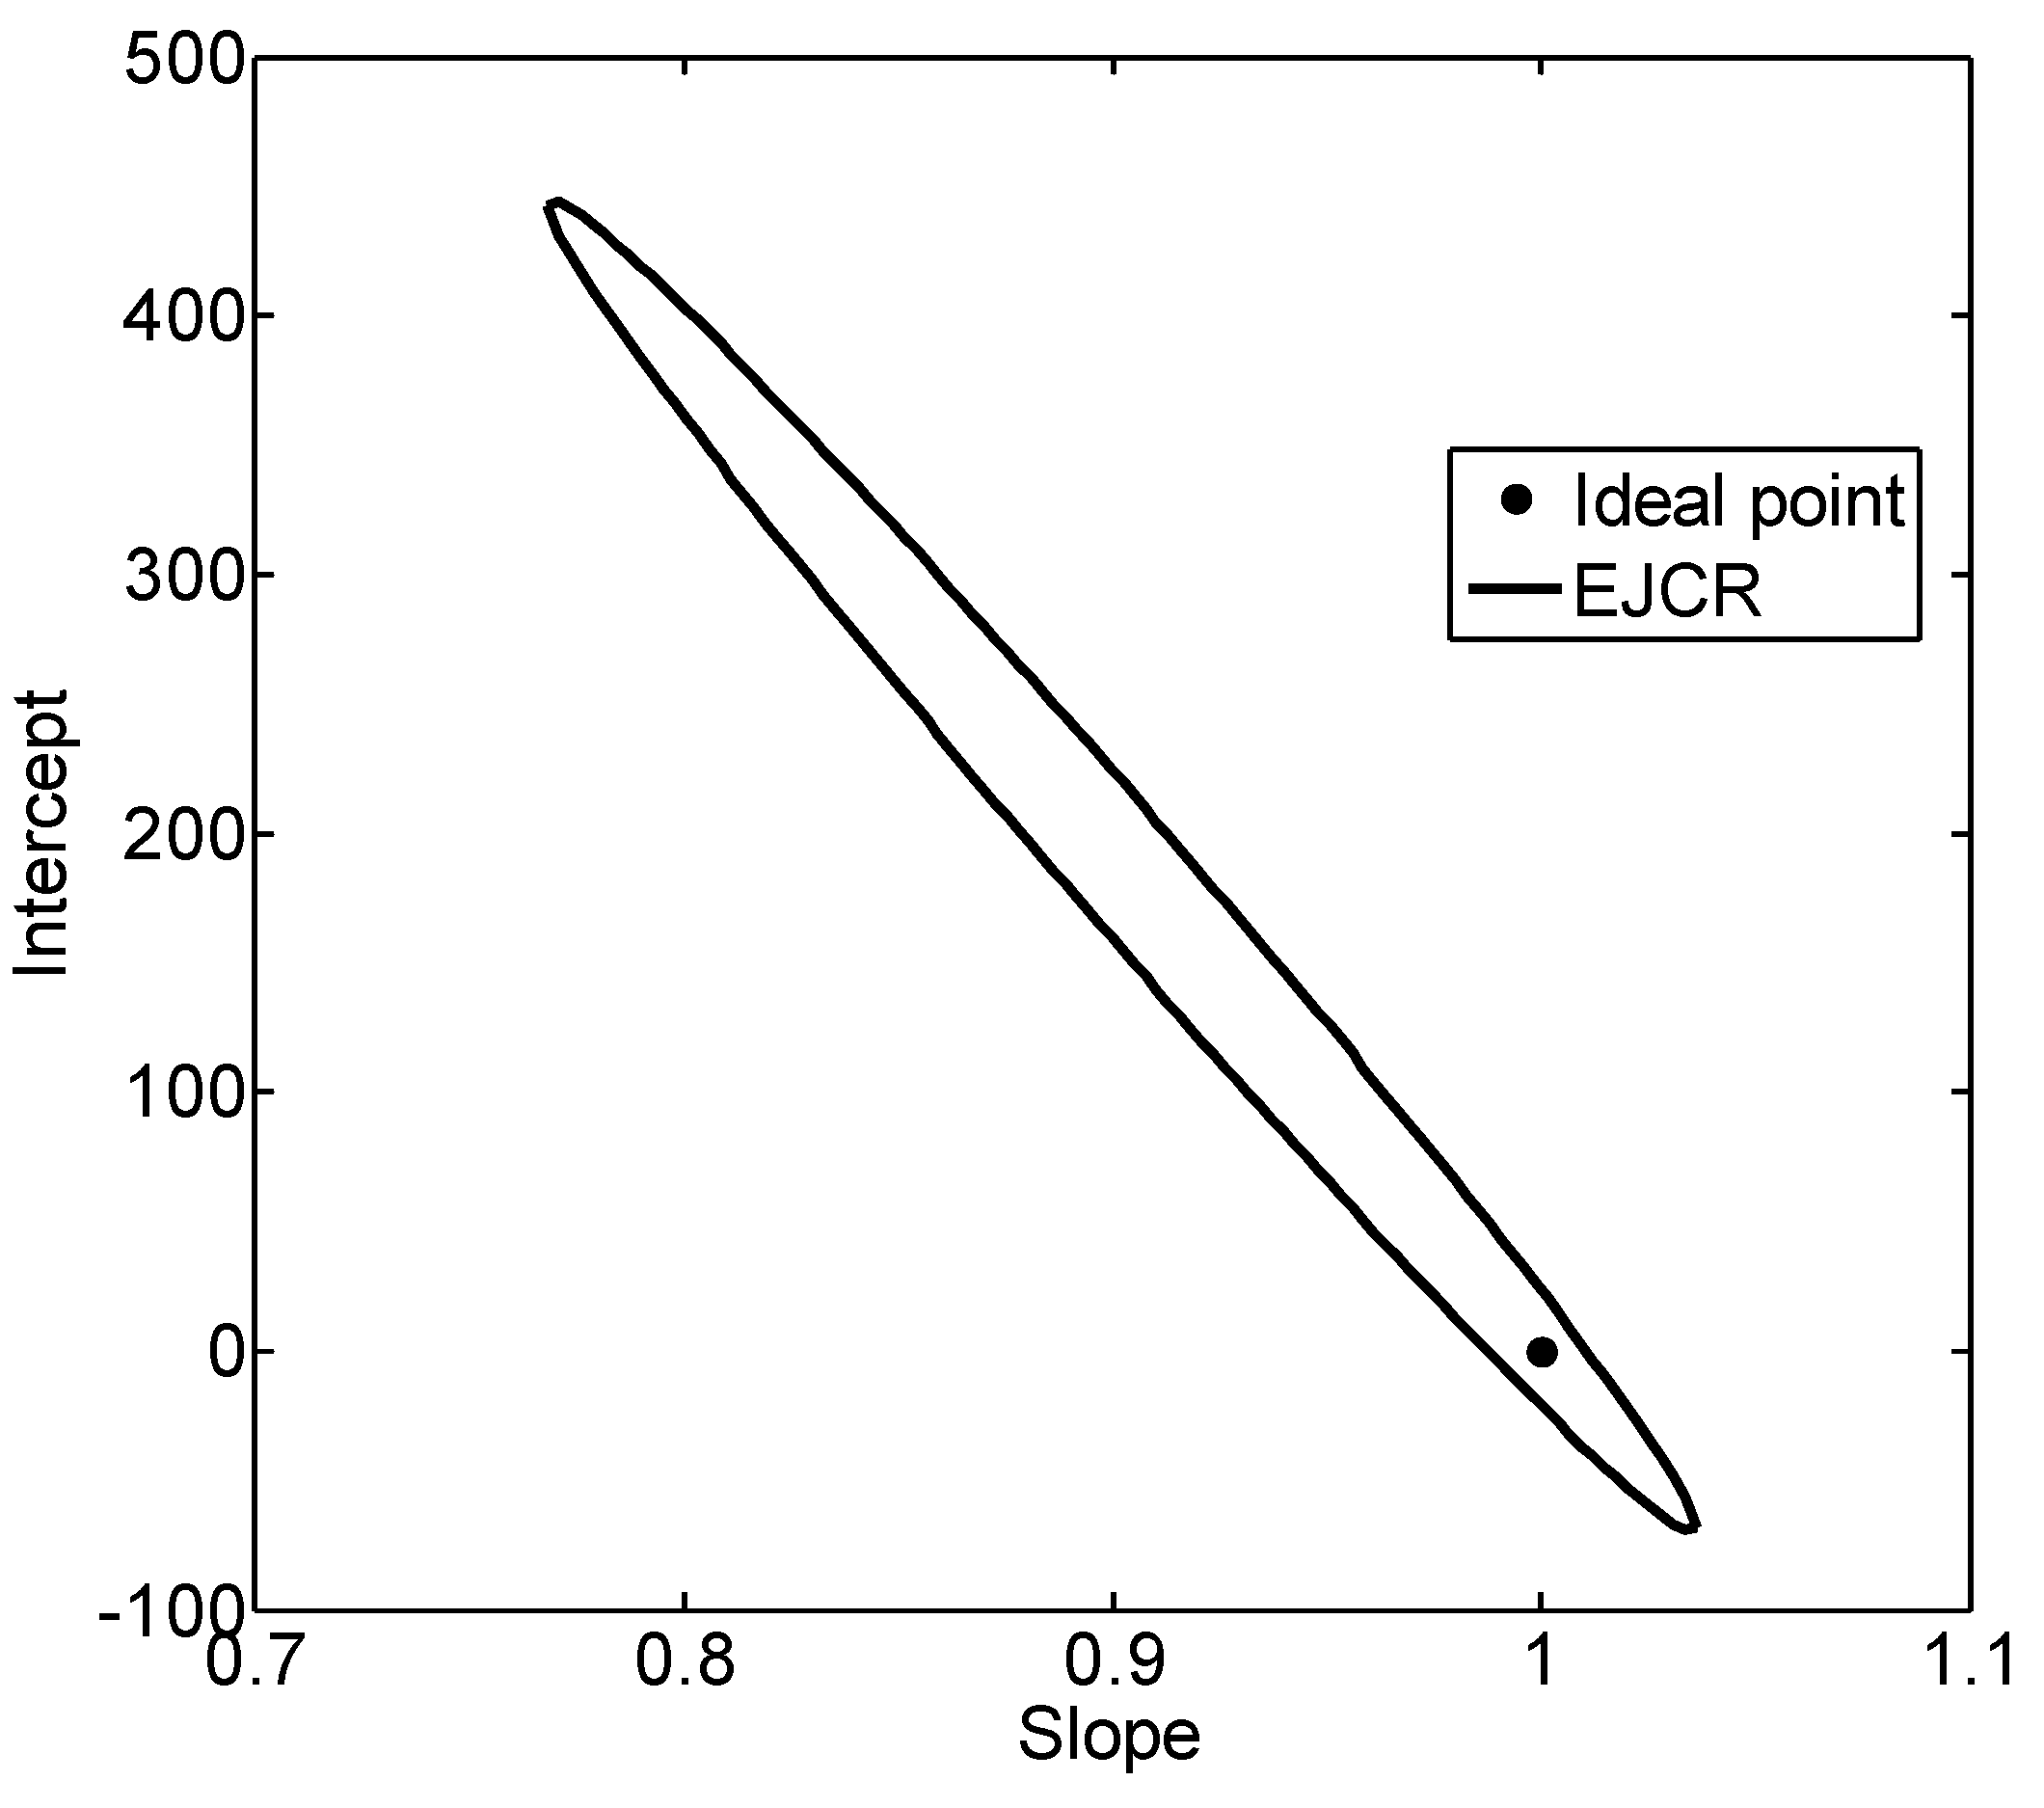
3.2. Ascorbic Acid Model Fitting

Initially, PLS and variable selection algorithms (iPLS and GA) were performed on the original spectra to develop the NIR model and thereby non-destructively predict ascorbic acid in intact acerola fruits. Table 2 shows the results for the PLS, iPLS-PLS and GA-PLS models, varying the processing method, after correcting the systematic behaviors presented by the original spectrum.
Table 3 presents the results for outlier elimination and the RMSECV, RMSEP, determination coefficient for calibration ( R c 2 ), predicted ( R p 2 ), and RPD values for the GA-PLS models. In order to find the best model, some desirable criteria were considered, such as low RMSEP, low RMSECV, high determination coefficient for calibration ( R c 2 ) and prediction ( R p 2 ) data set, a small difference between RMSECV, and RMSEP. A relatively low number of LV were considered desirable in order to avoid the inclusion of noise in the model.
Figure 2 shows the correlation between the measured ascorbic acid concentration in intact acerola and those predicted by the best model based on NIR spectroscopy. As Table 3 shows, the higher value of RPD achieved for GA-PLS model after outlier detection showed that accurate quantification of acerola based on their content could be obtained.
Based on the results for the best GA-PLS model presented in Table 3, the estimated intercept and slope ( a ^ and b ^ , respectively) parameters were compared with values of 0 and 1 using the EJCR test, in this case by using an ordinary least-squares (OLS) fitting. Figure 3 shows the ellipse corresponding to the validation samples (Table 3) that contain the theoretical (a = 0, b = 1) point, indicating that the bias was absent for the optimized GA-PLS model. The presence of relevant bias was tested with the prediction results for the validation samples by the t-test. The results showed that the bias included in the model was not significant, since the t value obtained (0.0831) was lower than the critical value of 2.14 within a 95% confidence level.
Validation of the optimized multivariate calibration model for ascorbic acid determination was confirmed by the FOM, presented in Table 4. A reasonably low signal-to-noise ratio of 4.83 indicated that no straight relationship between the reference method and the fitted model was detected.

4. Discussion

Ascorbic acid is a labile molecule affected by several deleterious conditions such as oxygen, light, temperature and pressure [23]. Acerola is known for its high content of ascorbic acid [24] which is associated with several biological activities such as antioxidant capacity, antiscorbutic activity and iron metabolism. The recent growing interest of the industry for such bioactive molecules has brought attention to the need to develop rapid and precise detection methods [25].
The ascorbic acid content of the fruits used in this study varied between 1190.65 to 2187.06 mg/100 g FW (Table 1). The observed variation of ascorbic acid was attributed to the differences between fruits, according to maturation stage [1]. In this regard, it has been already shown that ascorbic acid is greatly reduced (about 50%) from the green to the ripe stage of acerola fruit due to biochemical oxidation reactions related to maturation [24].
Consistent baseline offsets and bias were observed in Figure 1. These are quite common features in NIR spectra acquired by diffuse reflectance techniques. As can be seen in Figure 1, the spectra were dominated by the water spectrum, with three overtone bands of the OH-bonds at 1070 and 1450 nm, respectively, and a combination band at 1940 nm. The peak at 1190 nm corresponded to the second and third C−H overtone regions, associated with sugar. Moreover, the sugar probably influenced the peak at 1700 nm. The absorption at 1170–1180 nm corresponded to the second overtone methylene group, and the 1410 nm peak represented the methylene group combination bands of ascorbic acid, while acid absorption occurred at 1890–1950 nm. Since ascorbic acid is one of the main chemical constituents of acerola fruit, these absorptions could be detected in the NIR spectra.
Due to some undesirable systematic behavior (baseline offsets) observed in the spectra (Figure 1), the original data were transformed by SG smoothing, multiplicative scattering correction (MSC) and SG first- and second-order derivatives.
As can be seen in Table 2, PLS and iPLS models demonstrated low predictive capability, but similar calibration and validation errors were observed. RPD values were low for all models. GA-PLS models presented better predictive capability compared to PLS and iPLS models. Reasonable models for ascorbic acid (RMSEP = 46.3 mg/100 g and determination coefficient for calibration ( R c 2 ) and prediction ( R p 2 ) equal to 0.98 and 0.54, respectively) were obtained using a GA-PLS model with 436 wavelengths and 12 latent variables. However, the RPD = 1.6 is still considered poor. Although the RPD does not include other statistical parameters of the regression model, such as latent variables or calibration error, a more complex index would be desired for the evaluation of the goodness or robustness of regression models.
The GA-PLS model with second derivative pre-processing was optimized by eliminating samples with extreme leverages, extreme un-modeled residuals for the ascorbic acid concentration or spectral data (FT-NIR). For validation samples, the outlier tests were based on extreme leverages and spectral residuals. The best model was achieved using 14 latent variables, in which 3 and 15 samples were excluded due to extreme un-modeled residuals in the calibration and prediction set, respectively. For this model, the obtained errors were RMSECV = 22.9 mg/100 g FW, RMSEP = 46.3 mg/100 g FW, RPD = 8.0 and R p 2   = 0.96.
The FOM (Table 4) indicated a suitable validation of the fitted model. The RMSECV and RMSEP values revealed good accordance between the estimated multivariate model and the reference method, which highlighted a satisfactory accuracy for the model. Multiple measurements were conducted on five samples (ten replicates per sample) with spectra data recorded on the same day, to assess precision, at a level of repeatability. Sensitivity, LD and LQ results were considered adequate, considering the analytical range of each model.
Previous reports in the literature have attempted to develop an effective NIRS-based model for ascorbic acid content in fruit and vegetables. Kramchote et al. [26] applied the NIR reflectance spectra in the 310 to 1100 nm range (spectrophotometer Handy Lamda II; Spectra Co., Ltd., Tokyo, Japan) to evaluate the ascorbic acid content on cabbage and obtained a low predictive capacity model (RPD = 1.26, R p 2   = 0.35). In a more recent study, Pérez-Marín et al. [23] used the NIR spectra for assessing spinach pre-harvesting parameters. The fitted models revealed a limited use for routine testing, due to its restricted capacity of prediction (RPD = 1.21 and R p 2   = 0.33). The use of such poor-predicting models was recommended for simpler classification analysis, such as high/low sorting. Satisfactory accuracy for prediction was reported by Alamar et al. [27] using NIRS for modeling the ascorbic acid content on guava pulp. Lower variability on chemical data allowed the development of good-predicting models (RMSEP = 6.137 mg/100 g and R p 2   = 0.85) with a reduced number of samples (N = 45).

5. Conclusions

A method based on NIRS and multivariate calibration was developed to estimate the ascorbic acid content of intact acerola fruit. Spectra collected in the wavelength range of 1000–2400 nm were analyzed by PLS, iPLS and GA-PLS methods, combined with different spectral pretreatments. The best combination, based on the prediction performance, was the GA-PLS method with second derivative spectral pretreatment, with an RMSECV = 22.9 mg/100 g, RMSEP = 46.3 mg/100 g, RPD = 8.0, R2c = 0.98 and R2p = 0.96. Our best model was compared to the conventional (destructive) method and no significant difference at a 95% confidence level was found. The values for accuracy, precision, and other figures of merit indicated that the NIRS model for ascorbic acid determination in intact acerola is a fast and reliable analytical alternative to titrimetric measurements. These findings can be useful for the rapid determination of ascorbic acid, a key acerola phytochemical that has been highly valued for the production of dietary supplements and the development of new products worldwide.

Author Contributions

This work was a product of the combined effort of all of the authors. F.P.d.M. and F.G.M.d.M. performed the experiments, analyzed the data (destructive methods) and wrote the original draft; T.R.N.F. performed the experiments; R.C.C. and C.d.L.M.d.M. analyzed the data (non-destructive–MATLAB) and wrote the original draft; R.T.H. and K.M.G.d.L. supervised the project, reviewed and edited the final manuscript.

Funding

The authors would like to acknowledge the financial support from CAPES/Brazil and CNPq/Brazil. F.P. Moraes thanks the Post-Graduate Program in Chemical Engineering (PPGEQ/UFRN) and R.C. Costa thanks the Post-Graduate Program in Chemistry (PPGQ/UFRN). The work was funded by grants from CNPq/Capes project (Grant 070/2012) and CNPq (305962/2014-0).

Conflicts of Interest

The authors declare no conflict of interest.

References

  1. Belwal, T.; Devkota, H.P.; Hassan, H.A.; Ahluwalia, S.; Ramadan, M.F.; Mocan, A.; Atanasov, A.G. Phytopharmacology of Acerola (Malpighia spp.) and its potential as functional food. Trends Food Sci. Technol. 2018, 74, 99–106. [Google Scholar] [CrossRef]
  2. Future Market Insights. Acerola Extract Market: Rising Global Demand for Natural and Fresh Fruit Derivatives Likely to Boost Market Growth: Global Industry Analysis and Opportunity Assessment, 2016–2026. 2018. Available online: https://www.futuremarketinsights.com/reports/acerola-extract-market (accessed on 1 October 2018).
  3. Rezende, Y.R.R.S.; Nogueira, J.P.; Narain, N. Microencapsulation of extracts of bioactive compounds obtained from acerola (Malpighia emarginata DC) pulp and residue by spray and freeze drying: Chemical, morphological and chemometric characterization. Food Chem. 2018, 254, 281–291. [Google Scholar] [CrossRef] [PubMed]
  4. Ribeiro, H.L.; de Oliveira, A.V.; de Brito, E.S.; Ribeiro, P.R.V.; de sá Souza Filho, M.M.; Azeredo, H.M.C. Stabilizing effect of montmorillonite on acerola juice anthocyanins. Food Chem. 2018, 245, 966–973. [Google Scholar] [CrossRef] [PubMed]
  5. Nascimento, E.M.M.; Rodrigues, F.F.G.; Costa, W.D.; Teixeira, R.N.P.; Boligon, A.A.; Sousa, E.O.; Rodrigues, F.F.G.; Coutinho, H.D.M.; da Costa, J.G.M. HPLC and in vitro evaluation of antioxidant properties of fruit from Malpighia glabra (Malpighiaceae) at different stages of maturation. Food Chem. Toxicol. 2018, 119, 457–463. [Google Scholar] [CrossRef] [PubMed]
  6. Ignat, T.; Schmilovitch, Z.; Fefoldi, J.; Steiner, B.; Alkalai-Tuvia, S. Non-destructive measurement of ascorbic acid content in bell peppers by VIS-NIR and SWIR spectrometry. Postharvest Biol. Technol. 2012, 74, 91–99. [Google Scholar] [CrossRef]
  7. Blanco-Díaz, M.T.; Del Río-Celestino, M.; Martínez-Valdivieso, D.; Font, R. Use of visible and near-infrared spectroscopy for predicting antioxidant compounds in summer squash (Cucurbita pepo ssp pepo). Food Chem. 2014, 164, 301–308. [Google Scholar] [CrossRef] [PubMed]
  8. Li, X.; Wei, Y.; Xu, J.; Feng, X.; Wu, F.; Zhou, R.; Jin, J.; Xu, K.; Yu, X.; He, Y. SSC and pH for sweet assessment and maturity classification of harvested cherry fruit based on NIR hyperspectral imaging technology. Postharvest Biol. Technol. 2018, 143, 112–118. [Google Scholar] [CrossRef]
  9. Viegas, T.R.; Mata, A.L.M.L.; Duarte, M.M.L.; Lima, K.M.G. Determination of quality attributes in wax jambu fruit using NIRS and PLS. Food Chem. 2016, 190, 1–4. [Google Scholar] [CrossRef] [Green Version]
  10. Arendse, E.; Fawole, O.A.; Magwaza, L.S.; Nieuwoudt, H.; Opara, U.L. Evaluation of biochemical markers associated with the development of husk scald and the use of diffuse reflectance NIR spectroscopy to predict husk scald in pomegranate fruit. Sci. Hortic. 2018, 232, 240–249. [Google Scholar] [CrossRef]
  11. Moreda, G.P.; Ortiz-Cañavate, J.; García-Ramos, F.J.; Ruiz-Altisent, M. Non-destructive technologies for fruit and vegetable size determination—A review. J. Food Eng. 2009, 92, 119–136. [Google Scholar] [CrossRef]
  12. Luan, X.; Huang, B.; Sedghi, S.; Liu, F. Probabilistic PCR based near-infrared modeling with temperature compensation. ISA Trans. 2018, 81, 46–51. [Google Scholar] [CrossRef] [PubMed]
  13. Makino, Y.; Ichimura, M.; Oshita, S.; Kawagoe, Y.; Yamanaka, H. Estimation of oxygen uptake rate of tomato (Lycopersicon esculentum Mill.) fruits by artificial neural networks modelled using near-infrared spectral absorbance and fruit mass. Food Chem. 2010, 121, 533–539. [Google Scholar] [CrossRef]
  14. Mariani, N.C.T.; Da Costa, R.C.; De Lima, K.M.G.; Nardini, V.; Cunha Júnior, L.C.; Teixeira, G.H.D.A. Predicting soluble solid content in intact jaboticaba [Myrciaria jaboticaba (Vell.) O. Berg] fruit using near-infrared spectroscopy and chemometrics. Food Chem. 2014, 159, 458–462. [Google Scholar] [CrossRef] [PubMed]
  15. Li, J.; Huang, W.; Tian, X.; Wang, C.; Fan, S.; Zhao, C. Fast detection and visualization of early decay in citrus using Vis-NIR hyperspectral imaging. Comput. Electron. Agric. 2016, 127, 582–592. [Google Scholar] [CrossRef]
  16. Moghimi, A.; Aghkhani, M.H.; Sazgarnia, A.; Abbaspour-Fard, M.H. Improvement of NIR transmission mode for internal quality assessment of fruit using different orientations. J. Food Process Eng. 2011, 34, 1759–1774. [Google Scholar] [CrossRef]
  17. Inácio, M.R.C.; De Lima, K.M.G.; Lopes, V.G.; Pessoa, J.D.C.; De Almeida Teixeira, G.H. Total anthocyanin content determination in intact açaí (Euterpe oleracea Mart.) and palmitero-juçara (Euterpe edulis Mart.) fruit using near infrared spectroscopy (NIR) and multivariate calibration. Food Chem. 2013, 136, 1160–1164. [Google Scholar] [CrossRef] [PubMed]
  18. De Oliveira, R.G.; Godoy, H.T.; Prado, M.A. Otimização de metodologia colorimétrica para a determinação de ácido ascórbico em geleias de frutas. Ciênc. Tecnol. Aliment. 2010, 30, 244–249. [Google Scholar] [CrossRef] [Green Version]
  19. Nicolaï, B.M.; Beullens, K.; Bobelyn, E.; Peirs, A.; Saeys, W.; Theron, K.I.; Lammertyn, J. Nondestructive measurement of fruit and vegetable quality by means of NIR spectroscopy: A review. Postharvest Biol. Technol. 2007, 46, 99–118. [Google Scholar] [CrossRef]
  20. Pedro, A.M.K.; Ferreira, M.M.C. Simultaneously calibrating solids, sugars and acidity of tomato products using PLS2 and NIR spectroscopy. Anal. Chim. Acta 2007, 595, 221–227. [Google Scholar] [CrossRef]
  21. Kennard, R.W.; Stone, L.A. Computer Aided Design of Experiments. Technometrics 1969, 11, 137–148. [Google Scholar] [CrossRef]
  22. Altieri, G.; Genovese, F.; Tauriello, A.; Di Renzo, G.C. Models to improve the non-destructive analysis of persimmon fruit properties by VIS/NIR spectrometry. J. Sci. Food Agric. 2017, 97, 5302–5310. [Google Scholar] [CrossRef] [PubMed]
  23. Pérez-Marín, D.; Torres, I.; Entrenas, J.A.; Vega, M.; Sánchez, M.T. Pre-harvest screening on-vine of spinach quality and safety using NIRS technology. Spectrochim. Acta-Part A Mol. Biomol. Spectrosc. 2019, 207, 242–250. [Google Scholar] [CrossRef] [PubMed]
  24. de Moraes, F.P.; Gonçalves, A.C.; Miguel, T.B.V.; Borges, K.C.; Correia, R.T.P. Freeze Dried Acerola (Malpighia emarginata) Pulp and Pomace: Physicochemical Attributes, Phytochemical Content and Stability during Storage. J. Food Ind. 2017, 1. [Google Scholar] [CrossRef]
  25. Oliveira-Folador, G.; de Bicudo, M.O.; de Andrade, E.F.; Renard, C.M.G.C.; Bureau, S.; de Castilhos, F. Quality traits prediction of the passion fruit pulp using NIR and MIR spectroscopy. LWT-Food Sci. Technol. 2018, 95, 172–178. [Google Scholar] [CrossRef]
  26. Kramchote, S.; Nakano, K.; Kanlayanarat, S.; Ohashi, S.; Takizawa, K.; Bai, G. Rapid determination of cabbage quality using visible and near-infrared spectroscopy. LWT-Food Sci. Technol. 2014, 59, 695–700. [Google Scholar] [CrossRef]
  27. Alamar, P.D.; Caramês, E.T.S.; Poppi, R.J.; Pallone, J.A.L. Quality evaluation of frozen guava and yellow passion fruit pulps by NIR spectroscopy and chemometrics. Food Res. Int. 2016, 85, 209–214. [Google Scholar] [CrossRef] [PubMed]
Figure 1. Raw near-infrared (NIR) spectra (1000–2400 nm) of intact acerola fruit.
Horticulturae 05 00012 g001
Figure 2. Measured versus predicted concentration of ascorbic acid (mg/100 g FW) in intact acerola using the genetic algorithm partial least squares (GA-PLS) model after second derivative pretreatment, where (●) calibration set; and () prediction set.
Horticulturae 05 00012 g002
Figure 3. Elliptical joint confidence regions (EJCR) for predicted acid ascorbic content in acerola samples.
Horticulturae 05 00012 g003
Table 1. Summary of statistics for ascorbic acid content and morphological characteristics (diameter and weight) of acerola fruit.
ParameterNMinMaxMeanS.D.
Ascorbic acid (mg/100 g FW)1021190.652187.061833.57374.56
Diameter (mm)10210.125.519.13.0
Weight (g)1021.58.24.21.4
Table 2. Summary of statistics for the calibration and prediction sets for ascorbic acid (mg/100 g FW) in acerola fruit using FT-NIRz spectra and PLS, PLS-iPLS and GA-PLS.
ModelNumber of Selected WavelengthsSpectral Pre-TreatmentsCalibrationPrediction
R c 2 RMSECV R p 2 RMSEPRPDLV
PLS15532nd derivative
5 points
0.88395.70.17351.519
PLS1555MSC 1st derivative
3points
0.91402.40.2355.218
PLS1555MSC 2nd derivative
3points
0.93510.10.19358.818
iPLS-PLS148MSC 1st derivative
9 points
0.73518.90.163381.18
iPLS-PLS297MSC 2nd derivative
3points
0.98477.70.12365.318
GA-PLS4362nd derivative
5points
0.9822.90.5446.31.612
GA-PLS429MSC 2nd derivative
3points
0.97248.220.53268.51.414
Z Abbreviations: FT-NIR, Fourier transform near-infrared spectroscopy; PLS, partial least squares; iPLS, interval PLS; GA-PLS, genetic algorithm partial least square; R c 2 , determination coefficient for calibration; RMSECV, root mean square error of calibration; RMSEP, root mean square error of prediction; R p 2 , determination coefficient for prediction; RPD, ratio of prediction to deviation; LV, latent variables.
Table 3. Summary of statistics for the calibration and prediction sets for ascorbic acid (mg/100 g FW) in acerola fruit using FT-NIRz spectra for different GA-PLS (second derivative) models after outlier detection.
CalibrationPrediction
Model R c 2 RMSECVSamples excludedRMSEP R p 2 RPDSamples excluded
GA-PLS 9 LV0.9920.74106.20.853.59
GA-PLS 10 LV0.9920.74101.30.863.610
GA-PLS 12 LV0.9920.7483.30.934.415
GA-PLS 14 LV0.9822.9346.30.968.015
Z Abbreviations: FT-NIR, Fourier transform near-infrared spectroscopy; GA-PLS, genetic algorithm partial least squares; R c 2 , determination coefficient for calibration; RMSECV, root mean square error of calibration; RMSEP, root mean square error of prediction; R p 2 , determination coefficient for prediction; RPD, ratio of prediction to deviation; LV, latent variables.
Table 4. Figures of merit for the best performing GA-PLSz model of ascorbic acid in intact acerola.
FOMAscorbic Acid (mg/100 g FW)
RMSECV22.9
RMSEP46.3
R c 2 0.98
R p 2 0.96
RPD8.0
Precision11.6
SEN1.5598 × 10−6
SEL0.047
LD1.1397 × 103
LQ3.7989 × 103
S/N4.83
z Abbreviations: FOM, figures of merit; RMSECV, root mean square error of calibration; RMSEP, root mean square error of prediction; R c 2 , determination coefficient of calibration; R p 2 , determination coefficient of prediction; RPD, ratio of prediction to deviation; SEN, sensitivity; SEL, selectivity; LD, limit of detection; LQ, limit of quantitation; S/N, signal-to-noise ratio.

