Assessing the Impact of Reference Evapotranspiration Models on Decision Support Systems for Irrigation

Institute for Vegetable Crops, Hochschule Geisenheim University, Von-Lade-Str. 1, 65366 Geisenheim, Germany
*
Author to whom correspondence should be addressed.
Horticulturae 2018, 4(4), 49; https://doi.org/10.3390/horticulturae4040049
Submission received: 26 September 2018
/
Revised: 2 November 2018
/
Accepted: 19 November 2018
/
Published: 28 November 2018
(This article belongs to the Special Issue Water Management of Horticultural Crops)
Abstract
:Reference evapotranspiration () is a major estimator for crop water requirements predicted by decision support systems for irrigation. However, the impact of different s on the predicted amount of water supply and counts of irrigation events has not been evaluated. Simulations of the Geisenheim Irrigation Scheduling (GS) for vegetable crops with two different s, P2- and FAO56-, were evaluated to assess exemplarily the impact of s. The sensitivity of both s to local climate conditions was characterized through a random forest analysis, and a linear regression model was used to adjust the original GS by adapting -values to the exchange . For assessing the outcomes of GS irrigation decision, simulations of 173 individual cropping cycles including six vegetable crops over eight years were conducted. After adjusting P2- -values to FAO56- -values, there was no impact of the -model on the practical irrigation scheduling with GS. Finally, we discuss that any -model, if adjusted accordingly, might have little impact on similar irrigation systems and provide a method to exchange s.
1. Introduction
Water resources are limited; however, the worldwide water demand is increasing with a growing population and industry [1]. The naturally-available water supply is decreasing as a result of changes in precipitation and water ecosystems caused by climate change [2]. In contrast, horticultural crops have a high demand for water. Thus, crop growth and quality can only be secured by providing sufficient irrigation, especially for leafy vegetables. In this context, horticulture is forced to justify irrigation decisions, as well as optimize water use efficiency. A significant key to meet these challenges is an efficient and comprehensible irrigation scheduling system. For open field irrigation, there are several procedures available for estimating crop water requirements [3]. Irrigation scheduling based on estimating crop water requirements with reference evapotranspiration () and crop coefficients (-values), also called “crop water balance (CWB)”, is internationally well-established [4,5]. The CWB approach has been found to be simple, convenient, and reproducible for many crops in different climate conditions ([6] and the references therein). The reference evapotranspiration () represents the potential evapotranspiration of a model surface or crop. For crop-specific evapotranspiration, is adapted by -values. -values are scaling factors generated by adjusting the measured actual crop evapotranspiration () to a (Equation (1)).
Since -values are a relative measure of the crop’s evapotranspiration, each and each CWB model need specifically parametrized and evaluated -values. Therefore, high quality and validly-calculated , as well as carefully-parametrized -values, are crucial for the CWB [5]. There are three types of models: first, models depending exclusively on ambient temperature (e.g., [7]), second, radiation and temperature-based models [8], and third, combination models additionally containing aerodynamic properties (e.g., [9]). The models differ in their calculation procedures by the effort involved in the calculation, local adjustment, and the quantity and quality of data acquisition for precise estimates. The FAO56 Penman–Monteith-, which is a combination model (FAO56-; [5]), is currently the commonly-used and most positively-evaluated [10,11,12]. It is used in the “- approach” to calculate and schedule crop irrigation [4,5]. Besides the FAO24 - approach, there are further CWB procedures or software-based irrigation recommendation systems, as reviewed by Cahn and Johnson [3] (Section 4.1). Some of them represent more advanced decision support systems for irrigation scheduling [13,14,15,16,17,18,19,20,21,22]. Their underlying concept of estimation is similar to the above-mentioned approach. One of these is the Geisenheim Irrigation Scheduling (GS), which is locally developed and applied under German climate conditions [23]. The GS approach is similar to the FAO56 single procedure (see the Materials and Methods). GS has been developed over the past 30 years, and there are -values evaluated for about 27 vegetable crops [24]. For calculating GS, as well as the evaluation of the corresponding -values, the Penman- [9] has been used, which was adapted and adjusted for the research site (further called P2-). An external service provider supplied this P2-. This is not unusual, since some s, as the FAO56-, are data demanding, and for some regions, the availability of all required model parameters is limited. Therefore, there are efforts to utilize statistically-adjusted and less data-demanding models (e.g., [10,25,26,27,28,29,30,31]). Consequently, the P2- data, like any other statistically- or methodically-adjusted , is proprietary and exclusively available for the research site. To overcome this lack of universal applicability and, in our case, to eliminate the dependency on an external service provider, it can be necessary to exchange the used to calculate CWB.
However, the effect of this exchange on the recommendations of a decision support system for vegetable irrigation is not yet known: Federer et al. [32] found s to differ in their accuracy, affected by different climates and regions, with no consistent trend. Therefore, in general, there should be differences between P2- and FAO56-. Further, there have been attempts to optimize the used in dynamic crop models, e.g., in a maize model, the effects of different s were assessed, finding no statistical difference in the modeling-based conclusion [33]. Hence, the exchange might not affect the basic functionality of GS, also considering it is a much simpler model. However, this kind of models covers only one specific crop. Furthermore, they evaluate the effect of on the performance of crop growth systems rather than the quality of irrigation decisions. Xu and Chen [34] found small deviations in water balances depending on different s in a model for groundwater recharge. This suggests that different s might produce small deviations in crop water balances, as well. Even though, the impact of different s on decision support systems for vegetable irrigation has not been evaluated so far. To fill this gap, we assess exemplarily the impact of P2- and FAO56- on GS irrigation recommendations.
To exchange the model in an irrigation decision support system, several requirements have to be met. These requirements are described for GS in the following points: (I) The model has to provide a reliable estimation of without the need for adjustments to local conditions and a robust, well-documented calculation procedure with broad application and implementation. (II) The model requires a similar sensitivity to the input data such as temperature, air humidity, global radiation, and wind speed as P2-. (III) The exchange of the model has to be enabled via an adjustment of the -values to sustain GS for practical application. (IV) The exchanged model should produce similar irrigation patterns and volumes as the original model. We assumed that GS could be driven with FAO56- by using statistically-adjusted -values, which were evaluated with P2-, without significant changes in the resulting irrigation patterns and volumes. This study focused on performing sensitivity analysis for values and the statistical adjustment of -values for FAO56- with an added validation with computer simulations. We hypothesize that CWB procedures, in general, do not solely depend on the and can be driven with different s, producing the same outcomes when adjusted correctly. This paper will describe a method that may enable the adjustment of irrigation decision support systems with similar constraints in data availability.
2. Materials and Methods
2.1. Geisenheim Irrigation Scheduling
Geisenheim Irrigation Scheduling [23,24] is a decision support system for sprinkle irrigation management of vegetable crops. GS was developed in Geisenheim (Germany, Hesse, lat 49.98 long 7.96, soil: sandy loam, mean precipitation 549 /a) over the past 30 years. It is parametrized for 27 vegetable crops. These parametrizations are based on marketable yield. The underlying principle of GS is a crop water balance. Parameters of GS have been evaluated in an open-air gravimetric container system (similar to lysimeters), as well as in multi-annual open field experiments. The actual crop transpiration and soil evaporation () is balanced with the incoming precipitation and irrigation over the cultivation time on daily steps (see Equation (3)). For calculating , GS uses an adjusted by -values, representing the crop’s evapotranspiration (see Equation (2)). The -values are gradually adjusted over the cultivation period in stages, depending on the phenological development of the crop, which is measured in BBCH (“Biologische Bundesanstalt, Bundessortenamt und CHemische Industrie”) code states [35]. The calculation of the GS procedure can be described as follows: first, crop -values and rooting depths with their corresponding developmental stages are selected from the GS data tables [24]. Second, the irrigation thresholds for every developmental stage are calculated. The thresholds represent the soil water content available for evapotranspiration () and are determined by the available field capacity of the soil (AFC) concerning the maximum rooting depth and the rooted zone of the crop at the corresponding developmental stage. For each crop’s developmental stage, there is an individual number of soil layers defined. Thus, the first threshold equals the soil water content in the first rooted soil layer held between 60% to 90% AFC; the next threshold consists of 60% to 100% AFC of the first layer plus 60% to 90% AFC of the second layer. The AFC in the first layer is held to 90% to prevent nutrient leaching due to precipitation. This procedure applies to all following layers and developmental stages, accordingly. Third, a starting point for the soil water content for the field is set. This point is defined at 90% AFC. Either the corresponding soil water content can be measured gravimetrically or it can be induced by extensive irrigation or precipitation, filling the soil pores with water. This results in the soil reaching field capacity approximately two days after. At the beginning of cultivation, the calculation of the CWB starts with the daily crop water balance. Therefore, daily is calculated from and the current -values (Equation (2)), which is balanced with the precipitation and irrigation of the day. This daily water balance is then summed up over the cultivation period as the total water balance (see Equation (3)). If this total water balance equals or exceeds a deficit equivalent to the respective irrigation threshold, this amount of water is recommended for irrigation (see Equation (4)). In case total water balance exceeds 100% AFC due to an irrigation or rainfall event, this water drains into deeper soil layers, and the total water balance is set to zero. If this excess is caused by heavy rainfall, causing a total saturation of the coarse soil pores, the calculation is interrupted for two days to allow the coarse soil pores to drain again to field capacity. Over the whole cultivation period, phenological development of the crop is observed regularly, so, by reaching the defined BBCH code states, -values and irrigation thresholds for the daily calculation step are adjusted to the next stage.
2.2. Data
Weather data from the years 2000–2009, as well as the P2- were recorded daily, nearby the experimental site in Geisenheim and provided by the German weather forecast (DWD) (http://www.dwd.de). FAO56- was calculated from these weather data. The corresponding units and abbreviations of the data are displayed in Table 1.
The calculation of FAO56- was based on the standard procedure as described by Allen et al. [5] for daily steps. This includes the use of maximum and minimum air temperatures and the zeroing of soil heat flux (; see Equation (5)). Contrary to the recommended procedure, actual vapor pressure () is calculated by Equation (6). This is because the minimum and maximum air humidity were not logged and thus were not available for the recommended calculation procedure. For GS simulations, a total of 173 individual recorded cultivation datasets from years 2000–2008 were used. They include -values and BBCH state dates for six cultivars: cauliflower (Brassica oleracea var. botrytis L.), broccoli (Brassica oleracea var. italica Plenck), bush bean (Phaseolus vulgaris), carrot (Daucus carota subsp. sativus), leek (Allium porrum), and onion (Allium cepa).
where
- is reference evapotranspiration (),
- net radiation at the crop surface (),
- G soil heat flux density (),
- T mean daily air temperature at 2 height (),
- wind speed at 2 height (),
- mean saturation vapor pressure (),
- actual vapor pressure (),
- saturation vapor pressure deficit (),
- slope vapor pressure curve (), and
- psychrometric constant (), and:
- is actual vapor pressure (),
- mean saturation vapor pressure (), and
- mean relative air humidity (%).
2.3. Sensitivity Analysis with Random Forest
The differences of P2- and FAO56- were statistically assessed by an analysis of sensitivity to the environmental conditions in Geisenheim (weather data 2000–2009) using a random forest model [36,37]. In contrast to classical sensitivity analysis methods, which often observe local and one-dimensional parameter sensitivity, random forest allows for global multidimensional estimates of parameter sensitivity [38]. The random forest algorithm builds randomly-generated “regression decision trees”. For each tree, the algorithm samples a random subsample of the input and training data, which is known as “bagging”. This machine learning model was built for P2- and FAO56- depending on the weather data, which also included the measuring date as a predictor. The random forest regression trees were built by using three of eight variables (Table 1, plus date as a variable) in each tree, in a total of 500 trees for each . To determine the count of variables in each tree, the square root of total variables was rounded to the next full number [37]. The sensitivity was assessed by the inherent variable importance of the random forest models. It was measured as a relative increase in mean squared error (%IncMSE), as recommended by Breiman [37]. This value describes the increase in predicting performance loss of the random forest model if the factor in question is excluded from the model. The variable importance is statistically independent of the parametrization data, because it is generated from bagged data and, is thus, a very reliable value [36]. The relative rank of %IncMSE compared the sensitivity of the random forest models to the input variables, since the absolute value has no meaning for a comparison of random forest models. The random forest function used to predict either FAO56- or P2- out of the most important variable (factor) of the models was plotted to compare them visually.
2.4. Regression Model
To utilize P2---values (P2-) in the calculation of GS with FAO56- as FAO56-, a linear regression model without intercept was parametrized. This simplified model approach enables the easy mathematical transposition from to -values as follows: The abundance of an intercept allows for a static adjustment of -values, without the need for daily recalculations depending on . Consequently, P2- was predicted from FAO56- (Equation (7)), so that P2- could be transposed to FAO56- (Equation (8)). For parametrization of the regression model, we used the dataset from 2009 and excluded it from simulation data to maintain statistical independence to prevent overfitting. The performance of the regression model was assessed via residual standard deviation, relative residual standard deviation, and analytical plots of the residuals versus predicted values.
2.5. Simulations
Computer simulations of GS were evaluated to assess the predicting performance of the FAO56- model. The impact of a replaced and statistically-adjusted -values in contrast to the original GS was measured by comparing simulations of irrigation events. Weather data from 2000–2008 and cultivation data for the six crops (see Section 2.2) were input into an R-script (see Section 2.6), which implemented both s in GS (, ).
The FAO56- in were statistically adjusted through the parametrized regression model (see Section 2.4). Since precipitation adds a random error to the irrigation calculations, precipitation data were excluded for these simulations. Hence, no calculation pauses due to an excessive water supply for the soil were included in the simulations. The model output was summarized as differences in the total amount of water given (IWD), the total count of irrigation events (IC , IC ), and differences in the total count of irrigation events (ICD) for each of the six crops.
2.6. Computer Software
All statistical analyses and simulations were calculated using the R-programming language [39]. For the random forest model generation, the package randomForest was used [40]. Graphs were produced with the R-Package ggplot2 [41] with the color palette developed by Brewer [42]. The document was built with LaTeX and the dynamic document generation package knitR [43,44,45].
3. Results and Discussion
3.1. Regression
To adjust P2- statistically for the use with FAO56- in GS, we conducted a regression analysis between P2- and FAO56- with a simple linear regression model without intercept. P2- was predicted by with a residual standard deviation of (Figure 1). This corresponds to a relative error of %. The regression model (Figure 1) fit well to the data. The analytical plot of the residuals versus predicted revealed a very slightly skewed relationship at low and high values (blue line, Figure 2). The residuals of this model subsided at low and high values. Additionally, the residual mean (red dotted line) did not match the zero (black dotted line) exactly (Figure 2). These observations indicate a slight underestimation of the regression model and might question the linearity of the model. There might be better-fitting statistical models to estimate the relationship between P2- and FAO56-. However, our model is the only approach that allows for a one factorial adjustment of the -values without the influence of the . Consequently, FAO56- were calculated by (Equations (7) and (8)). A final evaluation of this regression model requires the combination with the irrigation model, which is described in Section 3.3.
3.2. Sensitivity of Random Forest
The factor importance of the FAO56- and P2- random forest models is shown in Figure 3. In both cases, the most important factor was global irradiation, followed by air temperature and relative air humidity. The overall order of the variables differed only slightly. Consequently, it was likely that there were no significant differences in the fluctuations of P2- and FAO56- at the research site. This conclusion is supported by the partial dependence plot for the most important variable, global radiation (Figure 4). Both models followed the global radiation similarly. For instance, irregular patterns such as the sudden rise of the curves between 12 · · d−1 to 15 · · d−1 were present in both models. These findings suggest that a simple linear scaling factor, as achieved with the regression model, may be capable of adjusting both s on an equal value. Moreover, a similar order of sensitivity rankings in the main vegetation period was also found for FAO56-, e.g., by Gong et al. [46], DeJonge et al. [47]. Due to this, the method for P2- to FAO56- adjustments appears applicable in other regions, as well.
3.3. Simulations of GS
The comparison outcomes for and are shown in Table 2. Aggregated results are presented for the six vegetable crops. There are averaged and relative differences of totaled irrigation water (IWD) and counted irrigation events (ICD). The mean IWD varied between % for broccoli and % leek. This means that irrigation with the original P2--driven GS produced higher amounts of irrigation water than the FAO56- adjusted GS. The highest standard deviation was observed in bush beans (%) with a mean IWD of %. This may be due to the high variability in cultivation periods, which is also represented by the standard deviation of IC FAO56- and IC P2- (Table 2). The boxplot (Figure 5) pictures the distribution patterns of the IWD. A widespread distribution of IWD was observed in bush bean. ICD ranged between 0.25 and 0.76 counts (Table 2). Thus, on average, there was a 0.45 irrigation events difference between the simulated GS irrigation scheduling systems. The simulations of broccoli, carrot, cauliflower, leek, and onion seemed to generate negligible differences in irrigation water when compared to common water distribution patterns produced by sprinkler irrigation. For instance, the variation of the applied amount of water from common sprinkler irrigation techniques in comparison to the water available to the crop was reported between 55% to 85% [48]. Zhang et al. [49] described an average sprinkler system uniformity (defined as the distinct distribution uniformity of water applied in the whole irrigation system on the field). They found a sprinkler system uniformity of 79% on average over several sprinkler types and terrain topographies. The ICD of the simulations strengthen the implication that there are negligible differences between and for practical irrigation purposes. The ICD did not exceed one irrigation on average (Table 2).
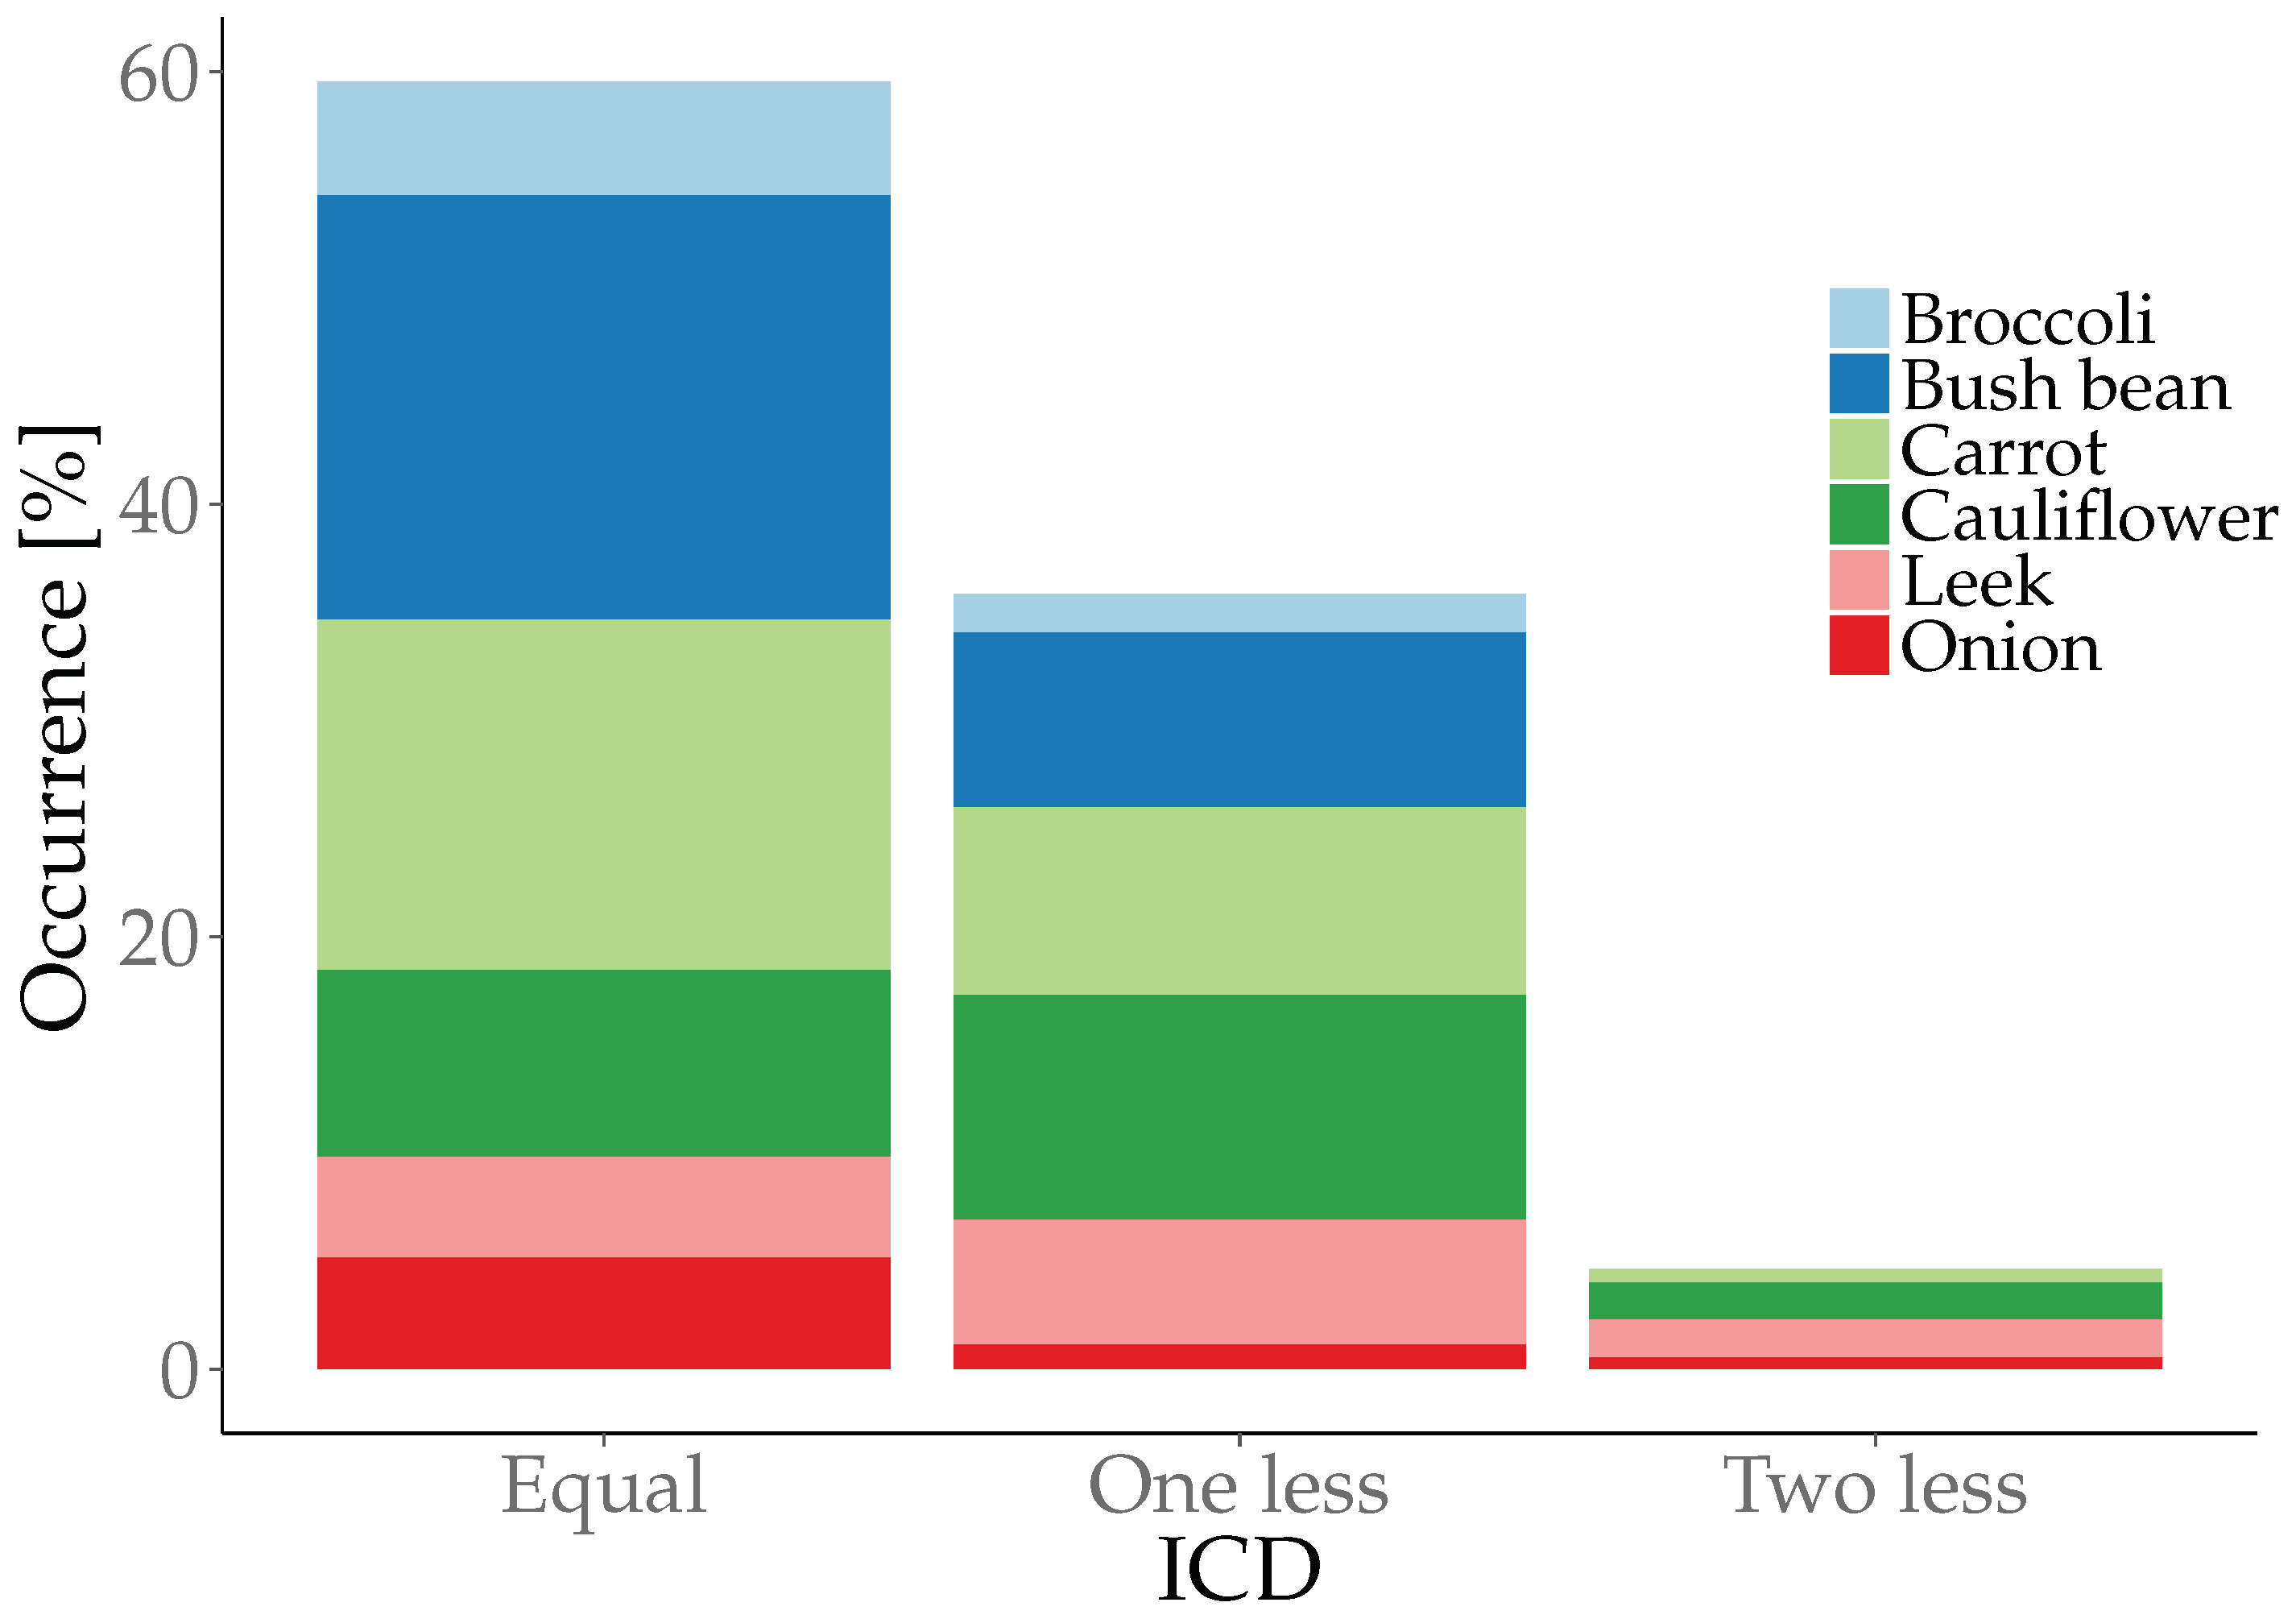
The distribution of ICD is given in Figure 6. In 59% of the cases, there were no differences between and at all. Over all crops, the ICD showed that irrigated slightly less often than . One less irrigation event was simulated in 36% of all irrigation events. Two fewer irrigation events were simulated in only 5% of the cases (n = 173). Nonetheless, crops, which were the most likely to have simulated two fewer irrigation events, leek and onion, produced a mean IWD of just % and %. This low level of different water supply was also covered by the technical constraints of common irrigation techniques mentioned above. Overall, the simulation results met our expectations concerning the exchange of the with adjusted -values for GS. The exchange resulted in similar irrigation patterns and water volumes for our simulation study.
3.3.1. The Precision of the CWB and Model
The limits and validity range of both the CWB procedure and the model are crucial for a better comprehension of the limits and validity range of our study. Individual, local parametrizations of FAO56- can also cause daily, site-specific errors ranging from −4% to 15% [12]. These errors may be related to the non-linear residual deviations due to the exclusion of the intercept in the model (Figure 2). However, also Xu and Chen [34] found a maximum error of 10% for CWB models, when used to calculate groundwater recharge, that have not been calibrated for their research site. Apart from the variability, the mean IWD was positive over all crops. This may be due to the differing assumptions of the Penman reference evapotranspiration and the FAO56-. Penman is known to overestimate , because of the hypothesized free evaporating water surface [5]. This is accounted for in the FAO56- using crop surface resistances. Therefore, the observed decrease in amounts of irrigation water and count of irrigation events might also be an improvement over the original GS. The irrigation decision may be more resource efficient, by recommending fewer irrigation events due to a more accurate representation of . Furthermore, similar comparison between a Penman-1963- and the FAO-modified Penman- equation produced a difference of 23% in annual [50]. However, the observed difference of 33% (factor 1.33) in our study in comparison to the difference of 23% [50] may be caused by different climate conditions and the modifications in the P2-.
3.3.2. Numerical and Statistical Issues
The statistical and numerical features of the model were essential constraints when rating the outcome of this study. In the first instance, as for any other model, parametrization an experimental validation was necessary for other locations. Further, the regression factor of 1.33 to adjust P2- to may be titled as “yet another trimming screw”. However, this factor influences the resulting irrigation decisions in GS simulations. When compared with terms like the albedo coefficient used in the Penman–Monteith- or the whole net radiation model in different s, the observed effect of these factors might be similar to the -values’ adjustment at the end. As a generalization, the regression model used was a one-factor representation of the differences between FAO56- and P2-. Simplified and less data-demanding models to predict are frequently reported in the literature [10,25,26,27,28,29,30,31]. In these studies, the authors successfully adjusted statistical models for their region with FAO56- as a reference, also neglecting the physically-based assumptions made in the FAO56-.
Further, it is in the nature of statistical model parametrizations to fit for the parametrization site. This is even true with bad parametrization for a single submodel in a complex model. However, with each additional parameter, an additional source of error arises. The more different the location from the parametrization site, the more significant is the error, due to overfitted parameters. Thus, the single parameter -value model may work as well as, or outperform, complex models at other non-parametrization sites.
Another cause of differences in the simulations might be the binary nature of the irrigation trigger, amplifying the contrast between the models. However, no examinations were carried out to determine whether an irrigation event occurred one or two days after the end of the irrigation model period. Since precipitation was excluded for simulations, it is likely that the influence of natural precipitation patterns may decrease or also level the observed differences.
3.3.3. Practical Considerations
Based on the study, GS seemed to be useful for practical application with statistically-valid adjusted -values and FAO56-. As it is a decision support system for irrigation scheduling, one fewer recommended irrigation has little practical meaning. In contrast to the considerable impact that natural precipitation, as well as a false prediction of this precipitation may have on cultivation and irrigation practice, the influence of the model recommended irrigation water may vanish. Moreover, two fewer simulated irrigation events may result in very different patterns if natural rainfall comes into consideration. Furthermore, irrigation decisions are, in practice, considered based on many other technical constraints, e.g., availability of irrigation systems and pest control. Those constraints might find consideration in complex future irrigation decision support systems.
As emphasized before, we used a simple method to estimate and adjust the differences necessary to facilitate the future use of GS. There is a need for simple methods for decision support systems because GS has to serve as a practical model for an economic decision. An overly complicated system might lead to failure, because of the need for dedicated labor to evaluate the model and adjust it for the needs of the farm, also reducing the economic value of the complex. Additionally, the transferability of GS might be facilitated by this simple method, as we eliminated the dependency on an external service provider for calculating GS. Moreover, the FAO56- adjusted -values may be more easily modified for other climates by the method of Allen et al. [5], enabling the use of GS in other regions.
4. Conclusions
In the Geisenheim Irrigation Scheduling, the reference evapotranspiration P2- can be replaced by the scientifically known to form FAO56-. Both s have a similar sensitivity to the weather conditions on the parametrization and evaluation site of GS in Geisenheim. With this prerequisite fulfilled, it was possible to parametrize a simple linear regression model to transpose -values from P2- to the use with FAO56-. Therefore, the practical application of GS is possible with FAO56- and adjusted -values. GS produces similar irrigation recommendations with the changed to FAO56- with adjusted -values as with P2- and the original -values. Furthermore, there is a potential for optimized irrigation recommendations with the more physically-adequate FAO56-.
This study enabled us to eliminate the dependency on external weather service and to provide the Geisenheim Irrigation Scheduling with a commonly-available for a universal application. In the process of the evaluation of the exchange in GS, we used random forest as the statistical procedure to assess the local sensitivities of the two s. It proved to be a valuable tool and may be of good use in similar “black box” applications. We replicated irrigation events with computer simulations from GS with FAO56- and yielded nearly the same outcome concerning common irrigation practices. The model itself has no impact on the practical irrigation scheduling recommendations of GS. Thus, the validity of a similar irrigation decision support system based on CWB might be independent of the incorporated , as well, if adjusted accordingly. Overall, we provide a proven method to adjust CWB procedures to an exchanged .
Author Contributions
Conceptualization, J.Z. and M.O. Methodology, M.O., K.K., and J.Z. Software, M.O. Validation, M.O., K.K., and J.Z. Formal analysis, M.O. Investigation, M.O. Resources, J.Z. Data curation, M.O. Writing, original draft preparation, M.O. Writing, review and editing, J.Z. and K.K. Visualization, M.O. Supervision, J.Z. Project administration, J.Z. Funding acquisition, J.Z.
Funding
This work was supported by funds of the Federal Ministry of Food, Agriculture and Consumer Protection (BMELV) based on a decision of the Parliament of the Federal Republic of Germany via the Federal Office for Agriculture and Food (BLE) under the innovation support program.
Conflicts of Interest
The authors declare no conflict of interest. The founding sponsors had no role in the design of the study; in the collection, analyses, or interpretation of data; in the writing of the manuscript; nor in the decision to publish the results.
Abbreviations
The following abbreviations are used in this manuscript:
| AFC | Available field capacity of the soil |
| BBCH | Crop phenology index |
| CWB | Crop water balance |
| GS | Geisenheim Irrigation Scheduling |
| Reference evapotranspiration | |
| Actual crop evapotranspiration | |
| FAO56 | Reference evapotranspiration based on the FAO56 paper |
| GS simulation model with FAO56 | |
| GS simulation model with P2 | |
| ICD | Differences in total counts of irrigation events |
| IWD | Differences in total amounts of irrigation water |
| P2 | Adjusted Penman reference evapotranspiration |
| %IncMSE | Relative increase in mean squared error |
References
- Earthscan (Ed.) The State of the World’s Land and Water Resources for Food and Agriculture: Managing Systems at Risk, 1st ed.; Earthscan: Milton Park, UK; New York, NY, USA, 2011. [Google Scholar]
- IPCC. Climate Change 2014: Impacts, Adaptation, and Vulnerability. Part A: Global and Sectoral Aspects. Contribution of Working Group II to the Fifth Assessment Report of the Intergovernmental Panel on Climate Change; Field, C.B., Barros, V.R., Dokken, D.J., Mach, K.J., Mastrandrea, M.D., Bilir, T.E., Chatterjee, M., Ebi, K.L., Estrada, Y.O., Genova, R.C., et al., Eds.; Cambridge University Press: Cambridge, UK; New York, NY, USA, 2014. [Google Scholar]
- Cahn, M.; Johnson, L. New Approaches to Irrigation Scheduling of Vegetables. Horticulturae 2017, 3, 28. [Google Scholar] [CrossRef]
- Doorenbos, J.; Pruitt, W.O.; Aboukhaled, A.; Damagnez, J.; Dastane, N.G.; Van Der Berg, C.; Rijtema, P.E.; Ashford, O.M.; Frère, M. Crop Water Requirements; FAO Irrigation and Drainage Paper; FAO: Rome, Italy, 1977. [Google Scholar]
- Allen, R.G.; Pereira, L.S.; Raes, D.; Smith, M. Crop Evapotranspiration-Guidelines for Computing Crop Water Requirements-FAO Irrigation and Drainage Paper 56; FAO: Rome, Italy, 1998; Volume 300, p. 6541. [Google Scholar]
- Allen, R.G.; Pereira, L.S. Estimating Crop Coefficients from Fraction of Ground Cover and Height. Irrig. Sci. 2009, 28, 17–34. [Google Scholar] [CrossRef]
- Thornthwaite, C.W.; Mather, J.R.; Carter, D. Instructions and Tables for Computing Potential Evapotranspiration and the Water Balance; Drexel Institute of Technology, Laboratory of Climatology: Centerton, AR, USA, 1957. [Google Scholar]
- Hargreaves, G.H.; Samani, Z.A. Reference Crop Evapotranspiration from Temperature. Appl. Eng. Agric. 1985, 1, 96–99. [Google Scholar] [CrossRef]
- Penman, H.L. Natural Evaporation from Open Water, Bare Soil and Grass. Proc. R. Soc. Lond. A Math. Phys. Eng. Sci. 1948, 193, 120–145. [Google Scholar] [CrossRef]
- Droogers, P.; Allen, R.G. Estimating Reference Evapotranspiration under Inaccurate Data Conditions. Irrig. Drain. Syst. 2002, 16, 33–45. [Google Scholar] [CrossRef]
- Allen, R.G.; Pruitt, W.O.; Wright, J.L.; Howell, T.A.; Ventura, F.; Snyder, R.; Itenfisu, D.; Steduto, P.; Berengena, J.; Yrisarry, J.B.; et al. A Recommendation on Standardized Surface Resistance for Hourly Calculation of Reference ETo by the FAO56 Penman-Monteith Method. Agric. Water Manag. 2006, 81, 1–22. [Google Scholar] [CrossRef]
- Liu, X.; Mei, X.; Li, Y.; Wang, Q.; Zhang, Y.; Porter, J.R. Variation in Reference Crop Evapotranspiration Caused by the Ångström–Prescott Coefficient: Locally Calibrated versus the FAO Recommended. Agric. Water Manag. 2009, 96, 1137–1145. [Google Scholar] [CrossRef]
- Johnson, L.; Cahn, M.; Martin, F.; Melton, F.; Benzen, S.; Farrara, B.; Post, K. Evapotranspiration Based Irrigation Scheduling of Lettuce and Broccoli. HortScience 2015, 51, 935–940. [Google Scholar]
- Mannini, P.; Genovesi, R.; Letterio, T. IRRINET: Large Scale DSS Application for On-Farm Irrigation Scheduling. Procedia Environ. Sci. 2013, 19, 823–829. [Google Scholar] [CrossRef]
- Cahn, M.; English, M.J.; Hartz, T. Irrigation and Nitrogen Management Web-Based Software for Lettuce Production. In Proceedings of the Fertilizer Research and Education Program Conference, Tulare, CA, USA, 16–17 November 2011; p. 19. [Google Scholar]
- Brisson, N.; Gary, C.; Justes, E.; Roche, R.; Mary, B.; Ripoche, D.; Zimmer, D.; Sierra, J.; Bertuzzi, P.; Burger, P.; et al. An Overview of the Crop Model STICS. Eur. J. Agron. 2003, 18, 309–332. [Google Scholar] [CrossRef]
- Mateos, L.; Lopez-Cortijo, I.; Sagardoy, J.A. SIMIS: The FAO Decision Support System for Irrigation Scheme Management. Agric. Water Manag. 2002, 56, 193–206. [Google Scholar] [CrossRef]
- Wolf, J.; de Wit, A. Calibration of WOFOST Crop Growth Simulation Model for Use within CGMS; Report; RIZa; SC-DLO: Wageningen, The Netherlands, 2003. [Google Scholar]
- Steduto, P.; Hsiao, T.C.; Raes, D.; Fereres, E. AquaCrop—The FAO Crop Model to Simulate Yield Response to Water: I. Concepts and Underlying Principles. Agron. J. 2009, 101, 426. [Google Scholar] [CrossRef] [Green Version]
- Leib, B.G.; Elliott, T.V.; Matthews, G. WISE: A Web-Linked and Producer Oriented Program for Irrigation Scheduling. Comput. Electr. Agric. 2001, 33, 1–6. [Google Scholar] [CrossRef]
- Smith, M. CROPWAT: A Computer Program for Irrigation Planning and Management, Ver. 5.7 ed.; Number 46 in FAO Irrigation and Drainage Paper; Food and Agriculture Organization of the United Nations: Roma, Italy, 1992. [Google Scholar]
- Stöckle, C.O.; Donatelli, M.; Nelson, R. CropSyst, a Cropping Systems Simulation Model. Eur. J. Agron. 2003, 18, 289–307. [Google Scholar] [CrossRef]
- Hartmann, H.D.; Pfülb, E.; Zenegerle, K.H. Wasserverbrauch und Bewässerung von Gemüse; Geisenheimer Berichte der Forschungsanstalt Geisenheim: Geisenheim, Germany, 2000; Volume 44. [Google Scholar]
- Geisenheim University. Geisenheim Irrigation Scheduling; Department of Vegetable Crops: Geisenheim, Germany, 2017. [Google Scholar]
- Martí, P.; González-Altozano, P.; López-Urrea, R.; Mancha, L.A.; Shiri, J. Modeling Reference Evapotranspiration with Calculated Targets. Assessment and Implications. Agric. Water Manag. 2015, 149, 81–90. [Google Scholar] [CrossRef]
- Kisi, O. Evapotranspiration Modeling Using a Wavelet Regression Model. Irrig. Sci. 2011, 29, 241–252. [Google Scholar] [CrossRef]
- Ozkan, C.; Kisi, O.; Akay, B. Neural Networks with Artificial Bee Colony Algorithm for Modeling Daily Reference Evapotranspiration. Irrig. Sci. 2011, 29, 431–441. [Google Scholar] [CrossRef]
- Kisi, O. Least Squares Support Vector Machine for Modeling Daily Reference Evapotranspiration. Irrig. Sci. 2013, 31, 611–619. [Google Scholar] [CrossRef]
- Kumar, M.; Raghuwanshi, N.S.; Singh, R.; Wallender, W.W.; Pruitt, W.O. Estimating Evapotranspiration Using Artificial Neural Network. J. Irrig. Drain. Eng. 2002, 128, 224–233. [Google Scholar] [CrossRef]
- Martí, P.; González-Altozano, P.; Gasque, M. Reference Evapotranspiration Estimation without Local Climatic Data. Irrig. Sci. 2011, 29, 479–495. [Google Scholar] [CrossRef]
- Ballesteros, R.; Ortega, J.F.; Moreno, M.Á. FORETo: New Software for Reference Evapotranspiration Forecasting. J. Arid Environ. 2016, 124, 128–141. [Google Scholar] [CrossRef]
- Federer, C.A.; Vörösmarty, C.; Fekete, B. Intercomparison of Methods for Calculating Potential Evaporation in Regional and Global Water Balance Models. Water Resour. Res. 1996, 32, 2315–2321. [Google Scholar] [CrossRef]
- Utset, A.; Farré, I.; Martínez-Cob, A.; Cavero, J. Comparing Penman–Monteith and Priestley–Taylor Approaches as Reference-Evapotranspiration Inputs for Modeling Maize Water-Use under Mediterranean Conditions. Agric. Water Manag. 2004, 66, 205–219. [Google Scholar] [CrossRef]
- Xu, C.Y.; Chen, D. Comparison of Seven Models for Estimation of Evapotranspiration and Groundwater Recharge Using Lysimeter Measurement Data in Germany. Hydrol. Process. 2005, 19, 3717–3734. [Google Scholar] [CrossRef]
- Meier, U. Entwicklungsstadien Mono- Und Dikotyler Pflanzen–BBCH-Monografie; Juli us Kühn-Institut (JKI): Braunschweig, Germany, 2018. [Google Scholar]
- Breiman, L. Bagging Predictors. Mach. Learn. 1996, 24, 123–140. [Google Scholar] [CrossRef]
- Breiman, L. Random Forests. Mach. Learn. 2001, 45, 5–32. [Google Scholar] [CrossRef] [Green Version]
- Pappenberger, F.; Iorgulescu, I.; Beven, K.J. Sensitivity Analysis Based on Regional Splits and Regression Trees (SARS-RT). Environ. Model. Softw. 2006, 21, 976–990. [Google Scholar] [CrossRef]
- R Core Team. R: A Language and Environment for Statistical Computing; R Foundation for Statistical Computing: Vienna, Austria, 2016. [Google Scholar]
- Liaw, A.; Wiener, M. Classification and Regression by randomForest. R News 2002, 2, 18–22. [Google Scholar]
- Wickham, H. Ggplot2: Elegant Graphics for Data Analysis; Springer: New York, NY, USA, 2009. [Google Scholar]
- Brewer, C. Designing Better Maps: A Guide for GIS Users, 2nd ed.; Esri Press: Redlands, CA, USA, 2015. [Google Scholar]
- Xie, Y. Knitr: A Comprehensive Tool for Reproducible Research in R. In Implementing Reproducible Computational Research; Stodden, V., Leisch, F., Peng, R.D., Eds.; Chapman and Hall/CRC: Boca Raton, FL, USA, 2014; ISBN 978-1466561595. [Google Scholar]
- Xie, Y. Dynamic Documents with R and Knitr, 2nd ed.; Chapman and Hall/CRC: Boca Raton, FL, USA, 2015; ISBN 978-1498716963. [Google Scholar]
- Xie, Y. Knitr: A General-Purpose Package for Dynamic Report Generation in R, R package version 1.13; 2016. Available online: https://yihui.name/knitr/ (accessed on 27 November 2018).
- Gong, L.; Xu, C.Y.; Chen, D.; Halldin, S.; Chen, Y.D. Sensitivity of the Penman–Monteith Reference Evapotranspiration to Key Climatic Variables in the Changjiang (Yangtze River) Basin. J. Hydrol. 2006, 329, 620–629. [Google Scholar] [CrossRef]
- DeJonge, K.C.; Ahmadi, M.; Ascough, J.C.; Kinzli, K.D. Sensitivity Analysis of Reference Evapotranspiration to Sensor Accuracy. Comput. Electr. Agric. 2015, 110, 176–186. [Google Scholar] [CrossRef]
- Howell, T.A. Irrigation Efficiency. Encyclopedia of Water Science; Marcel Dekker: New York, NY, USA, 2003; pp. 467–472. [Google Scholar]
- Zhang, L.; Merkley, G.P.; Pinthong, K. Assessing Whole-Field Sprinkler Irrigation Application Uniformity. Irrig. Sci. 2013, 31, 87–105. [Google Scholar] [CrossRef]
- Batchelor, C.H. The Accuracy of Evapotranspiration Estimated with the FAO Modified Penman Equation. Irrig. Sci. 1984, 5, 223–233. [Google Scholar] [CrossRef]
Figure 1.
Simple linear regression model (blue line) for P2-∼ FAO56- (). Data for the year 2009, Geisenheim, Germany.
Figure 1.
Simple linear regression model (blue line) for P2-∼ FAO56- (). Data for the year 2009, Geisenheim, Germany.
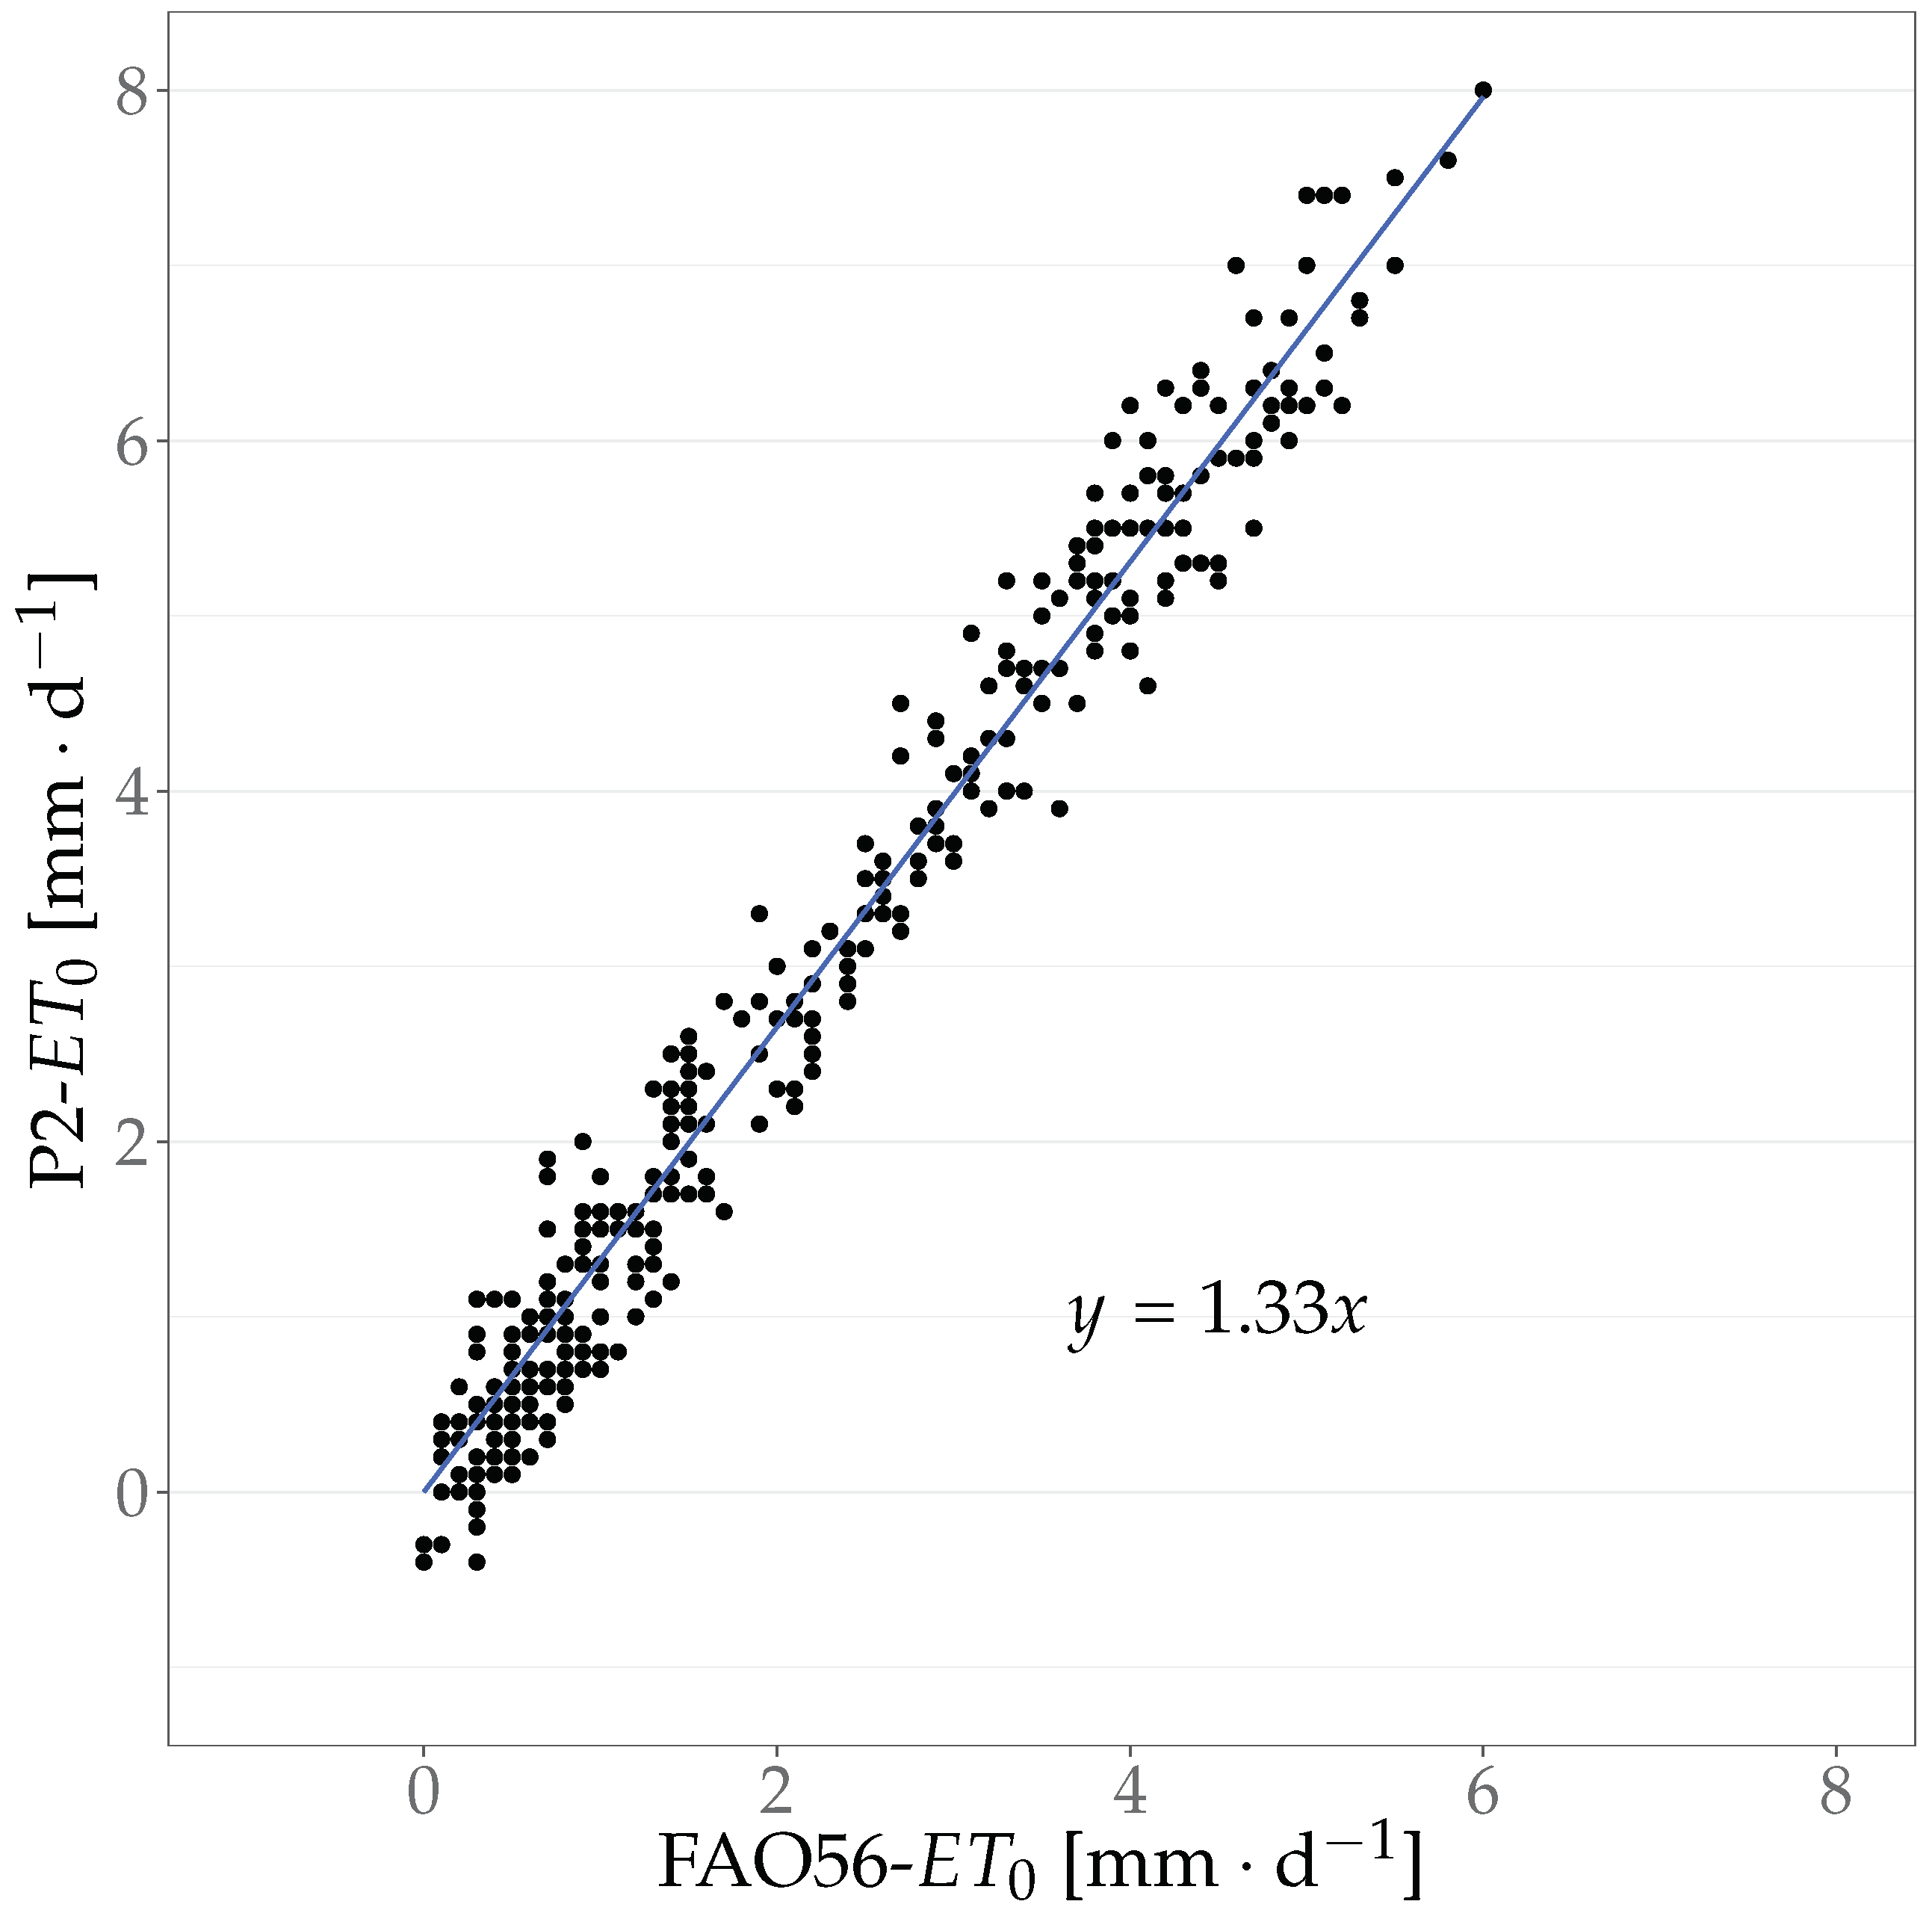
Figure 2.
Residuals () versus predicted () plot of the regression model P2-∼: P2-- versus -. With the null line (black), residual mean (red line), and polynomial trend line of residuals (blue line, ).
Figure 2.
Residuals () versus predicted () plot of the regression model P2-∼: P2-- versus -. With the null line (black), residual mean (red line), and polynomial trend line of residuals (blue line, ).
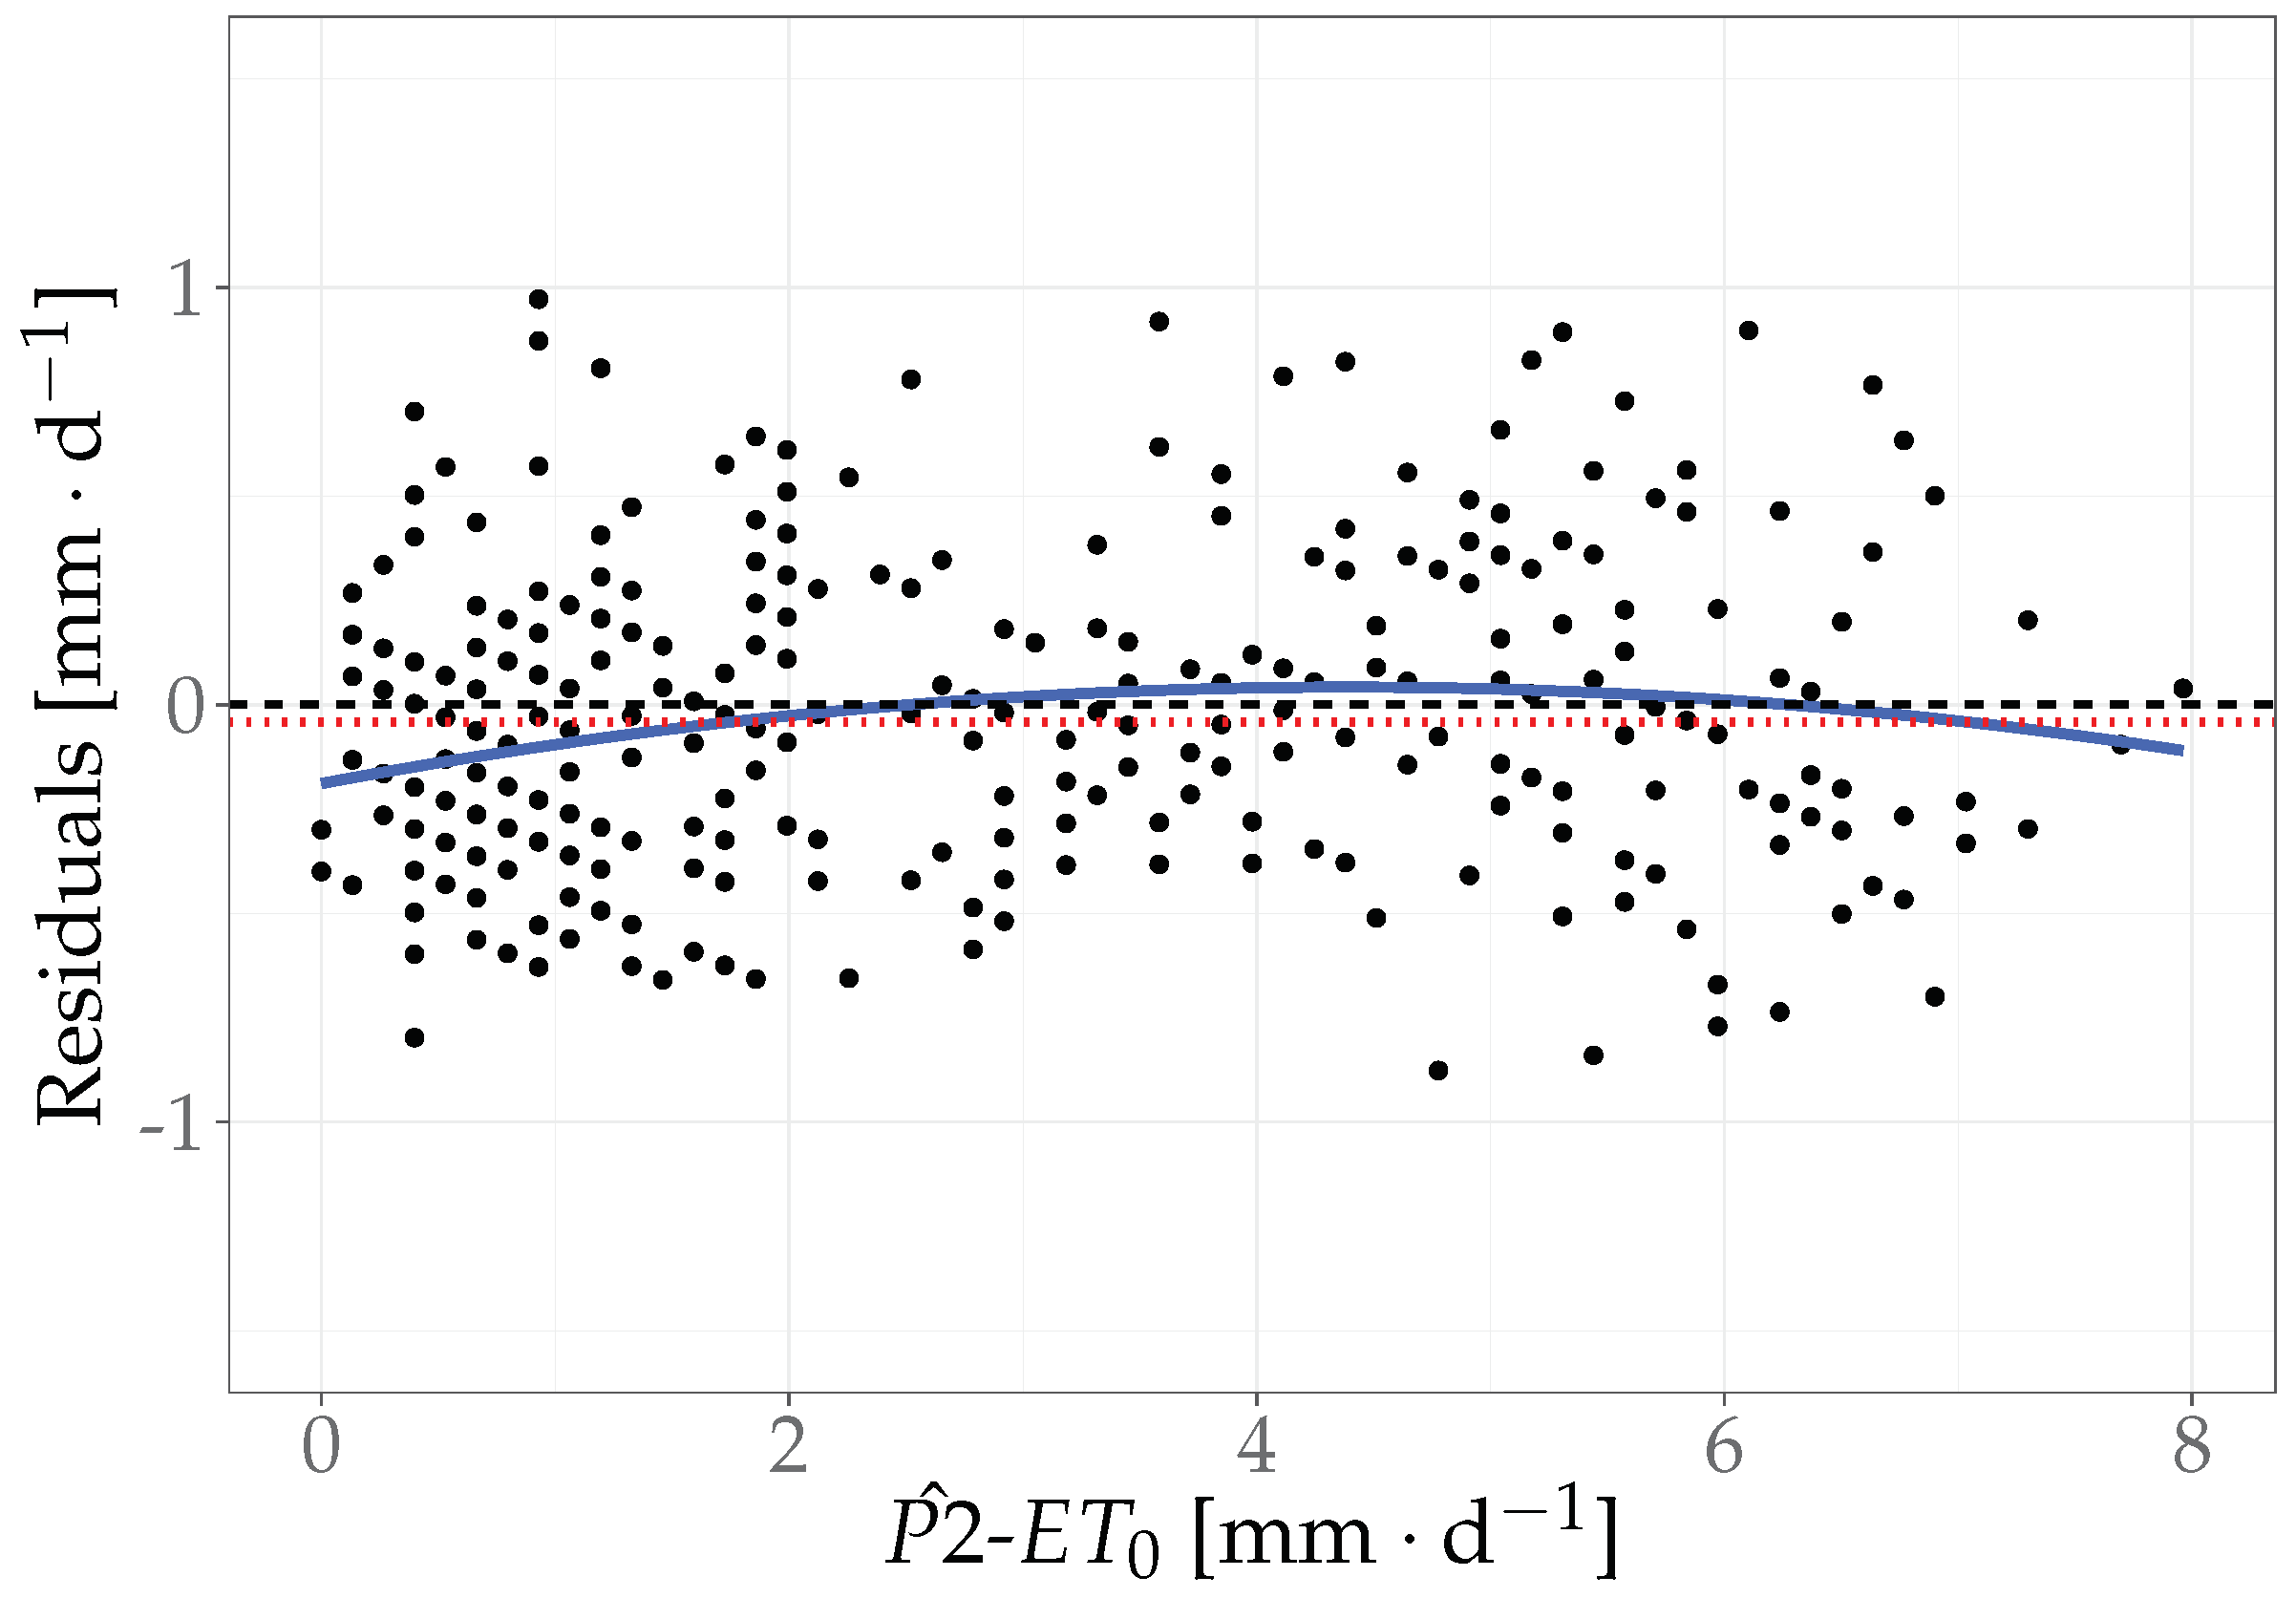
Figure 3.
Ranks of variable importance (%IncMSE), for the Random Forest Models P2- and FAO56-, using weather data of the years 2000–2009 (Explanation of parameters in Table 1).
Figure 3.
Ranks of variable importance (%IncMSE), for the Random Forest Models P2- and FAO56-, using weather data of the years 2000–2009 (Explanation of parameters in Table 1).
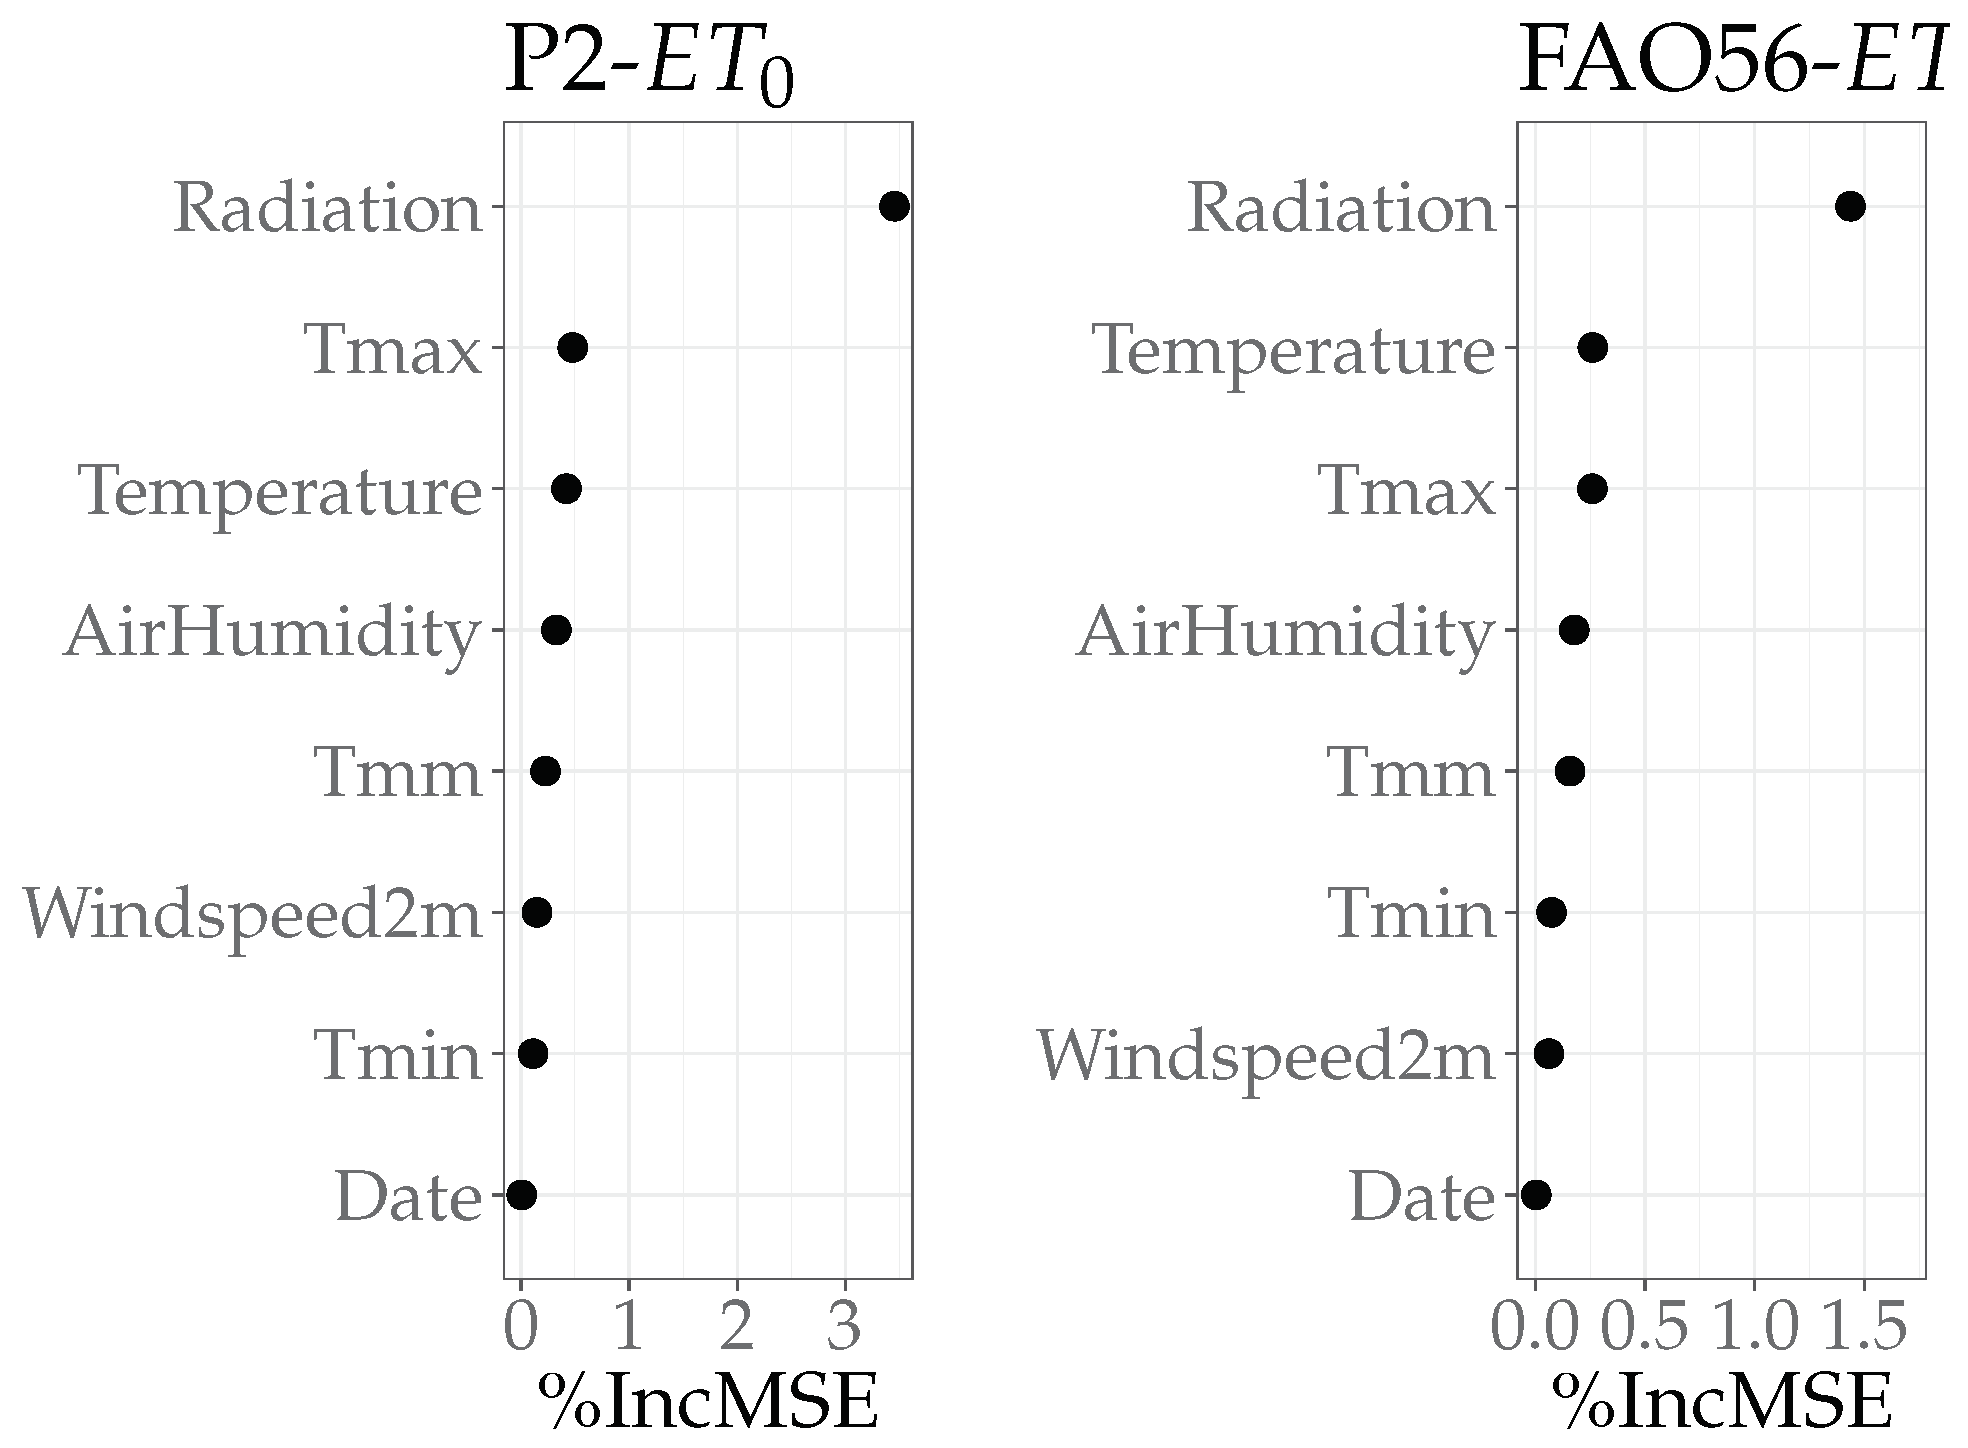
Figure 4.
() predicted by global radiation (), based on functions of random forest models for P2- and FAO56-. The shaded box marks a similar the sudden rise of both s in response to the global radiation.
Figure 4.
() predicted by global radiation (), based on functions of random forest models for P2- and FAO56-. The shaded box marks a similar the sudden rise of both s in response to the global radiation.
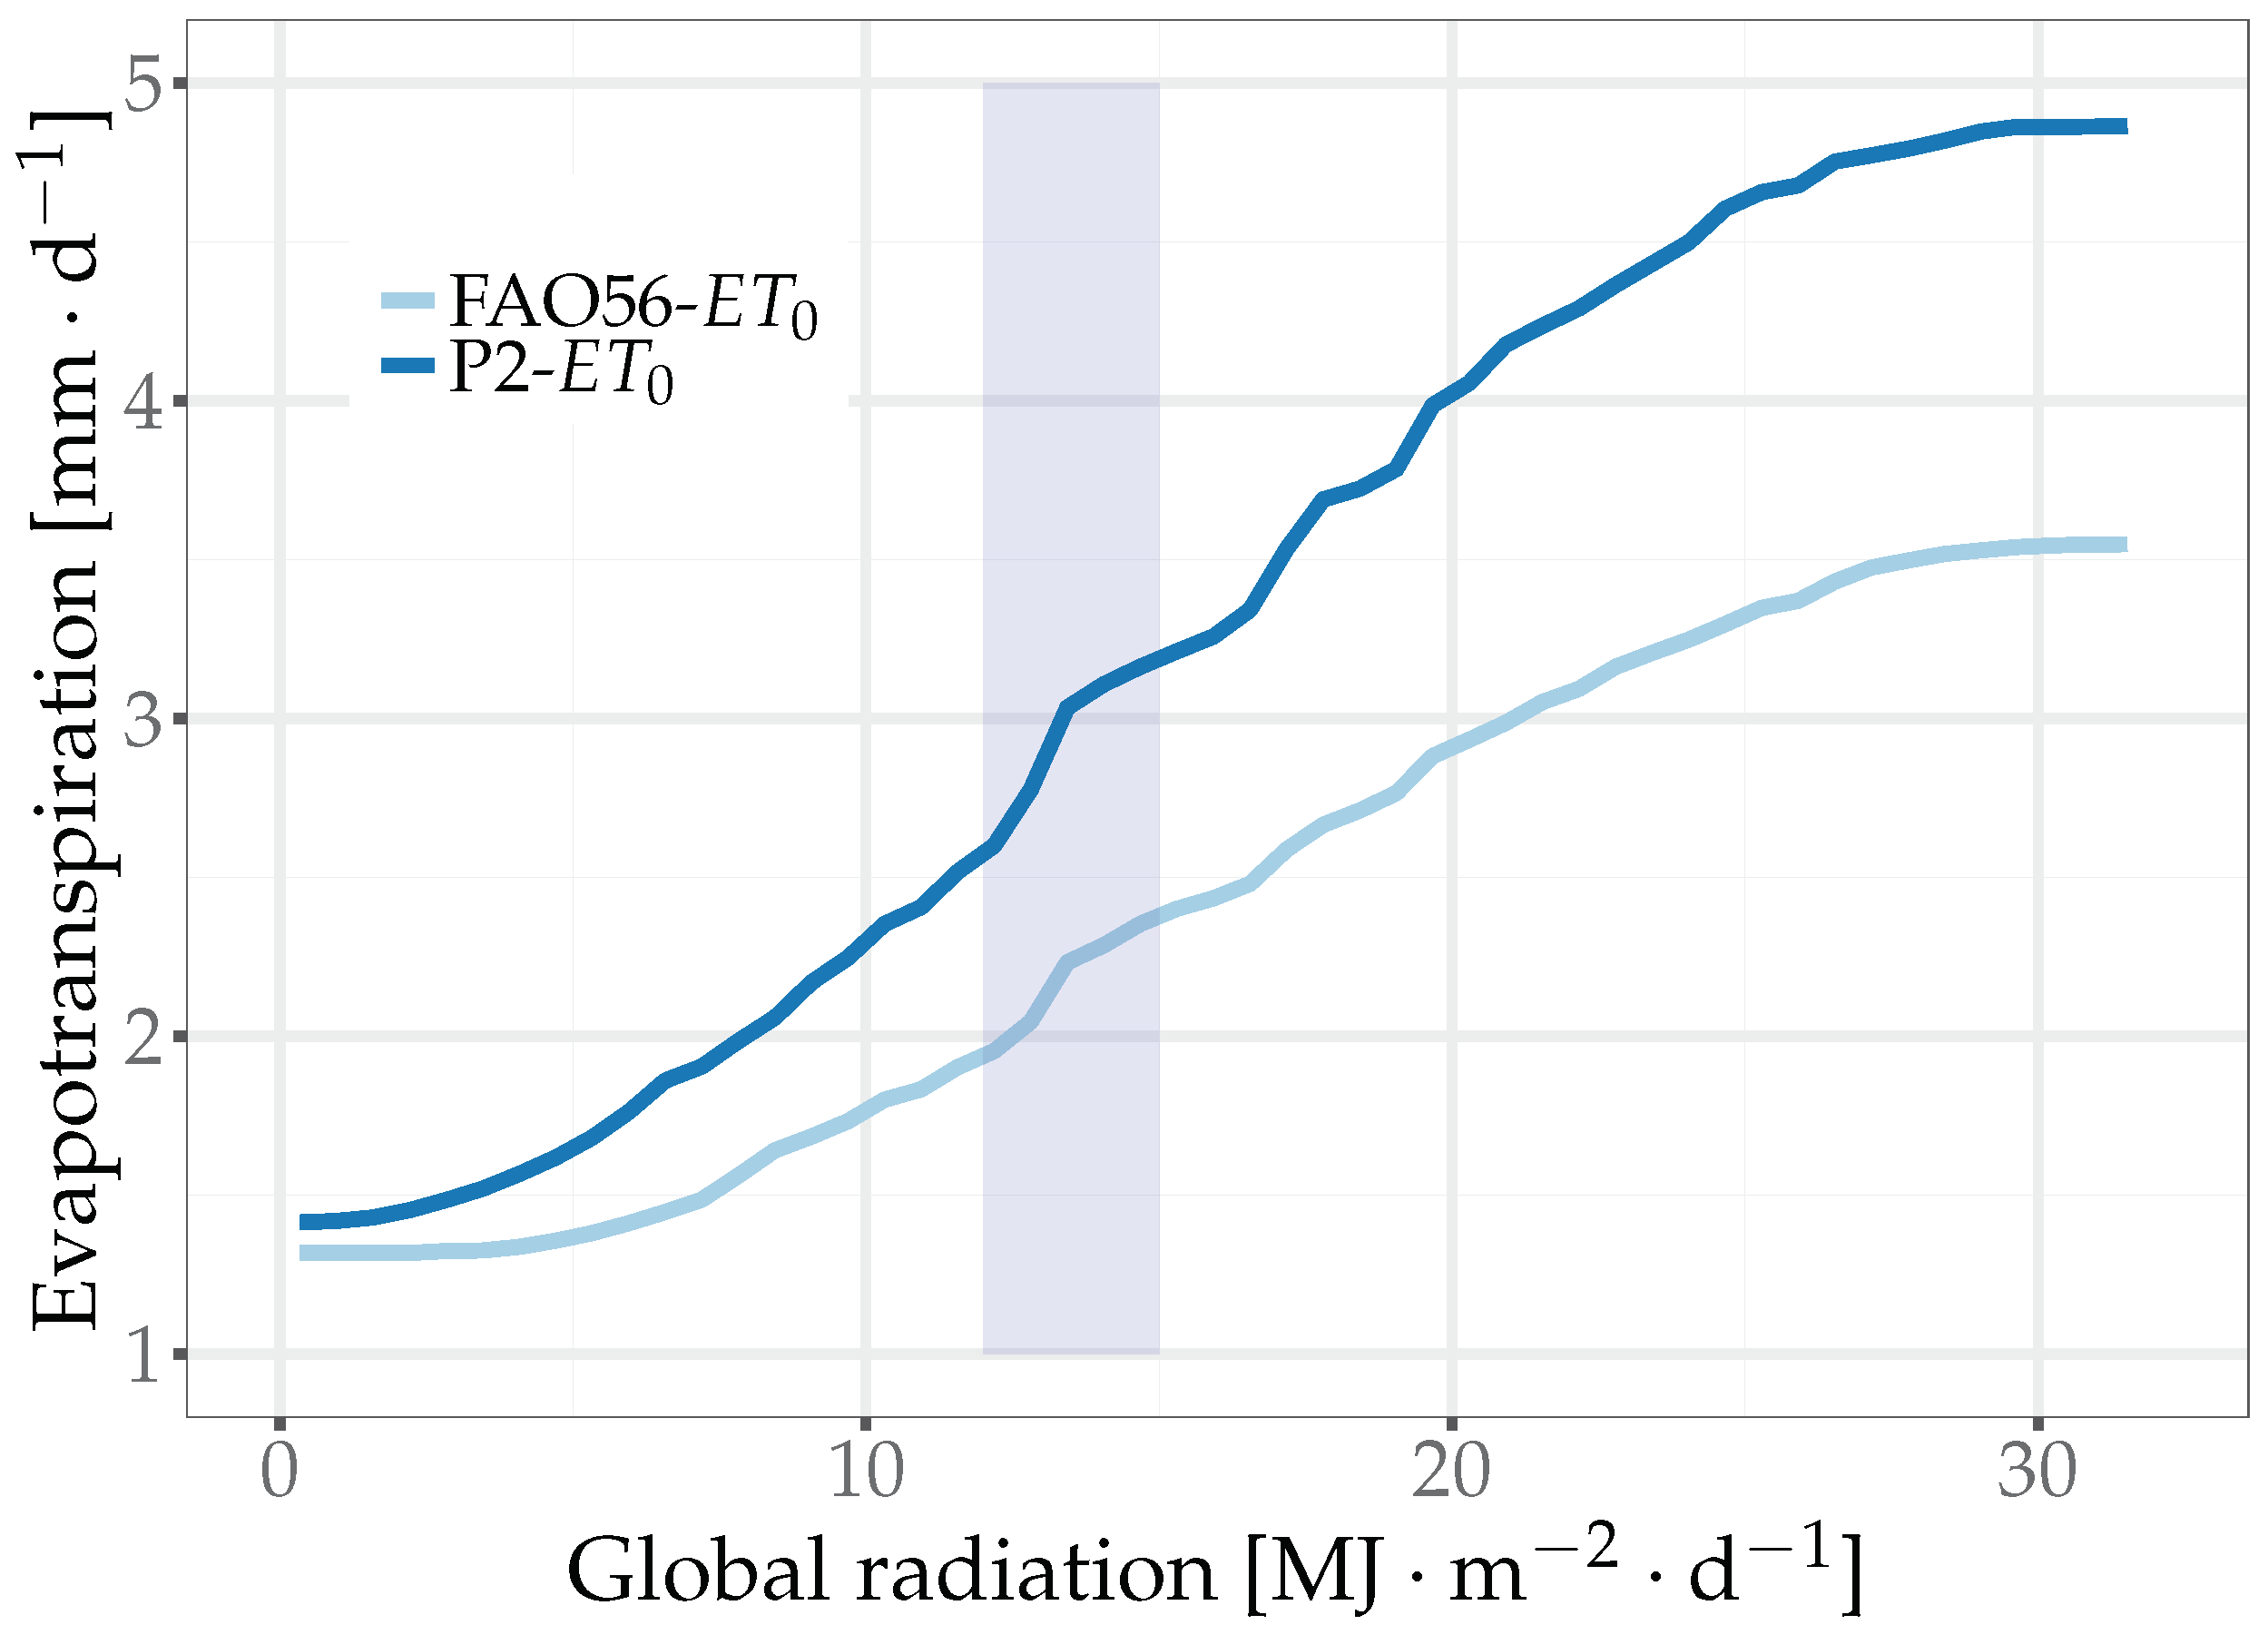
Figure 5.
Boxplot of relative irrigation water differences (IWD %), − , by GS simulations for the six vegetable crops. Black line = median, Boxes = second and third quantile, points = outliers.
Figure 5.
Boxplot of relative irrigation water differences (IWD %), − , by GS simulations for the six vegetable crops. Black line = median, Boxes = second and third quantile, points = outliers.
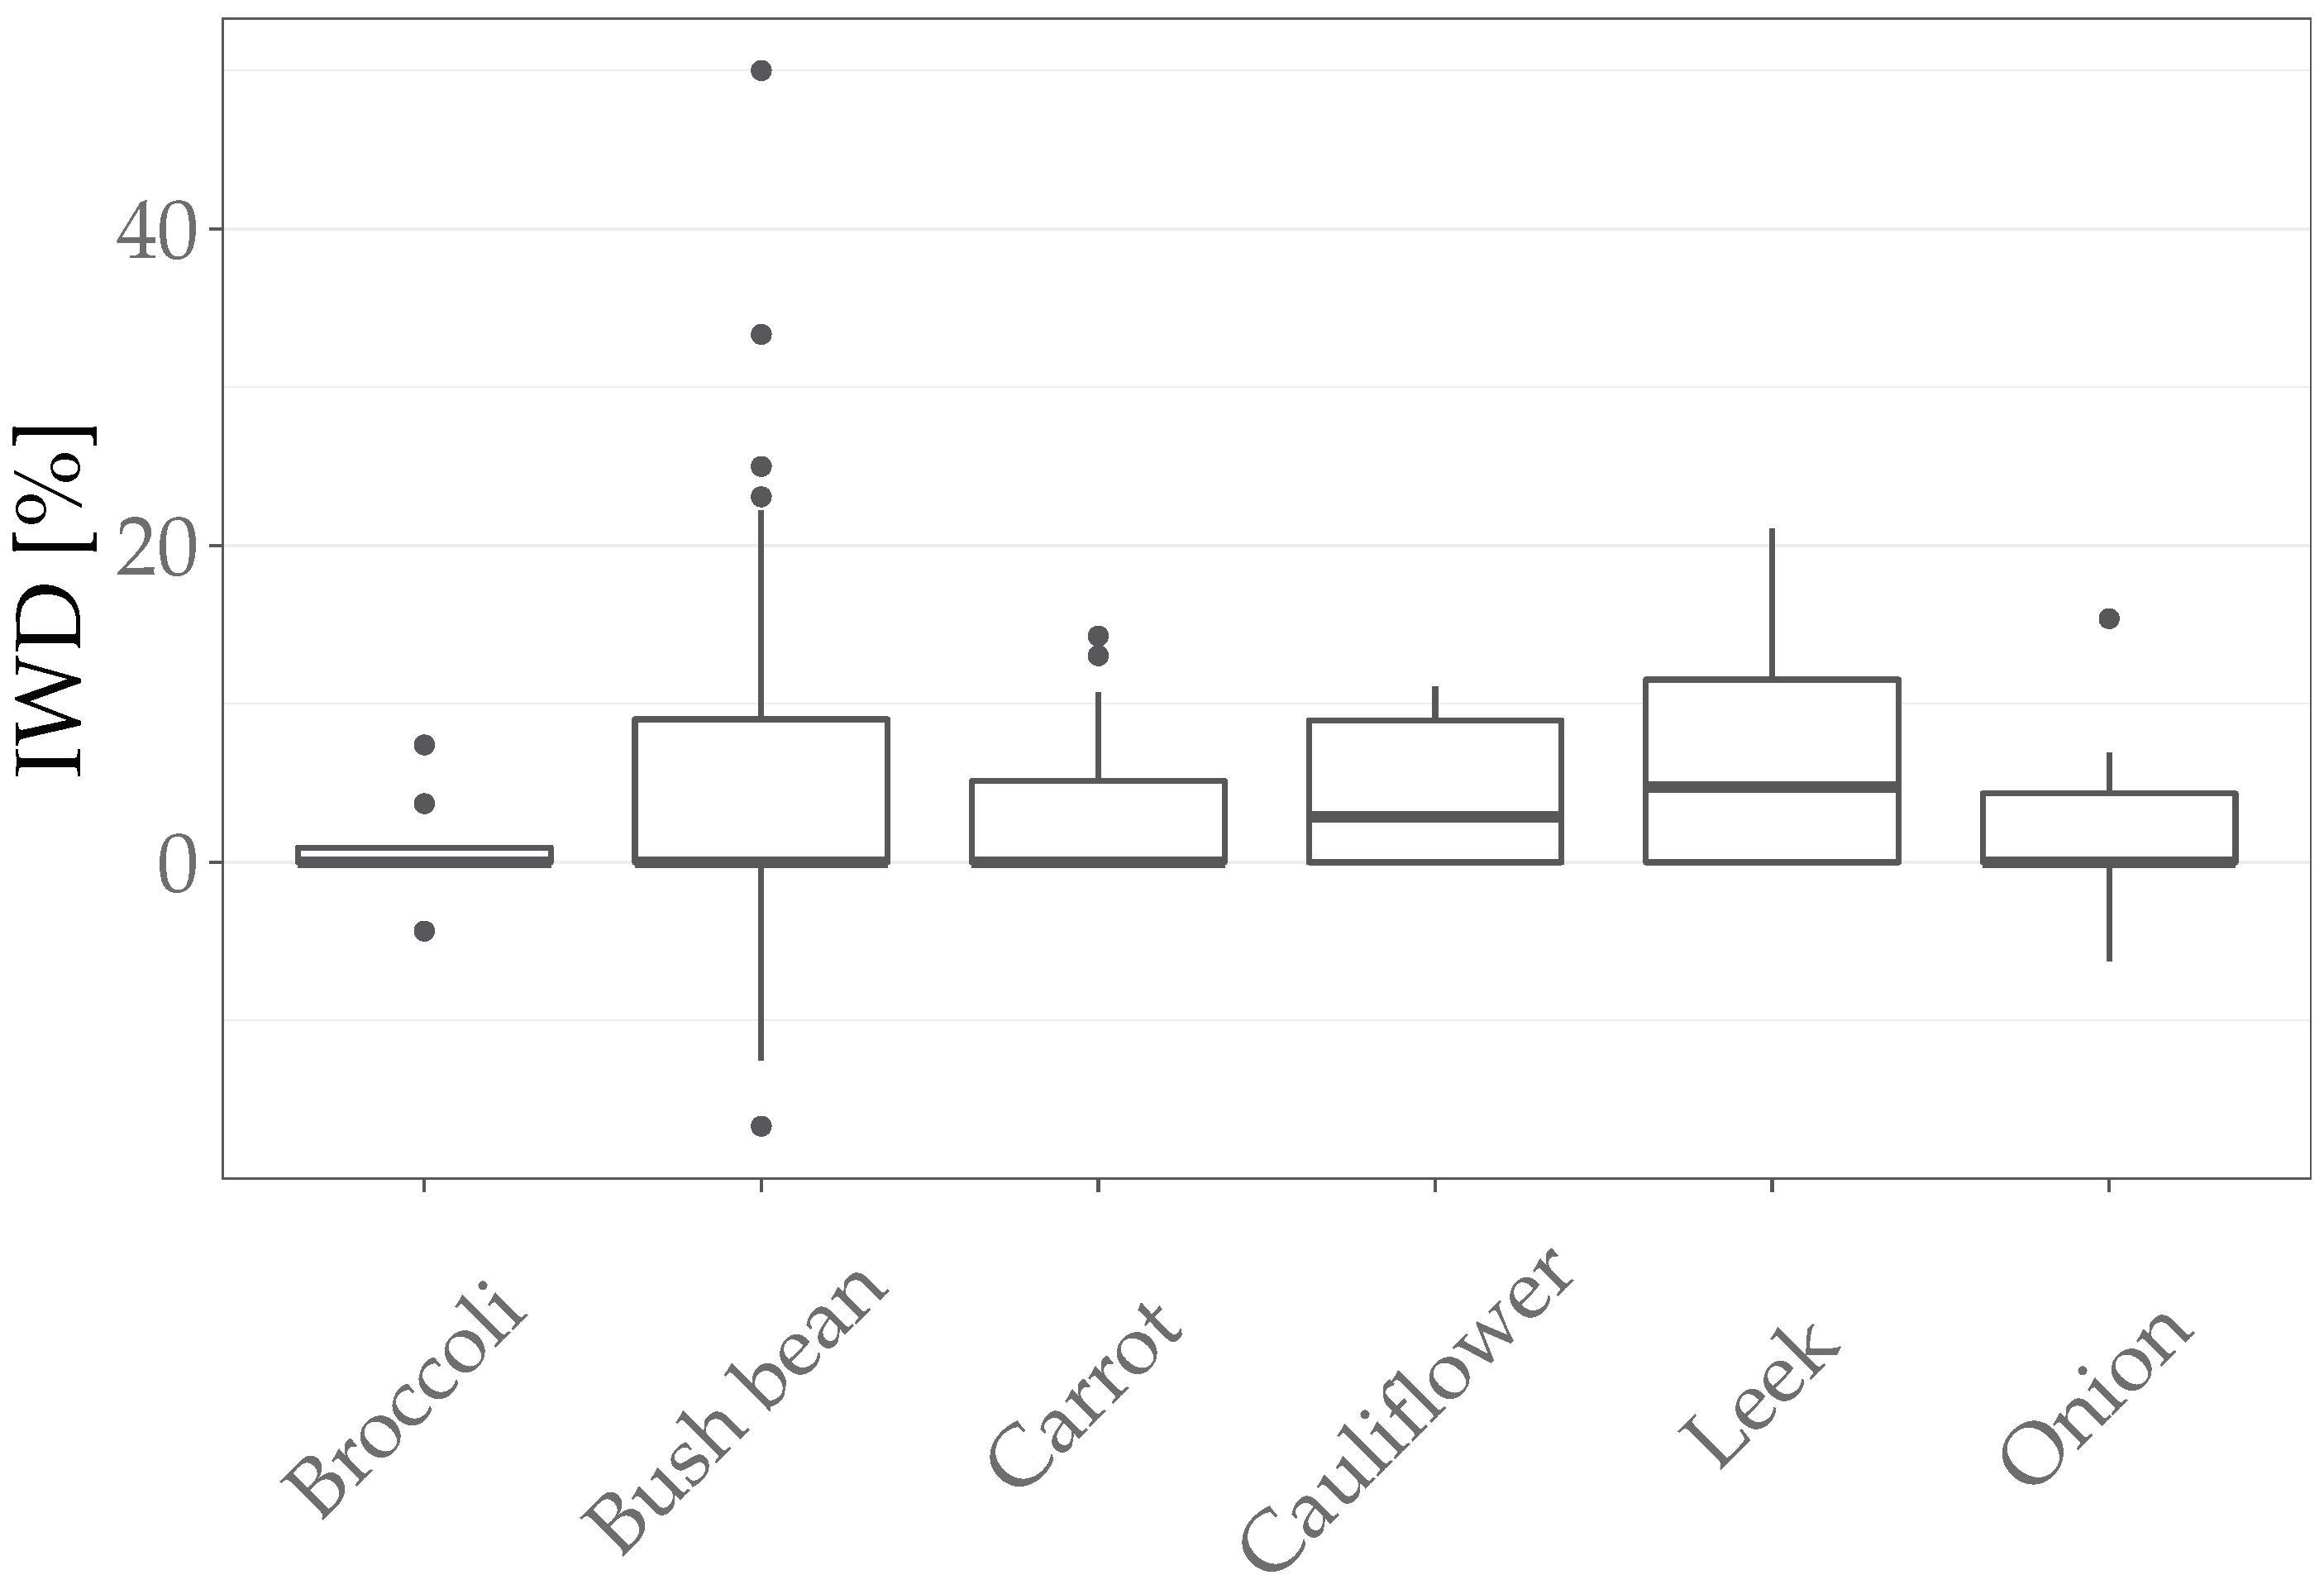
Figure 6.
Occurrence (%) of irrigation count differences, ICD, of relative to ( − ) as simulated using the six vegetable crops.
Figure 6.
Occurrence (%) of irrigation count differences, ICD, of relative to ( − ) as simulated using the six vegetable crops.

Table 1.
Overview of the daily weather data with units and abbreviations.
| Value | Abbreviation | Unit |
|---|---|---|
| Penman-P2- | P2- | |
| FAO56 Penman–Monteith- | FAO56- | |
| Temperature mean (24 h) | Temperature | |
| Temperature mean (max/min) | Tmm | |
| Temperature maxima | Tmax | |
| Temperature minima | Tmin | |
| Relative air humidity mean (24 h) | AirHumidity | % |
| Global radiation | Radiation | |
| Wind speed at 2 height mean (24 h) | Windspeed2m |
Table 2.
Simulation results comparing and (−) with mean irrigation water differences (%) (IWD), mean irrigation counts for both models (IC , IC ), and mean irrigation count differences (ICD) and their corresponding standard deviation.
Table 2.
Simulation results comparing and (−) with mean irrigation water differences (%) (IWD), mean irrigation counts for both models (IC , IC ), and mean irrigation count differences (ICD) and their corresponding standard deviation.
| Crop | IWD | ± | IC | ± | IC | ± | ICD | ± |
|---|---|---|---|---|---|---|---|---|
| Broccoli | 1.18 | 3.38 | 11.50 | 2.32 | 11.75 | 2.70 | 0.25 | 0.45 |
| Bush bean | 5.45 | 12.57 | 7.46 | 1.80 | 7.75 | 1.86 | 0.29 | 0.46 |
| Carrot | 2.84 | 4.19 | 15.98 | 3.83 | 16.36 | 4.01 | 0.39 | 0.54 |
| Cauliflower | 4.03 | 4.32 | 16.78 | 1.82 | 17.44 | 2.10 | 0.67 | 0.63 |
| Leek | 6.76 | 7.14 | 17.00 | 5.36 | 17.76 | 5.54 | 0.76 | 0.70 |
| Onion | 1.87 | 5.88 | 17.25 | 4.58 | 17.58 | 4.74 | 0.33 | 0.65 |
© 2018 by the authors. Licensee MDPI, Basel, Switzerland. This article is an open access article distributed under the terms and conditions of the Creative Commons Attribution (CC BY) license (http://creativecommons.org/licenses/by/4.0/).
Share and Cite
MDPI and ACS Style
Olberz, M.; Kahlen, K.; Zinkernagel, J. Assessing the Impact of Reference Evapotranspiration Models on Decision Support Systems for Irrigation. Horticulturae 2018, 4, 49. https://doi.org/10.3390/horticulturae4040049
AMA Style
Olberz M, Kahlen K, Zinkernagel J. Assessing the Impact of Reference Evapotranspiration Models on Decision Support Systems for Irrigation. Horticulturae. 2018; 4(4):49. https://doi.org/10.3390/horticulturae4040049
Chicago/Turabian StyleOlberz, Matthias, Katrin Kahlen, and Jana Zinkernagel. 2018. "Assessing the Impact of Reference Evapotranspiration Models on Decision Support Systems for Irrigation" Horticulturae 4, no. 4: 49. https://doi.org/10.3390/horticulturae4040049
Note that from the first issue of 2016, this journal uses article numbers instead of page numbers. See further details here.