Abstract
Water use and the cost of water are key factors when considering the net value of urban agriculture (UA). This systematic review critically evaluates past and recent UA yield research from the perspective of water use efficiency. A systematic literature search was conducted using the databases Scopus, ProQuest Agriculture and Environment, and Web of Science for references from 1975 to 2018, with 25 articles meeting the inclusion criteria. Of these, only five articles had actively collected UA water use data, all on purpose-built experimental gardens. Considering the scarcity of UA water use efficiency and water measurement literature, South Australia is presented as a case study to demonstrate the considerable diversity of water pricing, water sources and irrigation methods available to urban food growers. The practical challenges of garden placement and the wide variety of cultivation techniques, water sources and irrigation methods are reviewed. Four equations to calculate the water use efficiency (WUE) of UA are proposed and demonstrated. Collection of additional UA water use data would support more robust evaluations of the water use efficiency and economic implications of different cultivation techniques. Further work in this field will enable a realistic understanding of the current and future contribution of UA to our society.
1. Introduction
The production of food in urban environments, also known as urban agriculture (UA), has a number of positive benefits for those who grow some of their own food, including: supporting urban food security and re-connecting people with their food systems [1,2], encouraging positive dietary changes leading to better health [3,4], and supporting mental wellbeing through connection to nature [5,6]. Some UA produce has also been found to be fresher and more nutritious than produce trucked in from interstate or flown in from overseas [7,8]. While the research on UA has been diverse and informative, researchers have rarely taken into consideration some of the more practical and applied questions which underpin the viability of UA, namely:
- How efficiently does existing UA use the resources it requires?
- What is the productivity of existing urban food gardens?
- Does growing food in urban areas save people money?
This lack of research is concerning. As the world population continues to grow, so too does the demand for research into more efficient use of resources [9]. Scarcities of fresh water, fertile topsoil and fertiliser reserves are already serious issues for many parts of the world [10]. These issues are likely to become exacerbated in some regions by the impacts of climate change [11]. The combination of limited resources, a growing population and climate change has the potential to contribute to an increase in food prices [11,12]. In an attempt to mitigate such impacts, some consideration has been given as to whether technological advances can increase the productivity of UA to sufficiently supplement produce requirements of cities and other urban centres [13,14]. However, with no data on the input requirements, resource efficiency or productivity of existing UA, there is currently no baseline to improve upon. In particular, measurement of the water used by UA has been habitually overlooked, even within research on UA yields [15].
The water use of UA plays a vital part in answering all three of the practical questions listed above. Water is a fundamental and limiting resource in UA, yet there is little scientifically-collected data on the water use efficiency (WUE) of existing cultivation techniques used, nor a strong awareness of how much water people apply to their food gardens [13,14]. WUE is a measure of how efficiently production systems convert water (rainfall and/or irrigation) into a harvestable yield or into money. More efficient production systems work to lower the volume of water inputted while ensuring or improving the harvestable quantities. Calculations of the productivity of UA must account for the volume of water required to grow that produce, in addition to its cost. Rising water costs (of water suitable and available for food production) could limit future uptake of UA. Indeed, for many people the cost of water may already be a limiting factor, albeit a hidden one. In South Australia, for example, land blocks typically possess a single residential water meter to record combined indoor and outdoor water use [15]. By combining the indoor and outdoor water use into one metered bill, residents are unlikely to be aware of the volume or cost of water being applied to their food gardens.
This paper has two parts. We first present a systematic review of past UA WUE research with a focus on water use measurement. Such a review is necessary as only a limited number of past reviews have discussed the importance of considering UA water use and to some extent, available water sources [13,14,16,17]. No existing review has focussed on the challenge of measuring UA water use. How can the WUE of different UA cultivation techniques be compared (or indeed UA WUE compared with commercial horticulture) if there is little empirically collected data to base it upon? This systematic review aims to clearly highlight the lack of empirical UA WUE and water use measurement research.
Due to the small number of eligible articles identified which reported physically measuring UA water use, the second part of this paper introduces South Australia as a demonstration of the practical difficulty of measuring UA water use. Adelaide, the capital of South Australia, is known for its mostly arid and semi-arid climates climate, dependency on multiple water supplies and history of recycled water schemes [18]. A comparison of South Australia’s agricultural and urban water sources is provided, in addition to an overview of the range of household urban irrigation methods. Each of the main urban water sources for gardening are covered in detail, then the difficulty of measuring UA water use is assessed. The complementary approaches of the review and case study demonstrate that there is a crucial need for the collection of baseline data on the input requirements, resource efficiency and productivity of urban food gardens as they currently exist. The absence of UA water data necessitates the development of practical methods of measuring the water use of existing UA. A South Australian project is presented as one example of current research into UA water use measurement. Once enough baseline data has been collected and analysed, research can then begin into how to improve the WUE of various UA cultivation techniques.
2. Materials and Methods
The systematic review was conducted following the PRISMA Statement [19]. The literature search was finalised in June 2018. It focused on any studies conducted from 1975 to April 2018. This extended timeframe was applied due to the limited number of eligible papers expected, in addition to the authors’ prior knowledge of seminal research from the late 1970s onwards. The search was restricted to studies conducted within the 51 countries categorised as having “Very High Human Development” by the United Nations Development Programme in their 2016 report [20]. For the systematic literature search, three databases, Scopus, ProQuest Agriculture and Environment, and Web of Science were selected. Both Scopus and Web of Science are large collections of mainstream, indexed research, widely used in PRISMA systematic reviews. The ProQuest Agriculture and Environment Database was also included due to its particular focus on agricultural and environmental research. As a review of the WUE of UA which requires both harvested yield and water use figures, the search for articles required two related but separate searches. The first search focussed on identifying any urban agriculture-type studies which specifically investigated or measured water-related inputs. We searched for articles published in English since 1975 which included the following keywords in their title or abstract: (“urban agriculture” OR “urban food production” OR “home food garden” OR “community garden” AND water AND (measurement OR efficiency OR consumption OR supply OR management OR source).
The second search focussed on identifying any urban agriculture-type studies focussed on yields, harvests and/or the economic value of the crops produced. We searched the same three databases for articles published in English since 1975 which included the following combination of keywords in their title or abstract: (“urban agriculture” OR “home food garden” OR “community garden” OR “urban food production” OR “home vegetable garden*” OR “home garden” OR “urban garden” OR “urban collective garden”) AND (“economic value” OR empirical OR cost* OR saving* OR quantify* OR yield* OR harvest* OR product*).
From the three databases, only articles that were available to the authors in full text were considered. As part of the selection process we first reviewed each study’s title and abstract. The articles themselves were then screened according to their full texts and searched for descriptions, references or methods of empirical UA measurements of water, yield or economic value.
3. Results
Study Selection
The electronic database search resulted in n = 1665, 2189 and 475 hits from Scopus, ProQuest Agriculture and Environment, and Web of Science, respectively (Figure 1). From these, 134 duplicates were removed. A total of 3987 articles were excluded based on their title and abstract. As a result, 210 full texts were reviewed in detail and assessed for eligibility with 25 articles finally selected for inclusion in this systematic review.
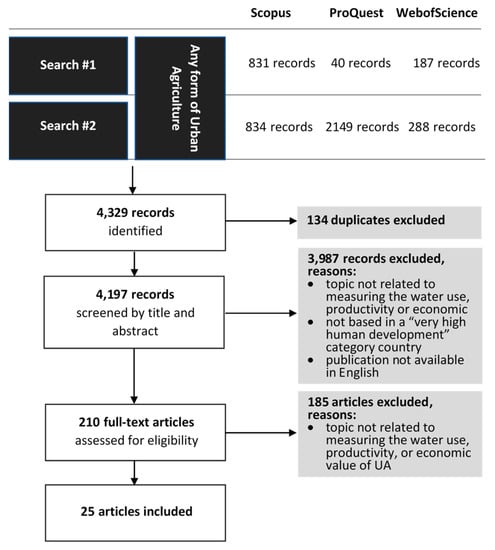
Figure 1.
PRISMA flowchart outlining the systematic literature review selection process of articles published between 1975 and April 2018, sourced from three databases: Scopus, ProQuest Environment and Agriculture and Web of Science.
The lack of consistent keywords used in research related to UA necessitated the broad selection of keywords used. Naturally, such a broad search resulted in a large list of hits, many of which were irrelevant, hence the large number of articles excluded. Examples of some of the article topics considered irrelevant for this systematic review included mentions of UA related ecosystem services, soil chemistry or contamination, GIS spatial assessments of land available for UA in cities and any discussion of biofuel production from food or food-waste products.
An interesting exception to the articles found by the systematic review process are three quite relevant articles published in non-indexed journals, or as “grey-literature” reports. These articles include: Gittleman et al. [21] and Vitiello et al. [22,23]. Another two articles not found by the systematic review but nevertheless included by the authors, are the work by Stall [24] titled, “Economic value of a home vegetable garden in South Florida” and Stephens et al. [25] titled, “Economic value of vegetables grown in North Florida Gardens”. Both are papers published in ‘Proceedings of the Florida State Horticultural Society’ and both are heavily referenced by the other early UA research from the 1970s and 80s. These five additional articles were included in this review due to their high relevance and common citation by other included articles, thus bringing the number of selected articles up to 30.
Of the 30 articles selected for this review, only five collected UA water use data (Table 1). Table 1 categorises all the articles by UA type, publication type and by their level of water data consideration.

Table 1.
Categorisation of all studies to respective types and level of water data consideration.
4. Discussion of the Systematic Review
4.1. Existing WUE in UA Research
Little is known about WUE in UA [15]. There has been a paucity of research in this area, despite the prevalence and increasing popularity of UA [47]. When compared with commercial horticulture, the irrigation applications and water consumption of UA production differ in several ways, including the size of land under production, the growing methods used, crop choices and planting arrangements. The majority of UA gardens support diverse polycultures instead of the more traditional monoculture crops of commercial horticulture and farming [15]. Different crops have different water requirements, so overwatering is common in polyculture situations [15]. Considering that both over and under watering can impact plant growth and therefore yield [48], there is limited utility in applying average commercial yield rates to UA gardens.
Studies investigating the economic costs and benefits of urban food gardens began appearing from the USA in the late 1970s [24,25,27,33]. In these studies, experimental gardens were constructed to measure the input costs and calculate the retail value (and other values) of the produce harvested. Stall [24] did not attempt to measure water use or the cost of the water applied to their study garden. Utzinger and Connolly [33] and Stephens et al. [25] recorded their water costs but did not record the volume of water used as an input.
Although water is one of the primary constraints of all plant growth [48,49], historically it has not been considered an expensive input [48], and so potentially not an input worth measuring. Cleveland et al. [27] were the first researchers to purposely measure and consider the volume of water applied as an input separate to cost. Being based in the urban desert environment of Arizona, they were interested in whether it was economically feasible for home gardeners to grow fresh, cheap produce in their area. Two gardens were built and, over periods of 2.5 and 3 years, all garden-related costs were recorded, including straw mulch, manure, tools, water and labour. Every water application was measured (to nearest 0.1 cubic feet) using a standard water meter provided by the utility, with calibrated buckets used for small volumes. Rainfall and evapotranspiration rates were also recorded. Water was found to be the single largest expense, contributing almost 30% of the total cost of each garden. The act of watering by hand took approximately 50% of the total hours spent. Cleveland et al. [27] found that small financial savings could be made by producing food using their methods, albeit at a lower returns per hour of labour than the minimum wage of the time.
These initial studies looked at the economic feasibility of urban food gardens for various USA States, and all collected data from purpose-built experimental gardens. Such experimental gardens may mimic a typical home food garden, but they differ in that they were designed, built and tended by scientists and not by everyday gardeners. Records from existing home food gardens would provide more realistic results and a greater understanding of the variability among gardens. Some urban food gardeners do keep yield records; however, such records are private and not often made public [15].
More recent studies interested in quantifying urban food gardens have tended to collect data from existing home and community gardens, rather than building experimental gardens [21,22,23,26,28,29,34,35,38,39]. There are exceptions to this shift, with studies identified in the systematic review that instead focus on technical assessments of particular cultivation techniques, including investigations into the yields (among other factors) of raingardens [41], integrated rooftop greenhouses [40,42], sub-irrigated planters [32] and other high-tech cultivation techniques [43]. Each of these studies designed, built, managed and collected data from their own experimental urban food gardens. The foci of these more recent studies were the measurement of yields, retail value calculations, and some full life-cycle or environmental assessments. However, similarly to the earlier studies, only four of the sixteen more recent studies measured or reported water use as an input: Sanyé-Mengual et al. [43], Richards et al. [41], Algert et al. [26] and Sanjuan-Delmás et al. [42].
Sanyé-Mengual et al. [43] conducted a life-cycle assessment of purpose-built experimental rooftop gardens from an environmental and economic perspective in Bologna, Italy. Using only mains water, they compared the water depletion as part of experimental trials of three cultivation techniques: nutrient film, floating hydroponic and raised soil garden bed. There was no mention of how the water applied was measured, although there was a description of using timers to control the application of set volumes of water. Sanyé-Mengual et al. [43] found the floating hydroponic system to be the most water efficient of their three cultivation techniques.
Around the same time (2015), Richards et al. [41] ran an 18-month field trial in Melbourne, Australia to test the yield productivity, irrigation requirements and runoff capture of experimental vegetable raingardens (these are garden areas designed to slow down and absorb excess rain and stormwater). Such gardens are typically planted with tough plants able to withstand both flood and drought conditions—this makes attempting to grow vegetables in a raingarden an interesting choice. Four raised vegetable beds were built. Two of the beds were irrigated only via surface micro-spray irrigation (one with mains water and one with collected rainwater). The other two beds (one lined and one not) were sub-irrigated by rainwater via connected downpipes. The water sources, irrigation methods, volume of water applied and irrigation requirements of all four beds were measured, yet the measurement method was not described. Although the lined raingarden bed was found to be the least productive yield-wise, it was still found to reduce the volume and frequency of runoff and did not require supplementary watering during summer.
The study by Algert et al. [26] investigated the contribution of home gardens to cost savings and improved nutrition for low-income households in San Jose, CA, USA. Participants of the La Mesa Verde Project were provided with two raised garden beds to take home and set up; each bed was 3 m2 and included soil, seedlings and seeds. Eight gardeners agreed to weigh their harvested produce for the 17-week study period and four of those gardeners also agreed to measure and record their water use. Water meters were attached to dedicated backyard hoses (it was not noted whether those taps were mains water or not). The gardeners recorded the volume of water used (in gallons) in an irrigation log each time they watered their garden. The cost of the water was calculated according to local water company prices and was found to have an estimated cost of US$2.96 per month, per garden. No WUE calculations or comparative analyses with the productivity of the gardens were made.
More recently, Sanjuan-Delmás et al. [42] conducted an assessment of experimental integrated rooftop greenhouses, also known as i-RTGs, in Barcelona, Spain. The enclosed rooftop of a research centre was retrofitted to incorporate four greenhouses. This integrated arrangement was thought to provide benefits to both the productive plants and the building itself, such as improved temperatures in both summer and winter. The building had an existing rainwater harvesting system, utilised to provide the majority of the water for the greenhouses (80–90%), supplemented by mains water (10–20%). Tomato plants were grown hydroponically over 15 months, and spring and winter tomato crops were compared. Sanjuan-Delmás et al. [42] also compared the WUE of their i-RTG tomato crops with those of standard greenhouses and found that the standard greenhouses performed better in both summer and winter.
Although there has been a variety of UA yield research undertaken, the five studies which did measure and collect water use data have done so using purpose-built, experimental gardens. The study by Sanjuan-Delmás et al. [42] was the only one of the five studies to actually calculate the WUE of their experimental rooftop greenhouses, which they defined as, “the water consumed for irrigation per unit of produce” (p. 332). We found no recorded attempt to collect any WUE data on existing urban food gardens, such as those created and managed by home gardeners.
4.2. Theoretical Modelling of UA
One alternative approach to physically measuring water use is theoretical modelling using crop water use figures from commercial horticulture. In Italy, Lupia and Pulighe [30] investigated the water management activities of residential kitchen gardens in Rome. They conducted a theoretical geospatial analysis of various UA land uses (classified as: horticulture, vineyards, olive groves, orchards and mixed crops), together with commercial irrigation data. Lupia and Pulighe [30] considered three local water sources (mains, well water and canal water), in combination with two irrigation systems (surface and localised drip irrigation). They concluded that the use of rainwater, coupled with high-efficiency irrigation, could reduce the need for additional water sources, the competition for mains water and the use of potentially contaminated canal water.
In Australia, Ward et al. [15] simulated a watering regime considered typical of urban irrigation for a polyculture UA garden. The research was concerned with the potential rise in demand for mains water if UA production increased substantially. When comparing various Australian capital cities (Adelaide, Melbourne, Hobart and Perth), Ward et al. [15] found Adelaide to have the highest irrigation water cost for a hypothetical urban food garden delivering approximately 25% self-sufficiency in fruit and vegetables. This high cost was due to a combination of high price and high crop water demand due to low summer rainfall and high evapotranspiration rates. The researchers concluded, “…it is questionable whether garden produce grown in Adelaide could compete with retail prices”. More recent research by Ward and Symons [50] used linear programming to optimise the net value of urban agriculture with regards to water applied, area utilised per person, and crop selection to provide a reasonable representation of dietary food groups. Although considering garden area sizes from 1 m2/person to 200 m2/person, the optimal size for water applied per unit area and the net value returned per kL of water applied was between 10 and 20 m2/person [50]. They concluded that, “even in a climate as dry as Adelaide with its high water prices, a modest food garden growing the right crops can theoretically be highly cost-effective, even with conservative estimates of crop yields and water use” [50].
4.3. Technological Advances in Automatic Irrigation Systems
Many existing automatic irrigation systems with built-in controllers to water whole gardens (or sections of gardens) lack flow meters to monitor the volume of water applied. However, irrigation typically occurs according to a specified schedule, meaning that gardeners can calculate the volume of water being applied by such a system if, for example, they know the number of dripper heads and the volume each head applies (noting, however, that many dripper heads offer a variable flow rate). Alternatively, gardeners could spend time optimising their irrigation system using their household water meter, running one irrigation sub-system at a time without any other water appliances operating, and thus inferring the volume of water applied per hour. Neither option is simple, but if water cost becomes prohibitive to urban gardening these options do at least exist.
Recent improvements in sensor technology for commercial horticultural irrigation systems have had flow-on effects for home garden automatic irrigation systems. Such systems can now use local rainfall tracking, evapotranspiration rates and soil moisture monitoring, together with smarter web and smartphone applications [51]. One example of such an improved home watering system is that of the manufacturing company Nymet Pty Ltd. in Adelaide, South Australia. Their ‘WaterMe’ wireless irrigation controller enables people to not only split their gardens into distinct areas with individual watering regimes, but to also use a linked smartphone application allowing system monitoring and control while away from home [52]. There is an opportunity for the companies producing such automatic irrigation controllers to consider their potential application to assist management of urban food production, in addition to an opportunity for future research to make use of such technology.
4.4. The Need for Further Research
Regardless of the potential watering challenges, a small number of studies have reported UA yields in excess of the average yield rates of commercial horticulture [23,24,33]. However, given that none of these studies measured or reported their garden’s water use, it is entirely possible that UA may be less water efficient than traditional horticulture [15]. There is currently no scientifically-recorded data on the WUE of existing UA gardens. While there are some data available from the Australian Bureau of Statistics (ABS) [53], there are no comprehensive data on the water sources and irrigation techniques used specifically for home food production. Any attempt to calculate, measure and monitor the WUE of UA will have to account for a variety of water sources and irrigation methods. Further research into the water sources, application methods, and WUE of existing UA production is evidently required, especially with the recent rise in the levels of popularity and participation [47].
The initial sections of this article have highlighted the lack of empirical UA water use data and water use measurement research available. Consequently, the following sections of this article present South Australia as a case study example to help demonstrate the variety of urban water sources, water prices and irrigation methods available. Four variations on how to calculate the WAE of UA are proposed, before the practical difficulty of measuring UA yield and water use is assessed. To finish, a contemporary South Australian project currently undertaking UA water use measurement of existing home food gardens is introduced.
5. Case Study: Measuring the WUE of UA in South Australia
5.1. Water Use in South Australia
The state of South Australia (SA) has mostly arid and semi-arid climates, with the area surrounding the capital city Adelaide receiving an average rainfall of 545 mm per annum [54]. As residents of a dry state, people living in SA have been shown to use 20% less water per capita than the average Australian [55]. It has been suggested that Adelaide has much higher water requirements (per capita) than two of the nearest cities, Melbourne and Hobart in neighbouring states, due to low summer rainfall and high evapotranspiration rates [15].
Extreme weather events across Australia such as droughts, heatwaves, ocean storm surges and severe storms are also becoming more frequent and severe [11]. Such weather events can damage crops and horticultural infrastructure. For example, during late 2016 a severe spring storm demolished and flooded the main commercial market garden area of Adelaide. This destruction temporarily increased the price of fresh produce to as much as double and even triple the standard seasonal prices [56].
The largest consumer of water in SA is the agriculture industry, which in 2014–2015 used 69% of the state’s total water consumption [55]. South Australian agriculture uses groundwater as its main source (44%) of water, while the main source of water for Australian agriculture is from irrigation channels or pipelines (43%). Only a small volume of the water used for agriculture comes from the reticulated mains supply, 1% for Australia and 3% for SA [57]. Urban residents of SA water their gardens with reticulated mains water, rainwater, recycled-, grey- or storm-water, or bore water [53]. These water sources differ from those used by the agriculture industry, as among urban residents the main source of water for gardening is mains water (69%). Each of these urban water sources and their costs are discussed in further detail below.
5.1.1. Reticulated Mains Water
The price of mains water for SA residents is split into three tiers according to kilolitre use per quarter annum, with an additional quarterly water supply charge [58]. In 2011 the SA government announced that the price of mains water was going to increase by 26% to cover the costs of future water infrastructure investments. Such investments included construction of the Adelaide Desalination Plant (ADP), new pipe connections to northern and southern water supplies, and gaining additional temporary water entitlements from the Murray River [59]. Consequently, by 2011/12 residents were paying an average of $3.96/kL—this average is the tiered usage price combined with the quarterly water supply charge [58]. Figure 2 displays the widening gap in the average price of mains water between SA households and the Australian average from 2008 to 2015.
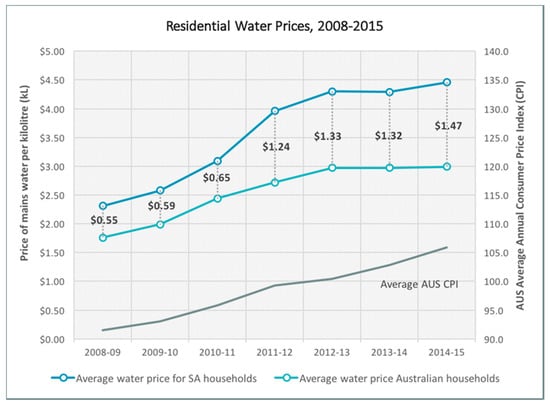
Figure 2.
Residential water prices, 2008–2015. The difference in price per kilolitre is shown in the centre data labels. Data sourced from Australian Bureau of Statistics (ABS) Report Water Account Australia 2014–2015, cat No. 4610.0 [60] and the ABS Report Consumer Price Index, Australia, September 2016, cat No. 6401.0 [61].
Since 2013–2014, SA residents have paid the highest price in Australia for urban distributed water [55]. In 2014/15, SA households paid an average of $4.46/kL (again a combination of tiered usage price and quarterly supply charge) [60]. As of July 2017 residential mains water prices were set at Tier 1 $2.32/kL; Tier 2 $3.30/kL; and Tier 3 $3.58/kL, with a quarterly supply charge of $73.10 [62]. A Water Regulatory Determination released by the Essential Services Commission of South Australia (ESCOSA), ensures that until June 2020, the price of mains water cannot rise more than the Consumer Price Index [63].
For the SA households using mains water (69%) on their gardens [53], their outdoor water use is currently inseparable from total residential water use. Each land block typically possesses a single residential water meter to record combined indoor and outdoor water use [15]. Urban food growers using mains water also pay a considerably higher price (Between $2.32/kL and $3.58/kL at 2017/18 prices) than their commercial agriculture counterparts, who pay only $0.09/kL [60].
5.1.2. Rainwater
While Adelaide is the driest capital city in Australia, it has the second highest take-up of household rainwater tanks (44.5%) in the country [53]. Regardless of the popularity of rainwater tanks in SA, there has been considerable discussion and disagreement over whether they truly are a financially viable option for household water supply. Research into their levelised cost (cost per kilolitre), cost effectiveness and reliability typically considers multiple variables, including: local rainfall, rainwater tank size, roof catchment area, and whether the water collected will be used only outdoors, or for a combination of outdoor and indoor use [64,65,66,67].
With such a wide range of roof catchment areas (50–250 m2), tank sizes (1–10 kL), tank lifespans (20–40 years), water usage regimes (outdoor only, indoor and outdoor use) and available rainwater harvest yields (10–156 kL) being used in Australian rainwater research, the conflicting results are unsurprising. As the price of South Australian mains water currently sits in the range of $2.32–$3.58/kL, the levelised cost of collected rainwater can be viewed as a competitive alternative ($1.70–$3.15/kL and $1.70–$2.34/kL respectively [64,67]), as a potential alternative ($2.05–$11.59/kL [66]), or as an unrealistic alternative water source ($12.08–$21.80/kL [65]), depending on the variables and calculations used.
Separate from roof runoff collected and stored in rainwater tanks, the soil itself has capacity to hold water in the upper layers. While growing food in in-ground garden beds is only one of many different cultivation techniques utilised by urban food growers, it is the one most able to take full advantage of this stored water. In his book, “Out of the Scientist’s Garden”, Stirzaker [68] describes his use of simple soil wetter front detectors (small funnels buried in the soil at different depths which indicate once water seeping through the ground has reached their depth) to monitor soil moisture in different parts of the garden. Stirzaker [68] takes this further with his innovative use of the soil as a surrogate rainwater tank. When it rains, and if the rainwater tanks are full, Stirzaker directs the overflow from his tanks to areas of his garden where he knows the soil water is below field capacity. In this way, the water that his existing tanks cannot hold is not wasted and he avoids the expense of additional rainwater tanks. It sounds ideal, but he does explain that such monitoring takes skill, experience and some equipment to apply.
5.1.3. Recycled Water: Wastewater, Greywater and Stormwater
Wastewater is effluent processed and treated to reduce its nutrient and organic content. After treatment it can be combined with or used in similar ways as treated stormwater [69]. The percentage of wastewater presently being reused is 56% (34% metropolitan and 22% country) [70]. Since 2011 the Christies Beach Wastewater Treatment Plant has supplied over 8000 households in Southern Adelaide with recycled water [62]. An example of another type of water re-use is in the Northern Adelaide suburb of Mawson Lakes. In Mawson Lakes, households have separate piping and meters built into their properties to provide treated stormwater, locally known as ‘purple piping’. This water comes from the City of Salisbury Aquifer Storage Program. It is mixed with treated wastewater from the SA Bolivar Treatment Works and is intended only for irrigation, gardens or toilet flushing. The price of recycled water is set at 90% of the tier 1 price for mains water, currently $2.08/kL [62].
Greywater is household wastewater from sinks, dishwashers, washing machines, showers and baths. In 2013, 5% of SA households stated their main water source for watering their garden was “greywater” [53]. It is unclear whether this water was diverted and collected via permanent greywater systems, or simply through manual collection by the household. SA Health (2016) require that untreated greywater be used only via subsurface irrigation systems and that the water be applied at a reasonable distance from buildings and all other water sources. The guidelines also state that, for health reasons, untreated greywater must not be used to water fruit or vegetable plants in South Australia [71].
South Australia is known for its harvesting and reuse of stormwater. There are eight main stormwater collection projects around Adelaide funded in part by the state government’s ‘Water For Good’ initiative. Currently, Adelaide has the capacity to harvest approximately 20 GL per annum [69]. This water can replace the use of drinking water for purposes such as greenspace irrigation, toilet flushing and agricultural irrigation. Theoretical research into future water use of UA in the cities of Adelaide, Melbourne, Hobart and Perth by Ward et al. (2014), considered whether surplus stormwater and recycled water currently harvested and treated in these cities could be used for urban food production. The study concluded that the use of such water would considerably improve the cost effectiveness of UA. Ward et al. [15] found Adelaide’s current surplus of stormwater and recycled water (50 GL) sufficient to provide water for 1.3 million hypothetical optimised 40 m2 food gardens.
5.1.4. Groundwater
Groundwater has a long history of use in South Australia. The South Australian landscape is built upon several layers of porous rock with a high proportion of confined and unconfined aquifers. The water contained in these aquifers travels incredibly slowly over time and is filtered by its passage through layers of rock. Groundwater is one of South Australia’s main agricultural water sources, providing 44% of the water for commercial agriculture (ABS, 2016a). In contrast, in 2013 only 2% of SA households stated their main water source for watering their garden was bore or well water [53]. Around Metropolitan Adelaide over 2600 shallow wells, also known as ‘backyard bores’ have been drilled since 1990 [72]. SA Health has guidelines on how to manage, test and use bore water and recommend that bore users regularly get their water tested due to concern over contamination [73].
Stormwater collected from winter rains is injected into managed aquifers. This water is recovered at other times of the year when the demand for water is greater [74]. Stormwater injected into the aquifer becomes classified as ‘groundwater’ and it is managed as such. Salisbury Aquifer Storage Transfer and Recovery collects stormwater, passes it through a series of reed beds for biofiltration and then pumps the water into a series of aquifers for storage [74]. As the water passes through the porous rock it is filtered. This filtration results in safe, clean water. Although this water is as clean as recycled wastewater, it is currently restricted for mixing only with non-drinking water. In 2007 the cost of producing water in this way was approximately half of the cost of mains water [74].
5.1.5. Desalinated Water
Another key element of the South Australian Government’s ‘Water for Good’ initiative was desalination. Construction of the ADP was recommended as a reliable and practical way to provide climate-independent water to the Greater Adelaide region [75]. The plant has the capacity to produce 100 GL of desalinated water per annum [69]. Since the ADP was completed at the end of 2012, it was used intensively until 2014–2015 when the severe drought of 2003–2012 ended [76]. The operating cost (the cost required to maintain and operate) of water produced by the ADP is $1/kL, making it one of the most expensive fresh water sources in SA [65].
Due in part to some political disagreement over the cost-effectiveness of continuing to run the ADP once SA was out of drought conditions, the ADP was included in the recent Determination Review [63]. ESCOSA’s 2016 Determination concluded that financially there was little difference between continuing to run the plant at minimum capacity and shutting it down to ‘standby’ and restarting it when needed. The plant currently runs at minimum capacity, producing approximately 8 GL per annum.
5.2. Calculating the WUE of UA
The term “water use efficiency” can be defined in many ways. In order to clarify the term for further use in UA research and evaluation, we propose four equations that can be used to calculate WUE to varying detail. The base equation for “simple” WUE is based on the “Systems Water Use Efficiency” equation practiced by dryland crop farmers of Northern Australia [77]. Systems Water Use Efficiency (SWUE) is capable of accounting for single crop or multiple crop and fallow phases, and when applied over consecutive years is less influenced by seasonal variability [77]. We have adapted SWUE to produce four successive and useful equations.
Each of our four equations can be used in future UA research to provide an understanding of the WUE at study sites. Each equation incorporates area under production and the duration of study time. The important part of these equations is the sum of all water. This includes both applied irrigation and any rain which falls on the area under production over the study time. The Water Footprint Network website defines green water as, “the water from precipitation that is stored in the root zone of the soil and evaporated, transpired or incorporated by plants” [78]. The total water footprint of a product or crop is made up of green water, blue water (“water that has been sourced from surface or groundwater resources” [78]), and grey water (“the amount of fresh water required to assimilate pollutants to meet specific water quality requirements” [78]). For example, the global average water footprint of apples is 822 L per 1 kg, of which 68% (559 L) is green water, 16% (132 L) is blue water and 15% (123 L) is grey water [79].
Including rainfall allows for fair comparison of UA from different parts of the world. In many places around the world, the WUE of commercial horticulture and agriculture have been improved beyond simple improvements of irrigation systems, crop choices or planting schedules and has reached the point of researching small complex improvements via crop breeding and physiological interventions [80,81]. There are potentially much simpler mechanisms to improve the WUE of UA. As discussed earlier, UA is a typically polyculture food production and is thus likely to be rife with both under- and over-watering. Measuring both the rainfall and all the water applied via irrigation to a particular area over a set duration of time will account for any possible overwatering, which could be considered as a waste of water, money and time. Discussed below are the advantages and limitations of each equation. In addition to measuring all water (both rainfall and applied irrigation), ideally, we also recommend monitoring changes in soil moisture over the set study time. Soil moisture can be thought of as “inherited” water, and if not accounted for, studies running short-term experiments in particular could give misleading results. For example, an experiment could begin data collection at the end of Winter, with soil moisture at field capacity, then applies very little irrigation over a Spring growing period and finishes data collection with high yields, low (or even no) irrigation and modest rainfall, but with the soil moisture potentially depleted to almost wilting point. The next crop would require significantly more irrigation to replace the depleted soil moisture.
Suppose a garden achieves a total yield (Y) of all crops produced from a particular area (A) over a set amount of time (T), with total water (W) received by those crops over the same period. It is possible to simply measure water use per unit area per unit time (i.e., W/TA), which could be used to compare between garden watering regimes. However, such a measure does not account for the produce from the garden and hence does not represent ‘efficiency’ in the sense of output relative to input resources. For this reason, our WUE measures are based on yield (Y) and water use (W), which incorporate area and time implicitly (i.e., larger areas and/or longer periods should both yield more and consume more water).
The first and simplest measure is WUEgross (1), which relates total yield to total water use:
WUEgross crudely accounts for polyculture production through a gross yield aggregation, and allows for basic comparisons among different cultivation techniques and/or irrigation systems. It does not allow for comparisons between individual crops and could become easily distorted if comparing systems producing only heavy- or only light-weight crops. Moreover, by aggregating yields in this way, crops of different value (nutritional or financial) are counted equally by weight. WUEgross is presented as a “better than nothing” approach to water use measurement.
In Equation (2), WUEk, disaggregates yield (Yk) into different crop categories (e.g., Vegetables: Leaf/Root/Fruit, Fruits: Tree/Shrub/Cane/Groundcover, Herbs: Leaf/Flower and potentially, Animal Products: Eggs/Meat/Milk/Fish/Honey), with categories denoted by subscript k, and divides by the water applied to each crop category (Wk).
This categorisation provides the greater level of detail required for polyculture production. Yet its application in practice would be limited by requiring a greater level of precision especially when attempting to measure water applied (rainfall, irrigation and change in soil moisture) for each individual crop type. For example, if one was measuring WUEk of Vegetable: Leaf crops, then one would also have to ensure that only the area taken up by those Vegetable: Leaf crops, and only the water applied to those crops was accounted for. If studying urban food gardens where the crops are divided by category into geometrically simple rows or beds and irrigated uniformly, this could be feasible, but would become impractical for a more complex polyculture with mixed-planting.
In an effort to identify a simple and practical measurement which accounts for mixed plantings, two additional measures are proposed. The first (3) is “nutritional WUE”, WUEnut, which builds on (1) and (2) by introducing a common nutritional unit for aggregation across crop categories:
where Nk is the concentration of a nutritional parameter of interest in crop type k, such as energy content in kilojoules (or kilocalories), expressed per kilogram of yield weight. The units of WUEnut are the relevant nutritional quantity (e.g., kilojoules) returned per kL of water used. Other nutritional qualities (for example, grams of protein, or even vitamins, minerals and micronutrients), could be compared in the same way. Incorporating nutritional values provides an opportunity to compare completely diverse polycultures, to examine how water-efficient they are per equivalent dietary contribution. The practical advantage of WUEnut is that yield weights (Yk) can be easily recorded per crop type, while water can be measured in aggregate for the whole planting. The nutritional contents (Nk) can be determined post-harvest from publicly available nutritional databases (for example, NUTTAB [82] or USDA Food Composition Databases [83]).
The final Equation (4) presents “financial WUE”, WUEfin, which complements WUEnut by calculating worth in the form of retail value ($) of the total yield.
where Fk is the value of crop type k, in the appropriate currency (e.g., AUD$) per kg. For household gardens, retail value (rather than wholesale value) is appropriate, to allow for comparison between what households would have to pay if they purchased the food instead of producing it themselves. As with WUEnut, the only field measurements required for WUEfin are the disaggregated yield weights (Yk) and aggregate water use (W), while Fk can be determined from retail prices post-harvest. WUEfin returns the efficiency in terms of retail value ($) per kL of water used. Or in turn it can also be divided by the cost of the water itself, resulting in a retail value ($) per water cost ($). Accounting for the cost of water does however become tricky if using any water source other than mains water. The limitations of WUEfin are that the retail value ($) of each individual crop depends on the location of the study, the time of year (seasonal demand), and whether there is any consideration of increased produce value due to it being ‘local’ or ‘organic’. While several past studies have used standard supermarket prices [24,25,27,28,33,35] (mostly the earlier studies), others have used Farmers Market or “Organic” prices to calculate the retail worth of their tracked produce [21,22,23,26,29]. We support the idea of monitoring produce prices from at least two separate sources so an average retail price can be used in any calculations. With regards to “organic” prices, it seems unfair to compare the non-certified (possibly only semi-organic) grown produce of urban food gardens, with the expensively certified produce of commercial organic growers.
In summary, we appeal to all future UA research to include the following two measurements, in addition to the area under production (A) and the duration of the study (T):
- Overall water use, W, including the relative contributions by rainfall and irrigation, and—if possible—an estimate of change in soil moisture conditions; and
- Yield, Yk, per crop category.
These measurements allow the basic WUEgross to be reported, representing a major improvement in UA research. Reporting Yk values—even without computing WUEnut or WUEfin—would allow other researchers in this space to post-process and compare studies meaningfully.
Demonstrating the WUE of UA Equations
To demonstrate the types of scores resulting from these recommended equations, below three of the equations have been applied to the results from Cleveland et al. [27] (Table 2). Cleveland et al. [27] collected input and yield data on two in-ground garden beds (77.4 m2 and 58.3 m2) located in Tuscon, AZ, USA, producing vegetables for 3 and 2.5 years respectively. Average annual rainfall for the region was low, only 285 mm per annum. Cleveland et al. [27] were comprehensive in their reporting of results, listing both the yield and value of each individual crop. Nutritional values were not included, but we were able to source these from the Australian NUTTAB database [82].
Table 2.
Results from Cleveland et al. [28] used to test WUEgross, WUEnut and WUEfin.
Garden B displays consistently higher WUE than Garden A, due to having produced almost twice the yield per square meter. Without soil moisture data, it is not possible to know the full difference in each garden’s endowment of water, although as the study ran over multiple years this is potentially less important. The same crops were grown in both gardens, meaning that the ratio of the two WUEgross values (1.76) was expected to be seen in the Nutritional or Financial WUE; it is interesting to note therefore that Garden B delivered 2.4 times the nutritional energy per kL of water, but only 1.4 times the financial value relative to Garden A. These results highlight the useful additional detail that can be gained from calculating WUEnut and WUEfin.
5.3. Measuring the WUE of UA
Besides the simple measurements of area under production (A) and the duration of study time (T), the three base components of all four equations include accurate measurement of yield Yk, area under production, overall water use W, and preferably an estimate of change in soil moisture conditions. While measuring the area under production is relatively straightforward, the measurement of yield and applied irrigation are both more complex. As discussed by Pollard et al. [45] and as touched upon earlier in the PRISMA review, there are three main ways to collect data on UA, (1) Build, manage and collect data on experimental food gardens; (2) Create theoretical models to extrapolate potential values based on commercial yields or small datasets; or (3) Collect data on existing urban food gardens, such as those managed by home-gardeners. Option 3 is the most likely to provide realistic data, but it is also the most complex approach. Urban food gardens in South Australia, for example are incredibly diverse in their garden sizes, cultivation techniques, gardening approaches and in the gardeners themselves, with different amounts of time and money invested and challenges faced [31]. Most of these urban food gardens exist on private property, thus gaining permission to access them becomes another challenge. But once access to these food gardens is available, how does one go about measuring everything that needs to be measured?
5.3.1. Measuring UA Yield
There remains indecision about the most suitable unit of measurement of UA yields. Commercial horticulture crops are typically grown separately in rows or bed sections. UA is typically grown as a polyculture with mixed crops including vegetables, herbs and fruits. While the majority of previous UA yield studies have produced a simple combined total yield (in kg or lb) per area (m2 or ft2) [22,23,24,26,27,28,29,33,34,35,84,85] (with some subsequent extrapolation of yields to other larger gardens, and some division of harvests into fruit, vegetable or herb categories), two previous UA yield studies have combined the first method with a second method of counting the number of individual crop plants per area [21,38]. This secondary method allows yields from the first gardens weighing all their harvests to provide a yield estimate for the subsequent gardens, although this approach can be cumbersome. Combining total weights does provide a simple figure to use, yet it does not fully allow for comparisons among crops of different weights (for example, herbs vs. root vegetables). As noted in the descriptions of the WUE Equations (3) and (4), different crop types are also likely to have different nutrient contents and retail values. Keita et al. [86] from the Food and Agriculture Organisation of the United Nations produced a paper attempting to tackle the lack of estimation methodologies suitable for horticulture farmers in Africa, titled, “Measuring area, yield and production of vegetable crops”. While their proposed method was intended as a method of surveying all the horticulture farms of a particular region or even country, it did consider a number of particulars of field-based small-scale horticulture. These particulars include: the type of vegetable crop (leaf, root or fruit), the mode of harvest (single, staggered or successive), and the cultivation technique (on bed or full field) [86]. Such details are important to document as part of the potential variations in any study of UA.
5.3.2. Measuring Applied Irrigation
With regards to water, urban residents in SA have the option of using either reticulated mains water, rainwater, recycled or grey water. Although mains water comes at a regulated pressure (as does the recycled water piped to some areas), water from rainwater tanks or grey water from indoor use is supplied at variable pressures and flow rates. Any method of water use measurement should be assessed for suitability depending on the water source. For example, different types of water meters have different tolerances to water temperature, ambient temperature, frost tolerance, water pressure, and flow rate [87]. Another consideration when attempting to measure UA water use is multiple watering methods. Households may use multiple methods to apply water across their gardens, including watering by hand (using a bucket, hose or watering can), by non-automatic irrigation (with drippers, agricultural pipe, sprayers or sprinklers), or by automatic irrigation on a timer or series of timers [53]. Any study measuring water use needs to account for any possible combination of water sources and watering methods that are potentially present in a single garden. In the earliest study to record water use, Cleveland et al. [27] measured the water use of two gardens using a standard residential water meter provided by their local utility company. For small volumes of water, they used calibrated buckets. Algert et al. [26] were the only other study to describe their method of water measurement, also using water meters on dedicated hoses for their participants to measure and log. Urban gardeners who water by hand using a watering can or bucket could easily use calibrated buckets to measure their water use (standard buckets and watering cans commonly have litre increments marked on them). For urban food gardeners who water using a hose, non-automatic irrigation (such as drippers, agricultural pipe, sprayers or sprinklers), or by automatic irrigation on a timer or series of timers, a water meter is the more practical option.
Due to the inherent diversity of UA production, we strongly recommend future UA research ensures all the basic details of the UA included in a study are adequately reported. Table 3 lists the details we feel should be reported, with some measurement suggestions for yield and applied water use suitable for different garden setups. We feel the inclusion of these details in future research will provide better clarity and greatly simplify comparisons among studies.
Table 3.
Recommended urban agriculture (UA) study details to report and suitable measurement methods.
5.4. The Edible Gardens Project
One such project undertaking field measurement and data collection of UA water use is the Edible Gardens Project. This project was conducted through the Discovery Circle, a citizen science initiative of the University of South Australia. The Edible Gardens project was designed to investigate the productivity and resource efficiency of urban agriculture in South Australia. The project launched in September 2016 and completed data collection as of June 2018. This project received approval from the Human Research Ethics Committee of the University of South Australia on 8 January 2016 (Protocol number 0000034940). It was open to all South Australian home, school and community gardeners over the age of 18. For greater detail about the Edible Gardens Project (both the online survey and the garden data collection) please refer to two earlier publications [31,45]. The project involved 2 phases:
- (1)
- An online survey collected via SurveyMonkey, which included a combination of both quantitative and qualitative questions, multiple choice and Likert-style scaled questions. From September 2016 to January 2018 401 people responded to the survey. The respondents were asked about their food gardening, including their motivations, experiences, learning sources, challenges, a description of their food garden, estimated setup and monthly costs, estimated weekly time spent, any food preservation or distribution, and what they valued most about growing food. The two survey questions pertinent to this paper were, “From where is the water used on your food-producing areas sourced? (Please select all that apply)” and “How do you usually apply that water? (Please select all that apply)”.
- (2)
- Garden data collection: selected participants collected data on their own food producing gardens. They measured and recorded input and yield data for each of their food garden areas: water (source, irrigation method, volume and time), time spent on food gardening-related activities, all costs and their yields (crop type and weight).
5.4.1. Challenges
Designing an approach for the garden data collection was challenging. Selected participants were not just required to measure and record the water use of their whole garden, but to measure the water use of each food ‘growing area’. Growing areas were categorised by the cultivation techniques, with options for: in-ground beds, raised beds, pots and planters, fruit trees, vertical gardens, poultry keeping (chickens), poultry keeping (other), aquaponics systems, wicking beds, bee hives and ‘other’. The selected participants were questioned about the water source/s for each recorded growing area and the method/s used to apply that water.
The potential difficulty of customising the data collection toolkits (kits containing instructions, examples and tools to assist the participants in measuring and recording data) was first detected in the survey responses. From the 383 responses, five main water sources were identified, with that water being applied via six different types of irrigation methods (Figure 3 and Figure 4).
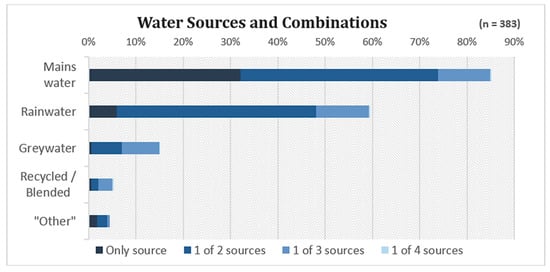
Figure 3.
Water sources and combinations used by Edible Gardens Project participants. Note: the sources are not mutually exclusive. “Other” sources mostly referred to the use of bore or dam water.
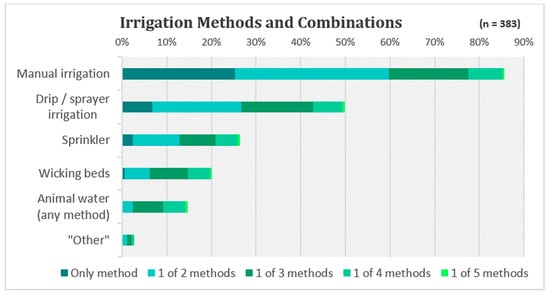
Figure 4.
Irrigation methods and combinations used by Edible Gardens Project participants. Note: the methods are not mutually exclusive. “Other” methods mostly refer to grey water piped from washing machines.
Taking that further, 58% of the 383 food gardeners surveyed made use of more than one water source, while 64% use more than one method to apply water. The high number of potential combinations meant any method designed to measure water use would need to be adaptable.
5.4.2. Water Meters
Water meters were considered the simplest way to measure the in-field water use of selected food gardens. Several different water meters were available. Such meters ranged in price and type from smaller plastic digital meters costing up to $100 AUS, to large steel residential and agricultural positive displacement water meters costing up to $1000 AUS each. Due to the potential for a considerable number of participants, three brands of the smaller cheaper water meters were selected for further testing.
Two meters of each of the three brands were tested at the facilities of the National Association of Testing Authorities (NATA) accredited Australian Irrigation and Hydraulics Technology Facility at the University of South Australia. The Gardena Water Smart Flow Meter was found to be the more consistently accurate, and suitable for use with mains water. However, overall, inexpensive digital water meters were found to be less accurate at low flow rates and low pressures (such as can be expected from a rainwater tank without a pump). We found that larger positive displacement meters were more accurate when water pressure was low and were therefore more suitable for use with rainwater tanks and other low-flow or low-pressure irrigation systems. The South Australian Water Board regularly test and de-commission Residential Elster Model v100 water meters. They were available in sufficient numbers to use and were able to be fitted with reducers and adaptors to suit any irrigation system.
5.4.3. Project Expectations
The Edible Gardens Project had 42 registered urban food gardeners with 119 individual growing areas, who entered water use data into the projects online data collection system. Some participants collected up to 15 months of water use data on their food gardens, and one pilot participant collected over 24 months of water use data on two wicking beds. The project aimed to collect a minimum of six months water use data from each registered participant. The assembled data is a collection of seasonal urban food production water use data relevant to specific water sources, irrigation methods and cultivation techniques. Analysis of the data is ongoing and it is the intention of the authors to publish all project data.
5.5. The Utility of UA
Conjecture and healthy scepticism remain around the real or potential contribution of UA to the global food supply. There is concern over the lack of field-based quantitative data [38,46,47,88], highly variable reported yields [28,34,35,38] and ambiguous global estimates of productive contribution [89]. And yet UA is a widespread and popular activity. In Australia, more than half the population is estimated to be engaged in growing some of their own food [47]. There are 50 community gardens in South Australia alone [90] and an increasing number of schools creating food gardens to support hands-on learning [91]. There are small UA businesses growing food and providing services, including Wagtail Urban Farm [92], Willunga Creek Village Greens, the Adelaide Bee Sanctuary [93], the Jetty Food Store Co-op [94] and two different kinds of food sharing, locating and selling networks: GrowFree [95] and RipeNearMe [96]. UA is seen by some as a sort of new-age agrarian livelihood, with the development of practical growing guides to help support those wanting to get into commercial UA. Examples include, guides to SPIN Farming (small plot intensive) [97], the deep-organic techniques of Eliot Coleman [98] and the low-tech, high yielding methods practised by Jean-Martin Fortier [99].
In the context of widespread promotion of UA, it is crucial to understand the efficiency and cost-effectiveness of water use in areas with such a large discrepancy in the cost of mains water, in order to assess the extent to which UA has a role to play in our food systems beyond a discretionary or hobby activity. From a water perspective and particularly in regions of lower annual rainfall, the urban food producers depending on reticulated mains water for their main water source can be at an immediate cost disadvantage compared to their commercial counterparts. As discussed earlier, the price of mains water in South Australia is between $2.32/kL and $3.58/kL, while commercial growers pay only $0.09/kL. Yet this is not necessarily an insurmountable obstacle. The logical next step would be to consider alternative water sources available for urban food production. Rainwater was the second most popular water source of the EG survey respondents however, collection and storage of rainwater is limited by catchment area, rainwater tank size/s and the volume and timing of available rainfall. Consequently, it remains difficult to confirm the levelised cost of rainwater to use in comparable calculations of cost. Other available South Australian water sources include greywater, recycled-, blended- or storm-water, and the occasional backyard-bore or dam. In their paper on the water use implications of an increased uptake of UA in cities, Ward et al. [15] calculated that a hypothetical urban food garden providing roughly 25% of the required fruits and vegetables per average household would increase that household’s water use by 20–50%. Looking beyond mains and rainwater, Ward et al. [15] concluded that the 2014 surplus of 51 GL/year of Adelaide recycled water which at the time was being discharged into the ocean, would, “(if) ignoring issues of distribution… … theoretically be sufficient to irrigate the equivalent of 1.3 million of (the) hypothetical food gardens”. As demonstrated by Stirzaker in his book [68], it is up to each household to increase their understanding of water in the garden and develop the potential to collect, apply and monitor water in creative ways.
6. Conclusions
Our extensive systematic review of WUE and measurement in UA, and the consideration of water use data in UA studies of productivity, economic value and full life-cycle or environmental assessments, confirms that there is an increasing level of interest in this type of UA research. However, it remains that only 30 articles focussed on this type of research were identified in the 43 years from 1975 to 2018, eight of which were review papers. Only five studies were found which actively collected some form of water use data, yet all of these were conducted on purpose-built experimental UA [26,27,41,42,43]. No single study was identified which collected and published WUE data on existing UA, such as on the dominant form of UA in Australia—home food gardens.
The future challenges of climate change and constrained resources such as fresh water, fertiliser and fertile topsoil, are likely to both increase the price of food and are leading to increased interest in UA. There are claims that UA can assist in supplementing the food security of towns and cities in the future. Currently there is a lack of existing rigorous scientific data to support these claims. If UA is to be a reliable part of future food plans, then the full costs and resource requirements of its production must be taken into consideration.
This paper acknowledges the challenging aspects of assessing the input requirements, resource efficiency and productivity of UA. One major factor in such assessments is water. UA water use has been regularly overlooked by past research. The absence of UA water use data points to a need for future UA research to make a better attempt to measure and calculate the WUE of UA, preferably using one of the two more detailed WUE equations (WUEnut and WUEfin) proposed in this paper. At the very least, rainfall and irrigation should both be reported, along with disaggregated yields per crop type. Certain practicalities must be taken into consideration, namely garden placement, cultivation techniques, water sources and irrigation methods. A combination of water meters tailored to fit all types of irrigation systems appears to provide the best capacity for water use measurement. One existing project working towards the collection of UA water use data is the Edible Gardens project. Designing a method for participants to measure the water use of their different ‘growing areas’ (areas categorised by cultivation technique) was challenging.
The collection of UA water use and yield data will provide a firm basis for further evaluation of how much water is being applied to UA gardens, their WUE and the comparison of different irrigation and cultivation techniques. It will also assist with calculation of the cost of water applied—thereby allowing more comprehensive economic evaluations of UA and assisting in its further optimisation. Only once these practical evaluations of existing UA production have been completed, will we have a clearer understanding of what UA currently contributes to our society and what future prospects may be possible.
Author Contributions
Conceptualisation, Methodology and Investigation by G.P., J.W. and P.R.; Writing—Original Draft Preparation by G.P.; Writing—Review and Editing by G.P., J.W. and P.R.; Supervision by J.W. and P.R.
Funding
This research was funded and supported by: University of South Australia; City of Marion; City of Salisbury; Adelaide and Mount Lofty Ranges Natural Resources Management Board; and the South Australian Department for Environment and Water.
Acknowledgments
We are grateful to all the gardeners for their participation in the Edible Gardens project. We thank Andrew Royal for his development of the online project infrastructure, Hayley Tindle for help with survey design and administration. Thank you to both Baden Myers and Ashley Hasler for their help understanding and testing both water meters and water measurement ideas. We also appreciate the generosity of the South Australian Water Board and their donation of 200 Elster water meters to the Edible Gardens Project.
Conflicts of Interest
The authors declare no conflict of interest. The funders had no role in the design of the study; in the collection, analyses, or interpretation of data; in the writing of the manuscript, and in the decision to publish the results.
References
- Bastian, A.; Coveney, J. Local evidenced-based policy options to improve food security in South Australia: The use of local knowledge in policy development. Public Health Nutr. 2012, 15, 1497–1502. [Google Scholar] [CrossRef] [PubMed]
- Hinrichs, C.C. Embeddedness and local food systems. notes on two types of direct agricultural market. J. Rural Stud. 2000, 16, 295–303. [Google Scholar] [CrossRef]
- Alaimo, K.; Packnett, E.; Miles, R.A.; Kruger, D.J. Fruit and vegetable intake among urban community gardeners. J. Nutr. Educ. Behav. 2008, 40, 94–101. [Google Scholar] [CrossRef] [PubMed]
- Bazzano, L.; He, J.; Ogden, L.; Loria, C.; Vupputuri, S.; Myers, L.; Whelton, P. Fruit and vegetable intake and risk of cardiovascular disease in US adults: The first National Health and Nutrition Examination Survey Epidemiologic Follow-up Study. Am. J. Clin. Nutr. 2002, 76, 93–99. [Google Scholar] [CrossRef] [PubMed]
- Freeman, C.; Dickinson, K.; Porter, S.; van Heezik, Y. “My garden is an expression of me”: Exploring householders’ relationships with their gardens. J. Environ. Psychol. 2012, 32, 135–143. [Google Scholar] [CrossRef]
- Lloyd, D. The Old School Community Garden: More Than a Growing Place, Building Community and Food Security. Int. J. Sustain. Econ. Soc. Cult. Context 2015, 11, 73–88. [Google Scholar] [CrossRef]
- Altieri, M.A. Small Farms as a Planetary Ecological Asset: Five Key Reasons Why We Should Support the Revitalisation of Small Farms in the Global South; Third World network (TWN): Penang, Malaysia, 2008; ISBN 9832729564. [Google Scholar]
- Pénicaud, C.; Achir, N.; Dhuique-Mayer, C.; Dornier, M.; Bohuon, P. Degradation of β-carotene during fruit and vegetable processing or storage: Reaction mechanisms and kinetic aspects: A review. Fruits 2011, 66, 417–440. [Google Scholar] [CrossRef]
- Ghosh, S. Measuring sustainability performance of local food production in home gardens. Local Environ. 2014, 19, 33–55. [Google Scholar] [CrossRef]
- Eigenbrod, C.; Gruda, N. Urban vegetable for food security in cities. A review. Agron. Sustain. Dev. 2015, 35, 483–498. [Google Scholar] [CrossRef]
- Hennessy, K.; Fitzharris, B.; Bates, B.C.; Harvey, N.; Howden, M.; Hughes, L.; Salinger, J.; Warrick, R. Australia and New Zealand; Cambridge University Press: Cambridge, UK, 2007; pp. 507–540. [Google Scholar]
- Auricht, G. Food Glorious Food. In Adelaide: Water of a City; Daniels, C., Ed.; Wakefield Press: Adelaide, Australia, 2010; pp. 315–344. ISBN 9781862548619. [Google Scholar]
- Mok, H.-F.; Williamson, V.G.; Grove, J.R.; Burry, K.; Barker, S.F.; Hamilton, A.J. Strawberry fields forever? Urban agriculture in developed countries: A review. Agron. Sustain. Dev. 2014, 34, 21–43. [Google Scholar] [CrossRef]
- Wortman, S.; Lovell, S. Environmental Challenges Threatening the Growth of Urban Agriculture in the United States. J. Environ. Qual. 2013, 42, 1283–1294. [Google Scholar] [CrossRef] [PubMed]
- Ward, J.; Ward, P.; Saint, C.; Mantzioris, E. The Urban Agriculture Revolution: Implications for Water Use in Cities. Water 2014, 41, 69–74. [Google Scholar]
- Specht, K.; Siebert, R.; Hartmann, I.; Freisinger, U.B.; Sawicka, M.; Werner, A.; Thomaier, S.; Henckel, D.; Walk, H.; Dierich, A. Urban agriculture of the future: An overview of sustainability aspects of food production in and on buildings. Agric. Hum. Values 2014, 31, 33–51. [Google Scholar] [CrossRef]
- Brown, S. A Guide to Types of Non Potable Water and the Potential for Reuse in Urban Systems. In Sowing Seeds in the City: Ecosystem and Municipal Services; Brown, S., McIvor, K., Hodges Snyder, E., Eds.; Springer: Dordrecht, The Netherlands, 2016; pp. 53–67. ISBN 978-94-017-7453-6. [Google Scholar]
- Marks, J. Chapter 19: Perceptions of water in urban landscapes—Section 19.3 Adelaide, the water recycling capital. In Adelaide: Water of a City; Daniels, C., Ed.; Wakefield Press: Adelaide, Australia, 2010; ISBN 1862548617. [Google Scholar]
- Moher, D.; Liberati, A.; Tetzlaff, J.; Altman, D.G.; The, P.G. Preferred Reporting Items for Systematic Reviews and Meta-Analyses: The PRISMA Statement. PLoS Med. 2009, 6, e1000097. [Google Scholar] [CrossRef] [PubMed]
- United Nations Development Programme. Human Development Report 2016: Human Development for Everyone; United Nations Development Programme: New York, NY, USA, 2016; p. 286. Available online: http://hdr.undp.org/en/content/human-development-report-2016-human-development-everyone (accessed on 5 June 2018).
- Gittleman, M.; Jordan, K.; Brelsford, E. Using citizen science to quantify community garden crop yields. Cities Environ. 2012, 5, 4. [Google Scholar] [CrossRef]
- Vitiello, D.; Nairn, M.; Grisso, J.; Swistak, N. Community Gardening in Camden, NJ Harvest Report: Summer 2009; Penn’s Center for Public Health Initiatives: Philadelphia, PA, USA, 2010; Available online: http://camdenchildrensgarden.org/Community%20Gardening%20Harvest%20Report.pdf (accessed on 5 June 2018).
- Vitiello, D.; Nairn, M.; Planning, P. Community Gardening in Philadelphia: 2008 Harvest Report. 2009. Available online: http://www.farmlandinfo.org/sites/default/files/Philadelphia_Harvest_1.pdf (accessed on 5 June 2018).
- Stall, W.M. Economic value of a home vegetable garden in South Florida. Proc. Fla. State Hortic. Soc. 1979, 92, 213–214. [Google Scholar]
- Stephens, J.M.; Carter, L.; Van Gundy, C. Economic value of vegetables grown in North Florida gardens. Proc. Fla. State Hortic. Soc. 1980, 93, 70–72. [Google Scholar]
- Algert, S.J.; Baameur, A.; Diekmann, L.O.; Gray, L.; Ortiz, D. Vegetable Output, Cost Savings, and Nutritional Value of Low-Income Families’ Home Gardens in San Jose, CA. J. Hunger Environ. Nutr. 2016, 11, 328–336. [Google Scholar] [CrossRef]
- Cleveland, D.; Orum, T.; Ferguson, N. Economic value of home vegetable gardens in an urban desert environment. Hortic. Sci. 1985, 20, 694–696. [Google Scholar]
- Codyre, M.; Fraser, E.; Landman, K. How does your garden grow? An empirical evaluation of the costs and potential of urban gardening. Urban For. Urban Green. 2014, 14, 72–79. [Google Scholar] [CrossRef]
- Conk, S. Quantifying Yields of Home and Community Gardens in Laramie, Wyoming; Division of Kinesiology and Health, University of Wyoming: Laramie, WY, USA, 2015. [Google Scholar]
- Lupia, F.; Pulighe, G. Water Use and Urban Agriculture: Estimation and Water Saving Scenarios for Residential Kitchen Gardens. Agric. Agric. Sci. Procedia 2015, 4, 50–58. [Google Scholar] [CrossRef]
- Pollard, G.; Ward, J.; Roetman, P. Typically Diverse: The Nature of Urban Agriculture in South Australia. Sustainability 2018, 10, 945. [Google Scholar] [CrossRef]
- Sullivan, C.; Hallaran, T.; Sogorka, G.; Weinkle, K. An evaluation of conventional and subirrigated planters for urban agriculture: Supporting evidence. Renew. Agric. Food Syst. 2015, 30, 55–63. [Google Scholar] [CrossRef]
- Utzinger, J.; Connolly, H. Economic value of a home vegetable garden. HortScience 1978, 13, 148–149. [Google Scholar]
- Zainuddin, Z.; Mercer, D. Domestic Residential Garden Food Production in Melbourne, Australia: A fine-grained analysis and pilot study. Aust. Geogr. 2014, 45, 465–484. [Google Scholar] [CrossRef]
- Algert, S.J.; Baameur, A.; Renvall, M.J. Vegetable Output and Cost Savings of Community Gardens in San Jose, California. J. Acad. Nutr. Diet. 2014, 114, 1072–1076. [Google Scholar] [CrossRef] [PubMed]
- Drake, L.; Lawson, L. Best Practices in Community Garden Management to Address Participation, Water Access, and Outreach. J. Ext. 2015, 53, 6FEA3. [Google Scholar]
- McGoodwin, M.; McGoodwin, R.; McGoodwin, W. How Much Can You Grow? Quantifying Yield in a Community Garden Plot—One Family’s Experience. In Sowing Seeds in the City: Ecosystem and Municipal Services; Brown, S., McIvor, K., Hodges Snyder, E., Eds.; Springer: Dordrecht, The Netherlands, 2016; pp. 245–267. ISBN 978-94-017-7453-6. [Google Scholar]
- Pourias, J.; Duchemin, E.; Aubry, C. Products from urban collective gardens: Food for thought or for consumption? Insights from Paris and Montreal. J. Agric. Food Syst. Community Dev. 2015, 5, 1–25. [Google Scholar] [CrossRef]
- Vogl, C.R.; Axmann, P.; Vogl-Lukasser, B. Urban organic farming in Austria with the concept of Selbsternte (’self-harvest‘): An agronomic and socio-economic analysis. Renew. Agric. Food Syst. 2004, 19, 67–79. [Google Scholar] [CrossRef]
- Orsini, F.; Gasperi, D.; Marchetti, L.; Piovene, C.; Draghetti, S.; Ramazzotti, S.; Bazzocchi, G.; Gianquinto, G. Exploring the production capacity of rooftop gardens (RTGs) in urban agriculture: The potential impact on food and nutrition security, biodiversity and other ecosystem services in the city of Bologna. Food Secur. 2014, 6, 781–792. [Google Scholar] [CrossRef]
- Richards, P.J.; Farrell, C.; Tom, M.; Williams, N.S.G.; Fletcher, T.D. Vegetable raingardens can produce food and reduce stormwater runoff. Urban For. Urban Green. 2015, 14, 646–654. [Google Scholar] [CrossRef]
- Sanjuan-Delmás, D.; Llorach-Massana, P.; Nadal, A.; Ercilla-Montserrat, M.; Muñoz, P.; Montero, J.I.; Josa, A.; Gabarrell, X.; Rieradevall, J. Environmental assessment of an integrated rooftop greenhouse for food production in cities. J. Clean. Prod. 2017, 177, 326–337. [Google Scholar] [CrossRef]
- Sanyé-Mengual, E.; Orsini, F.; Oliver-Solà, J.; Rieradevall, J.; Montero, J.I.; Gianquinto, G. Techniques and crops for efficient rooftop gardens in Bologna, Italy. Agron. Sustain. Dev. 2015, 35, 1477–1488. [Google Scholar] [CrossRef]
- Langellotto, G.A. What are the economic costs and benefits of home vegetable gardens? J. Ext. 2014, 52, 2RIB5. [Google Scholar]
- Pollard, G.; Roetman, P.; Ward, J. The case for citizen science in urban agriculture research. Future Food 2017, 5, 9–20. [Google Scholar]
- Taylor, J.; Lovell, S. Urban home food gardens in the Global North: Research traditions and future directions. Agric. Hum. Values 2013, 31, 285–305. [Google Scholar] [CrossRef]
- Wise, P. Grow Your Own: The Potential Value and Impacts of Residential and Community Food Gardening; The Australia Institute: Canberra, Australia, 2014; Available online: http://apo.org.au/node/39181 (accessed on 5 June 2018).
- Stirzaker, R. The problem of irrigated horticulture: Matching the biophysical efficiency with the economic efficiency. Agrofor. Syst. 1999, 45, 187–202. [Google Scholar] [CrossRef]
- Postel, S. Water for Food Production: Will There Be Enough in 2025? Bioscience 1998, 48, 629–637. [Google Scholar] [CrossRef]
- Ward, J.; Symons, J. Optimising crop selection for small urban food gardens in dry climates. Horticulturae 2017, 3, 33. [Google Scholar] [CrossRef]
- Cahn, M.D.; Johnson, L.F. New Approaches to Irrigation Scheduling of Vegetables. Horticulturae 2017, 3, 28. [Google Scholar] [CrossRef]
- Nymet Pty Ltd. WaterMe: Wireless Irrigation Controller. In Brochure; Nymet Pty Ltd.: Gulfview Heights, Australia, 2014. [Google Scholar]
- Australian Bureau of Statistics (ABS). Environmental Issues: Water Use and Conservation; cat No. 4602.0.55.003; Commonwealth of Australia: Canberra, Australia, 2013.
- Bureau of Meteorology. Adelaide (Kent Town) 1977–2016: Climate Statistics for Australian Locations. Available online: http://www.bom.gov.au/climate/averages/tables/cw_023090_All.shtml (accessed on 12 November 2016).
- Australian Bureau of Statistics (ABS). Water Account Australia 2013–2014; cat. No. 4610.0; Commonwealth of Australia: Canberra, Australia, 2015.
- Mattsson, D. Fresh Food Prices to Surge. The Advertiser, 5 October 2016; 13. [Google Scholar]
- Australian Bureau of Statistics (ABS). Water Use on Australian Farms, 2014–2015; cat. No. 4618.0; Commonwealth of Australia: Canberra, Australia, 2016.
- South Australian Government. Regulatory Statement—2012–2013 Drinking Water and Sewerage Prices; Department of Treasury and Finance; South Australian Government: Adelaide, Australia, 2012.
- South Australian Government. Regulatory Statement—2011–2012 Drinking Water and Sewerage Prices; Department of Treasury and Finance; South Australian Government: Adelaide, Australia, 2011.
- Australian Bureau of Statistics (ABS). Water Account Australia 2014–2015; cat. No. 4610.0; Commonwealth of Australia: Canberra, Australia, 2016.
- Australian Bureau of Statistics (ABS). Consumer Price Index, Australia, Sep 2016; cat. No. 6401.0; Commonwealth of Australia: Canberra, Australia, 2016.
- SA Water. Residential Water Prices. Available online: https://www.sawater.com.au/accounts-and-billing/current-water-and-sewerage-rates/residential-water-supply (accessed on 19 July 2016).
- Essential Services Commission of South Australia (ESCOSA). SA Water Regulatory Determination 2016; Essential Services Commission of South Australia: Adelaide, Australia, 2016. Available online: https://www.escosa.sa.gov.au/projects-and-publications/projects/water/sa-water-regulatory-determination-2016/sa-water-regulatory-determination-2016 (accessed on 5 June 2018).
- Khastagir, A.; Jayasuriya, N. Investment evaluation of rainwater tanks. Water Resour. Manag. 2011, 25, 3769–3784. [Google Scholar] [CrossRef]
- Marchi, A.; Holger, M.; Dandy, G. Financial Costs, Energy Consumption and Greenhouse Gas Emissions for Major Supply Water Sources and Demand Management Options for Metropolitan Adelaide; Goyder Institute for Water Research: Adelaide, Australia, 2014; p. 134. Available online: http://www.goyderinstitute.org/_r111/media/system/attrib/file/102/EnergyCostsReport_Marchietal_Final_web.pdf (accessed on 5 June 2018).
- Marsden Jacob Associates. The Cost-Effectiveness of Rainwater Tanks in Urban Australia; National Water Commission, Government of Australia: Canberra, Australia, 2007; p. 60. Available online: https://www.waterplex.com.au/download.php?file=media/Research/Rainwater_Tank_Research__Waterlines_Rainwater_Tanks.pdf (accessed on 5 June 2018).
- Tam, V.; Tam, L.; Zeng, S. Cost effectiveness and tradeoff on the use of rainwater tank: An empirical study in Australian residential decision-making. Resour. Conserv. Recycl. 2010, 54, 178–186. [Google Scholar] [CrossRef]
- Stirzaker, R. Out of the Scientist’s Garden: A Story of Water and Food; CSIRO Publishing: Melbourne, Australia, 2010; ISBN 9780643100145. [Google Scholar]
- Government of South Australia. Managing Natural Resources: Water Resources; Department of Environment, Water and Natural Resources: Adelaide, Australia, 2015.
- Australian Government Bureau of Meteorology (BOM). Climate Resilient Water Sources: National Overview. Australian Government Bureau of Meteorology. 2016. Available online: http://www.bom.gov.au/water/crews/ (accessed on 5 June 2018).
- SA Health; Government of South Australia. Greywater. Available online: http://www.sahealth.sa.gov.au/wps/wcm/connect/public+content/sa+health+internet/protecting+public+health/water+quality/wastewater/disposing+of+wastewater+onsite/greywater (accessed on 2 May 2017).
- Barnett, S.; Banks, E.W.; Love, A.J.; Simmons, C.T.; Gerges, N.Z. Aquifers and groundwater. In Adelaide: Water of a City; Daniels, C., Hodgson, J., Eds.; Wakefield Press: Adelaide, Australia, 2010; pp. 91–104. ISBN 9781862548619. [Google Scholar]
- Environmental Protection Agency—South Australia. Site Contamination: Bore Water (Groundwater). Available online: http://www.epa.sa.gov.au/environmental_info/site_contamination/groundwater (accessed on 13 December 2016).
- Wahlquist, Å. Thirsty Country: Options for Australia; Allen & Unwin: Crows Nest, Australia, 2008; ISBN 1741754844. [Google Scholar]
- Government of South Australia. Water for Good: A Plan to Ensure Our Water Future to 2050; Government of South Australia: Adelaide, Australia, 2009.
- Bureau of Meteorology. National Performance Report 2014–2015: Urban Water Utilities, Part A; Australian Government: Melbourne, Australia, 2016. Available online: http://www.bom.gov.au/water/npr/docs/2014-2015/National-performance-report-2014-2015_part-A_lowres.pdf (accessed on 5 June 2018).
- Routly, R. Water Use Efficiency: Optimizing Farming Systems Performance and Balancing Fallow Length and Sowing Decisions; Grains Research & Development Coporation (GDRC): Barton, Australia, 2010; Available online: https://grdc.com.au/resources-and-publications/grdc-update-papers/tab-content/grdc-update-papers/2010/09/water-use-efficiency-optimizing-farming-systems-performance-and-balancing-fallow-length-and-sowing-decisions (accessed on 5 June 2018).
- SAB Miller; World Wildlife Foundation. Water Footprinting: Identifying and Addressing Water Risks in the Value Chain; Water Footprint Network: London, UK, 2009; p. 17. Available online: http://www.wwf.eu/?171861/Water-Footprinting (accessed on 5 June 2018).
- Mekonnen, M.M.; Hoekstra, A.Y. The green, blue and grey water footprint of crops and derived crop products. Hydrol. Earth Syst. Sci. 2011, 15, 1577–1600. [Google Scholar] [CrossRef]
- Loveys, B.R.; Dry, P.R.; Stoll, M.; McCarthy, M.G. Using Plant Physiology to Improve the Water Use Efficiency of Horticultural Crops. In Proceedings of the III International Symposium on Irrigation of Horticultural Crops, Leuven, Belgium, 28 June–2 July 1999; International Society for Horticultural Science (ISHS): Leuven, Belgium, 2010; pp. 187–197. [Google Scholar]
- Costa, J.M.; Ortuño, M.F.; Chaves, M.M. Deficit irrigation as a strategy to save water: Physiology and potential application to horticulture. J. Integr. Plant Biol. 2007, 49, 1421–1434. [Google Scholar] [CrossRef]
- Food Standards Australia New Zealand. NUTTAB 2010 Online Searchable Database. Available online: http://www.foodstandards.gov.au/science/monitoringnutrients/nutrientables/nuttab/pages/default.aspx (accessed on 1 August 2017).
- United States Department of Agriculture (USDA). USDA Food Composition Databases. Agriculture Research Service. Available online: http://www.foodstandards.gov.au/science/monitoringnutrients/nutrientables/nuttab/pages/default.aspx (accessed on 1 June 2018).
- Rur, M. Measuring Garden Footprints. Master’s Thesis, Department of Plant Protection Biology, Swedish University of Agricultural Sciences, Alnarp, Sweden, 2010. [Google Scholar]
- Conway, T. Home-based Edible Gardening: Urban Residents’ Motivations and Barriers. Cities Environ. 2016, 9, 3. [Google Scholar]
- Keita, N.; Ouedraogo, E.; Nyamsi, U. Measuring Area, Yield and Production of Vegetable Crops. In Proceedings of the ICAS VII Seventh International Conference on Agricultural Statistics, Rome, Italy, 24–26 October 2016; p. 13. [Google Scholar]
- Husqvarna Australia Pty. Ltd. Gardena Operating Instructions: Water Smart Flow Meter; Husqvarna Australia Pty. Ltd.: Central Coast, Austrilia, 2016; Art. 8188, 8189. [Google Scholar]
- Ward, J.; Ward, P.; Mantzioris, E.; Saint, C. Optimising diet decisions and urban agriculture using linear programming. Food Secur. 2014, 6, 701–718. [Google Scholar] [CrossRef]
- Armar-Klemesu, M. Urban agriculture and food security, nutrition and health. In Growing Cities, Growing Food. Urban Agriculture on the Policy Agenda; Deutsche Stiftung fur Internationale Entwicklung: Feldafing, Germany, 2000; pp. 99–118. Available online: https://www.ruaf.org/sites/default/files/Theme114_111_111.PDF (accessed on 5 June 2018).
- Australian City Farms & Community Gardens Network. Networking Community Gardeners around Australia. Available online: http://directory.communitygarden.org.au/ (accessed on 1 June 2018).
- Stephanie Alexander Kitchen Garden Foundation. Kitchen Garden Schools: Growing, Harvesting, Preparing, Sharing. Available online: http://www.kitchengardenfoundation.org.au/about-us/the-foundation (accessed on 1 June 2018).
- Wiseman, N.; Hoepfner, S.; Young, B. Wagtail Urban Farm. Available online: http://wagtailurbanfarm.wordpress.com/about/ (accessed on 1 June 2018).
- Sanctuary, A.B. Adelaide Bee Sanctuary. Available online: http://www.cbdbees.com/#!sandra/c5e7 (accessed on 1 June 2018).
- Schmitz, S. Jetty Food Store. Available online: https://www.facebook.com/pg/jettyfoodstore/about/?ref=page_internal (accessed on 1 June 2018).
- Barker, A. GrowFree. Available online: http://www.growfree.org.au/ (accessed on 1 June 2018).
- Martin, A.; Martin, H. Ripe Near Me. Available online: https://www.ripenear.me/ (accessed on 1 June 2018).
- Stone, C. SPIN Farming. Available online: https://spinfarming.com/whatsSpin/ (accessed on 1 June 2018).
- Coleman, E. The Winter Harvest Handbook: Year Round Vegetable Production Using Deep-Organic Techniques; Chelsea Green Publishing: White River Junction, VT, USA, 2009; p. 264. ISBN 1603580816. [Google Scholar]
- Fortier, J.-M. The Market Gardener: A Successful Grower’s Handbook for Small-Scale Organic Farming; New Society Publishers: Gabriola Island, BC, Canada, 2014; ISBN 978-0-86571-765-7. [Google Scholar]

© 2018 by the authors. Licensee MDPI, Basel, Switzerland. This article is an open access article distributed under the terms and conditions of the Creative Commons Attribution (CC BY) license (http://creativecommons.org/licenses/by/4.0/).