Review

Use of Nondestructive Devices to Support Pre- and Postharvest Fruit Management

Department of Agricultural Science, Alma Mater Studiorum, University of Bologna, Bologna 40127, Italy
*
Author to whom correspondence should be addressed.
Horticulturae 2017, 3(1), 12; https://doi.org/10.3390/horticulturae3010012
Submission received: 3 December 2015 / Revised: 7 September 2016 / Accepted: 18 September 2016 / Published: 30 December 2016
(This article belongs to the Special Issue Quality Management of Organic Horticultural Produce)

Abstract

:
Fruit quality is greatly affected by the ripening stage at harvest. In order to preserve quality traits, increase product marketability, and extend both the storage time and the shelf life, it is crucial to tailor postharvest strategies to ripening and physiological stages, and these need to be determined precisely. Surveying instruments working with modern technologies such as visible spectrometry can be precise and effective in assessing ripening stage and in grouping fruit in homogeneous classes. This paper reviews results using original nondestructive devices developed at the University of Bologna to define the fruit ripening of several fruit species through a new index (Index of Absorbance Difference (IAD)) to compare relationships among fruit ripening stage, fruit quality, and postharvest life. The devices defining the IAD can be used in the field (by the Difference Absorbance (DA)-Meter), at the packinghouse (with the DA-head, a stationary device), and at the cold storage level (with the DA Fruit Logger (DAFL)).

1. Introduction

Fruit quality is a combination of several features that depend on the stage of maturity reached at harvest, postharvest fruit management and disease susceptibility, and storage duration, each influencing general consumer appreciation. In fact, it has been demonstrated that, when fruit are harvested before they reach the proper ripening stage on the tree, fruit quality is poor, as they do not reach their characteristic aroma and flavor, causing, in some situations, disaffection of the consumers for the fruit that do not fulfill their expectations. In this context, the proper choice of the best harvest time plays a crucial role, representing a compromise between the achievement of sufficient quality and the mechanical resistance to harvest and postharvest practices.
Unfortunately, the most common techniques used to determine the ripening stage are often based on destructive methods (°Brix, texture analysis, starch degradation evolution, etc.), and thus they are not applicable to the entire harvest, but only to a small subset of fruits used as a statistical sample. Because the ripening dynamics on-tree can significantly diverge based on the fruit position within the canopy or on the position of the tree in the orchard, even in case of multiple harvest dates performed over a wide harvest window, the fruit batch should be considered heterogeneous [1,2,3,4,5]. A deeper and more precise knowledge of the ripening degree, obtained using a strict protocol and proper devices, could help by segregating the fruit into more uniform groups that each could then be managed with the best storage and marketing strategies. In addition, the possibility of monitoring fruit ripening changes occurring during cold storage could provide critical information for deciding the post-storage temperature that needs to be re-established to guarantee the most appropriate marketing strategy [6]. As a consequence, the ripening stage of fruit at harvest has to be determined with great accuracy following a strict protocol, using proper techniques and devices. However, although fruit quality has always been recognized as a crucial aspect [7,8], only a few quality traits and characteristics are commonly determined at harvest by simple and outdated analyses.
To overcome the problems arising from an imprecise determination of fruit quality, the University of Bologna has focused its efforts in recent years on developing nondestructive devices based on visible/near infrared (VIS/NIR) properties, allowing the definition of fruit ripening and fruit quality attributes by assessing the level of chlorophyll degradation, defined as Index of Absorbance Difference (IAD), and providing a general indication about the fruit ripening stage. The devices have been tested at field and packinghouse levels and in the cold storage room to monitor fruit maturation and ripening evolution from the “field to the fork” level.
In this review, the main results obtained with these nondestructive devices are reported, focusing on the most significant results achieved with different fruit species as far as the relationships among fruit ripening definition, fruit quality enhancement, and disease susceptibility are concerned.

2. The VIS/NIR Devices Used in the Research
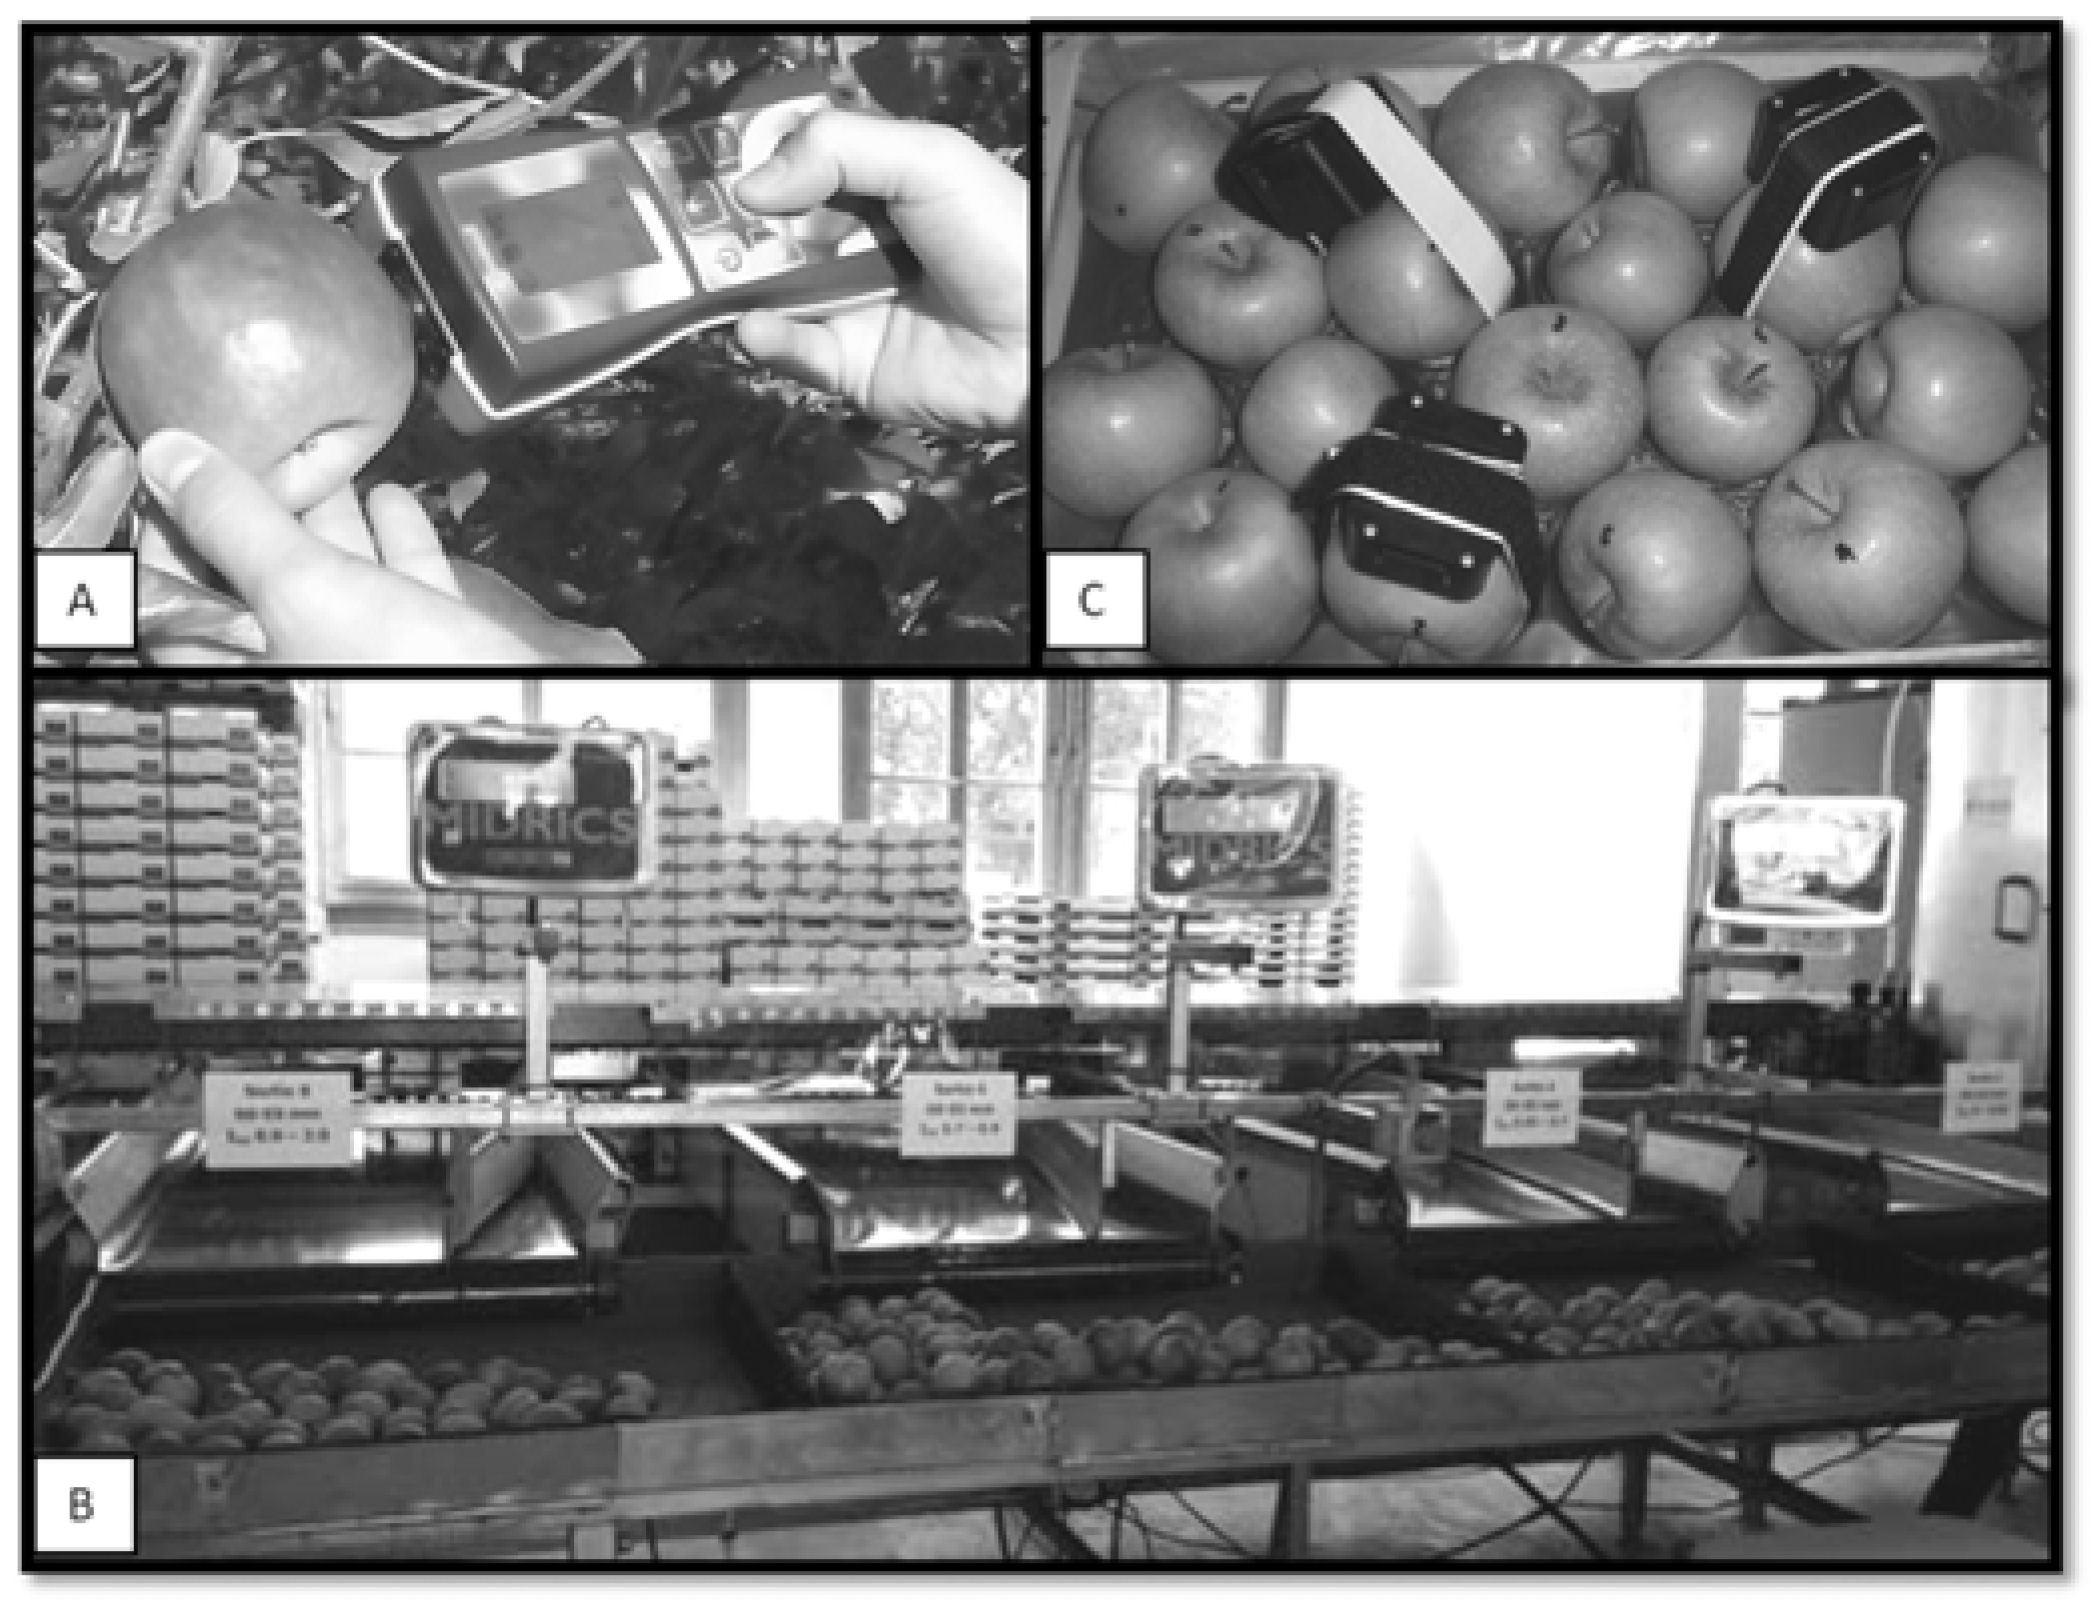
The 3 different devices developed for defining fruit ripening as IAD can be used along the supply chain at different levels: (a) in the field with the DA-Meter; (b) in the packinghouse with the DA-Head, a stationary device; and (c) in cold storage with the Difference Absorbance Fruit Logger (DAFL).

2.1. The DA-Meter

The University of Bologna developed and patented three different devices, the DA-Meter, Kiwi-Meter and Cherry-Meter, that have been tested on different fruit species. All three meters do not require any complex calibration and can be used along the productive chain [9]. The first device patented was the DA-Meter (University of Bologna patent n° MO 2005000211) (Figure 1A). The DA-Meter is a portable, user-friendly device for measuring the IAD. The DA-Meter has been tested on several pome and stone fruit cultivars. The IAD is calculated as the difference between the absorbance values at 670 nm and 720 nm, near the chlorophyll a absorbance peak.
The Kiwi-Meter (University of Bologna patent n° PD2009A000081) has been tested on Actinidia deliciosa and Actinidia chinensis kiwi fruit varieties. The device was developed specifically for kiwifruit, and it differs from the DA-Meter by the wavelengths used: 540 and 640 nm with 800 nm as a reference point. The difference between absorbance at 540 nm versus 800 nm is used for the Actinidia deliciosa fruit, and the difference between 640 nm versus 800 nm is used for the Actinidia chinensis fruit [10]. In Actinidia deliciosa, a higher IAD implies more ripe fruits with a brilliant green colored flesh, while with Actinidia chinensis, IAD gradually decreases, staying in a constant range for some time followed by a rapid decrease with the onset of the flesh color break from green to yellow.
The Cherry-Meter is used on cherry (Prunus avium, Prunus cerasus) fruit, allowing the determination of IAD with a value range from 0 to 2.6 positively correlated with ripening. The device is made up of six diode LEDs positioned around a photodiode detector. A set of two diode LEDs emit at 560 nm, 640 nm, and 750 nm. The fruit is illuminated alternately with the two monochromatic sources, and for each the amount of light re-emitted by the fruit is measured. Light is detected by a photodiode positioned centrally to a diode crown, and is converted to a digital signal through an analogue to digital converter. IAD is obtained from the differences of the absorbance between two wavelengths for anthocyanin (560 and 640 nm) and the reference value at 750 nm [3].

2.2. The DA-Head

The DA-Head (Figure 1B) is a stationary device that measures the ripening stage as IAD in a similar way to the DA-Meter. This device has been tested on several fruit species (kiwifruit, apricot (Prunus armeniaca), pear (Pyrus communis), apple (Malus × domestica), and peach (Prunus persica) [5,10,11], although the first and more complete trials have been carried out with the apricot cultivar “La vallée”, with the collaboration of the Office Cantonal de Arboriculture of Sion, Switzerland. The device can be considered a pre-commercial prototype [12]. The DA-Head, besides grading fruit on the basis of their size, contemporaneously groups the fruit according to their ripening stage using 2 or 3 remote sensors (DA-heads) which are able to read the IAD of fruit passing on a moving belt. The DA-Heads can be adapted to standard commercial grading machines and operate and select fruit at the same speed of the sorting machine itself, approximately 15 fruit/s.
From the practical point of view, it is a very important achievement that the IAD groups the fruit in homogeneous classes according to their ripening stage, starting in field conditions with the portable DA-Meter and at the packinghouse with the DA-Head.

2.3. The Difference Absorbance Fruit Logger (DAFL)

The last device along the productive chain is the DAFL (Figure 1C). It is a small device positioned over a batch of fruit stored in a cold room that continuously monitors the IAD and the temperature data of each fruit remotely at programmed times (minutes, hours, days, etc.). The data are transmitted via radio signal to a receiver unit connected to a computer, and the information is available through Internet connection [6].

3. Major Accomplishments with the Use of the Devices

3.1. Assessing Proper Harvest Time

The portable DA-Meters (DA-Meter, Kiwi-Meter and Cherry-Meter) are mainly used to monitor the ripening process of fruit still attached to the tree and to assess the proper time to harvest. In particular, in some fruit species (i.e., peach and nectarine) [11,13], the ripening stage can be precisely defined since the IAD and chlorophyll a amount in the outer mesocarp are highly correlated. In addition, in stone fruit, and in particular in peach, the IAD correlates with ethylene evolution, the ripening hormone responsible for flesh softening, color development, and sugar accumulation [14,15]. It is worth noting that a trial carried out for several years with different cultivars of peach and nectarine showed that each cultivar has a typical IAD value that remains constant year after year, coincident with the highest ethylene production peak. In addition, the IAD value is strongly correlated with the transcript levels of ripening related genes [13,16]. As a consequence, the determination of the IAD in nectarines and peach can precisely predict the optimal harvest time [17]. The ripening stage assessed at harvest by the IAD was also recognized and appreciated by consumers who were also able to distinguish fruit of different ripening stages. In a consumer test trial, the most desirable “Stark Red Gold” nectarine fruit were those that reached an IAD value of 0.4–0.5 [18], while “Plus Plus” peach fruit had to reach an IAD value <0.7 to be as desirable (Table 1).
For pome fruit, the IAD was also used to define the proper harvest time of several apple varieties, including “Gala”, “Golden Delicious”, “Red Delicious”, “Fuji”, “Granny Smith”, and “Pink Lady” [18,19,20] and of “Abbé Fétel”pear [5]. A consumer test trial performed with “Gala” apples indicated that the most desirable fruit were harvested at an IAD value of 0.6–0.9 [19]. Using “Abbé Fètel” pear, a consumer test trial performed with more than 100 people at the “AGER-Innovapero” Conference (Ferrara, Italy, 18 October 2013) [21] at the end of the storage period showed that the most desirable fruit were those harvested when the IAD had reached value of 1.8–1.9, but when the IAD value was >2 the fruit were not as desirable to consumers.
For cherry, the ripening stage expressed as IAD correlates with anthocyanin content (Figure 2) as well as with other traits normally used to assess fruit quality [3].
With Actinidia deliciosa kiwifruit, the robustness of IAD use is represented by the fact that the IAD value significantly correlates with the standard fruit quality trait values (Figure 2) normally used for assessing fruit maturity [10,22]. “Hayward” kiwifruit must be harvested when the soluble solids concentration (SSC) reaches a minimum value of 6.2 °Brix [23]. In some seasons, ripening of Actinidia deliciosa fruit, expressed as SSC values, evolves slowly in the last period of fruit growth, complicating the definition of the evolution of fruit ripening. When the Kiwi-meter is used in such circumstances, the IAD might not be fully able to detect small changes in ripening, and readings must be taken with a high accuracy to have robust and suitable data. In contrast, with Actinidia chinensis fruit, harvest must be performed when the flesh color changes from green to yellow, a change normally occurring at a hue angle of 103°–105° determined with a colorimeter (Figure 3) [10,24]. However, this determination requires fruit destruction and, as a consequence, can be only performed on a limited number of fruit. The Kiwi-Meter allows a much larger fruit sample, and the IAD results are significantly correlated with hue angle (R2 = 0.819). As a result the ripening stage expressed as IAD is more reliable and repeatable [12,23] on most of the yellow-fleshed cultivars. In addition, the IAD robustness is also underlined by the fact that the value is constant across years as shown in pome and stone fruit [12,13,25].

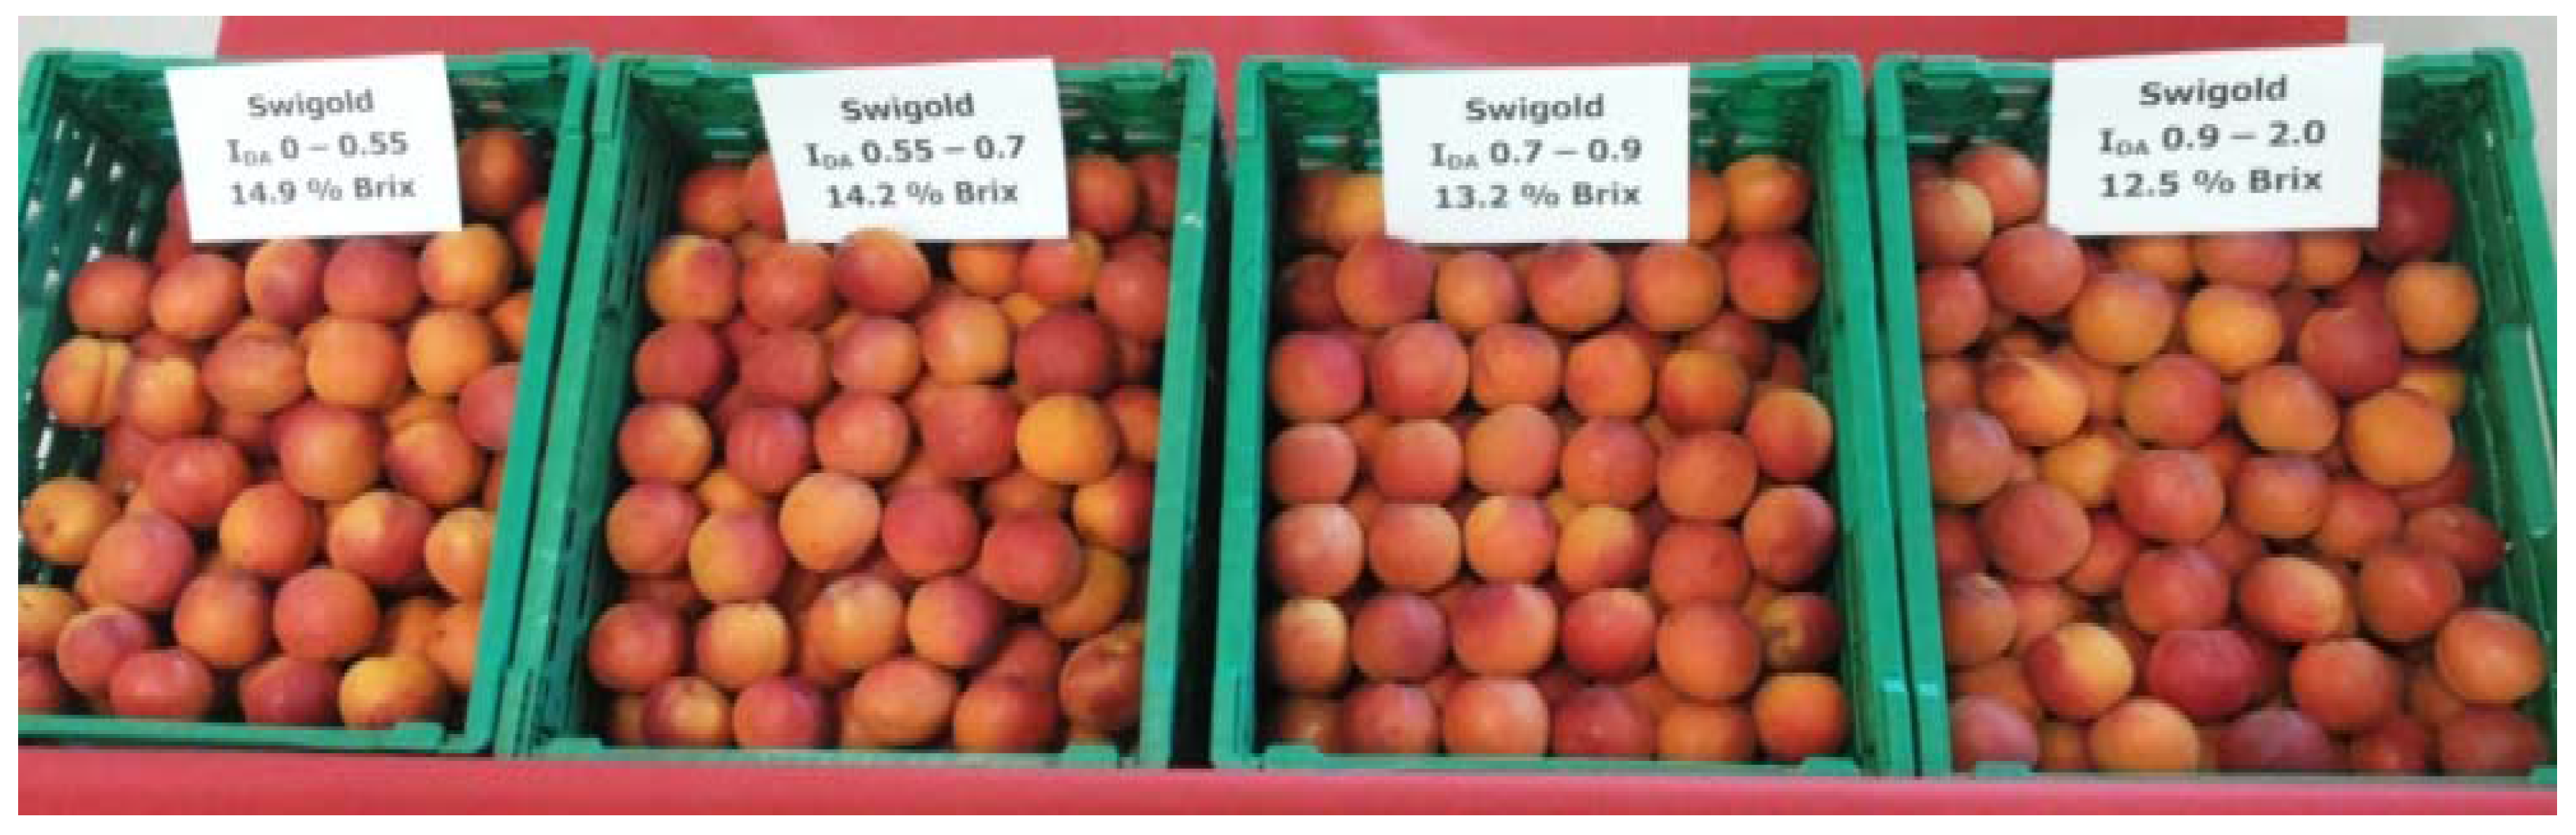
3.2. Grouping Fruit in Ripening Homogeneous Classes

The possibility of grouping fruit in homogeneous classes according to their ripening stage is an important use for the IAD, especially for fruit undergoing longer storage periods. Such information can be easily obtained by the IAD value determined at harvest with the DA-Meter on a limited number of fruit, or at the packinghouse with the DA-Head, so that all of the harvested fruit can be grouped into homogeneously-ripening classes. Such trials have been carried out on peach, apricot, apple, pear and kiwifruit. For instance, the DA stationary machine was able to detect within commercial classes of fruit differences that were not previously noticed using standard methods of evaluation, as in the case of classes of “Plus Plus” peaches that were further grouped into 4 subclasses of fruit according to the more precise IAD ripening measure.
Moreover, the differences detected by these new devices, and represented by the IAD index, are economically useful since the consumers are able to recognize the differences in ripening determined by the DA-Meter and appreciate more ripened fruit (Table 1). The same information was also obtained with several cultivars of apricot where the fruit were grouped into classes of uniform ripening with the DA-head device. Notably, consumer appreciation was related to fruit quality/ripening and but was influenced very little by appearance for “Swigold” apricot. In fact, although fruit ripening was quite different among the classes (4 classes characterized by the following IAD values, 0–0.5; 0.5–0.7; 0.7–0.9, and 0.9–2.0, and by the soluble solids content, 14.9; 14.2; 13.2 and 12.5 °Brix, respectively, fruit appearance (skin color and fruit size) in the 4 classes was practically identical (Figure 4) [12], demonstrating that the traditional methodologies, such as colorimeter or caliper measurements, are not suitable for effectively determining fruit physiological stage.

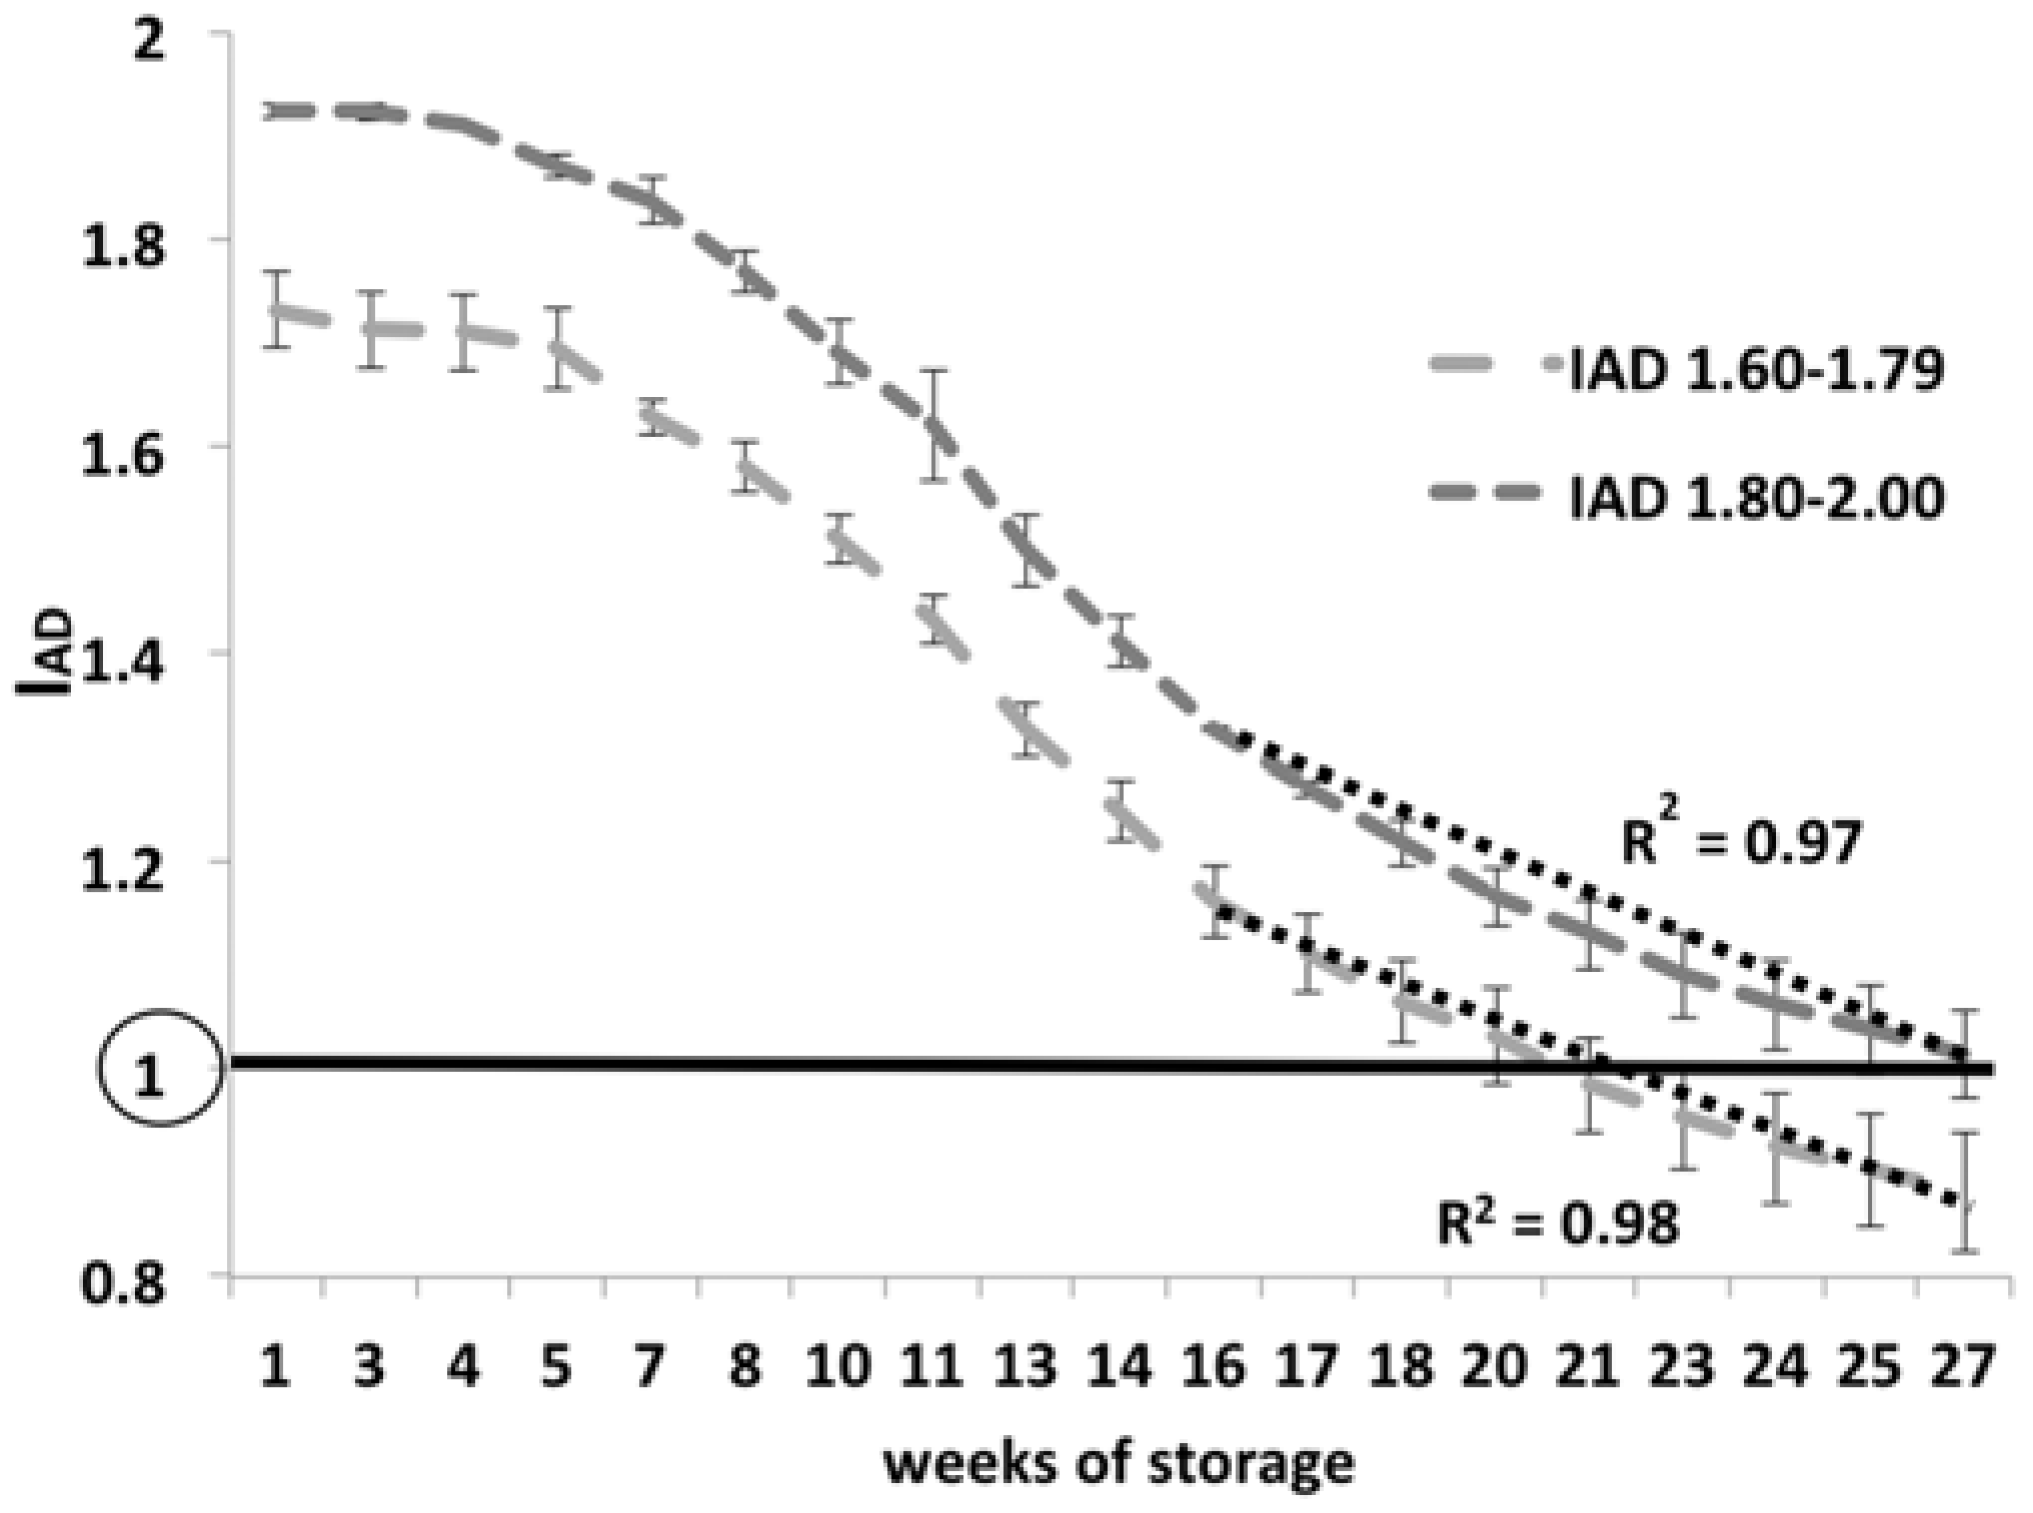
3.3. Fruit Ripening Monitoring in Cold Storage

The Difference Absorbance Fruit Logger (DAFL) (Figure 1C) monitors ripening stage of the fruit maintained in cold room during storage. Trials were carried out with apple, pear and kiwifruit and indicated that fruit collected at higher IAD values at harvest maintained higher values for the entire storage period as compared to fruit harvested at a lower IAD. In pear, the IAD value precisely followed ripening evolution in a sigmoid pattern (Figure 3). In the last phase of storage, the IAD value was linear for both lower and higher initial IAD values, allowing a tentative prediction of the span of time needed to reach the optimal IAD value before removing fruit from cold storage (arbitrarily defined as 1) and driving marketing decisions [6].

3.4. Reducing Postharvest Losses

Several studies have pointed out that fruit disease susceptibility is related to the ripening stage reached by the fruit at harvest [26,27,28]. In apple, superficial scald susceptibility trials were performed with 3 varieties, “Red Delicious”, “Granny Smith”, and “Pink Lady”, and revealed that when the harvest was performed too early, the fruit were significantly affected by scald. For the susceptible variety “Granny Smith”, fruit were harvested at an IAD value of 1.8–2.0 (early ripening, fruit not fully ripe). Scald incidence reached 100% after just two months of storage. In contrast, when fruit were harvested later at a more advanced ripening stage (IAD of 1.6–1.8), fruit were not affected by superficial scald within the first two months of storage (Figure 5) [20].
Also, in peach, the appearance of brown rot (Monilia fruticola) was related to the ripening stage. The damage caused by the fungus was more severe on fruit characterized by an advanced ripening stage [29].

4. Final Remarks

The results of research carried out over the last few years on some of the main temperate fruit species indicated that the IAD represents a powerful and reliable tool for assessing fruit ripening. The IAD devices allow monitoring the evolution of ripening from the field until removal from cold storage. Fruit ripening measured in the field with the DA-Meter establishes the proper harvest time and gives preliminary information about the homogeneity of fruit ripening. Furthermore, at the packinghouse, use of the DA-Head allows grouping of the fruit into homogeneously-ripening classes driving decisions on the best storage strategies and subsequent marketing. Finally, in cold storage, the DAFL allows continuous monitoring of the evolution of fruit ripening.
The IAD can find useful applications in the fruit production chain and represents an essential decision support system tool that can drive pre- and postharvest management of ripening fruit.

Acknowledgments

Research funded by AGER (Project “Agroalimentare e Ricerca”), grant No. 2010–2119.

Conflicts of Interest

The authors declare no conflict of interest.

References

  1. Smith, G.S.; Gravett, I.M.; Edwards, C.M.; Curtis, J.P.; Buwalda, J.G. Spatial analysis of the canopy of kiwifruit vines as it relates to the physical, chemical and postharvest attributes of the fruit. Ann. Bot. 1994, 73, 99–111. [Google Scholar] [CrossRef]
  2. Dallabetta, N.; Costa, F.; Pasqualini, J.; Wehrens, R.; Noferini, M.; Costa, G. The influence of training system on apple fruit quality. Acta Hortic. 2013, 1058, 55–62. [Google Scholar] [CrossRef]
  3. Nagpala, E.G.L.; Noferini, M.; Farneti, B.; Piccinini, L.; Costa, G. Cherry-Meter: An innovative nondestructive (vis/NIR) device for cherry fruit ripening and quality assessment. In Proceedings of the 7th ISHS Internation Symposium on Cherry, Plasencia, Spain, 23–27 June 2013; ISHS: Leuven, Belgium in press.
  4. Bonora, E.; Noferini, M.; Vidoni, S.; Costa, G. Modeling fruit ripening for improving peach homogeneity in planta. Sci. Hortic. 2013, 159, 166–171. [Google Scholar] [CrossRef]
  5. Vidoni, S.; Rocchi, L.; Donati, I.; Spinelli, F.; Costa, G. Combined use of Planttoon® and IAD to characterize fruit ripening homogeneity in “Abbé Fétel” pears. Acta Hortic. 2015. [Google Scholar] [CrossRef]
  6. Vidoni, S.; Fiori, G.; Rocchi, L.; Spinelli, F.; Musacchi, S.; Costa, G. DAFL: New innovative device to monitor fruit ripening in storage. Acta Hortic. 2015, 1094, 549–554. [Google Scholar] [CrossRef]
  7. Harman, J.E. Kiwifruit maturity. Orchard. N. Z. 1981, 54, 126–127. [Google Scholar]
  8. Shewfelt, R.L. What is quality? Postharvest Biol. Technol. 1998, 15, 197–200. [Google Scholar] [CrossRef]
  9. Costa, G.; Fiori, G.; Torrigiani, P.; Noferini, M. Use of Vis/NIR spectroscopy to assess fruit ripening stage and improve management in post-harvest chain. In New Trends in Postharvest Management of Fresh Produce I, Fresh Produce 3 (Special Issue 1) ed.; Sivakumar, D., Ed.; Global Science Book: Ikenobe, Japan, 2009; pp. 1–6. [Google Scholar]
  10. Costa, G.; Bonora, E.; Fiori, G.; Noferini, M. Innovative nondestructive device for fruit quality assessment. Acta Hortic. 2011, 913, 575–581. [Google Scholar] [CrossRef]
  11. Costa, G.; Bonora, E.; Noferini, M. Modeling system and vis-NIR devices to improve pre- and post-harvest management. Acta Hortic. 2015, 1084, 809–821. [Google Scholar] [CrossRef]
  12. Costa, G.; Fiori, G.; Rocchi, L.; Vidoni, S.; Berthod, N.; Besse, S.; Knieling, S.; Rossier, J. A prototype of a stationary DA-device to group the apricots in classes of homogeneous ripening. In Proceedings of the ISHS XVI International Symposium on Apricot Breeding and Culture, Shenyang, China, 29 June–3 July 2015.
  13. Ziosi, V.; Noferini, M.; Fiori, G.; Tadiello, A.; Trainotti, L.; Casadoro, G.; Costa, G. A new index based on Vis spectroscopy to characterize the progression of ripening in peach fruit. Postharvest Biol. Technol. 2008, 49, 319–329. [Google Scholar] [CrossRef]
  14. Ruperti, B.; Cattivelli, L.; Pagni, S.; Ramina, A. Ethylene-responsive genes are differentially regulated during abscission, organ senescence and wounding in peach (Prunuspersica). J. Exp. Bot. 2002, 53, 429–437. [Google Scholar] [CrossRef] [PubMed]
  15. Trainotti, L.; Zanin, D.; Casadoro, G. A cell-oriented genomic approach reveals a new and unexpected complexity of the softening in peaches. J. Exp. Bot. 2003, 54, 1821–1832. [Google Scholar] [CrossRef] [PubMed]
  16. Tadiello, A.; Ziosi, V.; Negri, A.S.; Noferini, M.; Fiori, G.; Busatto, N.; Espen, L.; Costa, G.; Trainotti, L. On the role of ethylene, auxin and a GOLVEN-like peptide hormone in the regulation of peach ripening. BMC Plant Biol. 2016. [Google Scholar] [CrossRef] [PubMed]
  17. Bonora, E.; Noferini, M.; Stefanelli, D.; Costa, G. A new simple modeling approach for the early prediction of harvest date and yield in nectarines. Sci. Hortic. 2014, 172, 1–9. [Google Scholar] [CrossRef]
  18. Costa, G.; Noferini, M. Use of Nondestructive devices as a decision support system for fruit quality enhancement. Acta Hortic. 2013, 998, 103–115. [Google Scholar] [CrossRef]
  19. Costamagna, F.; Giordani, L.; Costa, G.; Noferini, M. Use of AD Index to define harvest time and characterize ripening variability at harvest in “Gala”apple. Acta Hortic. 2013, 998, 117–123. [Google Scholar] [CrossRef]
  20. Farneti, B.; Gutierrez, M.S.; Novak, B.; Busatto, N.; Ravaglia, D.; Spinelli, F.; Costa, G. Use of the index of absorbance difference (IAD) as a tool for tailoring post-harvest 1-MCP application to control apple superficial scald. Sci. Hortic. 2015, 16, 110–116. [Google Scholar] [CrossRef]
  21. Costa, G.; Rossi, D.; Tamburini, E.; Donegà, V.; Loberti, R. Innovazioni di processo per unapericoltura di qualità. L’Inf. Agrar. 2013, 36, 44–46. (In Italian) [Google Scholar]
  22. Pellegrino, S.; Costamagna, F.; Noferini, M.; Costa, G. Monitoring of “Hayward” (Actinidiadeliciosa) fruit ripening in North-West Italy. Acta Hortic. 2011, 913, 665–669. [Google Scholar] [CrossRef]
  23. Rocchi, L.; Vidoni, S.; Ceccarelli, A.; Fiori, G.; Costa, G. Use of the DA-indexTM for monitoring fruit ripening evolution in A. chinensis to precisely assess harvesting time “in planta”. J. Berry Sci. 2016. [Google Scholar] [CrossRef]
  24. Costa, G.; Vidoni, S.; Rocchi, L.; Cellini, A.; Buriani, G.; Donati, I.; Spinelli, F. Innovative nondestructive device for fruit quality assessment and early disease diagnosis. Acta Hortic. 2015, 1096, 69–78. [Google Scholar] [CrossRef]
  25. Costa, G.; Noferini, M.; Fiori, G.; Ziosi, V.; Berthod, N.; Rossier, J. Establishment of the optimal harvest time in Apricot (“Orangered” and “Bergarouge”) by means of a new Index based on Vis spectroscopy. Acta Hortic. 2010, 862, 533–539. [Google Scholar] [CrossRef]
  26. Salzman, R.A.; Tikhonova, I.; Bordelon, B.P.; Hasegawa, P.M.; Bressan, R.A. Coordinate accumulation of antifungal proteins and hexoses constitutes a developmentally controlled defense response during fruit ripening in grape. Plant Physiol. 1998, 117, 465–472. [Google Scholar] [CrossRef] [PubMed]
  27. Guillén, F.; Castillo, S.; Zapata, P.J.; Martínez-Romero, D.; Valero, D.; Serrano, M. Efficacy of 1-MCP treatment in tomato fruit: 2. Effect of cultivar and ripening stage at harvest. Postharvest Biol. Technol. 2006, 42, 235–242. [Google Scholar] [CrossRef]
  28. Cantu, D.; Vicente, A.R.; Greve, L.C.; Dewey, F.M.; Bennett, A.B.; Labavitch, J.M.; Powell, A.L.T. The intersection between cell wall disassembly, ripening, and fruit susceptibility to Botrytis cinerea. Proc. Natl. Acad. Sci. USA 2008, 105, 859–864. [Google Scholar] [CrossRef] [PubMed]
  29. Spadoni, A.; Cameldi, I.; Noferini, M.; Bonora, E.; Costa, G.; Mari, M. An innovative use of DA-meter for peach fruit postharvest management. Sci. Hortic. 2016, 201, 140–144. [Google Scholar] [CrossRef]
Figure 1. The three devices assessing fruit ripening (IAD): (A) the DA-Meter at field level; (B) the DA-Head at the packinghouse level; and (C) the DAFL in cold storage.
Horticulturae 03 00012 g001
Figure 2. Correlation of skin anthocyanin content and IAD classes at harvest of “Lala Star” cherry.
Horticulturae 03 00012 g002
Figure 3. Ripening trends expressed as IAD class during storage of “Abbé Fétel” pear fruit. An IAD value = 1 shown in the figure represents the beginning of skin color change from green to yellow. In the last phase of storage, the IAD change tends to be linear.
Horticulturae 03 00012 g003
Figure 4. “Swigold” apricot grouped by the DA-head into 4 classes of ripening.
Horticulturae 03 00012 g004
Figure 5. Scald incidence (%) in Granny Smith apples harvested at two different ripening stages determined by IAD. The scald incidence was evaluated on fruit left at room at temperature for 1 week after 2, 4 and 6 months of commercial storage.
Horticulturae 03 00012 g005
Table 1. “Plus Plus” peach fruit segregated with the DA-stationary machine into 4 ripening classes, the % of the fruit in each class, and consumer likelihood of purchasing each class.
ClassIADFruits (%)Likelihood of Purchasing (%)
YesMaybeNo
00–0.45.534.057.419.4
10.4–0.722.231.959.523.4
20.7–161.119.146.823.4
3>111.28.540.421.3

