Article

Comparison of the Differences in Tolerance to Drought Stress across Five Clematis Species Based on Seed Germination and Seedling Growth

1
College of Forestry, Gansu Agricultural University, Lanzhou 730070, China
2
Wolfberry Harmless Cultivation Engineering Research Center of Gansu Province, Lanzhou 730070, China
3
Gansu Bailongjiang Forestry Ecological Monitoring and Inventigation Planning Institute, Gannan 730030, China
*
Author to whom correspondence should be addressed.
Horticulturae 2024, 10(3), 288; https://doi.org/10.3390/horticulturae10030288
Submission received: 24 February 2024 / Revised: 13 March 2024 / Accepted: 14 March 2024 / Published: 17 March 2024
(This article belongs to the Section Biotic and Abiotic Stress)

Abstract

:
Plants of the Clematis genus are attractive ornamental plants due to their various flower colors and patterns, and they play an important role as ground cover plants in landscaping. However, the application of Clematis plants in landscaping in arid and semi-arid areas is limited. This study used five common wild Clematis species in Gansu Province as experimental materials, including Clematis tangutica, Clematis glauca, Clematis intricata, Clematis nannophylla, and Clematis fruticosa. By simulating different intensities of drought stress with polyethylene glycol (PEG), the germination behavior of seeds and the physiological and biochemical responses of seedlings of these five species to drought stress were observed. The results showed that 15% PEG stress significantly inhibited the seed germination of the five species, which was also the drought threshold for seed germination of C. fruticosa. C. tangutica exhibited the strongest tolerance to drought stress in seed germination. Seedlings of the five Clematis plants showed different levels of tolerance to drought stress, mainly demonstrating higher tolerance to 10% and 20% concentrations of PEG stress, while a 30% concentration of PEG stress caused varying degrees of damage to the seedlings of the five Clematis species. PCA analysis indicated that seedlings of C. intricata and C. glauca had higher scores under drought stress. These findings can provide a theoretical basis for the selection of urban landscaping plant species in arid and semi-arid regions of northwest China.

1. Introduction

As urban areas expand globally, urban water resources are facing immense pressure due to population concentration, urbanization, and climate change [1]. The Sixth Assessment Report of the Intergovernmental Panel on Climate Change (IPCC) reveals that global warming caused by human activities has exceeded pre-industrial levels by 1.0 °C, and it is projected to reach 1.5 °C in 2030–2052 [2]. Research has also indicated that by 2030, climate change will significantly alter the global pattern and distribution of water supply, leading to an increase in the frequency of extreme events such as floods and droughts [3,4,5,6]. Meanwhile, the intensification of climate change has further increased the frequency and severity of urban drought, placing immense pressure on urban water supply [7], especially in arid and semi-arid regions [8,9]. Therefore, addressing the challenges of urban drought is an important component of achieving the Sustainable Development Goals (SDGs) [7].
Urban greenery is a crucial factor in creating comfort in urban areas [10,11]. Ground-covering plants serve as important basic materials and components of urban greening construction, and their application in urban green spaces is becoming increasingly prominent. However, plants in cities in the northwest region of China still frequently face water shortages. Therefore, it is crucial to focus on reducing water consumption in the construction and maintenance of green spaces and implementing water-saving practices in urban garden development, as these are urgent research areas and issues that need to be addressed in water-scarce urban environments. The selection and application of drought-tolerant plants are important technical means for water-saving garden construction. Although a large number of drought-tolerant ground-covering plants have been used in urban greening, the variety of ground-covering plants applied in arid and semi-arid regions in China is still relatively limited.
There are approximately 155 species of the Clematis genus distributed in China, accounting for 44% of the Clematis genus plants worldwide [12,13,14,15]. Clematis spp. are widely utilized in urban landscaping and ornamental horticulture in Poland, Britain, and other European countries due to their attractive flowers, distinctive fruits, and prolonged flowering period [16,17]. Despite this, research on Clematis spp. in China has predominantly centered on their medicinal properties [18]. Investigation into their ornamental characteristics is limited to species like Clematis vitalba [19], Clematis crassifolia, and Clematis cadmia [20], found in the southern regions of China. There remains a significant gap in the research on wild Clematis spp., particularly those species growing in arid and semi-arid environments, within the realms of urban landscaping and drought resilience. Clematis tangutica, Clematis glauca, Clematis intricata, Clematis nannophylla, and Clematis fruticosa are widely distributed in the arid and semi-arid regions of northwest China. Among them, C. tangutica, C. glauca, and C. intricata are classified under Clematis sect. Meclatis [21], whereas C. nannophylla and C. fruticosa belong to Clematis sect. Fruticella [22]. C. intricata has been used in the landscaping of certain cities in the northwest China, while C. fruticosa has been somewhat utilized as an important plant for water and soil conservation and landscaping in the arid and semi-arid regions of China [23].
Drought is one of the most common abiotic stress factors that adversely affect plant development and growth [24]. Seeds serve as the primary reproductive organs in most higher plants, playing a vital role in the renewal, sustainability, expansion, and regeneration of plant populations. Seed germination, a significant physiological characteristic, influences plant adaptation and survival [25]. Numerous studies have indicated that drought stress hinders seed germination [26,27,28,29], prompting the use of germination as a useful criterion for assessing water stress tolerance [30]. In addition, drought stress also affects the morphological and physiological biochemical indicators of seedlings [31,32]. Studies have demonstrated a reduction in photosynthesis when plant seedlings face water deficiency [33,34,35]. During this process, compatible solutes, such as proline, soluble sugars, and soluble proteins, help to maintain plant water balance under mild drought stress by reducing membrane permeability [36,37]. As drought stress intensifies, photosynthesis inhibition, reduced light absorption, and the excess generation of reactive oxygen species (ROS) lead to lipid peroxidation [38] and decreased photosynthetic pigment content, and ultimately accelerate plant death [39,40,41,42]. Plants have evolved efficient antioxidant defense mechanisms [43], including the important roles of superoxide dismutase (SOD) and peroxidase (POD) in scavenging excessive ROS, maintaining ROS homeostasis [44], and bolstering stress tolerance, including drought stress [38,39]. The responses of five Clematis plant species in arid and semi-arid regions of northwest China to drought stress during seed germination and seedling growth, as well as the most drought-tolerant species, remain unclear. Polyethylene glycol (PEG) can effectively simulate water stress to induce the uniform osmotic stress characteristic of dry soil [45], making it a common choice for inducing drought stress in higher plants [46,47]. Additionally, in vitro screening methods present a potentially cost-effective way to efficiently screen numerous germplasms in a short time [48]. Therefore, this study aims to simulate different intensities of drought environments using PEG stress, to investigate the effects of drought on seed germination and physiological–biochemical indicators of five common Clematis plants in northwest China, to determine the drought tolerance thresholds of these five Clematis species in seed germination and seedling growth, to evaluate their drought tolerance by comparing their performances under different drought stresses, and to identify the Clematis species with the highest tolerance to drought stress, providing a theoretical basis for developing drought-tolerant native wild plants for water-deficient cities in northwest China.

2. Materials and Methods

2.1. Experimental Materials and Experimental Site

The seed collection was conducted during the peak fruiting season from locations in their natural distribution in Gansu province, China. At least five individuals were sampled for each species. C. tangutica, C. glauca, and C. fruticosa individuals were collected from Diebu County in Gannan Tibetan Autonomous Prefecture (103°09′58″ E, 37°06′49″ N). These individuals grew at altitudes ranging from 2028 m to 2429 m, with an average annual temperature of 7.87 °C and an annual rainfall of 163.3 mm. C. intricata individuals were collected from Minqin County, Wuwei (103°04′48″ E, 38°37′12″ N) at an altitude of 1800 m, an average annual temperature of 9.34 °C, and an annual rainfall of 58.6 mm. C. nannophylla individuals were collected from Yongdeng County, Lanzhou (103°32′45″ E, 36°15′09″ N), at an altitude of 1739 m, an average annual temperature of 6.18 °C, and an annual rainfall of 121.5 mm. Seeds were randomly obtained from the fruits and stored in labeled paper bags at 4 °C after natural drying until the start of the experiment. This study was conducted in The Tree Seedling Culture Laboratory, College of Forestry, Gansu Agricultural University.

2.2. Pretreatment and Drought Stress Experiment of Seed Germination

Four drought stress treatments were prepared using osmotic solutions of PEG 6000 at concentrations of 0%, 5%, 10%, and 15%, corresponding to water potentials of 0 MPa, −0.05 MPa, −0.15 MPa, and −0.30 MPa, as calculated by Michel and Kaufmann [49]. Distilled water (0%) was used as the control. The response of seed germination to drought stress was assessed using the BP method [50] in a dark environment at 25 °C. The seeds of the five species underwent sterilization with 10% NaClO for 30 min, followed by five rinses with distilled water and a final 24 h soaking period. Seeds that were plump and of the same size were evenly distributed in 90 mm diameter Petri dishes, with two layers of filter paper covering them. The filter papers were moistened with either 5 mL of distilled water or the PEG treatment solutions. Each Petri dish contained 30 seeds and was sealed with Parafilm to minimize evaporation. This process was repeated three times for each treatment. Every three days, the seeds were transferred to fresh PEG solutions or distilled water placed on new Petri dishes with new sterilized filter paper. Prior to each use, both the Petri dishes and filter paper were sterilized.

2.3. Estimation of Gemination Parameters

The germination process was monitored by recording the number of seeds that sprouted every 24 h until no additional germination was observed within a three-day period. Germination was considered to have occurred when a radicle with a length of over 1 mm emerged from the seed.
The germination parameters included germination percentage (TG) [51], germination potential (GP) [51], germination index (GI) [51], vigor index (VI) [52], and germination drought tolerance index (GDTI) [53]. These parameters were calculated according to the following formulas:
TG   ( % ) = Total   nmuber   of   normally   germinated   seeds Number   of   seed   tested × 100
GP ( % ) = Number   of   normally   germinated   seeds   on   the   day   when   counts   of   germinated   seeds   reached   the   maximum Number   of   seeds   tested × 100
GI   = i = 1 n G i N i
Gi is the number of germinated seeds on day i. Ni is the number of days after the beginning of the experiment.
VI = GI   × radicle   length
GDTI = TG   under   PEG   stress TG   under   control
where GI is the germination index and TG is the germination percentage.

2.4. Pot Experiment for Drought Stress of Plant Growth

Seeds of the five species were sterilized and sown evenly in plastic culture pots with diameters, bottom diameters, and heights of 30 cm, 20 cm, and 25 cm, respectively. Each pot was filled with 12 kg of a mixed soil medium (vermiculite:peat soil:garden soil = 1:1:3). The soil medium had a pH of 7.8 and consisted of 5.6 g/kg of available nitrogen (N), 43 mg/kg of available phosphorus (P), and 135 mg/kg of available potassium (K). The cultivation was conducted in the Tree Seedling Culture Laboratory at the College of Forestry, Gansu Agricultural University. Seedling growth was kept for 4 months after sowing.
For each species, 120 healthy seedlings of the same height were selected and transplanted into 1/2 Hoagland’s solution for adaptable cultivation for 2 days. The plants were then treated with PEG 6000 at concentrations of 0% (control), 10% (−0.15 MPa, low-concentration drought stress), 20% (−0.51 MPa, moderated concentration drought stress), and 30% (−1.09 MPa, high-concentration drought stress), which were dissolved in Hoagland’s solution. Each treatment for each species had 3 replicates. After conducting preliminary experiments, the leaves of the seedlings were harvested following 24 h of drought stress to determine biochemical trait parameters.

2.5. Estimation Biochemical Parameters of Seedling Response to Drought Stress

2.5.1. Measurement of Photosynthetic Pigments Content

The chlorophyll extraction procedure followed the method described by Lichtenchtaler [54], with a minor modification. Fresh leaf tissue was soaked in 10 mL of 80% acetone for 24 h until the leaves became colorless. The optical density of the extracts was measured using a spectrophotometer (P9, MAPADA Instruments, Shanghai, China) at wavelengths of 470 nm, 646 nm, and 663 nm. The contents of chlorophyll a (Chl a), chlorophyll b (Chl b), and carotene (Car) were determined using the equations provided by Wellburn [55]. Additionally, the total chlorophyll content (Chl a + b) and the ratio of chlorophyll a to chlorophyll b (Chl a/b) were calculated.

2.5.2. Measurement of Lipid Peroxidation

Lipid peroxidation was measured by measuring the concentration of malondialdehyde (MDA) using the method outlined by Dhindsa et al. [56]. Fresh leaves weighing approximately 0.2 g were extracted with 5 mL of 1% trichloroacetic acid (TCA) and then centrifuged at 10,000× g for 10 min. Then, 2 mL of the supernatant was mixed with 2 mL of 0.6% thiobarbituric acid (TBA) in 10% TCA. The mixture was incubated in a water bath at 95 °C for 30 min, immediately cooled in an ice bath, and subsequently centrifuged at 10,000× g for 10 min at 4 °C. The absorbance of the resulting supernatant was measured at 450, 532, and 600 nm.

2.5.3. Measurement of Proline

The proline content was determined following the protocols established by Bates et al. [57], with slight modifications. A leaf sample of approximately 0.5 g was boiled in 3% sulfosalicylic acid (C7H6O6S·2H2O), and then filtered after cooling. The collected filtrate of 2.0 mL was mixed with 2.0 mL of glacial acetic acid and 2.0 mL of acidic ninhydrin. The reaction mixture was incubated at 100 °C for 1 h and subsequently cooled to room temperature. For extraction, 4.0 mL of toluene was added to the reaction mixture, and the absorbance was measured at 520 nm using a spectrophotometer (Model P9, MAPADA Instruments, Shanghai, China).

2.5.4. Measurement of Soluble Sugar Content

Soluble sugars were extracted using the method developed by Yemm and Willis [58] with modifications. Approximately 0.2 g leaf samples were extracted in 10 mL of distilled water and incubated in a boiled water bath for 30 min. The resulting extract was then filtered and brought to a final volume of 25 mL using distilled water. Then, 2 mL of the extract was combined with 0.5 mL of anthrone ethyl acetate and 5 mL of sulfuric acid solution, and incubated at 95 °C for 1 min. The absorbance of the samples was measured at 630 nm, and the sugar content (µg/g FW) was determined by referring to a glucose calibration curve.

2.5.5. Measurement of Soluble Protein Content

The soluble protein content was measured spectrophotometrically using the methods described by Wang [59], with modifications. Fresh leaf samples weighing 0.2 g were homogenized with 0.05 M phosphate buffer (pH 7.8) and then centrifuged for 20 min at 12,000× g. The resulting supernatant was used to assess enzyme activity as a soluble protein solution. Soluble protein content was determined using the Bradford test [60]. Afterward, 0.1 mL of this mixture was transferred to tubes and mixed with 0.9 mL of distilled water and 5 mL of G-250. The absorbance at 595 nm was measured.

2.5.6. Antioxidant Enzyme Assays

Fresh leaves weighing 0.2 g were homogenized using a pre-cooled mortar and pestle with 0.05 M phosphate buffer (pH 7.8), then subsequently centrifuged at 12,000× g for 20 min at 4 °C. The resulting supernatant was utilized for the enzyme activity assay.
Superoxide dismutase (SOD, EC 1.15.1.1) activity was assessed using the nitroblue tetrazolium (NBT) test [56] with slight modifications. To perform the test, 0.1 mL of enzyme extract was combined with 1.5 mL of 50 mM phosphate buffer (pH 7.8), 0.3 mL of 130 mM methionine (Met), 0.3 mL of 750 µM NBT, 0.3 mL of 100 µM Ethylenediaminetetraacetic acid disodium salt (EDTA-Na2), 0.3 mL of 20 µM riboflavin, and 0.5 mL of distilled water in a tube. The assay mixture was then incubated for 20 min under fluorescent illumination of 4000 lx, and the optical density at 560 nm was measured.
Peroxidase (POD, EC 1.11.1.7) activity was determined using the method described by Maehly [61], which measures the increase in absorbance at 470 nm. The reaction mixture for POD activity measurement consisted of 2.9 mL of 0.05 M phosphate buffer (pH 7.8), 1.0 mL of 2% H2O2, 1.0 mL of 0.05 M guaiacol, and 0.1 mL of the enzyme solution. The enzyme solution was boiled for 5 min and used as the control. After adding the enzyme solution to the reaction mixture, it was immediately incubated in a water bath at 37 °C for 15 min and then transferred to an ice bath immediately. To stop the reaction, 2.0 mL of 20% trichloroacetic acid was added.

2.6. Statistical Analysis

The experimental data were recorded and summarized in Microsoft Excel 2016. The results were analyzed using analysis of variance (ANOVA) with SPSS 19.0 (IBM Corporation, Armonk, NY, USA), followed by multiple mean comparison using Tukey’s HSD test (p ≤ 0.05). When the variance was not homogeneous, we used the Games–Howell’s test for multiple mean comparisons. Means were considered statistically significant at p ≤ 0.05. The means and standard errors (SEs) of each treatment were calculated.
A correlation analysis between variables under different PEG stress was performed using Spearman correlation coefficients. Principal component analysis (PCA) was used to analyze the relationship between drought stress and the biochemical characteristics of the leaves. The graphics were completed by OriginPro 2022 software.

3. Results

This study investigated the responses of seeds and seedlings from five species of Clematis to drought stress. Specifically, it examined indicators related to seed germination, as well as the physiological and biochemical responses of the leaves.

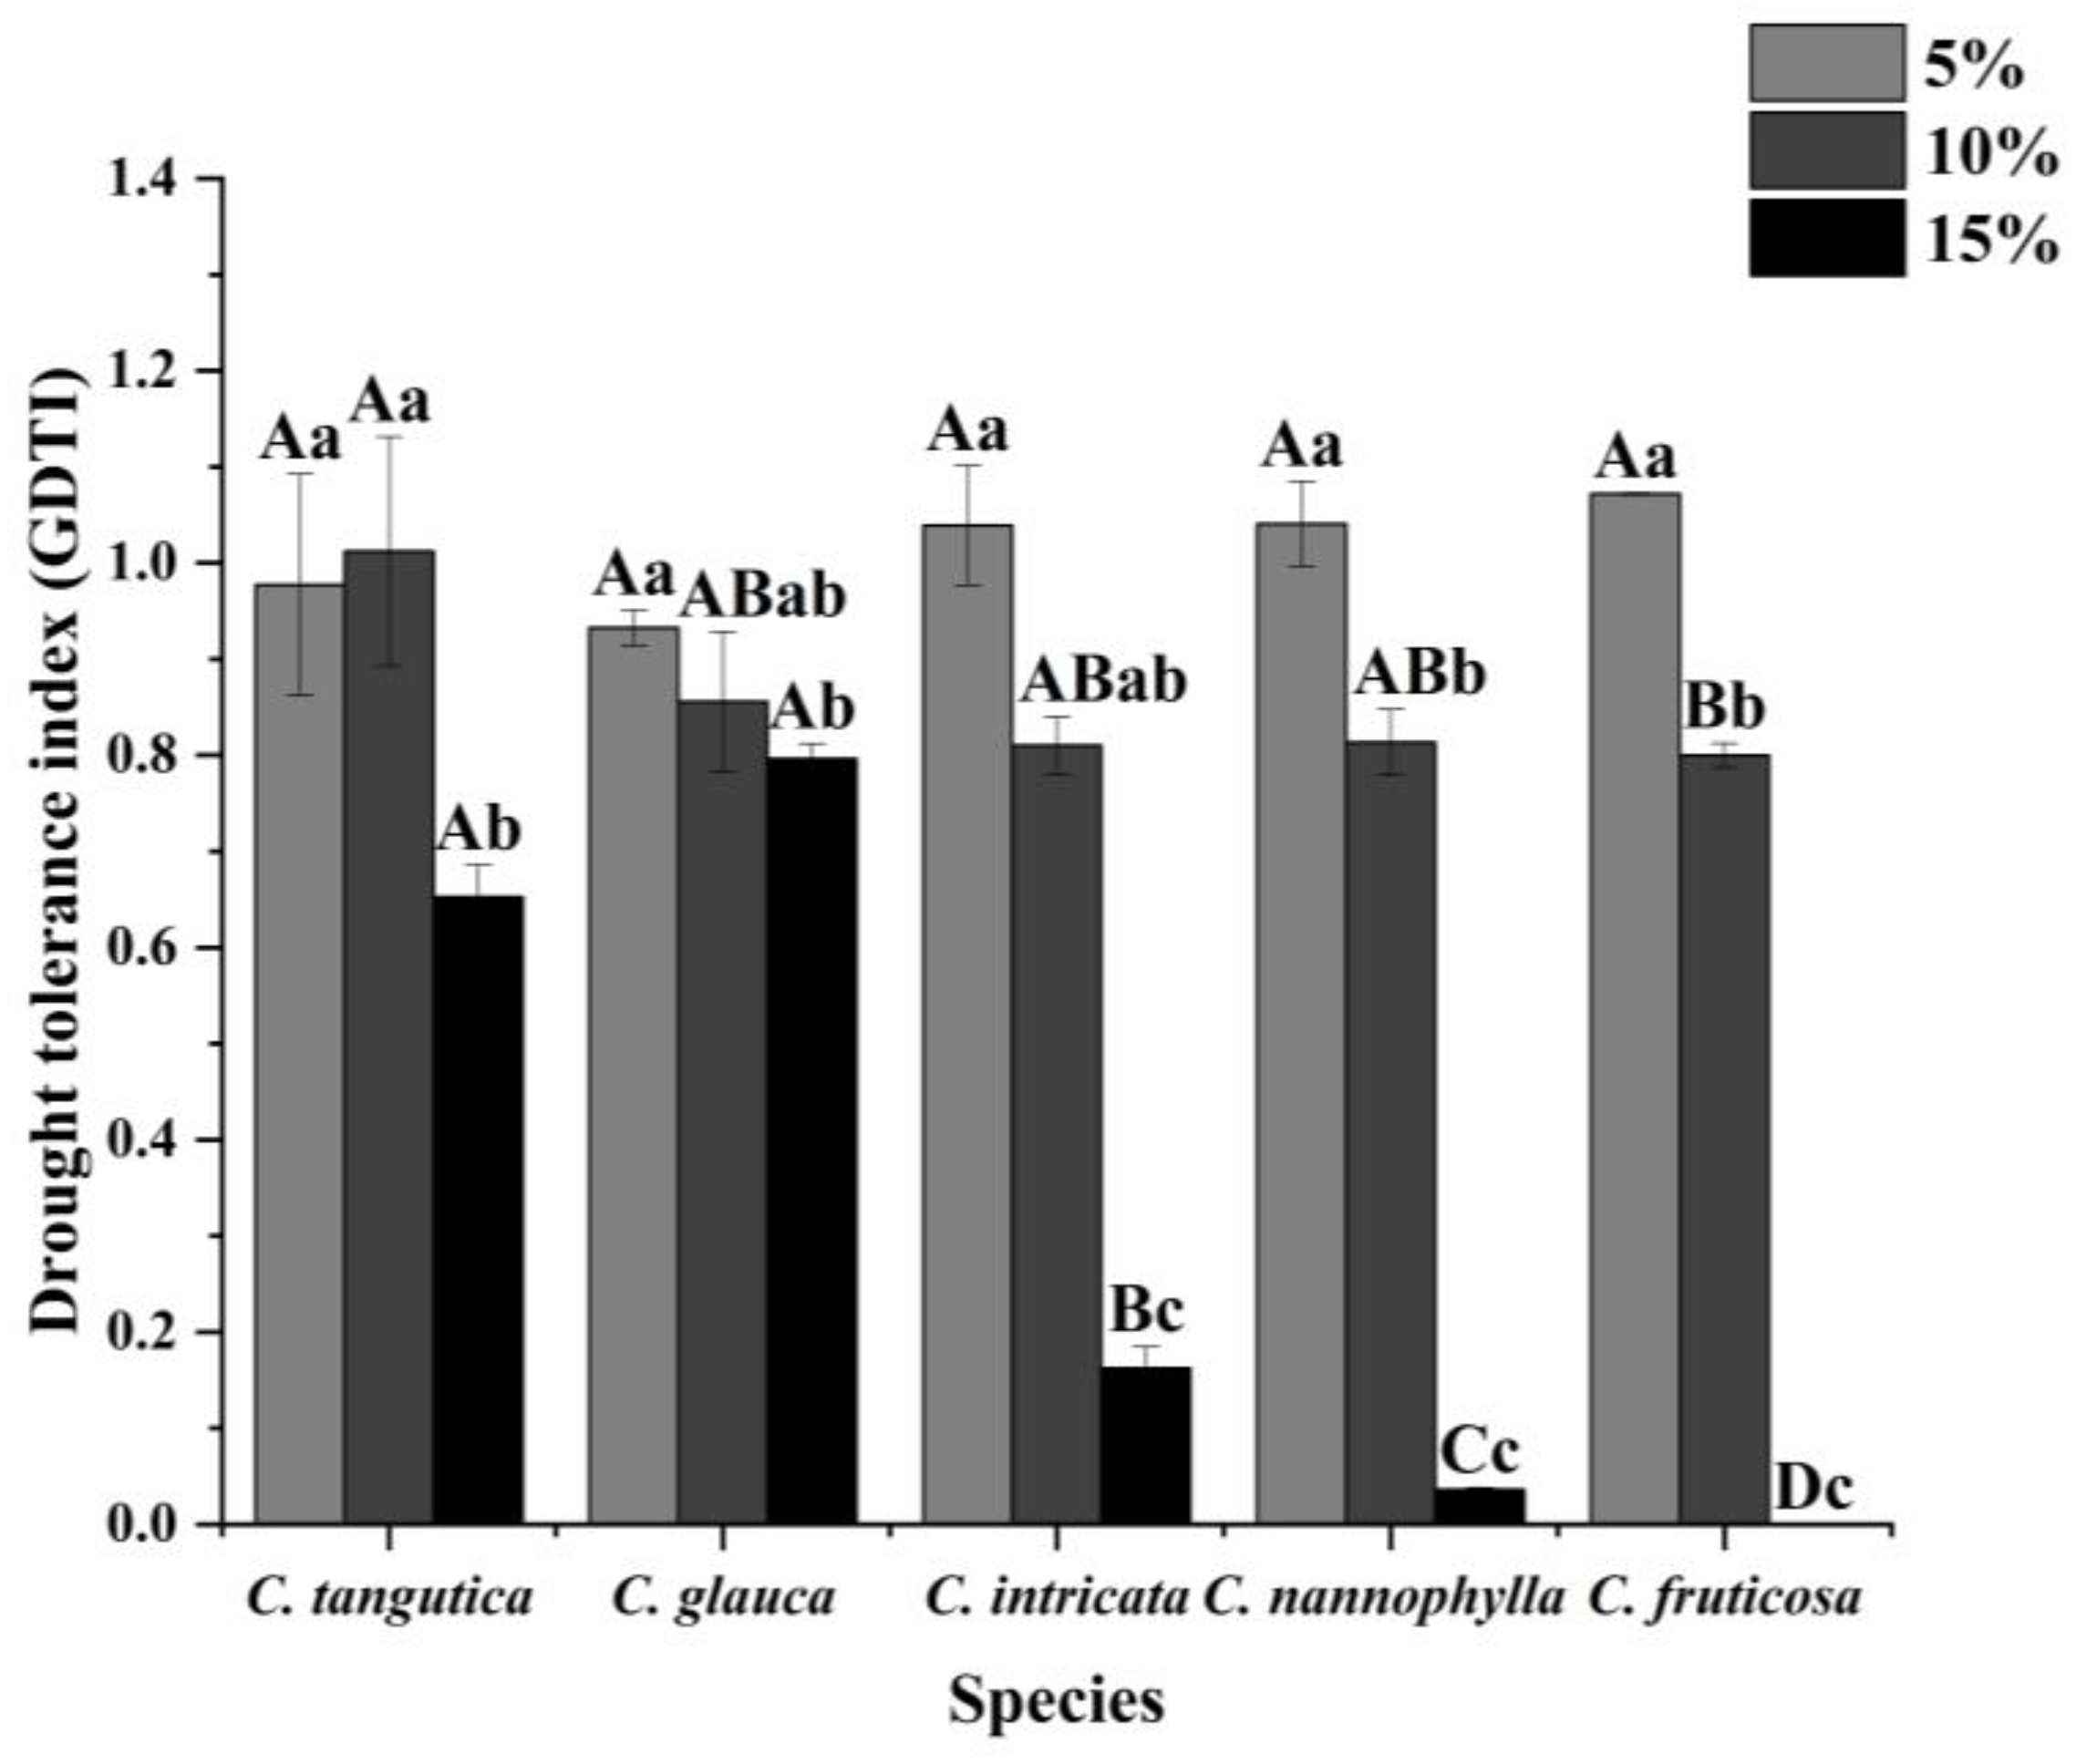
3.1. Seed Germination

The influences of PEG stress on TG, GP, GI, and VI of the five species of Clematis are shown in Table 1. Species, PEG concentration, and species × PEG concentration interactions had significant effects on all germinative parameters (p < 0.05). A 5% concentration of PEG stress promoted the TG of C. intricata and C. nannophylla to a certain extent (p > 0.05), and significantly promoted the TG of C. fruticosa. When the PEG concentration exceeded 10%, a significant decrease in TG was observed, except for in C. tangutica. The most significant inhibitory effect on TG was observed at a PEG concentration of 15%, resulting in decreases of 34.88%, 20.45%, 83.79%, 96.43%, and 100% in C. tangutica, C. glauca, C. intricata, C. nannophylla, and C. fruticosa, respectively, compared to the control (0%).
Furthermore, PEG stress exerted different effects on the GP of the five species. Below a PEG concentration of 10%, C. tangutica and C. glauca exhibited a GP above 20%, while C. intricata, C. nannophylla, and C. fruticosa displayed a GP below 18% at any PEG concentration. PEG stress significantly decreased the GP of C. tangutica, a 10% PEG concentration significantly decreased the GP of C. glauca, and a 15% PEG concentration significantly decreased the GP of all five Clematis species.
Drought stress generally decreased the GI and VI of the five species of Clematis. However, exposure to 5% and 10% concentrations of PEG instead significantly promoted the GI and VI of C. tangutica. Moreover, when exposed to a 15% PEG concentration, C. tangutica exhibited significantly higher GP, GI, and VI compared to the other four species of Clematis.
The GDTI of the five Clematis species under 5% PEG concentration stress were found to be consistently above 0.93, and there were no significant differences observed among the species (p > 0.05) (Figure 1). However, the GDTI of C. fruticosa was significantly reduced under 10% PEG stress. At a concentration of 15% PEG, C. glauca maintained the highest GDTI, followed by C. tangutica, C. intricata, and C. nannophylla. C. fruticosa exhibited no seed germination, resulting in a GDTI of 0.

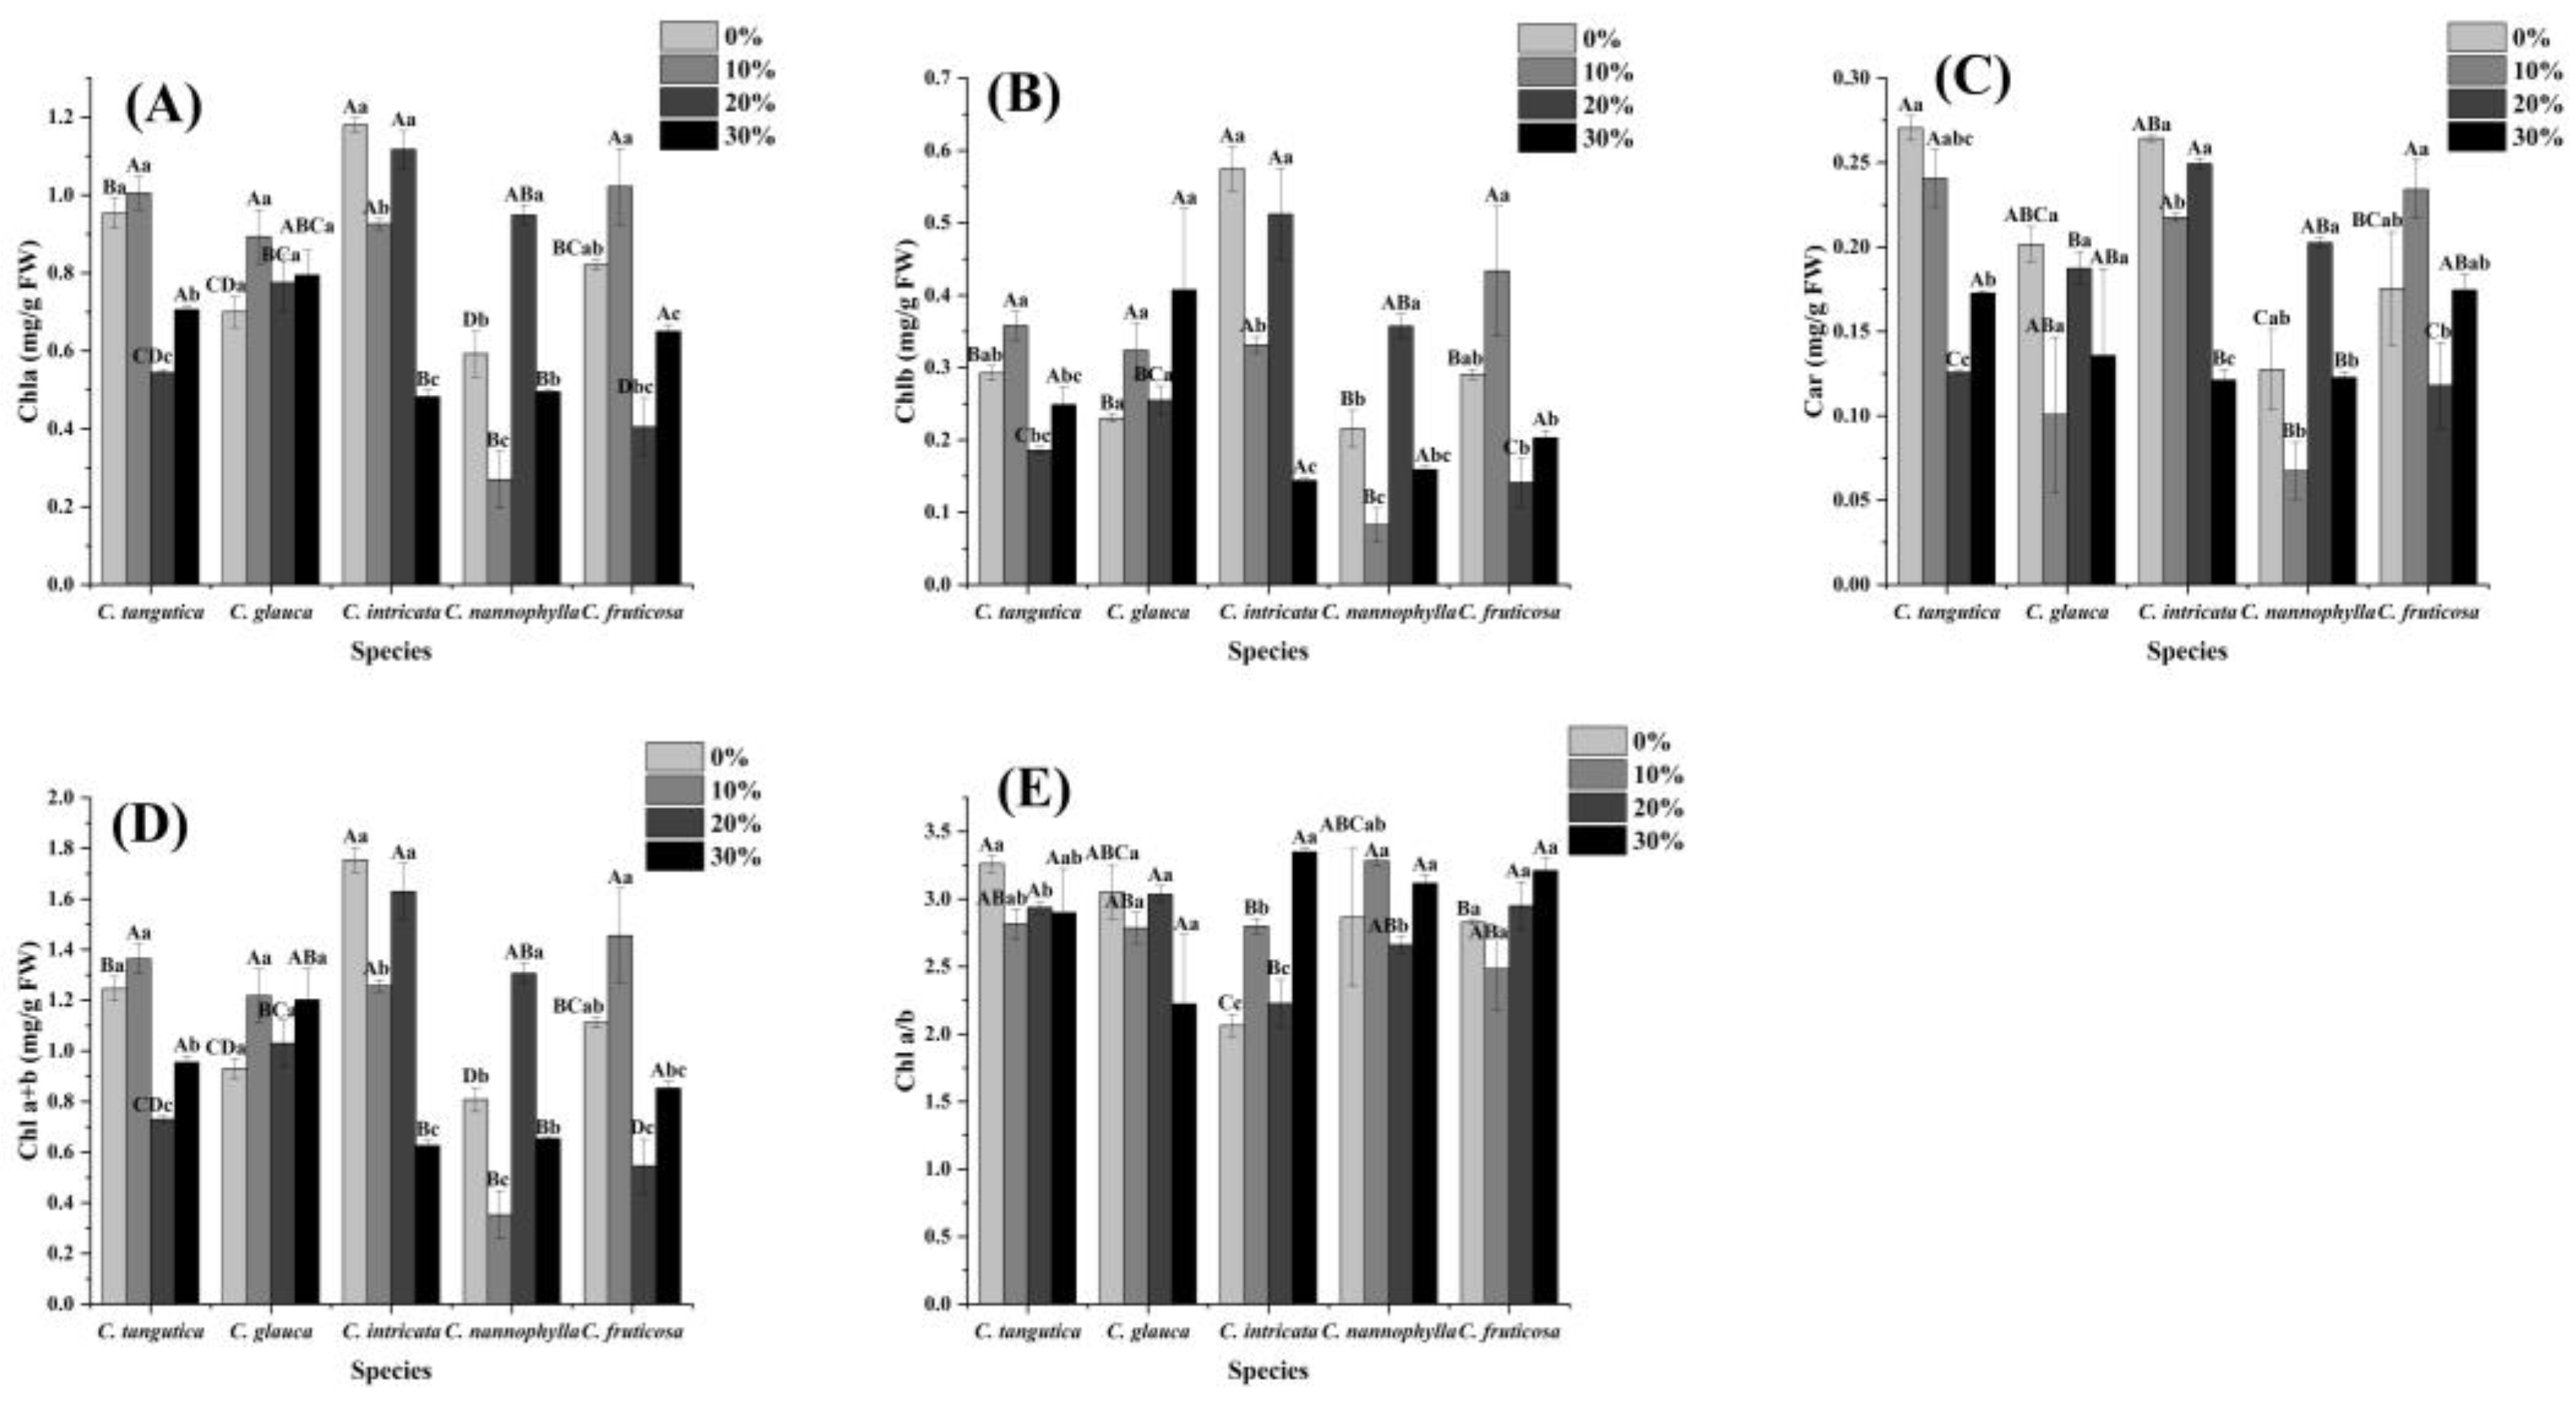
3.2. Photosynthetic Pigment Content

The results showed that the changes in the content of photosynthetic pigments (including Chl a, Chl b, Chl a + b, and Car) in the five species of Clematis under different concentrations of PEG stress were consistent. Chl a exhibited the highest content, followed by chl b, while the Car content was the lowest (Figure 2A–D). In terms of photosynthetic pigment concentration, C. intricata displayed higher levels compared to the other four Clematis species under 0%, 10%, and 20% PEG stress. However, under 30% PEG stress, C. intricata exhibited the lowest photosynthetic pigment content. The five species exhibited two distinct patterns of changes in photosynthetic pigment content under different PEG stress concentrations. The first pattern was observed in C. tangutica, C. glauca, and C. fruticosa. These species experienced decreases in photosynthetic pigment content when subjected to 20% and 30% PEG stress compared to the control (0%), with C. tangutica and C. fruticosa showing significant decreases under 20% PEG stress. However, C. glauca did not exhibit any significant changes in photosynthetic pigment content under any PEG stress. The second pattern, on the other hand, was observed in C. intricata and C. nannophylla (Figure 2A–D). These species demonstrated reductions in photosynthetic pigment content under 10% and 30% PEG stress compared to the control (0%), while their photosynthetic pigment content increased under 20% PEG stress. The trend of the Chl a/b ratio in the five Clematis species also exhibited two types: one was observed in C. tangutica, C. glauca, and C. fruticosa, while the other was evident in C. intricata and C. nannophylla. C. intricata displayed the lowest Chl a/b under the control treatment and 10% and 20% PEG stress, and no significant differences in this ratio were observed among the five species under 30% PEG stress (Figure 2E).

3.3. Membrane Lipid Peroxidation (MDA)

Figure 3 shows the MDA content of the five species of Clematis under different concentrations of drought stress. The results indicated that drought stress significantly induced MDA accumulation in all five species of Clematis. Specifically, there was a significant increase in MDA content for C. intricata and C. nannophylla when exposed to PEG concentrations above 10%, and for C. glauca when exposed to PEG concentrations above 20%. Similarly, C. tangutica exhibited a significant increase in MDA content when subjected to a 30% PEG concentration. Compared to the control, the MDA content increased by 88.49% for C. tangutica, 151.05% for C. glauca, 436.94% for C. intricata, 38.30% for C. nannophylla, and 210.30% for C. fruticosa, respectively.

3.4. Osmoregulatory Substances

3.4.1. Proline

Drought stress significantly induced the proline content of the five species of Clematis. The highest proline production was observed at 10% PEG stress (except for C. glauca), with proportions of 447.23%, 350.22%, 247.04%, and 475.20% of the control for C. tangutica, C. intricata, C. nannophylla, and C. fruticosa, respectively. Although the proline content gradually decreased under 20% and 30% PEG stress, it remained higher than the control. Among the five species, C. intricata showed the highest proline content under any concentration of PEG stress (Figure 4A).

3.4.2. Soluble Sugar

Drought stress significantly increased the content of soluble sugars in all five Clematis species. Notably, the application of 20% PEG stress resulted in the most substantial accumulation of soluble sugars (except for C. glauca): 20% PEG stress induced the highest accumulation of soluble sugars, with increases of 157.60%, 210.36%, 173.22%, and 200.93% compared to the control for C. tangutica, C. intricata, C. nannophylla, and C. fruticosa, respectively. Under drought stress, C. intricata still exhibited the highest soluble sugar content among the five species (Figure 4B).

3.4.3. Soluble Protein

Drought stress resulted in an increase in the soluble protein content across all five species of Clematis. However, this difference was found to be significant under 20% PEG stress in C. tangutica, C. glauca, and C. nannophylla. The induced soluble protein content at this concentration was 113.09%, 122.65%, and 112.07% of the respective controls. The soluble protein content of C. intricata significantly increased under 30% PEG stress, and the content was 110.37% of the control (Figure 4C).

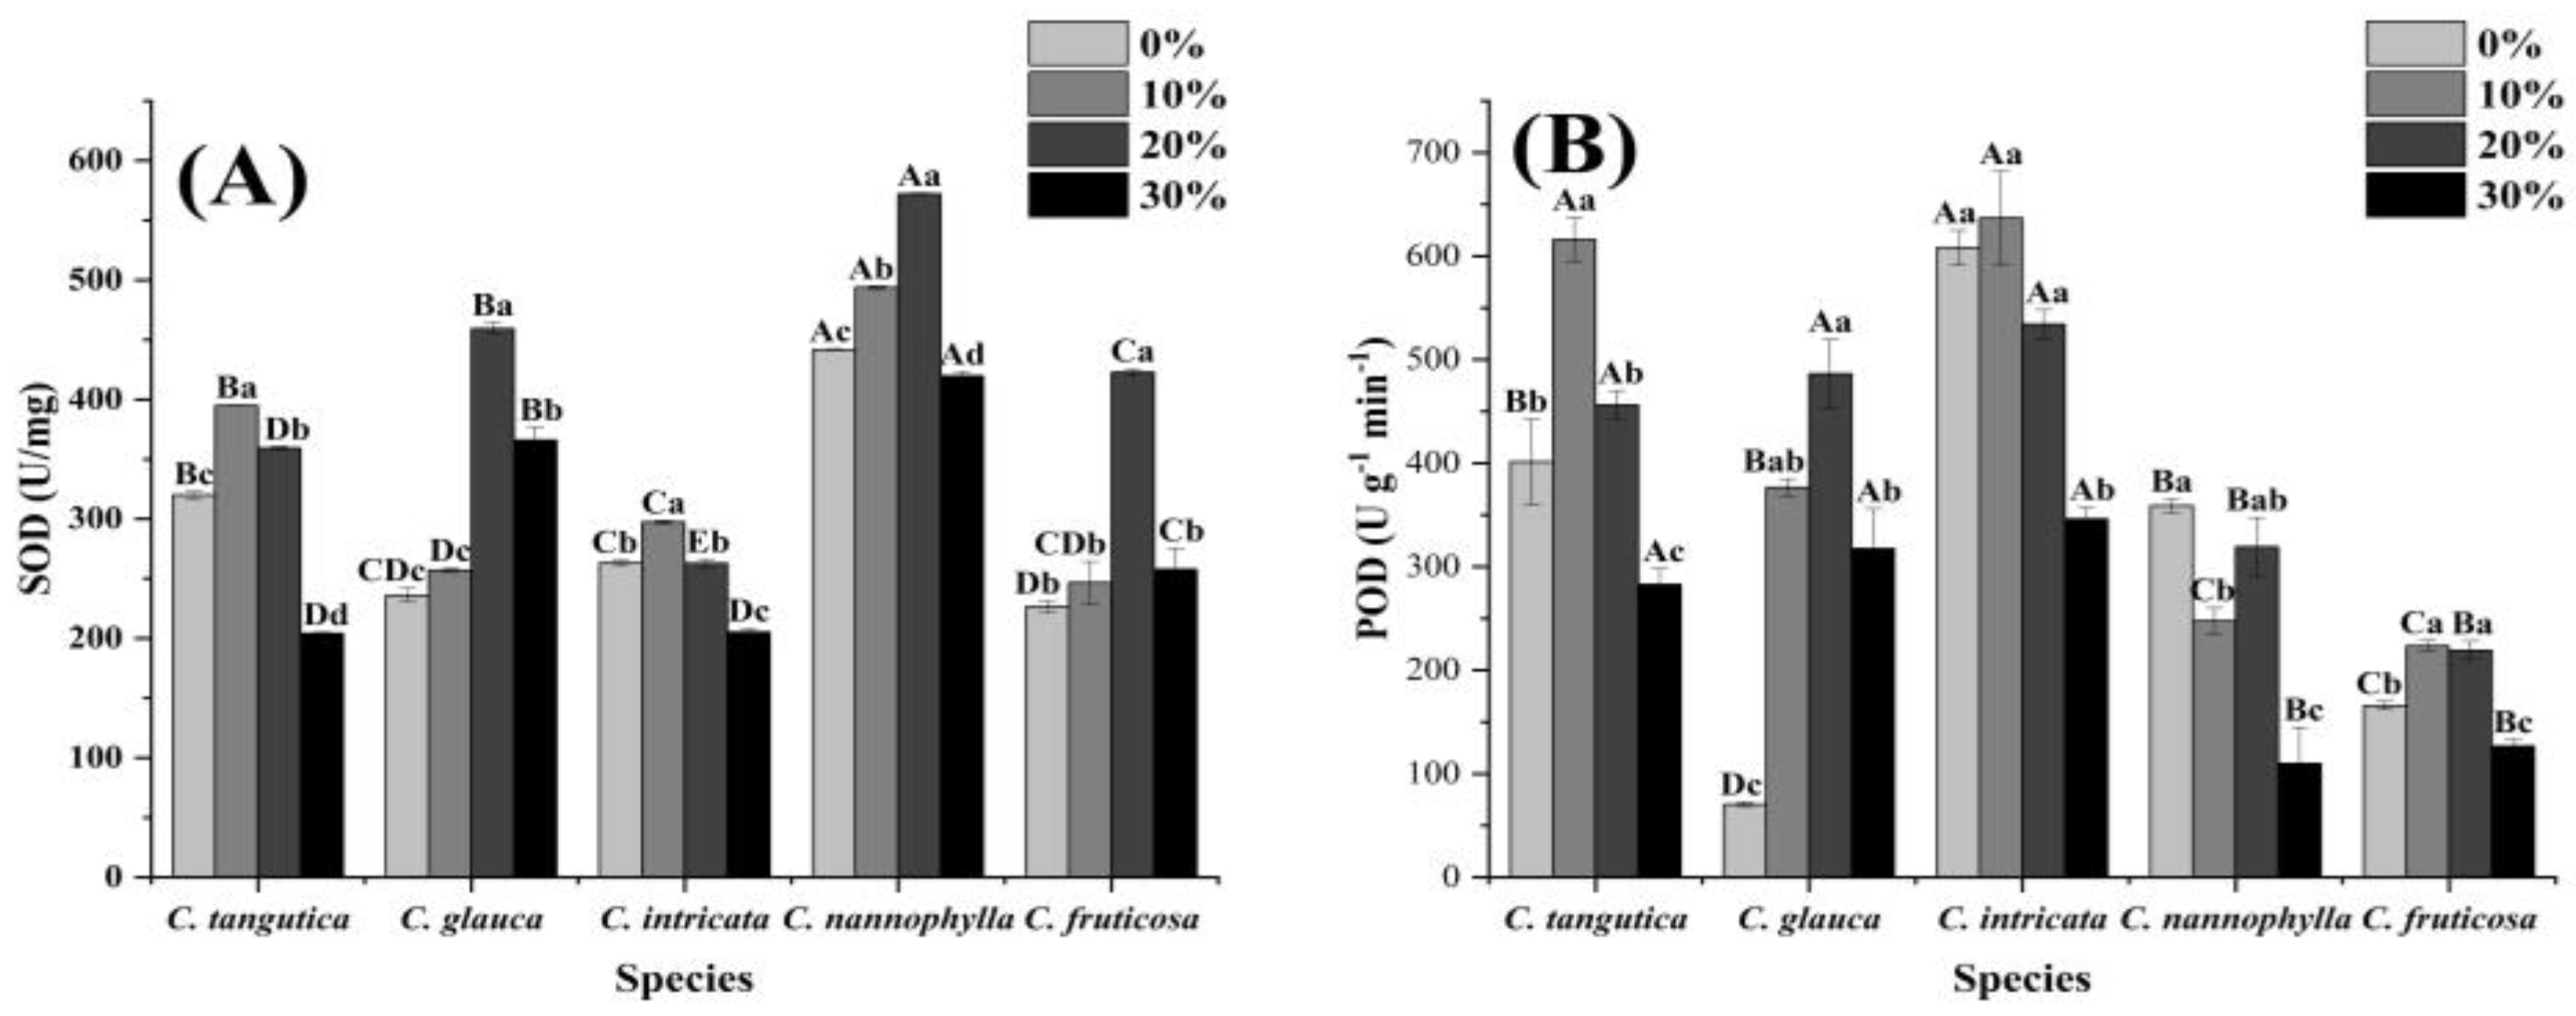
3.5. Antioxidant Enzyme Activity

We also measured the variations in SOD and POD activities in the leaves of the five species of Clematis under drought stress. Figure 5 showed that the SOD and POD activities in all five species displayed an initial increase followed by a subsequent decrease under different concentrations of PEG stress. Specifically, exposure to 10% PEG stress led to the highest SOD and POD activities in C. tangutica and C. intricata, while the maximum values for C. glauca, C. nannophylla, and C. fruticosa were observed at a stress concentration of 20% PEG (except for POD activity in C. nannophylla). Furthermore, the application of 30% PEG stress resulted in a decline in SOD and POD activities across all five Clematis species, with significant reductions observed in C. tangutica, C. intricata, and C. nannophylla compared to the control.

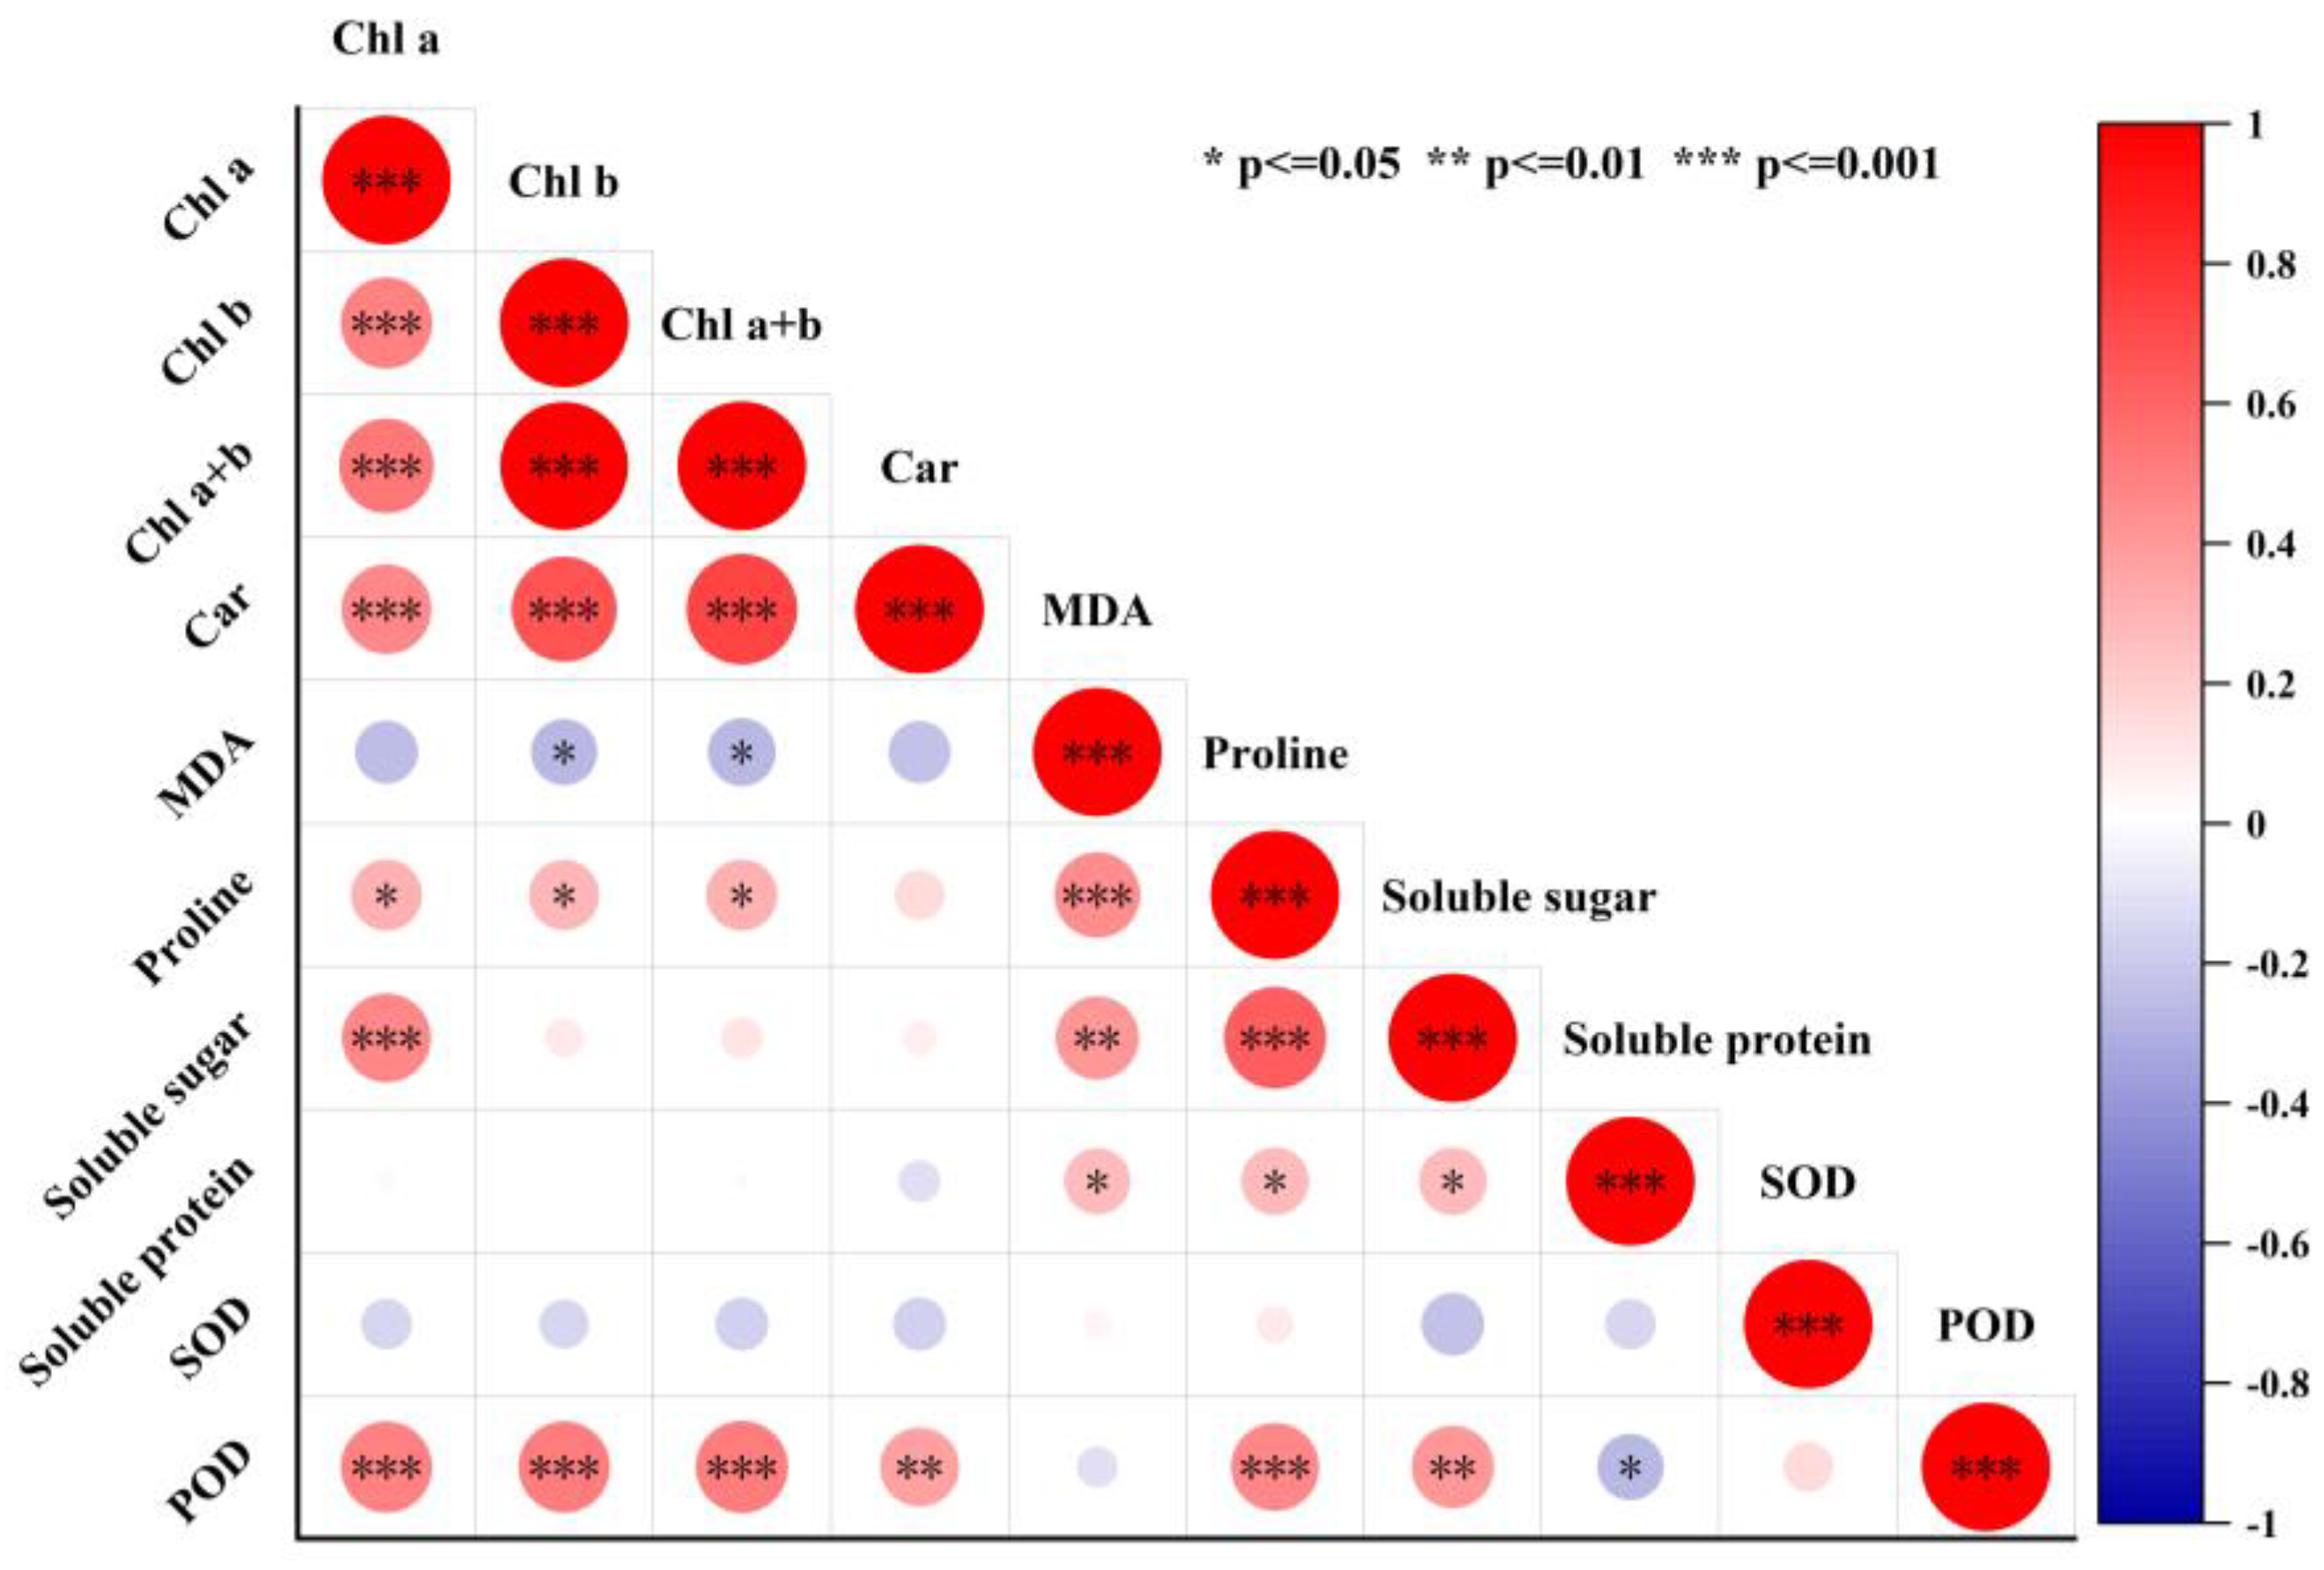
3.6. Correlation Analysis of Biochemical Parameters

Spearman correlation analysis (Figure 6) revealed a relationship among the leaf biochemical parameters of the five Clematis species. A highly significant positive correlation was observed among the contents of leaf photosynthetic pigments. The photosynthetic pigment contents exhibited a highly significant correlation with POD activity, a positive correlation with proline, and a negative correlation with MDA content. Additionally, MDA content exhibited significant positive correlations with proline, soluble sugar, and soluble protein.

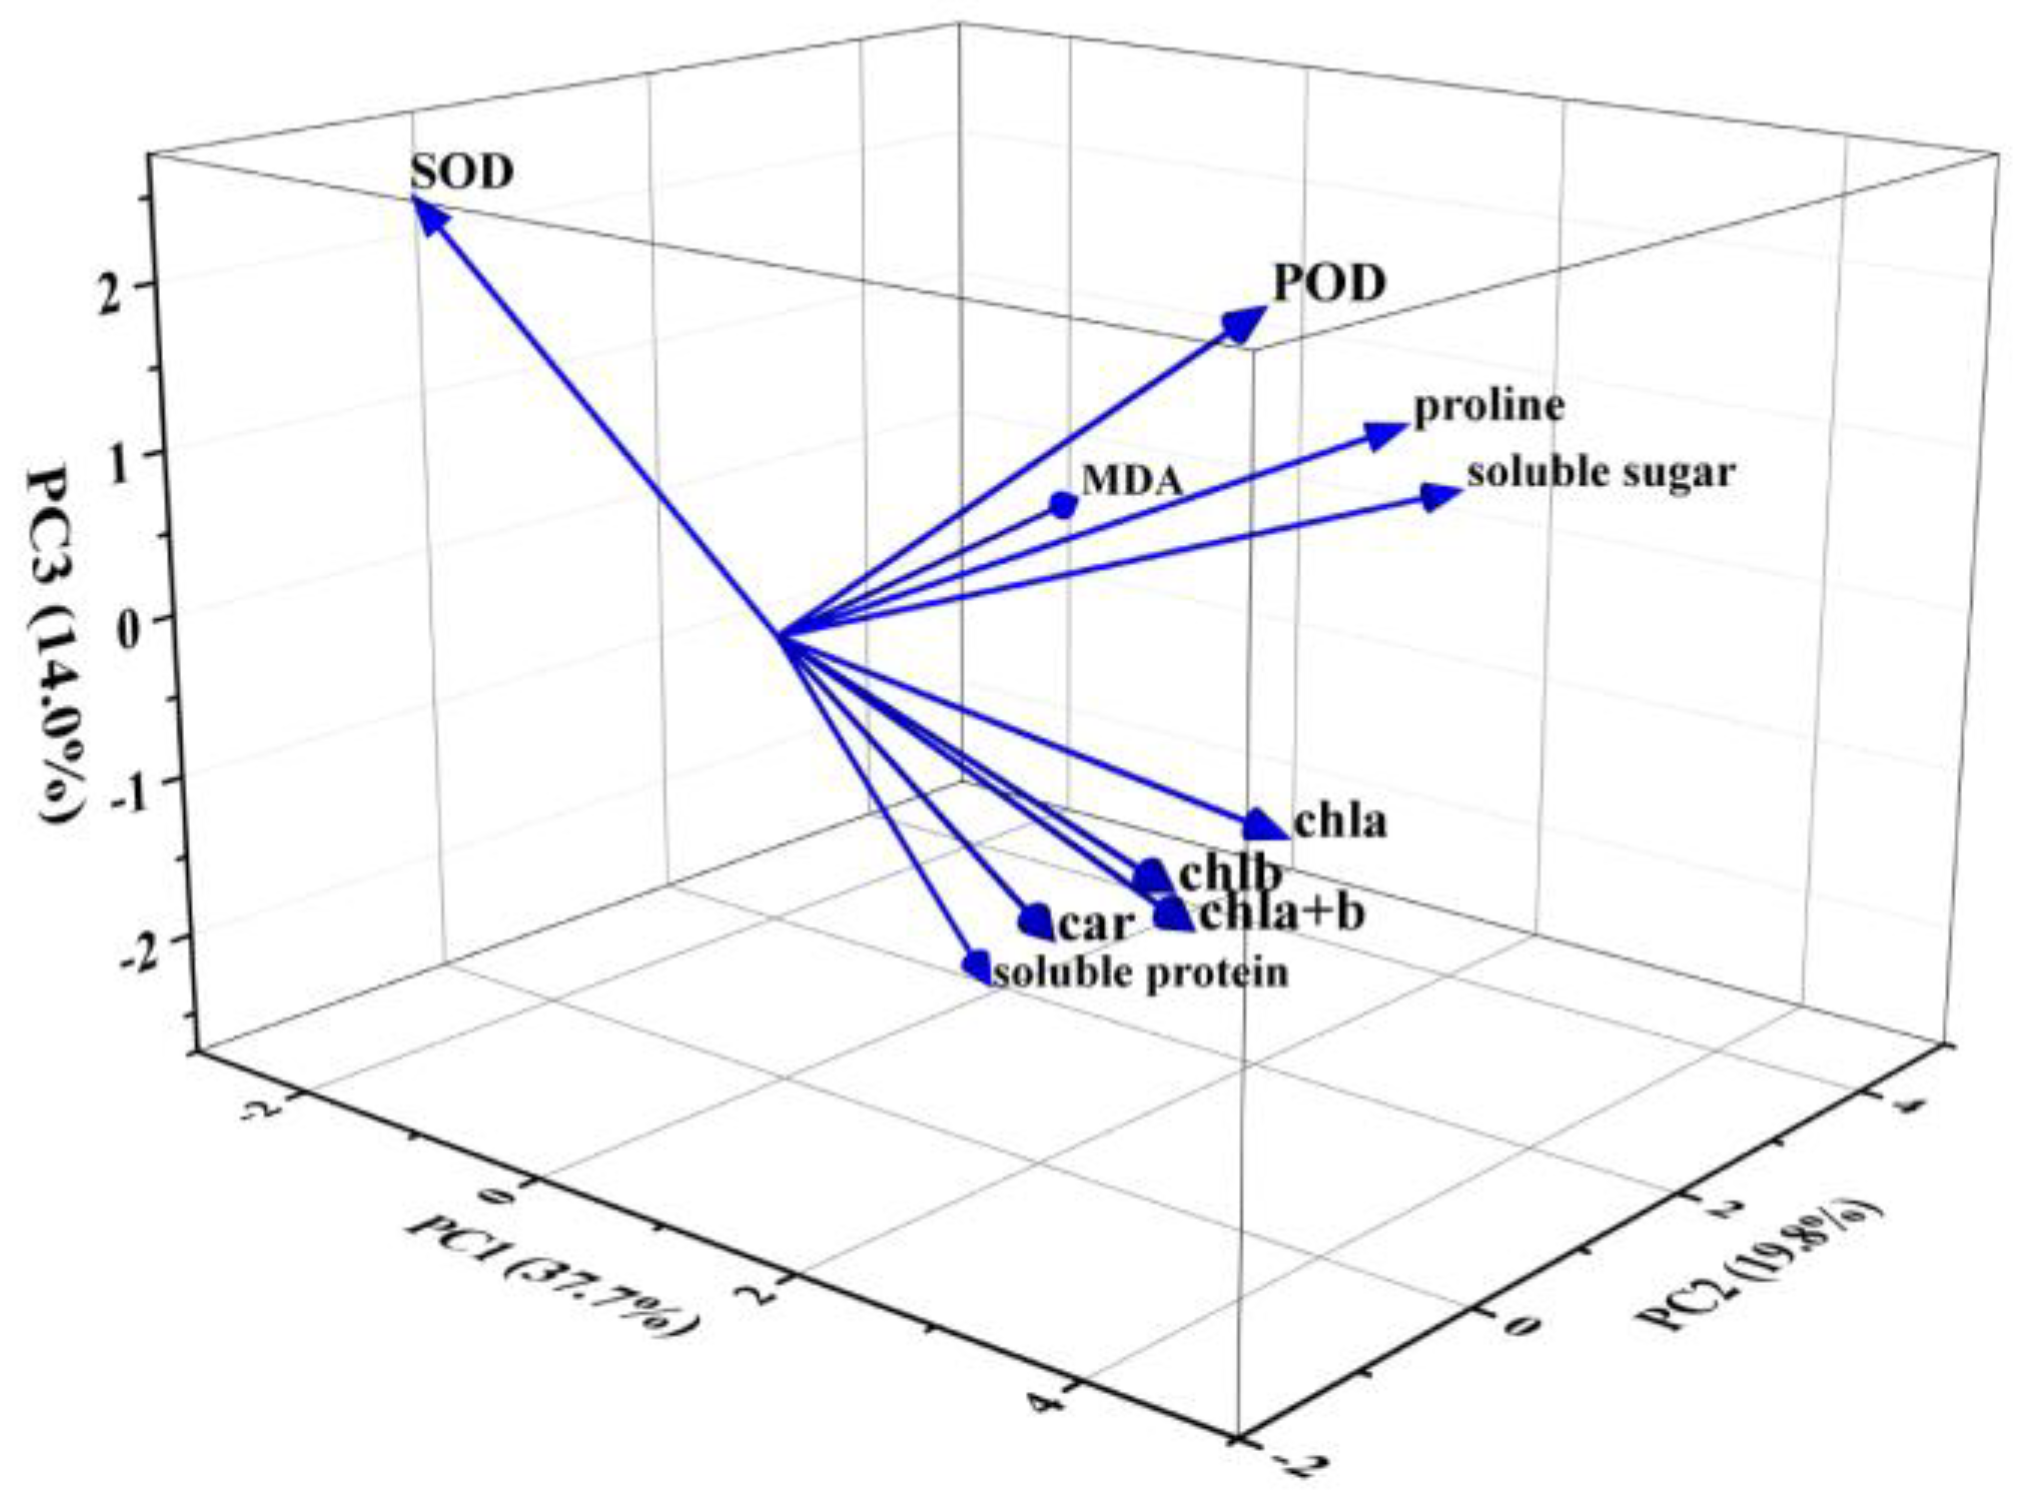
3.7. Principal Component Analysis of Drought Stress on Biochemical Parameters

After investigating the effects of different PEG concentrations on the leaf biochemical parameters of five Clematis species, we used the data to perform a PCA analysis in order to compare the drought stress to these specific biochemical attributes. The data was standardized, and the applicability of factor analysis was assessed by conducting the Kaiser–Meyer–Olkin (KMO) test and the Bartlett test of sphericity (Table 2). The KMO test yielded a value of 0.601, indicating a significant correlation among the parameters, as confirmed in Section 3.5 (Figure 6). The Bartlett test of sphericity yielded a value of 377.283, with a significance (Sig) value of 0.000. This suggested the rejection of the null hypothesis, indicating that the parameters were correlated. Both test results demonstrated that the data were suitable for PCA.
The PCA loading plot for the data described in Figure 2, Figure 3, Figure 4 and Figure 5 is presented in Figure 7. Principal component analysis revealed (Figure 7, Table 3) that the first three principal components accounted for 37.7%, 19.8%, and 14.0% of the total variance, respectively. The first principal component (PC1) exhibited a strong positive correlation with Chl a + b and Chl b. The second principal component (PC2) demonstrated a strong positive correlation with MDA and soluble sugar, as well as a moderate positive correlation with proline. The third principal component (PC3) displayed a moderate positive correlation with SOD and POD while exhibiting a moderate negative correlation with soluble protein.
Based on the calculations of principal component scores and integrated scores (Table 4), the highest total score was achieved by C. intricata under 20% PEG stress, followed by C. intricata under 10% PEG stress. Conversely, the lowest total scores were observed in C. nannophylla under 10% and 30% PEG stress conditions, respectively.

4. Discussion

The effective selection of drought-tolerant ornamental germplasms is considered to be very important in the breeding programs of urban drought-tolerant species. In view of the fact that Clematis has not been used in cities in arid and semi-arid areas of Northwest China at present, the purpose of this study was to determine the responses of five Clematis species to drought stress at the germination and seedling growth stages in an attempt to find five species of Clematis with strong drought tolerance.
Our research results showed that different species of Clematis exhibited different levels of tolerance to drought stress. Seeds are the important material foundation for plant reproduction and regeneration, playing a crucial milestone in the life cycle of plants [62]. Indicators related to seed germination, such as TG, GP, GI, and VI, were all affected by drought stress in the five species of Clematis (Figure 1 and Table 1). The 15% PEG stress significantly inhibited seed germination of the five Clematis species in this study (Table 1), as is consistent with previous research findings [63,64,65,66]. This may be due to a negative regulation of physiological mechanisms caused by drought stress, inhibiting seed water uptake and thereby affecting seed germination [52]. In addition, the TG, GP, and GI of C. intricata, C. nannophylla, and C. fruticosa under 15% PEG stress were significantly lower than those of C. tangutica and C. glauca (Table 1). Although C. intricata, C. tangutica, and C. glauca all belong to Clematis sect. Meclatis in taxonomy [21], C. nannophylla and C. fruticosa belong to Clematis sect. Fruticella [22]. However, C. intricata and the other two sect. Fruticella plants showed similar germination performances under drought stress, which may be related to the environment of seed collection and dormancy. Dormancy, as a survival strategy, helps plants avoid adverse conditions by delaying germination to ensure seed survival [67,68]. Research has shown that seeds can perceive environmental changes and continuously adjust their dormancy levels [69]. Further research is needed to investigate the impact of dormancy on seed germination under 15% concentrations of PEG. In our study, the TGs of the five species of Clematis were all above 50% under 10% PEG, and even under 15% PEG, the TGs for C. tangutica and C. glauca remained above 62.22% (Table 1), indicating that C. tangutica and C. glauca had high tolerance to drought stress. Such results are further supported by Figure 2, as GDTI is considered a reliable indicator of drought tolerance [53].
The VI and GI are highly sensitive to drought and can be considered as effective indicators of drought tolerance in plants [70,71]. Our research results indicated that PEG stress generally decreased the GI and VI of the five species of Clematis (Table 1), as is consistent with previous studies on Triticum aestivum [72], Cicer arietinum [73], Sesamum indicum [70], and other plant species [65,74]. However, our study also presented contrasting results. Low concentrations of PEG stress (5% and 10%) increased the GI and VI of C. tangutica (Table 1), which is similar to the results of soybean [31]. Notably, when exposed to 15% PEG stress, the germination indices GI and VI of C. tangutica stood significantly higher than those of the other Clematis species (Table 1), indicating a robust resistance to drought stress in C. tangutica. Furthermore, the complete absence of germination in C. fruticosa under 15% PEG stress implied that the seeds of C. fruticosa exhibited maximum tolerance to water deficit within a 15% PEG concentration threshold.
Chlorophyll serves as the photosensitive catalyst in plant photosynthesis, and its concentration directly influences the efficiency of photosynthesis. Thus, the chlorophyll content level can partly elucidate the photosynthetic capacity of leaves [75]. The current research indicates that drought significantly decreased the levels of Chls and Car [76], leading to a deceleration in plant growth [77]. However, in the present study, the concentrations of Chls and Car in the five species of Clematis exhibited an initial rise followed by a decline under drought stress (Figure 2A–D). This phenomenon could be attributed to the increased production of osmotic regulatory substances by these Clematis species under mild to moderate drought stress, as these substances are either direct or indirect byproducts of photosynthesis [78]. This result was verified in the correlation analysis (Figure 6). This strategy of mitigating the impact of drought stress on the photosynthetic system may act as a protective mechanism for these plants to adapt to arid conditions, suggesting their resilience to mild and moderate drought stress levels without compromising plant photosynthesis. Conversely, under high-intensity drought stress, there was an overall decrease in photosynthetic pigment content among the five Clematis species, particularly in C. intricata (Figure 2A–D), indicating high-concentration drought stress adversely affected the photosynthetic activity, resulting in a reduction in pigment content. [79]. These findings suggest that the five Clematis species have a certain level of tolerance to drought stress.
Research has shown that under drought conditions, the ratio of chlorophyll a/b in plants remains unchanged, indicating that the decrease in the content of photosynthetic pigments is mainly due to synthesis barriers rather than degradation [80]. Our research findings indicated that, with the exception of C. intricata, the other four Clematis species exhibited no significant difference in Chl a/b compared to the control across various levels of drought stress (Figure 2E), which is consistent with the results of research on Lathyrus sativus [79] and rice [81]. The elevated Chl a/b value in C. intricata under 30% PEG stress (Figure 2E) suggests that this species not only has synthetic obstacles for chlorophyll, but also that degradation of chlorophyll occurs under this concentration of drought stress [82].
The accumulation of MDA is positively correlated with the degree of lipid peroxidation of the cell membrane [83,84], indicating the extent of damage to plant cell membranes [85]. Previous research has shown that drought stress results in an increase in MDA content in leaves [86,87]. In this study, we also found that simulated drought stress with 30% PEG significantly increased the MDA content in the leaves of the five species of Clematis seedlings (Figure 3). Specifically, the MDA content of C. glauca and C. intricata increased significantly under 20% PEG stress, while the MDA content of C. nannophylla and C. fruticosa increased significantly under 10% PEG stress, and the MDA content of C. tangutica only significantly accumulated under 30% PEG stress (Figure 3). This indicates different levels of damage to the cell membranes of the five Clematis species under drought stress. Moreover, the MDA accumulation induced by drought stress was attributed to the disrupted balance between reactive oxygen species (ROS) production and clearance within cells [88], thus reducing the cell’s ROS scavenging capability and accelerating membrane system damage. In this study, it was found that the activities of SOD and POD significantly increased in the five Clematis species under 10% and 20% PEG stress, whereas these activities exhibited varying degrees of decline under 30% PEG stress (Figure 5A,B). This result further indicates that high concentrations of drought stress result in the clearance rate of ROS being lower than the production rate, leading to significant MDA accumulation.
Soluble sugars, proline, and soluble proteins are the most common compatible solutes actively accumulated under drought stress to maintain high water potential and cell turgor pressure, serving as the first line of defense against drought [36] without disrupting normal cellular biochemical reactions [37]. Proline, a versatile molecule, plays essential roles in regulating osmotic potential, scavenging free radicals, preserving membrane integrity, and adaptively responding to abiotic stress by increasing its concentration and accumulation in plant cells [89,90]. In this study, drought stress induced significant accumulation of proline in the leaves of the five species of Clematis (Figure 4A), as is consistent with previous research results [91,92,93]. Notably, the content of proline accumulated under low and moderate drought stress (10% and 20% PEG) was significantly higher than that under high drought stress (30% PEG) (Figure 4A), indicating a certain resistance of the five species of Clematis to low and moderate drought stress.
Numerous studies have demonstrated that the concentrations of soluble sugars and soluble proteins increase in plants under drought stress [94,95,96,97]. In this study, the soluble sugar content in the leaves of five Clematis species showed an increasing trend with increasing drought intensity, but decreased after a certain point, overall remaining higher than the control (Figure 4B). This phenomenon could be attributed to the multifunctionality of soluble sugars in not only preventing cellular dehydration, but also safeguarding cell organelles [79,98]. Elevated levels of this indicator enable plants to establish an osmotic mechanism in the leaves, facilitating water absorption and aiding in photosynthesis to sustain normal growth and development [99]. This was consistent with the correlation analysis showing a positive relationship between soluble sugars and photosynthetic pigments, particularly with Chl a (Figure 6). Similarly, the soluble protein content in the leaves of the five Clematis species displayed varying degrees of escalation under drought stress conditions (Figure 4C), owing to the ability of higher soluble protein levels to aid plants in water retention, thereby aiding their adaptation to water-deficient environments and enhancing the seedlings’ drought resistance capabilities [100,101]. The reduction in soluble sugar and protein content under high-concentration drought stress indicated that the five Clematis species possessed a degree of resilience to drought conditions, with C. intricata notably maintaining elevated levels of both soluble sugar and protein under 30% PEG stress, thus demonstrating significant tolerance.
Abiotic stresses, particularly drought stresses, can trigger a burst of ROS in plants, resulting in increased accumulation of H2O2, hydroxyl radicals, and MDA, thereby impacting plant growth and development [102,103]. SOD and POD are the key enzymes in the protective enzyme system and play a key role in scavenging reactive oxygen species [82]. In this study, the change trend of SOD and POD activity was similar to that of osmotic regulation substance content (Figure 5), and showed an upward trend under low and moderate concentrations of PEG stress, which was consistent with the results of rapeseed [104], spring wheat [105], and other plants [106,107]. The results showed that the five Clematis species had certain adaptability to low and moderate PEG stress conditions. However, under 30% PEG stress, with the exception of C. nannophylla, the SOD and POD activities in the leaves of the remaining four Clematis species were lower than those in the control (Figure 5), which can possibly be attributed to the excessive ROS production induced by drought stress leading to a detrimental impact on antioxidant enzyme activity and cellular function [52] and damaged cell function [8,38,39]. The determination of MDA content (Figure 3) further supported the above results.
In the principal component analysis of 11 biochemical parameters and 20 treatments (four concentrations of PEG stress and five Clematis species), the Kaiser–Meyer–Olkin test revealed a KMO value of 0.601 (Table 2), signifying a considerable correlation among the parameters, as supported in Section 3.5 (Figure 6). Additionally, the Bartlett test of sphericity yielded a value of 377.283 and a significance value of 0.000 (Table 2), indicating the rejection of the unity matrix for correlations between the various indicators. Both of these statistical tests confirmed that the data were suitable for further analysis. By evaluating the principal component scores, variations in the biochemical parameters of the five Clematis species under drought stress at different concentrations were investigated, and their aggregate scores were ranked. The results in Table 4 showed that C. intricata was the top-ranking species under diverse drought stress conditions, with C. glauca following closely behind, while C. nannophylla and C. fruticosa exhibited lower rankings under differing drought stress treatments. Therefore, C. intricata and C. glauca could be considered as promising species exhibiting strong drought resistance suitable for cultivation in arid to semi-arid urban regions.

5. Conclusions

In conclusion, the results of this study indicate that the five species of Clematis showed different seed germination and differences in the seedlings’ physiological indices under different concentrations of drought stress. In terms of seed germination, C. tangutica exhibited the strongest drought tolerance. The 15% PEG concentration was the limit threshold of water for the seed germination of C. fruticosa. In terms of seedling physiological indices, all five Clematis species showed a certain adaptability and resistance to low and medium concentrations of drought stress, but high-concentration drought stress caused significant damage. Through PCA analysis, it was concluded that C. intricata and C. glauca could be promising candidates for breeding programs aimed at enhancing drought resistance in plants intended for cultivation in arid and semi-arid regions.
Although this study investigated the differences in seed germination and physiological indicators of seedlings from the five Clematis species under PEG-simulated drought stress, further research is needed to examine their actual performance in urban greening, including differences in seedling growth and responses to varying soil moisture content. In addition, further long-term research is needed on the drought tolerance of these five species of Clematis in the later stages of their life cycles, such as during and after the reproductive growth period.

Author Contributions

Conceptualization, Z.Z. and Y.L.; methodology, Y.L. and T.L.; formal analysis, Z.Z. and Y.L.; investigation, Z.S. and R.S.; data curation, Z.Z., Y.L., R.S., T.L. and Y.W.; writing—original draft preparation, Z.Z., Y.L. and X.X.; writing—review and editing, Z.Z. and T.L. All authors have read and agreed to the published version of the manuscript.

Funding

This research was funded by the Forestry and Grassland Science and Technology Innovation and International Cooperation Project of Gansu Province (kjcx2021004) (Institutions providing this funding: Gansu Forestry and Grassland Administration).

Data Availability Statement

The original contributions presented in the study are included in the article, further inquiries can be directed to the corresponding author.

Conflicts of Interest

The authors declare no conflicts of interest.

References

  1. Wei, T.; Lou, I.; Yang, Z.; Li, Y. A system dynamics urban water management model for Macau, China. J. Environ. Sci. 2016, 50, 117–126. [Google Scholar] [CrossRef]
  2. An IPCC Special Report on the Global Warming of 1.5 °C. Available online: https://climate.copernicus.eu/ipcc-special-report-global-warming-15oc (accessed on 23 August 2023).
  3. Immerzeel, W.W.; van Beek, L.P.; Bierkens, M.F. Climate change will affect the Asian water towers. Science 2010, 328, 1382–1385. [Google Scholar] [CrossRef]
  4. Ho, H.C.; Knudby, A.; Walker, B.B.; Henderson, S.B. Delineation of Spatial Variability in the Temperature-Mortality Relationship on Extremely Hot Days in Greater Vancouver, Canada. Environ. Health Perspect. 2017, 125, 66–75. [Google Scholar] [CrossRef] [PubMed]
  5. Jay, O.; Capon, A.; Berry, P.; Broderick, C.; de Dear, R.; Havenith, G.; Honda, Y.; Kovats, R.S.; Ma, W.; Malik, A.; et al. Reducing the health effects of hot weather and heat extremes: From personal cooling strategies to green cities. Lancet 2021, 398, 709–724. [Google Scholar] [CrossRef]
  6. Wang, D.; Lau, K.K.; Ren, C.; Goggins, W.B.I.; Shi, Y.; Ho, H.C.; Lee, T.C.; Lee, L.S.; Woo, J.; Ng, E. The impact of extremely hot weather events on all-cause mortality in a highly urbanized and densely populated subtropical city: A 10-year time-series study (2006–2015). Sci. Total Environ. 2019, 690, 923–931. [Google Scholar] [CrossRef]
  7. Zhang, X.; Chen, N.; Sheng, H.; Ip, C.; Yang, L.; Chen, Y.; Sang, Z.; Tadesse, T.; Lim, T.P.Y.; Rajabifard, A.; et al. Urban drought challenge to 2030 sustainable development goals. Sci. Total Environ. 2019, 693, 133536. [Google Scholar] [CrossRef]
  8. Wang, P.; Sun, X.; Li, C.; Wei, Z.Z.; Liang, D. Long-term exogenous application of melatonin delays drought-induced leaf senescence in apple. J. Pineal Res. 2012, 54, 292–302. [Google Scholar] [CrossRef] [PubMed]
  9. Harrison, M.T.; Tardieu, F.; Dong, Z.; Messina, C.D.; Hammer, G.L. Characterizing drought stress and trait influence on maize yield under current and future conditions. Glob. Chang. Biol. 2014, 20, 867–878. [Google Scholar] [CrossRef] [PubMed]
  10. Gillner, S.; Vogt, J.; Tharang, A.; Dettmann, S.; Roloff, A. Role of street trees in mitigating effects of heat and drought at highly sealed urban sites. Landscape Urban Plan. 2015, 143, 33–42. [Google Scholar] [CrossRef]
  11. Rahman, M.A.; Moser, A.; Rötzer, T.; Pauleit, S. Within canopy temperature differences and cooling ability of Tilia cordata trees grown in urban conditions. Build. Environ. 2017, 114, 118–128. [Google Scholar] [CrossRef]
  12. Mitrofanova, I.; Ivanova, N.; Kuzmina, T.; Mitrofanova, O.; Zubkova, N. In vitro regeneration of Clematis plants in the Nikita botanical garden via somatic embryogenesis and organogenesis. Front. Plant Sci. 2021, 12, 541171. [Google Scholar] [CrossRef]
  13. Jiang, N.; Guan, K.Y.; Wang, Z.L. Species diversity and geographical distribution of Clematis (Ranunculaceae) in Yunnan. Acta Bot. Yunnanica 2007, 29, 145–154. (In Chinese) [Google Scholar]
  14. Liu, Z.; Shao, W.; Shen, Y.; Ji, M.; Chen, W.; Ye, Y.; Shen, Y. Characterization of new microsatellite markers based on the transcriptome sequencing of Clematis finetiana. Hereditas 2018, 155, 23. [Google Scholar] [CrossRef]
  15. Ma, X.; Qian, R.; Zhang, X.; Hu, Q.; Liu, H.; Zheng, J. Contrasting growth, physiological and gene expression responses of Clematis crassifolia and Clematis cadmia to different irradiance conditions. Sci. Rep. 2019, 9, 17842. [Google Scholar] [CrossRef]
  16. Beutler, L. The Rogerson Clematis Collection: Where Every Garden Tells a Story; Pacific Horticulture Society: Berkeley, CA, USA, 2014. [Google Scholar]
  17. Qian, R.; Hu, Q.; Ma, X.; Zhang, X.; Ye, Y.; Liu, H.; Gao, H.; Zheng, J. Comparative transcriptome analysis of heat stress responses of Clematis lanuginosa and Clematis crassifolia. BMC Plant Biol. 2022, 22, 138. [Google Scholar] [CrossRef] [PubMed]
  18. Wei, Y.; Chen, T.; Wang, S.; Shen, C.; Song, Z.; Li, A.; Li, H.; Li, Y. Integrated strategy for the screening of cyclooxygenase-2 inhibitors from triterpenoid saponins in Clematis tangutica. Phytochem. Anal. 2023, 34, 692–704. [Google Scholar] [CrossRef]
  19. Wang, R.; Mao, C.; Jiang, C.; Zhang, L.; Peng, S.; Zhang, Y.; Feng, S.; Ming, F. One Heat Shock Transcription Factor Confers High Thermal Tolerance in Clematis Plants. Int. J. Mol. Sci. 2021, 22, 2900. [Google Scholar] [CrossRef] [PubMed]
  20. Hu, Q.; Qian, R.; Zhang, Y.; Zhang, X.; Ma, X.; Zheng, J. Physiological and Gene Expression Changes of Clematis crassifolia and Clematis cadmia in Response to Heat Stress. Front. Plant Sci. 2021, 12, 624875. [Google Scholar] [CrossRef]
  21. Wang, W.T. A revision of Clematis sect. Meclatis (Ranunculaceae). Acta Phytotaxon. Sin. 2006, 44, 401–436. [Google Scholar] [CrossRef]
  22. Wang, W.T.; Li, L.Q. A revision of Clematis sect. Fruticella (Ranunculaceae). Acta Phytotaxon. Sin. 2005, 43, 193–209. [Google Scholar]
  23. Li, M.; He, J.; Zhao, Z.; Lyu, R.; Yao, M.; Cheng, J.; Xie, L. Predictive modelling of the distribution of Clematis sect. Fruticella s. str. under climate change reveals a range expansion during the Last Glacial Maximum. PeerJ 2020, 8, e8729. [Google Scholar] [CrossRef]
  24. Begum, N.; Ahanger, M.A.; Zhang, L. AMF inoculation and phosphorus supplementation alleviates drought induced growth and photosynthetic decline in Nicotiana tabacum by up-regulating antioxidant metabolism and osmolyte accumulation. Environ. Exp. Bot. 2020, 176, 104088. [Google Scholar] [CrossRef]
  25. Yan, A.; Chen, Z. The control of seed dormancy and germination by temperature, light and nitrate. Bot. Rev. 2020, 86, 39–75. [Google Scholar] [CrossRef]
  26. Norsworthy, J.K.; Oliveira, M.J. Sicklepod (Senna obtusifolia) germination and emergence as affected by environmental factors and seeding depth. Weed Sci. 2006, 54, 903–909. [Google Scholar] [CrossRef]
  27. Saima, S.; Li, G.; Wu, G. Effects of drought stress on hybrids of Vigna radiata at germination stage. Acta Biol. Hung. 2018, 69, 481–492. [Google Scholar] [CrossRef] [PubMed]
  28. Xiao, S.; Liu, L.; Wang, H.; Li, D.; Bai, Z.; Zhang, Y.; Sun, H.; Zhang, K.; Li, C. Exogenous melatonin accelerates seed germination in cotton (Gossypium hirsutum L.). PLoS ONE 2019, 14, e0216575. [Google Scholar] [CrossRef] [PubMed]
  29. Meeks, M.; Murray, S.C.; Hague, S.; Hays, D. Measuring maize seedling drought response in search of tolerant germplasm. Agronomy 2013, 3, 135–147. [Google Scholar] [CrossRef]
  30. Richards, R.A. Variation between and within species of rapeseed (Brassica campestris and B. napus) in response to drought stress: Physiological and physicochemical characters. Aust. J. Agr. Res. 1978, 29, 491–501. [Google Scholar] [CrossRef]
  31. Begum, N.; Hasanuzzaman, M.; Li, Y.; Akhtar, K.; Zhang, C.; Zhao, T. Seed Germination Behavior, Growth, Physiology and Antioxidant Metabolism of Four Contrasting Cultivars under Combined Drought and Salinity in Soybean. Antioxidants 2022, 11, 498. [Google Scholar] [CrossRef] [PubMed]
  32. Xiong, J.L.; Li, J.; Wang, H.C.; Zhang, C.L.; Naeem, M.S. Fullerol improves seed germination, biomass accumulation, photosynthesis and antioxidant system in Brassica napus L. under water stress. Plant Physiol. Biochem. 2018, 129, 130–140. [Google Scholar] [CrossRef] [PubMed]
  33. Hu, W.H.; Yan, X.H.; Xiao, Y.; Zeng, J.; Qi, H.; Ogweno, J.O. 24-Epibrassinosteroid alleviate drought-induced inhibition of photosynthesis in Capsicum annuum. Sci. Hortic. 2013, 150, 232–237. [Google Scholar] [CrossRef]
  34. Fu, J.; Huang, B. Involvement of antioxidants and lipid peroxidation in the adaptation of two cool-season grasses to localized drought stress. Environ. Exp. Bot. 2001, 45, 105–114. [Google Scholar] [CrossRef]
  35. Cui, G.; Zhao, X.; Liu, S.; Sun, F.; Zhang, C.; Xi, Y. Beneficial effects of melatonin in overcoming drought stress in wheat seedlings. Plant Physiol. Bioch. 2017, 118, 138–149. [Google Scholar] [CrossRef]
  36. Kaczmarek, M.; Fedorowicz-Strońska, O.; Głowacka, K.; Waśkiewicz, A.; Sadowski, J. CaCl2 treatment improves drought stress tolerance in barley (Hordeum vulgare L.). Acta Physiol. Plant. 2017, 39, 41. [Google Scholar] [CrossRef]
  37. Du, J.; Chen, X.; Li, W.; Qiong, G. Osmoregulation mechanism of drought stress and genetic engineering strategies for improving drought resistance in plants. For. Stud. China 2004, 6, 56–62. [Google Scholar] [CrossRef]
  38. Basu, S.; Roychoudhury, A.; Saha, P.P.; Sengupta, D.N. Differential antioxidative responses of indica rice cultivars to drought stress. Plant Growth Regul. 2010, 60, 51–59. [Google Scholar] [CrossRef]
  39. Deng, B.; Du, W.; Liu, C.; Sun, W.; Tian, S.; Dong, H. Antioxidant response to drought, cold and nutrient stress in two ploidy levels of tobacco plants: Low resource requirement confers polytolerance in polyploids? Plant Growth Regul. 2012, 66, 37–47. [Google Scholar] [CrossRef]
  40. Ahammad, G.J.; Li, X.; Yang, Y.X.; Liu, C.C.; Zhou, G.Z.; Wan, H.J.; Cheng, Y. Tomato WRKY81 acts as a negative regulator for drought tolerance by modulating guard cell H2O2–mediated stomatal closure. Environ. Exp. Bot. 2019, 171, 103960. [Google Scholar] [CrossRef]
  41. Huang, B.; Chen, Y.E.; Zhao, Y.Q.; Ding, C.B.; Liao, J.Q.; Hu, C.; Zhou, L.J.; Zhang, Z.W.; Yuan, S.; Yuan, M. Exogenous Melatonin Alleviates Oxidative Damages and Protects Photosystem II in Maize Seedlings Under Drought Stress. Front. Plant Sci. 2019, 10, 677. [Google Scholar] [CrossRef]
  42. Gao, W.; Zhang, Y.; Feng, Z.; Bai, Q.; He, J.; Wang, Y. Effects of Melatonin on Antioxidant Capacity in Naked Oat Seedlings under Drought Stress. Molecules 2018, 23, 1580. [Google Scholar] [CrossRef] [PubMed]
  43. Posmyk, M.M.; Bałabusta, M.; Wieczorek, M.; Sliwinska, E.; Janas, K.M. Melatonin applied to cucumber (Cucumis sativus L.) seeds improves germination during chilling stress. J. Pineal Res. 2009, 46, 214–223. [Google Scholar] [CrossRef]
  44. Sharma, P.; Jha, A.B.; Dubey, R.S.; Pessarakli, M. Reactive oxygen species, oxidative damage, and antioxidative defense mechanism in plants under stressful conditions. J. Bot. 2012, 2012, 217037. [Google Scholar] [CrossRef]
  45. Cooper, M.; Gho, C.; Leafgren, R.; Tang, T.; Messina, C. Breeding drought-tolerant maize hybrids for the US corn-belt: Discovery to product. J. Exp. Bot. 2014, 65, 6191–6204. [Google Scholar] [CrossRef] [PubMed]
  46. Badiane, F.A.; Diouf, D.; Sane, D.; Diouf, O.; Goudiaby, V.; Diallo, N. Screening cowpea [Vigna unguiculata (L.) Walp.] varieties by inducing water deficit and RAPD analyses. Afr. J. Biotechnol. 2004, 3, 174–178. [Google Scholar] [CrossRef]
  47. Verslues, P.E.; Agarwal, M.; Katiyar-Agarwal, S.; Zhu, J.; Zhu, J.K. Methods and concepts in quantifying resistance to drought, salt and freezing, abiotic stresses that affect plant water status. Plant J. 2006, 45, 523–539. [Google Scholar] [CrossRef] [PubMed]
  48. Hohl, M.; Schopfer, P. Water Relations of Growing Maize Coleoptiles: Comparison between Mannitol and Polyethylene Glycol 6000 as External Osmotica for Adjusting Turgor Pressure. Plant Physiol. 1991, 95, 716–722. [Google Scholar] [CrossRef] [PubMed]
  49. Michel, B.E.; Kaufmann, M.R. The Osmotic Potential of Polyethylene Glycol 6000. Plant Physiol. 1973, 51, 914–916. [Google Scholar] [CrossRef] [PubMed]
  50. Chapter 1: Certificates. In ISTA Certificates. International Rules for Seed Testing; The International Seed Testing Association (ISTA): Wallisellen, Switzerland, 2023; pp. 1–10.
  51. Wang, A.-H.; Yu, X.-L.; Liu, Y.-Y.; Chen, S.-G.; Wang, F.-G. Seed Germination and Storage of the Endangered Species Manglietia crassipes Y. W. Law (Magnoliaceae). Horticulturae 2021, 7, 42. [Google Scholar] [CrossRef]
  52. Bai, Y.; Xiao, S.; Zhang, Z.; Zhang, Y.; Sun, H.; Zhang, K.; Wang, X.; Bai, Z.; Li, C.; Liu, L. Melatonin improves the germination rate of cotton seeds under drought stress by opening pores in the seed coat. PeerJ 2020, 8, e9450. [Google Scholar] [CrossRef]
  53. Badr, A.; El-Shazly, H.H.; Tarawneh, R.A.; Börner, A. Screening for Drought Tolerance in Maize (Zea mays L.) Germplasm Using Germination and Seedling Traits under Simulated Drought Conditions. Plants 2020, 9, 565. [Google Scholar] [CrossRef]
  54. Lichtenthaler, H.K. Chlorophylls and carotenoids: Pigments of photosynthetic biomembranes. Method Enzymol. 1987, 148, 350–356. [Google Scholar] [CrossRef]
  55. Wellburn, A.R. The spectral determination of chlorophylls a and b, as well as total carotenoids, using various solvents with spectrophotometers of different resolution. J. Plant Physiol. 1994, 144, 307–313. [Google Scholar] [CrossRef]
  56. Dhindsa, R.S.; Plumb-Dhindsa, R.; Thorpe, T.A. Leaf senescence correlated with increased level of membrane permeability, lipid peroxidation and decreased level of superoxide dismutase and catalase. J. Exp. Bot. 1981, 32, 93–101. [Google Scholar] [CrossRef]
  57. Bates, L.S.; Waldren, R.P.; Teare, I.D. Rapid determination of free proline for water-stress studies. Plant Soil 1973, 39, 205–207. [Google Scholar] [CrossRef]
  58. Yemm, E.W.; Willis, A. The estimation of carbohydrates in plant extracts by anthrone. Biochem. J. 1954, 57, 508–514. [Google Scholar] [CrossRef] [PubMed]
  59. Wang, X.K. Experimental Principle and Technology of Plant Physiology and Biochemistry, 3rd ed.; Higher Education Press: Beijing, China, 2015. [Google Scholar]
  60. Bradford, K.J. A water relations analysis of seed germination rates. Plant Physiol. 1990, 94, 840–849. [Google Scholar] [CrossRef]
  61. Maehly, A.C. The assay of catalases and peroxidases. In Methods of Biochemical Analysis; Glick, D., Ed.; John Wiley & Sons, Inc: Hoboken, NJ, USA, 1954; Volume 1, pp. 357–424. [Google Scholar]
  62. Harper, J.L.; Lovell, P.H.; Moore, K.G. The shapes and sizes of seeds. Annu. Rev. Ecol. Syst. 1970, 1, 327–356. [Google Scholar] [CrossRef]
  63. Kong, H.; Meng, X.; Akram, N.A.; Zhu, F.; Hu, J.; Zhang, Z. Seed Priming with Fullerol Improves Seed Germination, Seedling Growth and Antioxidant Enzyme System of Two Winter Wheat Cultivars under Drought Stress. Plants 2023, 12, 1417. [Google Scholar] [CrossRef]
  64. Dissanayake, I.; Ranwala, S.M.W.; Perera, S.S.N. Germination and Seedling Growth Responses of Sri Lankan Grown Sesame/Thala (Sesamum indicum L.) for Simulated Drought Conditions. J. Natl. Sci. Found. Sri Lanka 2019, 47, 479–490. [Google Scholar] [CrossRef]
  65. Liu, J.; Hasanuzzaman, M.; Wen, H.; Zhang, J.; Peng, T.; Sun, H.; Zhao, Q. High temperature and drought stress cause abscisic acid and reactive oxygen species accumulation and suppress seed germination growth in rice. Protoplasma 2019, 256, 1217–1227. [Google Scholar] [CrossRef]
  66. Zhang, Y.; Chen, B.; Xu, Z.; Shi, Z.; Chen, S.; Huang, X.T.; Chen, J.; Wang, X. Involvement of reactive oxygen species in endosperm cap weakening and embryo elongation growth during lettuce seed germination. J. Exp. Bot. 2014, 65, 3189–3200. [Google Scholar] [CrossRef]
  67. Donohue, K.; Rubio de Casas, R.; Burghardt, L.; Kovach, K.; Willis, C.G. Germination, postgermination adaptation, and species ecological ranges. Annu. Rev. Ecol. Evol. Syst. 2010, 41, 293–319. [Google Scholar] [CrossRef]
  68. Wagmann, K.; Hautekèete, N.C.; Piquot, Y.; Meunier, C.; Schmitt, S.E.; Van Dijk, H. Seed dormancy distribution: Explanatory ecological factors. Ann. Bot. 2012, 110, 1205–1219. [Google Scholar] [CrossRef] [PubMed]
  69. Finch-Savage, W.E.; Leubner-Metzger, G. Seed dormancy and the control of germination. New Phytol. 2006, 171, 501–523. [Google Scholar] [CrossRef] [PubMed]
  70. Dhanda, S.S.; Sethi, G.S.; Behl, R.K. Indices of Drought Tolerance in Wheat Genotypes at Early Stages of Plant Growth. J. Agron. Crop. Sci. 2004, 190, 6–12. [Google Scholar] [CrossRef]
  71. Kouighat, M.; Hanine, H.; El Fechtali, M.; Nabloussi, A. First Report of Sesame Mutants Tolerant to Severe Drought Stress during Germination and Early Seedling Growth Stages. Plants 2021, 10, 1166. [Google Scholar] [CrossRef] [PubMed]
  72. Spielmeyer, W.; Hyles, J.; Joaquim, P.; Azanza, F.; Bonnett, D.; Ellis, M.E.; Moore, C.; Richards, R.A. A QTL on Chromosome 6A in Bread Wheat (Triticum aestivum) is Associated with Longer Coleoptiles, Greater Seedling Vigour and Final Plant Height. Theor. Appl. Genet. 2007, 115, 59–66. [Google Scholar] [CrossRef] [PubMed]
  73. Koskosidis, A.; Khah, E.; Mavromatis, A.; Pavli, O.; Vlachostergios, D.N. Effect of PEG-Induced Drought Stress on Germination of Ten Chickpea (Cicer arietinum L.) Genotypes. Not. Bot. Horti Agrobot. Cluj-Napoca 2020, 48, 294–304. [Google Scholar] [CrossRef]
  74. Liu, X.; Hu, P.; Huang, M.; Tang, Y.; Li, Y.; Li, L.; Hou, X. The NF-YC–RGL2 module integrates GA and ABA signalling to regulate seed germination in Arabidopsis. Nat. Commun. 2016, 7, 12768. [Google Scholar] [CrossRef]
  75. Buttery, B.R.; Buzzell, R.I. The relationship between chlorophyll content and rate of photosynthesis in soybeans. Can. J. Plant Sci. 1977, 57, 1–5. [Google Scholar] [CrossRef]
  76. Cao, L.; Jin, X.J.; Zhang, Y.X. Melatonin confers drought stress tolerance in soybean (Glycine max L.) by modulating photosynthesis, osmolytes, and reactive oxygen metabolism. Photosynthetica 2019, 57, 812–819. [Google Scholar] [CrossRef]
  77. Altaf, M.A.; Shahid, R.; Ren, M.X.; Naz, S.; Altaf, M.M.; Khan, L.U.; Tiwari, R.K.; Lal, M.K.; Shahid, M.A.; Kumar, R.; et al. Melatonin Improves Drought Stress Tolerance of Tomato by Modulating Plant Growth, Root Architecture, Photosynthesis, and Antioxidant Defense System. Antioxidants 2022, 11, 309. [Google Scholar] [CrossRef]
  78. Yue, H.; He, S.; Geng, J.; Tiang, L.; Ni, S.; He, X. Effect of Arbuscular Mycorrhizal Fungi Inoculation on the Drought Tolerance of Macadamia ternifolia Seedling. J. West China For. Sci. 2020, 49, 30–35+42. [Google Scholar] [CrossRef]
  79. Tokarz, B.; Wójtowicz, T.; Makowski, W.; Jędrzejczyk, R.J.; Tokarz, K.M. What is the Difference between the Response of Grass Pea (Lathyrus sativus L.) to Salinity and Drought Stress?—A Physiological Study. Agronomy 2020, 10, 833. [Google Scholar] [CrossRef]
  80. Phung, T.H.; Jung, H.I.; Park, J.H.; Kim, J.G.; Back, K.; Jung, S. Porphyrin biosynthesis control under water stress: Sustained porphyrin status correlates with drought tolerance in transgenic rice. Plant Physiol. 2011, 157, 1746–1764. [Google Scholar] [CrossRef] [PubMed]
  81. Dalal, V.K.; Tripathy, B.C. Modulation of chlorophyll biosynthesis by water stress in rice seedlings during chloroplast biogenesis. Plant Cell Environ. 2012, 35, 1685–1703. [Google Scholar] [CrossRef] [PubMed]
  82. Santos, C.V. Regulation of chlorophyll biosynthesis and degradation by salt stress in sunflower leaves. Sci. Hortic. 2004, 103, 93–99. [Google Scholar] [CrossRef]
  83. Cruz de Carvalho, M.H. Drought stress and reactive oxygen species: Production, scavenging and signaling. Plant Signal. Behav. 2008, 3, 156–165. [Google Scholar] [CrossRef] [PubMed]
  84. Singh, S.; Gupta, A.K.; Kaur, N. Differential responses of antioxidative defence system to long-term field drought in wheat (Triticum aestivum L.) genotypes differing in drought tolerance. J. Agron. Crop Sci. 2012, 198, 185–195. [Google Scholar] [CrossRef]
  85. Imran, M.; Latif Khan, A.; Shahzad, R.; Aaqil Khan, M.; Bilal, S.; Khan, A.; Kang, S.M.; Lee, I.J. Exogenous melatonin induces drought stress tolerance by promoting plant growth and antioxidant defence system of soybean plants. AoB Plants 2021, 13, plab026. [Google Scholar] [CrossRef]
  86. Guo, Y.; Li, D.; Liu, L.; Sun, H.; Zhu, L.; Zhang, K.; Zhao, H.; Zhang, Y.; Li, A.; Bai, Z.; et al. Seed Priming With Melatonin Promotes Seed Germination and Seedling Growth of Triticale hexaploide L. Under PEG-6000 Induced Drought Stress. Front. Plant Sci. 2022, 13, 932912. [Google Scholar] [CrossRef] [PubMed]
  87. Guo, Y.Y.; Yu, H.Y.; Yang, M.M.; Kong, D.; Zhang, Y. Effect of Drought Stress on Lipid Peroxidation, Osmotic Adjustment and Antioxidant Enzyme Activity of Leaves and Roots of Lycium ruthenicum Murr. Seedling. Russ. J. Plant Physiol. 2018, 65, 244–250. [Google Scholar] [CrossRef]
  88. Li, J.; Yang, Y.; Sun, K.; Chen, Y.; Chen, X.; Li, X. Exogenous Melatonin Enhances Cold, Salt and Drought Stress Tolerance by Improving Antioxidant Defense in Tea Plant (Camellia sinensis (L.) O. Kuntze). Molecules 2019, 24, 1826. [Google Scholar] [CrossRef]
  89. Kishor, P.B.K.; Sreenivasulu, N. Is proline accumulation per se correlated with stress tolerance or is proline homeostasis a more critical issue? Plant Cell Environ. 2014, 37, 300–311. [Google Scholar] [CrossRef] [PubMed]
  90. Shah, T.; Latif, S.; Saeed, F.; Ali, I.; Ullah, S.; Alsahli, A.A.; Jan, S.; Ahmad, P. Seed priming with titanium dioxide nanoparticles enhances seed vigor, leaf water status, and antioxidant enzyme activities in maize (Zea mays L.) under salinity stress. J. King Saud Univ. Sci. 2021, 33, 101207. [Google Scholar] [CrossRef]
  91. Parida, A.K.; Dagaonkar, V.S.; Phalak, M.S.; Aurangabadkar, L.P. Differential responses of the enzymes involved in proline biosynthesis and degradation in drought tolerant and sensitive cotton genotypes during drought stress and recovery. Acta Physiol. Plant. 2008, 30, 619–726. [Google Scholar] [CrossRef]
  92. Cui, T.; Yu, H.; Li, H.; Bian, X.; Wang, L. Effect of drought stress and rewatering on physiological characteristics of Pennisetum alopecuroides seedlings. Pratacultural Sci. 2017, 11, 788–793. [Google Scholar] [CrossRef]
  93. Xu, Z.; Zhang, J.; Wang, M.; Cao, X.; Liu, L.; Xu, H.; Li, W. Effect of drought stress on the growth and physiological characteristics of nine species of wild ornamental plants in. Pratacultural Sci. 2018, 35, 2865–2871. [Google Scholar] [CrossRef]
  94. Pereira, M.D.; Días, D.C.F.S.; Días, L.A.S.; Araujo, E.F. Germinação e vigor de sementes de cenoura osmocondicionadas em papel umedecido e solução aerada. Rev. Bras. Sementes 2008, 30, 137–145. [Google Scholar] [CrossRef]
  95. Viera, W.; Shinohara, T.; Sanada, A.; Terada, N.; Ron, L.; Koshio, K. Seed Germination and Seedling Growth of Yellow and Purple Passion Fruit Genotypes Cultivated in Ecuador. Horticulturae 2022, 8, 754. [Google Scholar] [CrossRef]
  96. Hayat, S.; Hayat, Q.; Alyemeni, M.N.; Wani, A.S.; Pichtel, J.; Ahmad, A. Role of proline under changing environments: A review. Plant Signal. Behav. 2012, 7, 1456–1466. [Google Scholar] [CrossRef] [PubMed]
  97. Rathinasabapathi, B. Metabolic engineering for stress tolerance: Installing osmoprotectant synthesis pathways. Ann. Bot. 2000, 4, 709–716. [Google Scholar] [CrossRef]
  98. Wang, W.; Vinocur, B.; Shoseyov, O.; Altman, A. Role of plant heat-shock proteins and molecular chaperones in the abiotic stress response. Trends Plant Sci. 2004, 9, 244–252. [Google Scholar] [CrossRef] [PubMed]
  99. Sarabi, B.; Bolandnazar, S.; Ghaderi, N.; Ghashghaie, J. Genotypic differences in physiological and biochemical responses to salinity stress in melon (Cucumis melo L.) plants: Prospects for selection of salt tolerant landraces. Plant Physiol. Biochem. 2017, 119, 294–311. [Google Scholar] [CrossRef] [PubMed]
  100. Chen, Z.; Cuin, T.A.; Zhou, M.; Twomey, A.; Naidu, B.P.; Shabala, S. Compatible solute accumulation and stress-mitigating effects in barley genotypes contrasting in their salt tolerance. J. Exp. Bot. 2007, 58, 4245–4255. [Google Scholar] [CrossRef] [PubMed]
  101. Zhang, J.; Mason, A.S.; Wu, J.; Liu, S.; Zhang, X.; Luo, T.; Redden, R.; Batley, J.; Hu, L.; Yan, G. Identification of putative candidate genes for water stress tolerance in canola (Brassica napus L.). Front. Plant Sci. 2015, 6, 1–13. [Google Scholar] [CrossRef]
  102. Lu, S.; Su, W.; Li, H.; Guo, Z. Abscisic acid improves drought tolerance of triploid bermudagrass and involves H2O2-and NO-induced antioxidant enzyme activities. Plant Physiol. Biochem. 2009, 47, 132–138. [Google Scholar] [CrossRef]
  103. Del Río, L.A. ROS and RNS in plant physiology: An overview. J. Exp. Bot. 2015, 66, 2827–2837. [Google Scholar] [CrossRef]
  104. Khan, M.N.; Zhang, J.; Luo, T.; Liu, J.; Rizwan, M.; Fahad, S.; Xu, Z. Seed priming with melatonin coping drought stress in rapeseed by regulating reactive oxygen species detoxification: Antioxidant defense system, osmotic adjustment, stomatal traits and chloroplast ultrastructure perseveration. Ind. Crop. Prod. 2019, 140, 111597. [Google Scholar] [CrossRef]
  105. Batool, A.; Akram, N.A.; Cheng, Z.G.; Lv, G.C.; Ashraf, M.; Afzal, M.; Xiong, J.L.; Wang, J.Y.; Xiong, Y.C. Physiological and biochemical responses of two spring wheat genotypes to non-hydraulic root-to-shoot signalling of partial and full root-zone drought stress. Plant Physiol. Biochem. 2019, 139, 11–20. [Google Scholar] [CrossRef] [PubMed]
  106. Mittler, R. Oxidative stress, antioxidants and stress tolerance. Trends Plant Sci. 2002, 7, 405–410. [Google Scholar] [CrossRef] [PubMed]
  107. Apel, K.; Hirt, H. Reactive oxygen species: Metabolism, oxidative stress, and signaling transduction. Annu. Rev. Plant Biol. 2004, 55, 373–399. [Google Scholar] [CrossRef] [PubMed]
Figure 1. The germination drought tolerance index (GDTI) of the five Clematis species exposed to different concentrations (5%, 10%, and 15%) of PEG stress. Different uppercase letters indicate the significant difference among species in the same PEG treatment, and different lowercase letters indicate the significant difference among treatments for the same species according to Tukey’s HSD test or Games-Howell’s test (p ≤ 0.05). Bars and error lines represent means ± SE (n = 3).
Horticulturae 10 00288 g001
Figure 2. The chlorophyll a (Chl a) (A), chlorophyll b (Chl b) (B), carotene (Car) (C), chlorophyll a + b (Chl a + b) (D), and Chl a/b (E) of the five Clematis species exposed to different concentrations (0%, 10%, 20%, and 30%) of PEG stress. Different uppercase letters indicate significant differences among species in the same PEG treatment, and different lowercase letters indicate significant differences among treatments for the same species according to Tukey’s HSD test or Games-Howell’s test (p ≤ 0.05). Bars and error lines represent means ± SE (n = 3).
Horticulturae 10 00288 g002
Figure 3. The membrane lipid peroxidation (MDA) content of the five Clematis species exposed to different concentrations (0%, 10%, 20%, and 30%) of PEG stress. Different uppercase letters indicate significant differences among species with the same PEG treatment, and different lowercase letters indicate significant differences among treatments for the same species according to Tukey’s HSD test or Games-Howell’s test (p ≤ 0.05). Bars and error lines represent means ± SE (n = 3).
Horticulturae 10 00288 g003
Figure 4. The proline (A), soluble sugar (B), and soluble protein (C) content of the five Clematis species exposed to different concentrations (0%, 10%, 20%, and 30%) of PEG stress. Different uppercase letters indicate significant differences among species with the same PEG treatment, and different lowercase letters indicate significant differences among treatments for the same species according to Tukey’s HSD test or Games-Howell’s test (p ≤ 0.05). Bars and error lines represent means ± SE (n = 3).
Horticulturae 10 00288 g004
Figure 5. The activities of superoxide dismutase (A) and peroxidase (B) of the five Clematis species exposed to different concentrations (0%, 10%, 20%, and 30%) of PEG stress. Different uppercase letters indicate significant differences among species with the same PEG treatment, and different lowercase letters indicate significant differences among treatments for the same species according to Tukey’s HSD test or Games-Howell’s test (p ≤ 0.05). Bars and error lines represent means ± SE (n = 3).
Horticulturae 10 00288 g005
Figure 6. Correlation analysis among leaf biochemical parameters of the five Clematis species. Red and blue represent positive and negative correlations, respectively. *, **, and *** indicate significance at the 0.05, 0.01, and 0.001 probability levels, respectively.
Horticulturae 10 00288 g006
Figure 7. The loading plot of principal component analysis (PCA) of leaf biochemical parameters from the five Clematis species.
Horticulturae 10 00288 g007
Table 1. The germination percentage (TG), germination potential (GP), germination index (GI), and vigor index (VI) of the five Clematis species exposed to different concentrations (0%, 5%, 10%, and 15%) of PEG stress. Mean ± standard error (SE) values are provided. Different uppercase letters indicate significant difference among species with the same PEG treatment, and different lowercase letters indicate significant difference among treatments for the same species according to Tukey’s HSD test or Games-Howell’s test (p ≤ 0.05). *** indicates a significant difference at p < 0.001. - - indicates no data.
Species (S)PEG Concentration (P)Germination Percentage (TG, %)Germination Potential (GP, %)Germination Index (GI)Vigor Index (VI)
C. tangutica0%95.55 ± 2.22 Aa33.33 ± 3.33 ABCa4.85 ± 0.13 Ab73.08 ± 22.37 ABb
5%93.33 ± 1.93 Aa20.00 ± 1.92 Bb5.62 ± 0.20 Aa249.07 ± 39.35 Aa
10%96.67 ± 1.93 Aa22.22 ± 1.11 Ab5.54 ± 0.18 Aab192.77 ± 20.32 Aa
15%62.22 ± 2.22 Bb18.89 ± 1.11 Ab4.09 ± 0.10 Ac66.64 ± 14.49 Ab
C. glauca0%97.78 ± 2.22 Aa27.78 ± 1.11 ABa3.65 ± 0.05 Ba83.90 ± 15.33 Aa
5%91.11 ± 1.11 Aab26.67 ± 1.92 Aa3.21 ± 0.05 Bb96.91 ± 12.58 Ba
10%83.33 ± 5.09 ABbc20.00 ± 0.00 Ab2.84 ± 0.16 Babc21.90 ± 3.19 BCb
15%77.78 ± 1.11 Ac11.11 ± 1.11 Cc2.25 ± 0.02 Bc3.32 ± 0.39 Bb
C. intricata0%82.22 ± 1.11 Aa17.78 ± 1.11 Ca1.71 ± 0.01 Cab72.99 ± 6.18 ABa
5%85.55 ± 6.19 Aa15.56 ± 1.11 BCa1.69 ± 0.11 Cab84.18 ± 16.23 Ba
10%66.67 ± 3.33 ABb16.67 ± 0.00 Ba1.29 ± 0.08 Cbc60.35 ± 14.33 BCa
15%13.33 ± 0.00 Cc3.33 ± 0.00 Cb0.23 ± 0.00 CcD1.92 ± 0.07 Bb
C. nannophylla0%93.33 ± 5.09 Aa17.78 ± 4.00 BCa1.03 ± 0.05 Db20.48 ± 0.87 BCa
5%96.67 ± 1.93 Aa13.33 ± 0.00 Ca1.45 ± 0.02 Ca13.55 ± 3.30 Babcd
10%75.56 ± 1.11 ABb13.33 ± 0.00 Ca0.78 ± 0.01 CDbc1.12 ± 0.04 Cbc
15%3.33 ± 0.00 Dc3.33 ± 0.00 Cb0.06 ± 0.00 Dd0.16 ± 0.03 Bd
C. fruticosa0%91.56 ± 1.67 Ab10.00 ± 0.00 Ca0.87 ± 0.08 Da14.22 ± 2.48 Cab
5%98.34 ± 1.67 Aa12.22 ± 1.11 Ca0.78 ± 0.13 Da9.51 ± 0.84 Ba
10%73.34 ± 3.34 Bc8.89 ± 1.11 Da0.52 ± 0.12 Db0.74 ± 0.13 Cb
15%0 ± 0 Dd- -- -- -
Species (S)************
PEG (P)************
S × P************
Table 2. Kaiser–Meyer–Olkin and Bartlett’s test of sphericity.
Kaiser–Meyer–Olkin Measure of Sampling AdequacyBartlett’s Test of Sphericity
Approx. Chi-SquaredfSig.
0.601377.283450.000
Table 3. The component matrix and loading value based on principal component analysis (PCA).
TraitsPrincipal Component MatrixLoading Value in PCA coordinate
PC1PC2PC3PC1PC2PC3
Chl a + b0.898166−0.29269−0.109720.462879−0.20774−0.09285
Chl b0.84265−0.25805−0.084060.434269−0.18316−0.07113
Chl a0.7567130.052037−0.131740.389980.036935−0.11148
Car0.706306−0.29639−0.177450.364002−0.21038−0.15017
POD0.7040280.062380.5988420.3628290.0442770.506769
MDA−0.19960.799024−0.0162−0.102870.567137−0.01371
Soluble sugar0.4634940.7843940.1314380.2388670.5567520.111229
Proline0.5468760.548410.3025470.2818380.3892540.25603
Soluble protein0.038910.34796−0.660860.0200530.246978−0.55925
SOD−0.3549−0.250360.651161−0.1829−0.17770.551044
Eigenvalue3.761.981.4
% of Variance37.6519.8513.96
Table 4. The scores and ranking of the five species of Clematis under different drought stress treatment based on principal component analysis (PCA).
SpeciesPEG ConcentrationScores of PC1Scores of PC2Scores of PC3Total ScoresRanking
C. tangutica0%0.82233−1.592490.068140.00303311
10%2.132707−0.581581.6171170.9133583
20%−0.331270.4090370.7600330.06259510
30%−0.70153−0.33696−0.5928−0.413813
C. glauca0%−1.11258−1.05352−1.4059−0.8243317
10%0.6633630.501420.061430.3578697
20%0.5925131.181620.6959330.5548095
30%0.283810.6153930.1713970.2529428
C. intricata0%3.27888−1.89698−0.205460.8293064
10%2.325591.0244931.2663171.255792
20%3.5243630.8767870.594741.5840441
30%−1.463963.74688−0.22890.1605699
C. nannophylla0%−1.86384−1.634840.74267−0.9225518
10%−3.59216−0.409891.556307−1.2165319
20%−0.79952−1.550560.88603−0.4850814
30%−2.95242−1.435390.349647−1.3477120
C. fruticosa0%−0.42474−0.9187−2.33459−0.6682716
10%1.8656670.104093−2.246380.4094266
20%−1.161831.8897270.351997−0.0131912
30%−1.085371.06146−2.10772−0.4922815
Disclaimer/Publisher’s Note: The statements, opinions and data contained in all publications are solely those of the individual author(s) and contributor(s) and not of MDPI and/or the editor(s). MDPI and/or the editor(s) disclaim responsibility for any injury to people or property resulting from any ideas, methods, instructions or products referred to in the content.

