Article

Neonatal Calf Diarrhea Is Associated with Decreased Bacterial Diversity and Altered Gut Microbiome Profiles

The State Key Laboratory of Animal Nutrition, College of Animal Science and Technology, China Agricultural University, No. 2 Yuanmingyuan West Road, Haidian District, Beijing 100193, China
*
Author to whom correspondence should be addressed.
Fermentation 2023, 9(9), 827; https://doi.org/10.3390/fermentation9090827
Submission received: 1 August 2023 / Revised: 19 August 2023 / Accepted: 22 August 2023 / Published: 11 September 2023
(This article belongs to the Section Probiotic Strains and Fermentation)

Abstract

:
Neonatal calf diarrhea (NCD) is a broad symptom encompassing many potential underlying causes. While alterations in the gut microbiota have been correlated with diarrhea, the effects of diarrhea on gut communities have not been sufficiently studied. To explore these effects and identify key microbiota involved, we profiled the fecal microbial community of 21 calves with varying health conditions using the 16S rRNA gene. In comparison to healthy calves, diarrheic calves exhibited significantly decreased diversity and evenness indices. There was a notable increase in the relative abundance of Proteobacteria and Actinobacteriota, and a significant decrease in the relative abundance of Bacteroidetes. At the genus level, there were increased relative abundances of Escherichia-Shigella and Lactobacillus. Notably, the abundance of Lactobacillus continued to increase during the recovery from diarrhea. Clinical observation and bacterial typing analysis revealed fecal microbiome dysbiosis as a significant characteristic of NCD. This work identifies dysbiosis as a key factor promoting diarrhea in neonatal calves, characterized by a low-diversity microbiome. The increased abundance of Lactobacillus might contribute to the curative properties of diarrhea.

1. Introduction

Neonatal calf diarrhea (NCD) is a significant cause of mortality in newborn calves, characterized by abnormal, frequent, watery, and irregular bowel movements. It is mainly attributed to infectious agents, although non-infectious factors can also play a role [1,2,3,4]. Moreover, among calves younger than two months, Escherichia coli has been identified as the most common pathogen associated with this condition [5].
Gut microbiota plays a protective role in pathogen defense, as dysbiosis of the intestinal microbiota can affect various microbial functions related to nucleotide transport and metabolism, defense, translation, and transcription [6,7]. Furthermore, reduced gastrointestinal barrier function and disruptions in the gut microbiota are associated with diarrhea and alterations in the gut microbiota [8]. Moreover, diarrhea and gut microbiota disruptions have a bidirectional relationship [9]. Specifically, diarrhea disrupts the intestinal microbiome balance, while an imbalance in the intestinal microbiota due to high-value-added exogenous pathogens can also lead to diarrhea.
Diarrheic calves exhibited reduced gut microbiota diversity and significant changes in fecal microbial composition compared to healthy calves. Dysbiosis is evident in diarrheic calves [10], with a notable reduction in the alpha-diversity of intestinal bacterial and fungal communities [11,12]. Furthermore, diarrhea is characterized by a decrease in beneficial bacteria that produce short-chain fatty acids (SCFAs), which play a role in reducing the risk of diarrhea [13,14]. The primary objective of this study was to identify the fecal bacterial microbiota of healthy and diarrheic calves, aiming to investigate how diarrhea impacts the neonatal calf’s intestinal microbiota. The secondary aim was to explore the alterations that occur during neonatal calf diarrhea. We hypothesized that the disruption of fecal microbiota during diarrhea contributes to the pathogenesis of natural calf diarrhea. Additionally, we posit that probiotics might aid in the recovery of diarrheic calves through gastrointestinal effects.

2. Materials and Methods

2.1. Sample Collection and Processing

During the spring season, calves from a large beef farm were enrolled in this study (Table 1). All procedures were conducted in accordance with the guidelines and regulations set by the Animal Ethics Committee of the China Agricultural University, Beijing, China (Permission Number: DK3178). Pregnant cows within 8 weeks of calving did not undergo a vaccination protocol. The calves were raised with their dams after birth and were not vaccinated for enterotoxigenic Escherichia coli and bovine coronavirus antibodies. The study included calves born from both Simmental and Angus cattle breeds, and calving was closely monitored with assistance provided as needed. The farm followed a standard health protocol for newborn calves, which included umbilicus care and colostrum feeding within the first four hours of life. The quality of colostrum was eligible. From 0 to 8 weeks of age, the calves were fed milk using a group bucket feeding method. The farm housed a total of 100 calves per year and provided group pen housing with mushroom residue as bedding.
Diarrhea in calves was evaluated using a fecal mobility score [15], where a score of 1 was considered normal (firm but not hard, original shape slightly distorted after falling to the floor and settling), 2 indicated soft consistency (does not retain its shape, piles up but spreads out a little), 3 indicated runny consistency (spreads out readily to a depth of about 6 mm), and 4 indicated watery consistency (liquid, splashy). A calf was categorized as having diarrhea if it scored 2 or higher on the fecal mobility score. To ensure accuracy and prevent sample contamination, fecal samples were collected from calves exhibiting diarrhea symptoms one day after the symptoms became noticeable (fecal score greater than 2). This process was repeated over a two-week sampling period, followed by a 7-day observation period to document the regression of diarrhea symptoms. Healthy calves were sampled based on age-matched, approximately day-old calves with normal fecal consistency (fecal score = 1). Their health status was also continuously observed for one week, excluding samples from calves that subsequently developed disease. Sterile rectal swabs were utilized to collect fecal samples from both diarrheic and healthy calves. Fecal samples were gathered after inducing defecation through rectal stimulation, and the initial part of the feces was discarded. Rigorous aseptic techniques were followed during sample collection, and all samples were promptly stored at −80 °C until further processing.
A total of 21 samples were collected for gut microbiota analysis. This comprised 9 samples from diarrheic calves aged 1 to 30 days and 9 age-matched samples from healthy calves. The OTUs in each group were used to generate rarefaction curves, which were used to assess whether the sequencing depth was sufficient (Supplementary Figure S1). As the number of sample reads increased, the identification rate of OTUs gradually decreased and then plateaued, indicating that the sequencing depth was sufficient to assess the major members of the rumen bacterial community. Additionally, 4 fecal samples were obtained from calves at different stages, including the incubation period (when the calf showed no obvious symptoms and had normal fecal consistency, fecal score = 1), prodromal phase (when calves exhibited reduced appetite, soft feces, depression, and watery feces, fecal score greater than 2), post-recovery (after diarrhea symptoms had disappeared, fecal consistency returned to normal, and regular behavior and activity were restored, fecal score = 2), and samples collected from the anal canal of a calf that died 7 days after sampling (fecal score = 1) [16]. In the comparison between diarrheic and healthy calves, three special samples (fecal samples from the incubation period, post-recovery, and 7 days after sampling from a deceased calf) were excluded. These three samples could not be definitively categorized as either healthy or diarrheic, and thus were not considered in the analyses of microbiota composition and functional predictions.

2.2. Microbial DNA Extraction and Sequencing

The microbial community genomic DNA from fecal samples was extracted using the E.Z.N.A.® soil DNA Kit (Omega Bio-tek, Norcross, GA, USA) according to the manufacturer’s instructions. The hypervariable region V3-V4 of the bacterial 16S rRNA gene was then amplified using primer pairs 338F (5′-ACTCCTACGGGAGGCAGCAG-3′) and 806R(5′-GGACTACHVGGGTWTCTAAT-3′) with an ABI GeneAmp® 9700 PCR thermocycler (ABI, Los Angeles, CA, USA). The PCR cycling protocol included an initial denaturation step at 95 °C for 3 min, followed by cycling for a certain number of times with denaturation at 95 °C for 30 s and annealing at 72 °C for 45 s. The final extension step was at 72 °C for 10 min, followed by a hold at 10 °C. The purified amplicons were pooled equimolarly and paired-end sequenced using an Illumina MiSeq PE300 platform or NovaSeq PE250 platform (Illumina, San Diego, CA, USA), according to the standard protocols provided by Majorbio Bio-Pharm Technology Co., Ltd. (Shanghai, China). The raw reads were deposited into the NCBI Sequence Read Archive (SRA) database with the Accession Number PRJNA918869. Using agarose gel electrophoresis to visualize the DNA bands and compare their intensity to known standards to estimate the concentration of the samples prior to pooling for sequencing. This method ensured the accuracy of subsequent sequencing results.

2.3. Bioinformatics and Statistical Analyses

The raw 16S rRNA gene sequencing reads underwent demultiplexing and quality filtering using fastp version 0.20.0 [17] and were merged using FLASH version 1.2.7 [18]. Operational taxonomic units (OTUs) were generated with a 97% similarity cutoff using UPARSE version 7.1 [19], and chimeric sequences were identified and removed. The taxonomy of each OTU representative sequence was analyzed using RDP Classifier version 2.2 [20] against the 16S rRNA database (Silva v138) with a confidence threshold of 0.7. The OTU abundance was normalized using a standard with a sequence number corresponding to the sample with the least number of sequences.
Alpha-diversity measurements and beta diversity were calculated using QIIME2 [21]. Four indices, including Sobs, Shannon, Shannoneven, and Coverage, as well as observed OTUs, were used to characterize the diversity of the gut bacterial community. Comparative analysis was performed using the Wilcoxon rank-sum test. Beta diversity analysis was conducted to examine differences in the main components among different samples. The weighted_unifrac dissimilarity index was employed to assess the differences in bacterial community structure between diarrheic and healthy calves, and it was analyzed using Principal co-ordinates analysis (PCoA) and PERMANOVA. To simplify the analysis, low-abundance groups were combined into “Others” to provide a clearer representation of the data. The Wilcoxon rank-sum test or Mann–Whitney U test was used to determine significant differences in bacterial communities between healthy and diarrheic calves, considering only taxa with a mean relative abundance >0.1% in at least one group. Statistical significance was defined as p < 0.05. LEfSe was utilized to identify taxa associated with diarrhea in fecal bacteria, using a size-effect threshold of 3.4 for the logarithmic LDA score as the discriminative functional biomarkers.
Metagenomes were predicted using Phylogenetic Investigation of Communities by Reconstruction of Unobserved States (PICRUSt 1.1.1) after normalizing for the 16S rRNA gene copy number. The KEGG genes were aggregated into metabolic pathways, and differential enrichment categories between healthy and diarrheic calves were determined using the Wilcoxon rank-sum test. Concurrently, we conducted statistical analysis on the functional information of microbial communities from samples obtained from both healthy and diarrheic calves. This was accomplished through PICRUSt2 functional prediction in conjunction with the rank-sum test.
Samples were clustered using Enterotype clustering, performed with Jensen–Shannon distance and partitioning around medoid (PAM) clustering. The optimal number of clusters was estimated using the Calinski–Harabasz (CH) index. Validation of the cluster was performed using the silhouette validation technique, and graphical interpretation of the clusters was visualized with principal component analysis.
A significance level of p < 0.05 was considered for all analyses. The statistical tests used for comparison included the Wilcoxon rank-sum test and Mann–Whitney U test for comparing bacterial communities between healthy and diarrheic calves, and the Wilcoxon rank-sum test for comparing differentially enriched metabolic pathways between the two groups. Multiple comparison (FDR) using correction was also applied in the analysis.

3. Results

3.1. Analysis of 16S rRNA Gene Sequencing

The study generated a total of 1,019,094 optimized sequences with a mean of 425,843,080 bases per sample. After clustering at 97% similarity, 497 operational taxonomic units (OTUs) were identified, which were further classified into 17 phyla, 34 classes, 74 orders, 128 families, 238 genera, and 358 species. The coverage of 97% obtained for all samples indicated that subsampling was adequate.

3.2. Diarrhea Is Associated with Decreased Alpha-Diversity of Gut Bacterial Microbiota

The alpha-diversity of the fecal microbiota was assessed using the Sobs and Shannon indices, which reflect bacterial richness and diversity, as well as the Shannoneven and Coverage indices, which reflect evenness and community coverage, respectively. The results showed that there were significant differences in richness (Sobs, p = 0.019), evenness (Shannon indices, p = 0.013), and diversity (Shannoneven, p = 0.017) of the fecal microbiota between healthy and diarrheic calves. During diarrhea, alpha-diversity decreased and remained significantly lower than that of healthy calves, with a coverage of 99% obtained for all samples (Figure 1).

3.3. Relationship between Diarrhea and the Fecal Microbiome Beta Diversity

The PCoA showed a clear distinction between the healthy calves and diarrheic calves (Figure 2). PCoA analysis on the OTU level showed a significant difference in the bacterial community structure between the fecal samples of diarrheic and healthy calves (F-value = 2.4749, R2 = 0.22312, p < 0.01). This finding suggests that the microbiota composition is altered during diarrhea.

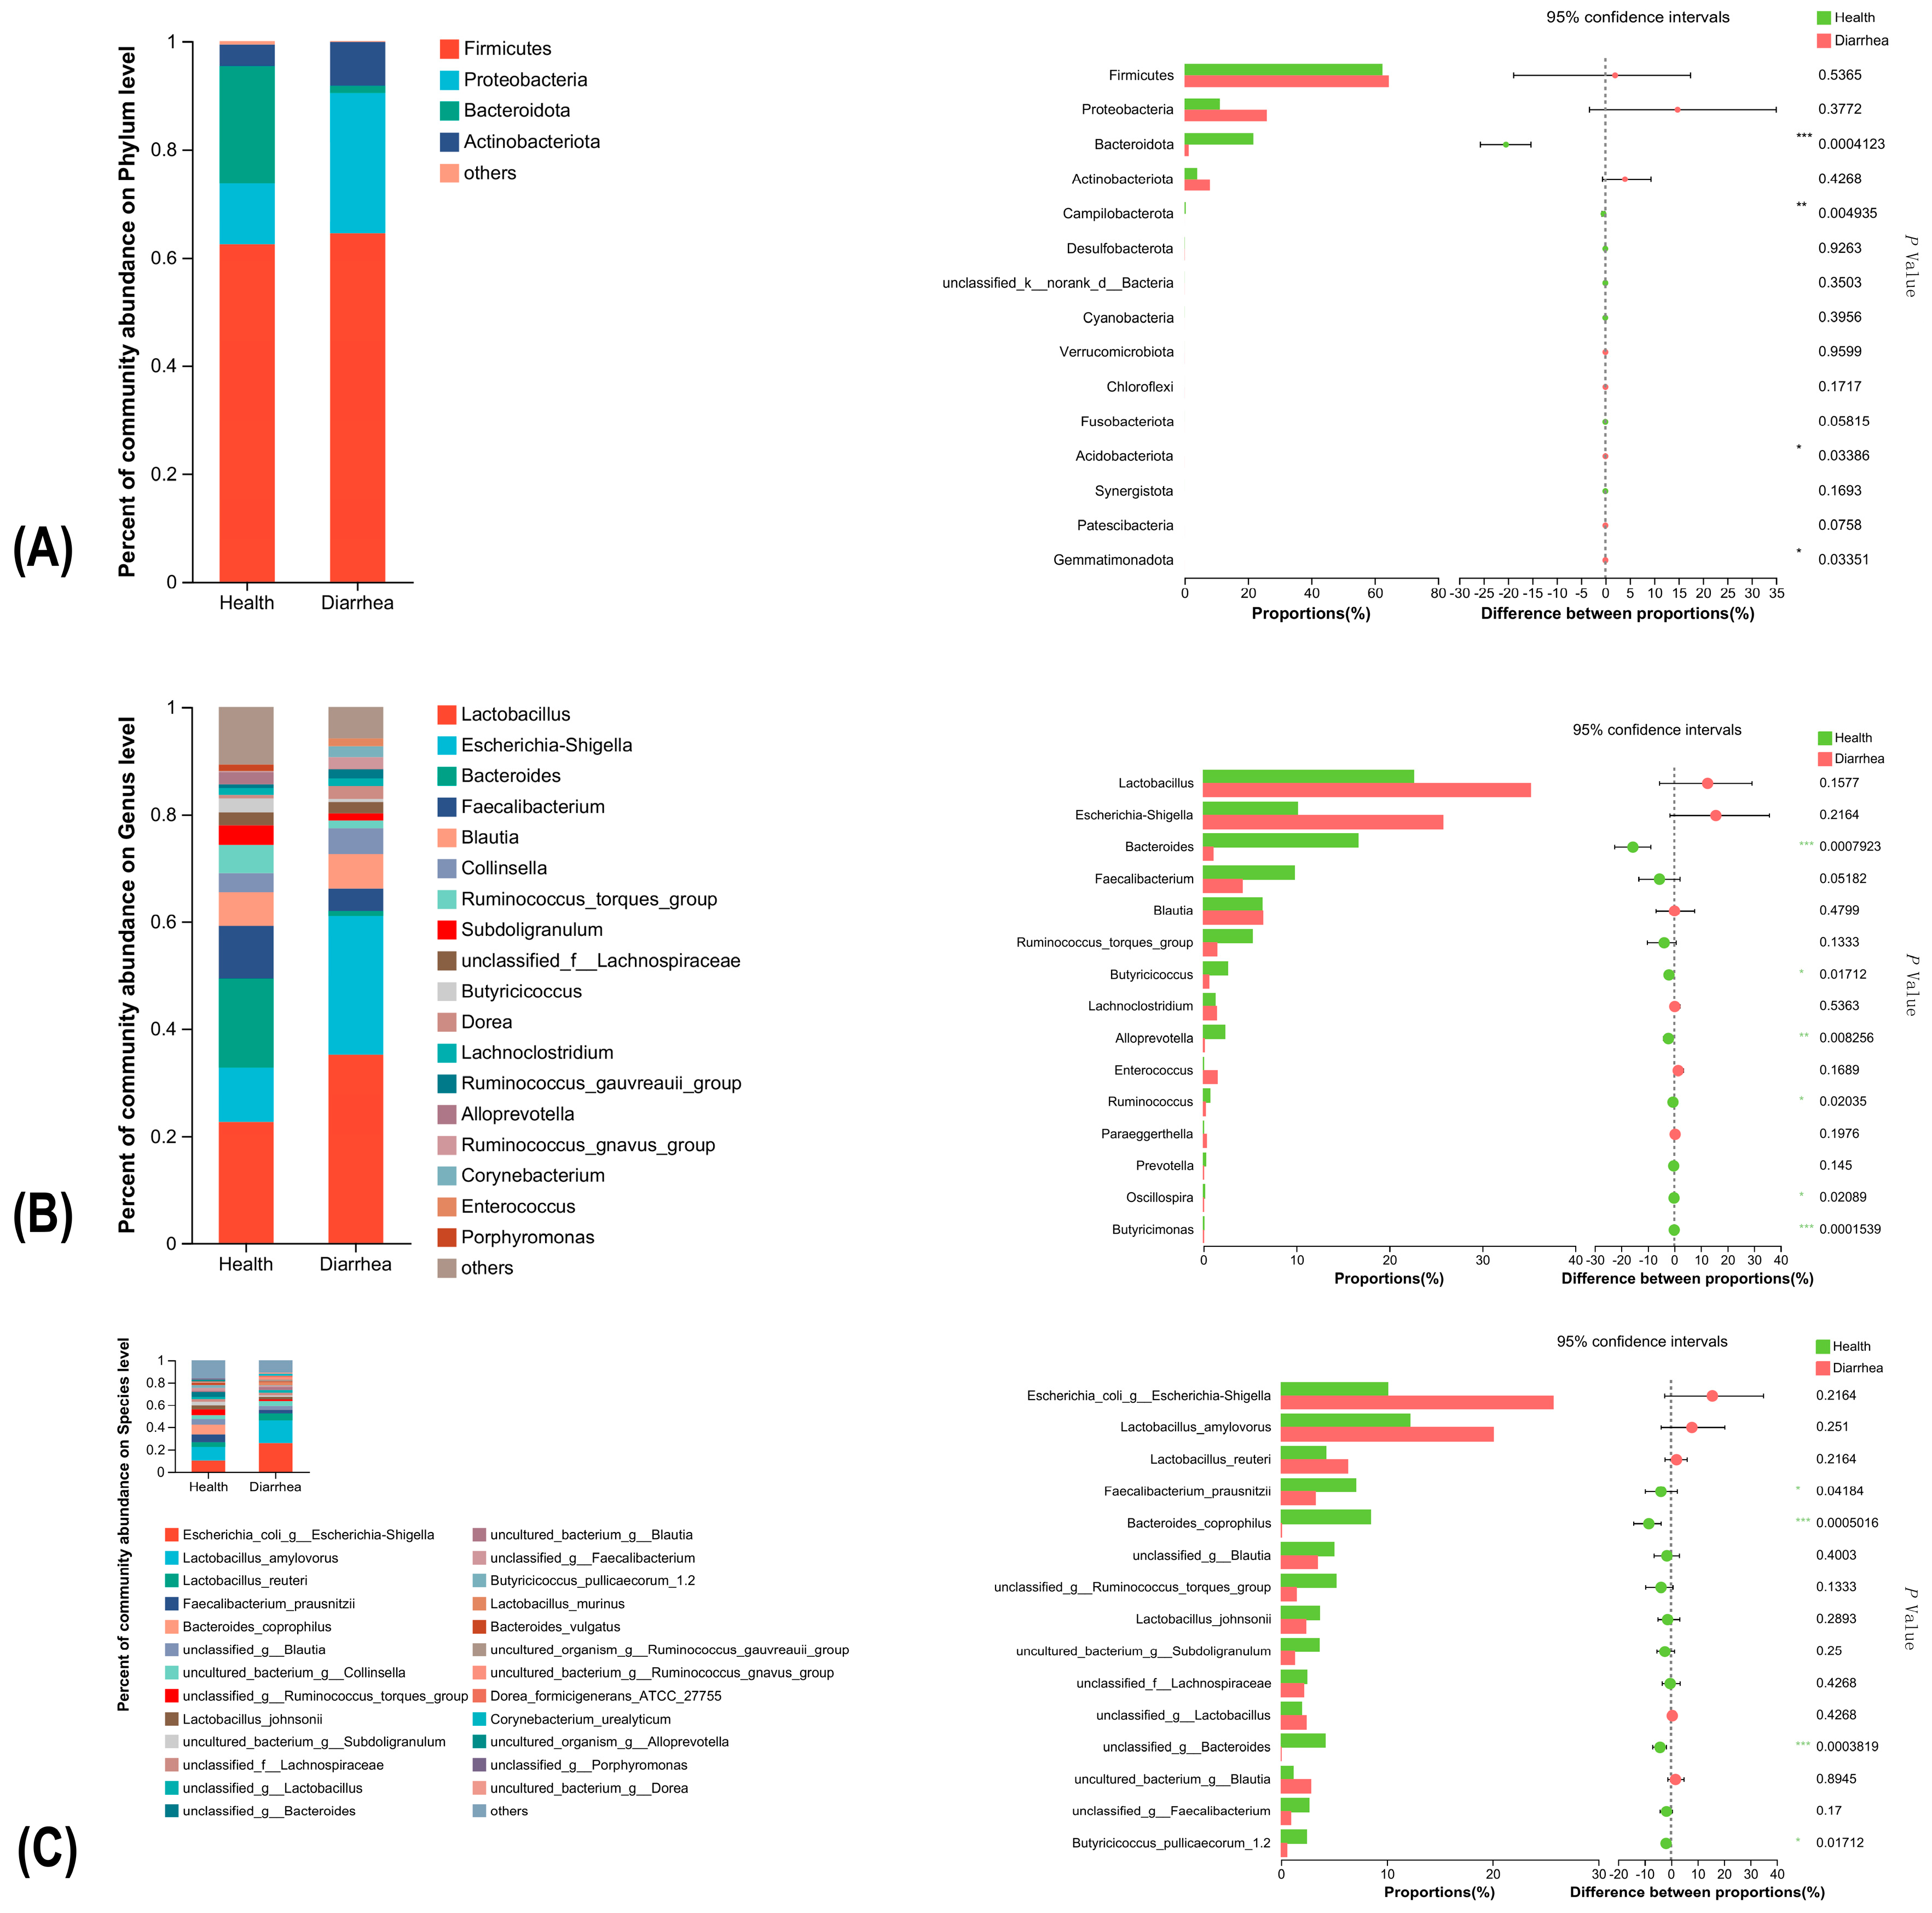
3.4. Significant Alterations of Bacterial Taxonomic Composition in Diarrheic Calves

Figure 3 depicts the composition of rumen bacterial communities and details of the intergroup differences in bacterial phyla, genera and species in terms of abundance. The study identified a total of 17 different phyla, 238 genera, and 358 species, with Firmicutes, Proteobacteria, Bacteroidota, and Actinobacteriota being the dominant phyla accounting for more than 97% of sequences in both healthy and diarrheic calves. However, there were some differences in bacterial prevalence at the phylum level between healthy and diarrheic calves. Healthy calves had a lower relative abundance of Firmicutes and Proteobacteria compared to diarrheic calves, while diarrheic calves had a significantly lower relative abundance of Bacteroidota and Campilobacterota and a significantly higher relative abundance of Acidobacteriota and Gemmatimonadota. At the genus level, diarrheic calves had a higher abundance of Lactobacillus and Escherichia-Shigella and a significantly lower abundance of Bacteroides, Butyricicoccus, Alloprevotella, Ruminococcus, Oscillospira, Butyricimonas, and Parasutterella compared to healthy calves. At the species level, a comparison between healthy calves and diarrheic calves identified a lower relative abundance of Escherichia-Shigella, Lactobacillus amylovorus, and Lactobacillus reuteri in healthy calves. In contrast, compared to healthy calves, diarrheic calves exhibited a significantly lower relative abundance of Faecalibacterium prausnitzii, Bacteroides coprophilus, and Butyricicoccus pullicaecorum 1.2.

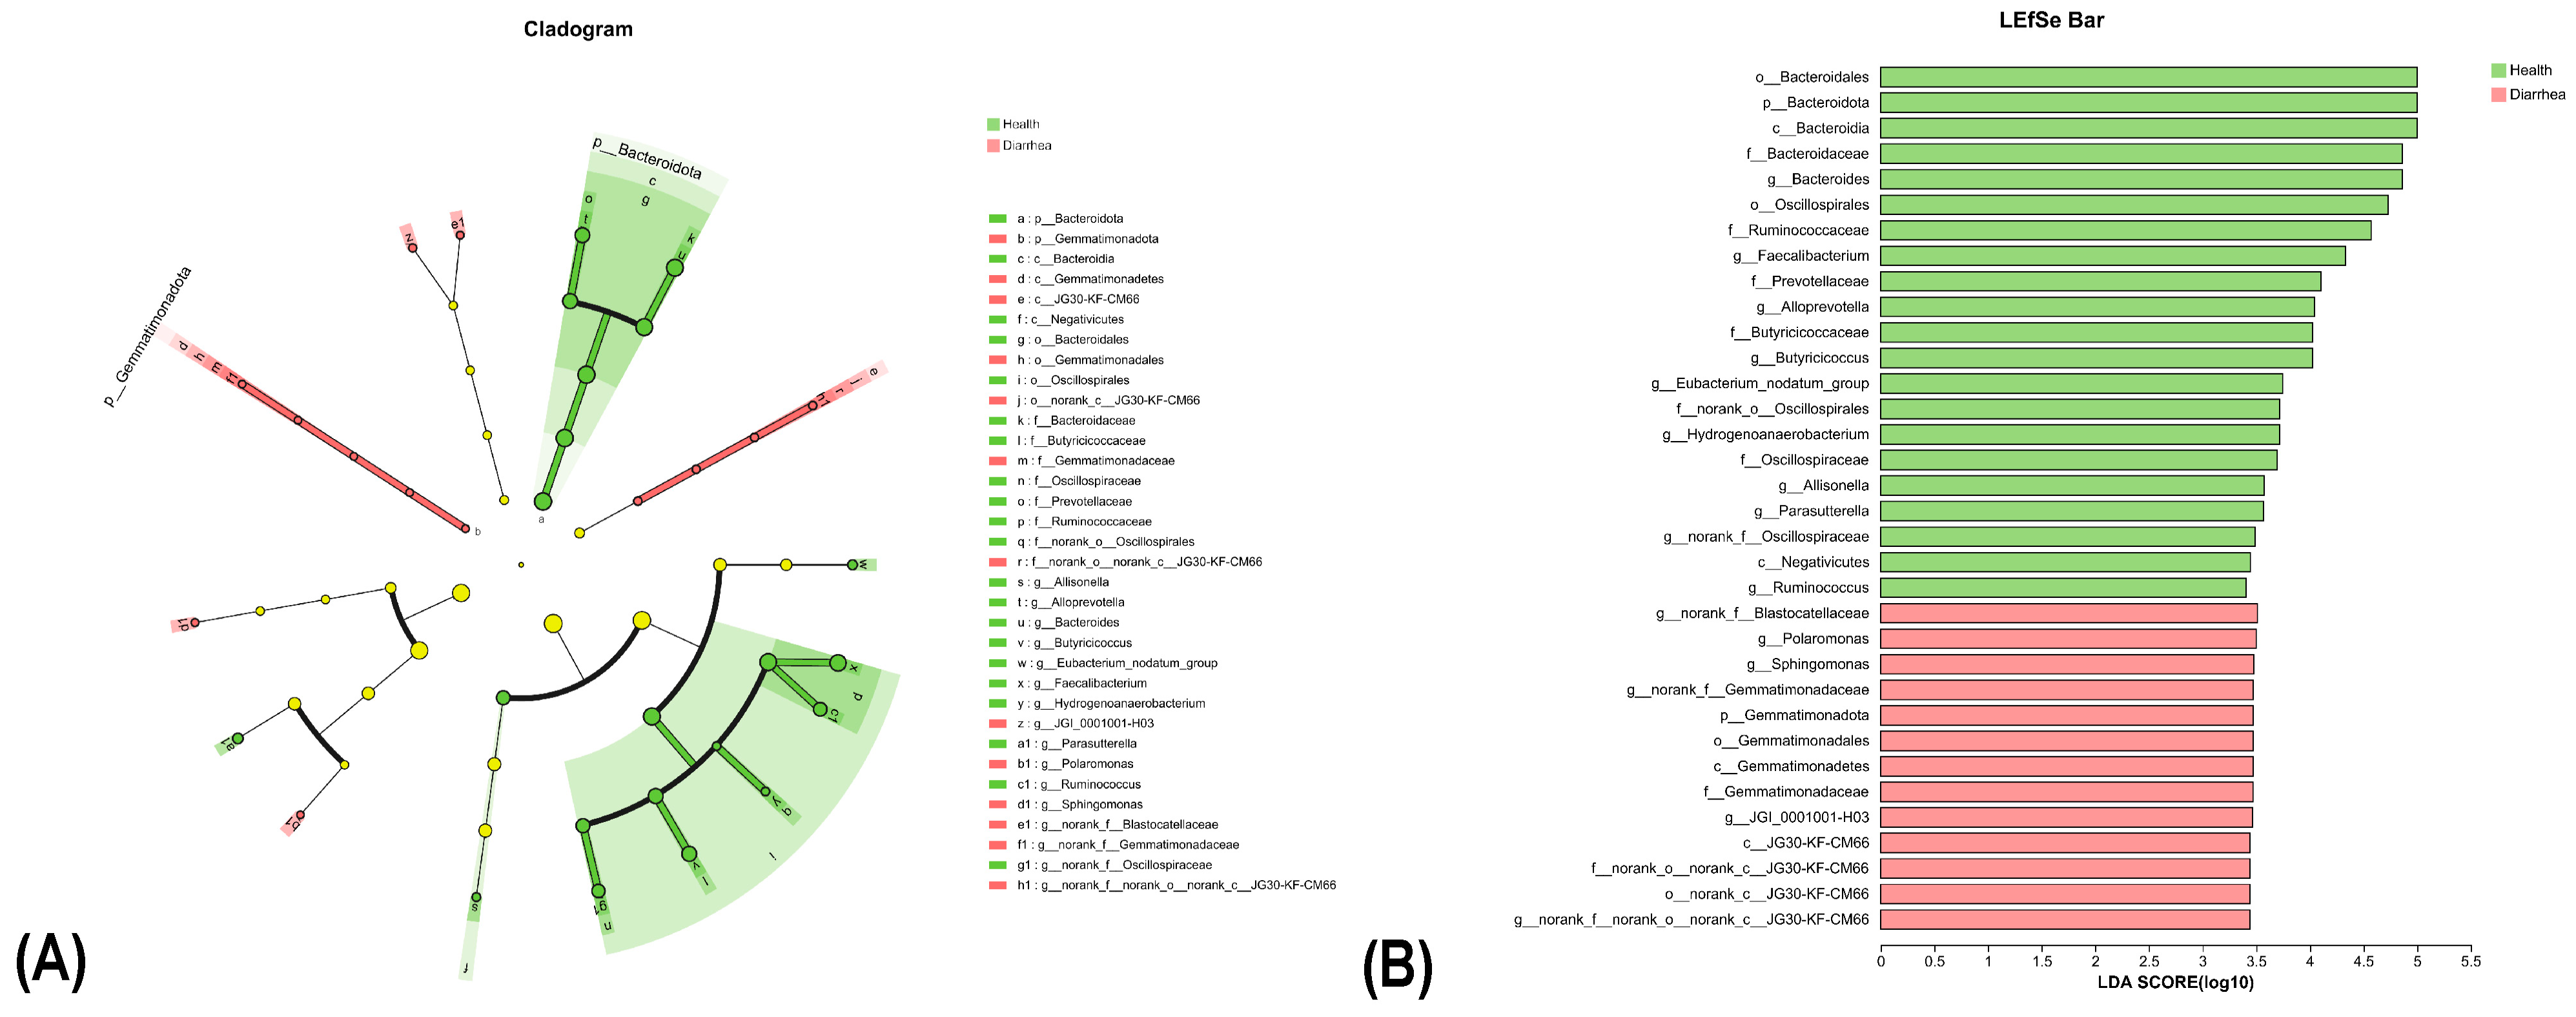
3.5. LEfSe Analysis Reveals Distinct Microbial Profiles between Healthy and Diarrheic Calves from Phylum to Species Level

LEfSe (Linear discriminant analysis Effect Size, Linear Discriminant Analysis and Influence Factor) was used to discover the species characteristics in diarrhea calves and diarrhea calves that best explained the differences between groups and the extent to which these characteristics influenced the differences between groups(Figure 4).The LDA effect size (LEfSe) analysis revealed significant differences in the microbial communities between healthy and diarrheic calves at the genus level. Several microorganisms, including Gemmatimonadota, Sphingomonas, Polaromonas, JG30-KF-CM66, and JGI_0001001-H03, were found to be enriched in diarrheic calves. In contrast, several taxa, such as Bacteroidota, Oscillospirales, Ruminococcaceae, Faecalibacterium, Prevotellaceae, Alloprevotella, Butyricicoccaceae, Butyricicoccus, Eubacterium_nodatum_group, norank_o Oscillospirales, Hydrogenoanaerobacterium, Oscillospiraceae, Allisonella, Parasutterella, norank_f Oscillospiraceae, and Negativicutes, were predominant in healthy calves.

3.6. Prokaryotic Taxa Identified across the Study Sample

To investigate potential differences in microbiome response to diarrhea compared to other disease states, the researchers performed clustering analysis using 16S rRNA data from 21 fecal samples (Figure 5), which were divided into five groups based on disease outcome. Nine microbiota clusters, or enterotypes, were identified. Type 1 and type 9 samples came from incubation and death individuals, respectively, and were dominated by Clostridium_sensu_stricto_1 and Collinsella, respectively. Type 2 consisted of diarrheic individuals and was largely composed of Escherichia-Shigella. Type 3, type 4, and type 6 consisted of samples from healthy and diarrheic individuals and were mainly composed of Escherichia-Shigella and Lactobacillus. Type 5 included individuals from recovered and diarrheic categories and was mainly composed of Lactobacillus. Type 7 and type 8 consisted of samples from healthy calves and were mainly composed of Bacteroidales.
The results revealed that about half of the fecal microbiota of diarrheic calves were dominated by Escherichia-Shigella, while the others were dominated by Lactobacillus. The composition of the main microbiota with dead and preclinical calves was single and imbalanced, suggesting that pathogenic bacterial infection and gut microbiome imbalance were the leading cause of diarrhea, but not the only reason.

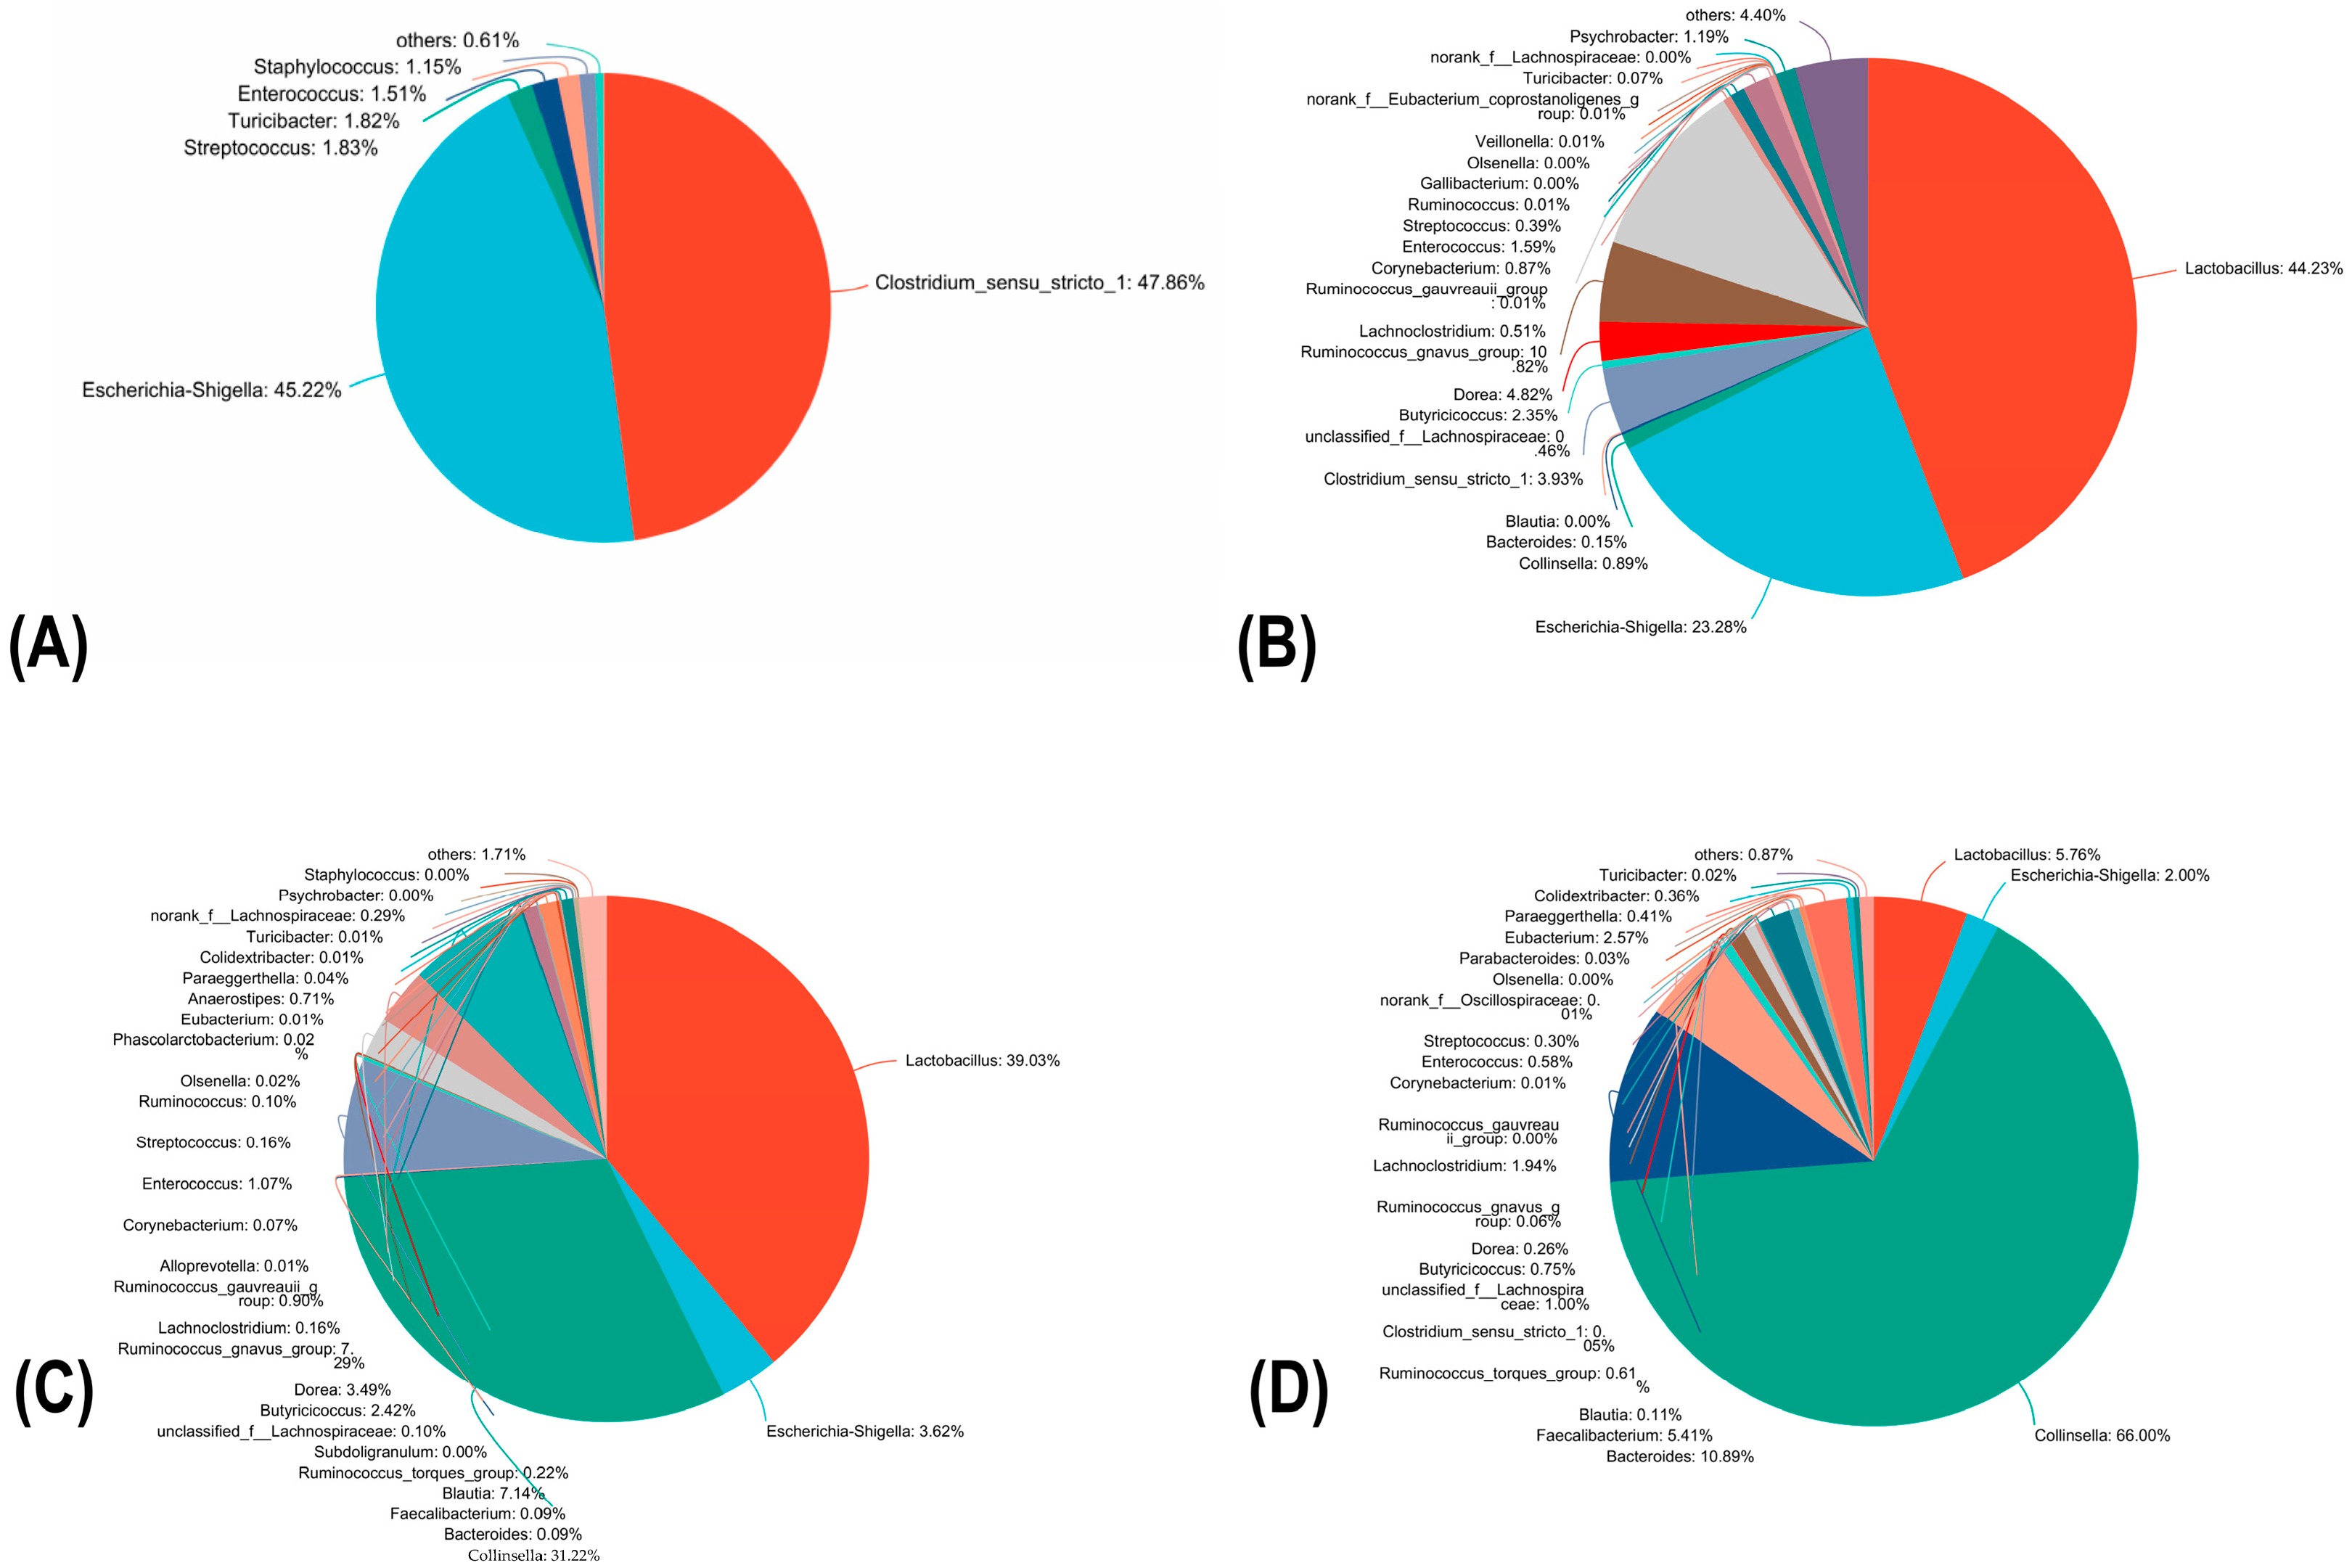
3.7. Fecal Microbiota Changes of Diarrhea Calves during Prodrome, Obvious Symptom, Conversion Period and Death

To better understand the clinical features, course, and outcome of NCD and the relationship between diarrhea outcome and gut microbial community assemblage, we examined changes in the fecal microbial community over time in a diarrheic calf (Figure 6A–C) and the composition of the fecal microbial community in a calf that died 7 days after sampling (Figure 6D). The results showed that during the incubation period, the fecal microbial communities were mainly composed of Escherichia-Shigella and Clostridium_sensu_stricto_1, while Lactobacillus increased in abundance during diarrhea and decreased back to baseline early in the recovery. The study also found that calves with low microbial diversity died 7 days after sampling. However, it should be noted that the sample size was limited, and further studies with larger sample sizes are necessary to validate these findings.

3.8. 16S rRNA Functional Prediction

Functional abundance of KEGG orthologs (KO) was predicted based on marker gene (16S) sequences using PICRUSt2 (Phylogenetic Investigation of Communities by Reconstruction of Unobserved States) software for functional prediction analysis, and the rank-sum test was performed on the predicted functional pathway (Figure 7). The study utilized PICRUSt2 and the KEGG database to predict potential functional changes in the microbiome between healthy and diarrheic calves. The analysis identified ten predicted pathways (defined by KEGG level 2) that were differentially abundant between the two groups. Membrane transport and infectious disease: parasitic were enriched in diarrheic calves, while cellular community—eukaryotes, environmental adaptation, immune system, transport and catabolism, cell growth and death, biosynthesis of other secondary metabolites, glycan biosynthesis and metabolism, and energy metabolism were depleted in diarrheic calves compared to healthy calves (p < 0.05). These results suggest that diarrhea not only impacts the structure of the fecal bacterial community but also its functionality.

4. Discussion

Neonatal diarrhea in calves is a significant issue in the cattle industry, leading to substantial economic losses [22]. Previous studies have shown that diarrhea is strongly associated with changes in the gut microbiome, regardless of etiology [23,24,25].
In our study, we compared the fecal microbiota diversity between healthy calves and those with diarrhea. We found a significant decrease in gut bacterial diversity in diarrheic calves. These calves exhibited lower microbial diversity and richness compared to healthy individuals. In healthy calves, the dominant bacteria in the intestinal microbiota were relatively uniform, indicating a balanced intestinal microbiota. Previous studies have shown that the gut microbiota interacts with the host and carries out a variety of important functions to maintain the host’s state of health, and that the diversity of the microbiota contributes to the development of a functional immune system on the surface of the intestinal tract, immunomodulation, and the prevention of infection by pathogens [26,27]. In previous studies on calf diarrhea, changes in the diversity of the fecal microbiota have also been observed, which also affects the function of the microbiota [10]. On the other hand, we also examined the microbiota of fecal samples collected prior to death (Figure 6D), which displayed extreme disorder. This suggests that dysbiosis occurs before death and implies that imbalances emerging earlier in life may contribute to mortality.
We found significant differences in the fecal microbiota and their predicted functional metabolic pathways between healthy and diarrheic calves. PCoA shows large differences in the fecal microbiomes of calves of different health statuses. This is consistent with the results of related diarrhea studies [28,29]. At the phylum level, the fecal microbiota of healthy calves was dominated by Firmicutes, followed by Bacteroidetes, Proteobacteria, and Actinobacteria, while that of diarrhea calves was dominated by Firmicutes, followed by Proteobacteria, Actinobacteria, and Bacteroidetes. Besides, Firmicutes and Bacteroidetes predominate in the feces of healthy calves, and the ratio of Firmicutes/Bacteroidetes can also reflect the ecological balance or dysbiosis of the gastrointestinal tract [30]. In the present study, the increase in the ratio of Firmicutes/Bacteroidetes can be regarded as an important marker of intestinal microbiota dysbiosis. Such changes are also associated with disease susceptibility [31]. Though various factors are implicated in NCD, infectious agents remain a major cause. Compared with healthy calves, the relative abundance of Firmicutes and Proteobacteria increased in diarrheic calves. Proteobacteria is a prominent phylum in the rumen microbiome, which contains potentially harmful bacteria like Escherichia coli. This bacterium is found in both healthy and unhealthy guts, encompassing various strains [32,33]. Escherichia coli-Shigella triggers the secretion of ATP from cells lining the gut. This occurrence is linked to the invasion and propagation of these bacteria within the gut, consequently contributing to the advancement of secretory diarrhea [34,35,36]. Cluster analysis of the calves’ fecal microbiome enterotypes showed that Escherichia-Shigella is the main pathogen in calves with diarrhea, suggesting that an overload of pathogenic bacteria contributed mainly to the development of diarrhea.
In diarrheic calves, higher levels of Lactobacillus and Escherichia coli-Shigella are observed. Lactobacillus has been shown to mitigate Escherichia coli-Shigella presence, reinstating a balanced fecal microbiota [37]. It also plays a crucial role in maintaining intestinal health, which contributes to a lower pH in the intestinal tract, which inhibits the growth of harmful pathogens [38]. It also has been found to have beneficial effects on inflammatory bowel disorders by stimulating immune cells [39]. Therefore, having high levels of Lactobacillus is considered a key indicator of a healthy gut environment. We tracked the composition of the fecal microbiota of a calf during the incubation, prodromal stage, and recovery phases of diarrhea and showed that the abundance of Lactobacillus increases and returns to baseline levels early in the recovery phase (Figure 6A–C). The structure and composition of fecal microbiota in diarrheic calves exhibited more abundance of Lactobacillus, suggesting that Lactobacillus may be a marker of intestinal microbiota changes during the recovery period of diarrhea.
Microbiota possess significant metabolic potential and are associated with SCFA production, with some SCFA-producing bacteria (such as Faecalibaculum, Butyricicoccus, and Ruminococcaceae) significantly reduced in diarrheic calves [40]. Our research on fecal microbiota has revealed that neonatal calf diarrhea is characterized by a reduction in beneficial bacteria that produce short-chain fatty acids (SCFAs) and help improve the risk of diarrhea, diarrheic calves showed expansion of pro-inflammatory bacteria such as Escherichia coli. Healthy calves had a lower relative abundance of Lactobacillus and Escherichia-Shigella but had a high relative abundance of Bacteriodetes, Faecalibacterium, Ruminococcus_torques_group, and Parasutterella similar to previous observations in neonatal dairy calves [41]. Probiotics can decrease the severity and duration of diarrhea in calves. Faecalibaculum and Parasutterella have been associated with various health outcomes and contribute to metabolic functionalities [42]. F. prausnitzii contributes to butyrate and other SCFA production in the gut and displayed a negative association with calve diarrhea incidences. Reduction in F. prausnitzii has been associated with inflammatory bowel disease and Clostridium difficile infection [43,44]. The administration of B. pullicaecorum has been shown to alleviate TNBS-induced colitis, and the supernatant of B. pullicaecorum cultures enhances the epithelial barrier function. Butyricimonas, a butyrate-producing bacteria, exhibits immunomodulatory effects by promoting Treg cells in the gut. Besides, patients with inflammatory bowel disease have lower levels of Butyricicoccus bacteria in their stools [45,46,47]. Our study found that the relative abundance of Faecalibacterium_prausnitzii, Butyricicoccus_pullicaecorum_1.2, Butyricicoccus, and Butyricimonas were significantly reduced in diarrheic calves (Figure 3). This is in agreement with previous studies and also suggests that a decrease in probiotic abundance is another feature of calf diarrhea.
LefSe analysis revealed that the biomarkers of diarrhea in calves include Gemmatimonadota and other microorganisms commonly found in soil and water. Clinical observations have shown that while disinfection is crucial in reducing the incidence of diarrhea in the newborn calf community, proper daily environmental cleaning and disinfection are often overlooked. As a result, we deduced that the primary source of calf diarrhea infections originates from contaminated soil on the calf island, leading to the contamination of the newborn calf’s environment and ultimately resulting in NCD. In addition, while dysbiosis of the fecal microbiota has been identified in calves with diarrhea, association with specific pathogens is still lacking. In some cases, some cows display aggression, and corresponding calves may not receive enough colostrum and maternal care after birth, leading to stress. At the same time, stress is a key factor in abnormal bowel habits such as constipation and diarrhea, and stress can exacerbate these symptoms [48,49,50]. It is important for caregivers to pay attention to conditions that could lead to calf stress.
Based on 16S rRNA function prediction, the abundance of functional genes in the metabolic pathways of the immune system and energy metabolism was significantly reduced in calves with diarrhea, and the infectious disease pathways were significantly increased (Figure 7B). These findings provide further support for the association between gut microbiota dysbiosis and immune system dysregulation, metabolic disorders, inflammatory bowel disease, and heightened susceptibility to pathogens [51]. However, further research is needed to confirm the accuracy of gene function information.

5. Conclusions

Neonatal calf diarrhea is associated with variance in fecal microbial structure and diversity, as well as a reduction in the relative abundance of beneficial bacteria. The fecal microbiota with diarrheic calves were characterized by low diversity and were dominated by Escherichia-Shigella-Lactobacillus. Dysbiosis in fecal microbial community structure was associated with neonatal calf diarrhea and was associated with changes in the predictive metagenomic function of the bacterial communities.

Supplementary Materials

The following supporting information can be downloaded at: https://www.mdpi.com/article/10.3390/fermentation9090827/s1, Figure S1: the Sobs rarefaction curves of healthy and diarrheic calves.

Author Contributions

W.L. designed the study, analyzed the data, and wrote the manuscript. Z.Z. and H.W. revised the manuscript. X.Y., B.W., X.L., B.Y., Z.D., R.A., S.H. and D.L. participated in the sample health status observation. All authors have read and agreed to the published version of the manuscript.

Funding

This study was financially supported by grants from the National Natural Science Foundation of China (Grant Number: 31972593) and the Government Purchase Service (Grant Number: 16200158).

Institutional Review Board Statement

The animal study was reviewed and approved by the Animal Care Committee, China Agriculture University (Permit Number: DK3178).

Informed Consent Statement

Not applicable.

Data Availability Statement

The original contributions presented in the study are publicly available. This data can be found at: https://www.ncbi.nlm.nih.gov/, PRJNA918869.

Acknowledgments

We are grateful to Xiaodong Li and Wanxiang Liu of the Beijing Doudian Hengsheng Animal Husbandry for their help with collecting the samples.

Conflicts of Interest

The authors declare no conflict of interest.

References

  1. Sharp, C.P.; Gregory, W.F.; Mason, C.; Bronsvoort, B.M.d.C.; Beard, P.M. High Prevalence and Diversity of Bovine Astroviruses in the Faeces of Healthy and Diarrhoeic Calves in South West Scotland. Vet. Microbiol. 2015, 178, 70–76. [Google Scholar] [CrossRef] [PubMed]
  2. Fritzen, J.T.; Oliveira, M.V.; Lorenzetti, E.; Miyabe, F.M.; Viziack, M.P.; Rodrigues, C.A.; Ayres, H.; Alfieri, A.F.; Alfieri, A.A. Longitudinal Surveillance of Rotavirus A Genotypes Circulating in a High Milk Yield Dairy Cattle Herd after the Introduction of a Rotavirus Vaccine. Vet. Microbiol. 2019, 230, 260–264. [Google Scholar] [CrossRef] [PubMed]
  3. Blanchard, P.C. Diagnostics of Dairy and Beef Cattle Diarrhea. Vet. Clin. N. Am. Food Anim. Pract. 2012, 28, 443–464. [Google Scholar] [CrossRef] [PubMed]
  4. Smith, D.R. Field Disease Diagnostic Investigation of Neonatal Calf Diarrhea. Vet. Clin. Food Anim. Pract. 2012, 28, 465–481. [Google Scholar] [CrossRef] [PubMed]
  5. House, J.A. Economic Impact of Rotavirus and Other Neonatal Disease Agents of Animals. J. Am. Vet. Med. Assoc. 1978, 173, 573–576. [Google Scholar]
  6. Van Der Waaij, D.; Berghuis-de Vries, J.M.; Lekkerkerk-van Der Wees, J.E.C. Colonization Resistance of the Digestive Tract in Conventional and Antibiotic-Treated Mice. J. Hyg. 1971, 69, 405–411. [Google Scholar] [CrossRef]
  7. Li, H.; Li, B.; Liang, Q.; Jin, X.; Tang, L.; Ding, Q.; Wang, Z.; Wei, Z. Porcine Deltacoronavirus Infection Alters Bacterial Communities in the Colon and Feces of Neonatal Piglets. Microbiologyopen 2020, 9, e1036. [Google Scholar] [CrossRef]
  8. Burrello, C.; Garavaglia, F.; Cribiù, F.M.; Ercoli, G.; Lopez, G.; Troisi, J.; Colucci, A.; Guglietta, S.; Carloni, S.; Guglielmetti, S.; et al. Therapeutic Faecal Microbiota Transplantation Controls Intestinal Inflammation through IL10 Secretion by Immune Cells. Nat. Commun. 2018, 9, 5184. [Google Scholar] [CrossRef]
  9. Li, X.-Y.; He, C.; Zhu, Y.; Lu, N.-H. Role of Gut Microbiota on Intestinal Barrier Function in Acute Pancreatitis. World J. Gastroenterol. 2020, 26, 2187–2193. [Google Scholar] [CrossRef]
  10. Gomez, D.E.; Arroyo, L.G.; Costa, M.C.; Viel, L.; Weese, J.S. Characterization of the Fecal Bacterial Microbiota of Healthy and Diarrheic Dairy Calves. J. Vet. Intern. Med. 2017, 31, 928–939. [Google Scholar] [CrossRef]
  11. Jang, J.-Y.; Kim, S.; Kwon, M.-S.; Lee, J.; Yu, D.-H.; Song, R.-H.; Choi, H.-J.; Park, J. Rotavirus-Mediated Alteration of Gut Microbiota and Its Correlation with Physiological Characteristics in Neonatal Calves. J. Microbiol. 2019, 57, 113–121. [Google Scholar] [CrossRef] [PubMed]
  12. Liu, J.; Wang, X.; Zhang, W.; Kulyar, M.F.-A.; Ullah, K.; Han, Z.; Qin, J.; Bi, C.; Wang, Y.; Li, K. Comparative Analysis of Gut Microbiota in Healthy and Diarrheic Yaks. Microb. Cell Factories 2022, 21, 111. [Google Scholar] [CrossRef]
  13. Yang, Q.; Huang, X.; Zhao, S.; Sun, W.; Yan, Z.; Wang, P.; Li, S.; Huang, W.; Zhang, S.; Liu, L. Structure and Function of the Fecal Microbiota in Diarrheic Neonatal Piglets. Front. Microbiol. 2017, 8, 502. [Google Scholar] [CrossRef] [PubMed]
  14. Hennessy, M.; Indugu, N.; Vecchiarelli, B.; Redding, L.; Bender, J.; Pappalardo, C.; Leibstein, M.; Toth, J.; Stefanovski, D.; Katepalli, A. Comparison of the Fecal Bacterial Communities in Diarrheic and Nondiarrheic Dairy Calves from Multiple Farms in Southeastern Pennsylvania. J. Dairy Sci. 2021, 104, 7225–7232. [Google Scholar] [CrossRef]
  15. Larson, L.L.; Owen, F.G.; Albright, J.L.; Appleman, R.D.; Lamb, R.C.; Muller, L.D. Guidelines Toward More Uniformity in Measuring and Reporting Calf Experimental Data. J. Dairy Sci. 1977, 60, 989–991. [Google Scholar] [CrossRef]
  16. Constable, P.D.; Hinchcliff, K.W.; Done, S.H.; Grünberg, W. Veterinary Medicine: A Textbook of the Diseases of Cattle, Horses, Sheep, Pigs and Goats; Elsevier Health Sciences: Amsterdam, The Netherlands, 2016. [Google Scholar]
  17. Chen, S.; Zhou, Y.; Chen, Y.; Gu, J. Fastp: An Ultra-Fast All-in-One FASTQ Preprocessor. Bioinformatics 2018, 34, i884–i890. [Google Scholar] [CrossRef] [PubMed]
  18. Magoč, T.; Salzberg, S.L. FLASH: Fast Length Adjustment of Short Reads to Improve Genome Assemblies. Bioinformatics 2011, 27, 2957–2963. [Google Scholar] [CrossRef]
  19. Edgar, R.C. UPARSE: Highly Accurate OTU Sequences from Microbial Amplicon Reads. Nat. Methods 2013, 10, 996–998. [Google Scholar] [CrossRef]
  20. Wang, Q.; Garrity, G.M.; Tiedje, J.M.; Cole, J.R. Naive Bayesian Classifier for Rapid Assignment of RRNA Sequences into the New Bacterial Taxonomy. Appl. Environ. Microbiol. 2007, 73, 5261–5267. [Google Scholar] [CrossRef]
  21. Hall, M.; Beiko, R.G. 16S RRNA Gene Analysis with QIIME2. In Microbiome Analysis: Methods and Protocols; Springer: Berlin/Heidelberg, Germany, 2018; pp. 113–129. [Google Scholar] [CrossRef]
  22. Uetake, K. Newborn Calf Welfare: A Review Focusing on Mortality Rates: Newborn Calf Welfare. Anim. Sci. J. 2013, 84, 101–105. [Google Scholar] [CrossRef]
  23. Youmans, B.P.; Ajami, N.J.; Jiang, Z.-D.; Campbell, F.; Wadsworth, W.D.; Petrosino, J.F.; DuPont, H.L.; Highlander, S.K. Characterization of the Human Gut Microbiome during Travelers’ Diarrhea. Gut Microbes 2015, 6, 110–119. [Google Scholar] [CrossRef]
  24. Deng, L.; Lee, J.W.; Tan, K.S. Infection with Pathogenic Blastocystis ST7 Is Associated with Decreased Bacterial Diversity and Altered Gut Microbiome Profiles in Diarrheal Patients. Parasites Vectors 2022, 15, 312. [Google Scholar] [CrossRef] [PubMed]
  25. Yuan, Y.; Wu, H.; Pan, H. Comparative Analysis of the Fecal Microbiome and Metabolomics of Healthy versus Captive South China Tigers with Mild Diarrhea. Can. J. Microbiol. 2022, 68, 758–768. [Google Scholar] [CrossRef] [PubMed]
  26. Schippa, S.; Conte, M. Dysbiotic Events in Gut Microbiota: Impact on Human Health. Nutrients 2014, 6, 5786–5805. [Google Scholar] [CrossRef] [PubMed]
  27. Huang, M.-Z.; Wang, S.-Y.; Wang, H.; Cui, D.-A.; Yang, Y.-J.; Liu, X.-W.; Kong, X.-J.; Li, J.-Y. Differences in the Intestinal Microbiota between Uninfected Piglets and Piglets Infected with Porcine Epidemic Diarrhea Virus. PLoS ONE 2018, 13, e0192992. [Google Scholar] [CrossRef] [PubMed]
  28. Suchodolski, J.S.; Foster, M.L.; Sohail, M.U.; Leutenegger, C.; Queen, E.V.; Steiner, J.M.; Marks, S.L. The Fecal Microbiome in Cats with Diarrhea. PLoS ONE 2015, 10, e0127378. [Google Scholar] [CrossRef]
  29. Costa, M.C.; Arroyo, L.G.; Allen-Vercoe, E.; Stämpfli, H.R.; Kim, P.T.; Sturgeon, A.; Weese, J.S. Comparison of the Fecal Microbiota of Healthy Horses and Horses with Colitis by High Throughput Sequencing of the V3-V5 Region of the 16S RRNA Gene. PLoS ONE 2012, 7, e41484. [Google Scholar] [CrossRef] [PubMed]
  30. Ling, Z.; Liu, X.; Jia, X.; Cheng, Y.; Luo, Y.; Yuan, L.; Wang, Y.; Zhao, C.; Guo, S.; Li, L.; et al. Impacts of Infection with Different Toxigenic Clostridium Difficile Strains on Faecal Microbiota in Children. Sci. Rep. 2014, 4, 7485. [Google Scholar] [CrossRef] [PubMed]
  31. Stojanov, S.; Berlec, A.; Štrukelj, B. The Influence of Probiotics on the Firmicutes/Bacteroidetes Ratio in the Treatment of Obesity and Inflammatory Bowel Disease. Microorganisms 2020, 8, 1715. [Google Scholar] [CrossRef] [PubMed]
  32. Duvallet, C.; Gibbons, S.; Gurry, T.; Irizarry, R.; Alm, E. Meta Analysis of Microbiome Studies Identifies Shared and Disease-Specific Patterns. bioRxiv 2017, 134031. [Google Scholar] [CrossRef]
  33. Bäumler, A.J.; Sperandio, V. Interactions between the Microbiota and Pathogenic Bacteria in the Gut. Nature 2016, 535, 85–93. [Google Scholar] [CrossRef] [PubMed]
  34. Abbracchio, M.P.; Burnstock, G.; Boeynaems, J.-M.; Barnard, E.A.; Boyer, J.L.; Kennedy, C.; Knight, G.E.; Fumagalli, M.; Gachet, C.; Jacobson, K.A.; et al. International Union of Pharmacology LVIII: Update on the P2Y G Protein-Coupled Nucleotide Receptors: From Molecular Mechanisms and Pathophysiology to Therapy. Pharmacol. Rev. 2006, 58, 281–341. [Google Scholar] [CrossRef] [PubMed]
  35. Van Nhieu, G.T.; Clair, C.; Bruzzone, R.; Mesnil, M.; Sansonetti, P.; Combettes, L. Connexin-Dependent Inter-Cellular Communication Increases Invasion and Dissemination of Shigella in Epithelial Cells. Nat. Cell Biol. 2003, 5, 720–726. [Google Scholar] [CrossRef] [PubMed]
  36. Crane, J.K.; Olson, R.A.; Jones, H.M.; Duffey, M.E. Release of ATP during Host Cell Killing by Enteropathogenic E. coli and Its Role as a Secretory Mediator. Am. J. Physiol. Gastrointest. Liver Physiol. 2002, 283, G74–G86. [Google Scholar] [CrossRef] [PubMed]
  37. Dong, H.; Liu, B.; Li, A.; Iqbal, M.; Mehmood, K.; Jamil, T.; Chang, Y.-F.; Zhang, H.; Wu, Q. Microbiome Analysis Reveals the Attenuation Effect of Lactobacillus from Yaks on Diarrhea via Modulation of Gut Microbiota. Front. Cell. Infect. Microbiol. 2021, 10, 610781. [Google Scholar] [CrossRef] [PubMed]
  38. Dempsey, E.; Corr, S.C. Lactobacillus spp. for Gastrointestinal Health: Current and Future Perspectives. Front. Immunol. 2022, 13, 840245. [Google Scholar] [CrossRef] [PubMed]
  39. Nishida, S.; Ishii, M.; Nishiyama, Y.; Abe, S.; Ono, Y.; Sekimizu, K. Lactobacillus paraplantarum 11-1 Isolated from Rice Bran Pickles Activated Innate Immunity and Improved Survival in a Silkworm Bacterial Infection Model. Front. Microbiol. 2017, 8, 436. [Google Scholar] [CrossRef]
  40. Wolin, M.J. Fermentation in the Rumen and Human Large Intestine. Science 1981, 213, 1463–1468. [Google Scholar] [CrossRef]
  41. Kim, E.T.; Lee, S.J.; Kim, T.Y.; Lee, H.G.; Atikur, R.M.; Gu, B.H.; Kim, D.H.; Park, B.Y.; Son, J.K.; Kim, M. Dynamic Changes in Fecal Microbial Communities of Neonatal Dairy Calves by Aging and Diarrhea. Animals 2021, 11, 1113. [Google Scholar] [CrossRef]
  42. Ju, T.; Kong, J.Y.; Stothard, P.; Willing, B.P. Defining the Role of Parasutterella, a Previously Uncharacterized Member of the Core Gut Microbiota. ISME J. 2019, 13, 1520–1534. [Google Scholar] [CrossRef]
  43. Zhang, X.; Deeke, S.A.; Ning, Z.; Starr, A.E.; Butcher, J.; Li, J.; Mayne, J.; Cheng, K.; Liao, B.; Li, L. Metaproteomics Reveals Associations between Microbiome and Intestinal Extracellular Vesicle Proteins in Pediatric Inflammatory Bowel Disease. Nat. Commun. 2018, 9, 2873. [Google Scholar] [CrossRef] [PubMed]
  44. Cornuault, J.K.; Petit, M.-A.; Mariadassou, M.; Benevides, L.; Moncaut, E.; Langella, P.; Sokol, H.; De Paepe, M. Phages Infecting Faecalibacterium prausnitzii Belong to Novel Viral Genera that Help to Decipher Intestinal Viromes. Microbiome 2018, 6, 65. [Google Scholar] [CrossRef] [PubMed]
  45. Eeckhaut, V.; Machiels, K.; Perrier, C.; Romero, C.; Maes, S.; Flahou, B.; Steppe, M.; Haesebrouck, F.; Sas, B.; Ducatelle, R.; et al. Butyricicoccus pullicaecorum in Inflammatory Bowel Disease. Gut 2013, 62, 1745–1752. [Google Scholar] [CrossRef] [PubMed]
  46. Facchin, S.; Vitulo, N.; Calgaro, M.; Buda, A.; Romualdi, C.; Pohl, D.; Perini, B.; Lorenzon, G.; Marinelli, C.; D’Incà, R.; et al. Microbiota Changes Induced by Microencapsulated Sodium Butyrate in Patients with Inflammatory Bowel Disease. Neurogastroenterol. Motil. 2020, 32, 13914. [Google Scholar] [CrossRef]
  47. Wang, W.; Chen, L.; Zhou, R.; Wang, X.; Song, L.; Huang, S.; Wang, G.; Xia, B. Increased Proportions of Bifidobacterium and the Lactobacillus Group and Loss of Butyrate-Producing Bacteria in Inflammatory Bowel Disease. J. Clin. Microbiol. 2014, 52, 398–406. [Google Scholar] [CrossRef]
  48. Guthrie, E.; Creed, F.; Dawson, D.; Tomenson, B. A Controlled Trial of Psychological Treatment for the Irritable Bowel Syndrome. Gastroenterology 1991, 100, 450–457. [Google Scholar] [CrossRef]
  49. Chan, A.O. Differing Coping Mechanisms, Stress Level and Anorectal Physiology in Patients with Functional Constipation. World J. Gastroenterol. 2005, 11, 5362. [Google Scholar] [CrossRef]
  50. Murray, C.D.R.; Flynn, J.; Ratcliffe, L.; Jacyna, M.R.; Kamm, M.A.; Emmanuel, A.V. Effect of Acute Physical and Psychological Stress on Gut Autonomic Innervation in Irritable Bowel Syndrome. Gastroenterology 2004, 127, 1695–1703. [Google Scholar] [CrossRef]
  51. Yang, T.; Richards, E.M.; Pepine, C.J.; Raizada, M.K. The Gut Microbiota and the Brain–Gut–Kidney Axis in Hypertension and Chronic Kidney Disease. Nat. Rev. Nephrol. 2018, 14, 442–456. [Google Scholar] [CrossRef]
Figure 1. Comparative analysis of the fecal bacterial diversities between healthy and diarrheic calves. (AD) represents the Sobs, Shannon, Shannoneven and Coverage indices that can reflect the diversity of fecal bacterial community. Data was presented as the mean ± SD, * p < 0.05.
Fermentation 09 00827 g001
Figure 2. Principal co-ordinates analysis (PCoA) distribution in healthy and diarrheic calves (n = 9 per group).
Fermentation 09 00827 g002
Figure 3. Characterization of core microbial communities and differential abundant phyla, genera, and species abundant. (A) Relative abundance of the main bacterial phyla in feces of healthy and diarrheic calves (n = 9 per group). (B) Relative abundance of the main bacterial genera in feces of healthy and diarrheic calves. (C) Relative abundance of the main bacterial species in feces of healthy and diarrheic calves. (* Represents 0.01 < p < 0.05, ** represents 0.001 < p < 0.01 and *** represents p < 0.001 in the figure. The “difference between proportions” refers to the disparity in microbial abundance values between the fecal microbiota of diarrheic calves and healthy calves. If the value is negative, the data point falls to the left of the dashed line; if it is positive, the point falls to the right of the dashed line. The color of the data point corresponds to the color of samples with higher abundances).
Fermentation 09 00827 g003
Figure 4. Linear discriminant analysis (LDA) effect size (LEfSe) analysis between healthy and diarrheic calves. (A) LEfSe barplot on the bacterial from phylum to genus level. (B) Cladogram demonstrating the taxonomic levels with phyla in the innermost and genera in the outermost ring. Only LDA score > 3.4 are shown. All against all as the multiple comparisons. The prefixes “p” represented as phylum, “c” as class, “o” as order, “f” as family, and “g” as genus.
Fermentation 09 00827 g004
Figure 5. Clustering of the microbiota of fecal samples. (A) Typing analysis on genus level (By clustering fecal samples with similarly dominant microbiota structures into one category, enterotyping presents nine distinct categories (enterotypes), ranging from type 1 to type 9).; (B) Fecal bacterial clustering analysis.
Fermentation 09 00827 g005
Figure 6. The fecal microbiota structure of calves over time. (A) Composition of the predominant bacterial genus identified in fecal samples from incubation period calve (Inc), n = 1; (B) Composition of the predominant bacterial genus identified in fecal samples from prodromal stage (Pre), n = 1; (C) Composition of the predominant bacterial genus identified in fecal samples from recovery period calve (Rec), n = 1; (D) Composition of the predominant bacterial genus identified in fecal samples from dead calve (Dea), n = 1.
Fermentation 09 00827 g006
Figure 7. Comparison of functions and metabolisms between healthy and diarrheic calves. (A) Function heatmap figure between healthy calves and diarrheic calves at the second level. (B) The rank-sum test of PICRUST analysis of KEGG metabolic pathways at the second level. Graphs show the abundance ratios of different functions between diarrheic and healthy calves, * represents 0.01 < p < 0.05. The term “difference between proportions” refers to the variance in predicted functional abundance values of the fecal microbiota between diarrheic calves and healthy calves. If the value is negative, the data point will be located to the left of the dashed line, while positive values will place the data point to the right of the dashed line. The color of the data point corresponds to the color associated with samples of higher functional abundance.
Fermentation 09 00827 g007
Table 1. Farm characteristics and management practices.
The Health Protocol and Management for Calves
BreedSimmental cattle and Angus cattle
Calves per year100
Type of housingGroup pen
Type of beddingThe mushroom residue
Whether calves were born from discotic parturitionNo
Dam vaccinationNo
Umbilicus careProperly sanitize the umbilical stump and ensure that it is kept clean and dry to prevent infection
Colostrum qualityEligible colostrum
Colostrum feeding4 L first 4 h
Diet and nutrition (8–12 weeks)milk and/or formula milk
Feeding methodGroup bucket
Disclaimer/Publisher’s Note: The statements, opinions and data contained in all publications are solely those of the individual author(s) and contributor(s) and not of MDPI and/or the editor(s). MDPI and/or the editor(s) disclaim responsibility for any injury to people or property resulting from any ideas, methods, instructions or products referred to in the content.

