Article

Kinetic Analysis of Gluconacetobacter diazotrophicus Cultivated on a Bench Scale: Modeling the Effect of pH and Design of a Sucrose-Based Medium

by
Gloria M. Restrepo
1,
Alejandro Rincón
1,2 and
Óscar J. Sánchez
3,*
1
Research Group on Microbiology and Agro-Industrial Biotechnology (GIMIBAG), Research Institute in Microbiology and Agro-Industrial Biotechnology, Universidad Católica de Manizales, Carrera 23 No. 60-63, Manizales 170002, Colombia
2
Research Group on Technological and Environmental Developments (GIDTA), Faculty of Engineering and Architecture, Universidad Católica de Manizales, Carrera 23 No. 60-63, Manizales 170002, Colombia
3
Center for Technological Development—Bioprocess and Agro-Industry Plant, Department of Engineering, Universidad de Caldas, Calle 65 No. 26-10, Manizales 170004, Colombia
*
Author to whom correspondence should be addressed.
Fermentation 2023, 9(8), 705; https://doi.org/10.3390/fermentation9080705
Submission received: 8 June 2023 / Revised: 20 July 2023 / Accepted: 21 July 2023 / Published: 26 July 2023
(This article belongs to the Special Issue Modeling Methods for Fermentation Processes)

Abstract

:
Gluconacetobacter diazotrophicus is an endophytic bacterium that has shown important plant growth-promoting properties. During the growth of G. diazotrophicus with high carbon source concentrations, organic acids are produced, and pH decreases, thus inhibiting biomass growth. The objective of this work was to design a sucrose-based medium and perform a kinetic analysis of the batch submerged cultivation of this bacterium in a 3 L stirred-tank bioreactor without pH control. A mathematical model was proposed for representing G. diazotrophicus concentration, considering the inhibitory effect of hydrogen ion concentration. It comprises a biomass growth model, a specific growth rate expression that accounts for the inhibitory effect of hydrogen concentration, and a hydrogen model that represents the relationship between hydrogen and biomass concentrations. The sucrose-based medium proved its suitability for G. diazotrophicus growth. A higher biomass concentration (1.10 g/L) was obtained in a modified LGI-P medium containing 30 g/L sucrose with a three-fold increase in biomass production relative to the initial inoculation. The model allowed a satisfactory description of the experimental data obtained, and it could be used to design a cultivation strategy to maximize biomass production leading to the production of an alternative microbial inoculant for plant growth promotion of economically important crops.

1. Introduction

The need to replace conventional agriculture with more environmentally friendly, sustainable agriculture has led to the intensive conduction of research and development to produce new agricultural inputs from microorganisms. Plant growth-promoting rhizobacteria (PGPR) have demonstrated their ability to stimulate crop growth through the synthesis of different metabolites, the fixation of atmospheric nitrogen, and the solubilization of nutrients in the soil [1]. Research on these bacteria is of great interest in terms of improving the productivity of crops [2], so the use of PGPR is a practice that has boomed in recent years [3].
Among PGPR, Gluconacetobacter diazotrophicus has gained much relevance in the last few decades due to its potential for the development of agricultural inputs such as biofertilizers [4]. It is an endophytic, diazotrophic (capable of fixing atmospheric nitrogen), Gram-negative bacterium that lives in sucrose-rich crops and promotes plant growth by producing phytohormones and inhibiting phytopathogens, among other features [4,5,6]. This bacterium has been used as an inoculant for different crops, increasing crop yields and reducing the use of nitrogen fertilizers [5,6]. In previous work [7], in vitro assessment of G. diazotrophicus demonstrated interesting potential in the solubilization of different phosphate sources, as well as nitrogen-fixing properties measured through the determination of nitrogenase activity and production of indole compounds. These properties have caused this bacterium to be applied to different economically important crops with positive results in terms of growth promotion, such as sugarcane [8], corn, rice, and tomato [9,10].
G. diazotrophicus is cultivated on a laboratory scale in semi-solid, solid, and liquid media. The semi-solid LGI-P medium is used for the evaluation of atmospheric nitrogen fixation and to determine the diazotrophic character since it is free of nitrogen; LGI-P agar is used for the isolation of bacterial colonies, and LGI-P broth is used for biomass production [11,12]. These culture media contain sucrose as a carbon source and ammonium sulfate as a nitrogen source for biomass production. The production of a microbial preparation based on G. diazotrophicus requires performing batch cultivations using liquid media containing low-cost carbon sources, such as sucrose, to reduce the costs not only on the laboratory scale (<1 L) but also on the bench (1–10 L) and pilot (10–1000 L) scales. Regarding this, LGI-P broth contains sucrose (or brown sugar) but with a high content (100 g/L), so there exists interest in exploring lower sucrose levels for producing G. diazotrophicus biomass in this medium. In a previous work [10], a bacterial suspension of G. diazotrophicus was grown in LGI-P broth, reaching high bacterial concentrations (up to 1 × 10⁸ CFU/mL). After preparing dilutions with different bacterial concentrations, they were applied to tomato seedlings, obtaining statistically significant differences in terms of dry weight related to the control treatment without the addition of this bacterium. In that case, the application of G. diazotrophicus exhibited its growth-promoting properties at the early stages of tomato development.
Molinari and Boiardi [13] evaluated the growth of G. diazotrophicus in media with different concentrations of sucrose and nitrogen sources. The maximum biomass of this bacterium was obtained in culture media with a high sucrose concentration (100 g/L) and inorganic nitrogen. Gluconic acid production was 9 g/L in culture media with excess sucrose under biological nitrogen fixation (BNF) conditions. Ríos Rocafull et al. [14] evaluated under in vitro and in vivo conditions the effect of five liquid culture media (LGI, SG, SYP, modified DYGS, and MA medium) on the growth promotion activity of G. diazotrophicus in carrot and beet. Biomass production at 48 h of fermentation was 1012 CFU/mL in flasks with 250 mL working volume for all the media assessed. After the cultivation process, the bacteria had stable growth in nitrogen-free media, but differences were observed in the phosphate solubilization halos in the NBRIP medium, indicating the affectation of the phosphate solubilization ability. Finally, the results demonstrated the influence of the culture medium for the inoculum production on the growth promotion features of G. diazotrophicus when applied to carrot and beet.
There exists a very reduced number of papers dealing with the kinetic behavior of the submerged culture of G. diazotrophicus in the available literature. This could be related to the fact that different organizations are currently developing or patenting microbial inoculants based on this bacterium for crops such as sugarcane in countries like Brazil, India, and the United States. In this regard, very few patents related to G. diazotrophicus have been granted in several countries. These patents disclose the bacterium itself as an inoculant [15], mention G. diazotrophicus among many other bacteria for fertilizing cereal grasses [16], and present a composition based on G. diazotrophicus for enhancing the growth of sugar beet [17]. However, data on the time profile of G. diazotrophicus biomass formation and substrate consumption during batch submerged cultivations on a laboratory scale are scarce or protected under commercial secrecy. On a bench or pilot scale, the information disclosed is practically inexistent and is limited to the generic description of the fermentation process, such as the one disclosed in one Brazilian patent application [18]. For this reason, the assessment of the kinetic relationships of G. diazotrophicus growth is gaining importance, especially for cultures conducted in stirred-tank bioreactors on bench and pilot scales. In this sense, the mathematical modeling of growth kinetics can offer essential knowledge on appropriate conditions for the production of viable cell biomass of this bacterium over fermentation time. In a previous work [19], different mathematical models were applied to represent G. diazotrophicus growth in a batch submerged culture conducted in a 3 L bioreactor using sugarcane molasses and sucrose as energy sources. The Herbert–Pirt–Contois model was the one presenting the best fitting of the cell biomass and total sugars profiles. This model considers that the volumetric growth rate is reduced by endogenous metabolism, and the specific growth rate is inhibited by biomass concentration.
G. diazotrophicus produces gluconic acid by direct oxidation of glucose. In the case of glucose as a carbon source and no pH control, acidic pH values in the range of 2.0–4.0 appear due to gluconic acid production. When glucose is exhausted, G. diazotrophicus utilizes the gluconic acid produced as the carbon and energy source [4,20,21]. The pH of the culture medium influences biomass yield and oxygen consumption, as well as enzyme activity and synthesis. The natural habitat of G. diazotrophicus features a pH of 5.5 and 10% sucrose. The optimum pH range related to biomass yield coefficient is 5.0–6.5 under biological nitrogen fixation conditions and glucose as the carbon source. For pH below this range, biomass yield values significantly decrease due to the extra consumption of carbon and oxygen for maintenance requirements [22]. When sucrose is used as the carbon source, gluconic acid is produced with either low or high initial sucrose concentration, under conditions of BNF or without it. However, high initial sucrose concentration leads to higher acid production and lower biomass yield coefficient due to the pH decrease, which is strongly related to acid production. Furthermore, the biomass yield coefficient was lower when the bacterium was cultivated without pH control compared to the case of a constant pH of 6.0. In addition, keto gluconic acid is produced by G. diazotrophicus in a medium with a high initial sucrose concentration (100 g/L) under BNF conditions [23].
Modeling the relationship between hydrogen ions and acid produced is important for developing and testing pH control strategies in bioprocesses as well as for optimization purposes [24,25], especially for microorganisms producing organic acids during their cultivation by submerged fermentation. In this regard, Nicolai et al. [26] formulated a rigorous-like pH model for the surface growth of lactic acid bacteria on vacuum-packed meat. The arranged model relates the concentrations of hydrogen ions, lactic acid, and buffer. It is assumed that a single buffer compound is present in the medium, and it consists of a weak acid and its salt. The buffer ion is expressed in terms of total buffer concentration, and the total buffer concentration is assumed to be constant. The resulting polynomial is of the third order. In the model for biomass growth and lactic acid production, the specific growth rate and the specific product formation rate depend on the concentrations of hydrogen ions and undissociated lactic acid. The limitation is the mathematical complexity of determining the hydrogen ion concentration.
Spann et al. [27] analyzed the growth of Streptococcus thermophilus by using a mechanistic model and fitting it to experimental data. The developed model combines a kinetic model for biomass, substrate, and product concentrations based on mass balances, as well as an acid/base model to predict pH. The acid/base model is based on the dissociation of water, acid, and base compounds and electroneutrality. Biomass, lactose, lactic acid, and galactose concentrations were measured, and online parameter estimation was performed using the measurements of added base and pH to update the parameters of the acid/base model.
In summary, the above studies show applications of ion dissociation equations for pH modeling, but some simplification possibilities can also be deduced. These possibilities would facilitate its implementation and adjustment in ongoing measurements. The dissociation equations may involve many coefficients, thus leading to cumbersome fitting, as can be deduced from Spann et al. [27], so simpler pH models are needed. In addition, the assumptions of constant total buffer concentration and a single acid compound simplify the pH model, whereas an accurate pH representation is achieved, as can be noticed by Nicolai et al. [26].
The dependence of pH on either flowrate, volume, or concentration of acids or bases is highly nonlinear and exhibits steep slopes in some regions. The presence of buffer substances softens these slopes [28,29,30]. The curve of pH as a function of acid or base concentration is usually known as the titration curve and is highly nonlinear. This curve exhibits a significant variation in the slope over small acid or base concentration range and strongly depends on the concentration of buffering agents so that a change in the buffer concentration modifies the shape of the curve [31,32]. An overview of some modeling approaches for the dependence of hydrogen ions on acids, bases, and buffers applicable to culture media is presented in Appendix A.
The production of a microbial preparation based on G. diazotrophicus requires the kinetic analysis of the submerged cultivation of this bacterium on different scales using culture media that contain carbon sources other than glucose in order to reduce operating costs. Mathematical modeling is a powerful tool to acquire insight into the behavior of the cultivation process. As G. diazotrophicus synthesizes organic acids during its growth and the release of these acids plays a crucial role during the solubilization of phosphates contained or added to the soil (an important plant growth-promoting property) [10], the modeling of bacterial growth kinetics considering the balance of hydrogen ions (pH) is paramount to assessing the behavior of this culture for subsequent scale-up studies. To the authors’ knowledge, there are no modeling studies for G. diazotrophicus that include the effect of pH on biomass growth and the relationship between pH and acid products. In the above-cited previous work [19], the batch culture of G. diazotrophicus in a liquid medium was modeled, but the effect of pH on the specific growth rate and the relationship between pH and acid and biomass concentrations were not considered. Therefore, the objective of this work was to evaluate the effect of the different concentrations of the main components of the LGI-P medium on the production of G. diazotrophicus ATCC 49037 during its batch submerged fermentation on a bench scale. In addition, this work was aimed at modeling the kinetic behavior of this bacterium during such batch cultivation by proposing a rigorous mathematical description that includes the effect of pH changes on microbial growth rate.

2. Materials and Methods

2.1. Microorganism

The Gluconacetobacter diazotrophicus strain ATCC 49037 acquired in the strain bank of the American Type Culture Collection (ATCC) was reactivated in nutrient broth and maintained in potato dextrose agar (PDA; Oxoid, Basingstoke, UK). The preservation of the strain was carried out using 10% glycerol as a cryoprotectant at a concentration of 108 cells/mL; the resulting suspension was transferred to microtubes that were brought to −80 °C to have reserve material for the different assays.

2.2. Inoculum Preparation

The preparation of the inoculum was carried out in two stages: activation and inoculum production. In the activation stage, a microtube containing 1 mL was taken from the stock culture frozen at −80 °C and transferred to 25 mL of LGI-P medium contained in a 125 mL Erlenmeyer flask; the flask was incubated for 24 h at 30 °C and 150 rpm in an orbital shaker. In the inoculum production stage, 2.5 mL of the resulting culture broth was used to inoculate 50 mL of fresh LGI-P medium in a 250 mL Erlenmeyer flask, which was incubated for 24 h, according to Boniolo et al. [33]. This culture was used to inoculate the growth medium.

2.3. Cultivation Conditions for Culture Medium Design

Submerged cultivation of G. diazotrophicus on a laboratory scale was carried out in 250 mL flasks containing 50 mL of medium, which was seeded with 5% (by volume) of the inoculum. The cultures were incubated for 160 h at 30 °C [11] and 150 rpm [34,35]. The different culture media for the identification of the most relevant components of the medium and the one-factor design were adjusted to an initial pH of 5.5 [11].

2.4. Screening of Medium Components

For the identification of the key components of the culture medium (i.e., the components whose variability exerts the greatest influence on the response variable) in terms of the production of G. diazotrophicus biomass, the experimental design of Plackett–Burman was conducted. This design is a useful tool for quickly identifying the key factors in a multivariable system [36]. In this work, this design was used to screen for key factors before media optimization [37]. The medium design was based on the composition of the LGI-P culture medium, as shown in Table 1 [11]. From the composition of this medium, the low and high concentration levels of each component were defined (see Table 2). The concentration range for each nutrient was established based on the literature and experience gained.
The concentration of biomass expressed in g/L of dry weight was evaluated as the response variable. The purity of the cultures obtained was evaluated using an exhaustion seeding method on LGI-P agar and PDA at 72 and 160 h of incubation. Table 3 presents the corresponding experimental design matrix. Eight factors, including carbon and nitrogen sources and essential elements for growth, were selected. Three “dummy” or auxiliary variables were included in the design to calculate the standard error. Three replicates of each treatment were performed according to the conditions described in Section 2.3. The magnitude and direction of the effects of the factors were examined to determine the components of the medium whose variability exerts the greatest effect on the production of cellular biomass of G. diazotrophicus. This was performed by the analysis of variance using the statistical package Statgraphics® (Statpoint Technologies, USA).

2.5. One-Factor Design

The biomass production of G. diazotrophicus was evaluated in LGI-P medium with different sucrose concentrations (in g/L), as follows: 15, 30, 45, 60, 75, 90, 105, 120, 135, and 150. For each culture medium (treatment), 10 repetitions were performed, inoculating them with the strain G. diazotrophicus ATCC 49037 as described above. The response variable was the concentration of cell biomass determined by the dry weight method. The inoculation was conducted as described in Section 2.3.

2.6. Submerged Cultivation on a Bench Scale

In order to define the length of the batch submerged culture of G. diazotrophicus on a bench scale, as well as to determine the final evaluation time of the cultures in the experimental designs, preliminary cultivation was carried out in a 500 mL Erlenmeyer flask containing 300 mL of LGI-P medium (Table 1) and 30 mL of inoculum in the exponential growth phase (with an optical density between 0.9 and 1.0 corresponding to approximately 108 cells/mL). The inoculation concentration was increased up to 10% (by volume) to speed up bacterial growth and development. The working suspension was stirred at 150 rpm at 30 °C on an orbital shaker. During the evolution of bacterial growth, 10 mL samples were taken every 24 h for 15 days (366 h), in which the concentration of cell biomass was determined by optical density and dry weight.
The batch submerged cultivation on a bench scale was performed using the culture medium defined in the one-factor design at 30 °C and 150 rpm, with an aeration rate of 0.57 vvm (volumes of air per volume of broth in one minute) regulated with an Elite air pump (Hagen, Mansfield, MA, USA). The time profile of cell biomass and substrate concentration was experimentally determined using a 3 L stirred-tank bioreactor (Equipos para Laboratorios, Colombia), with an initial working volume of 2000 mL seeded with 10% (by volume) of the inoculum. Culture follow-up was performed by taking periodic samples at 8 h intervals during the first 24 h and subsequently at 18 h intervals until completing 366 h. Samples were taken aseptically in triplicate.

2.7. Analytical Methods

The cell biomass concentration of G. diazotrophicus during the experiments to identify the most relevant components of the culture medium, the one-factor design, and the follow-up of the submerged cultivation on laboratory and bench scales was determined by the method of dry weight [38]. For this, the samples were centrifuged at 3500 rpm for 30 min; then, the centrifugate was resuspended with distilled water and filtered through 0.45 µm Millipore® membranes using a vacuum pump. The biomass obtained was dried in an oven at 105 °C until constant weight.
During the submerged cultivation on a bench scale, two methods were applied to evaluate bacterial growth: measurement of the dry weight and optical density. The calculation of biomass concentration (in g/L) was based on the correlation of the dry weight and optical density data obtained from the preliminary cultivation performed in a 500 mL flask through linear regression. Optical density measurement was performed to quickly determine the cell biomass concentration. In this case, the optical density of the samples from culture broth was determined at a wavelength of 600 nm in a Spectronic Biomate 5 spectrophotometer (ThermoFisher Scientific, Waltham, MA, USA).
Total sugars in the samples from the culture broth was determined by the sulfuric phenol method [39] to quantify the concentration of the carbon source. Ammonium ion concentrations were also determined to follow up on the nitrogen source (ammonium sulfate) present in the broth [40,41]. The pH was measured in the samples as well.

3. Model Development

In this work, a model is proposed for representing the time course of biomass concentration of G. diazotrophicus in batch operation. It comprises a biomass balance in which the specific growth rate is a function of hydrogen ion concentration [H+], and a relationship between [H+] and biomass concentration is provided by the hydrogen model. The hydrogen model is constructed by combining the mass balance for acid concentration, the electroneutrality equation, and the ion dissociations, and applying a simplification. In addition, the proposed model is compared with a basic model in which μ is a function of biomass concentration, but the effect of hydrogen ions is disregarded. The two models are fitted to the measurements of biomass concentration and pH over time from batch submerged culture of G. diazotrophicus performed in a 3 L bioreactor. The proposed model has several advantages. Firstly, it applies to the case of several unknown acid and buffer species. Secondly, the number of parameters to be estimated and the order of the polynomial is smaller than that in the rigorous classic model. Finally, the effect of adding acids and bases can be incorporated, which is an advantage over common simplified models. The procedure for model calibration and calculation of the time courses of pH and concentrations of biomass and substrate is proposed as well.

3.1. Model Formulation

In this section, the proposed model (second model approach) is formulated, and the other two models (the preliminary model and the first approach) are considered as well. The preliminary model makes it possible to assess the convenience of accounting for the effect of substrate concentration on the specific growth rate and the convenience of fitting the substrate model. The first approach accounts for the effect of biomass concentration, but it disregards the effect of substrate and hydrogen ion concentrations.
For model formulation, the batch submerged culture of G. diazotrophicus conducted in a bench-scale bioreactor (see Section 2.6) was considered. The characteristics of such culture relevant for modeling purposes (coded as Ci) are as follows:
C1: The tank is perfectly mixed and isothermal, and the liquid volume is constant;
C2: There are neither inlet nor outlet flows; acids, bases, or buffer substances are not added, and pH is not controlled;
C3: The measurements of pH and concentrations of biomass and sucrose over time are available;
C4: The culture medium is LGI-P, which includes KH2PO4 and K2HPO4.

3.2. Preliminary Modeling and Fitting

The preliminary model comprises the mass balances for biomass and substrate concentrations, whereas the expression for specific growth rate comprises the effect of substrate and biomass concentrations, but the effect of [H+] is disregarded. Considering characteristics C1 to C4, the mass balances for biomass and substrate concentrations are as follows:
d X d t = μ X
d S d t = 1 Y x s μ X m s X ,
where X is the biomass concentration (g/L), S is the substrate concentration (g/L), µ is the specific growth rate (h−1), Yxs is the biomass yield coefficient (g biomass/g substrate), and ms is the maintenance coefficient (g substrate/(g biomass × h)).
In microbial cultures, the decrease in the growth rate in the transition from the exponential to the stationary growth phase is considered to be caused by the presence of excreted metabolites. If this product has not been identified, an inhibition term depending on biomass can be incorporated [30,42,43]. For instance, the inhibition term 1/(1 + KxX) was used by Belfares et al. [43]. Accounting for this, the following expression for the specific growth rate was considered:
μ = μ m a x S ( K + S ) 1 ( 1 + K x X ) ,
where µmax is the maximum specific growth rate (h−1), K is the substrate half-saturation constant (g/L), and KX is a proportional coefficient related to biomass (L/g).
Equations (1)–(3) are fitted by minimization of the sum of squared errors:
S S E = i = 1 n t ( X e x p X m o d ) 2 X m a x 2 + i = 1 n t ( S e x p S m o d ) 2 S m a x 2 ,
where nt is the number of data points; Xexp and Sexp are the measurements of biomass and substrate concentrations, respectively; Xmod and Smod are the values of biomass and substrate concentrations estimated by the model, respectively; and Xmax and Smax are the maximum values of the experimental data of biomass and substrate, respectively [44]. It was found that the term S / ( K + S ) is not suitable as the estimate of K exhibited overlarge confidence interval. Then, that term was neglected, but a determination coefficient of 0.0887⫷ 1.0 was obtained for substrate concentration (see Figure A1). Therefore, the effect of carbon source concentration on the specific growth rate was neglected, and further fitting of the substrate model (2) was not performed. This neglection of the effect of the carbon source concentration was also undertaken in the modeling of Gluconobacter japonicus, as reported by Cañete-Rodríguez et al. [45].

3.3. First Modeling Approach

The first modeling approach comprises the biomass model (1), whereas the specific growth rate expression involves the inhibition effect of high biomass concentration, but it disregards the effect of substrate concentration and [H+] [46]:
μ = μ m a x ( 1 X X m a x ) f ,
where Xmax is the maximum biomass concentration achieved during the cultivation (g/L), and f is a constant that defines the degree of inhibition of biomass.

3.4. Second Modeling Approach

The second approach model comprises the mass balance for biomass production (Equation (1)), the expression for specific growth rate that involves the effect of [H+] but disregards the effect of substrate and biomass concentrations, and the hydrogen model that describes the relationship between H+ concentration and biomass concentration. The hydrogen model is obtained by combining the mass balance for acid concentration, the electroneutrality equation, and the equation for the ion dissociation of water, acid, and buffer species.
For the specific growth rate expression, we consider that there is no substrate limitation effect on the specific growth rate due to a high sucrose content in the growth medium and that the transition from the exponential growth phase to the slow growth phase is a consequence of high concentrations of hydrogen ions in the culture medium. Thus, we disregard the effect of substrate, but we account for the effect of [H+] by using an inhibition function [47,48] as follows:
μ = μ m a x ( 1 [ H + ] H m a x ) d ,
where Hmax is the proton concentration at which growth ceases; µmax, Hmax, and d are parameters to be fitted.
In order to formulate the equations for electroneutrality and ion dissociation, the following assumptions (As) were taken:
As1: The effect of the acid compounds on the hydrogen ion concentration can be described as that of a single acid;
As2: The effect of buffering substances can be described as that of a single one, and its concentration is constant and unknown;
As3: The ions are completely soluble.
For the acid mass balance, Luedeking–Piret kinetics for product formation [49,50,51,52] and batch mode were considered:
d A t o t d t = α μ X + β X ,
where Atot is the total concentration of acid species, α is the constant of product formation associated with microbial growth, and β is the constant of product formation associated with microbial mass.
Combining with the biomass formation model (Equation (1)), integrating and arranging yield:
K A A t o t = α ¯ X + k o + β ¯ z
z = t o t X d t ,
where KA, α ¯ ,     β ¯ , and k0 are constants. The acid ( H A ) is considered weak, so the corresponding dissociation reaction is:
H A A + H + ,
where A is the dissociated acid, and H+ is the hydrogen ion. For the buffer ( H 2 B u ), the following dissociation reactions were assumed:
H 2 B u H B u + H + H B u B u = + H + ,
where H B u and B u = are buffer anions. The electroneutrality is described by the following equation:
[ H + ] = [ O H ] + [ A ] + [ H B u ] + [ B u = ]   ,
where O H is the hydroxide ion, and [ H + ] , [ O H ] , [ A ] , [ H B u ] , and [ B u = ] are ion concentrations (mol/L). In the charge balance, also called electroneutrality or proton condition equation, the sum of cations (in mol/L) equals the sum of anions (in mol/L) [26,32].
Stating the dissociation equations for H 2 B u and H B u and arranging yields:
[ H B u ] + [ B u = ] = ( K b 1 [ H + ] + K b 1 K b 2 ) [ H + ] 2 + K b 1 [ H + ] + K b 1 K b 2 B u | t o t   ,
where B u | t o t is the total concentration of buffer, and Kb1 and Kb2 are dissociation constants of H 2 B u and H B u . Stating the dissociation equations for acid and H2O and combining Equations (9) and (10) yields:
[ H + ] = K w 1 [ H + ] + K a 1 K a + [ H + ] A t o t + ( K b 1 [ H + ] + K b 1 K b 2 ) [ H + ] 2 + K b 1 [ H + ] + K b 1 K b 2 B u | t o t   ,
where K w is the water dissociation constant, K a is the acid dissociation constant, and B u | t o t is constant according to assumption As2. The following simplification is considered:
K w 1 [ H + ] + K a 1 K a + [ H + ] A t o t + ( K b 1 [ H + ] + K b 1 K b 2 ) [ H + ] 2 + K b 1 [ H + ] + K b 1 K b 2 B u | t o t   K 2 [ H + ] + K 4 K 1 A t o t + K 2 [ H + ] + K 4 K 3
Substituting into Equation (11) yields:
[ H + ] = K 2 [ H + ] + K 4 ( K 1 A t o t + K 3 )   ,
where K1, K2, K3, and K4 are constants that depend on the culture medium characteristics and can be estimated by model fitting using measurements of acid ( A t o t ) and pH and the pH definition p H = log 10 [ H + ] . Equation (12) relates the hydrogen ion concentration [H+] with the total acid concentration.
In what follows, the hydrogen model is generated by combining Equations (8) and (12). Arranging Equation (12) yields:
[ H + ] 2 + K 4 [ H + ] ( K 2 K 3 + K 2 K 1 A t o t ) = 0
That is a polynomial of order two with respect to [H+]. In the case that buffer, acid, or base species are considered in addition to HA and H2Bu, the corresponding ion concentrations must be included in the electroneutrality equation. Since data from acid measurements are not available, Equation (8) must be used, which expresses total acid concentration (Atot) in terms of biomass concentration (X). Combining Equations (8) and (13) yields the following expression that relates the hydrogen ion concentration [H+] to the biomass concentration (X):
X = θ 1 z + θ 2 + θ 3 [ H + ] + θ 4 [ H + ] 2
z = t o t X d t .
The parameters θ1, θ2, θ3, and θ4 can be obtained by fitting. The following simplification is considered:
| θ 1 z | | θ 2 + θ 3 [ H + ] + θ 4 [ H + ] 2 |
What is equivalent to:
θ 1 z + θ 2 + θ 3 [ H + ] + θ 4 [ H + ] 2 θ 2 + θ 3 [ H + ] + θ 4 [ H + ] 2
Substituting into Equation (14) yields:
X = θ 2 + θ 3 [ H + ] + θ 4 [ H + ] 2
An alternative simplification is:
| X | θ 1 z + θ 2 + θ 3 [ H + ] + θ 4 [ H + ] 2 ,
Or equivalently,
θ 1 z + θ 2 + θ 3 [ H + ] + θ 4 [ H + ] 2 0 .
Substituting into Equation (14) and arranging yields:
z = θ 2 θ 1 + θ 3 θ 1 [ H + ] + θ 3 θ 1 [ H + ] + θ 4 θ 1 [ H + ] 2
In order to have a simpler nomenclature, the coefficients θ 1 , θ 2 , θ 3 , and θ 4 in Equations (15) and (16) are renamed as follows:
θ 3 [ H + ] 2 + θ 2 [ H + ] + θ 1 = X
θ 3 [ H + ] 2 + θ 2 [ H + ] + θ 1 = z .
where the coefficients θ 1 , θ 2 , and θ 3 can be estimated by model fitting using measurements of X , z , and pH over time. In summary, the second modeling approach is based on the mass balances for acid and biomass concentrations, the electroneutrality equation, and the ion dissociation equations. The hydrogen model (14) describes the concentration of H+ ion as a function of biomass concentration; it is obtained by combining Equations (8) and (12), using a simplification for the relationship between the concentrations of hydrogen ions and acid, what greatly reduces the complexity for computing [H+]. The hydrogen model for the case when an acid and a base are added is developed in Appendix B.

3.5. Statement of the Fitting Procedure

The parameters of the modeling approaches proposed are estimated using the measurements of biomass concentration and pH over time resulting from the experiments described in Section 2.6. For fitting the biomass model (1) and the specific growth rate expression (5) or (6), its parameters are estimated on biomass measurements using the ordinary least squares method, which is based on the minimization of the sum of squared errors, which is defined as:
S S E = i = 1 n t ( X e x p X m o d ) 2 X m a x 2 ,
where nt is the number of data points, Xexp is the measurement of biomass concentration, Xmod is the value of biomass estimated by the model, and Xmax is the maximum value of the experimental data of biomass [53]. The fitting quality is assessed through the determination coefficient (R2), and the precision of the estimates is evaluated through the width of the 95% asymptotic confidence intervals [54,55,56]. Matlab version 2014 (The MathWorks Inc., Natick, MA, USA) was used for these purposes. In particular, the fmin routine was used for minimization.
The second approach also involves the fitting of hydrogen models (17a) and (17b), which relate [H+] and biomass. This is performed via the least squares method:
θ = ( φ T φ ) 1 φ T Y   ,   Y ^ = φ θ   ,
where θ is the parameter vector and φ is the regression vector, which is defined by arranging the model as Y = φθ [57].
The whole fitting procedure for the second approach, considering biomass model (1), µ model (5), and hydrogen models (17a) and (17b), comprises the following steps:
  • The parameters of biomass and µ models are estimated on biomass measurements by minimization of SSE (18); in the µ model (6), the [H+] values are obtained by interpolation of the experimental [H+] data, and the signal z = t o t X d t is computed as well, whereas the pH definition is p H = log 10 [ H + ] [42];
  • The parameters of hydrogen models (17a) and (17b) are estimated on measurements of pH and biomass concentration via least squares, using Equation (19), with the values of z = t o t X d t computed in the previous step;
  • The parameters of the biomass model (1) and specific growth rate model (6) are estimated on biomass measurements by minimization of the SSE (18); in the specific growth rate model (6), the [H+] values are obtained by using the hydrogen models (17a) and (17b) fitted in the previous step, instead of using interpolation.
The determination coefficient and the width of the 95% confidence interval of its parameters are determined at each of the above steps.

4. Results and Discussion

4.1. Cultivation of Gluconacetobacter Diazotrophicus on a Laboratory Scale

The preliminary evaluation of the growth of G. diazotrophicus was carried out in LGI-P medium with sucrose as the only carbon source (Table 1) using an orbital shaker and flasks with 330 mL of culture broth and evaluating the production of cell biomass both by optical density and by dry weight. In the plot of the evolution of cell biomass during the time elapsed after the inoculation of the bacteria (Figure 1), a clear correspondence between the exponential phases of the two growth curves obtained by applying the two methods is evidenced.
Figure 1 shows the growth curve of the bacteria obtained under the experimental conditions evaluated, in which exponential growth was evidenced up to 240 h. From this time, cell biomass began to stabilize, and the culture entered the stationary phase. The lag phase was imperceptible under these conditions. The identification of the growth phases during the bacterial growth allowed for establishing the times in which the pre-inocula and inocula should be prepared for the evaluation of the most relevant components of the culture medium, the one-factor design, and the cultivation in the bioreactor.
In this way, from the kinetic data of the culture on a laboratory scale, the different growth phases of the bacteria were identified using the LGI-P medium. This type of analysis is important for determining the behavior of the microorganisms during the propagation of cell biomass in response to different conditions of the culture medium with an assessment of carbon, nitrogen, and pH sources, among other factors. In the present work, two growth phases (exponential and stationary) were observed in G. diazotrophicus culture using 100 g/L sucrose as the carbon source (Figure 1), in correspondence with the results obtained by Attwood et al. [20] and Flores-Encarnación et al. [58], who observed this same biphasic growth of G. diazotrophicus in the presence of glucose and sucrose, respectively.

4.2. Key Components of the Culture Medium

The evaluation of the effect of the eight components of the LGI-P medium on biomass production was carried out through an experimental matrix of 12 treatments (each one in triplicate) to identify the key components (factors) of the culture medium, i.e., those whose variability exerts the highest influence on this response variable. Based on the biomass growth curve obtained by dry weight (see Figure 1), the evaluation time for the experimental design was defined at 160 h, taking into account that the difference in biomass production related to the maximum growth peak at 240 h was only about 0.15 g/L and that the optical density values were stabilized in a first moment at 160 h. In this way, it was possible to reduce the length of the experimental work when the treatments of the design were applied to identify the key components of the medium.
Based on the results obtained (see Table 3), the variability of the concentrations of the culture medium components did not influence the biomass production of G. diazotrophicus since no significant differences were evidenced during the analysis of variance (p < 0.05), as shown in Table 4. This indicates that all the components of the medium were relevant for the bacterial growth under the experimental conditions evaluated. Therefore, it was decided to conduct a one-factor design in which different concentrations of the carbon source of the LGI-P medium (sucrose) in a greater interval were assessed.
The LGI-P culture medium includes components that favor the growth of G. diazotrophicus [11,12,59]. This medium has sucrose as a carbon source at a concentration of 100 g/L and (NH4)2SO4 as a nitrogen source to promote the activation of bacterial reproduction in the liquid medium; it also has salts that favor its development. According to the results obtained regarding the effect of the eight components of the medium on biomass production, no statistically significant differences (p < 0.05) were detected between the nutrients evaluated. That is, there were no significant differences in biomass production when the different components of the medium were varied within the ranges predefined in the Plackett–Burman experimental design. Considering the linear interaction model implicit in this type of design, this outcome implies that it is not possible to select a group of nutrients whose variability influences the formation of new cells of G. diazotrophicus differently (to a greater degree) than the rest of the components of the medium.

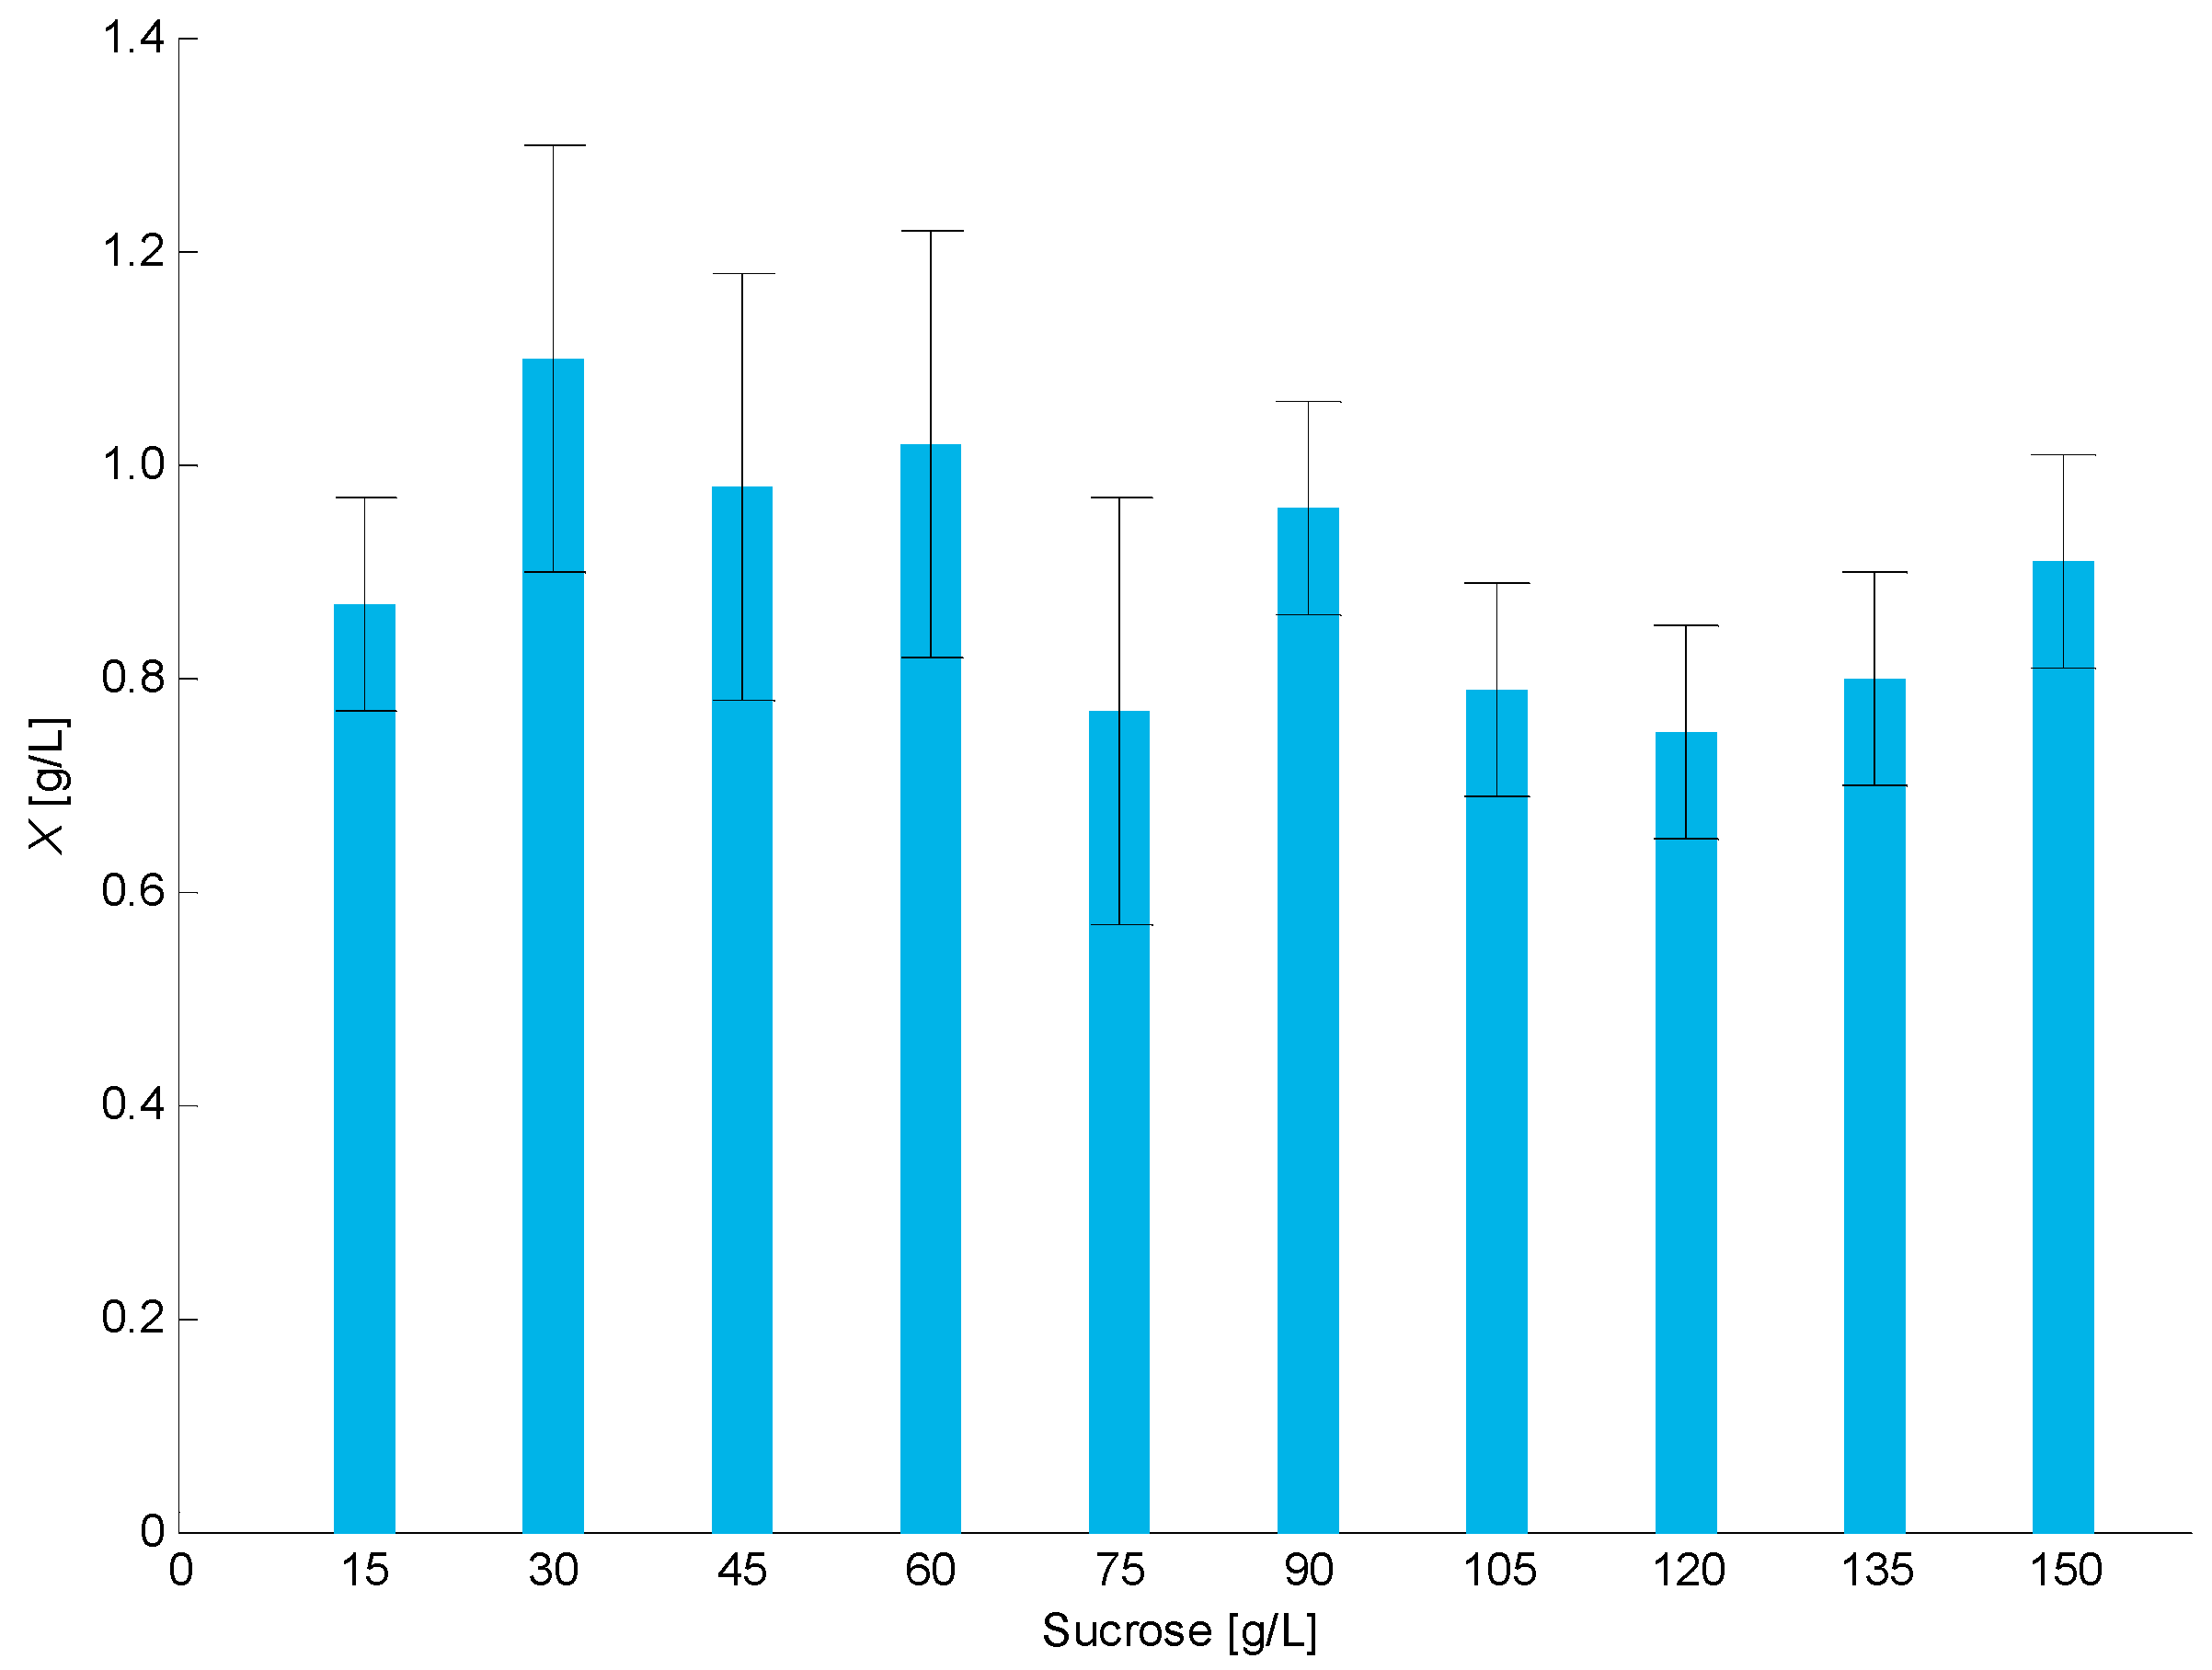
4.3. Definition of Carbon Source Concentration

According to the results obtained from the Plackett–Burman design, a subsequent one-factor design for evaluating different concentrations of the carbon source (sucrose) in the medium and their effect on the biomass production of G. diazotrophicus was proposed and conducted. This one-factor design was aimed at determining a suitable sucrose concentration in the medium from an economic viewpoint since the carbon source exhibits the highest costs of all the medium components in this case. Figure 2 shows the behavior of the production of G. diazotrophicus biomass during the evaluation of different sucrose concentrations in the culture medium. The highest biomass value occurred when the medium contained 30 g/L sucrose.
Table 5 shows the estimated differences between each pair of means, in which the related pairs present statistically significant differences with a confidence level of 95%. Statistically significant differences (p < 0.05) were found for sucrose concentrations (in g/L) of 30, 45, and 60 compared with concentrations of 15, 75, 90, 105, 120, 135, and 150. Selection of the sucrose concentration in the medium to perform the subsequent follow-up of the bacterial culture over time was made among the three best treatments (30, 45, and 60 g/L sucrose), taking into account economic criteria. Thus, a carbon source concentration of 30 g/L sucrose in the medium was chosen for subsequent evaluations.
The results obtained from the one-factor design made it possible to identify the three concentration levels of sucrose (30, 45, and 60 g/L) most suitable for G. diazotrophicus production, considering the cost of the culture medium. Since the first report of this bacterium, Cavalcante and Döbereiner [11] observed the highest growth using a concentration of 100 g/L sucrose in the medium. They even observed bacterial growth in a medium containing up to 300 g/L. This demonstrates the ability of G. diazotrophicus to grow under osmophilic conditions. Liquid media containing up to 150 g/L sucrose were assessed in this work. Considering the data obtained, a relatively low sucrose concentration (30 g/L) was chosen for subsequent cultivations.

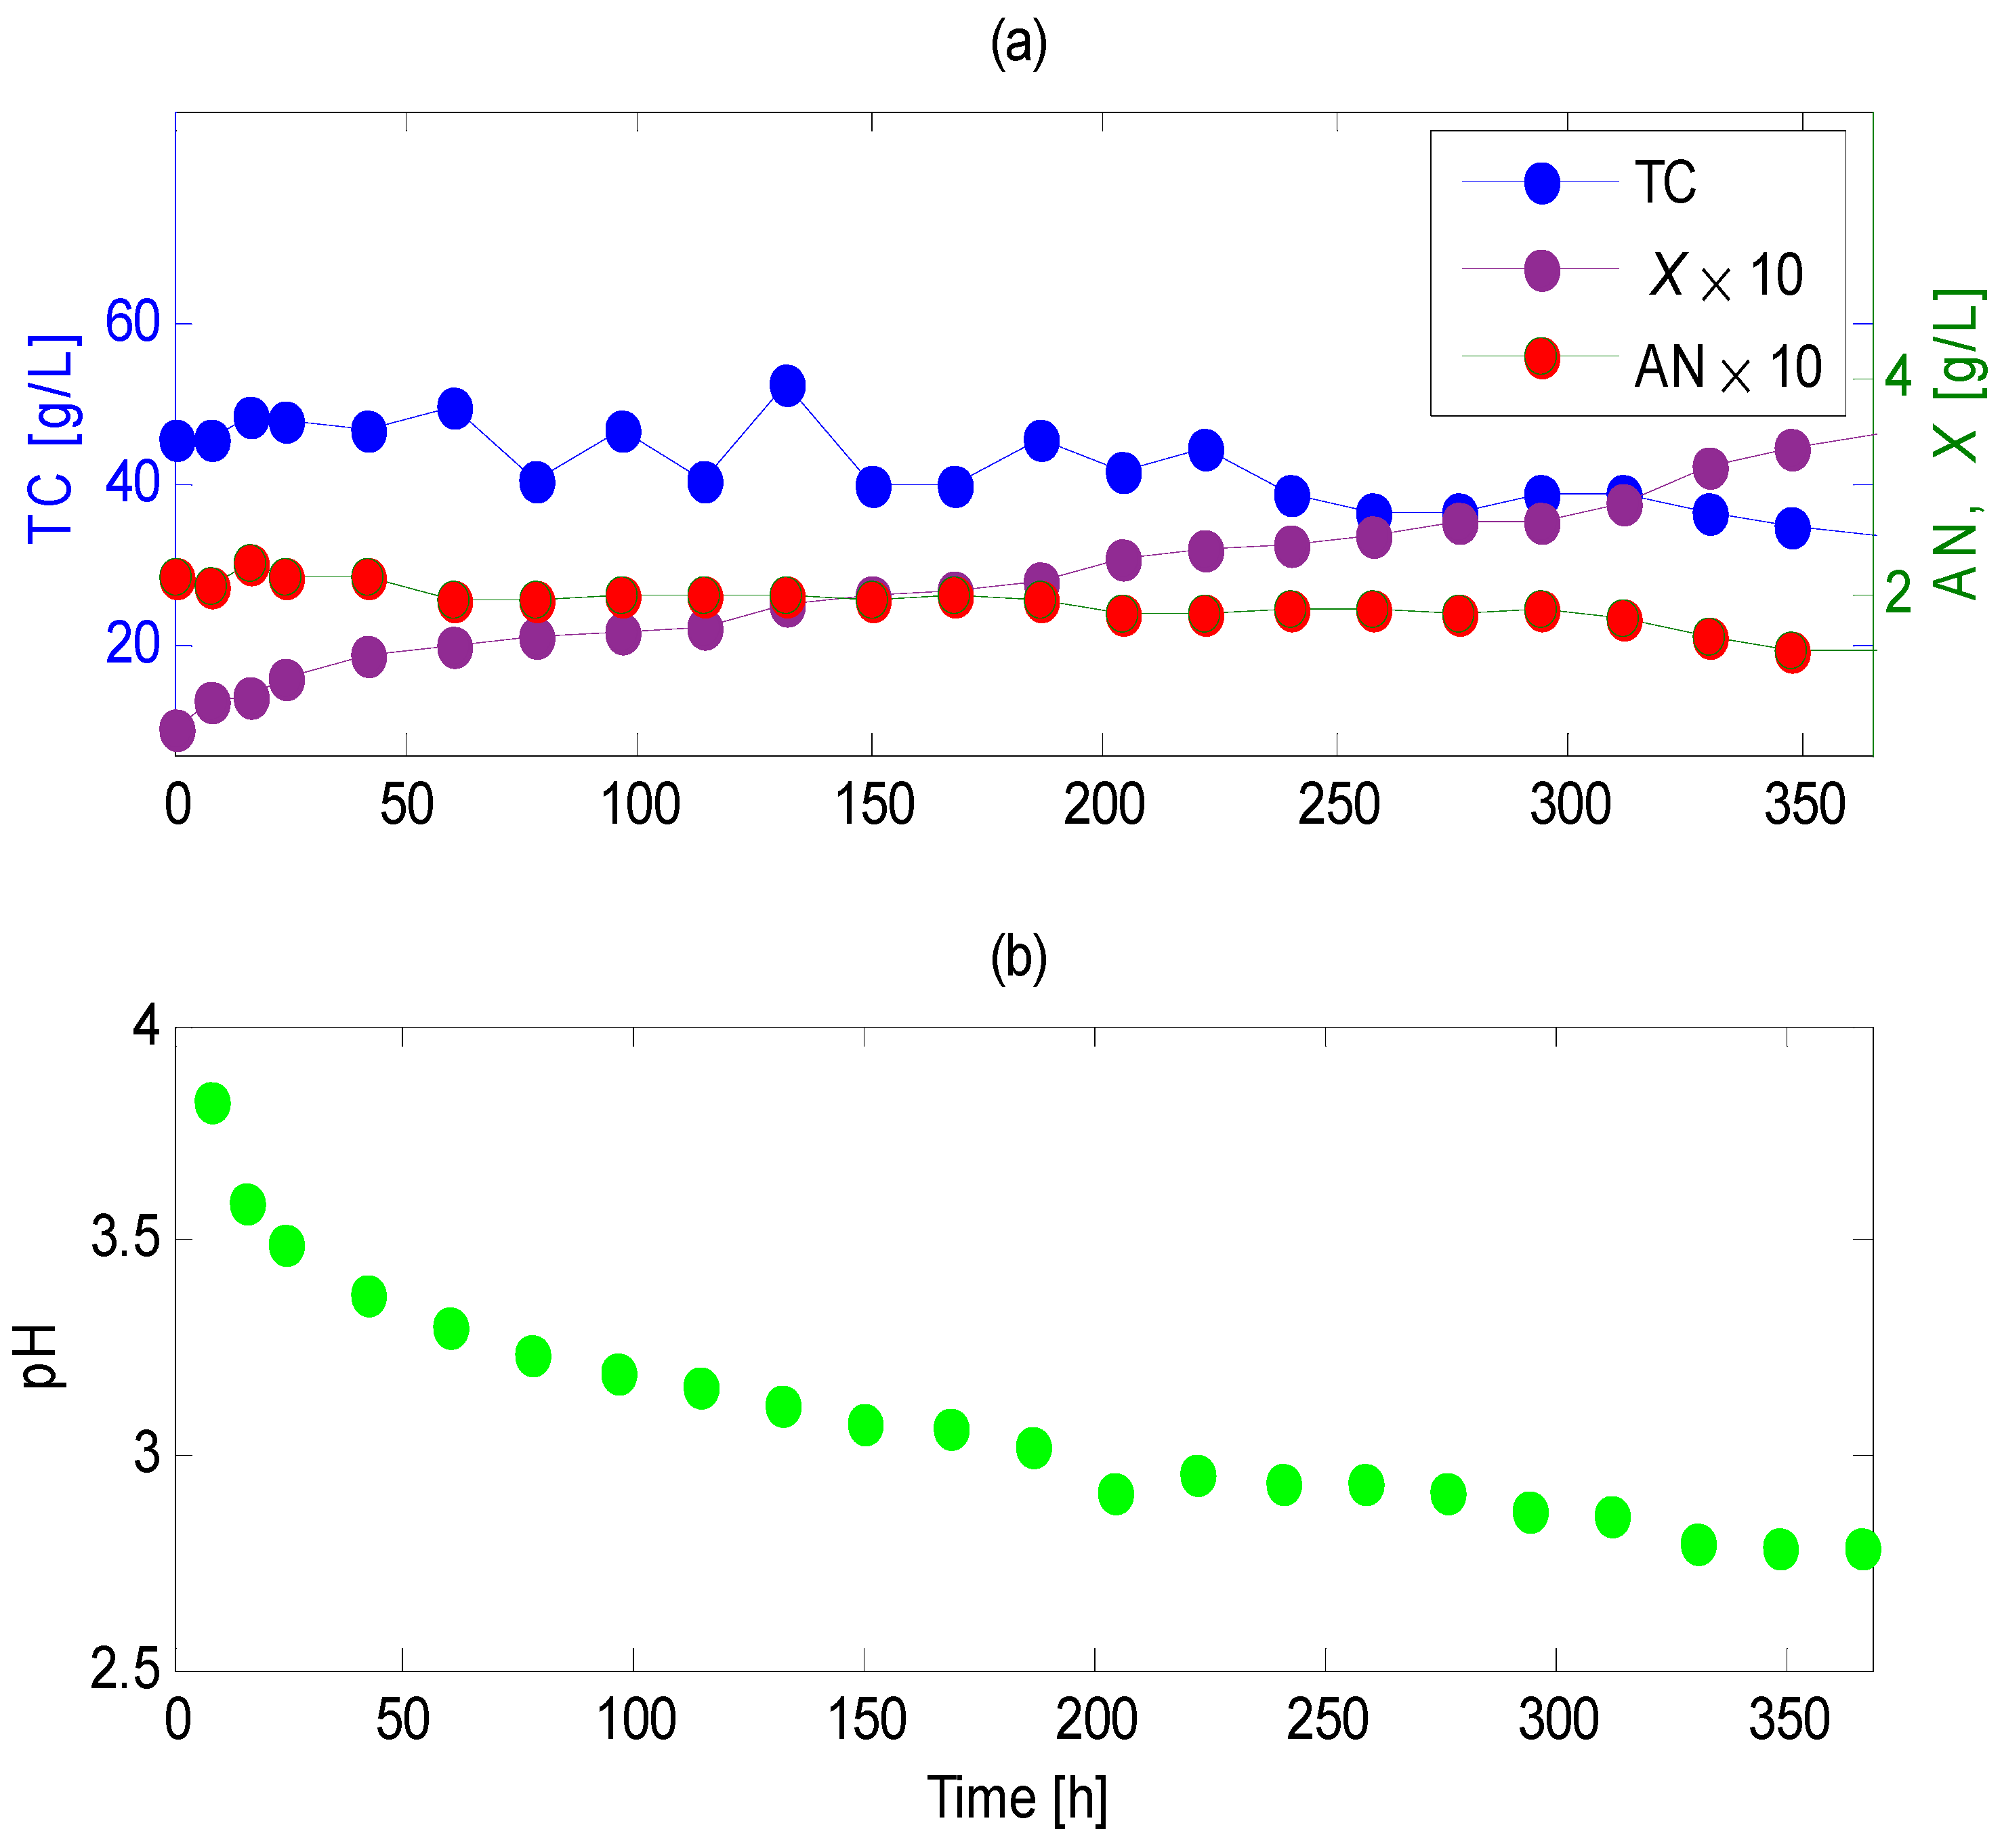
4.4. Bench-Scale Submerged Cultivation

The bench-scale submerged batch cultivation was performed in a 3 L bioreactor where G. diazotrophicus was grown using sucrose (in its commercial white sugar form) as a carbon source and ammonium sulfate as a nitrogen source, according to the medium composition defined from the results of the one-factor design. Figure 3 shows the behavior of pH, biomass production, and carbon and nitrogen sources over time. The consumption of ammonium sulfate (down to 0.147 g/L) is evident, as well as the decrease in the pH value (down to 2.78). However, total sugars concentration presents noticeable fluctuations up to 186 h. Afterward, a consumption trend of the carbon source is evident. This irregular behavior may be associated with sucrose consumption, and concomitant production of exopolysaccharides by the bacteria, which can be detected and quantified by the method used for the determination of total carbohydrates. On the other hand, the biomass concentration increased over time.
The culture began with 0.08 g/L biomass and 46 g/L total sugars, which included 30 g/L sucrose from the LGI-P medium plus the total sugars from the inoculum added at the time of inoculation (sucrose not consumed and exopolysaccharides produced by the bacteria). The bacteria presented an exponential growth pattern, which began rapidly and gradually increased until the end of the culture (from 0.08 to 0.35 g/L). There was no evidence of a lag phase since the bacteria quickly adapted to the culture medium, a condition that was favored in the inoculum production stage because the same culture medium was used. There was also no evidence of a marked stationary phase under the conditions evaluated, although a slight stabilization of the culture can be observed during the last 18 h. Luna [21] obtained this same exponential growth but using media with 5 g/L glucose and 0.264% ammonium sulfate.
In the present work, the initial growth phase was characterized by a rapid decrease in pH and irregular behavior of the concentration of total sugars attributed to the production of exopolysaccharides. The pH remarkably decreased between the time of inoculation and 186 h of cultivation (down to 3.02); however, between 204 and 366 h, it only decreased by 0.24 units (down to 2.78). The pH decrease is explained by the production of organic acids, resulting from the metabolism of the bacteria, since G. diazotrophicus has an oxidative metabolism in which final products such as acetic acid, gluconic acid, keto acids, citric acid, and lactic acid are released, among others [21]. These acids contribute to the expression of the growth-promoting features of the bacterial strain, such as phosphate solubilization [60]. In fact, G. diazotrophicus has the ability to grow at low pH values due to the production of organic acids, a physiological characteristic that was evaluated by Cavalcante and Döbereiner [11]. Regardless of the initial pH value of the medium, it rapidly changes to a value of 3.0. In the assays conducted, this behavior was evidenced during the initial growth phase, where the pH reached 3.02 at 186 h of cultivation.
These outcomes can be contrasted with the variable concentration of total sugars between the time of inoculation and 186 h (Figure 3), where the carbon source was used for primary metabolism with the subsequent production of organic acids (decrease in pH) by G. diazotrophicus. This consumption overlapped with the production of extracellular polysaccharides. In this case, the determination of pH could be used as an indirect measure of the use of the carbon source.
The data resulting from the batch culture of G. diazotrophicus using sucrose as the carbon source indicate that this bacterium grows at slower rates compared to other microorganisms that possess similar sugar assimilation pathways. Pizarro [61] obtained the growth curve of Gluconobacter spp. in a standard medium containing 100 g/L glucose and 10 g/L yeast extract. The exponential phase was evidenced at 120 h of cultivation with a viable cell count of 1 × 10⁸ CFU/mL, unlike the present work, in which G. diazotrophicus reached a count of about 7 × 10⁸ CFU/mL at 294 h. For bacterial growth, sucrose hydrolysis is required, which may imply an increase in the duration of the submerged culture compared to the use of glucose as a carbon source [21]. However, it is important to consider the use of sucrose instead of glucose for the design of culture media for the production of G. diazotrophicus since it allows for the cost reduction of industrial culture media. For these purposes, the use of low-cost agro-industrial by-products such as molasses or starch hydrolyzates will be addressed in future work.
Under the conditions evaluated, there was no evidence of a marked decrease in the concentration of total sugars. This can be explained by the fact that the determination of total sugars was influenced by the production of exopolysaccharides by the bacteria, which caused interference in the tests performed. This condition was also identified by Molinari [23] during batch cultivations using culture media containing 10 and 100 g/L sucrose. The production of extracellular polysaccharides by G. diazotrophicus has been demonstrated in several works [35,59,62]. Stephan et al. [59] evidenced the formation of polyhydroxybutyrate (PHB) for the first time in G. diazotrophicus after 9 h of incubation in a liquid medium in a fermenter. Therefore, the use of other analytical methods (chromatographic or enzymatic) is suggested for determining the carbon source concentration over time, especially in the case of using sucrose. In this work, the quantification of the carbon source was performed according to DuBois et al. [39]. Regarding this, the final sucrose concentration is not quantified in the case of most related papers published in the available literature addressing kinetic experimental studies on G. diazotrophicus [21,23]. In fact, the estimation of the biomass yield in those works was calculated from the cell concentration data obtained by optical density. This allows us to highlight the results obtained in the present work since the determination of the dynamics of the carbon source consumption by G. diazotrophicus based on direct spectrophotometric methods is not often disclosed in the open literature. In this way, the knowledge of the time profile of total carbohydrates during submerged cultivation of this type of microorganism is very useful despite the interference caused by the presence of extracellular polysaccharides released by the bacteria into the medium.
The addition of ammonium nitrogen in the form of ammonium sulfate is essential for the propagation of G. diazotrophicus in a liquid culture medium because it has been proven that there is no massive growth of this bacterium in the absence of the nitrogen source [35,58]. In this work, consumption of ammonium nitrogen was evidenced down to 0.147 g/L (see Figure 3). As an important amount of ammonium nitrogen remains in the culture broth at the end of cultivation, it is recommended to evaluate the ammonium dynamics under different conditions, for instance, by changing the aeration or agitation rates to obtain higher biomass concentrations in less time, but with enhanced consumption of the nitrogen source.
Aeration of the culture broth is another factor that influences bacterial growth. G. diazotrophicus is an aerobic bacterium; therefore, higher aeration rates could have a positive effect on its growth. In this work, the aeration rate was 0.6 vvm; with this rate, a growth curve similar to that reported by Flores-Encarnación et al. [58], who used 0.5 vvm, was obtained. Under these conditions, these authors reported slower growth of G. diazotrophicus compared to aeration rates between 1 and 4 vvm. Thus, it is important to design future experiments considering higher aeration rates in order to identify their effect on the biomass production of G. diazotrophicus.
The concentrations of biomass obtained in the 3 L stirred-tank bioreactor expressed in g/L (see Figure 3a) were low when compared to the biomass data obtained during the evaluation of the concentration levels of sucrose of the culture medium in Erlenmeyer flasks, which reached values as high as 1.3 g/L for some replicates (see Figure 2). This indicates that the operating conditions defined for the bench-scale fermentation were not the optimal ones for the biomass propagation of G. diazotrophicus. In particular, the aeration rate applied (about 0.6 vvm) could not be enough to supply the appropriate levels of oxygen required by the culture. Furthermore, the agitation rate and initial pH of the medium may exert a significant influence on the values of biomass that can be obtained during the cultivations in the 3 L bioreactor. Therefore, more research is needed to optimize the cultivation conditions on a bench scale. In future work, the cultivation conditions will be assessed to increase biomass production, particularly the agitation speed and the aeration rate.
As far as we know from the available literature, this is the only work that reports the experimental kinetics of G. diazotrophicus grown in a sucrose-based medium in a bench-scale stirred-tank bioreactor, including the time profiles of the biomass, carbon source, nitrogen source, and pH. The few reports published on this matter employ the determination of optical density as the main method for biomass quantification [35,58,59,63] or present the dry weight data of biomass without the corresponding data of substrate consumption [13]. This kind of kinetic experimental study represents a fundamental input for the modeling of G. diazotrophicus growth. In turn, mathematical modeling can provide the basis for scaling up bacterial cultures on a pilot scale (between 10 and 1000 L). From subsequent pilot-scale studies, the conditions required for the production of a microbial inoculant based on G. diazotrophicus on an industrial scale may be established in order to widen the spectrum of plant growth-promoting preparations in the framework of sustainable agriculture.

4.5. Fitting of the Kinetic Model

In this section, the results of the model fitting to experimental data obtained from G. diazotrophicus batch culture (shown in Figure 3) are presented. The estimated parameter values are provided in Table 6.

4.5.1. Fitting of First Approach Models

A satisfactory description of the time course of biomass concentration was obtained, as can be noticed from the modeling results (Figure 4) and the corresponding determination coefficient (Table 6).
The µ model (5) resulted in an overlarge confidence interval of parameter f; thus, the following simplified form was used, resulting in adequate confidence intervals (see Table 6):
μ = μ m a x ( 1 X X m a x ) ,

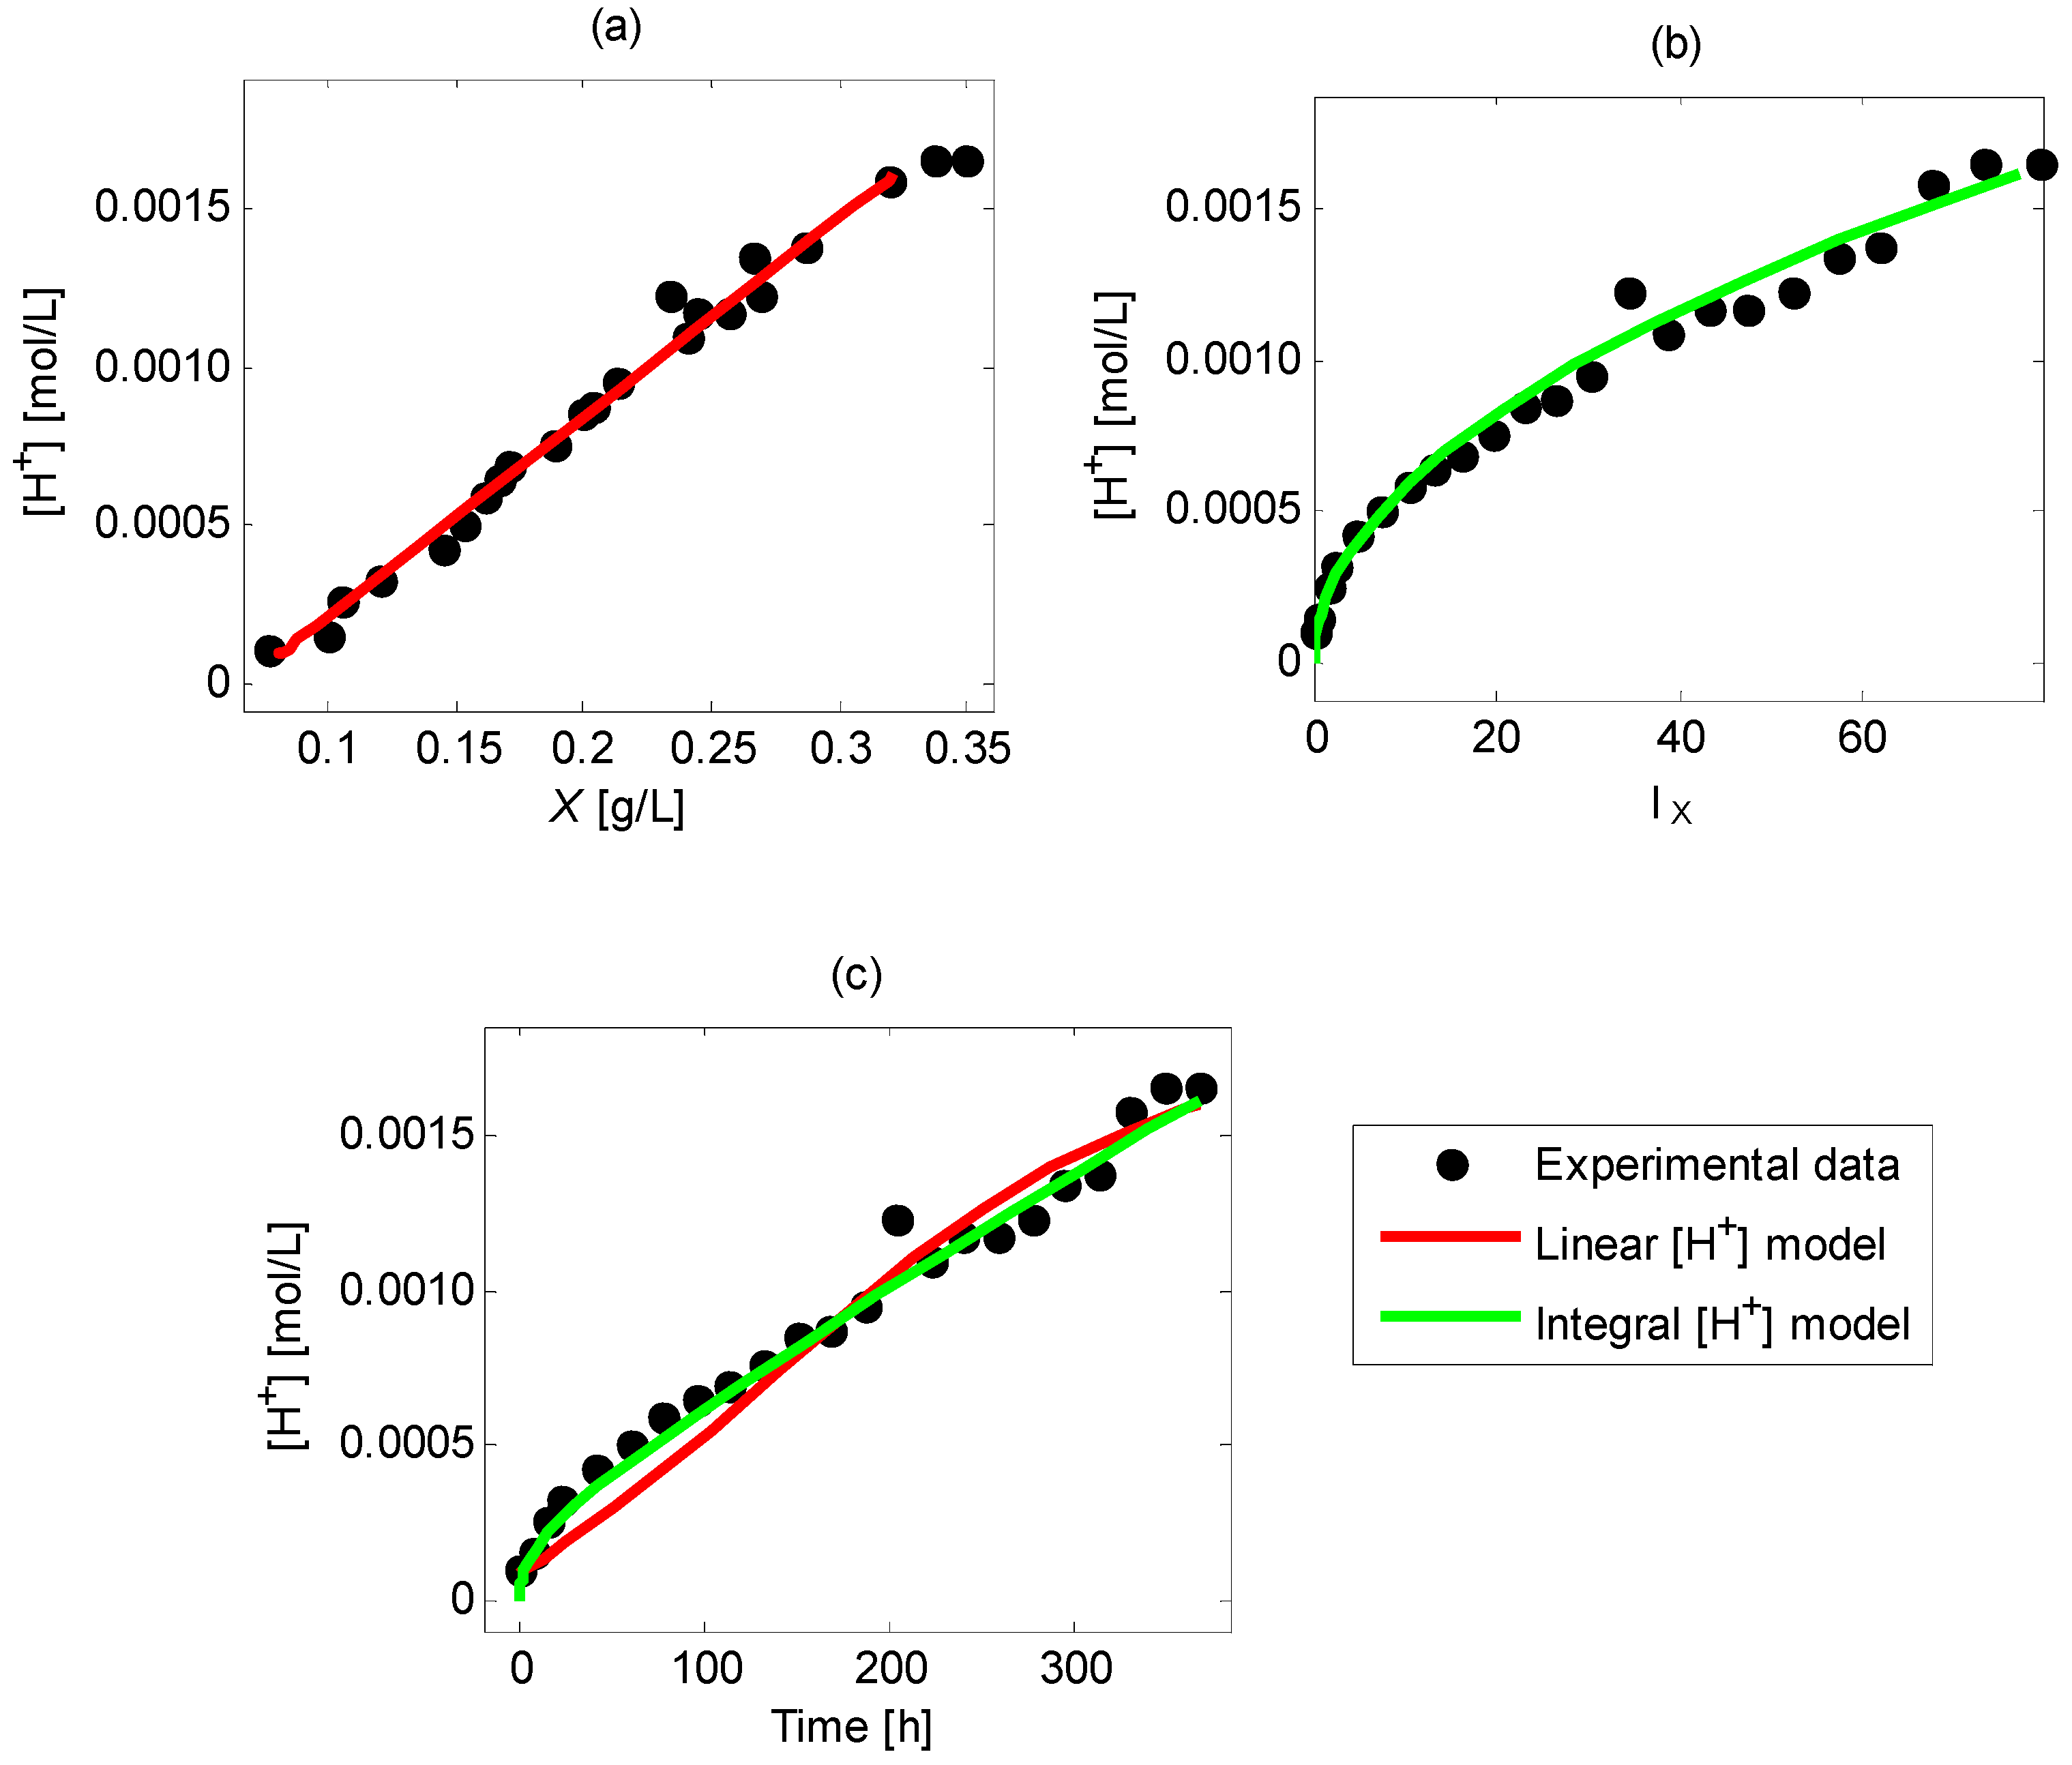
4.5.2. Fitting of Second Approach Models

A satisfactory description of the time course of biomass concentration and of the relationship between [H+] and X was obtained, as can be noticed from the modeling results (Figure 5 and Figure 6) and the corresponding determination coefficients (Table 6). This supports the assumptions made, including a single acid-like behavior and a single buffer-like behavior. For the description of [H+] as a function of X and t o t X d t , the parameter θ3 of model (17a) and θ1 and θ2 of model (17b) exhibited overlarge confidence intervals. Thus, the following simplified hydrogen models were applied, which achieved adequate confidence intervals:
θ 2 [ H + ] + θ 1 = X
θ [ H + ] 2 = t o t X d t   ,
The modeling results for [H+] as a function of X are shown in Figure 5a, and the corresponding simulation of the time course of [H+] is presented in Figure 5c. The simulation of [H+] as a function of t o t X d t is shown in Figure 5b. A high correspondence between simulated and experimental values was obtained.
The fitting of the µ model (6) resulted in an overlarge confidence interval of parameter d. Thus, the following simplified expression was used, which resulted in adequate confidence intervals:
μ = μ m a x ( 1 [ H + ] H m a x ) .  
The fitting of the biomass concentration model (1) using hydrogen models (21) and (22) is shown in Figure 6. A high correspondence between simulated and experimental values was obtained.

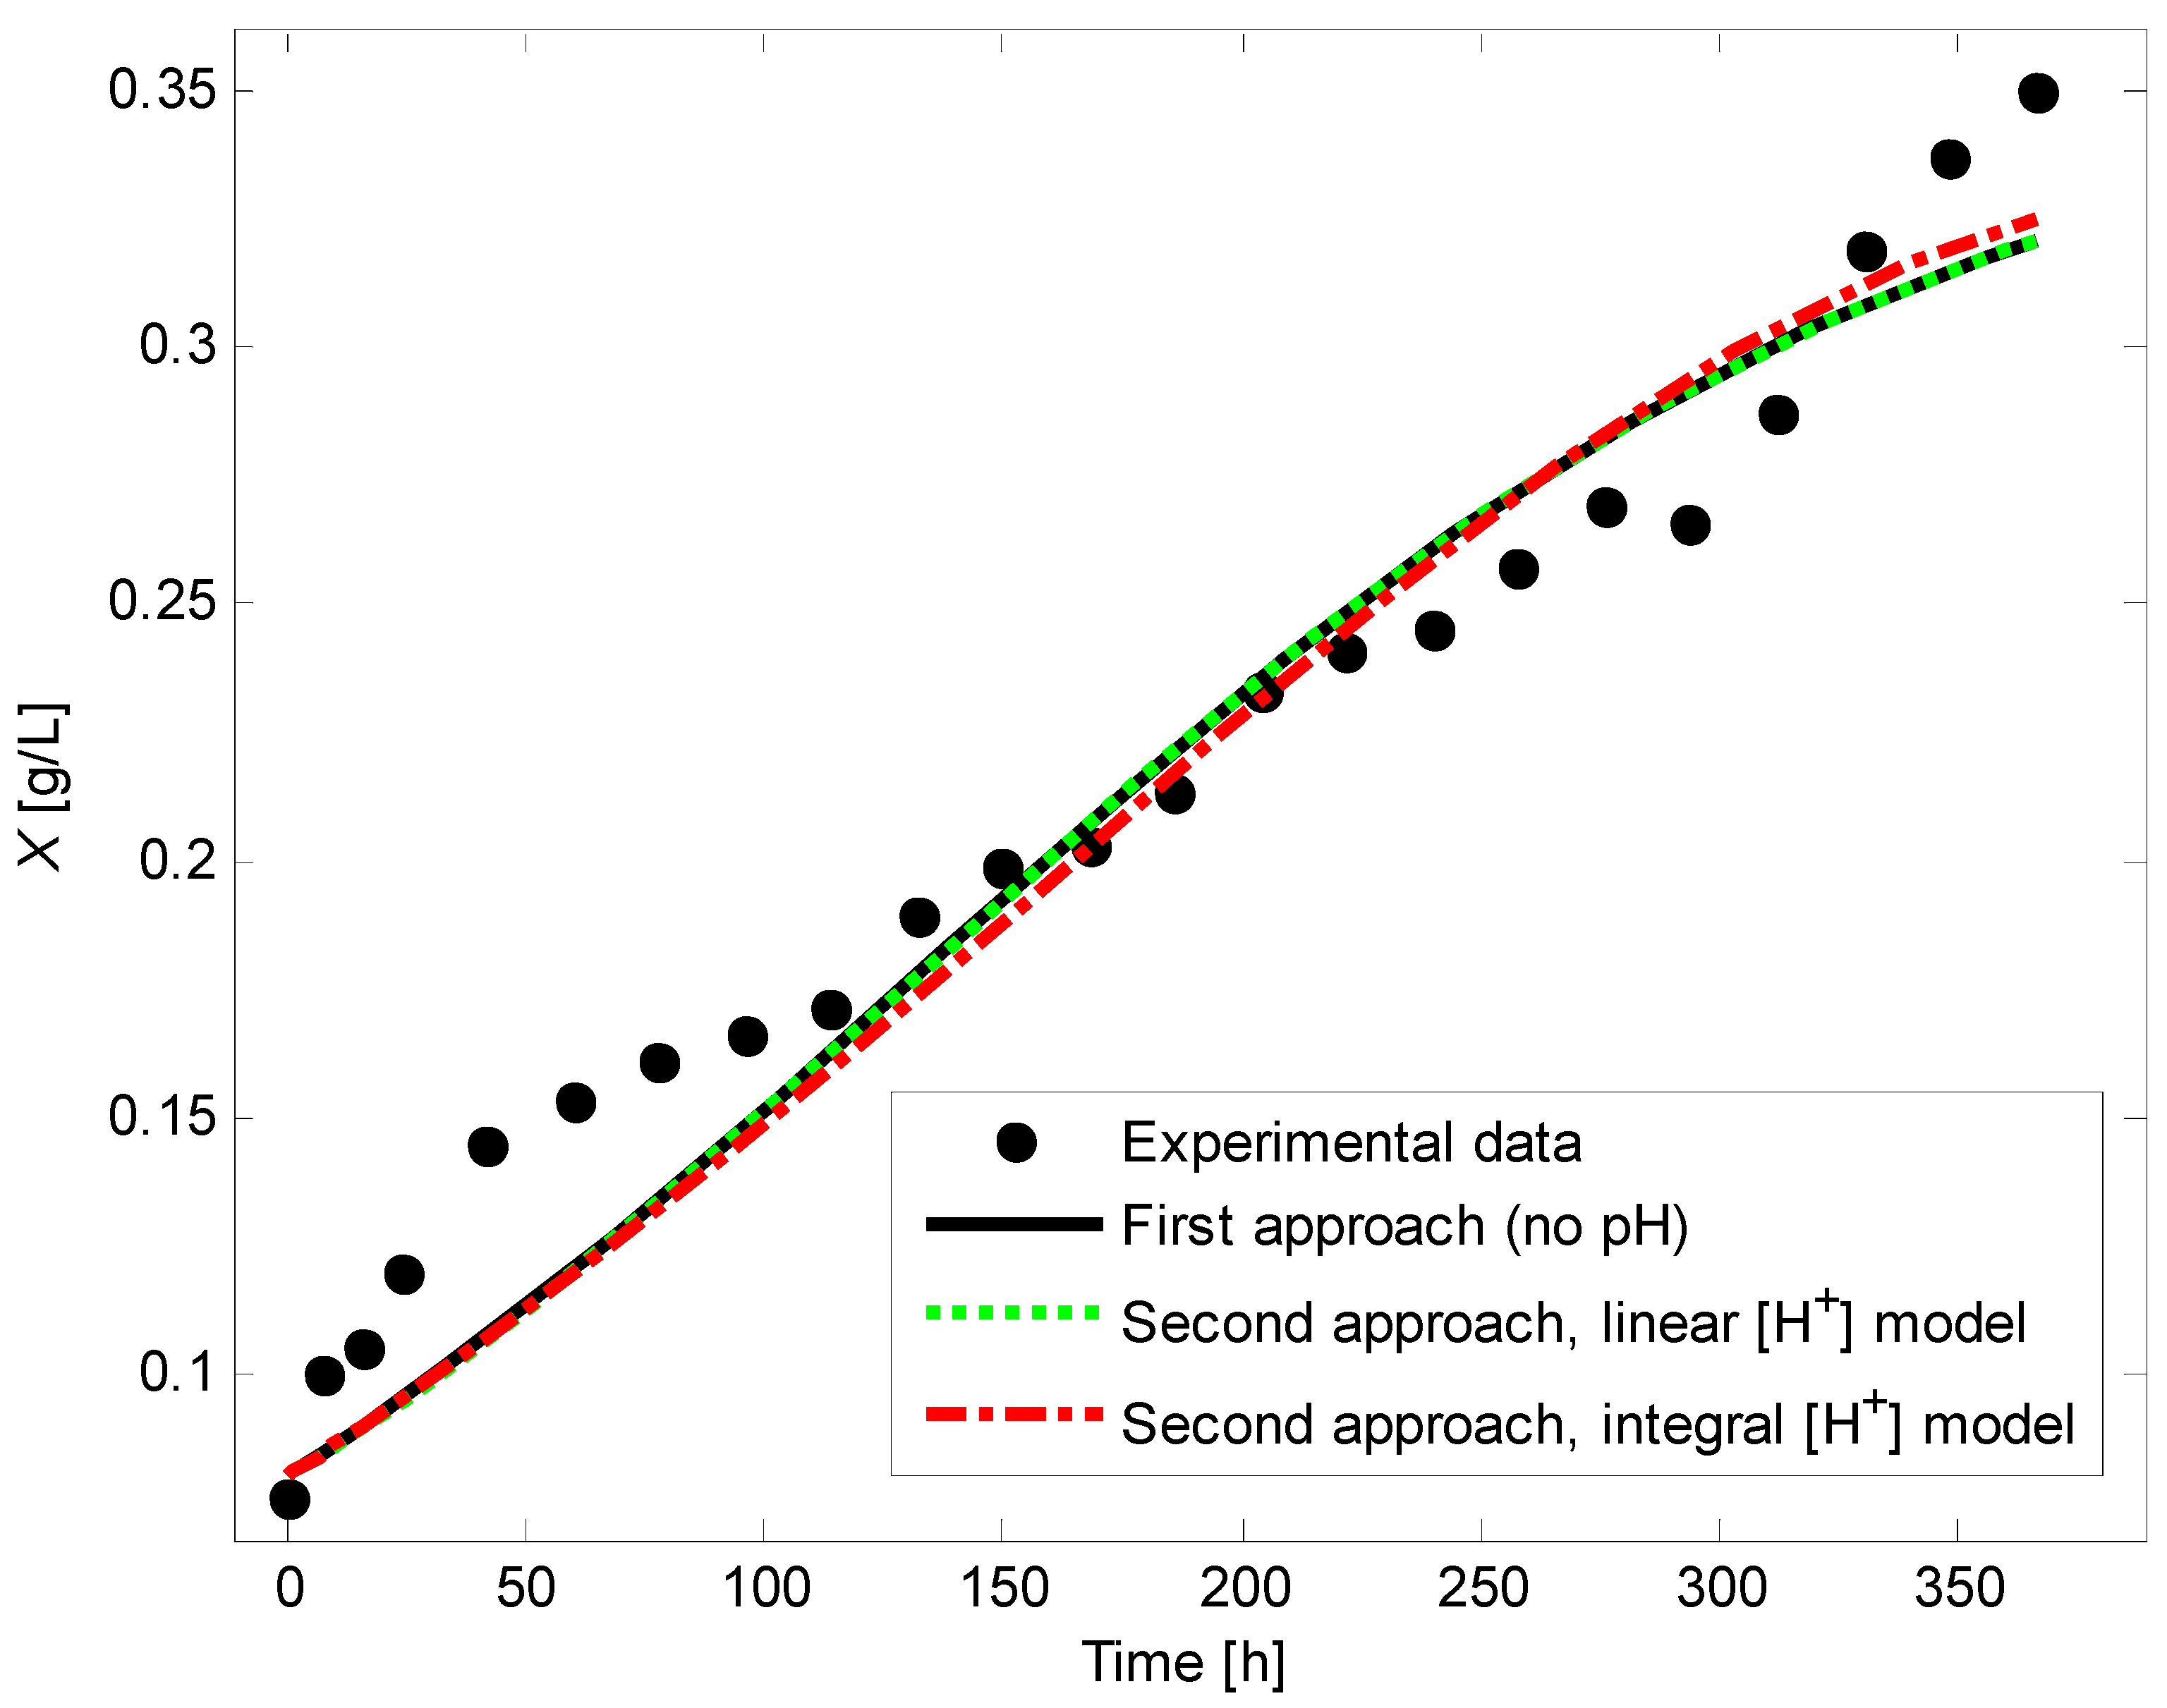
4.6. Comparison of Model Fitting via First and Second Approaches

A satisfactory description of the time course of biomass concentration was obtained by both approaches, as can be noticed from the determination coefficients and the fitting of models (see Table 6 and Figure 6). The parameter estimates are reliable, according to the confidence intervals.
The main difference in the application of these approaches relies on the fact that the second approach involves fitting the hydrogen model, using the measured concentrations of hydrogen and biomass concentrations; in addition, the second approach comprises more parameters to be estimated. For the first modeling approach and the second modeling approach with the hydrogen model described by Equation (21), the simulated curves overlap (see Figure 6), and the determination coefficients coincide (see Table 6). For the second approach, the estimates of µmax and Hmax using the hydrogen models (Equations (21) and (22)) agree. This is because a satisfactory representation of [H+] is achieved by both hydrogen models (see Figure 5).
The second modeling approach uses a hydrogen model that results from the ion dissociation and electroneutrality equations and the acid and biomass mass balances. In addition, the proposed model combines the mass balance for the produced acid and biomass concentrations to tackle the lack of knowledge of the acid concentration. In addition, a nonlinear relationship between the hydrogen ion and the acid concentration was obtained by combining the dissociation and electroneutrality equations and applying several simplifications. The effectiveness and adequacy of these simplifications concerning the considered G. diazotrophicus measurements are due to the relatively simple behavior of pH and the limited range of the operation conditions of the batch runs. However, other types of simplifications can be applied to capture a more complex nonlinearity relationship for other experimental conditions.
In the first modeling approach, the µ model (20) accounts for biomass concentration, but it disregards the effect of pH, and no hydrogen model is used. In the second modeling approach, the µ model (23) accounts for the effect of pH, and the hydrogen model (14) is used to this end. Thus, the second modeling approach is more convenient for considering the dependence of biomass yield values on pH. Furthermore, the hydrogen model (14) can be extended to include the effect of base and acid addition, which would make it possible to test and calibrate different pH control strategies. If the production of microbial inoculant of G. diazotrophicus is foreseen, it would be convenient to optimize biomass production and biomass yield coefficient by several batch runs with different operating conditions. In this case, the second modeling approach would allow accounting for the pH effect for these conditions.
The proposed models allow the simulation of biomass and substrate concentrations in case of varying pH with different initial concentrations of substrate and biomass in the absence of pH control. Furthermore, the procedure for obtaining the pH models can be extended to the case of pH control with acid/base addition.

5. Conclusions

In the present work, the composition of a sucrose-based culture medium was modified to reach higher values of cell biomass concentration during batch submerged cultivations performed on laboratory and bench scales. The modified culture medium was used to conduct an experimental kinetic study, comprising the aerobic cultivation of G. diazotrophicus in a bench-scale stirred-tank bioreactor, including the time profiles of the biomass, carbon source, nitrogen source, and pH. The kinetic experimental data obtained were a fundamental input for the modeling of G. diazotrophicus growth.
In this work, a model was proposed for representing the behavior of the biomass concentration over time for the batch submerged cultivation of G. diazotrophicus that considered the inhibitory effect of hydrogen concentration. The model was applied to the experimental data, achieving satisfactory agreement between modeling results and measurements, as well as reliable parameter estimates. The hydrogen model allows future incorporation of the effect of the addition of acids and bases, which is an improvement related to the existing simplified models. The fitting results confirm that the effect of several acids and buffer species on the hydrogen ion concentration can be described as that of a single acid and a single buffer species; in addition, the hydrogen model is capable of capturing the nonlinear relationship between the concentrations of hydrogen and biomass.
The results obtained in this work are relevant for the future development of a biotechnological process for the production of G. diazotrophicus, which could be offered to the industrial sector. Further studies should be conducted to define the conditions of submerged culture conditions that maximize G. diazotrophicus production both on bench and pilot scales. For instance, it is recommended to evaluate the effect of higher aeration rates on the biomass production of the bacterial strain used. In this way, future work will be intended to intensify the propagation of G. diazotrophicus biomass, which will be used as the main component of an alternative plant growth-promoting preparation for crops of economic importance in the context of sustainable agriculture.

Author Contributions

Conceptualization, Ó.J.S. and G.M.R.; data acquisition: G.M.R.; data analysis, G.M.R., A.R. and Ó.J.S.; methodology, Ó.J.S. and A.R.; software, A.R.; validation, G.M.R. and A.R.; formal analysis, A.R. and Ó.J.S.; investigation, G.M.R.; resources, Ó.J.S. and G.M.R.; data curation, A.R.; writing—original draft preparation, G.M.R. and A.R.; writing—review and editing, Ó.J.S.; visualization, A.R.; supervision, Ó.J.S.; project administration, Ó.J.S. and G.M.R.; funding acquisition, Ó.J.S. and G.M.R. All authors have read and agreed to the published version of the manuscript.

Funding

This research was funded by the Colombian Ministry of Science, Technology, and Innovation, Minciencias (grant 112752128333), the Research Direction at the Universidad Católica de Manizales, and the Vice-Rectorate of Research and Graduate Studies at the Universidad de Caldas. This research was also financially supported by the research project “Evaluation of an alternative liquid medium for the production of biomass of Gluconacetobacter diazotrophicus GIBI025” (grant IGCN2012). The article processing charge (APC) was funded by the Research Direction at the Universidad Católica de Manizales.

Institutional Review Board Statement

Not applicable.

Informed Consent Statement

Not applicable.

Data Availability Statement

Data are contained within the article.

Acknowledgments

The authors would like to thank Fernando Galeano for his support during the statistical analysis of the experimental data obtained. Thanks are also expressed to the students Jorge Cuéllar and Luis F. Valencia for their valuable assistance during the experimental runs.

Conflicts of Interest

The authors declare no conflict of interest.

Appendix A. Overview of Scientific Literature on Modeling Approaches for the Relationship between Hydrogen Ions, Acids, Bases, and Buffer

Several modeling approaches for representing the dependence of hydrogen ions on acids, bases, and buffer compounds have been published, including:
  • The rigorous classic approach [26,32];
  • The empiric nonlinear models [30,64,65];
  • The fuzzy and neural network models [66,67];
  • The Wiener models [24].
In particular, Wiener models combine one linear subsystem (e.g., autoregression with extra inputs, known as ARX) and a static nonlinear function [24].
The rigorous approach is based on the electroneutrality equation and the ion dissociation of water, acid, and buffer substances [26]. It leads to a single algebraic equation that relates the ionic hydrogen concentration with the total concentrations of acids, bases, and buffer species [26,68]. This equation can be recast as a polynomial of n-th order with respect to hydrogen ion concentration. The advantage of this model is that it allows accounting for the addition of different bases, acids, and buffer substances. Nevertheless, its applicability is hampered by: (i) unavailable measurements of one or more acids in some cases [69]; (ii) unavailable measurements of two or more buffer substances; (iii) the mathematical complexity in determining the hydrogen ion concentration, as it requires either numerical iterative methods or root finding methods; (iv) the complexity of the fitting the pH model to experimental data and the computation of pH, which is related to the increase to the number of parameters with the number of acids and buffer species [32,70].
The empiric models of Vereecken and Van Impe [30] and Ellouze et al. [65] overcome the aforementioned drawbacks of the rigorous approach. The empiric model of Vereecken and Van Impe [30] comprises a Dabies-type kinetic expression that describes the effect of total acid and undissociated acid on pH. The buffer concentration is unaccounted for in the pH equation, which amounts to consider it constant. The model coefficients are estimated by fitting them to experimental data. The hydrogen ion can be computed explicitly, and the model is capable of capturing the nonlinear relationship between pH and acid concentration. This approach was used for the culture of lactic acid bacteria [30,47,71] and Listeria innocua [47,71]. In addition, different amounts of the buffering agent KH2PO4 were used by Antwi et al. [47], and the pH model was fitted for each. However, the model does not allow accounting for the future addition of bases or acids. The empiric model of Ellouze et al. [65] is a modified logistic model representation of the relationship between total acid concentration and pH. This approach was used for the culture of acid lactic bacteria. However, the model does not allow accounting for the future addition of bases or acids.

Appendix B. Equation of pH for the Case of External Addition of Acids/Bases/Buffer Compounds

The electroneutrality equation, considering a strong acid and a strong base, is:
[ H + ] = [ O H ] + [ A ] + [ B u ] + [ B u = ] + C a C b
[ H + ] = K w 1 [ H + ] + K a 1 K a + [ H + ] A t o t + ( K b 1 [ H + ] + K b 1 K b 2 ) [ H + ] 2 + K 1 [ H + ] + K b 1 K b 2 B u | t o t + E ¯
E ¯ = C a C b   ,
where Ca and Cb are the concentrations of the added acid and base in the tank. The simplified form is:
[ H + ] = K 2 [ H + ] + K 5 ( K 3 A t o t + K 4 ) + E ¯
E ¯ = C a C b .
Arranging yields a polynomial of order two with respect to [H+]:
[ H + ] 2 + ( K 5 E ¯ ) [ H + ] ( K 2 K 4 + K 2 K 3 A t o t + K 5 E ¯ ) = 0 .
Differentiating with respect to time and arranging yields:
d [ H + ] d t = ( [ H + ] + K 5 ) ( d E ¯ / d t ) + K 2 K 3 ( d A t o t / d t ) 2 [ H + ] + ( K 5 K 2 E ¯ ) .
In the case that a base and an acid are added, assuming that water volume is not constant and there are no outlet flows, the dynamics of Ē = CaCb are provided by McAvoy et al. [32]:
d E ¯ d t = 1 V ( F a C a i F b C b i ( F a + F b ) E ¯ )
E ¯ = C a C b .
In the above expression of d[H+]/dt, the dĒ/dt term is a function of the acid and base flowrates (Fa and Fb), thus providing an input–output relationship with a relative degree of one. Thus, a control law can be defined to control the hydrogen ion concentration by manipulating the acid and base flowrates.

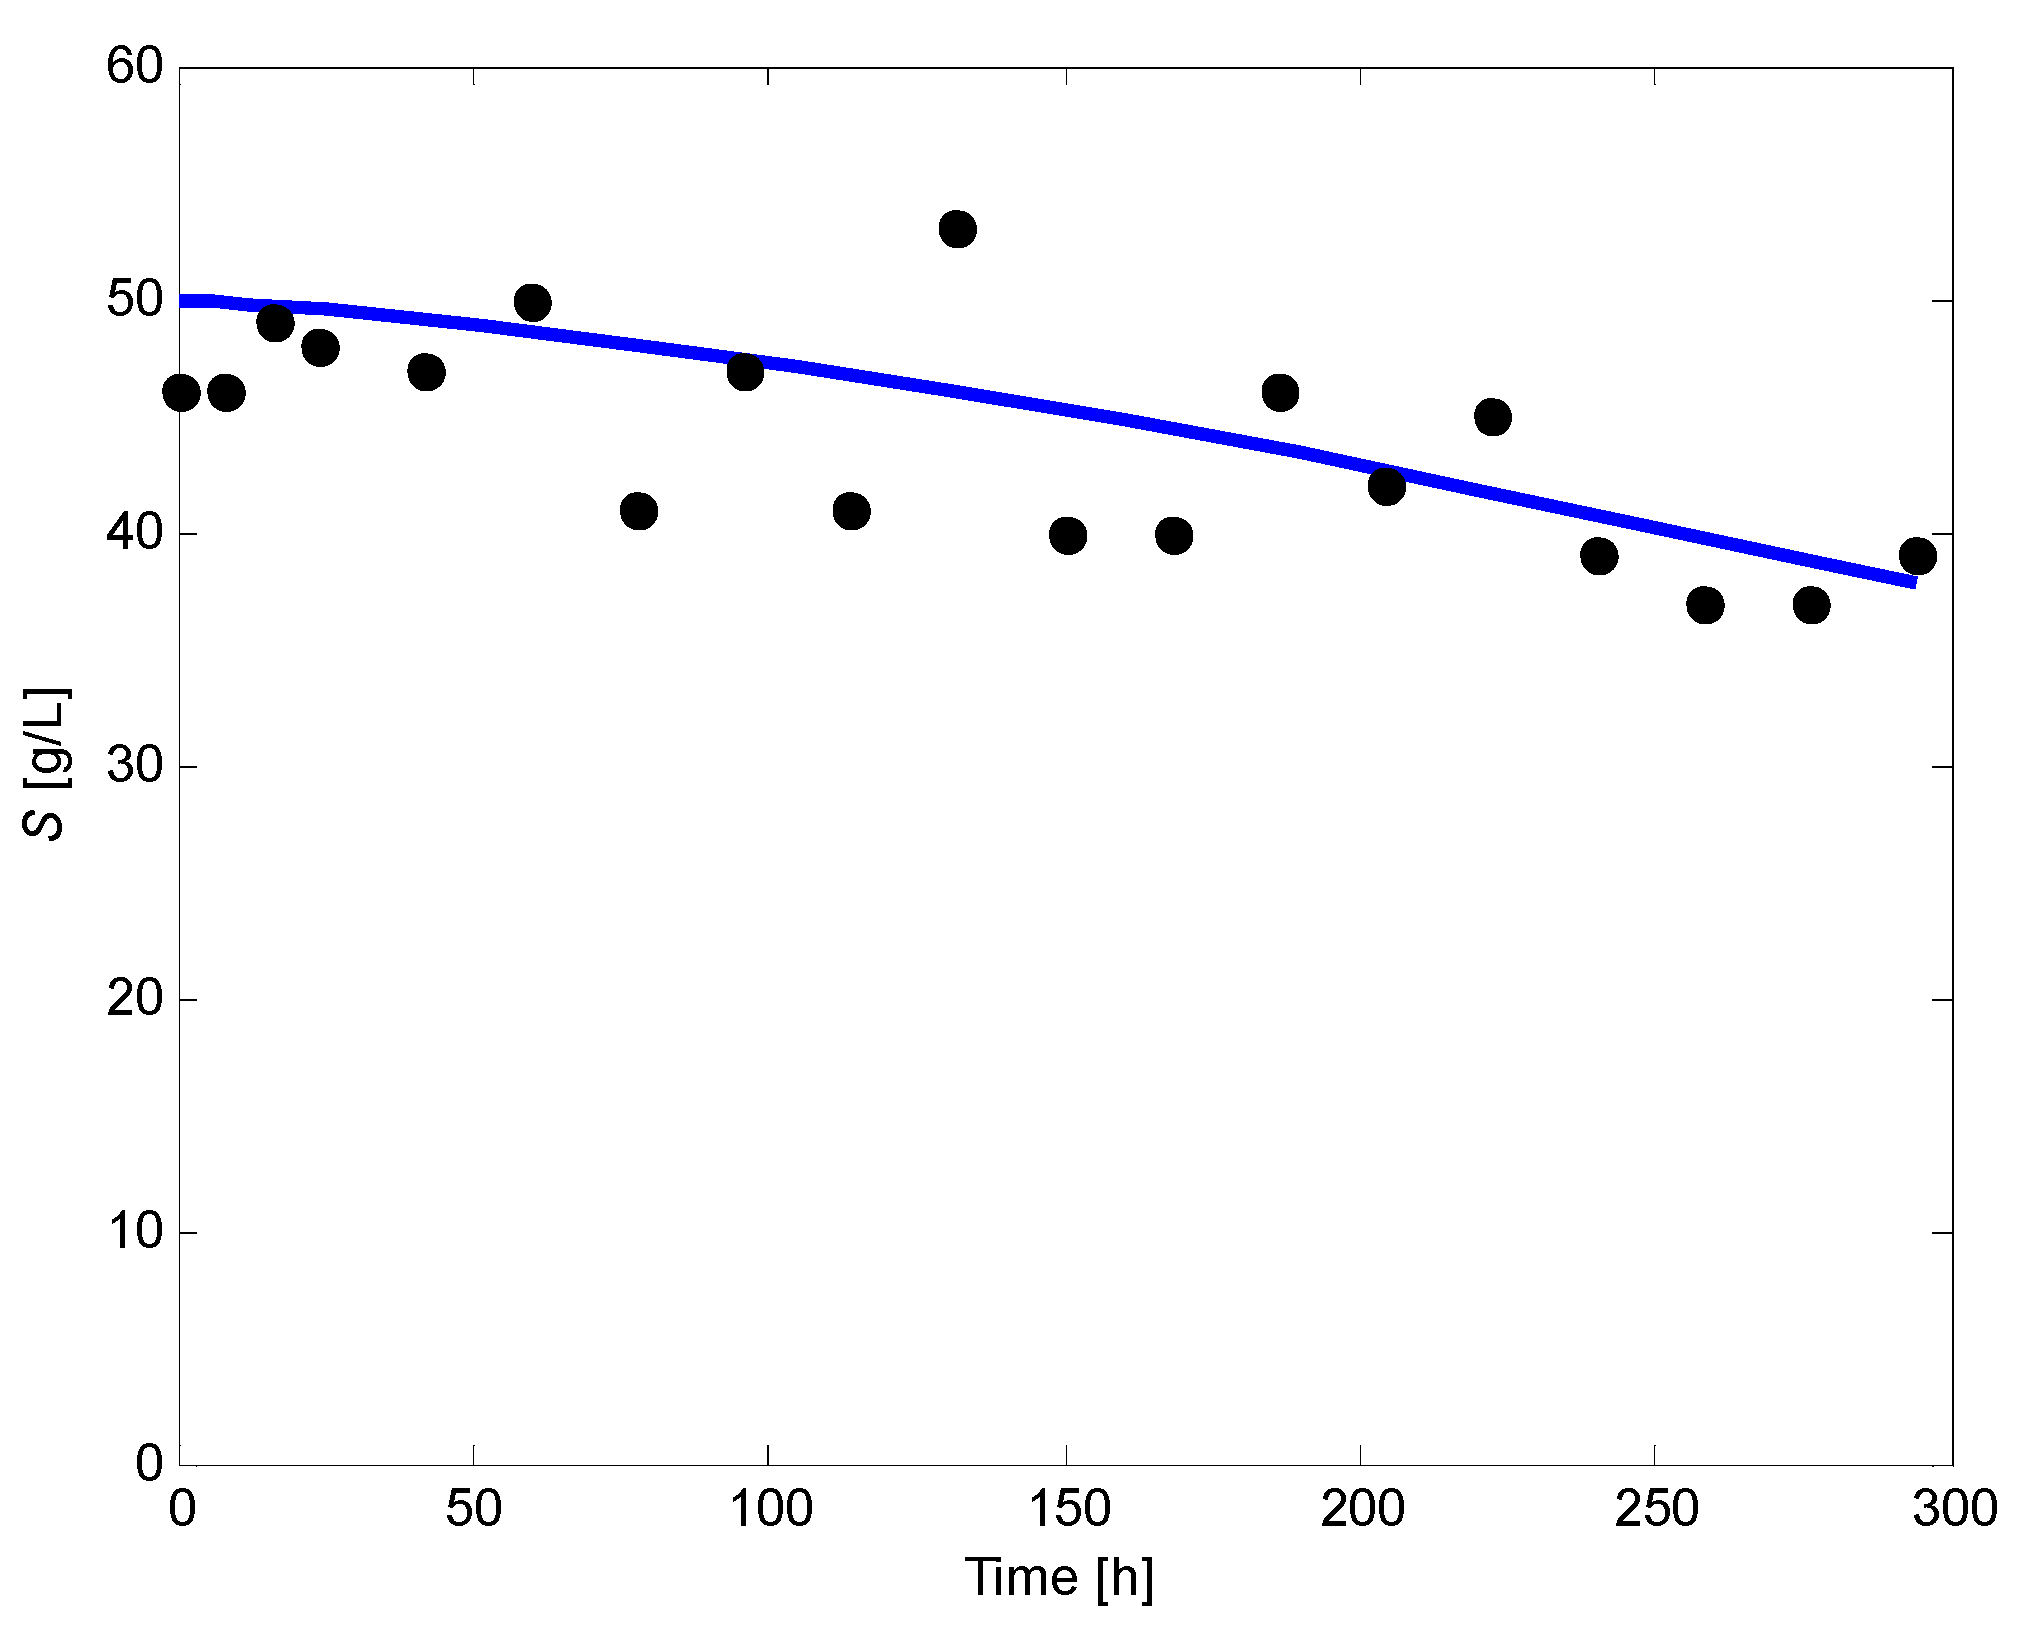
Appendix C. Fitting of Substrate Concentration

Figure A1. Preliminary modeling for G. diazotrophicus batch fermentation. Experimental data are represented by filled circles; the solid lines are calculated by the model proposed. S: substrate concentration. Graph built using Matlab (The MathWorks Inc., Natick, MA, USA).
Fermentation 09 00705 g0a1

References

  1. Moreno Reséndez, A.; Carda Mendoza, V.; Reyes Carrillo, J.L.; Vásquez Arroyo, J.; Cano Ríos, P. Plant growth promoting rhizobacteria: A biofertilization alternative for sustainable agriculture. Rev. Colomb. Biotecnol. 2018, 20, 68–83. [Google Scholar] [CrossRef]
  2. Rojas, M.; Hernández, A.; Rives, N.; Tejera, B.; Acebo, Y.; Heydrich, M. Antisera production to detect indoleacetic acid in cultures of plant-growth promoting bacteria. Acta Biol. Colomb. 2012, 17, 271–280. [Google Scholar]
  3. Acurio Vásconez, R.D.; Mamarandi Mossot, J.E.; Ojeda Shagñay, A.G.; Tenorio Moya, E.M.; Chiluisa Utreras, V.P.; Vaca Suquillo, I.Á. Evaluation of Bacillus spp. as plant growth-promoting rhizobacteria (PGPR) in broccoli (Brassica oleracea var. italica) and lettuce (Lactuca sativa). Cienc. Tecnol. Agropecuaria. 2020, 21, e1465. [Google Scholar] [CrossRef]
  4. Nieto-Penalver, C.G.; Savino, M.J.; Bertini, E.V.; Sánchez, L.A.; de Figueroa, L.I. Gluconic acid produced by Gluconacetobacter diazotrophicus Pal5 possesses antimicrobial properties. Res. Microbiol. 2014, 165, 549–558. [Google Scholar] [CrossRef] [PubMed]
  5. Murumkar, D.; Nalawade, S.; Indi, D.; Pawar, S. Response of sugarcane seed plot to microbial inoculation by Gluconacetobacter diazotrophicus and phosphate-solubilizing bacteria. Sugar. Tech. 2017, 19, 26–32. [Google Scholar] [CrossRef]
  6. de Oliveira, T.R.A.; Gravina, G.A.; da Cruz, D.P.; Silva, N.D.; de Oliveira, G.H.F.; de Sant’Anna, C.Q.; Magalhães, M.M.; Berbert-Molina, M.A.; Neto, F.A. The performance of bean pod lineage inoculated with Gluconacetobacter diazotrophicus PAL5. Sci. Hortic. 2019, 249, 65–70. [Google Scholar] [CrossRef]
  7. Restrepo, G.M.; Sánchez, Ó.J.; Marulanda, S.M.; Galeano, N.F.; Taborda, G. Evaluation of plant-growth promoting properties of Gluconacetobacter diazotrophicus and Gluconacetobacter sacchari isolated from sugarcane and tomato in West Central region of Colombia. Afr. J. Biotechnol. 2017, 16, 1619–1629. [Google Scholar]
  8. Ferreira, C.M.; Soares, H.M.; Soares, E.V. Promising bacterial genera for agricultural practices: An insight on plant growth-promoting properties and microbial safety aspects. Sci. Total Environ. 2019, 682, 779–799. [Google Scholar] [CrossRef] [Green Version]
  9. Botta, A.L.; Santacecilia, A.; Ercole, C.; Cacchio, P.; Del Gallo, M. In vitro and in vivo inoculation of four endophytic bacteria on Lycopersicon esculentum. New Biotechnol. 2013, 30, 666–674. [Google Scholar] [CrossRef]
  10. Restrepo, G.M.; Ceballos, N.; Valencia, L.F.; Sánchez, Ó.J. Plant growth promotion by Gluconacetobacter diazotrophicus and its interaction with genotype and phosphorus availability in tomato seedlings. Org. Agric. 2021, 11, 601–614. [Google Scholar] [CrossRef]
  11. Cavalcante, V.A.; Döbereiner, J. A new acid-tolerant nitrogen-fixing bacterium associated with sugar cane. Plant Soil 1988, 108, 23–31. [Google Scholar] [CrossRef] [Green Version]
  12. Reis, V.M.; Olivares, F.L.; Döbereiner, J. Improved methodology for isolation of Acetobacter diazotrophicus and confirmation of its endophytic habitat. World J. Microbiol. Biotechnol. 1994, 10, 401–405. [Google Scholar] [CrossRef] [PubMed]
  13. Molinari, M.L.; Boiardi, J.L. Levans production by Gluconacetobacter diazotrophicus. Electron. J. Biotechnol. 2013, 16, 7. [Google Scholar] [CrossRef]
  14. Ríos Rocafull, Y.; Sánchez López, M.; Dibut Álvarez, B.; Ortega García, M.; Tejeda González, G.; Rodríguez Sánchez, J.; Rojas Badía, M. The culture medium effect in plant growth promotion activity of Gluconacetobacter diazotrophicus in carrot and sugar beet. Rev. Bio Cienc. 2019, 6, e470. [Google Scholar] [CrossRef]
  15. Dent, D.R.; Patel, D.; Devine, G. Novel Strain of Gluconacetobacter diazotrophicus (Gd) and Use Thereof in Agriculture. United Kingdom Patent No. 2558094, 22 April 2020. [Google Scholar]
  16. Triplett, E.W.; Kaeppler, S.M.; Chelius, M.K. Klebsiella pneumoniae Inoculants for Enhancing Plant Growth. United States Patent No. 7393678, 1 July 2008. [Google Scholar]
  17. Vessey, J.K.; Fei, H.; Abudureheman, A. Use of Gluconacetobacter with Reduced Use of Nitrogen Fertilizer to Improve Beet Crop Production. United States Patent No. 8252720, 28 August 2012. [Google Scholar]
  18. Boniolo, F.S.; Nunes, M.C.O.; Berbert de Molina, M.A. Processo Tecnológico Para a Produção de Biomassa Bacteriana e Produtos de Fermentação de Gluconacetobacter diazotrophicus. Brazil Patent No. Application PI0917666-7, 13 March 2012. [Google Scholar]
  19. Rincón, A.; Cuéllar, J.A.; Valencia, L.F.; Sánchez, O.J. Kinetics of Gluconacetobacter diazotrophicus growth using cane molasses and sucrose: Assessment of kinetic models. Acta Biol. Colomb. 2019, 24, 38–57. [Google Scholar]
  20. Attwood, M.; Van Dijken, J.; Pronk, J. Glucose metabolism and gluconic acid production by Acetobacter diazotrophicus. J. Ferment. Bioeng. 1991, 72, 101–105. [Google Scholar] [CrossRef] [Green Version]
  21. Luna, M.F. Características fisiológicas de Gluconacetobacter diazotrophicus: Importancia funcional de la oxidación periplasmática de aldosas. Ph.D. Thesis, Departamento de Ciencias Biológicas, Universidad Nacional de la Plata, La Plata, Argentina, 2003; 134p. [Google Scholar]
  22. Luna, M.F.; Boiardi, J.L. Growth yields and glucose metabolism of N2-fixing Gluconacetobacter diazotrophicus at different culture pH values. World J. Microbiol. Biotechnol. 2008, 24, 587–590. [Google Scholar] [CrossRef]
  23. Molinari, M.L. Producción de exopolisacáridos tipo fructooligosacáridos por Gluconacetobacter diazotrophicus. PhD Thesis, Doctorado en Ciencias Exactas; Departamento de Química, Universidad Nacional de la Plata: La Plata, Argentina, 2011; 153p. [Google Scholar]
  24. Aliskan, I. Adaptive model predictive control for Wiener nonlinear systems. Iran. J. Sci. Technol. Trans. Electr. Eng. 2019, 43, 361–377. [Google Scholar] [CrossRef]
  25. Panda, A.; Panda, R.C. Adaptive nonlinear model-based control scheme implemented on the nonlinear processes. Nonlinear Dyn. 2018, 91, 2735–2753. [Google Scholar] [CrossRef]
  26. Nicolai, B.; Van Impe, J.; Verlinden, B.; Martens, T.; Vandewalle, J.; De Baerdemaeker, J. Predictive modelling of surface growth of lactic acid bacteria in vacuum-packed meat. Food Microbiol. 1993, 10, 229–238. [Google Scholar] [CrossRef]
  27. Spann, R.; Roca, C.; Kold, D.; Lantz, A.E.; Gernaey, K.V.; Sin, G. A probabilistic model-based soft sensor to monitor lactic acid bacteria fermentations. Biochem. Eng. J. 2018, 135, 49–60. [Google Scholar] [CrossRef] [Green Version]
  28. Duarte-Mermoud, M.A.; Rojo, F.A.; Pérez, R. Experimental evaluation of combined model reference adaptive controller in a pH regulation process. Int. J. Adapt. Control. Signal Process. 2002, 16, 85–106. [Google Scholar] [CrossRef]
  29. Lee, S.; Sung, S.W.; Lee, J. In-line mixer pH system for the identification of titration curve. Int. J. Control. Autom. Syst. 2013, 11, 442–449. [Google Scholar] [CrossRef]
  30. Vereecken, K.M.; Van Impe, J.F. Analysis and practical implementation of a model for combined growth and metabolite production of lactic acid bacteria. Int. J. Food Microbiol. 2002, 73, 239–250. [Google Scholar] [CrossRef]
  31. Hall, R.C.; Seborg, D.E. Modelling and self-tuning control of a multivariable ph neutralization process Part I: Modelling and multiloop control. In Proceedings of the 1989 American Control Conference, Pittsburgh, PA, USA, 21–23 June 1989; IEEE: Pittsburgh, PA, USA, 1989; pp. 1822–1827. [Google Scholar]
  32. McAvoy, T.J.; Hsu, E.; Lowenthal, S. Dynamics of pH in controlled stirred tank reactor. Ind. Eng. Chem. Process Des. Dev. 1972, 11, 68–70. [Google Scholar] [CrossRef]
  33. Boniolo, F.S.; Rodrigues, R.C.; Delatorre, E.O.; da Silveira, M.M.; Flores, V.M.Q.; Berbert-Molina, M.A. Glycine betaine enhances growth of nitrogen-fixing bacteria Gluconacetobacter diazotrophicus PAL5 under saline stress conditions. Curr. Microbiol. 2009, 59, 593–599. [Google Scholar] [CrossRef]
  34. Luna, M.; Bernardelli, C.; Galar, M.; Boiardi, J. Glucose metabolism in batch and continuous cultures of Gluconacetobacter diazotrophicus PAL 3. Curr. Microbiol. 2006, 52, 163–168. [Google Scholar] [CrossRef]
  35. Stephan, M.P.; Oliveira, M.; Teixeira, K.R.S.; Martinez-Drets, G.; Döbereiner, J. Physiology and dinitrogen fixation of Acetobacter diazotrophicus. FEMS Microbiol. Lett. 1991, 77, 67–72. [Google Scholar] [CrossRef]
  36. Plackett, R.L.; Burman, J.P. The design of optimum multifactorial experiments. Biometrika 1946, 33, 305–325. [Google Scholar] [CrossRef]
  37. Feng, Y.; Li, W.; Wu, X.; Cheng, J.; Ma, S. Statistical optimization of media for mycelial growth and exo-polysaccharide production by Lentinus edodes and a kinetic model study of two growth morphologies. Biochem. Eng. J. 2010, 49, 104–112. [Google Scholar] [CrossRef]
  38. Herbert, D.; Phipps, P.J.; Strange, R.E. Chemical analysis of microbial cells. In Methods in Microbiology; Norris, J.R., Ribbons, D.W., Eds.; Academic Press: New York, NY, USA, 1971; pp. 265–272. [Google Scholar]
  39. DuBois, M.; Gilles, K.; Hamilton, J.; Rebers, P.; Smith, F. Colorimetric method for determination of sugars and related substances. Anal. Chem. 1956, 28, 350–356. [Google Scholar] [CrossRef]
  40. Wheaterburn, M.W. Phenol hypoclorite reaction determination of ammonia. Anal. Chem. 1967, 39, 971–974. [Google Scholar] [CrossRef]
  41. Lara, C.; Villalba, M.; Oviedo, L. Non-symbiotic bacterial diazotrophs from agricultural crops of San Carlos. Córdoba, Colombia. Rev. Colomb. Biotecnol. 2007, 9, 6–14. [Google Scholar]
  42. Poschet, F.; Vereecken, K.; Geeraerd, A.; Nicolaï, B.; Van Impe, J. Analysis of a novel class of predictive microbial growth models and application to coculture growth. Int. J. Food Microbiol. 2005, 100, 107–124. [Google Scholar] [CrossRef] [PubMed]
  43. Belfares, L.; Perrier, M.; Ramsay, B.A.; Ramsay, J.A.; Jolicoeur, M.; Chavarie, C. Multi-inhibition kinetic model for the growth of Alcaligenes eutrophus. Can. J. Microbiol. 1995, 41, 249–256. [Google Scholar] [CrossRef]
  44. de Andrade, R.R.; Maugeri Filho, F.; Maciel Filho, R.; da Costa, A.C. Kinetics of ethanol production from sugarcane bagasse enzymatic hydrolysate concentrated with molasses under cell recycle. Bioresour. Technol. 2013, 130, 351–359. [Google Scholar] [CrossRef]
  45. Cañete-Rodríguez, A.; Santos-Dueñas, I.; Jimenez-Hornero, J.; Torija-Martinez, M.; Mas, A.; García-García, I. An approach for estimating the maximum specific growth rate of Gluconobacter japonicus in strawberry purée without cell concentration data. Biochem. Eng. J. 2016, 105, 314–320. [Google Scholar] [CrossRef]
  46. Gordeeva, Y.L.; Rudakovskaya, E.; Gordeeva, E.; Borodkin, A. Mathematical modeling of biotechnological process of lactic acid production by batch fermentation: A review. Theor. Found. Chem. Eng. 2017, 51, 282–298. [Google Scholar] [CrossRef]
  47. Antwi, M.; Theys, T.; Bernaerts, K.; Van Impe, J.; Geeraerd, A. Validation of a model for growth of Lactococcus lactis and Listeria innocua in a structured gel system: Effect of monopotassium phosphate. Int. J. Food Microbiol. 2008, 125, 320–329. [Google Scholar] [CrossRef]
  48. Vereecken, K.; Devlieghere, F.; Bockstaele, A.; Debevere, J.; Van Impe, J. A model for lactic acid-induced inhibition of Yersinia enterocolitica in mono-and coculture with Lactobacillus sakei. Food Microbiol. 2003, 20, 701–713. [Google Scholar] [CrossRef]
  49. Luedeking, R.; Piret, E.L. A kinetic study of the lactic acid fermentation. Batch process at controlled pH. J. Biochem. Microbiol. Technol. Eng. 1959, 1, 393–412. [Google Scholar] [CrossRef]
  50. Cangussu, A.S.R.; Cruz, P.A.; Aguiar, R.W.S.; Santos, G.R.; Campos, F.S.; Sobrinho, E.M.; Brandi, I.V.; Viana, K.F.; Nogueira, P.A.; Passos, F.J. Prediction of fermentative parameters from mathematical modeling using thermotolerant probiotic yeast. Bioresour. Technol. Rep. 2020, 11, 100522. [Google Scholar] [CrossRef]
  51. De Bhowmick, G.; Sen, R.; Sarmah, A.K. Analysis of growth and intracellular product synthesis dynamics of a microalga cultivated in wastewater cocktail as medium. Biochem. Eng. J. 2019, 149, 107253. [Google Scholar] [CrossRef]
  52. Sanjay, K.; Anand, A.P.; Veeranki, V.D.; Kannan, P. Kinetics of growth on dual substrates, production of novel glutaminase-free L-asparaginase and substrates utilization by Pectobacterium carotovorum MTCC 1428 in a batch bioreactor. Korean J. Chem. Eng. 2017, 34, 118–126. [Google Scholar] [CrossRef]
  53. Motulsky, H.; Christopoulos, A. Fitting Models to Biological Data Using Linear and Nonlinear Regression: A Practical Guide to Curve Fitting; Oxford University Press: Oxford, UK, 2004. [Google Scholar]
  54. Akkermans, S.; Van Impe, J.F. Mechanistic modelling of the inhibitory effect of pH on microbial growth. Food Microbiol. 2018, 72, 214–219. [Google Scholar] [CrossRef]
  55. Baty, F.; Delignette-Muller, M.-L. Estimating the bacterial lag time: Which model, which precision? Int. J. Food Microbiol. 2004, 91, 261–277. [Google Scholar] [CrossRef]
  56. Donaldson, J.R.; Schnabel, R.B. Computational experience with confidence regions and confidence intervals for nonlinear least squares. Technometrics 1987, 29, 67–82. [Google Scholar] [CrossRef]
  57. Åström, K.; Wittenmark, B. Adaptive Control. Reading ea; Addison Wesley Publishing Comp: Boston, MA, USA, 1995. [Google Scholar]
  58. Flores-Encarnación, M.; Contreras-Zentella, M.; Soto-Urzua, L.; Aguilar, G.; Baca, B.; Escamilla, J. The respiratory system and diazotrophic activity of Acetobacter diazotrophicus PAL5. J. Bacteriol. 1999, 181, 6987–6995. [Google Scholar] [CrossRef]
  59. Stephan, M.P.; Teixeira, K.R.S.; Döbereiner, J. Nitrogen fixation physiology of Acetobacter nitrocaptans: Effect of oxygen, pH and carbon source on respiration and nitrogenase activity. In Proceedings of the 7th International Congress on Nitrogen Fixation; Nitrogen Fixation: Hundred years after, Cologne, Germany, 13–20 March 1988; p. 207. [Google Scholar]
  60. Bashan, Y.; Kamnev, A.A.; de-Bashan, L.E. Tricalcium phosphate is inappropriate as a universal selection factor for isolating and testing phosphate-solubilizing bacteria that enhance plant growth: A proposal for an alternative procedure. Biol. Fertil. Soils 2013, 49, 465–479. [Google Scholar] [CrossRef]
  61. Pizarro, O. Obtención de condiciones de elaboración de vinagre de arándanos (Vaccinium corymbosum) utilizando torta de prensa Ingeniería de Alimentos. In Escuela de Ingeniería de Alimentos; Universidad Austral de Chile: Valdivia, Spain, 2005; p. 81. [Google Scholar]
  62. Meneses, C.; Vassoler, R.; Rouws, L.; de Araújo, J.; Soares, M.; Baldani, J.I. Produção e Quantificação de Exopolissaccarídeos Sintetizados por Gluconacetobacter Diazotrophicus PAL5 em meio de cultivo líquido; Comunicado Técnico; Embrapa: Seropedica, RJ, USA, 2009; pp. 1–6. [Google Scholar]
  63. Rodrigues, E.P.; Coelho, M.S.; Soares, C.d.P.; Vidal, M.S.; Araújo, J.L.; Baldani, J.I. Identificação e Quantificação de Compostos Indólicos no Sobrenadante de Gluconacetobacter Diazotrophicus, Cultivada em Meio Liquido, por Cromatografia Líquida de Alta Eficiência (HPLC). 2009. Available online: https://www.embrapa.br/busca-de-publicacoes/-/publicacao/664190/identificacao-e-quantificacao-de-compostos-indolicos-no-sobrenadante-de-gluconacetobacter-diazotrophicus-cultivada-em-meio-liquido-por-cromatografia-liquida-de-alta-eficiencia-hplc (accessed on 7 June 2023).
  64. Balannec, B.; Bouguettoucha, A.; Amrane, A. Unstructured model for batch cultures without pH control of Lactobacillus helveticus—Inhibitory effect of the undissociated lactic acid. Biochem. Eng. J. 2007, 35, 289–294. [Google Scholar] [CrossRef]
  65. Ellouze, M.; Pichaud, M.; Bonaiti, C.; Coroller, L.; Couvert, O.; Thuault, D.; Vaillant, R. Modelling pH evolution and lactic acid production in the growth medium of a lactic acid bacterium: Application to set a biological TTI. Int. J. Food Microbiol. 2008, 128, 101–107. [Google Scholar] [CrossRef] [PubMed]
  66. Alkamil, E.H.; Al-Dabooni, S.; Abbas, A.K.; Flori, R.; Wunsch II, D.C. Learning from experience: An automatic pH neutralization system using hybrid fuzzy system and neural network. Procedia Comput. Sci. 2018, 140, 206–215. [Google Scholar] [CrossRef]
  67. Ebrahimpour, M.; Yu, W.; Young, B. Artificial neural network modelling for cream cheese fermentation pH prediction at lab and industrial scales. Food Bioprod. Process. 2021, 126, 81–89. [Google Scholar] [CrossRef]
  68. Wright, R.A.; Kravaris, C. Nonlinear control of pH processes using the strong acid equivalent. Ind. Eng. Chem. Res. 1991, 30, 1561–1572. [Google Scholar] [CrossRef]
  69. Birol, G.; Ündey, C.; Cinar, A. A modular simulation package for fed-batch fermentation: Penicillin production. Comput. Chem. Eng. 2002, 26, 1553–1565. [Google Scholar] [CrossRef]
  70. Henson, M.A.; Seborg, D.E. Adaptive nonlinear control of a pH neutralization process. IEEE Trans. Control. Syst. Technol. 1994, 2, 169–182. [Google Scholar] [CrossRef]
  71. Antwi, M.; Bernaerts, K.; Van Impe, J.; Geeraerd, A.H. Modelling the combined effects of structured food model system and lactic acid on Listeria innocua and Lactococcus lactis growth in mono-and coculture. Int. J. Food Microbiol. 2007, 120, 71–84. [Google Scholar] [CrossRef]
Figure 1. Time profile of G. diazotrophicus ATCC 49037 growth (a) and correlation between biomass concentration measured by dry weight and optical density (b). Cells were grown on LGI-P medium in 500 mL flasks at 150 rpm and 30 °C. The optical density of the initial inoculum was 1.0, corresponding to about 108 cells/mL. OD: optical density at 600 nm; X: biomass concentration measured by dry weight. Graphs built by using MS Excel (Microsoft Corporation, Redmon, IL, USA).
Fermentation 09 00705 g001
Figure 2. Production of G. diazotrophicus ATCC 49037 biomass for different sucrose concentrations in the culture medium. Biomass concentration values are the mean of 10 replicates. Standard deviations of the ten replicates are shown as vertical error bars. X: cell biomass concentration. Graph built by using MS Excel (Microsoft Corporation, Redmon, IL, USA); statistical package used to analyze the obtained data: Statgraphics® (Statpoint Technologies, Warrenton, VA, USA).
Fermentation 09 00705 g002
Figure 3. Time profile of substrate, cell biomass, and ammonium nitrogen concentrations (a) and pH (b) in the culture medium during batch submerged cultivation of G. diazotrophicus ATCC 49037 in a 3 L stirred-tank bioreactor. AN: ammonium nitrogen; TC: total carbohydrates; X: cell biomass. Values of biomass and ammonium nitrogen concentrations are multiplied by 10. Graphs built using Matlab (The MathWorks Inc., Natick, MA, USA).
Fermentation 09 00705 g003
Figure 4. Results of the first modeling approach for the kinetics of G. diazotrophicus batch cultivation. Experimental data are represented by filled circles; the solid line is calculated by the model proposed. Graph built using Matlab (The MathWorks Inc., Natick, MA, USA).
Fermentation 09 00705 g004
Figure 5. Fitting of the hydrogen models for the kinetics of G. diazotrophicus batch cultivation. Experimental data are represented by filled circles; the solid lines are calculated by the model proposed. (a) Effect of biomass concentration (X) on the concentration of hydrogen ions [H+], with fitting using linear hydrogen model (Equation (21)). (b) Effect of I x = t o t X d t on the concentration of hydrogen ions, with fitting using a nonlinear hydrogen model (Equation (22). (c) Time course of the concentration of hydrogen ions, with fitting using both hydrogen models. Graphs built using Matlab (The MathWorks Inc., Natick, MA, USA).
Fermentation 09 00705 g005
Figure 6. Comparison of the results of the first and second modeling approaches for the kinetics of G. diazotrophicus batch fermentation. Experimental data are represented by filled circles; the solid and dashed lines are calculated by the model proposed. The second approach involves the linear hydrogen model (Equation (21)) and a nonlinear hydrogen model (Equation (22)). Graph built using Matlab (The MathWorks Inc., Natick, MA, USA).
Fermentation 09 00705 g006
Table 1. Composition of LGI-P culture medium.
N.ComponentAmount for 1 LConcentration (g/L)
1White sugar100 g100
2K2HPO4 (10% solution)2 mL0.02
3KH2PO4 (10% solution)6 mL0.06
4MgSO4·7H2O (10% solution)2 mL0.02
5CaCl2·2H2O (1% solution)2 mL0.002
6Na2MoO4·2H2O (0,1% solution)2 mL0.0002
7FeCl3·6H2O (1% solution)1 mL0.001
8(NH4)2SO41 g1
Table 2. Definition of variables and their levels for the Plackett–Burman design.
Coded FactorFactorExperimental Range (g/L)
Low Level (−1)High Level (+1)
Z1Sucrose70130
Z2K2HPO40.0050.035
Z3KH2PO40.0450.075
Z4MgSO4·7H2O0.0050.035
Z5CaCl2·2H2O0.00050.0035
Z6Na2MoO4·2H2O0.000050.00035
Z7FeCl3·6H2O0.00010.0019
Z8(NH4)2SO40.11.9
Z9–Z11Dummy factors--
Table 3. Plackett–Burman design matrix with biomass as the response.
N.Coded FactorsBiomass
(g/L) 1
Standard Deviation
Z1Z2Z3Z4Z5Z6Z7Z8Z9Z10Z11
1+1−1+1+1+1+1+1−1−1−1−10.830.20
2+1+1−1+1−1+1−1+1−1+1−11.080.32
3−1+1+1−1−1+1+1+1−1−1+11.100.23
4−1+1+1+1+1−1−1−1−1+1+11.170.11
5−1−1+1−1+1+1−1+1+1+1−11.100.04
6−1−1−1+1−1+1+1−1+1+1+11.420.63
7+1−1+1+1−1−1−1+1+1−1+11.110.20
8−1+1−1+1+1−1+1+1+1−1−11.280.19
9−1−1−1−1−1−1−1−1−1−1−11.320.22
10+1+1−1−1+1+1−1−1+1−1+11.350.43
11+1+1+1−1−1−1+1−1+1+1−11.150.17
12+1−1−1−1+1−1+1+1−1+1+11.190.24
1 Mean of three replicates.
Table 4. Analysis of variance of the results of Plackett–Burman design.
SourceChi-SquaredDegrees of Freedomt-ValueMean Squared Deviationp-Value
Z11.37072312.0322457.0970780.2416877
Z20.27259312.0322457.2120220.6015979
Z32.60427412.0322456.9656990.1065760
Z41.26183612.0322457.1085590.2613038
Z50.00225312.0322457.2400390.9621434
Z61.76622012.0322457.0552220.1838505
Z70.36145412.0322457.2027880.5476996
Z80.01226512.0322457.2390030.9118151
Table 5. Estimated differences between treatments.
ContrastDifference+/− LimitsLower LimitHigher Limit
15–30−0.226010.132147−0.358157−0.093863
15–60−0.142680.132147−0.274827−0.010533
30–750.324330.1321470.1921830.456477
30–900.136340.1321470.0041930.268487
30–1050.313330.1321470.1811830.445477
30–1200.352670.1321470.2205230.484817
30–1350.297010.1321470.1648630.429157
30–1500.1870.1321470.0548530.319147
45–750.206990.1321470.0748430.339137
45–1050.195990.1321470.0638430.328137
45–1200.235330.1321470.1031830.367477
45–1350.179670.1321470.0475230.311817
60–750.2410.1321470.1088530.373147
60–1050.230.1321470.0978530.362147
60–1200.269340.1321470.1371930.401487
60–1350.213680.1321470.0815330.345827
75–90−0.187990.132147−0.320137−0.055843
75–150−0.137330.132147−0.269477−0.005183
90–1050.176990.1321470.0448430.309137
90–1200.216330.1321470.0841830.348477
90–1350.160670.1321470.0285230.292817
120–150−0.165670.132147−0.297817−0.033523
Table 6. Estimated parameters with the width of the 95% confidence interval.
Modeling Approach and ModelParameter and R2Value
First modeling approach; biomass model (1) and µ model (20)µmax0.0093 ± 0.0017 h−1
Xmax0.3578 ± 0.0503 g/L
R2 (for biomass concentration over time)0.9364
Second modeling approach; hydrogen model (21)θ10.0665 ± 0.0093
θ2158.5 ± 9.1
R2 (for H+ concentration as a function of biomass concentration)0.9841
Second modeling approach; hydrogen model (22)θ29,449,609 ± 1,652,515
R2 (for H+ concentration as a function of the integral of biomass concentration)0.9811
Second modeling approach; biomass model (1) and µ model (23), with [H+] provided by the hydrogen model (21)µmax0.0076 ± 0.0012 h−1
Hmax0.00184 ± 0.00032 mol/L (corresponds to pHmin = 2.735)
R2 (for biomass concentration over time)0.9364
Second modeling approach; biomass model (1) and µ model (23), with [H+] provided by the hydrogen model (22)µmax0.0078 ± 0.0010 h−1
Hmax0.00181 ± 0.00027 mol/L
R2 (for biomass concentration over time)0.9357
Disclaimer/Publisher’s Note: The statements, opinions and data contained in all publications are solely those of the individual author(s) and contributor(s) and not of MDPI and/or the editor(s). MDPI and/or the editor(s) disclaim responsibility for any injury to people or property resulting from any ideas, methods, instructions or products referred to in the content.

