Article

Optimization of Wheat Straw Conversion into Microbial Lipids by Lipomyces tetrasporus DSM 70314 from Bench to Pilot Scale

1
Italian National Agency for New Technologies, Energy and Sustainable Economic Development (ENEA), Laboratory for Processes and Technologies for Biorefineries and Green Chemistry, ENEA C.R. Trisaia S.S. 106 Jonica, 75026 Rotondella (MT), Italy
2
School of Agricultural, Forest, Food and Environmental Sciences, University of Basilicata, Viale dell’Ateneo Lucano 10, 85100 Potenza, Italy
*
Authors to whom correspondence should be addressed.
Fermentation 2023, 9(2), 180; https://doi.org/10.3390/fermentation9020180
Submission received: 12 November 2022 / Revised: 11 January 2023 / Accepted: 10 February 2023 / Published: 16 February 2023
(This article belongs to the Special Issue Recent Trend in Biofuel Fermentation from Renewable Biomass)

Abstract

:
Microbial lipids are renewable platforms for several applications including biofuels, green chemicals, and nutraceuticals that can be produced from several residual carbon sources. Lignocellulosic biomasses are abundant raw materials for the production of second-generation sugars with conversion yields depending on the quality of the hydrolysates and the metabolic efficiency of the microorganisms. In the present work, wheat straw pre-treated by steam explosion and enzymatically hydrolysed was converted into microbial lipids by Lipomyces tetrasporus DSM 70314. The preliminary optimization of the enzymatic hydrolysis was performed at the bench scale through the response surface methodology (RSM). The fermentation medium and set-up were optimized in terms of the nitrogen (N) source and carbon-to-nitrogen (C/N) ratio yielding to the selection of soy flour as a N source and C/N ratio of 160. The bench scale settings were scaled-up and further optimized at the 10 L-scale and finally at the 50 L pilot scale bioreactor. Process optimization also included oxygen supply strategies. Under optimized conditions, a lipid concentration of 14.8 gL−1 was achieved corresponding to a 23.1% w/w lipid yield and 67.4% w/w lipid cell content. Oleic acid was the most abundant fatty acid with a percentage of 57%. The overall process mass balance was assessed for the production of biodiesel from wheat straw.

Graphical Abstract

1. Introduction

The environmental impact resulting from human activity combined with the extraction and intensive use of fossil resources has led to a significant increase in the greenhouse gas concentration in the atmosphere with direct consequences on global warming and air pollution [1]. In response to this situation, there is a global effort to develop novel technologies and processes for greener products [2]. Biorefineries, namely, technological platforms able to convert primary and residual biomass into a spectrum of marketable products and energy, are expected to develop more sustainable production systems in the future. To accelerate the transition toward a biobased economy, it is necessary to make biorefining systems efficient and economically viable. One of the most consolidated biorefinery processes over time is the production of biodiesel and biofuels from vegetable oils. Depending on the raw material, the value chain based on vegetable oils has been identified to have environmental implications due, for instance, to the intensive cultivation of oil crops that has stimulated many regulatory initiatives to discourage the use of some vegetable oils for biofuel production [3]. An alternative to vegetable oils is represented by microbial lipids produced by many oleaginous microorganisms [4]. Microbial oils have many advantages over vegetable ones. They are not subject to seasonality, have short production times, require less space and workforce, and above all, they do not compete with the food industry. Furthermore, they can be produced from many carbon sources and this increases the biorefinery’s versatility and stability. For all these reasons, microbial oils represent a renewable and sustainable alternative to vegetable oils to be used as feedstock for the production of biofuels and biochemicals [5].
Microorganisms able to accumulate microbial lipids include different varieties of microbial genera including bacteria, yeasts, algae, and fungi. Among these, oleaginous yeasts are of particular industrial interest as they showed rapid growth, the versatility of using a wide variety of raw materials and ease of cultivation in large fermenters. The most studied genera include Yarrowia, Rhodotorula (Rhodosporidium), Lipomyces, Cryptococcus, and Trichosporon [5]. These yeasts can accumulate oils up to 70% of their dry cell weight, under conditions of excess carbon source and nitrogen starvation. Among the various yeast genera, the selection of Lipomyces was due to its ability to grow on many carbon sources and produce lipids at high titers. It belongs to the Lipomycetaceae family, order Saccharomycetales, phylum Ascomycota. Among the 16 species accepted as part of the Lipomyces genus, L. tetrasporus is a relatively new and less studied species, although in previous works, it has shown interesting growth and lipid accumulation capabilities on low-cost substrates [6,7,8].
The lipid accumulating mechanism is well-known [5,9] and currently, the main scientific efforts are focused on enhancing the yield and productivity from a low-value substrate. The main factor that makes the production of microbial lipids expensive is the carbon source which can represent up to 30% of the final cost [10].
Wastes and residues with the potential of lowering the microbial lipid production costs include molasses [11], food waste [12], waste cooking oils [13,14], olive mill wastewater [15], industrial wastes [16], glycerol [17], and lignocellulosic biomass [18]. Among these, lignocellulosic biomass has attracted industrial attention due to its versatility and high availability. For example, wheat straw (WS) is one of the most widespread and abundant feedstocks across the world; furthermore, it is less suitable for thermal conversion processes due to the high inorganic contents [19]. Hence, the use of WS as a carbon source for oleaginous yeasts could be an option to improve the economic feasibility of the microbial lipids. Due to the high recalcitrance of lignocellulosic biomass, pre-treatment is required to facilitate the enzymatic hydrolysis and produce fermentable carbohydrates. In the production of sugars, the efficiency of the enzymatic processes has a key role in determining the economic and environmental sustainability of the process. Productive processes require biomass suitably pre-treated, a high biomass loading with an over 20% solid-to-liquid ratio, stable enzymes, and optimized cocktails [20]. The current cost of the enzymes is in the range of 2–3 €/kg PROTEIN [21], namely, two-fold lower than it was 10–20 years ago [22], but optimized processes reducing the amount of enzymes are still the key to making the process feasible. Many pre-treatment processes were developed to improve the enzymatic digestibility, and some reached the industrial scale [23]. In the present investigation, steam explosion at medium severity was used for the biomass pre-treatment. It is one of the most effective processes yielding high depolymerization with producing low biomass degradation [24]. With the scope of optimizing the hydrolysis process, the response surface methodology (RSM) has been used. It is a statistical technique that could provide an effective optimization of the main factors affecting the enzymatic hydrolysis phase. With fewer experimental trials, without losing the significant statistical degree, the optimal process conditions can be found by interpolation by first or second-polynomial equations in a sequential testing procedure. The RSM approach has been successfully applied for the optimization of the enzymatic hydrolysis of several raw materials, e.g., sweet sorghum bagasse [25], date seeds [26], and corn and rice straw [27].
A crucial factor for improving the microbial lipid productivity and consequently the economic feasibility of the overall process is nitrogen. Nitrogen is essential in the initial growth phase for cell division and the growth of cell mass; subsequently, its absence is crucial for triggering the switch of the yeast metabolism from cell growth to the lipogenic phase. It was demonstrated that low nitrogen (N) and a high carbon-to-nitrogen (C/N) ratio led to lipid accumulation. Identifying the most suitable C/N range, ensuring an initial cell mass growth and subsequently a good lipid production, is necessary for improving the process yields.
In the present study, undetoxified wheat straw hydrolysates were used as a growth medium for L. tetrasporus DSM 70314. Three different N sources (yeast extract, urea, and soy flour) with five different C/N ratios, 40, 80, 120, 160, and 200, were investigated. The optimized process was scaled at a 10 L bioreactor and subsequently, at a 50 L pilot scale bioreactor. Finally, a mass balance of the optimized biorefinery process was defined. The main novelty of the present paper lies in the multistep process optimization and the scaling of the fermentation processes at a pilot scale with the assessment of the overall process mass balance.

2. Materials and Methods

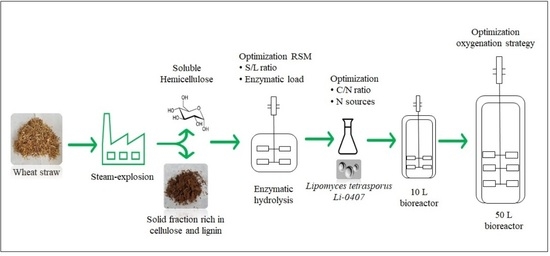
2.1. Feedstock Characterization

The wheat straw was collected from agricultural sites in Southern Italy. Prior to the pre-treatment, the biomass had a dry matter content of 91.9 ± 0.2%. After grinding at 50 mesh, air-dried wheat straw was analysed for extractives [28] and for carbohydrate, lignin, and ash content (Table 1) in accordance with the NREL procedures [29]. The sugar analysis was performed with a High-Performance Ionic Chromatography (HIPC) (DIONEX ICS2500, (Dionex, Thermo Scientific, Waltham, MA, USA) system equipped with a Nucleogel Ion 300 OA operating at 60 °C with 10 mN H2SO4 solution as a mobile phase (0.4 mL min−1). The detector was a Shodex RI101 refractive index. Each analysis was carried out in duplicate. Ash content was measured by heating a sample to 575 °C and held isothermally for 24 h [29]. Elemental analysis was carried out in a VARIO MACRO CUBE CHN/O system (Elementar Analysensysteme GmbH, Langenselbold, Germany). The overall feedstock composition is similar to that used by Chen et al. [30].

2.2. Feedstock and Pre-Treatment

The steam explosion batch technology (Staketech, 10 L reactor) was used for the biomass pre-treatment according to set-up conditions previously optimized [31]. In particular, before the pre-treatment, biomass was crumbled to particle size in the range of 1.7–5.6 mm and was soaked in a dilute H2SO4 solution (0.05 M) for 10 min in 10% s/L (w/v) suspension. The resulting acid load on raw material was measured following titration of the impregnation liquid and was found to be 1.4% (w/w). The pre-treatment was carried out at 203 °C for 5 min similarly to process parameters optimized by other authors [32,33]. The pre-treated product was filtered to separate the solids from the soluble fraction. The composition of the pre-treated product consisted of a solid fraction rich in cellulose and lignin, and a liquid fraction containing soluble hemicellulose. Due to the steam condensation, biomass after the pre-treatment had a high moisture content. It was then squeezed to separate the solids and after that remixed up to achieve the target solids concentration of 20% for the enzymatic hydrolysis process.

2.3. Optimization of the Enzymatic Hydrolysis Process

Response surface methodology (RSM), based on a 3-level 2-factor Central Composite Design (CCD) was assessed to investigate the influence of solids loading and the amount of the enzyme on the hydrolysability of ACSEWS (acid-catalysed steam-exploded wheat straw). Two independent variables were chosen, solid content and enzyme loading. The solid content was investigated from 15 to 25% while the enzyme load was explored from 10 to 20 FPU (filter paper unit) per gram of cellulose. Enzymatic hydrolysis was carried out with a commercial blend called Cellic™ CTec2, kindly provided by Novozymes (Denmark). The lab-scale trials were carried out in 250 mL flasks at pH 4.8, 50 °C, and were mixed at 180 rpm. After sampling, the temperature was then raised to 100 °C for a few minutes to denature the enzymatic proteins. The exhaust solids were then removed by filtration. The hydrolysis process time was set at 72 h for all tested parameter combinations.
Using Design of Experiment (DoE) statistical software, 11 experiments including 3 center points were set. The analysis of the variance (ANOVA) was utilized for the investigation of model validation. A second-order polynomial regression model (Equation (1)) was constructed from the analysis of the experimental data (α = 0.05), and was applied to generate response surface and contour plot graphs:
Y = β0 + β1A + β2B + β11A2 + β22B2 + β12AB
where Y is the measured response associated with each combination of factor levels, A and B are independent variables coded for levels, β0 is an intercept, β1 and β2 are the linear regression coefficients derived from experimental runs, b11 and b22 are the quadratic coefficients, and b12 is a cross-product coefficient.
The final validation test was carried out in 10 L stirred bioreactor (Braun Biotech International, Melsungen, Germany) equipped with a helical impeller. Hydrolysate obtained (WSH) was then added with a solution of nutrients, centrifugated (8000 RPM) to eliminate suspended solid and sterilized through membrane filtration (0.22 µm). The sterilized solution was used for the fermentative processes.

2.4. Analytical Methods for Medium Characterization

The sugars and organic acids analysis was performed as described in paragraph 2.1. The inhibitory compounds were quantified using the HP1100 system (Agilent technologies, Santa Clara, CA, USA) equipped with an RP18 5 µm column LiChroCart, 250 × 4 mm column, operating at 50 °C with Milli-Q-water/acetonitrile as mobile phase (1 mL min−1) and a diode array detector. Quantification was carried out at two different wavelengths, 210 and 280 nm. Phenolic compounds were estimated by the Folin test [34]. Briefly, 2 mL of the sample were added to 10 mL of Folin reagent (dilution ratio 1:10) and 8 mL of 75 gL−1 Na2CO3, and distilled water was added to obtain a total volume equal to 20 mL. The reaction mixture was maintained at room temperature for 2 h and then OD was measured at 765 nm. Vanillin (Sigma-Aldrich, St Louis, MO, USA) was used as a standard for the estimation of the content of total phenolic-derived compounds.

2.5. Strain Cultivation

Lipomyces tetrasporus DSM 70314, (DSMZ, Braunschweig, Germany) was purchased by the Leibniz Institute DSMZ-German Collection of Microorganisms and Cell Cultures. Stock cultures were maintained in YPD agar plates at 4 °C and transferred to fresh agar plates weekly. For preculturing step, a single colony was transferred in a 500 mL Erlenmeyer flask with 100 mL of YPD broth, containing 10 gL−1 yeast extract, 20 gL−1 peptones, and 20 gL−1 dextrose (Oxoid, Hampshire, UK), and cultured at 27 °C and 200 rpm for 120 h [6]. After incubation, the wet cells were recovered, quantified, and inoculated with a precise volume of the cell suspension to obtain the cell concentration of 2 ∗ 106 CFU mL−1. All media were sterilized by autoclave (121 °C, 20 min) before inoculation.

2.6. Fermentation Set-Up in Bench Scale

Lipomyces tetrasporus was grown on a hydrolysate mixed with hemicellulose in the ratio 1: 2 (WSH/HEM), using 3 different N sources (urea, yeast extract, and soy flour) and five different C/N ratios (40, 80, 120, 160, and 200). The medium was added with trace elements, namely, MgSO4•7H2O 1.5 gL−1, MnSO4•H2O 0.004 gL−1, CuSO4•5H2O 0.001 gL−1, KH2PO4 2 gL−1, Na2HPO4 0.3 gL−1, and ZnSO4 0.04 gL−1. The pH was set at 5.5 and was not adjusted through the fermentation. Temperature and stirring were set at 27 °C and 200 rpm, respectively, in all the tests. All tests are conducted in triplicate. Data of yeast performance in bench scale were analysed by one- and two-way analysis of variance (ANOVA). Levene’s test (p < 0.05) was used to verify the variance homogeneity. Tukey’s test was used to compare the mean values between different conditions. The software used for the statistical analyses was PAST ver. 3.26 [35].

2.7. Fermentation in 10 L Bioreactor

Fermentation tests were performed in 10 L stirred tank bioreactor equipped with two Rushton impellers, with a working volume of 8 L. The temperature was maintained at 27 °C and the pH was set at 5.5 and controlled by the automatic addition of NaOH solution 4N. Agitation was automatically varied to ensure, together with the airflow (1.5 vvm), a dissolved oxygen concentration of at least above 40% of the maximum water solubility value.
The initial working volume (WSH/HEM) was 7000 mL, increased subsequently to 7500 mL, and then 8000 mL after the addition of two feeds of 500 mL. WSH, for fed-batch feeding, was concentrated in a laboratory vacuum system at 7 kPa, 180 rpm, and 60 °C for 5 h to ensure the same sugars in the feed.

2.8. Fermentation in 50 L Bioreactor

The pilot scale fermentation tests were carried out in a 50 L stirred tank bioreactor equipped with three Rushton impellers, with a total volume of 72 L, and a working volume of 50 L. The initial volume was 31.5 L (21.5 L WSH + 10 L HEM), which increased subsequently to 46.2 L, with the addition of 15.2 L WSH. The dissolved oxygen concentration was set at 40% for the initial growth phase, and at 25% after the feeding phase. The dissolved oxygen concentration was maintained by airflow (1.0 vvm), and automatically changing the stirring speed (max 250 rpm). The pH was set at 5.5 and it was maintained at that value by the automatic addition of NaOH solution 4N.

2.9. Lipid Extraction

Lipid extraction was performed using the protocol described previously [6]. Briefly, L. tetrasporus cells were harvested, centrifuged at 4862 g per 6 min, and washed twice with distillate water. To promote the cell lysis, about 500 mg of wet cells were suspended in 10 mL HCl 4M and placed in a thermostated water bath and sonicated at 40 °C for 30 min followed by incubation in a freezer at −20 °C for 20 min. This procedure was repeated 3 times. Then, 15 mL of chloroform were added and incubated at room temperature for 2 h under stirring at 180 rpm. After 2 h, the sample was filtered by Whatman glass microfiber filters, grade GF/A, and left to rest overnight. The organic phase was withdrawn with a syringe and evaporated in a rotavapor under a vacuum at 40 °C till constant weight. Finally, the total lipids were gravimetrically quantified.

2.10. Fatty Acid Methyl Esters (FAMEs)

The microbial lipids were transmethylated according to the method reported by Morrison et al. [36]. Briefly, 2 mL of BF3/MeOH (10% w/w) and 1 mL of 2,2-dimethoxypropane were added to total dry lipids and put in a water bath for 60 min at 60 °C. Subsequently, 1 mL of distilled water was added to stop the reaction and 2 mL of heptane were added to extract the FAMEs.
The FAME profiles were determined by GC analyses carried out on Agilent GC7890A gas chromatograph, equipped with HP-INNOVAX 19091N-213 (Agilent technologies, Santa Clara, CA, USA) capillary column (30 m × 0.32 mm × 0.50 μm) and a flame ionization detector. The oven temperature was programmed at 80 °C for 11 min, from 80 °C to 180 °C at a rate of 20 °C/min. and held at 180 °C for 22 min. Helium was the carrier gas at 80 kPa. Split ratio was 1:19 (v/v). Identification of methyl esters was performed by comparing the peak retention times to FAME standards mix, C8–C24 (CRM 18918 Sigma-Aldrich).

3. Results and Discussion

3.1. Biomass Pre-Treatment and Enzymatic Hydrolysis

Pre-treatment through steam explosion has been widely investigated and applied to several feedstocks [37,38,39]. It uses saturated steam to promote autohydrolysis reactions combined with the instantaneous pressure release that disrupts the biomass structure. To avoid high treatment temperatures, the use of small quantities of acids as a catalyst is recommended. Steam pre-treatment of wheat straw was previously optimized by other authors and therefore the process optimization was not included in the present paper [31,40,41,42]. Table 2 describes the composition of the steam-exploded products.
The pre-treatment steps achieved an almost complete solubilization of hemicellulose, namely, 88% xylan, 38% arabinan, and 64% galactan, in the raw material. Glucose and xylose were partially dehydrated to the corresponding furanic compounds whose concentrations were 0.69 gL−1 5-hydroxymethyl-2-furaldehyde (5-HMF) and 0.15 gL−1 furan-2-carbaldehyde (furfural), respectively. The water-insoluble fraction contained around 48% cellulose and 30% lignin.
It was re-suspended in the liquid hemicellulose-rich fraction at the desired solid ratio in the range 15–25% before the enzymatic hydrolysis. The optimized use of the enzymatic mixture is important as it could represent about one-third of the total cost of the sugars [37,43].
The solids load and the enzyme dosage are the main variables affecting the hydrolysis yield. The glucose yields of the RSM experiments set are shown in Table 3.
As expected, the lowest hydrolysis yield was achieved with the highest solids load and the lowest amount of enzyme (Y = 61.3%, run n.5) and the maximum glucose yield was 90.8% (run n.9).
Statistical analysis was performed using ANOVA to validate the statistical model. The p-value of less than 0.05 denotes that a certain coefficient will be considered significant; results were interpreted in Table 4 as significant and not significant. The Model F-value of 117.21 implies the model is significant. There is only a 0.01% chance that an F-value this large could occur due to noise. Values of “Prob > F” less than 0.0500 indicate model terms are significant. In this case, A, B, A2, and B2 are significant model terms. The model was acceptably (p = 0.0001 < 0.05) adequate and reproducible due to both a significant R2 (0.9915) and Adj R2 (0.9831), and insignificant lack of fit (0.1489 > 0.05).
Equation (2) was created from the model describing the interaction among the two variables and the final responses. The Final Equation in Terms of Coded Factors is shown as follows:
Yield = + 86.86 − 6.93 ∗ A + 8.63 ∗ B − 0.53 ∗ AB − 5.29 ∗ A2 -6.39 ∗ B2
The coded equation is useful to identify the relative impact of the factors by comparing the factor coefficients. As expected, an increase in factor A (solid–liquid ratio) implied a reduction of the hydrolysis yields. On the contrary, the increase in the enzymatic load (factor B) favoured a higher hydrolysability yield. The response equation was used to generate the response surface plots and the 3D surface graph in Figure 1.
The optimal conditions to achieve the highest hydrolysis yields appeared at 17% s/L and 15 FPU per gram of cellulose yielding 89% glucose, which is very close to the maximum obtainable in the explored range (90.8%). A further experiment was then carried out to validate this combination of parameters. The control test yielded 87.5 ± 0.6% was obtained. This optimization made it possible to save 25% of the enzymes.
The hydrolysis of wheat straw was already investigated by other authors [40,41,42]. Cellulose conversion yields of wheat straw hydrolysed with Ctec2 enzyme or Celluclast/Novozym188 enzyme mix in a wide range of solids loads from 5% to 30% were studied by Weiss et al. [44]. For Ctec2-treated samples, the cellulose conversion yields remained stable with solids loadings until 18% and after that, they begin to decrease. The cellulose conversion yield at a 20% solid–liquid ratio was around 60%, lower than the results obtained in this study. This was likely due to the use of the acid catalyst in the present study that increased biomass destructuration. The optimization of the various cellulase mixture composition was recently carried out by Du et al. [45] on diluted-acid-pre-treated wheat straw with sulphuric acid at 2% and 20% w/w solid content. The results indicated that high loads of acid-pre-treated wheat straw needs an enzymatic mixture with high cellobiohydrolases activity. The high glucose yield obtained in non-optimal rheological conditions can therefore be explained by the higher cellobiohydrolases activity of Cellic® CTec2 [46].
Undetoxified wheat straw hydrolysates were used as carbon media for the growth and lipid production of L. tetrasporus. In our previous publication on the conversion of cardoon hydrolysates by L. tetrasporus, we demonstrated that the sugar concentration higher than 40 g L−1 in association with degradation by-products negatively affected the growth and lipid production of the yeasts [6]. Taking into account the previous achievements, the mixed hydrolysates for fermentation was diluted with the hemicellulose rich fraction separated from the steam-exploded product. The composition of the various streams is detailed in Table 5.

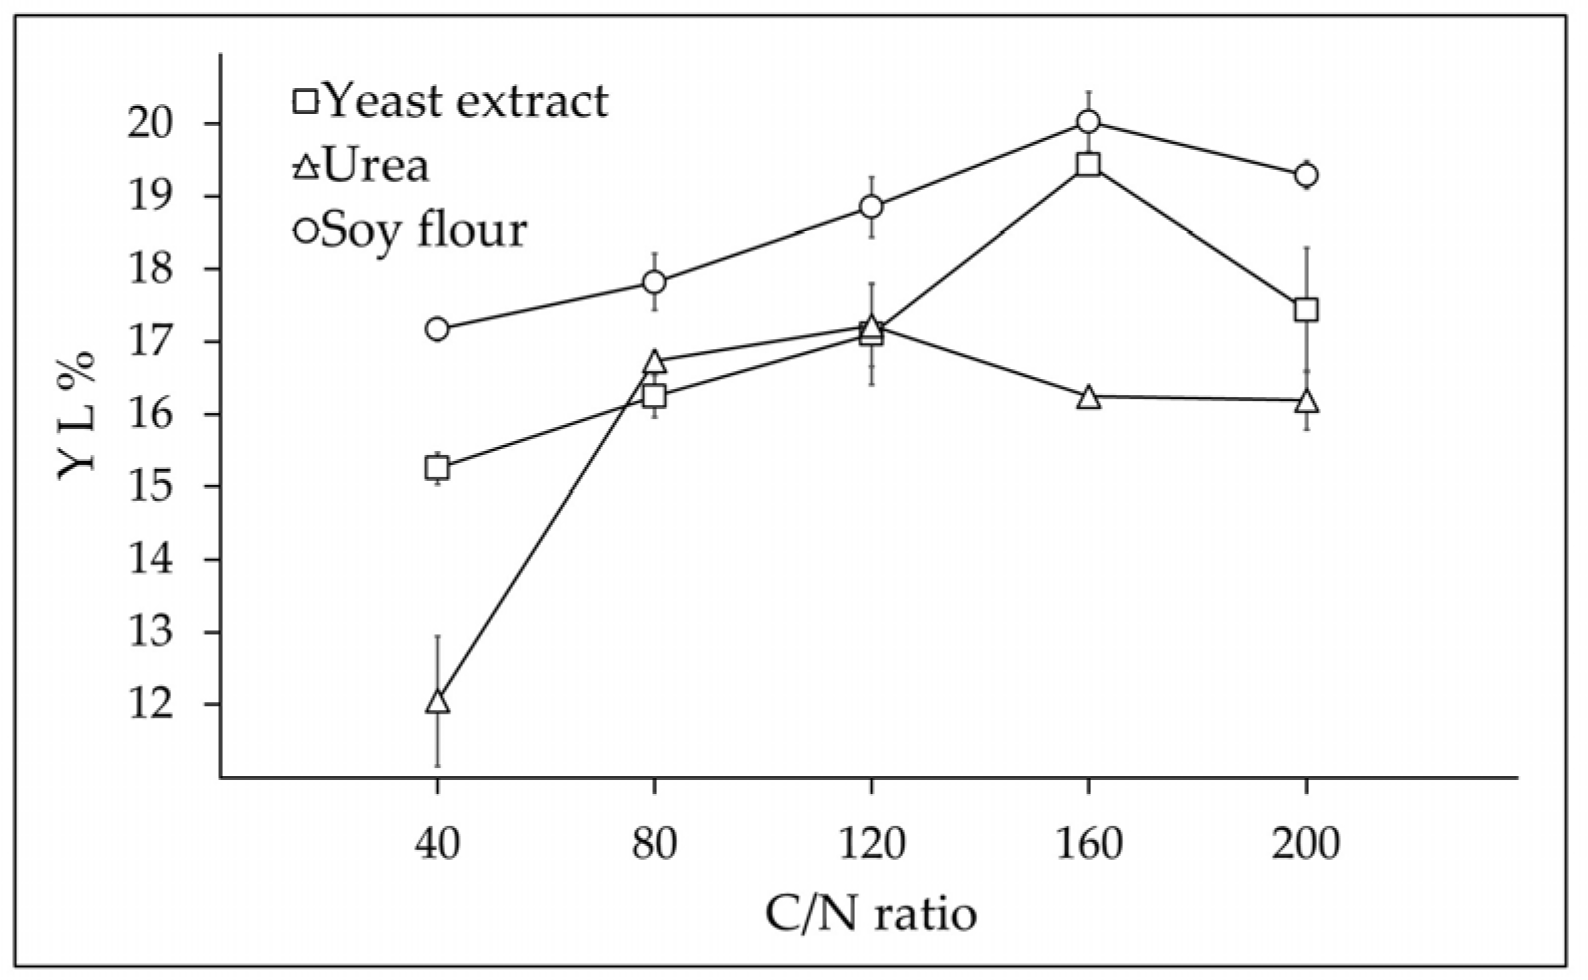
3.2. Optimization of Bench Scale Bioconversion with Three Nitrogen Sources and Five C/N Ratios

The N source and C/N ratio influence the lipid accumulation capability in several microorganisms [47]. Microbial lipid production by L. tetrasporus was scarcely documented in the literature; therefore, the present study investigated innovative and low-cost nitrogen sources at different C/N ratios. Five C/N ratios (40, 80, 120, 160, and 200) and three different organic N sources (yeast extract, soy flour, and urea) were selected. The three N sources were organic substrates, as in previous research which reported that, compared to inorganic salts, organic nitrogen sources are more suitable to trigger the lipid accumulation [48]. Typically, the most widely used nitrogen source for biological processes is yeast extract, but considering the high cost of this source, it was decided to test two additional low-cost nitrogen sources.
Although the nitrogen content in raw wheat straw was 0.20%, it can reasonably be assumed that the amount of soluble nitrogen from biomass was negligible.
The nitrogen content in the raw wheat straw was likely in the form of structural membrane proteins [49]. The steam-explosion process typically causes a partial protein degradation [50]. Biomass nitrogen could form aggregates with lignin or with oligosaccharides through the Maillard reaction [51]. For this reason, even if a detailed analysis of the nitrogen fate in the biomass hydrolysates was not performed, we are assuming that the hydrolysates purification steps through deep centrifugation followed by microfiltration could remove all precipitate proteins.
L. tetrasporus was able to use both soy flour and urea as N sources. According to our previous results [52], when the yeast was inoculated in the stationary phase of growth as in this condition, it displayed a higher resistance toward thermal degradation by-products in the biomass hydrolysates. Under these conditions, the microorganism first detoxified the hydrolysate, mainly by converting 5-HMF and furfural into less toxic products, [5-(hydroxymethyl)furan-2-yl]methanol and (Furan-2-yl)methanol, respectively. The furanic aldehydes were reduced in the first 24 h and no lag phase was observed.
Additional biomass degradation products with a potential inhibition toward the microorganism include vanillic acid, 4-hydroxybenzoic acid, syringaldehyde, and many phenols that resulted in being extremely toxic to many microorganisms of industrial interest [53,54]. In the present study, no aromatic acids or aldehydes were detected in the steam-pre-treated products. Furthermore, the total phenol compounds estimated through the UV measurements (~5 gL−1) were probably mostly available as polyphenols, since no single-ring aromatics were detected in the hydrolysate through the chromatographic analysis. The UV measurements indicated that the estimated phenols concentration remained substantially unchanged over time and this could indicate a weak interaction with the yeast metabolism. In all the trials, the sugar uptake started with glucose consumption after the medium detoxification. When the glucose concentration was reduced by 66%, the uptake of galactose and xylose started. This agrees with previous findings. In particular, it was found that in mixed hydrolysates, the Lipomyces species consumed first glucose (due to the glucose repression mechanism), followed by xylose and other secondary sugars present in the medium [55,56]. Arabinose was not consumed even at a prolonged process time and after the consumption of the major sugars. Unlike this result, other authors [8] documented the ability of L. tetrasporus DSM 70314, grown on switchgrass hydrolysate, to metabolize arabinose. This might be correlated to the arabinose concentration in the medium, which in the switchgrass was about five-fold higher than in wheat straw. Therefore, it is likely that the lack of arabinose uptake was due to its low concentration which did not trigger its transport and consumption. The yeast also consumed acetic acid (approximately 2.3 gL−1) in agreement with previous studies [8] and probably could represent a source of carbon for acetyl-CoA synthesis [57]. The yeast’s tolerance to acetic acid and its capacity to convert it depends both on the microorganism and on the process conditions [58,59]. More in detail, the inhibitory action of acetic acid depends on the concentration of its undissociated form, which is a function of both concentration and pH. At a pH value below 4.8, acetic acid can diffuse into the cell cytoplasm, where it dissociates and lowers the intracellular pH, resulting in uncoupled energy production and the deficient transport of various nutrients along with increased ATP requirements. In addition, the corresponding ATP demand increases with increasing the acid concentration. After the ATP demand exceeds a threshold, the acid significantly inhibits microbial activity because the free energy is diverted from cellular growth causing the cessation of growth or even cell death [60]. In the present study, the process pH was 5.5, corresponding to 90% of acetic in dissociated form, and the yeast can use it as a carbon source to produce the lipids.
The analysis, reported in Table 6, indicates that urea determined the lowest production of cell mass (X) in the range 11.8–13.4 gL−1, corresponding to a cell mass yield (YX) of 26–33% w/w, significantly lower, around 15–20% w/w, than that obtained with Yeast Extract (YE) (p < 0.05). The same difference was also observed for lipid yield (YL), with the lowest value of 12% obtained at U 40. The highest process yields with urea, namely lipid produced (L) and YL value of 7.3 gL−1 and 17%, respectively (54% of the maximum theoretical yield), were obtained at the U 120 test. More interestingly, urea produced an intracellular lipid accumulation at C/N 160 of 62% w/w, corresponding to the highest value obtained among these trials.
Soy flour (S) is an interesting and cheap nitrogen source yielding cell mass and lipids slightly higher than those obtained with YE. The X value was in the range of 15.3–18.3 gL−1, corresponding to values of YX between 36 and 43% w/w. L was in the range of 7.3–8.3 gL−1, YL in the range of 17–20% w/w, and IL/X fell in the range of 40 and 54% w/w. In the best condition, i.e., S 160, the highest lipid yield was 20% w/w, corresponding to 62% of the maximum theoretical yield. Soy flour was confirmed to be an effective nitrogen source for lipid production by L. tetrasporus.
Previous studies reported high levels of products and cell mass through the use of soy flour as a nitrogen source [8,61,62,63]. Soy flour is rich in vitamins, proteins, cofactors, carotenoids, growth factors, and free amino acids, all useful elements to promote the best conditions for cell growth and lipid synthesis. For example, a study showed that the availability of cysteine and pantothenate, elements present in soybean flour [64], increased the production of coenzyme A, a necessary precursor for lipid synthesis. In the same way, tests with YE as a nitrogen source have provided interesting results, although slightly lower than soy flour with X values in the range between 13.6–16.6 gL−1, and YX between 33–41% w/w, and L, YL, and IL/X between 6.1–7.9 gL−1, 15–19% w/w, and 37–57% w/w, respectively. Finally, similarly to the tests with soy flour, the best condition was found with a C/N ratio of 160 (Y 160), and the maximum theoretical yield was 60%. On the whole, the data in Table 6 demonstrated that at decreasing the concentration of the external nitrogen sources, the C/N ratio increased, and this was accomplished by a linear increment of the intracellular lipids until reaching the plateau in the C/N range 160–200, in agreement with similar findings of other oleaginous yeasts [65,66]. This data confirmed that the contribution of any endogenous biomass nitrogen source was indeed negligible.
The YX and YL obtained at Y 80 in this study were 20% lower compared to the results obtained in our previous study regarding the conversion of diluted cardoon hydrolysate (S 30) by L. tetrasporus [6]. This underlines the importance of optimizing the conversion process for each coupled hydrolysate microorganism.
For example, Annamalai et al. [67] found that C. curvatus grown on waste paper hydrolysate started the lipid accumulation at C/N 120 even if the best compromise between the cell mass growth and lipid accumulation was found at C/N 80. Similarly, for R. toruloides, the effect of four C/N ratios on lipid synthesis was studied, namely, 60, 80, 100, and 120. The highest intracellular lipid accumulation was found at a C/N of 120 [68]. Some authors have also investigated wide ranges of C/N ratios. Patel et al. [69] studied the lipid production in R. toruloides in the range C/N 20–500. At a C/N ratio below 20, the cell mass was produced, while at increasing the C/N ratio above 50, the metabolism already switched in favor of the lipid synthesis [69]. Many authors also documented the influence of nitrogen sources on the lipid synthesis [70,71]. For example, Chopra and Sen [72] found a different metabolism of P. guilliermondi, grown on two different N sources. On ammonium chloride, the growth was fast and efficient; conversely, on sodium nitrate, the growth was very slow. Furthermore, the productivity was increased when ammonium sulfate was used as the N source, indicating a better ability of the microorganism to use ammonium rather than nitrate as a N source. Finally, slight variations in the lipid profile were found at different N sources [70,72]. Overall, these results demonstrated the high specificity of the C/N ratio and N source for each microorganism.
Finally, all these data were further submitted to two-way ANOVA analysis in order to evaluate the weight of the different factors on the L. tetrasporus performance (Table 7). The different N sources affect mainly X, YX, and L, whereas the C/N ratio affects mainly IL/X and L. The interaction among these factors influences mainly L and IL/X.
As summarized in Figure 2, the highest lipid yield was obtained in soy flour as a N source with a C/N ratio of 160.
On the whole, based on this preliminary screening, soy flour was selected as a N source and the concentration in the media was set at 160 C/N.

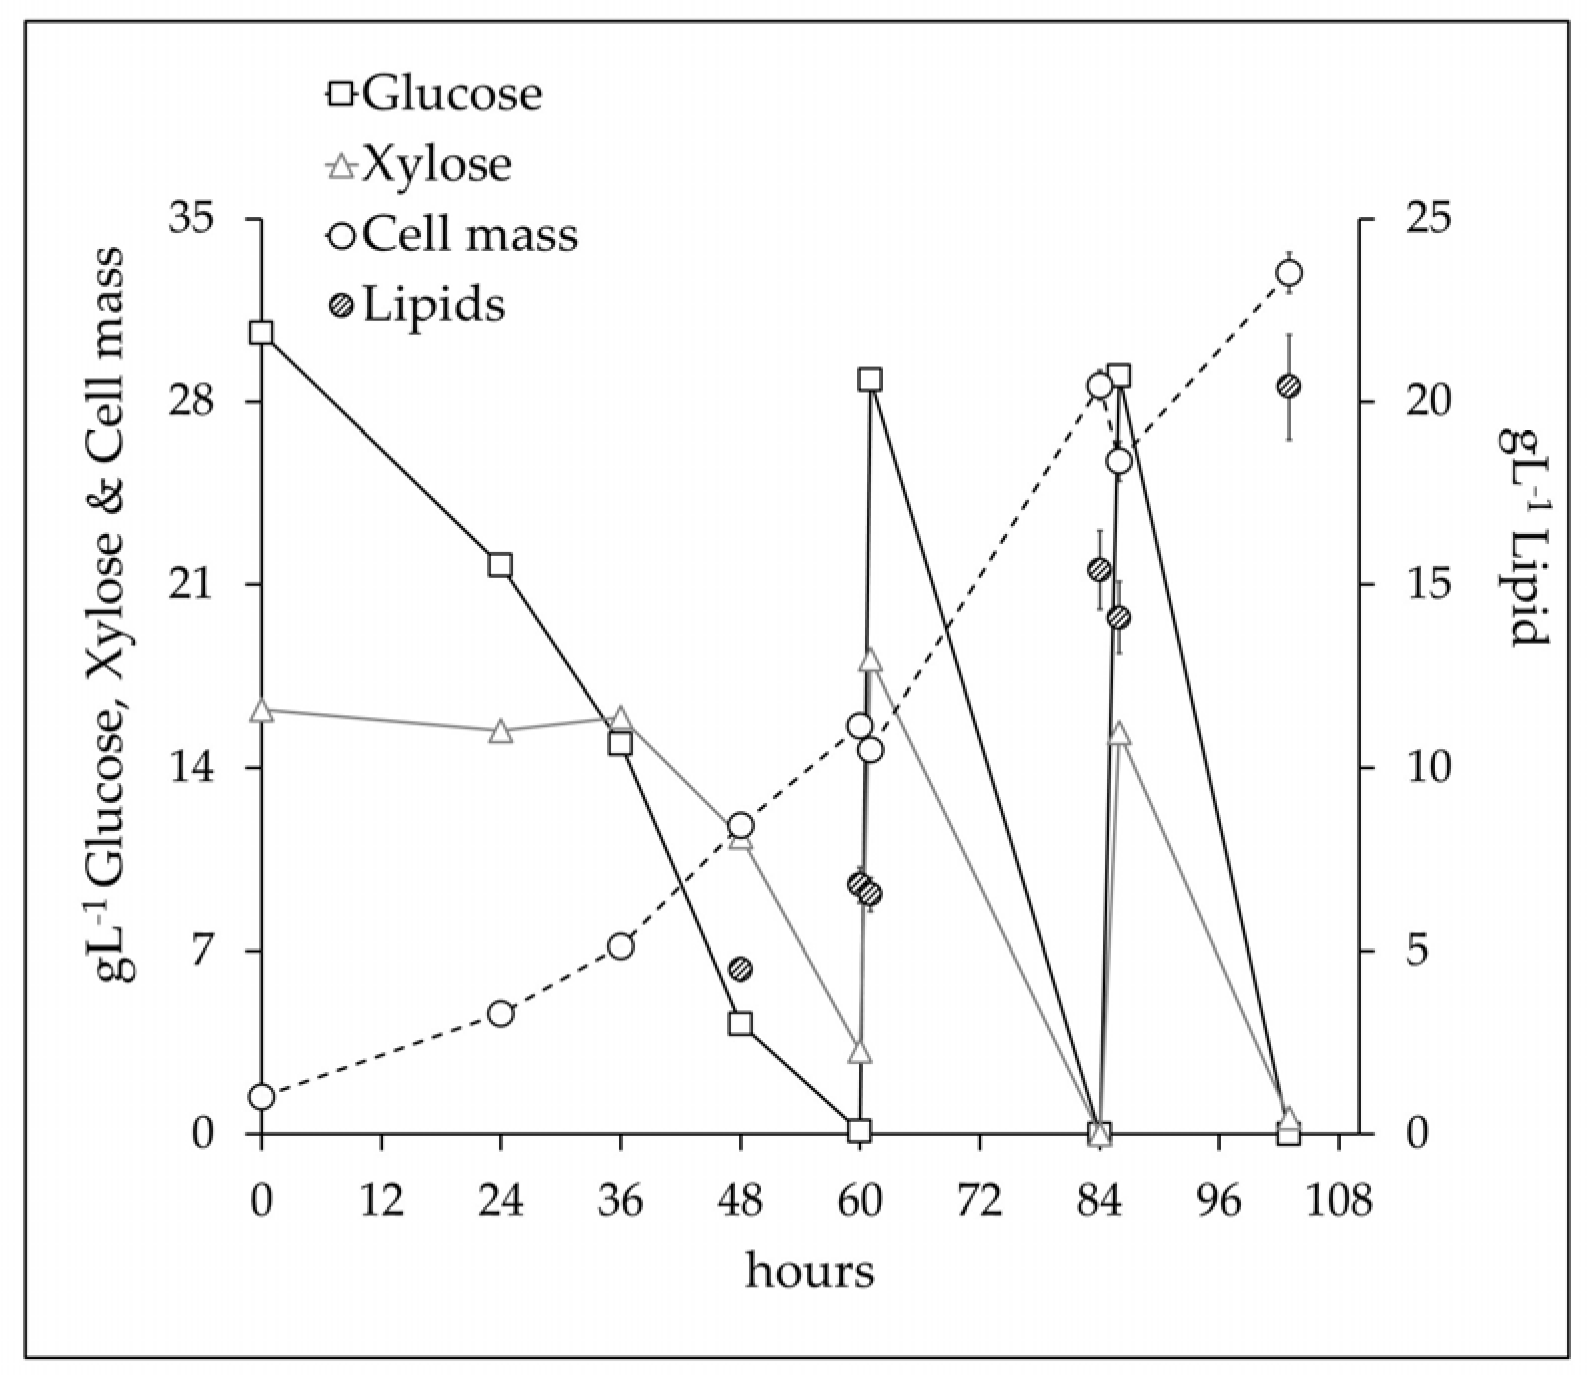
3.3. Scale Up at 10 L Bioreactor

Once the best growth conditions at the bench scale have been assessed, the process was scaled at the bioreactor scale to control the process parameters such as aeration, homogenization, and pH.
To increase productivity, the process was carried out in fed-batch mode, starting from an initial concentration of 30 gL−1 glucose and 15 gL−1 xylose. The obtained results were summarized in Figure 3. After about 60 h of the process, the initial sugars were completely metabolized. The cell mass growth and lipids production were simultaneously yielding 15.6 gL−1 cell mass (X) containing 6.8 gL−1 lipids (L) (43% w/w of IL/X). The productivity, 0.34 gL−1h−1 (X/h), resulted in a four-fold higher amount compared to the bench scale even if the lipid yield (15% w/w) decreased by 25%. After the early 60 h, a fresh feed without a nitrogen source was supplied. The data showed a switch in the yeast metabolism; about 30% w/w (YX) of the sugars consumed were used for cell mass growth of which about 70% were lipids. 15.4 gL−1 of L were produced after 84 h, corresponding to a YL of 16% w/w and an IL/X of 54% w/w. Finally, with the supply of the last feed, the productivity remained almost unchanged, respectively 0.320 gL−1h−1 and the amount of L rose to 20.4 gL−1, with a YL of 15% w/w and an IL/X of 61%.
In general, an optimized bioreactor aeration favours the cell mass growth in aerobic microorganisms. In the present investigation, the reasons for the low lipid yield are probably to be found in the oxygen transfer rate. In fact, to ensure a dissolved oxygen concentration of 40%, in particular in the high cell density phase, airflow was set to 1.5 vvm and the automatic rpm controller reached the thresholds of 500 rpm. The high stirring rate and the airflow increased the foam level with the automatic supply of significant amounts of antifoam which could have disturbed the microbial growth. In fact, many authors documented the inhibiting effect of high-quantity silicon antifoam on various microorganisms, including some oleaginous yeasts [72,73,74].
Recent articles reported a positive correlation between the oxygen concentration and both the cell mass and lipid production [75,76,77]. On the other hand, other authors observed that in some yeasts, only the growth rates and the cell mass production were improved by increasing the oxygen supply, while the intracellular lipid accumulation was reduced [78,79,80]. For example, Yen and Zang [80] recorded in R glutinis a 10% decrease in intracellular lipid accumulation when agitation (rpm) was increased three-fold. According to previous results, Unrean et al. [81] found that the effect of the reduced oxygen supply through the decrease of agitation from 300 rpm to 100 rpm resulted in a 14% increase in lipid yield and a 48% increase in intracellular lipid accumulation in Yarrowia lipolytica. Furthermore, decreasing the oxygen supply through reduced agitation also caused an increase of the lipid titer by 20% whereas the total cell mass titer was decreased by 22%. This could suggest that downregulated oxygen utilization could reduce metabolite utilization for cell growth to enable lipid synthesis. Probably, the decrease in lipid production in response to increased oxygen consumption was caused by the channelling of the acetyl-CoA precursor and NADPH+ cofactor for cell mass growth rather than lipid synthesis.
Additionally, a reduction in oxygen concentration could trigger a nitrogen-starvation-like metabolism in yeast, i.e., increased lipid synthesis and reduced growth rate. This result suggests that the balance of the oxygen supply is essential to properly control flux partitioning between cell growth and lipid synthesis.
The bioreactor set-up could be further improved by maintaining the oxygen level through a mass flow meter. Furthermore, a reduction in oxygen supply in the lipogenic phase could further improve the process yield.

3.4. Scale Up at 50 L Bioreactor

Moving from the bench to pilot scale is necessary to assess what aspects of the process parameters need to be considered and to demonstrate the proof of concept for a process. A pilot plant will provide material for downstream processes and quality assessment. In this sense, it could increase the knowledge of the process and favor its industrialization. In the present paper, the process was at the scale of a 50 L Stirred Tank Reactor (STR). The specific settings were derived from the results obtained at the bench and intermediate bioreactor scales. To optimize the oxygen transfer rate, the reactor geometry was modified by adding a Rushton element (total of three Rushton impellers), useful for increasing the oxygen transfer rate at a low stirring rate. Furthermore, the aeration rate was reduced from 1.5 vvm to 1 vvm, and the test was carried out with a slight positive pressure, about 0.5 bar. Previous investigations demonstrated that a slight positive pressure in the bioreactor did not affect the growth and lipid production but was useful for promoting less foaming, less chance of contamination, and higher oxygen solubilization [80].
In addition, for further implementation, it was decided to limit the dissolved oxygen concentration in the lipogenic phase according to previous works [77,82]. Then, the dissolved oxygen concentration was set at 40% for the initial growth phase and lowered to 25% in the lipogenic phase.
Soy flour and a C/N ratio of 160 were used, and the test was carried out in fed-batch mode, starting with an initial concentration of 45 gL−1 total sugars and adding only one fresh feed.
The kinetics of the process is shown in Figure 4. The productivity value was 0.49 gL−1h−1 (X/h), then the process produced a six-fold faster result than the bench scale and about 1.7-fold than the 10 L bioreactor. In the first 12 h, L. tetrasporus completely detoxified the medium and started the sugar consumption. At 24 h, about 50% of the glucose was consumed while xylose uptake did not start yet.
At 34 h, there were no more glucose and galactose in the growth medium; the xylose concentration dropped to below 30%. About 15.8 gL−1 of cell mass (X) was obtained (YX, 35% w/w) from which 8.8 gL−1 of the lipids (L) were extracted (YL, 20% w/w), accounting for 56% w/w of the lipid content (IL/X).
Due to the implementation strategy, the process in the 50 L bioreactor achieved 25% more lipids than the 10 L bioreactor. The action of the low air flow in a positive pressure reactor and the addition of one more Rushton turbine allowed us to reach the target dissolved oxygen without increasing the stirring rate. This reduced the yeast shear stress and the foam formation.
When no more sugars were present in the medium (33 h), fresh feed nutrient was added and the dissolved oxygen concentration was decreased to 25%. After feeding (34 h), due to the dilution effect, the X and L decreased by 33%, passing from 15.8 to 10.6 gL−1 (X) and 8.8 to 5.9 gL−1 (L), respectively.
After the sugars in the feed were completely consumed, the X concentration increased up to 22.0 gL−1 (YX 34% w/w), from which 14.8 gL−1 of L was extracted (YL 23% w/w). Due to the further implementation of the oxygen supply strategy (low oxygen supply in the lipogenic phase), a theoretical maximum yield of 72% was obtained, the best result of our experimentation The optimized oxygen supply mode was likely the most important factor determining the 25% increase in lipid yield in the 50 L bioreactor.
Only a few studies concerning the production of microbial lipids in pilot scale reactors are present in the literature. Soccol and co-worker [83] investigated the lipid production at a 1000 L pilot scale by Rhodosporidium toruloides DEBB 5533 grown on sugarcane juice. The maximum lipid yield and cell content were 22% w/w and 35% w/w, respectively. The fed-batch process further improved the yields up to 27% w/w and 45% w/w, respectively. Similarly, Huang et al. [18] investigated the corn stover conversion in a 1000 L bioreactor by the red yeast R. toruloides CGMCC 2.1389. In the batch tests, the yeast converted about 47 gL−1 total reducing sugars into 8 gL−1 microbial lipid and produced a 19% w/w lipid yield with 76% w/w lipid content [18]. Saran et al. [84] evaluated the production of lipids by R. toruloides A29 for biodiesel production. The process was successfully scaled up in a 30 L bioreactor with a final lipid cell content of 53.5% w/w, corresponding to a 22-fold increase with respect to the bench scale. Banerjee et al. [85] investigated the lipid production by Rhodotorula mucilagenosa IIPL32 in corn-cob-derived pentosane achieving a relevant yield improvement (four-fold) in the scale up from 50 mL to 50 L. In addition, the productivity increased two-fold [85].

3.5. Lipid Profile

In Table 8, the composition of microbial lipids produced by L. tetrasporus grown in different nitrogen-limited conditions was summarized. The most abundant FA was oleic acid (C18: 1) in the range of 40–60%, followed by palmitic acid (C16:0) in the range of 20–33%, and stearic acid (C18:0) in the range of 7–23%, consistent with previous studies carried out with L. tetrasporus on cardoon hydrolysate and Douglas fir [6,7]. These are also the dominant FAs of vegetable oils used for the production of biodiesel, such as canola and sunflower oils [86].
Lower amounts of palmitoleic (C16:1) and linoleic (C18:2) acids, namely, 1–7% and 1–5%, were also found. In addition, trace amounts of short-chain acids lower than 1% have been determined, such as lauric (C12:0) and myristic (C14: 0) acid, and long-chain acids such as arachidic (C20:0), behenic (C22:0), and lignoceric (C24:0) acid. It is worth noticing that the fatty acid profile also included C18:3 (n-6), better known as omega-3, in all the trials at a low C/N ratio, i.e., 40. Probably, the presence of this FA could suggest that nitrogen played a fundamental role in the activation of the Δ6 desaturase, in non-limiting nitrogen conditions. No correlation between the C/N ratio and lipid profile can be inferred.
It seemed that there were appreciable differences in the function of the nitrogen sources. For example, when YE and U were used, the quantities of C 16:0 (about 30%) decreased by a third with respect to S (about 20%).
On average, the amounts of C16:0 (about 30%) and C18:0 (about 20%) were the same with all the nitrogen sources. Furthermore, the amounts of C18:1, the most abundant FA in all the conditions, were found to be approximately 43% for YE and U and approximately 47% for S. Moreover, the relative percentage of minor FAs were unchanged by changing the nitrogen sources.
The relative abundance of saturated and unsaturated acids was almost comparable, with a slightly higher quantity of saturated acids (about 55%) for YE and U as nitrogen sources. Conversely, a slightly higher amount of unsaturated acids was found for S (about 55%).
A potential explanation for this different effect of the nitrogen source on the lipid profile can be found in the stearoyl-CoA desaturase (Δ-9-desaturase) enzyme. It is a key enzyme in the synthesis of fatty acids and is responsible for the saturated/unsaturated fatty acid ratio. It catalyses the double-bond formation in stearoyl-CoA and palmitoyl-CoA for the synthesis of oleate and palmitoleate, respectively. As shown by the Qiao and co-worker [87], an up-regulation of this enzyme can lead to an increase in lipid titres with a high abundance of unsaturated fatty acids. In this regard, soy flour contains many cofactors [64] useful for increasing Stearoyl-CoA desaturase activity.
No difference was found between the tests carried out on the 10 L and 50 L scales. On the other hand, comparing the flask test (S 160) with the bioreactor tests (10 and 50 L), an increase of C16:0 from 20 to 26% was found. Additionally, a decrease of about 33% C18:0 and a corresponding increase of 10% C18:1 were found. Moreover, the amount of unsaturated products increased from 55% in the flask to 65% in the bioreactor. Similar achievements were reported by us also for the conversion of cardoon hydrolysate by L. tetrasporus [6]. This confirmed that an increased oxygen supply in the bioreactor increased the activity of the Δ9 desaturase. This is also consistent with some articles in which a high oxygen supply has been found to increase the activity of FA elongases and desaturases. It implied an increase in the degree of unsaturation and an elongation of the FA chains [88,89,90].

3.6. Mass Balance

An overall mass balance was finally assessed for the conversion of 1000 g of dry wheat straw (WS) into lipids for biodiesel production using oleaginous yeast L. tetrasporus DSM 70314 (Figure 5), using main results from the pilot scale bioreactor discussed in the previous paragraphs. For the mass balance analysis, the main components of dried wheat straw were cellulose (glucan), hemicellulose (xylan, arabinan, and galactan) and lignin. After the steam-explosion pre-treatment, two fractions were obtained, a liquid fraction consisting mainly of hemicellulose and a solid fraction composed almost entirely of cellulose and lignin. Following the enzymatic hydrolysis process, two fractions were obtained: a lignin cake and a sugar hydrolysate. The lignin cake could be valorised through thermochemical processes such as gasification, pyrolysis, or direct combustion in cogeneration plants [20] due to its high calorific value—in this case, about 19.11 MJ/kg—or through several chemical applications for the synthesis of phenolic resins, epoxies, adhesives, polyolefins, hydrocarbons, etc. [91,92,93].
Based on the results obtained in this study, through the fed-batch cultivation of L. tetrasporus DSM 70314 on the 50 L bioreactor, the bioconversion of 1000 g WS could yield about 172.5 g of yeast—116.3 g of lipids and 56.2 g of cellular residual. The cellular residue was characterized by and contained a significant amount of carbon and nitrogen, namely, C 59.5%, H 7.6%, N 19.7%, and S 2.3%. It could be applied to produce bio-fertilizer, nitrogen sources for microbial cultivation, and raw material for anaerobic digestion. This is in agreement with the circular economy pursuing zero waste processes. The microbial lipids could be converted into biodiesel, with a yield of 85% [52]. Therefore, starting from 1000 g of WS, it is possible to produce about 98.9 g of biodiesel (about 110.8 mL). Considering a wheat straw yield of 4550 Kg ha−1 [94], about 504.1 L ha−1 of biodiesel can be produced. This yield value is confrontable with the biodiesel yield per hectare, summarized in Table 9, considering the vegetable oils as feedstock [83,95,96,97].
With the process optimized in the present work, about twice as much biodiesel per hectare could be produced as canola, and about 60% per hectare with respect to rapeseed. The sunflower oil yields are affected by multiple agronomic factors; therefore, the biodiesel yield is in a range 400–1000 L ha−1 [95]. Other lignocellulosic feedstocks (e.g., sugarcane) can lead to a higher yield due to a higher biomass productivity with respect to wheat straw. On the other hand, sugarcane requires high agronomic inputs, such as water, fertilizers, and pesticides, which significantly lower net production. Furthermore, sugarcane is not a residue of straw but represents a dedicated crop, and therefore was not considered in the RED 2 regulation.

4. Conclusions

This study concerned the optimization and analysis of a process for the conversion of wheat straw into microbial lipids by Lipomyces tetrasporus DSM 70314 up to the pilot scale. Under the optimal conditions, the digestibility of steam-exploded wheat straw at 17% solid loading and 15 FPU reached 89%. The microbial conversion was optimized at the bench scale and scaled up to the 10 and 50 L bioreactor scales. The oxygen supply resulted in a fundamental parameter affecting both the cell mass and the lipid yields. It was varied by manipulating the air flow rate, the bioreactor pressure, the stirrer speed, and the bioreactor geometry. The process in the 10 L bioreactor increased the yeast productivity up to four-fold compared to the tests in the bench scale, reaching 0.34 gL−1h−1, which was further improved at 0.49 gL−1h−1 at the 50 L bioreactor scale. The final lipid concentration at a bioreactor scale was 15 gL−1 corresponding to a 23% w/w yield (72% of maximum theoretical yield) and a lipid cell content of 68% w/w.
The different N sources mainly affected the cell mass and lipid production, whereas the C/N ratio affects mainly the lipid yield and intracellular lipid accumulation. The interaction among these factors influenced mainly the lipid and the intracellular lipid accumulation.
Furthermore, different nitrogen sources influenced the lipid profiles. In particular, by using urea or yeast extract as a nitrogen source, the saturated fatty acid percentage was 55% higher than unsaturated fatty acids. On the other hand, using soy flour as a nitrogen source produced 55% higher unsaturated fatty acids. The overall mass balance of the process showed that from 1000 g of dry wheat straw it would be possible to produce up to 116.3 g of microbial oils. Therefore, considering a wheat straw yield of 4550 Kg ha−1, about 504.1 L ha−1 of biodiesel can be produced.

Author Contributions

Conceptualization, A.C. (Antonio Caporusso) and I.D.B.; methodology, A.C. (Antonio Caporusso), A.G., F.L., R.P., G.S. and A.R.; software, A.C. (Antonio Caporusso), A.G., F.L., R.P., G.S. and A.R.; validation, A.C. (Antonio Caporusso), A.G., R.A., F.L., R.P. and G.S.; formal analysis, A.C. (Antonio Caporusso), A.G., F.L. and R.P.; investigation, A.C. (Antonio Caporusso); writing—original draft preparation, A.C. (Antonio Caporusso), A.G., F.L., I.D.B. and A.C. (Angela Capece); writing—review and editing, A.C. (Antonio Caporusso), G.S., R.P., G.B., I.D.B. and A.C. (Angela Capece); supervision, G.B., I.D.B. and A.C. (Angela Capece) All authors have read and agreed to the published version of the manuscript.

Funding

This research was funded by regione Basilicata, “dottorati innovativi di ricerca con specializzazione in tecnologie abilitanti in industria 4.0”.

Informed Consent Statement

Not applicable.

Data Availability Statement

The data presented in this study are available on request from the first author.

Conflicts of Interest

The authors declare no conflict of interest.

References

  1. Mercure, J.F.; Pollitt, H.; Viñuales, J.E.; Edwards, N.R.; Holden, P.B.; Chewpreecha, U.; Salas, P.; Sognnaes, I.; Lam, A.; Knobloch, F. Macroeconomic Impact of Stranded Fossil Fuel Assets. Nat. Clim. Change 2018, 8, 588–593. [Google Scholar] [CrossRef] [Green Version]
  2. Bórawski, P.; Bełdycka-Bórawska, A.; Szymańska, E.J.; Jankowski, K.J.; Dubis, B.; Dunn, J.W. Development of Renewable Energy Sources Market and Biofuels in The European Union. J. Clean. Prod. 2019, 228, 467–484. [Google Scholar] [CrossRef]
  3. Mayr, S.; Hollaus, B.; Madner, V. Palm Oil, the RED II and WTO Law: EU Sustainable Biofuel Policy Tangled up in Green? Rev. Eur. Comp. Int. Environ. Law 2020, 30, 233–248. [Google Scholar] [CrossRef]
  4. di Fidio, N.; Minonne, F.; Antonetti, C.; Galletti, A.M.R. Cutaneotrichosporon oleaginosus: A Versatile Whole-Cell Biocatalyst for the Production of Single-Cell Oil from Agro-Industrial Wastes. Catalysts 2021, 11, 1291. [Google Scholar] [CrossRef]
  5. Caporusso, A.; Capece, A.; de Bari, I. Oleaginous Yeasts as Cell Factories for the Sustainable Production of Microbial Lipids by the Valorization of Agri-Food Wastes. Fermentation 2021, 7, 50. [Google Scholar]
  6. Caporusso, A.; de Bari, I.; Valerio, V.; Albergo, R.; Liuzzi, F. Conversion of Cardoon Crop Residues into Single Cell Oils by Lipomyces tetrasporus and Cutaneotrichosporon curvatus: Process Optimizations to Overcome the Microbial Inhibition of Lignocellulosic Hydrolysates. Ind. Crop. Prod. 2020, 159, 113030. [Google Scholar] [CrossRef]
  7. Dien, B.S.; Zhu, J.Y.; Slininger, P.J.; Kurtzman, C.P.; Moser, B.R.; O’Bryan, P.J.; Gleisner, R.; Cotta, M.A. Conversion of SPORL Pretreated Douglas Fir Forest Residues into Microbial Lipids with Oleaginous Yeasts. RSC Adv. 2016, 6, 20695–20705. [Google Scholar] [CrossRef]
  8. Slininger, P.J.; Dien, B.S.; Kurtzman, C.P.; Moser, B.R.; Bakota, E.L.; Thompson, S.R.; O’Bryan, P.J.; Cotta, M.A.; Balan, V.; Jin, M.; et al. Comparative Lipid Production by Oleaginous Yeasts in Hydrolyzates of Lignocellulosic Biomass and Process Strategy for High Titers. Biotechnol. Bioeng. 2016, 113, 1676–1690. [Google Scholar] [CrossRef] [Green Version]
  9. Yuzbasheva, E.Y.; Scarcia, P.; Yuzbashev, T.V.; Messina, E.; Kosikhina, I.M.; Palmieri, L.; Shutov, A.V.; Taratynova, M.O.; Amaro, R.L.; Palmieri, F.; et al. Engineering Yarrowia lipolytica for the Selective and High-Level Production of Isocitric Acid through Manipulation of Mitochondrial Dicarboxylate–Tricarboxylate Carriers. Metab. Eng. 2020, 65, 156–166. [Google Scholar] [CrossRef]
  10. Caporusso, A.; Giuliano, A.; Liuzzi, F.; De Bari, I. Techno-Economic Analysis of a Lignocellulosic Biorefinery Producing Microbial Oils by Oleaginous Yeasts. Chem. Eng. Trans. 2022, 92, 637–642. [Google Scholar]
  11. Carpio, R.R.; Secchi, S.G.; Barros, R.O.; Oliveira, R.A.; Queiroz, S.; Teixeira, R.S.S.; Bon, E.P.S.; Secchi, A.R. Techno-Economic Evaluation of Second-Generation Ethanol from Sugarcane Bagasse: Commercial versus on-Site Produced Enzymes and Use of the Xylose Liquor. J. Clean. Prod. 2022, 369, 133340. [Google Scholar] [CrossRef]
  12. Donzella, S.; Fumagalli, A.; Arioli, S.; Pellegrino, L.; D’Incecco, P.; Molinari, F.; Speranza, G.; Ubiali, D.; Robescu, M.S.; Compagno, C. Recycling Food Waste and Saving Water: Optimization of the Fermentation Processes from Cheese Whey Permeate to Yeast Oil. Fermentation 2022, 8, 341. [Google Scholar] [CrossRef]
  13. Ciliberti, C.; Biundo, A.; Colacicco, M.; Agrimi, G.; Pisano, I. lla Physiological Characterisation of Yarrowia lipolytica Cultures Grown on Alternative Carbon Sources to Develop Microbial Platforms for Waste Cooking Oils Valorisation. Chem. Eng. Trans. 2022, 93, 241–246. [Google Scholar]
  14. Colacicco, M.; Ciliberti, C.; Agrimi, G.; Biundo, A.; Pisano, I. Towards the Physiological Understanding of Yarrowia lipolytica Growth and Lipase Production Using Waste Cooking Oils. Energies 2022, 15, 5217. [Google Scholar] [CrossRef]
  15. Sarris, D.; Rapti, A.; Papafotis, N.; Koutinas, A.A.; Papanikolaou, S. Production of Added-Value Chemical Compounds through Bioconversions of Olive-Mill Wastewaters Blended with Crude Glycerol by a Yarrowia lipolytica Strain. Molecules 2019, 24, 222. [Google Scholar] [CrossRef] [Green Version]
  16. di Fidio, N.; Dragoni, F.; Antonetti, C.; de Bari, I.; Raspolli Galletti, A.M.; Ragaglini, G. From Paper Mill Waste to Single Cell Oil: Enzymatic Hydrolysis to Sugars and Their Fermentation into Microbial Oil by the Yeast Lipomyces starkeyi. Bioresour. Technol. 2020, 315, 123790. [Google Scholar] [CrossRef]
  17. Giacomobono, R.; Albergo, R.; Valerio, V.; Caporusso, A.; de Bari, I. Modelling of the Citric Acid Production from Crude Glycerol by Wild-Type Yarrowia lipolytica DSM 8218 Using Response Surface Methodology (RSM). Life 2022, 12, 621. [Google Scholar]
  18. Huang, Q.; Kamal, R.; Shen, H.; Lu, H.; Song, J.; Chu, Y.; Xue, C.; Zhao, Z.K. Pilot-Scale Conversion of Corn Stover into Lipids by the Red Yeast Rhodosporidium toruloides. J. Environ. Chem. Eng. 2022, 10, 108858. [Google Scholar] [CrossRef]
  19. Tufail, T.; Saeed, F.; Afzaal, M.; Ain, H.B.U.; Gilani, S.A.; Hussain, M.; Anjum, F.M. Wheat Straw: A Natural Remedy against Different Maladies. Food Sci. Nutr. 2021, 9, 2335–2344. [Google Scholar] [CrossRef]
  20. de Bari, I.; Giuliano, A.; Petrone, M.T.; Stoppiello, G.; Fatta, V.; Giardi, C.; Razza, F.; Novelli, A. From Cardoon Lignocellulosic Biomass to Bio-1,4 Butanediol: An Integrated Biorefinery Model. Processes 2020, 8, 1585. [Google Scholar] [CrossRef]
  21. Bonatsos, N.; Marazioti, C.; Moutousidi, E.; Anagnostou, A.; Koutinas, A.; Kookos, I.K. Techno-Economic Analysis and Life Cycle Assessment of Heterotrophic Yeast-Derived Single Cell Oil Production Process. Fuel 2020, 264, 116839. [Google Scholar] [CrossRef]
  22. Liu, G.; Zhang, J.; Bao, J. Cost Evaluation of Cellulase Enzyme for Industrial-Scale Cellulosic Ethanol Production Based on Rigorous Aspen Plus Modeling. Bioprocess Biosyst. Eng. 2016, 39, 133–140. [Google Scholar] [CrossRef] [PubMed]
  23. Rosales-Calderon, O.; Arantes, V. A Review on Commercial-Scale High-Value Products That Can Be Produced alongside Cellulosic Ethanol. Biotechnol. Biofuels 2019, 12, 1–58. [Google Scholar]
  24. Duque, A.; Manzanares, P.; Ballesteros, I.; Ballesteros, M. Steam Explosion as Lignocellulosic Biomass Pretreatment. In Biomass Fractionation Technologies for a Lignocellulosic Feedstock Based Biorefinery; Elsevier: Amsterdam, The Netherlands, 2016. [Google Scholar]
  25. Guarneros-Flores, J.; Aguilar-Uscanga, M.G.; Morales-Martínez, J.L.; López-Zamora, L. Maximization of Fermentable Sugar Production from Sweet Sorghum Bagasse (Dry and Wet Bases) Using Response Surface Methodology (RSM). Biomass- Convers. Biorefinery 2019, 9, 633–639. [Google Scholar] [CrossRef]
  26. Hasan Ba Hamid, H.S.; Ku Ismail, K.S. Optimization of Enzymatic Hydrolysis for Acid Pretreated Date Seeds into Fermentable Sugars. Biocatal. Agric. Biotechnol. 2020, 24, 101530. [Google Scholar] [CrossRef]
  27. Chen, L.; Wei, Y.; Shi, M.; Li, Z.; Zhang, S.H. Statistical Optimization of a Cellulase from Aspergillus glaucus CCHA for Hydrolyzing Corn and Rice Straw by RSM to Enhance Yield of Reducing Sugar. Biotechnol. Lett. 2020, 42, 583–595. [Google Scholar] [CrossRef] [PubMed]
  28. Sluiter, A.; Ruiz, R.O.; Scarlata, C.; Sluiter, J.; Templeton, D. Determination of Extractives in Biomass; NREL: Golden, CO, USA, 2004. [Google Scholar]
  29. Sluiter, A.; Hames, B.; Ruiz, R.; Scarlata, C.; Sluiter, J.; Templeton, D.; Crocker, D.L.A.P. Determination of Structural Carbohydrates and Lignin in Biomass: Laboratory Analytical Procedure (LAP); Technical Report NREL/TP-510-42618; NREL: Golden, CO, USA, 2008. [Google Scholar]
  30. Chen, J.; Wang, X.; Zhang, B.; Yang, Y.; Song, Y.; Zhang, F.; Liu, B.; Zhou, Y.; Yi, Y.; Shan, Y.; et al. Integrating Enzymatic Hydrolysis into Subcritical Water Pretreatment Optimization for Bioethanol Production from Wheat Straw. Sci. Total. Environ. 2021, 770, 145321. [Google Scholar] [CrossRef]
  31. de Bari, I.; Liuzzi, F.; Villone, A.; Braccio, G. Hydrolysis of Concentrated Suspensions of Steam Pretreated Arundo Donax. Appl. Energy 2013, 102, 179–189. [Google Scholar] [CrossRef]
  32. Jakobsson, E. Optimization of the Pretreatment of Wheat Straw for Production of Bioethanol; Lund University: Lund, Sweden, 2002. [Google Scholar]
  33. Ballesteros, I.; Negro, M.J.; Oliva, J.M.; Cabañas, A.; Manzanares, P.; Ballesteros, M. Ethanol Production from Steam-Explosion Pretreated Wheat Straw. Proc. Appl. Biochem. Biotechnol. 2006, 130, 496–508. [Google Scholar] [CrossRef]
  34. Irfan, M.; Gulsher, M.; Abbas, S.; Syed, Q.; Nadeem, M.; Baig, S. Effect of Various Pretreatment Conditions on Enzymatic Saccharification. Songklanakarin J. Sci. Technol. 2011, 33, 397–404. [Google Scholar]
  35. Hammer, Ø.; Harper, D.A.T.; Ryan, P.D. Past: Paleontological Statistics Software Package for Education and Data Analysis. Palaeontol. Electron. 2001, 4, 9. [Google Scholar]
  36. Morrison, W.R.; Smith, L.M. Preparation of Fatty Acid Methyl Esters and Dimethylacetals from Lipids with Boron Fluoride–Methanol. J. Lipid Res. 1964, 5, 600–608. [Google Scholar] [CrossRef]
  37. Liuzzi, F.; Mastrolitti, S.; de Bari, I. Hydrolysis of Corn Stover by Talaromyces cellulolyticus Enzymes: Evaluation of the Residual Enzymes Activities Through the Process. Appl. Biochem. Biotechnol. 2019, 188, 690–705. [Google Scholar] [CrossRef] [PubMed]
  38. de Bari, I.; Liuzzi, F.; Ambrico, A.; Trupo, M. Arundo Donax Refining to Second Generation Bioethanol and Furfural. Processes 2020, 8, 1591. [Google Scholar] [CrossRef]
  39. Crognale, S.; Liuzzi, F.; D’Annibale, A.; de Bari, I.; Petruccioli, M. Cynara Cardunculus a Novel Substrate for Solid-State Production of Aspergillus tubingensis Cellulases and Sugar Hydrolysates. Biomass Bioenergy 2019, 127, 105276. [Google Scholar] [CrossRef]
  40. Rodrigues, A.C.; Haven, M.Ø.; Lindedam, J.; Felby, C.; Gama, M. Celluclast and Cellic® CTec2: Saccharification/Fermentation of Wheat Straw, Solid-Liquid Partition and Potential of Enzyme Recycling by Alkaline Washing. Enzym. Microb. Technol. 2015, 79–80, 70–77. [Google Scholar] [CrossRef] [Green Version]
  41. Horn, S.J.; Nguyen, Q.D.; Westereng, B.; Nilsen, P.J.; Eijsink, V.G.H. Screening of Steam Explosion Conditions for Glucose Production from Non-Impregnated Wheat Straw. Biomass Bioenergy 2011, 35, 4879–4886. [Google Scholar] [CrossRef]
  42. Alvira, P.; Negro, M.J.; Ballesteros, I.; González, A.; Ballesteros, M. Steam Explosion for Wheat Straw Pretreatment for Sugars Production. Bioethanol 2016, 2, 3. [Google Scholar] [CrossRef] [Green Version]
  43. Macrelli, S.; Zacchi, G.; Mogensen, J. Techno-Economic Evaluation of 2nd Generation Bioethanol Production from Sugar Cane Bagasse and Leaves Integrated with the Sugar-Based Ethanol Process [Electronic Resource]. Biotechnol. Biofuels 2012, 5, 22. [Google Scholar] [CrossRef] [Green Version]
  44. Weiss, N.D.; Felby, C.; Thygesen, L.G. Enzymatic Hydrolysis Is Limited by Biomass–Water Interactions at High-Solids: Improved Performance through Substrate Modifications. Biotechnol. Biofuels 2019, 12, 3. [Google Scholar] [CrossRef] [Green Version]
  45. Du, J.; Liang, J.; Gao, X.; Liu, G.; Qu, Y. Optimization of an Artificial Cellulase Cocktail for High-Solids Enzymatic Hydrolysis of Cellulosic Materials with Different Pretreatment Methods. Bioresour. Technol. 2020, 295, 122272. [Google Scholar] [CrossRef] [PubMed]
  46. Yang, J.; Kim, J.E.; Kim, J.K.; Lee, S.H.; Yu, J.H.; Kim, K.H. Evaluation of Commercial Cellulase Preparations for the Efficient Hydrolysis of Hydrothermally Pretreated Empty Fruit Bunches. Bioresources 2017, 12, 7840. [Google Scholar] [CrossRef]
  47. Papanikolaou, S.; Aggelis, G. Lipids of Oleaginous Yeasts. Part I: Biochemistry of Single Cell Oil Production. Eur. J. Lipid Sci. Technol. 2011, 113, 1031–1051. [Google Scholar]
  48. Madani, M.; Enshaeieh, M.; Abdoli, A. Single Cell Oil and Its Application for Biodiesel Production. Process Saf. Environ. Prot. 2017, 111, 747–756. [Google Scholar] [CrossRef]
  49. Hansen, M.A.T.; Jørgensen, H.; Laursen, K.H.; Schjoerring, J.K.; Felby, C. Structural and Chemical Analysis of Process Residue from Biochemical Conversion of Wheat Straw (Triticum Aestivum L.) to Ethanol. Biomass- Bioenergy 2013, 56, 572–581. [Google Scholar] [CrossRef]
  50. Kemppainen, K.; Rommi, K.; Holopainen, U.; Kruus, K. Steam Explosion of Brewer’s Spent Grain Improves Enzymatic Digestibility of Carbohydrates and Affects Solubility and Stability of Proteins. Appl. Biochem. Biotechnol. 2016, 180, 94–108. [Google Scholar] [CrossRef]
  51. Zhang, Y.; Feng, Y.; Shi, H.; Ding, K.; Zhou, X.; Zhao, G.; Hadiatullah, H. Impact of Steam Explosion Pretreatment of Defatted Soybean Meal on the Flavor of Soy Sauce. LWT 2022, 156, 113034. [Google Scholar] [CrossRef]
  52. Caporusso, A.; de Bari, I.; Liuzzi, F.; Albergo, R.; Valerio, V.; Viola, E.; Pietrafesa, R.; Siesto, G.; Capece, A. Optimized Conversion of Wheat Straw into Single Cell Oils by Yarrowia lipolytica and Lipomyces tetrasporus and Synthesis of Advanced Biofuels. Renew. Energy 2023, 202, 184–195. [Google Scholar] [CrossRef]
  53. Zhang, L.; Li, X.; Yong, Q.; Yang, S.T.; Ouyang, J.; Yu, S. Impacts of Lignocellulose-Derived Inhibitors on l-Lactic Acid Fermentation by Rhizopus oryzae. Renew. Energy 2023, 202, 184–195. [Google Scholar] [CrossRef]
  54. Huang, C.; Zhu, D.H.; Wu, H.; Lou, W.Y.; Zong, M.H. Evaluating the Influence of Inhibitors Present in Lignocellulosic Hydrolysates on the Cell Membrane Integrity of Oleaginous Yeast Trichosporon fermentans by Flow Cytometry. Renew. Energy 2023, 202, 184–195. [Google Scholar] [CrossRef]
  55. Gong, Z.; Wang, Q.; Shen, H.; Hu, C.; Jin, G.; Zhao, Z.K. Co-Fermentation of Cellobiose and Xylose by Lipomyces starkeyi for Lipid Production. Bioresour. Technol. 2012, 117, 20–24. [Google Scholar] [CrossRef] [PubMed]
  56. Probst, K.V.; Vadlani, P.v. Single Cell Oil Production by Lipomyces starkeyi: Biphasic Fed-Batch Fermentation Strategy Providing Glucose for Growth and Xylose for Oil Production. Bioresour. Technol. 2012, 117, 20–24. [Google Scholar] [CrossRef] [Green Version]
  57. Vorapreeda, T.; Thammarongtham, C.; Cheevadhanarak, S.; Laoteng, K. Alternative Routes of Acetyl-CoA Synthesis Identified by Comparative Genomic Analysis: Involvement in the Lipid Production of Oleaginous Yeast and Fungi. Microbiology 2012, 158, 217–228. [Google Scholar] [CrossRef] [PubMed] [Green Version]
  58. Chen, X.; Li, Z.; Zhang, X.; Hu, F.; Ryu, D.D.Y.; Bao, J. Screening of Oleaginous Yeast Strains Tolerant to Lignocellulose Degradation Compounds. Appl. Biochem. Biotechnol. 2009, 159, 591–604. [Google Scholar] [CrossRef] [PubMed]
  59. Zhao, X.; Peng, F.; Du, W.; Liu, C.; Liu, D. Effects of Some Inhibitors on the Growth and Lipid Accumulation of Oleaginous Yeast Rhodosporidium toruloides and Preparation of Biodiesel by Enzymatic Transesterification of the Lipid. Bioprocess Biosyst. Eng. 2012, 35, 993–1004. [Google Scholar] [CrossRef]
  60. Xavier, M.C.A.; Coradini, A.L.V.; Deckmann, A.C.; Franco, T.T. Lipid Production from Hemicellulose Hydrolysate and Acetic Acid by Lipomyces starkeyi and the Ability of Yeast to Metabolize Inhibitors. Biochem. Eng. J. 2017, 118, 11–19. [Google Scholar] [CrossRef]
  61. Ge, C.; Chen, H.; Mei, T.; Tang, X.; Chang, L.; Gu, Z.; Zhang, H.; Chen, W.; Chen, Y.Q. Application of a ω-3 Desaturase with an Arachidonic Acid Preference to Eicosapentaenoic Acid Production in Mortierella alpina. Front. Bioeng. Biotechnol. 2018, 5, 89. [Google Scholar] [CrossRef] [PubMed] [Green Version]
  62. Kim, T.I.; Lim, D.H.; Baek, K.S.; Jang, S.S.; Park, B.Y.; Mayakrishnan, V. Production of chitinase from Escherichia fergusonii, chitosanase from Chryseobacterium indologenes, Comamonas koreensis and its application in N-acetylglucosamine production. Int. J. Biol. Macromol. 2018, 112, 1115–1121. [Google Scholar] [CrossRef]
  63. Mitrović, I.; Tančić-Živanov, S.; Purar, B.; Trivunović, Z.; Mitrović, B. Effect of different carbon and nitrogen sources combination in medium for production of biocontrol agent Trichoderma harzianum. Ratar. Povrt. 2021, 58, 1–6. [Google Scholar] [CrossRef]
  64. Li, S.; Jin, Z.; Hu, D.; Yang, W.; Yan, Y.; Nie, X.; Lin, J.; Zhang, Q.; Gai, D.; Ji, Y.; et al. Effect of solid-state fermentation with Lactobacillus casei on the nutritional value, isoflavones, phenolic acids and antioxidant activity of whole soybean flour. LWT Food Sci. Technol. 2020, 125, 109264. [Google Scholar] [CrossRef]
  65. Antonopoulou, I.; Spanopoulos, A.; Matsakas, L. Single cell oil and ethanol production by the oleaginous yeast Trichosporon fermentans utilizing dried sweet sorghum stalks. Renew. Energy 2019, 146, 1609–1617. [Google Scholar] [CrossRef]
  66. Huang, C.; Wu, H.; Li, R.-F.; Zong, M.-H. Improving lipid production from bagasse hydrolysate with Trichosporon fermentans by response surface methodology. New Biotechnol. 2011, 29, 372–378. [Google Scholar] [CrossRef]
  67. Annamalai, N.; Sivakumar, N.; Oleskowicz-Popiel, P. Enhanced production of microbial lipids from waste office paper by the oleaginous yeast Cryptococcus curvatus. Fuel 2018, 217, 420–426. [Google Scholar] [CrossRef]
  68. Lopes, H.J.S.; Bonturi, N.; Kerkhoven, E.J.; Miranda, E.A.; Lahtvee, P.-J. C/N ratio and carbon source-dependent lipid production profiling in Rhodotorula toruloides. Appl. Microbiol. Biotechnol. 2020, 104, 2639–2649. [Google Scholar] [CrossRef] [PubMed] [Green Version]
  69. Patel, A.; Mikes, F.; Bühler, S.; Matsakas, L. Valorization of Brewers’ Spent Grain for the Production of Lipids by Oleaginous Yeast. Molecules 2018, 23, 3052. [Google Scholar] [CrossRef] [PubMed] [Green Version]
  70. Awad, D.; Bohnen, F.; Mehlmer, N.; Brueck, T. Multi-Factorial-Guided Media Optimization for Enhanced Biomass and Lipid Formation by the Oleaginous Yeast Cutaneotrichosporon oleaginosus. Front. Bioeng. Biotechnol. 2019, 7, 54. [Google Scholar] [CrossRef] [Green Version]
  71. Sitepu, I.R.; Sestric, R.; Ignatia, L.; Levin, D.; German, J.B.; Gillies, L.A.; Almada, L.A.; Boundy-Mills, K.L. Manipulation of culture conditions alters lipid content and fatty acid profiles of a wide variety of known and new oleaginous yeast species. Bioresour. Technol. 2013, 144, 360–369. [Google Scholar] [CrossRef] [Green Version]
  72. Chopra, J.; Sen, R. Process optimization involving critical evaluation of oxygen transfer, oxygen uptake and nitrogen limitation for enhanced biomass and lipid production by oleaginous yeast for biofuel application. Bioprocess Biosyst. Eng. 2018, 41, 1103–1113. [Google Scholar] [CrossRef]
  73. Bouchedja, D.N.; Danthine, S.; Kar, T.; Fickers, P.; Sassi, H.; Boudjellal, A.; Blecker, C.; Delvigne, F. pH level has a strong impact on population dynamics of the yeast Yarrowia lipolytica and oil micro-droplets in multiphasic bioreactor. FEMS Microbiol. Lett. 2018, 365, fny173. [Google Scholar] [CrossRef] [Green Version]
  74. Routledge, S.J. Beyond De-Foaming: The Effects of Antifoams on Bioprocess Productivity. Comput. Struct. Biotechnol. J. 2012, 3, e201210001. [Google Scholar] [CrossRef] [Green Version]
  75. Calvey, C.H.; Su, Y.-K.; Willis, L.B.; McGee, M.; Jeffries, T.W. Nitrogen limitation, oxygen limitation, and lipid accumulation in Lipomyces starkeyi. Bioresour. Technol. 2016, 200, 780–788. [Google Scholar] [CrossRef] [PubMed] [Green Version]
  76. Guerreiro, F.; Constantino, A.; Lima-Costa, E.; Raposo, S. A new combined approach to improved lipid production using a strictly aerobic and oleaginous yeast. Eng. Life Sci. 2018, 19, 47–56. [Google Scholar] [CrossRef] [PubMed] [Green Version]
  77. Zhang, X.; Chen, J.; Wu, D.; Li, J.; Tyagi, R.D.; Surampalli, R.Y. Economical lipid production from Trichosporon oleaginosus via dissolved oxygen adjustment and crude glycerol addition. Bioresour. Technol. 2018, 273, 288–296. [Google Scholar] [CrossRef] [PubMed]
  78. Kitcha, S.; Cheirsilp, B. Enhancing Lipid Production from Crude Glycerol by Newly Isolated Oleaginous Yeasts: Strain Selection, Process Optimization, and Fed-Batch Strategy. BioEnergy Res. 2012, 6, 300–310. [Google Scholar] [CrossRef]
  79. Yen, H.-W.; Liu, Y.X. Application of airlift bioreactor for the cultivation of aerobic oleaginous yeast Rhodotorula glutinis with different aeration rates. J. Biosci. Bioeng. 2014, 118, 195–198. [Google Scholar] [CrossRef] [PubMed]
  80. Yen, H.-W.; Zhang, Z. Effects of dissolved oxygen level on cell growth and total lipid accumulation in the cultivation of Rhodotorula glutinis. J. Biosci. Bioeng. 2011, 112, 71–74. [Google Scholar] [CrossRef]
  81. Unrean, P.; Khajeeram, S.; Champreda, V. Combining metabolic evolution and systematic fed-batch optimization for efficient single-cell oil production from sugarcane bagasse. Renew. Energy 2017, 111, 295–306. [Google Scholar] [CrossRef]
  82. Qiao, K.; Wasylenko, T.M.; Zhou, K.; Xu, P.; Stephanopoulos, G. Lipid production in Yarrowia lipolytica is maximized by engineering cytosolic redox metabolism. Nat. Biotechnol. 2017, 35, 173–177. [Google Scholar] [CrossRef]
  83. Soccol, C.R.; Neto, C.J.D.; Soccol, V.T.; Sydney, E.B.; da Costa, E.S.F.; Medeiros, A.B.P.; Vandenberghe, L.P.D.S. Pilot scale biodiesel production from microbial oil of Rhodosporidium toruloides DEBB 5533 using sugarcane juice: Performance in diesel engine and preliminary economic study. Bioresour. Technol. 2017, 223, 259–268. [Google Scholar] [CrossRef]
  84. Saran, S.; Mathur, A.; Dalal, J.; Saxena, R. Process optimization for cultivation and oil accumulation in an oleaginous yeast Rhodosporidium toruloides A29. Fuel 2017, 188, 324–331. [Google Scholar] [CrossRef]
  85. Banerjee, A.; Sharma, T.; Nautiyal, A.K.; Dasgupta, D.; Hazra, S.; Bhaskar, T.; Ghosh, D. Scale-up strategy for yeast single cell oil production for Rhodotorula mucilagenosa IIPL32 from corn cob derived pentosan. Bioresour. Technol. 2020, 309, 123329. [Google Scholar] [CrossRef] [PubMed]
  86. Ageitos, J.M.; Vallejo, J.; Veiga-Crespo, P.; Villa, T.G. Oily yeasts as oleaginous cell factories. Appl. Microbiol. Biotechnol. 2011, 90, 1219–1227. [Google Scholar] [CrossRef] [PubMed]
  87. Qiao, K.; Abidi, S.H.I.; Liu, H.; Zhang, H.; Chakraborty, S.; Watson, N.; Ajikumar, P.K.; Stephanopoulos, G. Engineering lipid overproduction in the oleaginous yeast Yarrowia lipolytica. Metab. Eng. 2015, 29, 56–65. [Google Scholar] [CrossRef] [PubMed] [Green Version]
  88. Chi, Z.; Liu, Y.; Frear, C.; Chen, S. Study of a two-stage growth of DHA-producing marine algae Schizochytrium limacinum SR21 with shifting dissolved oxygen level. Appl. Microbiol. Biotechnol. 2009, 81, 1141–1148. [Google Scholar] [CrossRef] [PubMed]
  89. Sun, X.M.; Geng, L.J.; Ren, L.J.; Ji, X.J.; Hao, N.; Chen, K.Q.; Huang, H. Influence of Oxygen on the Biosynthesis of Polyun-saturated Fatty Acids in Microalgae. Bioresour. Technol. 2018, 250, 868–876. [Google Scholar] [CrossRef] [Green Version]
  90. Lu, H.; Chen, H.; Tang, X.; Yang, Q.; Zhang, H.; Chen, Y.Q.; Chen, W. Metabolomics analysis reveals the role of oxygen control in the nitrogen limitation induced lipid accumulation in Mortierella alpina. J. Biotechnol. 2020, 325, 325–333. [Google Scholar] [CrossRef]
  91. Yu, O.; Kim, K.H. Lignin to Materials: A Focused Review on Recent Novel Lignin Applications. Appl. Sci. 2020, 10, 4626. [Google Scholar] [CrossRef]
  92. Espinoza-Acosta, J.L.; Torres-Chávez, P.I.; Olmedo-Martínez, J.L.; Vega-Rios, A.; Flores-Gallardo, S.; Zaragoza-Contreras, E.A. Lignin in storage and renewable energy applications: A review. J. Energy Chem. 2018, 27, 1422–1438. [Google Scholar] [CrossRef]
  93. Borsella, E.; De Bari, I.; Colucci, P.; Mastrolitti, S.; Liuzzi, F.; De Stefanis, A.; Valentini, V.; Gallese, F.; Perez, G. Lignin Depolymerization by Catalytic Hydrodeoxygenation Performed with Smectitic Clay-Based Materials. Energy Technol. 2020, 8, 633. [Google Scholar] [CrossRef]
  94. Hasanly, A.; Talkhoncheh, M.K.; Alavijeh, M.K. Techno-economic assessment of bioethanol production from wheat straw: A case study of Iran. Clean Technol. Environ. Policy 2017, 20, 357–377. [Google Scholar] [CrossRef]
  95. Zheljazkov, V.D.; Vick, B.A.; Ebelhar, M.W.; Buehring, N.; Baldwin, B.S.; Astatkie, T.; Miller, J.F. Yield, Oil Content, and Composition of Sunflower Grown at Multiple Locations in Mississippi. Agron. J. 2008, 100, 635–642. [Google Scholar] [CrossRef] [Green Version]
  96. Fore, S.R.; Porter, P.; Lazarus, W. Net energy balance of small-scale on-farm biodiesel production from canola and soybean. Biomass Bioenergy 2011, 35, 2234–2244. [Google Scholar] [CrossRef]
  97. Felten, D.; Fröba, N.; Fries, J.; Emmerling, C. Energy balances and greenhouse gas-mitigation potentials of bioenergy cropping systems (Miscanthus, rapeseed, and maize) based on farming conditions in Western Germany. Renew. Energy 2013, 55, 160–174. [Google Scholar] [CrossRef]
  98. Ozturk, H.H. Energy Analysis for Biodiesel Production from Rapeseed Oil. Energy Explor. Exploit. 2014, 32, 1005–1031. [Google Scholar] [CrossRef]
  99. Bharathiraja, B.; Chakravarthy, M.; Kumar, R.R.; Yuvaraj, D.; Jayamuthunagai, J.; Kumar, R.P.; Palani, S. Biodiesel Production Using Chemical and Biological Methods—A Review of Process, Catalyst, Acyl Acceptor, Source and Process Variables. Re-Newable Sustain. Energy Rev. 2014, 38, 368–382. [Google Scholar] [CrossRef]
Figure 1. 3D surface plots of RSM analysis representing the relationship between two independent variables on the hydrolysis yield (A); corresponding contour plot showing the relationship between various levels of the two factors (B).
Fermentation 09 00180 g001
Figure 2. Lipid yield obtained by L. tetrasporus DSM 70314 grown on wheat straw hydrolysate with three different nitrogen sources, Urea, Yeast Extract, and Soy flour, with different C/N ratios.
Fermentation 09 00180 g002
Figure 3. Microbial lipid production by L. tetrasporus DSM 70314 during 10 L fermentation in fed-batch mode. Profiles of cell mass, glucose, xylose, and lipids.
Fermentation 09 00180 g003
Figure 4. Scale-up of the process at 50 L bioreactor, in fed-batch mode, with L. tetrasporus DSM 70314 on wheat straw hydrolysate, soy flour as N sources, and C/N ratio of 160.
Fermentation 09 00180 g004
Figure 5. The mass balance of microbial lipid production from wheat straw using the oleaginous yeasts L. tetrasporus DSM 70314.
Fermentation 09 00180 g005
Table 1. Composition of raw wheat straw.
Feedstock Characterization %
Glucan38.4 ± 3.2
Xylan16.7 ± 1.1
Arabinan3.1 ± 0.2
Galactan1.2 ± 0.1
Lignin20.6 ± 1.1
Extractive4.3 ± 0.3
Ash6.2 ± 0.1
Other9.5 ± 3.4
Carbon43.6
Hydrogen6.4
Nitrogen0.2
Oxygen49.8
Table 2. Composition of pre-treated wheat straw. (a): Internal composition of water-insoluble fraction; (b): sugar solubilization recovery in the liquid fraction, with respect to each sugar in the initial raw material.
GlucanXylanArabinanGalactanLigninAshes
Internal composition of the
water-insoluble fraction (%)
47.63.40.10.329.55.6
Sugar recovery in the
liquid fraction (%)
2.287.537.964.5//
Table 3. Conversion rate of cellulose using different combinations of parameters.
Run% S/LFPUGlucose Y%
1201587.3
2201070.1
3251573.3
4252076.5
5251061.3
6201586.7
7151073.5
8201588.0
9152090.8
10151588.4
11202089.4
Table 4. ANOVA of the model-predicted glucose yield from biomass hydrolysis. Degree of Freedom (DF).
SourceDFF-Valuep-Value (Prob > F)
Model5117.21<0.0001significant
A-SL1173.55<0.0001
B-FPU1269.10<0.0001
AB10.660.4524
A2142.730.0013
B2162.340.0005
Residual5
Lack of Fit35.880.1489not significant
Pure Error2
Cor Total10
Table 5. Main sugars and inhibitor compounds present in steam-pre-treated wheat straw.
Glucose
gL−1
Xylose
gL−1
Galactose
gL−1
Arabinose
gL−1
A.a
gL−1
5-HMF
gL−1
Furfural
gL−1
Phenols
gL−1
WSH86.4 ± 0.916.2 ± 0.70.9 ± 0.11.7 ± 0.12.3 ± 0.20.140.715.0
HEM0.98 ± 0.116.4 ± 0.90.7 ± 0.11.4 ± 0.11.9 ± 0.30.150.725.3
WSH/HEM30.3 ± 0.716.3 ± 0.90.9 ± 0.11.7 ± 0.12.3 ± 0.20.150.725.2
Tables WSH > Wheat straw hydrolysate, sugar medium obtained from steam explosion, and enzymatic hydrolysis of wheat straw at optimized conditions; HEM > Hemicellulose, the liquid fraction obtained from steam-pre-treated wheat straw; WSH/HEM > WSH diluted with hemicellulose in the ratio of 1:2; A.a. > Acetic acid.
Table 6. Performance of L. tetrasporus DSM 70314, grown on wheat straw hydrolysate (30 gL−1 glucose, 16 gL−1 xylose) with three different nitrogen sources: Yeast extract (Y), Soy flour (S), and Urea (U), and 5 different C/N ratios, 40, 80, 120, 160, and 200.
1X
gL−1
2Y X
% w/w
X/h
gL−1h−1
1L
gL−1
2Y L
% w/w
3I L/X
% w/w
Y 4016.6 ± 0.6 a41.3 ± 0.9 a0.13 ± 0.01 a6.1 ± 0.2 a15.3 ± 0.2 a36.9 ± 0.1
S 4018.3 ± 0.6 a43.1 ± 2.0 a0.11 ± 0.01 a7.3 ± 0.1 a17.2 ± 0.2 a39.8 ± 1.0
U 4013.4 ± 0.6 b33.2 ± 0.9 b0.04 ± 0.01 b4.9 ± 0.3 b12.1 ± 0.9 b36.3 ± 3.0
Y 8015.0 ± 0.3 a36.9 ± 0.7 a0.08 ± 0.01 a6.6 ± 0.1 a16.3 ± 0.3 a44.0 ± 0.1 a
S 8016.8 ± 0.5 b40.2 ± 0.2 b0.10 ± 0.01 b7.5 ± 0.1 b17.8 ± 0.4 b44.3 ± 1.0 a
U 8011.8 ± 0.3 c28.8 ± 0.9 c0.05 ± 0.01 c6.9 ± 0.1 a16.7 ± 0.1 ab58.1 ± 1.0 b
Y 12014.7 ± 0.1 a34.7 ± 0.4 a0.08 ± 0.01 a7.2 ± 0.2 17.1 ± 0.749.3 ± 1.0 a
S 12015.6 ± 0.6 a37.0 ± 1.0 a0.08 ± 0.01 a7.9 ± 0.2 18.9 ± 0.450.9 ± 0.7 ab
U 12012.5 ± 0.4 b29.3 ± 0.5 b0.06 ± 0.01 b7.3 ± 0.217.2 ± 0.658.8 ± 3.0 b
Y 16013.8 ± 0.3 a33.9 ± 1.0 a0.10 ± 0.01 a7.9 ± 0.1 a19.4 ± 0.1 a57.3 ± 2.0 a
S 16015.3 ± 0.4 a36.9 ± 3.0 ab0.08 ± 0.01 b8.3 ± 0.2 a20.0 ± 0.4 ab54.3 ± 0.1 ab
U 16010.7 ± 0.2 b26.1 ± 1.0 ac0.05 ± 0.01 c6.7 ± 0.1 b16.3 ± 0.1 ac62.4 ± 2.0 ac
Y 20013.6 ± 0.1 a32.9 ± 0.9 a0.09 ± 0.01 a7.2 ± 0.1 a17.4 ± 0.9 a53.0 ± 1.0
S 20015.5 ± 0.4 b36.4 ± 0.2 b0.07 ± 0.01 b8.2 ± 0.2 b19.3 ± 0.2 ab53.1 ± 0.2
U 20012.3 ± 0.3 c29.8 ± 0.4 c0.06 ± 0.01 c6.7 ± 0.3 a16.2 ± 0.4 ac54.3 ± 0.7
1 Cell mass (X) and Lipids (L) produced were expressed in gL−1. 2 Yields (Y) were calculated as X (YX) or L (YL) produced per gram of sugar consumed ∗ 100. 3 Intracellular lipid (IL/X) was calculated as L/X ∗ 100. Productivity (X/h) was calculated as X produced in the time. For each C/N ratio, different superscript letters indicate statistically significant differences (p < 0.05) in performance parameters among the three nitrogen sources.
Table 7. Two-way ANOVA of factors affecting performance of L. tetrasporus DSM 70314, grown on wheat straw hydrolysate with different nitrogen sources and C/N ratios.
F Value
1 dfXYXLYLIL/X
N source:2273.5 ***152.2 ***187 ***62.19 **39.02 **
C/N ratio:442.07 **30.48 **90.69 ***34.69 **128.2 ***
Interaction:83.371 *2.177 *15.3 **5.706 *10.33 **
1 df = degree freedom. Significance codes: p < *** 0.001; ** 0.01; * 0.05. X = Cell Mass; YX = Cell Mass Yield; L = Lipids; YL = Lipid Yield; IL/X =Intracellular Lipids.
Table 8. Main FAs produced by L. tetrasporus DSM70314, in bench scale and bioreactor (10 and 50 L) from steam-pre-treated wheat straw in 3 different nitorgen sources, Yeast extract (Y), Urea (U), and Soy flour (S), and 5 different C/N ratios: 40, 80, 120, 160, and 200, respectively. The values have been normalized and correspond to % of the total FAs produced.
C12:0C14:0C16:0C16:1C18:0C18:1C18:2C18:3C20:0C22:0C24:01 Sat2 Unsat
Y 400.49 ± 0.030.66 ± 0.0129.60 ± 0.902.36 ± 0.0220.15 ± 0.7043.72 ± 0.801.10 ± 0.020.04 ± 0.010.59 ± 0.100.41 ± 0.070.88 ± 0.0752.78 ± 1.0047.22 ± 0.80
Y 800.55 ± 0.020.68 ± 0.0233.13 ± 0.901.59 ± 0.0123.67 ± 0.2037.50 ± 0.900.90 ± 0.01-0.83 ± 0.071.15 ± 0.15-60.01 ± 0.9039.99 ± 0.90
Y 120--31.10 ± 1.002.07 ± 0.0321.50 ± 0.5043.41 ± 0.701.04 ± 0.01---0.89 ± 0.0853.49 ± 1.0046.51 ± 0.70
Y 1600.39 ± 0.010.64 ± 0.0131.88 ± 1.002.15 ± 0.0119.60 ± 0.7041.98 ± 0.901.11 ± 0.02-0.71 ± 0.150.49 ± 0.041.05 ± 0.0954.76 ± 1.0045.24 ± 0.90
Y 2000.39 ± 0.010.63 ± 0.0231.60 ± 1.002.06 ± 0.0120.66 ± 0.2042.49 ± 1.001.03 ± 0.01-0.72 ± 0.100.42 ± 0.05-54.42 ± 1.0045.58 ± 1.00
U 40--32.54 ± 0.702.04 ± 0.0119.90 ± 0.4044.10 ± 0.701.40 ± 0.010.03 ± 0.01---52.43 ± 0.8047.57 ± 0.70
U 800.41 ± 0.010.60 ± 0.0130.92 ± 0.702.14 ± 0.0119.77 ± 0.6043.22 ± 0.900.88 ± 0.01-0.68 ± 0.090.42 ± 0.060.94 ± 0.0552.81 ± 0.9047.19 ± 0.90
U 1200.35 ± 0.030.49 ± 0.0131.77 ± 0.502.23 ± 0.0119.61 ± 0.9042.34 ± 1.000.91 ± 0.02-0.67 ± 0.050.50 ± 0.051.12 ± 0.0654.51 ± 1.0045.49 ± 1.00
U 1600.44 ± 0.010.69 ± 0.0132.08 ± 0.302.19 ± 0.0119.76 ± 0.6041.72 ± 0.500.92 ± 0.01-0.65 ± 0.070.44 ± 0.041.10 ± 0.0655.17 ± 0.7044.83 ± 0.50
U 2000.41 ± 0.010.65 ± 0.0131.99 ± 0.802.27 ± 0.0119.89 ± 0.3041.67 ± 0.600.92 ± 0.01-0.71 ± 0.040.43 ± 0.041.05 ± 0.0655.14 ± 0.9044.86 ± 0.60
S 400.41 ± 0.020.56 ± 0.0121.89 ± 0.105.56 ± 0.0318.83 ± 0.9045.09 ± 0.502.29 ± 0.010.11 ± 0.014.27 ± 0.030.39 ± 0.040.59 ± 0.0446.95 ± 0.9053.05 ± 0.50
S 800.38 ± 0.010.66 ± 0.0224.98 ± 0.505.93 ± 0.0218.09 ± 0.5045.81 ± 0.802.42 ± 0.02-0.73 ± 0.030.43 ± 0.050.55 ± 0.0745.84 ± 0.7054.16 ± 0.80
S 1200.50 ± 0.020.68 ± 0.0120.73 ± 0.407.12 ± 0.0316.80 ± 0.6049.72 ± 0.902.59 ± 0.01-0.70 ± 0.090.40 ± 0.040.75 ± 0.0440.57 ± 0.8059.43 ± 0.90
S 1600.49 ± 0.010.72 ± 0.0220.80 ± 1.006.43 ± 0.0319.58 ± 0.2047.70 ± 1.002.40 ± 0.01-0.62 ± 0.120.40 ± 0.030.84 ± 0.0543.47 ± 1.0056.53 ± 1.00
S 2000.39 ± 0.010.70 ± 0.0120.49 ± 1.005.56 ± 0.0320.53 ± 0.9047.83 ± 1.002.44 ± 0.02-0.64 ± 0.100.46 ± 0.040.94 ± 0.0944.17 ± 1.0055.83 ± 1.00
10 L0.80 ± 0.010.34 ± 0.0126.95 ± 0.704.14 ± 0.016.59 ± 0.6055.93 ± 0.805.24 ± 0.01----34.69 ± 0.9065.31 ± 0.80
50 L--26.70 ± 0.803.38 ± 0.027.65 ± 0.9057.20 ± 0.703.42 ± 0.01-0.71 ± 0.010.49 ± 0.040.45 ± 0.0935.99 ± 1.0064.01 ± 0.70
1 Sat > sum of saturated fatty acids. 2 Unsat > sum of unsaturated fatty acids.
Table 9. Biodiesel yield per hectare from conventional feedstock.
FeedstockBiodiesel Yield (L ha−1)Reference
Wheat straw500This work
Canola300[96]
Rapeseed800[98]
Sunflower400–1000[95]
Soybean600–700[99]
Sugarcane4000[83]
Disclaimer/Publisher’s Note: The statements, opinions and data contained in all publications are solely those of the individual author(s) and contributor(s) and not of MDPI and/or the editor(s). MDPI and/or the editor(s) disclaim responsibility for any injury to people or property resulting from any ideas, methods, instructions or products referred to in the content.

