Article

Correlation of Ruminal Fermentation Parameters and Rumen Bacterial Community by Comparing Those of the Goat, Sheep, and Cow In Vitro

College of Animal Science and Technology, Hebei Agricultural University, Baoding 071000, China
*
Authors to whom correspondence should be addressed.
These authors contribute equally to this work.
Fermentation 2022, 8(9), 427; https://doi.org/10.3390/fermentation8090427
Submission received: 6 July 2022 / Revised: 23 August 2022 / Accepted: 24 August 2022 / Published: 28 August 2022
(This article belongs to the Special Issue Recent Advances in Rumen Fermentation Efficiency)

Abstract

:
In this study, we aimed to establish the correlation between ruminal fermentation parameters and the bacterial community by comparing those of the goat, sheep, and cow, thus illustrating the main bacteria causing the difference in rumen fermentation among goats, sheep, and cows and providing a new idea for improving the feed digestibility of ruminants. Rumen fluid from goats (Taihang White cashmere goat, n = 6), sheep (Hu sheep, n = 6), and cows (Holstein cow, n = 6) was collected using oral intubation and immediately brought back to the laboratory for a fermentation test with the same total mixed ration (TMR) feed in vitro. The rumen bacterial composition was measured by high-throughput sequencing of 16S rRNA genes in the MiSeq platform, the gas production (GP) was recorded after 2, 4, 6, 8, 10, 12, 24, 36, and 48 h of fermentation, and the feed nutrient digestibility and the rumen fluid parameters were determined after 48 h of fermentation. The results showed that the 48 h GP of the sheep group was higher than that of the cow group (p < 0.05), and the theoretical maximum GP was higher than that of the goat and cow groups (p < 0.05). The organic matter digestibility (OMD), dry matter digestibility (DMD), crude protein digestibility (CPD), and gross energy digestibility (GED) of the sheep group were higher than those of the goat and cow groups (p < 0.05). The ammonia nitrogen (NH3-N), microbial protein (MCP), and total volatile fatty acids (TVFA) concentrations of the sheep group were higher than those of the other groups (p < 0.05), and the pH of the sheep group was lower than those of the other groups (p < 0.05). The 16S rRNA gene sequencing revealed that bacterial composition also differed in the rumens of the sheep, goat, and cow groups (ANOSIM, p < 0.05). We then used a random forest machine learning algorithm to establish models to predict the fermentation parameters by rumen bacterial composition, and the results showed that rumen bacterial composition could explain most of the ruminal fermentation parameter variation (66.56%, 56.13%, 65.75%, 80.85%, 61.30%, 4.59%, 1.41%, −3.13%, 34.76%, −25.62%, 2.73%, 60.74%, 76.23%, 47.48%, −13.2%, 80.16%, 4.15%, 69.03%, 32.29%, and 89.96% for 48 h GP, a (GP of quickly degraded part), b (GP of slowly degraded part), c (GP rate), a + b (theoretical maximum GP), DMD, OMD, GED, CPD, NDFD, ANDF, pH, NH3-N, MCP, acetic acid, propionic acid, butyric acid, valeric acid, TVFA, and A:P (acetic acid–propionic acid ratio), respectively). A correlation analysis revealed that Lactobacillus, Prevotellaceae_UCG-003, Selenomonas, Peptostreptococcus, and Olsenella significantly correlated with most in vitro fermentation parameters (p < 0.05). A comprehensive analysis showed that rumen fermentation parameters and bacterial composition differed in goats, sheep, and cows. The ruminal fermentation parameters of GP, a, b, c, a + b, pH, NH3-N, propionic acid, valeric acid, and A:P could be accurately predicted by rumen bacteria (explanation > 55% of variation), and the Lactobacillus, Prevotellaceae_UCG-003, Olsenella, Selenomonas, and Peptostreptococcus were the main bacteria that affected the in vitro fermentation parameters of goats, sheep, and cows.

1. Introduction

Rumen fermentation plays an important role in feed efficiency, productivity, and health for ruminants. With the help of colonized microbes, the rumen can transfer low-quality plant protein and nonprotein nitrogen to high-quality microbial protein and can hydrolyze plant fibers to volatile fatty acid (VFA), thus improving the feed digestibility [1]. Some studies have concluded that microbial protein synthesis in the rumen provides the majority of required protein (accounting for 50 to 80% of the total absorbable protein) [2] and that VFAs produced in the rumen provide about 75% of the total metabolic energy for ruminants [3]. Therefore, targeting rumen fermentation is an efficient way to enhance feed digestion for ruminants.
Understanding the main factor affecting rumen fermentation is the key step in enhancing rumen feed digestion. Previous studies observed that the feed composition [4], the feed type, feed processing, and additives could affect rumen fermentation [5,6], but these feed factors could not explain the feed digestibility differences among different species of ruminants, even with similar feed, as observed in our previous studies. Some studies also demonstrated that the composition of rumen bacteria, fungi, and protozoa, as well as their cooperative and competitive relationships, affect rumen fermentation [7,8,9], such as the feed degradation rate of cattle, which can be improved by transferring the rumen contents of buffalo to the rumens of cattle [10]. The degradation of crude fiber increased after the removal of protozoa [11], and supplementation with Bacillus licheniformis in feed increased the digestibility of neutral detergent fiber (NDF), acid detergent fiber (ADF), and organic matter (OM) [12]. Some studies have also shown that the rumen microbial community of different species of ruminants differed [13,14]. Thus, we speculated that the microbiota composition difference of different species of ruminants might contribute to their feed digestibility variation and that some bacterial taxa might play key roles.
To test this hypothesis, in this study in vitro fermentation, which is a widely used method to evaluate rumen fermentation, was performed [15], and goats (Taihang White cashmere goat), sheep (Hu sheep), and cows (Holstein cow) were used as experimental animals [16,17] to establish the correlation between their rumen bacterial communities and fermentation parameters with a random forest machine learning algorithm.

2. Materials and Methods

2.1. Animals and Feed Management

The donor animals and experimental procedures were approved by the requirements of the Ethical Committee of Hebei Agricultural University (ID: KY202016).
Female goats (Taihang White cashmere goat, n = 6), sheep (Hu sheep, n = 6), and cows (Holstein cow, n = 6) with similar body conditions (3.0 ± 0.5 in body condition score) were selected as experimental animals, and the goats, sheep, and cows were all at their fully matured stage at around two years old. The goats, sheep, and cows had mean rectal temperatures of 38.90 ± 0.87 ℃, 39.10± 0.91 ℃, and 38.50 ± 1.03 ℃ and mean body weights of 36.50 ± 1.02 kg, 48.50 ± 1.25 kg, and 705.60 ± 20.34 kg, respectively. In addition, two veterinarians evaluated the health status of the animals independently from various aspects such as heart rate, respiratory rate, and appetite to ensure the animals were in a healthy condition. The experimental animals were all raised at the laboratory animal center of Hebei Agricultural University (Baoding, Hebei, China) with the same total mixed ration (TMR) according to NRC (2001) with a concentrate–roughage ratio of approximately 7:3 and were fed twice daily (8:00 a.m and 4:00 p.m). All animals were free to access feed and clear water. Feed and residuals were collected each day, and 500 g subsamples were achieved by the quartering method for analyzing nutrient levels and providing fermentation substrates, as in a previous study [18]. The feed composition and nutritional levels are shown in Table 1.

2.2. Rumen Fluid Preparation

After 14 days of adaptation to the experimental diet, approximately 450 mL of rumen digesta were collected with oral intubation (Anscitech Company, Hangzhou, China) 1 h before morning feeding from each individual goat, sheep, and cow on the same day [19]. The insertion depth was considered, as the tube approximately reached the bottom of the rumen based on the body size of each animal. The first 10 mL of achieved digesta were discarded to avoid saliva contamination, the obtained digesta was filtered through four layers of sterile cheesecloth, and the rumen fluid was immediately collected and moved into prewarmed (39 ℃) anaerobic thermos flasks (by injecting CO2) in 10 min from the time the digesta were obtained, which were then brought back to the laboratory for in vitro fermentation in 2 h. For each animal, 2 mL of rumen fluid was also collected on site and stored at −80 ℃ in sterile tubes 5 min after the rumen fluid was obtained for sequencing the 16S rRNA genes.

2.3. In Vitro Incubation

The rumen buffer (pH = 6.86) was prepared according to the method of Menke [20], and CO2 was continuously injected into the buffer solution for approximately 30 min prior to inoculation [21]. The pH of the rumen fluid of each animal was measured with a pH EL-20 acidometer (Lecurn Fllid Controls Company, Shanghai, China), and all of them were within a range of 6.7 ± 0.2. The bacterial density of the rumen fluid of each animal was checked on a bacterial counting plate and adjusted to (5.00 ± 0.25) ×1010 bacteria/mL of rumen fluid by adding rumen buffer before incubation. After the ruminal inoculum was obtained for each animal, a total of 2 g of feed substrate (Table 1), 100 mL of rumen fluid, and 200 mL of prewarmed buffer solution were added to each plastic incubation bag with 500 mL capacity (Anscitech Company, Hangzhou, China). All incubation bags (3 animal species × 6 individuals for each species × 4 replicates) were deoxygenated and sealed using a bag vacuum packer (Aodeju Company, Huzhou, China) to create anaerobic conditions. Then, the incubation bags were placed in a 39 ℃ thermostatic water bath (Jerriel Company, Changzhou, Jiangsu, China) with a speed of 45 r/min for incubation. The gas production (GP) readings (mL) were measured and recorded at 2, 4, 6, 8, 10, 12, 24, 36, and 48 h after incubation by a graduated syringe. Additionally, three blank incubation bags with rumen fluid and buffer only without feed substrate were used to correct the GP.

2.4. Sampling

At the end of the 48 h incubation, the plastic incubation bags were immediately moved into an ice-water bath for 30 min to stop fermentation [22]. The digesta were filtered through predried and weighted 5.5 × 4.5 cm nylon bags (300 mesh), and fermented rumen fluid and residuals were separated and collected. The pH of the fermented rumen fluid was measured immediately after filtering with a pH EL-20 acidometer (Lecurn Fllid Controls Company, Shanghai, China). Then, the fermented rumen fluid of each incubation bag was divided among six 2 mL sterile tubes. Two tubes were centrifuged at 4000× g for 15 min at 4 ℃, the supernatants were mixed with 0.2 mL of meta-phosphoric acid solution (250 g/L) at 4 ℃ for 30 min, the mixtures were centrifuged at 10,000× g for 10 min at 4 ℃, and subsequently, the supernatants were collected for volatile fatty acid (VFA) analysis [21]. Two tubes were centrifuged at 3000 r·min−1 for 10 min, the supernatant was separated and stored at −20 ℃, and the concentration of ammonia nitrogen (NH3-N) was determined [22]. The other two sterile tubes were immediately stored at −20 ℃ for microbial protein (MCP) analysis [21]. The fermented rumen residuals were withdrawn and sealed up in the 5.5 × 4.5 cm filtered nylon bags (300 mesh), and the filtered nylon bags were then washed with distilled water and squeezed manually until the water was clear, and four filter nylon bags containing pre-incubated feed were also used to correct the escaped feed substrates. Then, all the filter nylon bags were dried at 65 ℃ for 48 h for further chemical analysis.

2.5. Chemical Analysis

The diet substrate and un-degraded residuals were dried at 65 ℃ for 48 h, and the organic matter (OM), dry matter (DM), gross energy (GE), crude protein (CP), neutral detergent fiber (NDF), acid detergent fiber (ADF), ether extract (EE), starch, and nonstructural carbohydrate (NSC) were determined by using the AOAC (2016) method [18]. The MCP concentration was measured by the Coomassie brilliant blue method [23], and the NH3-N concentration was determined by indophenol colorimetry according to Chaney et al. [24]. The VFA analysis was performed with gas chromatography (7890A, Agilent, United Kingdom) according to the method described by Zhou et al. [25]. Briefly, H2 was used as the carrier gas with a 30 m × 320 µm × 0.5 µm capillary column (AT-FFAP), the gas chromatograph column temperature was set at 1 min hold (60 ℃), 5 ℃·min−1 to 120 ℃ (not held), 10 ℃·min−1 to 180 ℃, the detector temperature was set at 250 ℃, and the injection port temperature was set at 220 ℃.
The dry matter digestibility (DMD), organic matter digestibility (OMD), crude protein digestibility (CPD), gross energy digestibility (GED), neutral detergent fiber digestibility (NDFD), and acid detergent fiber digestibility (ADFD) were calculated by the weight and nutrient content change of the substrate (DM basis) before and after in vitro fermentation.
The GP parameters were calculated according to the following formula:
GPt = a + b (1 − e−ct)
where t is a time point during rumen in vitro fermentation (h); GPt is the GP at time t (mL); a is the GP of the quickly degraded part (mL); b is the GP of the slowly degraded part (mL); c is the GP rate (×103 h−%), and a + b is the theoretical maximum GP (mL). [26].

2.6. DNA Extraction and High-Throughput Sequencing

A total of 18 samples, with one sample from each individual animal, were used for DNA extraction and high-throughput sequencing. Bacterial DNA in the rumen fluid was extracted using the RNeasy Mini kit (Allwegene Tech, Beijing, China) following the manual. The total DNA concentration and purity were determined using the NanoDropND-1000 spectrophotometer (Thermo Fisher Scientific, Waltham, MA, USA). The V3–V4 (338–806) region of the bacterial 16S rDNA genes was amplified with the primers 338 F (5′-ACTCCTAC GGGAGGCAGCAG-3′) and 806 R (5′-GGACTACHVGGGTWTCTAAT-3′), as described by Guo et al. [27]. Amplicons were extracted from 2% agarose gels, purified using the AxyPrepDNA Gel Extraction Kit (Axygen Biosciences, Union City, CA, USA), and quantified using the PCR carried out on a Mastercycler Gradient (Eppendorf, Hamburg, Germany) in 28 μL reaction volumes containing 12.5 μL of 2xTaq Plus Master Mix, 1 µL of Forward Primer (5 µM), 1 µL of Reverse Primer (5 µM), 3 µL of BSA (2 ng/µL), 3 µL of DNA (total template quantity was 30 ng), and 7.5 µL of ddH2O. The PCR amplification procedure was performed as follows: pre-denaturation for 5 min (94 ℃); denaturation for 30 s (94 ℃), annealing for 30 s (50 ℃), extension for 60 s (72 ℃), 30 cycles; final extension for 7 min (72 ℃). High-throughput sequencing was performed on the Illumina MiSeq (Illumina, San Diego, CA, USA) platform.

2.7. Bioinformatic Analysis

The raw data based on the Illumina HiSeq sequencing platform (Illumina, San Diego, CA, USA) were screened by a quality control process (Trimmomatic v 0.36), double-end splicing (Flash v 1.2.0 and Pear v 0.9.6), and chimera removal (Uchime v 4.2). A total of 266,865, 284,931 and 293,881 raw tags and 259,267, 270,789 and 281,722 clean tags were obtained for the goat, sheep, and cow groups, respectively, with 43,211, 45,131, and 46,953 clean tags (reads) for each individual of the goat, sheep, and cow groups, respectively. Then, operational taxonomic units (OTUs) were de novo-clustered with a 97% sequence similarity cutoff using UPARSE (version 7.1, https://www.nature.com/articles/nmeth.2604, accessed on 17 June 2022). Finally, 1346, 2649, and 3541 OTUs were obtained for the goat, sheep, and cow groups, respectively. The OTUs were then taxonomically annotated based on the Silva (bacteria) taxonomic database. The QIIME2 software (https://qiime2.org, accessed on 17 June 2022) was used to calculate the alpha diversity (Chao1 and Shannon indices) and the beta diversity (principal coordinates analysis (PCoA) based on the Bray–Curtis distance). The multisample rarefaction curve indicated the curve reached a plateau at about 20,000 reads, and the sequencing coverage was saturated (Figure S1).

2.8. Statistical Analysis

All fermentation parameters (n = 6 for each animal species and each parameter of each individual animal was calculated by the means of the four repeatedly measured replicates) were analyzed using the one-way ANOVA of SPSS 22.0 (SPSS, Chicago, IL, USA) software with a model of yi = µ + xi + ei, where yi is the dependent parameters, µ is the overall mean, xi is the effect of groups (goats, sheep, or cows), and ei is the residual error. Duncan’s multiple comparison method was used to assess differences between the groups, and a significant difference was considered at p < 0.05. The prediction model for the in vitro fermentation parameters using bacterial composition was based on random forest in R software (version 3.6.3, https://link.zhihu.com/?target=https%3A//www.r-project.org, accessed on 17 June 2022) with the randomForest package (version 4.6–14, https://stackoverflow.com/questions/68972153/r-randomforest-localimp-for-test-set, accessed on 17 June 2022), which was also screened by the increase in the mean squared error (%IncMSE) and cross-validation curve. Bacterial biomarkers were determined by the lowest cross-validation error and the top IncMSE score. The correlations between the in vitro fermentation parameters and rumen bacteria (relative abundance > 0.5%) were analyzed by spearman correlation tests. The p value of the bacterial abundance comparison and the correlation of the in vitro fermentation parameters with the rumen bacterial biomarker taxa were adjusted in R software with the p.adjust function, and a significant difference was considered at (adjusted p-value) FDR < 0.05.

3. Results

3.1. Comparison of Ruminal Cumulative GP and GP Parameters between the Goat, Sheep, and Cow

The GP at each time point was lowest in the cow group. In particular, the 48 h cumulative GP of sheep and goats was higher than that of cows (p < 0.05). The GP of the quickly degraded part (a) of the cow group was lower than those of the goat and sheep groups (p < 0.05), the GP of the slowly degraded part (b) and the theoretical maximum GP (a + b) of the sheep group were significantly higher than those of the other groups (p < 0.05), and the GP rate (c) was highest in the goat group and lowest in the cow group (p < 0.05) (Table 2).

3.2. Comparison of Feed Nutrient Degradation between the Goat, Sheep, and Cow

The OMD, DMD, CPD, and GED of the sheep group were significantly higher than the goat and cow groups (p < 0.05), and the NDFD and ADFD were not different among groups (p > 0.05) (Table 3).

3.3. Comparison of Rumen Fluid Parameters between the Goat, Sheep, and Cow

The pH of the sheep group was significantly lower than those of the goat and cow groups (p < 0.05), and the NH3-N and MCP concentrations of the sheep group were significantly higher than those of the other groups (p < 0.05). The acetate concentration of the sheep group was significantly higher than that of the cow group (p < 0.05), and the propionate concentration of the sheep and cow groups were significantly higher than that of the goat group (p < 0.05). The butyrate, valeric acid, and TVFA concentrations of the sheep group were significantly higher than those of the goat and cow groups (p < 0.05), and the acetic acid–propionic acid ratio (A:P) of the goat group was significantly higher than those of the other groups (p< 0.05) (Table 4).

3.4. Comparison of the Rumen Bacterial Community between Goat, Sheep, and Cow

The Chao 1 index and Shannon index had no differences between the sheep and cow groups (p > 0.05), but that of the goat group was lower than the sheep and cow groups (p < 0.05) (Figure 1A,B). A PCoA showed that bacterial composition was significantly different among the sheep, goat, and cow groups (R = 1; ANOSIM p < 0.05) (Figure 1C). A total of 1122 OTUs were obtained in the current experiment. The shared OTUs in the goat, sheep, and cow groups only accounted for 37.61%, and the unique OTUs in the goat, sheep, and cow groups were 2.23%, 5.08%, and 20.68%, respectively (Figure 1D).

3.5. Comparison of Rumen Bacterial Composition between the Goat, Sheep, and Cow

In total, 18 phyla, 32 classes, 64 orders, 107 families, and 239 genera were detected. At the phylum level, four phyla had relative abundances greater than 1%, and the relative abundance of Firmicutes accounted for 61.68% and 59.15% in the sheep and cow groups, which was significantly higher than that of the goat group (p < 0.05). The relative abundance of Proteobacteria in the goat group was highest, while that in the sheep group was lowest among the three groups (p < 0.05), and the relative abundances of Bacteroidota and Actinobacteriota of the sheep group were significantly higher than those of the goat group (p < 0.05) (Table 5). At the genus level, 11 genera had relative abundances greater than 1%. Escherichia-Shigella was the dominant genera in the goat group; Prevotella, Streptococcus, and Olsenella were the dominant genera in the sheep group; and Prevotella, Streptococcus, and Escherichia-Shigella were the dominant genera in the cow group when considering relative abundances higher than 10%. The relative abundance of Escherichia-Shigella in the sheep group was significantly lower than those of the goat and cow groups (p < 0.05), the relative abundances of Prevotella and Streptococcus in the sheep and cow groups were significantly higher than those of the goat group (p < 0.05), and the relative abundance of Olsenella in the sheep group was significantly higher than those of the goat and cow groups (p < 0.05) (Table 6).

3.6. Prediction of Fermentation Parameters by Rumen Bacterial Composition Based on Random Forest Machine Learning Algorithm

The in vitro fermentation parameters were predicted by rumen bacterial composition at the genus level using the random forest machine learning algorithm. First, we observed that the rumen bacterial community at the genus level could explain 80.16% of the variation in the propionic acid content in the goat, sheep, and cow groups, and with the cross-validation error curve, 10 genera were detected as biomarker taxa (Figure 2). Using the same method, we also predicted the other fermentation parameters (48 h GP, a, b, c, a + b, DMD, OMD, GED, CPD, NDFD, ANDF, pH, NH3-N, MCP, acetic acid, butyric acid, valeric acid, TVFA, and A:P), and the rumen bacterial community could explain most of the fermentation parameters (Table 7).

3.7. Correlation of the In Vitro Fermentation Parameters with Rumen Bacterial Biomarker Taxa

Correlations of the dominant bacterial biomarker taxa (relative abundance higher than 0.5%) with rumen fermentation parameters were constructed, and a total of 22 bacterial taxa at the genus level were observed to be significantly correlated with rumen fermentation parameters (p < 0.05). Among these, Lactobacillus, Olsenella, Prevotellaceae_UCG-003, Selenomonas, and Peptostreptococcus were positively correlated with most of the in vitro fermentation parameters (p < 0.05), while some potential pathogens, such as Citrobacter and Escherichia-Shigella, were negatively correlated with most of the in vitro fermentation parameters (p < 0.05) (Figure 3).

4. Discussion

Gas production (GP) is produced by rumen microorganisms, and it is positively correlated with both the feed quality and the activity of rumen microorganisms [28,29]. In this study, even with the same feed substrate, we observed different GP and GP parameters between different species of ruminants, and the sheep group had the highest GP and theoretical maximum GP (a + b). Correspondingly, we also observed that the nutrient digestibility of OM, DM, CP, and GE in the goat and cow groups were lower than that of the sheep group, although no difference was observed in the nutrient digestibility of NDF and ADF between the goat, sheep, and cow groups. Li et al. previously found that the anaerobic fungi population in the sheep rumen were greater than that of the goat, but the bacteria and ciliates populations were smaller than those of the goat [30]. The ability of gas production and the degradation of plant fragments for different microbes differed [31], which might be the reason why gas production and feed digestibility differed between the goat, sheep, and cow groups, even when the same feed was provided.
Ruminal pH is an important indicator of the homeostasis of the rumen metabolism and environment and usually varies from 5.0 to 7.5 [32]. In this study, the ruminal pH values of the goat, sheep, and cow groups were all within the normal range, but the ruminal pH of the sheep group was lower than those of the goat and cow groups, and there were no significant differences between the goat and cow groups. This might be caused by the greater quantities of TVFA produced during the rumen microbial fermentation of the sheep, but no significant difference in the TVFA produced by goats and cows was observed. Domngue et al. [33] also found that goats and sheep with the same forage feed also had different VFA contents in the rumen, indicating the microbes in different species of ruminants might contribute to the ruminal pH and VFA content variations. Isac et al. [34] found that the A:P of goats was significantly higher than that of sheep, which is the same as our findings. Some studies inferred that methyl malonyl CoA mutase activity played an important role in changing propionic acid production in the rumen and causing the dysregulation of glucose homeostasis for ruminants, which were mainly produced by Prevotella, which could be affected by multiple factors [35,36]. We also observed that the relative abundances of Prevotella in the sheep and cow groups were higher than that of the goat group as well as low propionic acid production in the rumens of goats, which may be the main reason for the increased A:P. NH3-N can be used to synthesize MCP and is the intermediate product of rumen microbial decomposition of nitrogen-containing substances, The optimal concentration range of NH3-N is 2.37–27.3 mg/dL [37], and MCP is the most important nitrogen source for ruminants, providing 40%−80% of their protein requirements. In this study, the content of NH3-N and MCP in the sheep group was also higher than in the goat and cow groups.
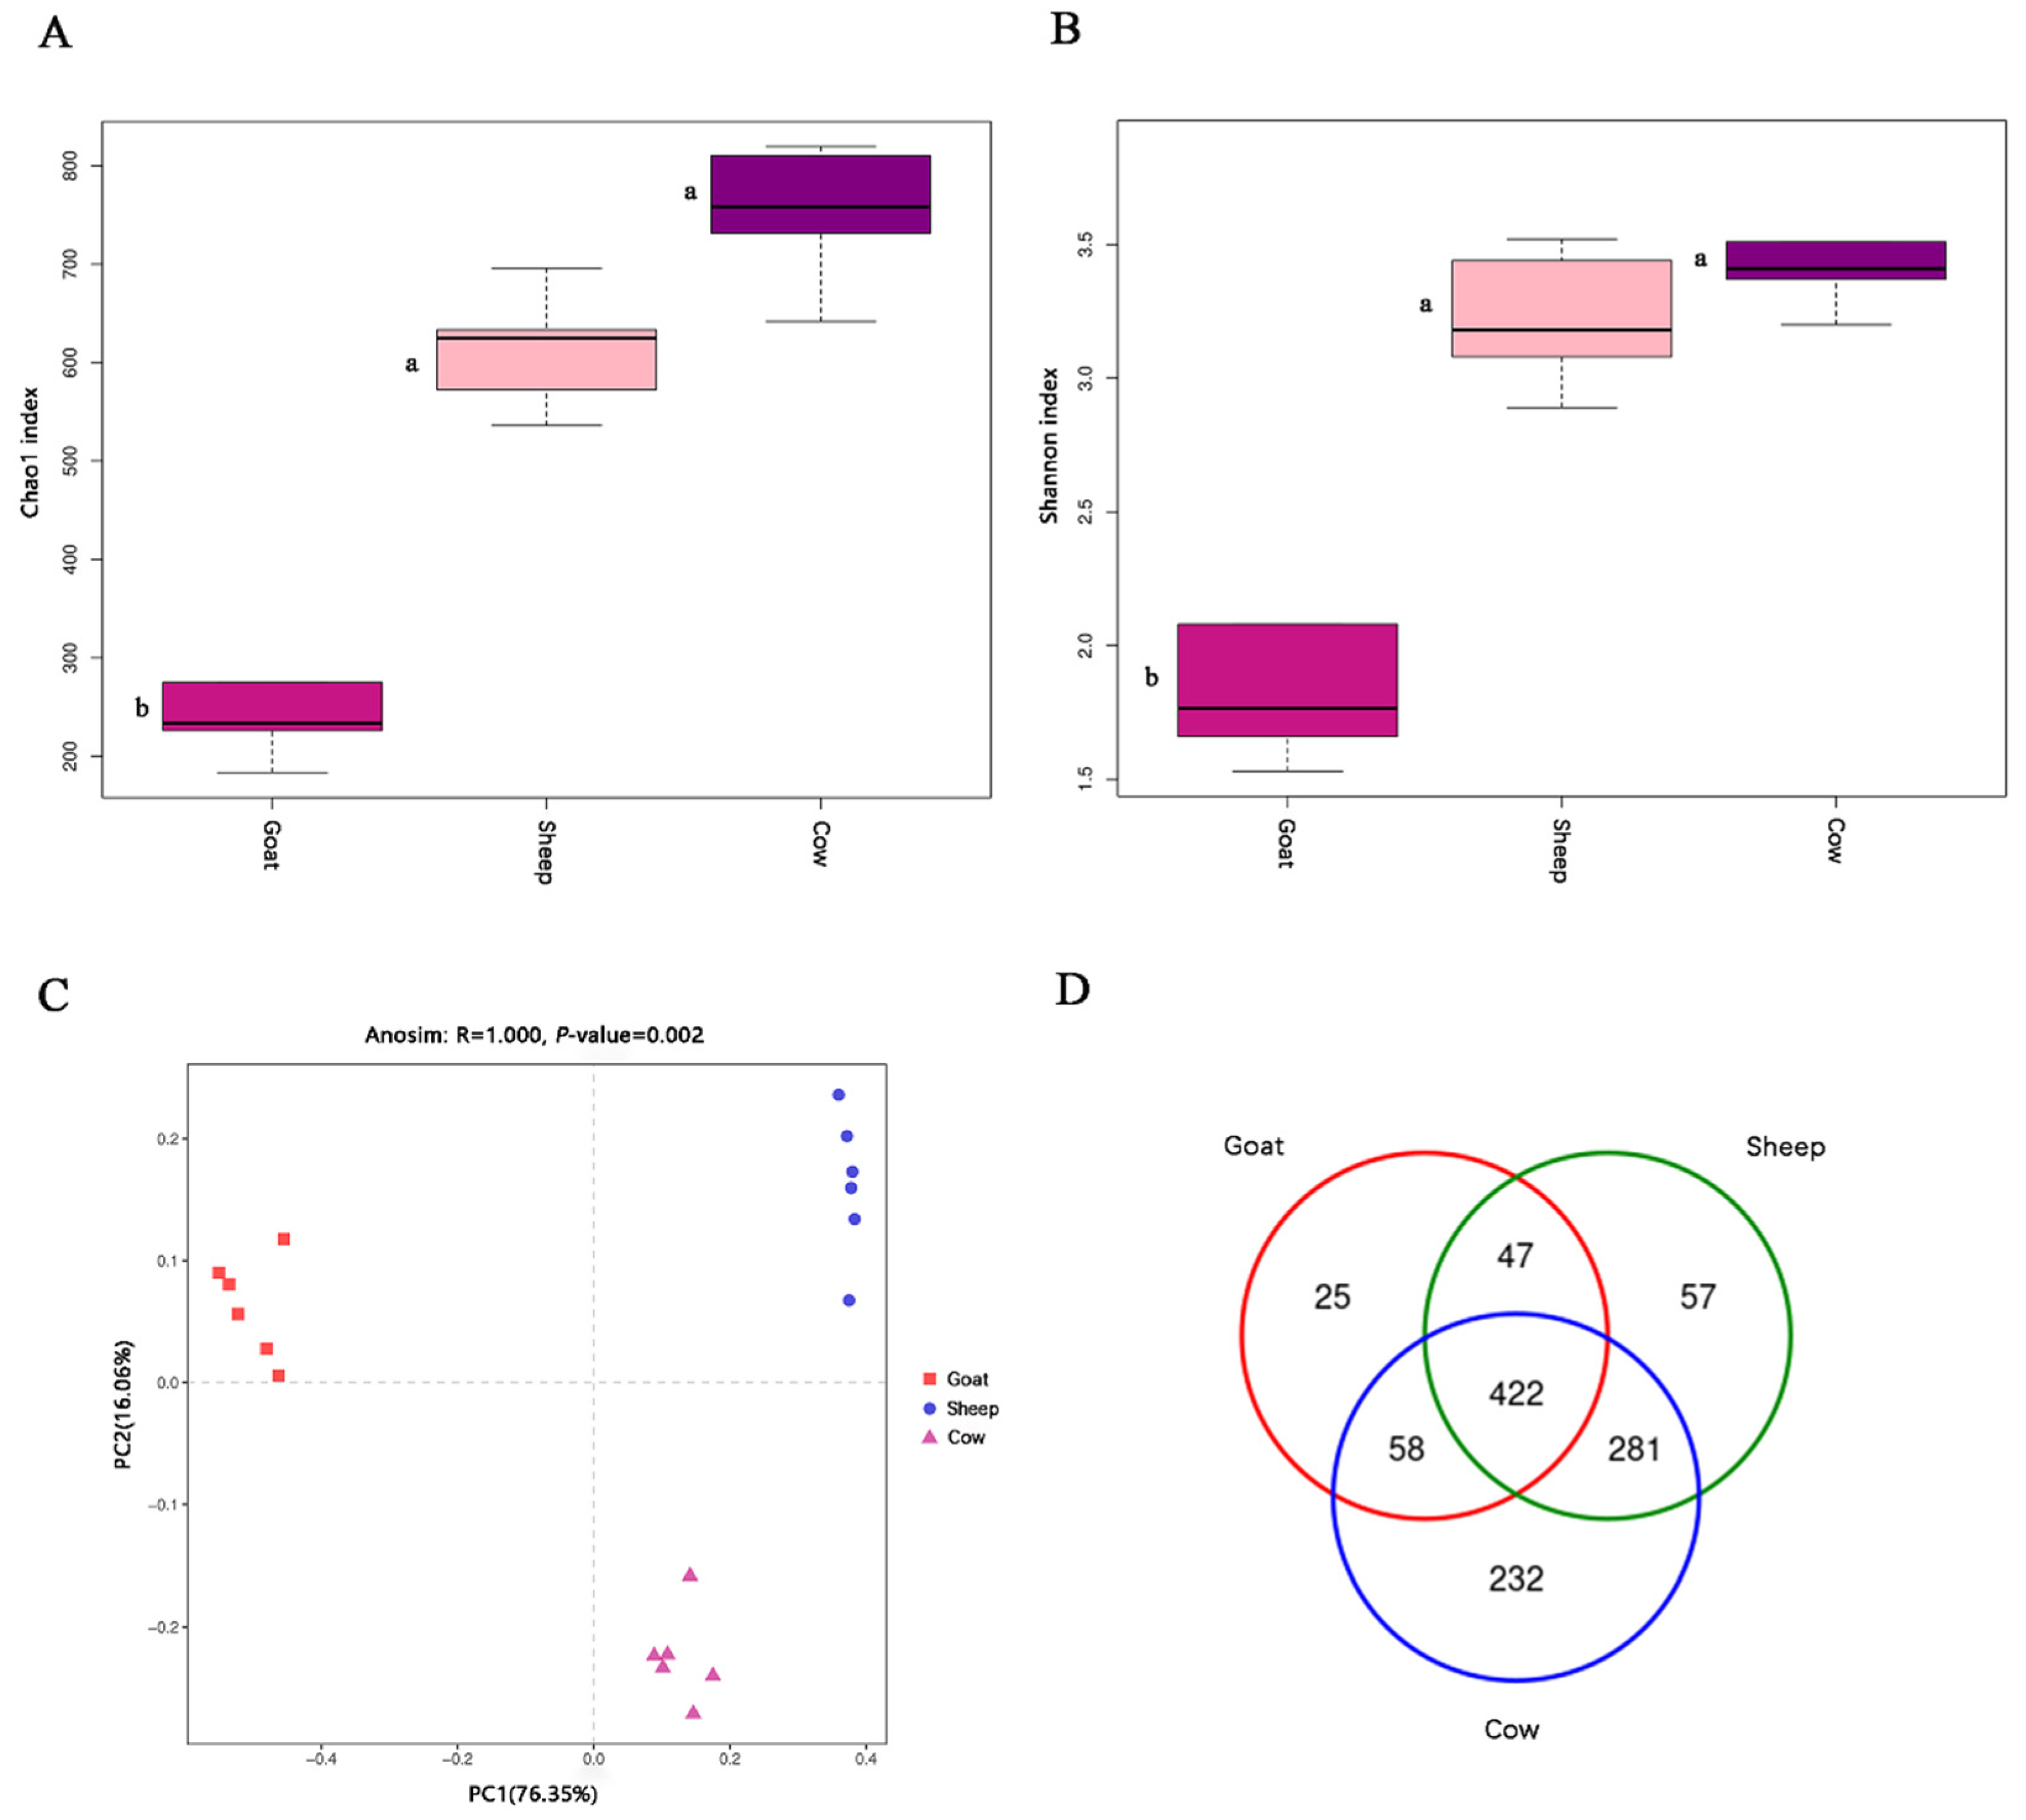
We found that there were significant differences in the bacterial communities of the goat, sheep, and cow. Firmicutes were the main dominant phyla of the sheep and cow, but Proteobacteria was the main dominant phylum of the goat. Firmicutes could improve the abundance of genes encoding enzymes related to energy metabolism [38], promote the digestibility of oligosaccharides, starch, and cellulose [39], and improve the enzyme activity and rumen fermentation. Proteobacteria are Gram-negative bacteria, mainly including escherichia coli, vibrio, spirobacter, and other pathogens, most of which are the main factors threatening the health of livestock [40]. At the genus level, Prevotella and Streptococcus were the main dominant genera of the sheep and cow. Streptococcus could obtain glucose through the phosphotransferase system and produce lactic acid through glycolysis or the hexose diphosphate pathway [41]. It was found that starch-based high-concentrate feed can cause the rapid proliferation and growth of Streptococcus in the rumens of ruminants, which generate large amounts of lactic acid by fermentation with easily fermentable carbohydrates [42], resulting in lactic acid accumulation and accelerating the process of rumen acidosis. Therefore, maintaining rumen Streptococcus in the normal range was of great significance for preventing rumen acidosis in ruminants. The results of this study suggest that the high abundance of Streptococcus in the sheep and cow rumens might induce a greater susceptibility to rumen acidosis than the goat.
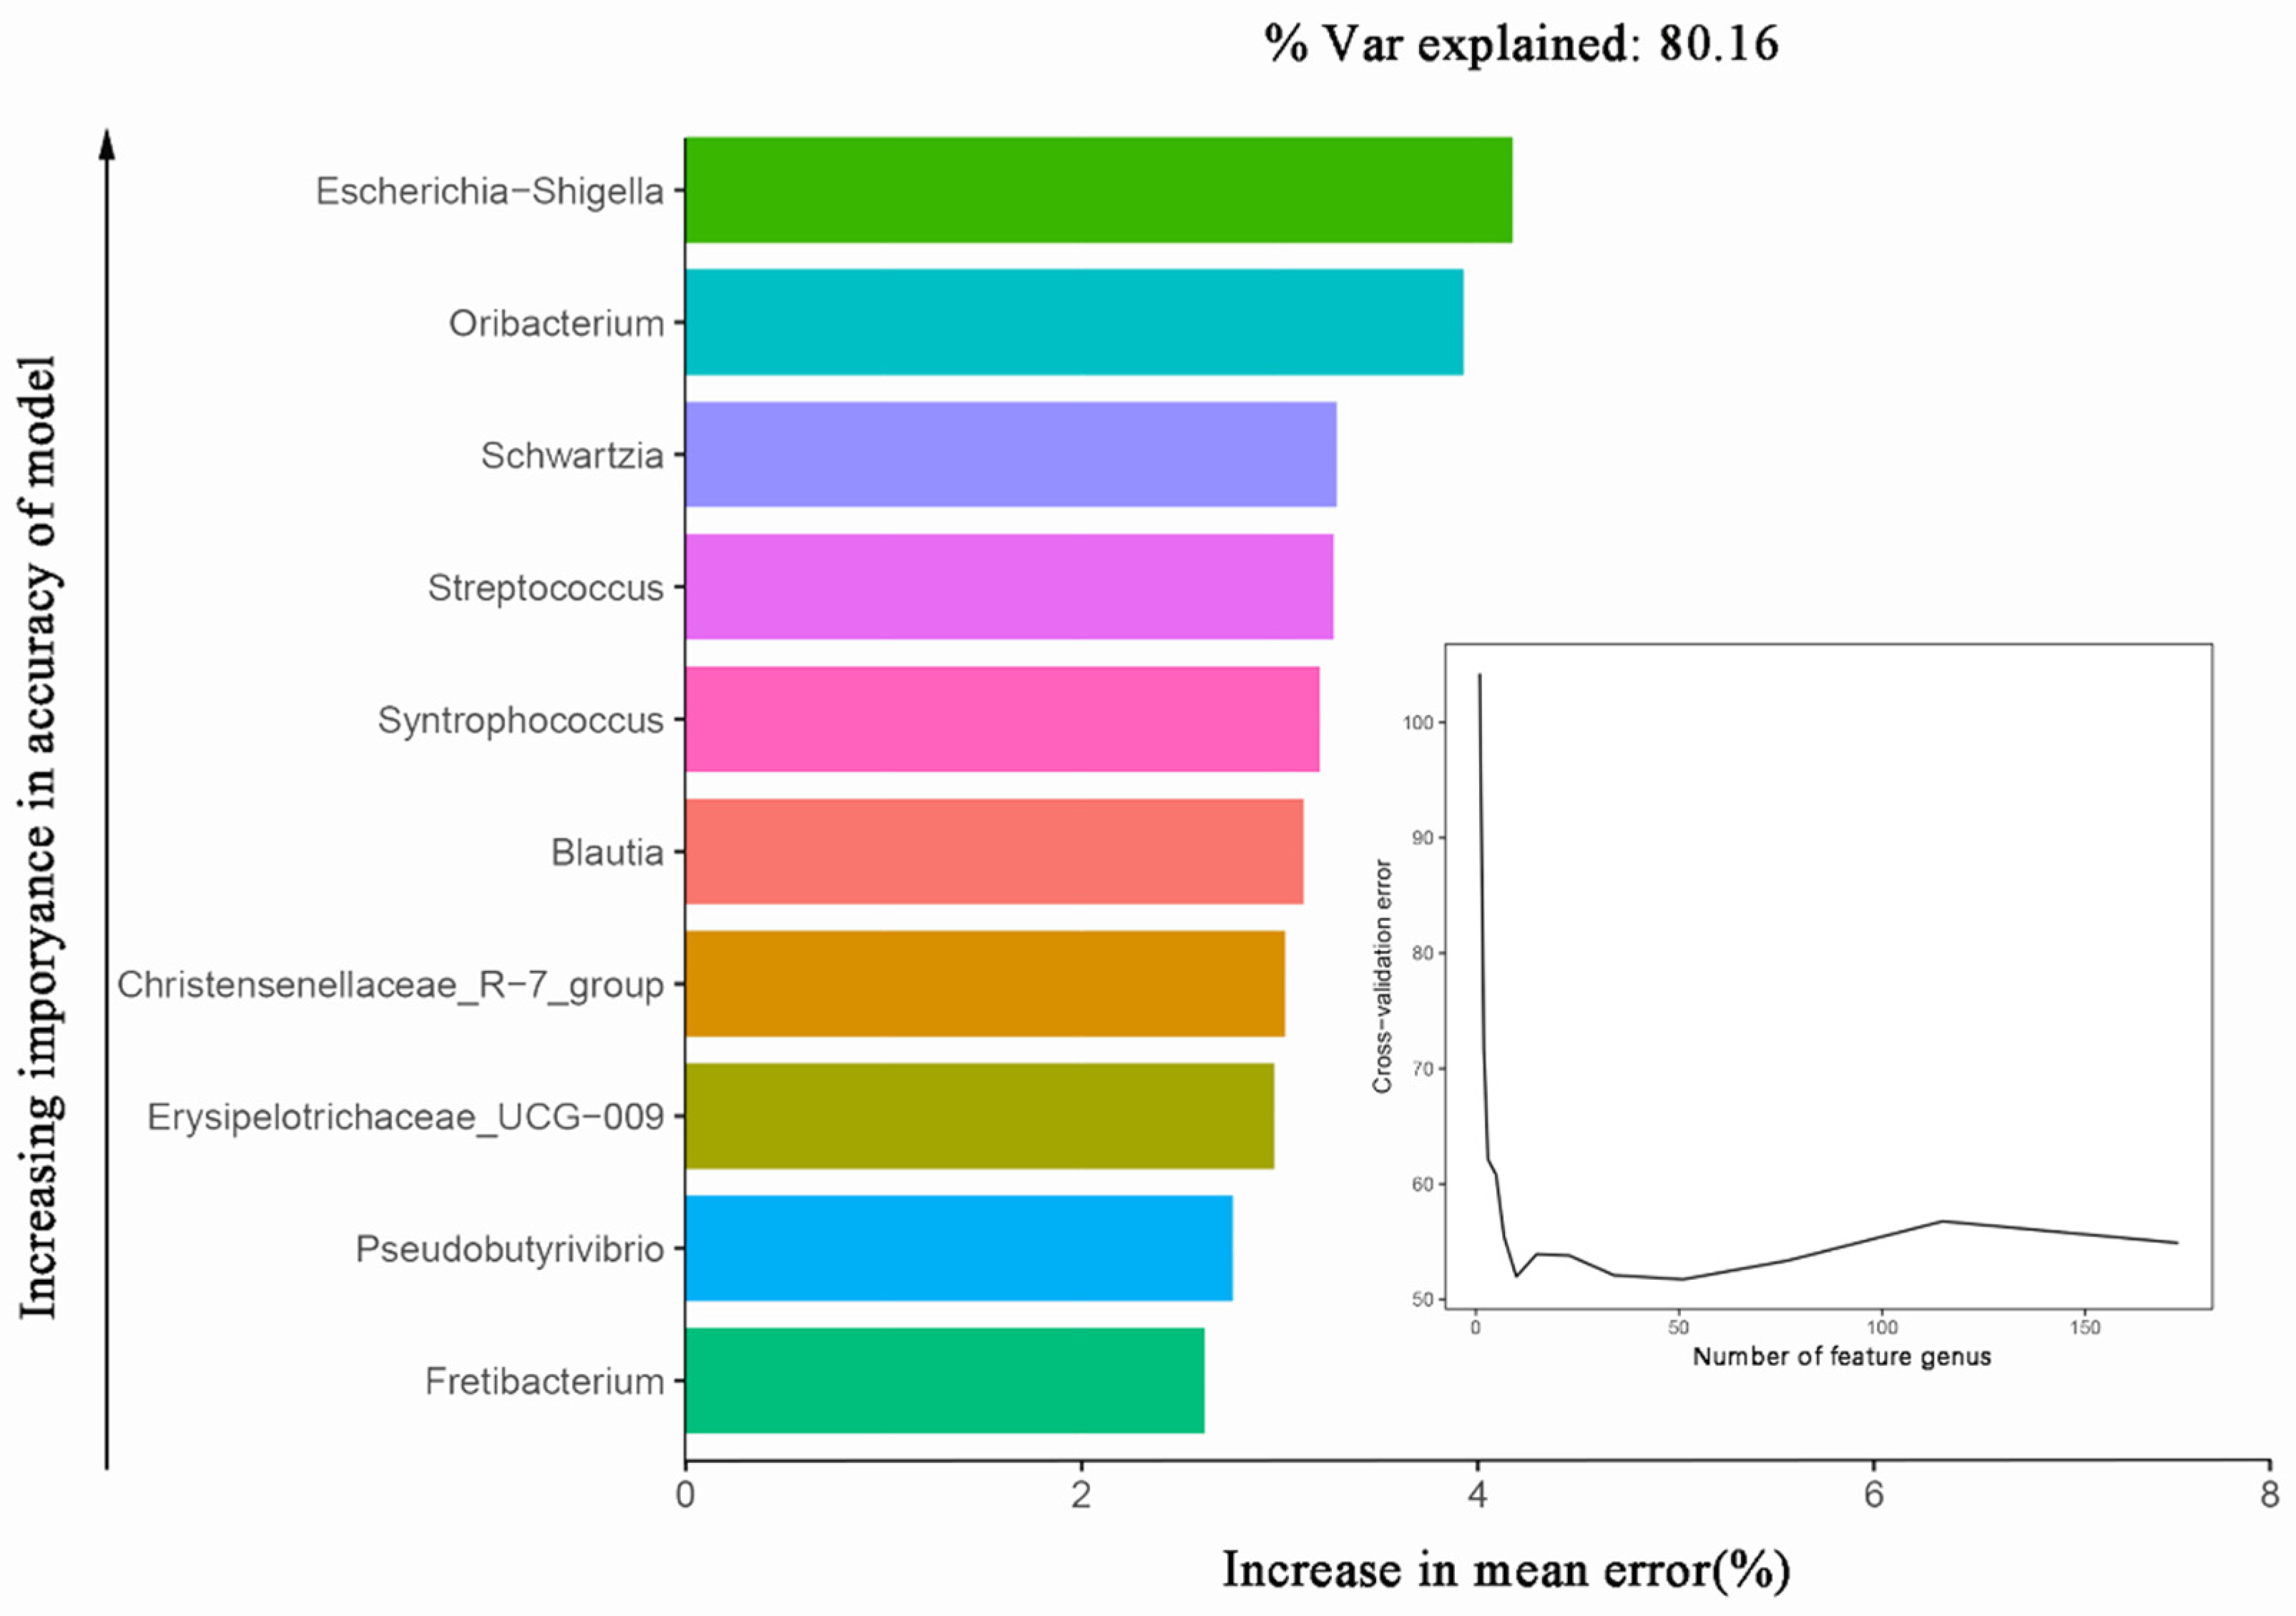
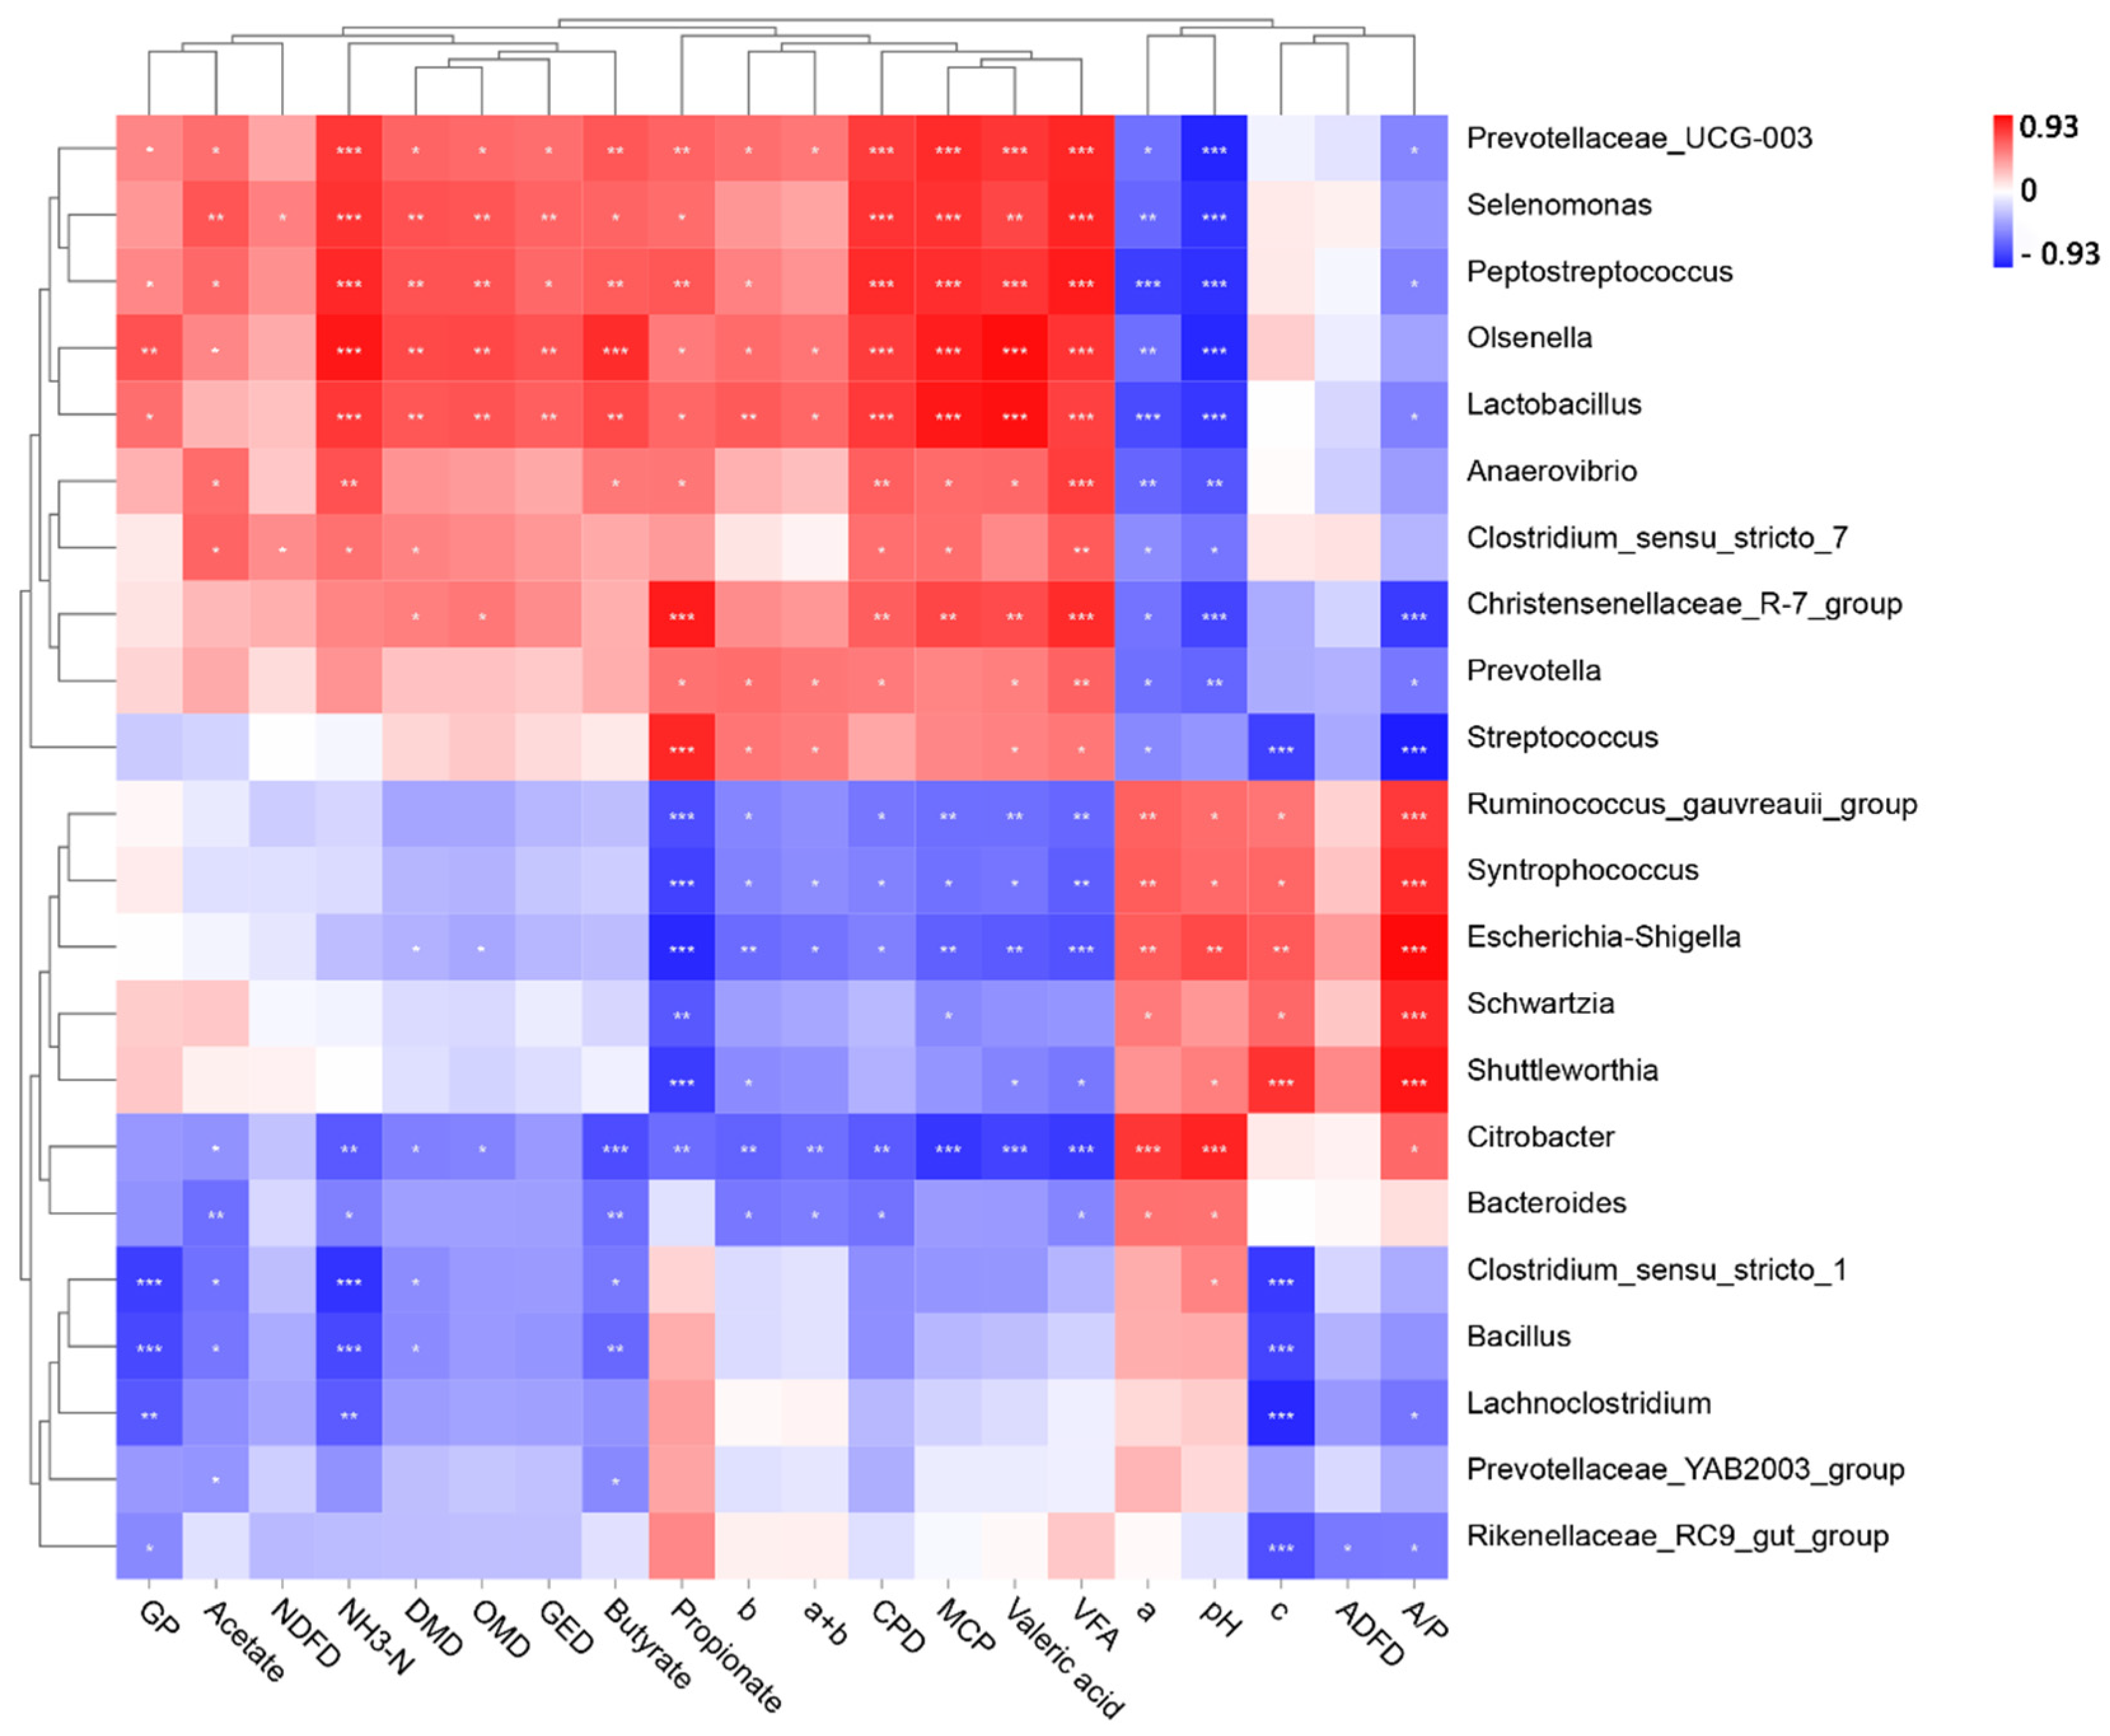
Multiple differences in bacterial composition and fermentation parameters were observed between goats, sheep, and cows, and we inferred that the bacterial community differences between goats, sheep, and cows contributed to the fermentation parameter alterations. With the random forest machine learning algorithm, we found that most of the in vitro fermentation parameters could be accurately predicted by rumen bacterial composition. In addition, we made a correlation heat map based on the bacteria selected from the random forest model to determine the main bacteria that affect the fermentation parameters. The results showed that Prevotellaceae_UCG-003, Lactobacillus, Olsenella, Selenomonas, and Peptostreptococcus were the main bacteria that affected the in vitro fermentation parameters of ruminants. Prevotellaceae_UCG-003 belongs to the family Prevotellaceae, which could increase rumen propionic acid content and promote feed digestion [35]. A high abundance of Lactobacillus could reduce ruminal pH and restrain the aerobic consumption caused by harmful bacteria growth [43], so Lactobacillus abundance was also significantly positively correlated with most fermentation parameters. Olsenella and Peptostreptococcus are anaerobic bacteria that produce lactic acid from glucose fermentation, similar to the metabolites of Lactobacillus [44]. Selenomonas is a very important lactic acid utilization bacterium in the rumen, which could reduce rumen lactic acid accumulation, stabilize ruminal pH, provide a suitable environment for rumen microorganisms, and accelerate the production of propionic acid [45], thus enhancing rumen fermentation.
We could accurately predict the fermentation parameters of GP, a, b, c, a + b, pH, NH3-N, propionic acid, valeric acid, and A:P by rumen bacteria (explanation > 55% of variations), but the predictive effect for DMD, OMD, GED, CPD, NDFD, ADFD, MCP, acetic acid, butyric acid, and TVFA were inadequate, especially for feed digestibility. The rumen microbial community is composed of bacteria, fungi, and protozoa, and they also have complex relationships in predation, competition, and even interdependence, which could also affect rumen fermentation. Some studies have demonstrated that rumen fungi could infiltrate plant cell walls through abundant rhizoids, erode plant tissues, and decrease the tension of plant fragments [46]. Rumen protozoa could affect the digestibility of carbohydrates and protein and also have the ability to survive phagocytosis activity to conserve the relative abundance of rumen bacteria [47]. Thus, although the rumen bacteria were the main rumen microbial community of ruminants, rumen fungi and protozoa performed an important role in the process of feed degradation, which might be the main reason for the insufficient prediction effect of feed digestibility in the current experiment. In the future, further studies on the effects of rumen fungi and protozoa on ruminal fermentation parameters and adding the main rumen fungi and protozoa that cause the differences in feed digestibility among goats, sheep, and cows in the prediction model might contribute to a better prediction.
Although the bacterial community analysis based on the 16S rRNA genes did not allow for species level comparisons, our findings from bacterial ecology at the phylum and genus levels indicated that the in vitro fermentation parameter differences between the goat, sheep, and cow were due to their different bacterial communities and hinted that targeting rumen bacteria might be an efficient way to manipulate rumen fermentation. The strategy of rumen bacteria regulation is of great promise and needs to be further studied.

5. Conclusions

Our results showed that the rumen fermentation parameters and bacterial composition differed in goats, sheep, and cows. At the phylum level, Firmicutes were the main dominant phyla of the sheep and cow, but Proteobacteria was the main dominant phylum of the goat; at the genus level, Prevotella and Streptococcus were the main dominant genera of the sheep and cow, while Escherichia-Shigella was the main dominant genus of the goat. The fermentation parameters of GP, a, b, c, a + b, pH, NH3-N, propionic acid, valeric acid, and A:P could be accurately predicted by rumen bacteria (explanation > 55% of variations), and Lactobacillus, Prevotellaceae_UCG-003, Olsenella, Selenomonas, and Peptostreptococcus were the main bacteria that affected in vitro rumen fermentation parameters.

Supplementary Materials

The following supporting information can be downloaded at: https://www.mdpi.com/article/10.3390/fermentation8090427/s1, Figure S1: The rarefaction curve for each sample of the goat, sheep, and cow groups.

Author Contributions

Conceptualization, Y.Z. and S.J.; methodology, J.L., H.Y., J.C. and S.J.; validation, Y.Z. and S.J.; formal analysis, J.L.; investigation, J.L. and J.C.; resources, H.Y., Y.Z. and S.J.; data curation, J.L., C.D., Y.G. and Y.L.; writing—original draft preparation, J.L.; writing—review and editing, H.Y. and S.J.; supervision, H.Y. and S.J. All authors have read and agreed to the published version of the manuscript.

Funding

This study was funded by the S&T Program of Hebei (19226627D and C2021204147), the Science and Technology Project of Hebei Education Department (QN2019134), and the Scientific Research Foundation of Hebei Agricultural University (YJ201846 and KY202016).

Institutional Review Board Statement

The study was approved by the Ethical Committee of Hebei Agricultural University (ID: KY202016).

Informed Consent Statement

Not applicable.

Data Availability Statement

The microbial sequencing data presented in this study are openly available in the BIG Sub at https://bigd.big.ac.cn/gsa/browse/CRA007365 accessed on 17 June 2022, reference number CRA007365.

Acknowledgments

We thank Xuejiao Yin, Xingzhe, Tian, Hanjie Xiao, Chensi Lu, Lu Wang, and Mengyu Liu for their assistance in the sample analysis.

Conflicts of Interest

The authors declare no conflict of interest.

References

  1. Sakita, G.Z.; Lima, P.; Filho, A.; Bompadre, T.; Ovani, V.; Chaves, C.; Bizzuti, B.; Costa, W.; Paim, P.; Campioni, T. Treating tropical grass with fibrolytic enzymes from the fungus Trichoderma reesei: Effects on animal performance, digestibility and enteric methane emissions of growing lambs. Anim. Feed. Sci. Technol. 2022, 286, 115–253. [Google Scholar] [CrossRef]
  2. Bach, A.; Calsamiglia, S.; Stern, M.D. Nitrogen metabolism in the rumen. J. Dairy Sci. 2005, 88, 9–21. [Google Scholar] [CrossRef]
  3. Bergman, E.N. Energy contributions of volatile fatty acids from the gastrointestinal tract in various species. Physiol. Rev. 1990, 70, 567–590. [Google Scholar] [CrossRef]
  4. Na, Y.; Li, D.H.; Lee, S.R. Effects of feedary forage-to-concentrate ratio on nutrient digestibility and enteric methane production in growing goats (Capra hircus hircus) and Sika deer (Cervus nippon hortulorum). J. Anim. Sci. 2017, 30, 967–972. [Google Scholar] [CrossRef]
  5. Wegi, T.; Hassen, A.; Bezabih, M.; Nurfeta, A.; Tolera, A. Estimation of feed intake and digestibility in Zebu type Arsi steers fed natural pasture using the n-alkane technique. Anim. Feed. Sci. Technol. 2020, 271, 56–67. [Google Scholar] [CrossRef]
  6. Andriarimalala, J.H.; Dubeux, J.; Dilorenzo, N.; Jaramillo, D.M.; Salgado, P. Use of n-alkanes to estimate feed intake in ruminants: A meta-analysis. J. Anim. Sci. 2020, 98, 46–57. [Google Scholar] [CrossRef]
  7. Lin, L.; Xie, F.; Sun, D.; Liu, J.; Zhu, W.; Mao, S. Ruminal microbiome-host crosstalk stimulates the development of the ruminal epithelium in a lamb model. Microbiome 2019, 7, 45–56. [Google Scholar] [CrossRef]
  8. Newbold, C.J.; Ramos-Morales, E. Review: Ruminal microbiome and microbial metabolome: Effects of feed and ruminant host. Animal 2020, 14, 78–86. [Google Scholar] [CrossRef] [PubMed]
  9. Denman, S.E.; McSweeney, C.S. The early impact of genomics and metagenomics on ruminal microbiology. Annu. Rev. Anim. Biosci. 2015, 3, 447–465. [Google Scholar] [CrossRef] [PubMed]
  10. Wanapat, M.; Nontaso, N.; Yuangklang, C.; Wora-anu, S.; Ngarmsang, A.; Wachirapakorn, C.; Rowlinson, P. Comparative Study between Swamp Buffalo and Native Cattle in Feed Digestibility and Potential Transfer of Buffalo Rumen Digesta into Cattle. Asian-Australas J. Anim. Sci. 2003, 16, 504–510. [Google Scholar] [CrossRef]
  11. Zhang, Z.; Wang, S.; Wang, M.; Shahzad, K.; Zhang, X.; Qi, R.; Shi, L. Effects of Urtica cannabina to Leymus chinensis Ratios on Ruminal Microorganisms and Fiber Degradation In Vitro. Animals 2020, 20, 335. [Google Scholar] [CrossRef] [PubMed]
  12. Deng, K.D.; Xiao, Y.; Ma, T.; Tu, Y.; Diao, Q.Y.; Chen, Y.H.; Jiang, J.J. Ruminal fermentation, nutrient metabolism, and methane emissions of sheep in response to feedary supplementation with Bacillus licheniformis. Anim. Feed. Sci. Technol. 2018, 04, 38–44. [Google Scholar] [CrossRef]
  13. Bach, A.; López-García, A.; González-Recio, O.; Elcoso, G.; Fàbregas, F.; Chaucheyras-Durand, F.; Castex, M. Changes in the rumen and colon microbiota and effects of live yeast feedary supplementation during the transition from the dry period to lactation of dairy cows. J. Dairy Sci. 2019, 102, 45–57. [Google Scholar] [CrossRef] [PubMed]
  14. Yue, Z.Q.; Xu, Y.Z.; Wang, C.; Liu, Q.; Zhang, S.L. Effects of feedary laccase supplementation on growth performance, nutrient digestion, rumen fermentation and microbiota in dairy bulls. Anim. Feed. Sci. Technol. 2020, 11, 46–51. [Google Scholar] [CrossRef]
  15. Ahmed, E.; Yano, R.; Fujimori, M.; Kand, D.; Hanada, M.; Nishida, T.; Fukuma, N. Impacts of Mootral on Methane Production, Rumen Fermentation, and Microbial Community in an in vitro Study. Front. Vet. Sci. 2021, 7, 623–637. [Google Scholar] [CrossRef]
  16. Zhang, Z.A.; Li, F.; Ma, X.W.; Li, F.D.; Wang, Z.L. Effects of barley starch level in diet on fermentation and microflora in rumen of Hu sheep. Animals 2022, 12, 1941. [Google Scholar] [CrossRef]
  17. Kong, F.L.; Zhang, Y.J.; Wang, S.; Cao, Z.; Liu, Y.F.; Zhang, Z.X.; Wang, W.; Lu, N.; Li, S. Acremonium terricola culture’s dose–response effects on lactational performance, antioxidant capacity, and ruminal characteristics in Holstein dairy cows. Antioxidants 2022, 11, 175. [Google Scholar] [CrossRef]
  18. AOAC International. Official Methods of Analysis of AOAC International; AOAC International: Arlington, VA, USA; p. 1995.
  19. Zhang, F.; Wu, Q.C.; Wang, W.K.; Guo, S.S.; Li, W.J.; Lv, L.K.; Chen, H.W.; Xiong, F.L.; Liu, Y.Y.; Chen, Y.; et al. Inhibitory effect mediated by deoxynivalenol on rumen fermentation under high-forage substrate. Fermentation 2020, 8, 369. [Google Scholar] [CrossRef]
  20. Menke, K.H.; Steingass, H. Estimation of the energetic feed value obtained from chemical analysis and in vitro gas production using rumen fluid. Anim. Res. Dev. 1988, 28, 7–55. [Google Scholar]
  21. Sun, X.G.; Wang, Q.Q.; Yang, Z.T.; Xie, T.; Wang, Z.G.; Li, S.L.; Wang, W. Altering methane emission, fatty acid composition, and microbial profile during in vitro ruminant fermentation by manipulating dietary fatty acid ratios. Fermentation 2022, 8, 310. [Google Scholar] [CrossRef]
  22. Wang, Z.W.; Li, X.X.; Zhang, L.Y.; Wu, J.P.; Zhao, S.G.; Jiao, T. Effect of oregano oil and cobalt lactate on sheep in vitro digestibility, fermentation characteristics and rumen microbial community. Animals 2022, 12, 118. [Google Scholar] [CrossRef] [PubMed]
  23. Ahmed, E.; Batbekh, B.; Fukuma, N.; Kand, D.; Nishida, T. A Garlic and Citrus Extract: Impacts on Behavior, Feed Intake, Rumen Fermentation, and Digestibility in Sheep. Anim. Feed. Sci. Technol. 2021, 278, 115–127. [Google Scholar] [CrossRef]
  24. Chaney, A.L.; Marbach, E.P. Modified Reagents for Determination of Urea and Ammonia. Clin. Chem. 1962, 2, 130–132. [Google Scholar] [CrossRef]
  25. Zhou, Z.; Meng, Q.; Yu, Z. Effects of Methanogenic Inhibitors on Methane Production and Abundances of Methanogens and Cellulolytic Bacteria in In Vitro Ruminal Cultures. Appl. Environ. Microb. 2011, 77, 2634–2639. [Google Scholar] [CrossRef] [PubMed]
  26. Uchenna, A.; Sultan, S.; Kushwaha, B.P.; Gupta, P.K.; Bhattacharya, S. PSII-5 Chemical composition, in vitro dry matter digestibility, gas production and methane emission of maintenance, growth and production feeds/rations of buffaloes. J. Anim. Sci. 2020, 4, 67–79. [Google Scholar] [CrossRef]
  27. Guo, M.; Wu, F.; Hao, G.; Qi, Q.; Li, R.; Li, N.; Wei, L.; Chai, T. Bacillus subtilis improves immunity and disease resistance in rabbits. Front. Immunol. 2017, 8, 354. [Google Scholar] [CrossRef]
  28. Omontese, B.O.; Ashok, S.; Samuel, D.; Emily, J.; Megan, W.; Andres, G. PSX-A-22 Late-Breaking: Rumen microbiome composition and microbe network dynamics in beef cattle predict finishing performance under different backgrounding systems. J. Anim. Sci. 2021, 3, 456–467. [Google Scholar] [CrossRef]
  29. Yu, J.; Cai, L.; Zhang, J.; Yang, A.; Wang, Y.; Zhang, L.; Guan, L.L.; Qi, D. Effects of Thymol Supplementation on Goat Rumen Fermentation and Rumen Microbiota In Vitro. Microorganisms 2020, 8, 1160. [Google Scholar] [CrossRef]
  30. Li, D.B.; Hou, X.Z. Effect of Fungal Elimination on Bacteria and Protozoa Populations and Degradation of Straw Dry Matter in the Rumen of Sheep and Goats. Asian-Aust. J. Anim. Sci. 2007, 20, 70–74. [Google Scholar] [CrossRef]
  31. Kirk, T.K.; Connors, W.J.; Zeikus, J.G. Requirement for a Growth Substrate during Lignin Decomposition by Two Wood-Rotting Fungi. Appl. Environ. Microb. 2020, 32, 19–24. [Google Scholar] [CrossRef]
  32. Dijkstra, J.; Gastelen, S.; Dieho, K.; Nichols, K.; Bannink, A. Review: Rumen sensors: Data and interpretation for key rumen metabolic processes. Animal 2020, 14, 176–186. [Google Scholar] [CrossRef] [PubMed] [Green Version]
  33. Francoise Domngue, B.M.; Dellow, D.W.; Wilson, P.R. Nitrogen metabolism, rumen fermentation, and water absorption in red deer, goats, and sheep. N. Z. J. Agric. Res. 1991, 34, 391–400. [Google Scholar] [CrossRef]
  34. Isac, M.D.; Garcia, M.A.; Aguilera, J.F.; Alcaide, M.E. A comparative study of nutrient digestibility, kinetics of digestion and passage and rumen fermentation pattern in goats and sheep offered medium quality forages at the maintenance level of feeding. Arch. Anim. Nutr. 1994, 46, 37–50. [Google Scholar] [CrossRef]
  35. González-Montaña, J.R.; Escalera-Valente, F.; Alonso, A.J.; Lomillos, J.M.; Robles, R.; Alonso, M.E. Relationship between Vitamin B12 and Cobalt Metabolism in Domestic Ruminant: An Update. Animals 2020, 10, 1855. [Google Scholar] [CrossRef]
  36. Poudel, P.; Froehlich, K.; Casper, D.P.; St-Pierre, B. Feeding Essential Oils to Neonatal Holstein Dairy Calves Results in Increased Ruminal Prevotellaceae Abundance and Propionate Concentrations. Microorganisms 2019, 7, 120. [Google Scholar] [CrossRef] [PubMed]
  37. Hervás, G.; Boussalia, Y.; Labbouz, Y.; Badia, A.D.; Toral, P.G.; Frutos, P. Insect oils and chitosan in sheep feeding: Effects on in vitro ruminal biohydrogenation and fermentation. Anim. Feed. Sci. Technol. 2022, 285, 115–222. [Google Scholar] [CrossRef]
  38. Guo, W.; Niekerk, J.; Zhou, M.; Steele, M.A.; Guan, L.L. Longitudinal assessment revealed the shifts in rumen and colon mucosal-attached microbiota of dairy calves during weaning transition. J. Dairy Sci. 2021, 104, 56–64. [Google Scholar] [CrossRef] [PubMed]
  39. Ahmad, A.A.; Yang, C.; Zhang, J.; Kalwar, Q.; Ding, X. Effects of Feedary Energy Levels on Rumen Fermentation, Microbial Diversity, and Feed Efficiency of Yaks (Bos grunniens). Front. Microbiol. 2020, 11, 625–630. [Google Scholar] [CrossRef]
  40. Chuanshang, C.; Hongkui, W.; Huichao, Y.; Chuanhui, X.; Siwen, J.; Jian, P. Metabolic Syndrome during Perinatal Period in Sows and the Link with Gut Microbiota and Metabolites. Front. Microbiol. 2018, 9, 79–89. [Google Scholar] [CrossRef]
  41. Restani, C.; Forde, T.L.; Lycett, S.J.; Holmes, M.A.; Zadoks, R.N. The fall and rise of group B Streptococcus in dairy cattle: Reintroduction due to human-to-cattle host jumps. Microbial. Genom. 2021, 56, 345–357. [Google Scholar] [CrossRef]
  42. Liu, Q.; Wang, C.; Li, H.Q.; Guo, G.; Huo, W.J.; Pei, C.X.; Zhang, S.L.; Wang, H. Effects of feedary protein levels and rumen-protected pantothenate on ruminal fermentation, microbial enzyme activity and bacteria population in Blonde d’Aquitaine×Simmental beef steers. Anim. Feed. Sci. Technol. 2017, 7, 31–39. [Google Scholar] [CrossRef]
  43. Beck, M.R.; Garrett, K.; Olejar, K.J.; Maxwell, T.M.R.; Bunt, C.R.; Greer, A.E.; Gregorini, P. Negative effects of energy supplementation at peak lactation of sheep can be offset by the addition of Lactobacillus fermented plant extracts. J. Anim. Sci. 2021, 69, 45–56. [Google Scholar] [CrossRef] [PubMed]
  44. Gaowa, N.; Li, W.; Gelsinger, S.; Murphy, B.; Li, S. Analysis of Host Jejunum Transcriptome and Associated Microbial Community Structure Variation in Young Calves with Feed-Induced Acidosis. Metabolites 2021, 11, 414. [Google Scholar] [CrossRef] [PubMed]
  45. Cidrini, I.A.; Ferreira, I.M.; Karla, O.; Yury, G.S.; Lage, J.F.; Gustavo, S.; Flavio, R. PSX-B-9 Effect of trace mineral sources in the supplement for grazing cattle on ruminal bacteria diversity. J. Anim. Sci. 2021, 3, 453–454. [Google Scholar] [CrossRef]
  46. Hristov, A.N.; Callaway, T.R.; Lee, C.; Dowd, S.E. Rumen bacterial, archaeal, and fungal diversity of dairy cows in response to lauric or myristic acids ingestion. J. Anim. Sci. 2012, 90, 4449–4457. [Google Scholar] [CrossRef] [PubMed]
  47. Ayemele, A.G.; Ma, L.; Li, X.; Yang, P.; Xu, J.; Yu, Z.; Bu, D. Identification of Bioactive Phytochemicals from Six Plants: Mechanistic Insights into the Inhibition of Rumen Protozoa, Ammoniagenesis, and α-Glucosidase. Biology 2021, 10, 1055. [Google Scholar] [CrossRef] [PubMed]
Figure 1. Diversity analysis of rumen bacterial community in goats, sheep, and cows. (A) Chao1 indices of rumen bacteria in goat, sheep, and cow groups; (B) Shannon indices of rumen bacteria in goat, sheep, and cow groups; (C) Principal coordinates analysis (PCoA) based on Bray–Curtis distance of rumen bacteria in goat, sheep, and cow groups; (D) Venn analysis of OTUs of rumen bacteria in goat, sheep, and cow groups. Different letters indicate significant differences among groups (p < 0.05).
Fermentation 08 00427 g001
Figure 2. Prediction of propionic acid by rumen bacterial community based on random forest machine learning algorithm.
Fermentation 08 00427 g002
Figure 3. Correlations of the dominant bacterial biomarkers with rumen fermentation parameters. Note: The dominant bacterial biomarker taxa: relative abundance ≥ 0.5% with lowest cross-validation error screened by random forest machine learning algorithm in Table 7. GP, gas production; a, GP of quickly degraded part; b, GP of slowly degraded part; c, GP rate; a + b, theoretical maximum GP; OMD, organic matter digestibility; DMD, dry matter digestibility; GED, gross energy digestibility; CPD, crude protein digestibility; NDFD, neutral detergent fiber digestibility; ADFD, acid detergent fiber digestibility; TVFA, total volatile fatty acid; NH3-N, ammonia n; MCP, microbial protein; A:P, acetic acid–propionic acid ratio; * FDR < 0.05, ** FDR < 0.01, *** FDR < 0.001.
Fermentation 08 00427 g003
Table 1. Feed composition and nutrient levels of the feed (dry matter basis).
IngredientsContent (%)NutrientContent (%)
Peanut seedling33.36ME/(MJ kg−1)11.00
Soybean meal13.80DM91.52
Corn50.80OM95.63
Limestone0.31CP12.29
NaHCO30.42NDF33.52
NaCl0.31ADF19.13
Premix1.00EE2.54
Total100Starch26.34
NSC44.54
Ca0.79
P0.38
Note: ME, metabolic energy; DM, dry matter; OM, organic matter; CP, crude protein; NDF, neutral detergent fiber; ADF, acid detergent fiber; EE, ether extract; NSC, nonstructural carbohydrate; Ca, calcium; P, phosphorus. One kilogram of the premix contained the following: VA 260 000IU, VD3 86 000IU, VE 600IU, Cu 0.50 g, Zn 3.60 g, Fe 10.60 g, Mn 3.50 g, Se 14 mg, I 110 mg, Co 44 mg. Metabolic energy was a calculated value, and the others were measured values.
Table 2. Ruminal cumulative GP and GP parameters (mL/g DM) of the goat, sheep, and cow.
ItemsGoatSheepCowSEMp-Value
2 h GP (mL/g)39.75 a35.59 a17.59 b3.1290.002
4 h GP (mL/g)70.75 a57.59 a31.42 b4.6420.001
6 h GP (mL/g)95.67 a80.34 b46.67 c5.6270.001
8 h GP (mL/g)118.42 a95.09 b59.67 c6.3900.001
10 h GP (mL/g)139.00 a103.84 b72.25 c7.1550.001
12 h GP (mL/g)157.42 a113.34 b83.42 c7.9710.001
24 h GP (mL/g)246.25 b302.92 a120.67 c20.3420.001
36 h GP (mL/g)307.00 a340.09 a213.09 b15.5410.001
48 h GP (mL/g)321.59 a371.25 a223.67 b17.5540.001
a (mL/g)8.81 a−9.50 a5.85 b2.4070.001
b (mL/g)358.76 b513.44 a412.38 b18.0110.004
c (×103h/%)0.03 a0.02 b0.01 c0.0020.001
a + b (mL/g)367.57 b503.94 a418.23 b20.3800.011
Note: GP, gas production; a, GP of quickly degraded part; b, GP of slowly degraded part; c, GP rate; a + b, theoretical maximum GP. Different uppercase letters in the same row indicate significant differences among groups (p < 0.05).
Table 3. Feed nutrient degradation of the goat, sheep, and cow.
Items%GoatSheepCowSEMp-Value
OMD64.22 b68.31 a63.20 b0.7490.005
DMD64.49 b67.08 a62.64 b0.4950.001
CPD61.53 b68.90 a61.15 b1.0200.001
GED59.92 b63.27 a58.67 b0.7060.012
NDFD40.5743.1237.951.1760.207
ADFD39.2434.2331.431.8170.213
Note: OMD, organic digestibility; DMD, dry matter digestibility; CPD, crude protein digestibility; GED, gross energy digestibility; NDFD, neutral detergent fiber digestibility; ADFD, acid detergent fiber digestibility. Different uppercase letters in the same row indicate significant differences among groups (p < 0.05).
Table 4. Rumen fluid parameters of the goat, sheep, and cow.
ItemsGoatSheepCowSEMp-Value
pH6.22 a5.78 b6.17 a0.0490.001
NH3-N (mg/dL)16.06 b23.64 a10.10 c1.3550.001
MCP (ug/mL)115.11 b166.64 a120.53 b2.8570.001
Acetate (mmol/L)85.94 ab91.60 a79.26 b1.9700.026
Propionate (mmol/L)14.13 b36.82 a30.77 a2.6160.001
Butyrate (mmol/L)5.032 b8.283 a3.487 b0.6090.001
Valeric acid (mmol/L)1.433 b6.665 a2.192 b0.6780.001
TVFA (mmol/L)106.06 b143.37 a115.71 b1.9850.001
A:P6.088 a2.523 b2.767 b0.4200.001
Note: NH3-N, ammonia n; MCP, microbial crude protein; TVFA, total volatile fatty acid; A:P, acetic acid–propionic acid ratio. Different uppercase letters in the same row indicate significant differences among groups (p < 0.05).
Table 5. Comparison of the bacterial composition between goat, sheep, and cow at the phylum level.
Items%GoatSheepCowSEMFDR
Firmicutes13.03 b61.68 a59.15 a0.0550.001
Proteobacteria75.69 a1.21 c18.26 b0.0780.001
Bacteroidota8.36 b24.67 a21.59 a0.0220.001
Actinobacteriota2.47 b11.76 a0.57 b0.0130.001
Note: Different uppercase letters in the same row indicate significant differences among groups (FDR < 0.05).
Table 6. Comparison of the bacterial composition between goat, sheep, and cow at the genus level.
Items%GoatSheepCowSEMFDR
Prevotella7.08 b22.86 a15.55 a0.0200.001
Lactobacillus0.03 b6.36 a0.41 b0.0080.001
Lachnoclostridium0.03 c0.34 b1.48 a0.0020.001
Streptococcus5.15 b44.01 a48.85 a0.0480.001
Selenomonas0.05 b2.58 a0.14 b0.0030.001
Clostridium_sensu_stricto_70.01 b1.39 a0.19 b0.0030.009
Rikenellaceae_RC9_gut_group0.10 b0.65 ab1.19 a0.0020.014
Clostridium_sensu_stricto_10.28 b0.16 b1.20 a0.0010.001
Olsenella2.22 b11.30 a0.35 b0.0120.001
Prevotellaceae_YAB2003_group0.01 b0.08 b3.50 a0.0070.009
Escherichia-Shigella74.65 a0.75 c16.69 b0.0780.001
Note: Different uppercase letters in the same row indicate significant differences among groups (FDR < 0.05).
Table 7. Prediction of the in vitro fermentation parameters by rumen bacterial community based on random forest machine learning algorithm.
ItemsGPabca + bDMDOMDGEDCPDNDFDADFDpHNH3-NMCPAcetateButyrateValeric AcidTVFAA/P
Var explained (%)66.5656.1365.7580.8561.304.591.41−3.1334.76−25.622.7360.7476.2347.48−13.24.1569.0332.2989.96
biomarker taxa342334231334102323571523151572516345
Note: biomarker taxa, the number of rumen bacteria with lowest cross-validation error screened by random forest machine learning algorithm.
Publisher’s Note: MDPI stays neutral with regard to jurisdictional claims in published maps and institutional affiliations.

