
Influence of Animal/Plant Activated Biochar Properties on Methane Production from Corn Stalk by Anaerobic Fermentation


1
College of Energy and Power Engineering, North China University of Water Resources and Electric Power, Zhengzhou 450045, China
2
School of Mechanical Engineering, North China University of Water Resources and Electric Power, Zhengzhou 450045, China
*
Authors to whom correspondence should be addressed.
Fermentation 2022, 8(8), 397; https://doi.org/10.3390/fermentation8080397
Submission received: 22 July 2022
/
Revised: 7 August 2022
/
Accepted: 11 August 2022
/
Published: 16 August 2022
(This article belongs to the Section Industrial Fermentation)
Abstract
:Activated biochar (ABC) was prepared from typical plant/animal biochar (pig bone biochar/corn stalk biochar) by optimizing the gas production characteristics of anaerobic fermentation. The effects of the physical and chemical properties (specific surface area, surface functional group and conductivity) of ABC on the gas production characteristics of anaerobic fermentation were investigated. The results showed that the effect of pig-bone activated biochar (PABC) on anaerobic fermentation gas production characteristics was better than that of corn-stalk activated biochar (CABC). The peak period of gas production or methane production was up to 4 days earlier than that of the control group, and the cumulative methane production was up to 68% higher; this can shorten the fermentation period for up to 7 days, and the effect of stabilizing pH is better. In addition, the surface functional groups are not the dominant factors affecting the gas production characteristics, but the effects of conductivity and specific surface area cannot be neglected. For most experimental groups, when the specific surface area of PABC is more than 90 m2/g and the specific surface area of CABC is more than 100 m2/g. Methane production increases with the specific surface area increases and the controllable range of CBAC is relatively wider than that of PBAC. When the conductivity of CABC is more than 650 μS/cm and the conductivity of PABC is more than 1000 μS/cm, the conductivity has a positive correlation with methane production.
1. Introduction
Biochar as a good adsorption material is widely used in pharmaceutical, chemical, and sugar production, food processing, agriculture, gas production, energy generation and daily life due to its developed micropore structure, high specific surface area, strong adsorption capacity, strong conductivity and other characteristics [1,2,3,4,5]. As a new kind of functional material, biochar can effectively maintain the stability of the anaerobic fermentation process and improve the efficiency of anaerobic fermentation. At the same time, biochar has a wide source and low cost, so it has a bright future in the field of anaerobic fermentation [6,7,8]. In recent years, many studies show that biochar can effectively strengthen anaerobic fermentation and improve the efficiency of organic waste treatment in anaerobic fermentation process. The physical and chemical properties of biochar, such as pore structure, surface functional groups and conductivity, are the key factors and fundamental factors for the enhancement of biochar mediated anaerobic fermentation, and the key to further understanding the enhancement mechanism.
The abundant specific surface area and porous structure of biochar are beneficial to the colonization of acetogenic bacteria and methanogenic archaea, thus promoting the removal of total organic carbon and the increase of reaction rates in anaerobic fermentation [9,10,11]. Fábio Codignole Luz has found that biochar with a high specific surface area can interact more effectively with surrounding species and improve anaerobic digestion in most cases [12]. Lehmann and Joseph argue that the porous structure of biochar promotes colonization and enrichment of microorganisms during anaerobic digestion and facilitates biofilm formation, containing a variety of microorganisms including acids, acetic acids and methanogens [13]. In addition, the porous biochar provides a large specific surface area for the colonization of microorganisms, which is conducive to the formation of biofilm, which can be used in anaerobic digestion to adapt to a variety of microbial populations including acid-producing bacteria, acetic acid-producing bacteria and methanogenic bacteria [14,15].
The surface of biochar is rich in functional groups, and the surface of biochar is generally rich in functional groups containing oxygen, nitrogen and sulfur, most of which are negatively charged and densely distributed; moreover, it is beneficial to enhance the surface polarity of biochar and its cation exchange capacity with external materials [16]. Park et al. found that rich carboxyl groups on the surface of biochar can bind to NH3, which may reduce the concentration of NH3 and the toxicity of NH3 to microorganisms [17,18]. Sun et al. found that the surface of biochar is rich in oxygen functional group, which can hydrate in a liquid environment and produce a certain amount of carboxyl, which makes the surface of biochar alkaline, which can maintain a neutral environment and maintain microbial activity during anaerobic fermentation [19].
In addition, the electrical properties of biochar affect the efficiency of interspecific electron transfer, which plays an important role in the symbiotic relationship between organic acids oxidizing acetogenic bacteria and CO2-reducing Methanogenic archaea; this symbiosis facilitates CO2 reduction and methane formation [20]. Stams AJ confirms that biochar added to the reactor stimulates the oxidation of butyrates through transition receptors for electrons that are accepted by methanogens, thereby reducing carbon dioxide in the biogas [21,22]. Luo demonstrated that the electrical properties of biochar could be a good promoter for biofilm growth, enabling electron exchange between symbionts and methanogens [23]. Xu et al. found that the addition of biochar increased the electrical conductivity of the anaerobic fermentation system (37.0%) higher than that of the control group), and the superior electrical conductivity enhanced the extracellular electron transfer, thus increasing adenosine 5′-triphosphate (ATP) production; this in turn promotes anaerobic fermentation [24]. In addition, biochar, as a mediator, may be directly involved in the direct electron transfer between microorganisms in an anaerobic reaction system, greatly promoting methane production efficiency [25,26].
The application of biochar as an additive in anaerobic fermentation has been increasingly studied, but most of the existing biochar-mediated anaerobic fermentation reactions use pyrolysis of biochar at high temperature. The addition of biochar reduces the lag phase of methanogenesis and increases CH4 production, but the enhancement effect of this kind of biochar could only achieve 5–40% [22,27,28]. It is a new research direction to seek a new type of carbon-based synergistic material, such as granular activated carbon [29], single-walled carbon nanotubes [30], and graphene [31], but the cost of these carbon materials is too high. Moreover, there is little research on the effect of the pore structure, surface functional groups and conductivity of biochar materials in anaerobic fermentation. In this study, ABC was used in anaerobic fermentation and the effects of the physical and chemical properties (pore structure, surface functional groups, conductivity) of biochar on the gas production characteristics of anaerobic fermentation were investigated, and the matching relationship between the physical and chemical characteristics of biological carbon and its gas production potential is clarified; on this basis, the effects of plant/animal-based biochar on the gas production characteristics of anaerobic fermentation were compared and analyzed, which laid a theoretical foundation for preparing excellent carbon-based synergistic materials.
2. Experimental Materials and Methods
2.1. Materials and Methods
Activated biochar (ABC) was prepared from pig bone biochar and corn stalk biochar for enhanced anaerobic fermentation. Corn stalk biochar produced by corn stalk pyrolysis at 400 °C was purchased from Lize environmental protection technology Co., Ltd. (Tianjing, China) Pig bone biochar is prepared from pig bone (degreased, washed, crushed and dried) by pyrolysis and carbonization in a vertical tube furnace at 450 °C. ABC was obtained from corn stalk and pig bone biochar, which were impregnated in an oscillator at 35 °C for 6 h with an oscillation speed 150 r/min, activated with KOH (Sinopharm Chemical Reagent Co., Ltd., Beijing, China), acid washed with 1 mol L−1 aqueous HCl (Sinopharm Chemical Reagent Co., Ltd., Beijing, China), solutions, and dried. The detailed information of ABC preparation conditions is shown in Table 1.
2.2. ABC-Mediated Anaerobic Fermentation Studies
The raw material of anaerobic fermentation is corn stalk. The corn stalk was crushed to less than 2 mm. The inoculum is the inoculum sludge cultured in the laboratory. Corn stalk- and pig bone-based ABCs were used as additives. The characteristics of corn stalk and inoculated sludge are shown in Table 2.
In the experiment, a 500 mL conical flask was used as fermentation vessel, the effective mass of fermentation was set at 400 g, and the ratio of inoculating sludge and ABC was calculated based on total solid (TS). The concentration of inoculating sludge was 5.96%, the corn stalk was 12 g, and the inoculating sludge was 200 g. There was an ABC addition of 10% of TS, and to the remaining part, of less than 400 g, we added distilled water.
The anaerobic fermentation experiment with PABC (a-1–a-9) was set up in 9 groups, with the number A-1–A-9. The anaerobic fermentation experiment with CABC (b-1–b-9) was carried out in 9 groups, with the number B-1–B-9. There was also a group with no addition of ABC, Control Group 1 group, number C; each group had three parallel experimental replicates.
2.3. Analytical Methods
Measurement of ABC physical and chemical properties: The surface morphologies of ABC were obtained by a field-emission scanning electron microscope (FSEM) (Nanosem 430, FEI, Waltham, MA, USA); samples were imaged at 5 kV acceleration, 1 nm resolution and a 7 to 10 mm working distance. The special surface area of ABCs was calculated through N2 adsorption isotherms by the BET equation which was determined by a pore structure analyzer (BEL mini, Mezickbar, Japan). The surface chemical properties of ABCs were obtained by Fourier transform infrared spectroscopy (IR960, Tianjin Jingtuo Instrument Technology Inc., Tianjin, China). The FTIR spectra were obtained using a KBr plate in the wavenumber ranging from 400 to 4000 cm−1 with a cumulative scan number of 32. The electrical conductivity properties were detected using an electrical conductivity meter (VSM, Lake Shore Cryotroni, Westerville, OH, USA). The XRD patterns were conducted on an X-ray diffractometer (D8 Advance, Bruker Inc., Silberstreifen, Germany) using Cu Ka radiation at a wavelength of 1.5406 Å, for 2-theta = 10–70° and a speed of 0.01°/s. A pH meter (PHS-3E, Shanghai Yidian Science Inc., Shanghai, China) was used to measure the acidity and alkalinity of fermentation broth.
Measurement of gas production: In this experiment, an air bag connected to the mouth of the fermentation bottle was used to collect gas production. At first, the air bag was kept in a vacuum state, then the air bag was drained with a graduated needle every day and returned to the vacuum state. The calibration of the needle was recorded to determine the daily volume of gas production. An Agilent Technology Company 6820 GC gas chromatograph (Agilent Technology Company, Santa Clara, CA, USA) was used to measure the percentage of gas composition and methane. The specific conditions are as follows: Detector, TCD; The carrier gas, N2; Velocity, 30 mL/min; Oven temperature, 40 °C; Sampling temperature, 150 °C; Detector temperature, 200 °C; Sampling method, Sampling valve; forward sampling port.
3. Effect of Animal/Plant ABC on the Characteristics of Anaerobic Fermentation Gas Production
3.1. Effect of ABC on Gas and Methane Production Peak
The gas and methane production in the anaerobic fermentation process shows a trend of increasing at first and then decreasing. The time of the peak of gas production/methane production directly affects the effective gas production cycle of the fermentation process, and the addition of biochar provides the attachment space for the fermentation bacteria, enhances the biological activity of the bacteria, and advances the gas production/methane production peak period appropriately. The peak of gas production and methane production occurred in the process of anaerobic fermentation, and the corresponding daily gas production and methane production are shown in Figure 1.
In terms of daily gas production, the blank control group showed peak gas production on day 11; the gas production peak appeared on the 9th to 11th day in Group A, and the gas production peak appeared on the 8th to 11th day in Group B, which was 1 to 3 days earlier than the control group. According to the daily methane production, the gas production peak appeared on the 11th day in the control group, the daily methane production peak appeared on the 8th–11th day in Group A, and the daily methane production peak appeared on the 7th–10th day in Group B, which was 1–4 days earlier than the control group.
Comparing Group A samples with Group B samples, the peak time of gas production or methane production in Group B is longer, but the gas production or methane production in Group B is similar to that in the control group. At the same time, the peak period in Group A was later than that in Group B, but the gas production or methane production in Group A was obviously higher than that in Group B and blank. Because the pore size of Group A biochar is between 2.4 and 6.1 nm, and that of Group B biochar is between 5.2 and 9.3 nm, it can be concluded that a small pore size is easier to colonize bacteria, however, the time for the reaction gas to escape from the small channel will also increase relatively.
3.2. Effect of ABC on Gas and Methane Production
As shown in Figure 2, the cumulative gas production/methane production of the control group (Group C) is the lowest. When compared with the control group, the cumulative gas production of Group A and Group B increased by 2–29% and 0.02–48% respectively, and the cumulative methane production increased by 1–36% and 2–68%, respectively. Among them, A-5 and B-4 performed best, and the cumulative methane production increased by 48% and 68% respectively, indicating that the addition of PACB and CACB could significantly improve the methane production. The increase of maximum cumulative methane production with ACB addition is twice that of the work of Zhou [32].
Under the condition of obtaining the same cumulative gas production, the shorter the fermentation time, the better the fermentation effect, and the higher the methane production efficiency. Figure 3 shows the change in cumulative methane production. The time when the cumulative methane production accounted for 80% of the total methane production during the whole fermentation cycle was as follows: Group C was the 22nd day, Group A was the 20th to 21st day, and Group B was the 20th to 21st day. The best ones were A-5 and B-4, the proportion of which reached 81.6 and 81.19% on the 22nd and 15th day respectively. The results showed that ACB could not only increase methane production, but also shorten the fermentation period, and the optimization effect of PACB was better than CACB; this is highly consistent with the results of Sunyoto’s research [33].
3.3. Effect of ABC on pH Value
Microorganisms, especially methanogens, are very sensitive to the fluctuation of pH values, which is of great significance to the stability of anaerobic gas production. The optimum pH value of methanogens is 6.5–7.8. The changes of pH values in the anaerobic fermentation process are shown in Figure 4. The overall trend is first to decrease, then to increase, and finally to stabilize. The initial pH value of each experimental group was in the range of 7.7–8.3. The pH value dropped sharply in the initial stage of fermentation to 6.2–6.8 on the second day of fermentation, and the cause is the accumulation of organic acids from the acid-producing stage. With the anaerobic fermentation from the acidogenic stage to the methanogenic stage, the pH value of Group A began to recover on the sixth day, returned to normal on the 12th day, and stabilized at about 7.2. The pH value of Group B began to recover on the fourth day and returned to normal on the 10th day, the pH value of Group C recovered from 8 days to 6.9 days after treatment. After adding ABC, the anaerobic fermentation system was buffered, and the pH value recovered quickly, so the environment was suitable for anaerobic fermentation bacteria to grow; the fermentation recovery was accelerated, and the gas production peak was advanced. These results are consistent with the findings of Sunyoto [33] and Cai [34], indicating that biochar possesses the sufficient buffering capacity to maintain an acidification balance.
In addition, Group C had the lowest pH of 5.79 on the sixth day, indicating that the anaerobic fermentation process was more likely to end with acid drowning without any additives. Both Group A and Group B had the lowest pH value on the sixth day, which ranged from 5.6 to 6.0, but this did not cause acid drowning due to a low pH. Observe the A-5 and B-5 with the best gas production effect: both groups were found to rise relatively fastest at pH and eventually stabilized at higher pH levels. Comparing Group A with Group B, it was found that Group B had a short pH fluctuation period, which soon restored the pH of the system to normal. It showed that adding ABC to an anaerobic fermentation system could stabilize pH, and adding PABC was better than adding CBAC.
4. Comparative Analysis of the Effects of the Properties of Activated Carbon from Plants/Animals ABC on Anaerobic Fermentation
4.1. Structural Changes of Corn Stalk before and after Fermentation
In the anaerobic fermentation experiment, A-5 and B-4 groups had the best synergistic effect. The fermentation broth of A-5, B-4 and C groups was dried and grinded, and analyzed by SEM and XRD to observe the structural changes in the corn stalk. As shown in Figure 5, the surface of the unfermented cornstalk powder is smooth, the connection is complete and there is no fracture. Observing Group C, it was found that the most outer layer of waxy silicified layer of the fermented corn stalk powder had basically decomposed and disappeared. The regular arrangement of vascular bundles is slightly deformed, but it can be distinguished, which indicates that the fermentation process of this group is not complete. In A-5 and B-4 groups, the structure of corn stalk was dismembered into small pieces, most of the epidermis was destroyed and only part of the long cells remained, and the original smooth cornstalk powder is almost gone. The results showed that the structure of corn stalk was changed during the fermentation; the reason is that during the fermentation process, hemicellulose and cuticle in the corn stalk are hydrolyzed into soluble substances, some organic matter is utilized, and then the pores are formed. Therefore, adding ABC can improve the decomposition degree of raw materials in an anaerobic fermentation system. When compared with adding PABC, adding CBA can produce more pores and cracks, and can promote more cell wall destruction, and it can decompose the cellulose, hemicellulose and lignin in the raw material to a greater extent [35].
It can be seen from Figure 6 that the peak of corn stalk before and after anaerobic fermentation has an obvious change at 2θ = 22°, which is assigned to the (0 0 2) lattice plane of cellulose. The peak shape of the corn stalk before anaerobic fermentation is obviously wider, in contrast, the fermented corn stover showed many independent and narrow peaks, and the peak area decreased obviously, which indicated that the crystallinity of the fermented corn stover changed. This is due to the breakage of original crystallites and considerable distortion of the three-dimensional crystalline order [36]. In addition, the peak intensity at 2θ near 18° decreased and weakened significantly with the increase of BAC load. The peak around 2θ ≈ 26.6° was considered to be silicon oxide during the fermentation process [37]. Because the integral intensity of diffraction peak directly reflects the content of phase in the compound, it can be found that the decomposition degree of corn stalk after anaerobic fermentation is B-4 > A-5 > C, which is consistent with SEM analysis.
4.2. Effect of Surface Functional Groups on Anaerobic Fermentation Process
The FT-IR spectra of the samples are shown in Figure 7. It can be seen that the ABC of A1-A9 Group and B1-B9 group has similar peak shape, and the peak value mainly appears near 450, 565, 1040, 1400, 1640, 3436 cm−1, but the peak value is slightly different. The surface functional groups of the 18 groups were similar, including P–O (450 cm−1, 565 cm−1), C–O–C (1040 cm−1), C = O (1640 cm−1) and –OH (3436 cm−1). The chemical groups PO43− and CO32−, which correspond to the above functional groups, can effectively increase the adsorption active sites, and then alleviate the effects of high ammonia nitrogen or volatile fatty acids in fermentation; the functional groups such as hydroxyl and carboxyl groups on the surface of carbon can make the carbon surface complexation take place, combine with carbon dioxide, reduce the content of carbon dioxide in biogas, or participate in the process of NH4+–N adsorption, preventing the inhibition phenomenon caused by excessive accumulation of ammonia. Therefore, the types of surface functional groups are basically the same in both plant-based and animal-based carbon materials. It was found that the intensity of the diffraction peak of the functional groups of A-5 and B-4 was relatively weak, which indicated that functional groups were not the dominant factor affecting anaerobic fermentation gas production.
4.3. Effects of Specific Surface Area and Conductivity on Anaerobic Fermentation Process
Figure 8 shows the relationship between ABC properties and cumulative methane production. For most experimental groups, a high specific surface area is favorable for methane production, but the argument that the higher the specific surface area, the better, the lower the worse is not true. For example, the specific surface areas of A-6 (166.6 m2/g) and B-1 (145.89 m2/g) are larger, but the cumulative methane production is lowest, while the specific surface areas of A-5 (74.24 m2/g) and B-4 (110.15 m2/g) are smaller, but the cumulative methane production is highest. Similarly, ABC groups with the same specific surface area had different cumulative methane yields, such as at A-2 (90.65 m2/g) and A-5 (74.23 m2/g), and at B-2 (129.34 m2/g) and B-5 (127.28 m2/g), although the specific surface area had little difference; however, the methane yields were significantly different, being 27.74 and 27.51 mL/g VS, respectively.
The relationship between electrical conductivity and cumulative methane production is shown in Figure 8. The higher the electrical conductivity is (σCABC > 650 μS/cm or σPABC > 1000 μS/cm), the higher the cumulative methane production is. However, when σCABC < 650 μS/cm or/σPABC < 1000 μS/cm, the effect of conductivity on methane production is no longer the dominant factor, and the relationship between conductivity and methane production is not positive. In addition, the amount of methane accumulated under the same conductivity is different; for example, the conductivity of A-3 (695 μS/cm) and A-7 (650 μS/cm), B-3 (481 μS/cm) and B-7 (442 μS/cm) are not different, however, the methane yields were 11.97 and 34.07 mL/g VS, respectively.
5. Conclusions
The effect of PABC on anaerobic fermentation was better than that of CABC. Compared with the control group, here are the conclusions: (1) the peak period of Group B (PABC) can be advanced up to 4 days, and the peak period of Group A (CABC) can be advanced up to 3 days, but the peak period of Group A can produce more gas or methane. (2) The cumulative methane production of Group A and Group B increased by up to 48 and 68%. (3) The effective fermentation period of Group A and Group B was shortened by 2 days and 7 days at most.
The influence of ABC on the gas-producing characteristics of anaerobic fermentation is closely related to specific surface area, conductivity and functional groups, and surface functional groups are not the dominant factors. The effects of conductivity and specific surface area on gas production characteristics cannot be neglected. For most experimental groups: (1) a high specific surface area is favorable for methane production; (2) when σCABC > 650 μS/cm or σPABC > 1000 μS/cm, the higher the conductivity is, the higher the cumulative methane production is; (3) when compared with PABC, the controllable range of CABC is wider, that is, the preparation condition of plant-based biochar is looser.
Author Contributions
Z.Z., conceptualization, investigation, data curation, and writing the draft; S.T., investigation and formal analysis; J.L., contribution to discussion of the results; P.-Y.G., conceptualization, supervision of investigation, and writing the manuscript; J.S., data curation. All authors have read and agreed to the published version of the manuscript.
Funding
This research was financially supported by the Key R & D and promotion special project of Henan Province (202102310234, 202102310557, 212102311053, 222102230087).
Institutional Review Board Statement
Not applicable.
Informed Consent Statement
Not applicable.
Data Availability Statement
Not applicable.
Conflicts of Interest
The authors declare no conflict of interest.
References
- Xiu, S.; Shahbazi, A.; Li, R. Characterization, Modification and Application of Biochar for Energy Storage and Catalysis: A Review. Trends Renew. Energy 2017, 3, 86–101. [Google Scholar] [CrossRef]
- Shen, Y.; Linville, J.L.; Ignacio-de Leon, P.A.A.; Schoene, R.P.; Urgun-Demirtas, M. Towards a sustainable paradigm of waste-to-energy process: Enhanced anaerobic digestion of sludge with woody biochar. J. Clean. Prod. 2016, 135, 1054–1064. [Google Scholar] [CrossRef]
- Olugbade, T.; Ojo, O.; Mohammed, T. Influence of Binders on Combustion Properties of Biomass Briquettes: A Recent Review. Bioenergy Res. 2019, 12, 241–259. [Google Scholar] [CrossRef]
- Olugbade, T.O.; Ojo, O.T. Biomass Torrefaction for the Production of High-Grade Solid Biofuels: A Review. Bioenergy Res. 2020, 13, 999–1015. [Google Scholar] [CrossRef]
- Olugbade, T.O.; Ojo, O.T. Binderless briquetting technology for lignite briquettes: A review. Energy Ecol. Environ. 2021, 6, 69–79. [Google Scholar] [CrossRef]
- Linville, J.L.; Shen, Y.; Ignacio-de Leon, P.A.; Schoene, R.P.; Urgun-Demirtas, M. In-situ biogas upgrading during anaerobic digestion of food waste amended with walnut shell biochar at bench scale. Waste Manag. Res. 2017, 35, 669–679. [Google Scholar] [CrossRef]
- Xu, J.; Mustafa, A.M.; Lin, H.; Choe, U.Y.; Sheng, K. Effect of hydrochar on anaerobic digestion of dead pig carcass after hydrothermal pretreatment. Waste Manag. 2018, 78, 849–856. [Google Scholar] [CrossRef]
- Gómez, X.; Meredith, W.; Fernández, C.; Sánchez-García, M.; Díez-Antolínez, R.; Garzón-Santos, J.; Snape, C.E. Evaluating the effect of biochar addition on the anaerobic digestion of swine manure: Application of Py-GC/MS. Environ. Sci. Pollut. Res. 2018, 25, 25600–25611. [Google Scholar] [CrossRef]
- Cetin, E.; Moghtaderi, B.; Gupta, R.; Wall, T.F. Influence of pyrolysis conditions on the structure and gasification reactivity of biomass chars. Fuel 2004, 83, 2139–2150. [Google Scholar] [CrossRef]
- Sharma, P.; Melkania, U. Biochar-enhanced hydrogen production from organic fraction of municipal solid waste using co-culture of Enterobacter aerogenes and E. coli. Int. J. Hydrogen Energy 2017, 42, 18865–18874. [Google Scholar] [CrossRef]
- Xu, S.; He, C.; Luo, L.; Lü, F.; He, P.; Cui, L. Comparing activated carbon of different particle sizes on enhancing methane generation in upflow anaerobic digester. Bioresour. Technol. 2015, 196, 606–612. [Google Scholar] [CrossRef] [PubMed]
- Codignole Luz, F.; Cordiner, S.; Manni, A.; Mulone, V.; Rocco, V. Biochar characteristics and early applications in anaerobic digestion-a review. J. Environ. Chem. Eng. 2018, 6, 2892–2909. [Google Scholar] [CrossRef]
- Joseph, S.; Lehmann, J. Biochar for Environmental Management: Science and Technology; Earthscan: London, UK, 2009. [Google Scholar]
- Cooney, M.J.; Lewis, K.; Harris, K.; Zhang, Q.; Yan, T. Start up performance of biochar packed bed anaerobic digesters. J. Water Process. Eng. 2016, 9, e7–e13. [Google Scholar] [CrossRef]
- Cabeza, I.; Waterhouse, T.; Sohi, S.; Rooke, J.A. Effect of biochar produced from different biomass sources and at different process temperatures on methane production and ammonia concentrations in vitro. Anim. Feed Sci. Technol. 2018, 237, 1–7. [Google Scholar] [CrossRef]
- Shen, Y.; Linville, J.L.; Urgun-Demirtas, M.; Schoene, R.P.; Snyder, S.W. Producing pipeline-quality biomethane via anaerobic digestion of sludge amended with corn stover biochar with in-situ CO2 removal. Appl. Energy 2015, 158, 300–309. [Google Scholar] [CrossRef]
- Park, J.-H.; Kang, H.-J.; Park, K.-H.; Park, H.-D. Direct interspecies electron transfer via conductive materials: A perspective for anaerobic digestion applications. Bioresour. Technol. 2018, 254, 300–311. [Google Scholar] [CrossRef] [PubMed]
- Nagarajan, V.; Chandiramouli, R. Investigation of NH3 adsorption behavior on graphdiyne nanosheet and nanotubes: A first-principles study. J. Mol. Liq. 2018, 249, 24–32. [Google Scholar] [CrossRef]
- Sun, Y.; Yang, G.; Zhang, J.; Wen, C.; Sun, Z. Optimization and kinetic modeling of an enhanced bio-hydrogen fermentation with the addition of synergistic biochar and nickel nanoparticle. Int. J. Energy Res. 2019, 43, 983–999. [Google Scholar] [CrossRef]
- Liu, F.; Rotaru, A.-E.; Shrestha, P.M.; Malvankar, N.S.; Nevin, K.P.; Lovley, D.R. Magnetite compensates for the lack of a pilin-associated c-type cytochrome in extracellular electron exchange. Environ. Microbiol. 2015, 17, 648–655. [Google Scholar] [CrossRef]
- Stams, A.J.M.; Plugge, C.M. Electron transfer in syntrophic communities of anaerobic bacteria and archaea. Nat. Rev. Microbiol. 2009, 7, 568–577. [Google Scholar] [CrossRef]
- Wang, G.; Li, Q.; Gao, X.; Wang, X.C. Synergetic promotion of syntrophic methane production from anaerobic digestion of complex organic wastes by biochar: Performance and associated mechanisms. Bioresour. Technol. 2018, 250, 812–820. [Google Scholar] [CrossRef] [PubMed]
- Luo, C.; Lü, F.; Shao, L.; He, P. Application of eco-compatible biochar in anaerobic digestion to relieve acid stress and promote the selective colonization of functional microbes. Water Res. 2015, 68, 710–718. [Google Scholar] [CrossRef] [PubMed]
- Duan, X.; Chen, Y.; Yan, Y.; Feng, L.; Chen, Y.; Zhou, Q. New method for algae comprehensive utilization: Algae-derived biochar enhances algae anaerobic fermentation for short-chain fatty acids production. Bioresour. Technol. 2019, 289, 121637. [Google Scholar] [CrossRef] [PubMed]
- Rotaru, A.-E.; Shrestha, P.M.; Liu, F.; Shrestha, M.; Shrestha, D.; Embree, M.; Zengler, K.; Wardman, C.; Nevin, K.P.; Lovley, D.R. A new model for electron flow during anaerobic digestion: Direct interspecies electron transfer to Methanosaeta for the reduction of carbon dioxide to methane. Energy Environ. Sci. 2014, 7, 408–415. [Google Scholar] [CrossRef]
- Chen, S.; Rotaru, A.-E.; Shrestha, P.M.; Malvankar, N.S.; Liu, F.; Fan, W.; Nevin, K.P.; Lovley, D.R. Promoting Interspecies Electron Transfer with Biochar. Sci. Rep. 2014, 4, 5019. [Google Scholar] [CrossRef]
- Giwa, A.S.; Xu, H.; Chang, F.; Wu, J.; Li, Y.; Ali, N.; Ding, S.; Wang, K. Effect of biochar on reactor performance and methane generation during the anaerobic digestion of food waste treatment at long-run operations. J. Environ. Chem. Eng. 2019, 7, 103067. [Google Scholar] [CrossRef]
- Kaur, G.; Johnravindar, D.; Wong, J.W.C. Enhanced volatile fatty acid degradation and methane production efficiency by biochar addition in food waste-sludge co-digestion: A step towards increased organic loading efficiency in co-digestion. Bioresour. Technol. 2020, 308, 123250. [Google Scholar] [CrossRef]
- Liu, F.; Rotaru, A.-E.; Shrestha, P.M.; Malvankar, N.S.; Nevin, K.P.; Lovley, D.R. Promoting direct interspecies electron transfer with activated carbon. Energy Environ. Sci. 2012, 5, 8982–8989. [Google Scholar] [CrossRef]
- Li, L.-L.; Tong, Z.-H.; Fang, C.-Y.; Chu, J.; Yu, H.-Q. Response of anaerobic granular sludge to single-wall carbon nanotube exposure. Water Res. 2015, 70, 1–8. [Google Scholar] [CrossRef]
- Lin, R.; Cheng, J.; Zhang, J.; Zhou, J.; Cen, K.; Murphy, J.D. Boosting biomethane yield and production rate with graphene: The potential of direct interspecies electron transfer in anaerobic digestion. Bioresour. Technol. 2017, 239, 345–352. [Google Scholar] [CrossRef]
- Zhou, H.; Brown, R.C.; Wen, Z. Biochar as an Additive in Anaerobic Digestion of Municipal Sludge: Biochar Properties and Their Effects on the Digestion Performance. ACS Sustain. Chem. Eng. 2020, 8, 6391–6401. [Google Scholar] [CrossRef]
- Sunyoto, N.M.S.; Zhu, M.; Zhang, Z.; Zhang, D. Effect of biochar addition on hydrogen and methane production in two-phase anaerobic digestion of aqueous carbohydrates food waste. Bioresour. Technol. 2016, 219, 29–36. [Google Scholar] [CrossRef] [PubMed]
- Cai, J.; He, P.; Wang, Y.; Shao, L.; Lü, F. Effects and optimization of the use of biochar in anaerobic digestion of food wastes. Waste Manag. Res. 2016, 34, 409–416. [Google Scholar] [CrossRef] [PubMed]
- Mao, J.D.; Johnson, R.L.; Lehmann, J.; Olk, D.C.; Neves, E.G.; Thompson, M.L.; Schmidt-Rohr, K. Abundant and Stable Char Residues in Soils: Implications for Soil Fertility and Carbon Sequestration. Environ. Sci. Technol. 2012, 46, 9571–9576. [Google Scholar] [CrossRef] [PubMed]
- Chen, G.; Zheng, Z.; Yang, S.; Fang, C.; Zou, X.; Luo, Y. Experimental co-digestion of corn stalk and vermicompost to improve biogas production. Waste Manag. 2010, 30, 1834–1840. [Google Scholar] [CrossRef] [PubMed]
- Davraz, M.; Gunduz, L. Engineering properties of amorphous silica as a new natural pozzolan for use in concrete. Cem. Concr. Res. 2005, 35, 1251–1261. [Google Scholar] [CrossRef]
Figure 1.
(a) Gas production peak period and (b) methane production peak using different ABC as supplement.
Figure 1.
(a) Gas production peak period and (b) methane production peak using different ABC as supplement.
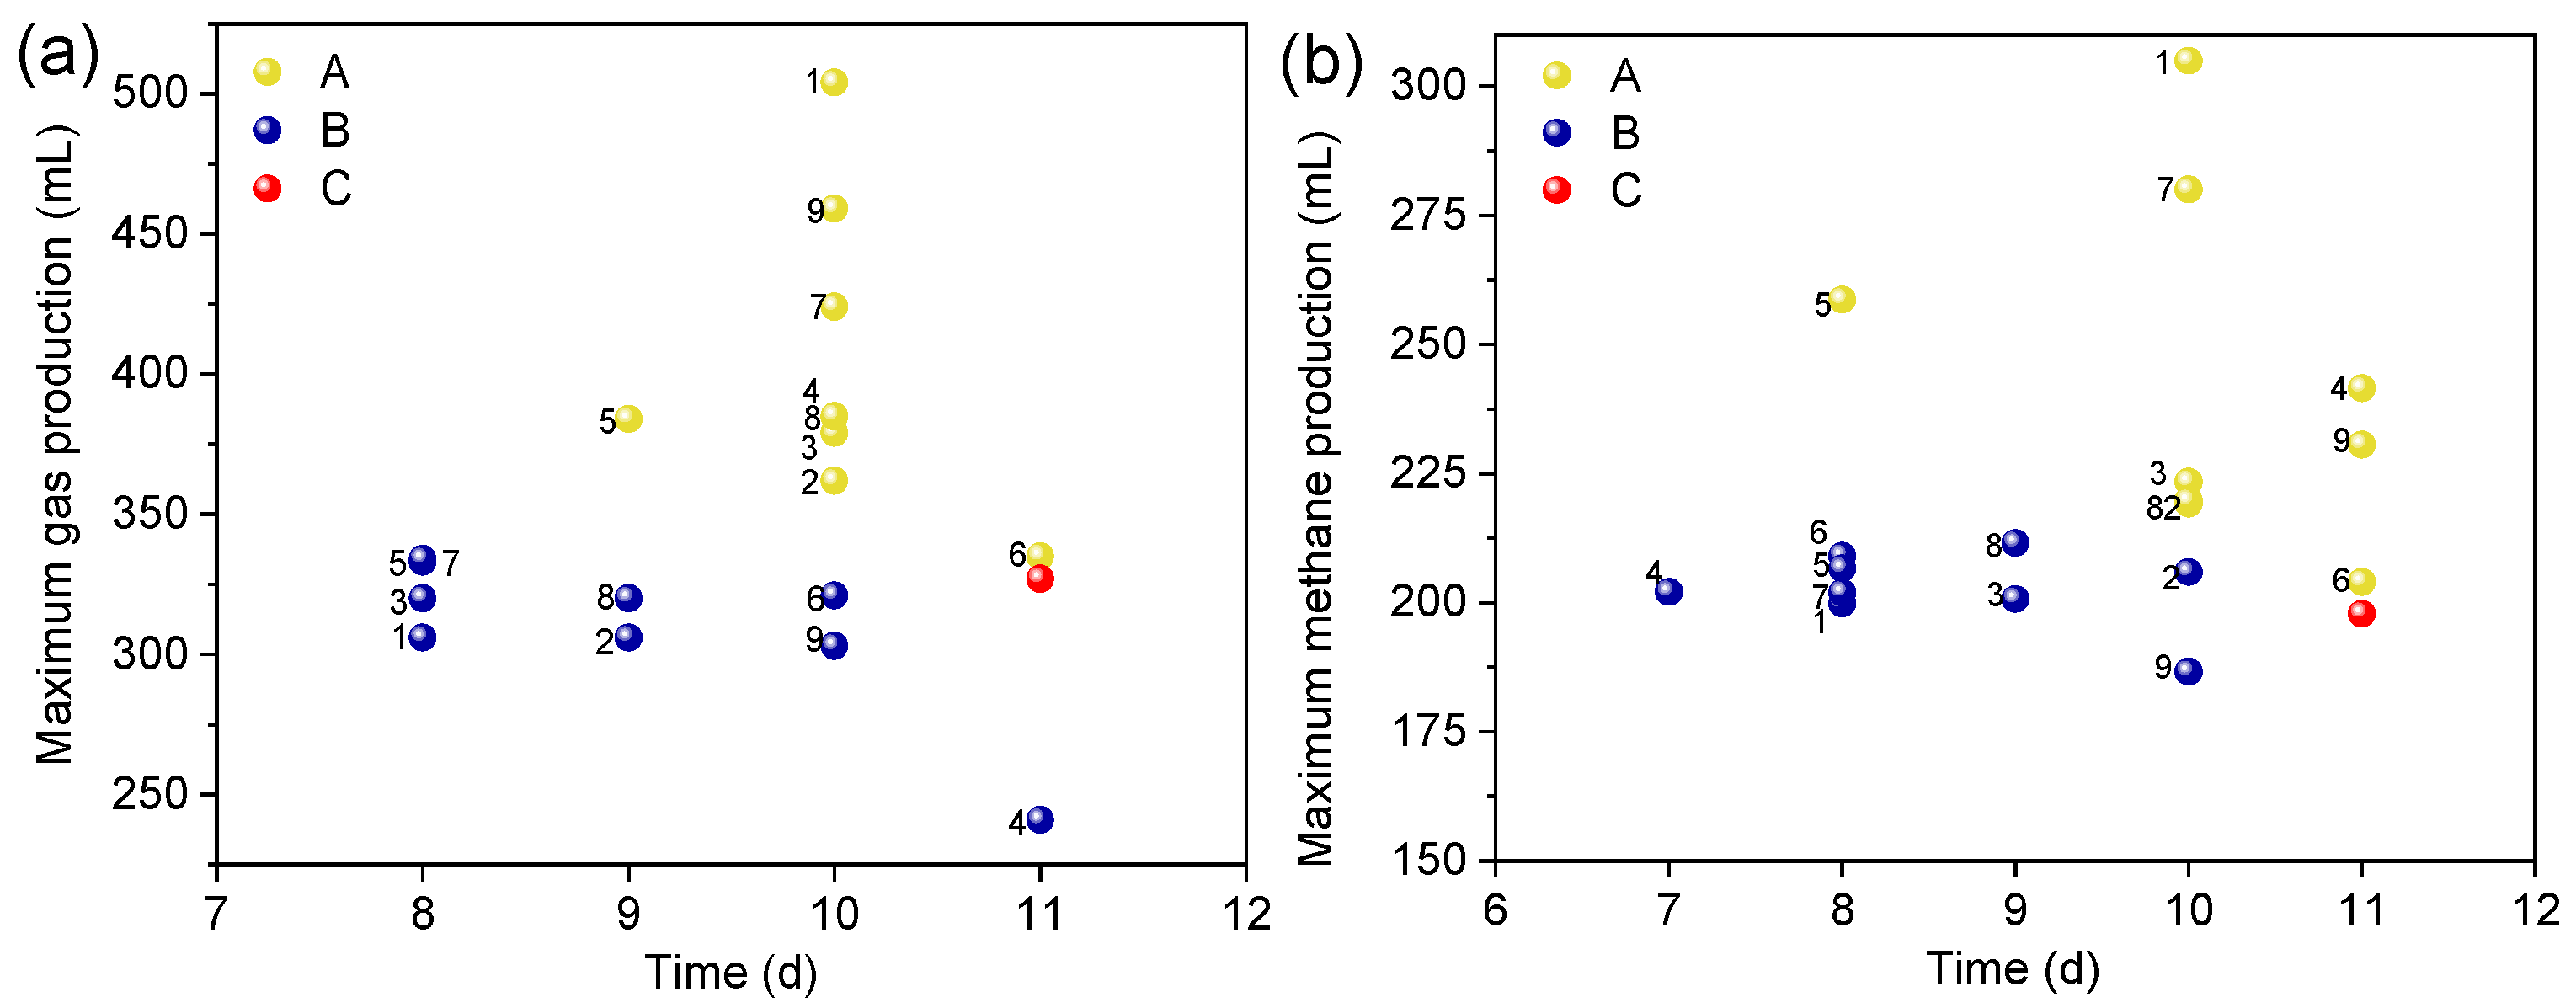
Figure 2.
Comparison chart of cumulative gas production using different ABCs as supplement.

Figure 3.
Cumulative methane production during anaerobic fermentation with (a) CABC and (b) PABC as a supplement.
Figure 3.
Cumulative methane production during anaerobic fermentation with (a) CABC and (b) PABC as a supplement.
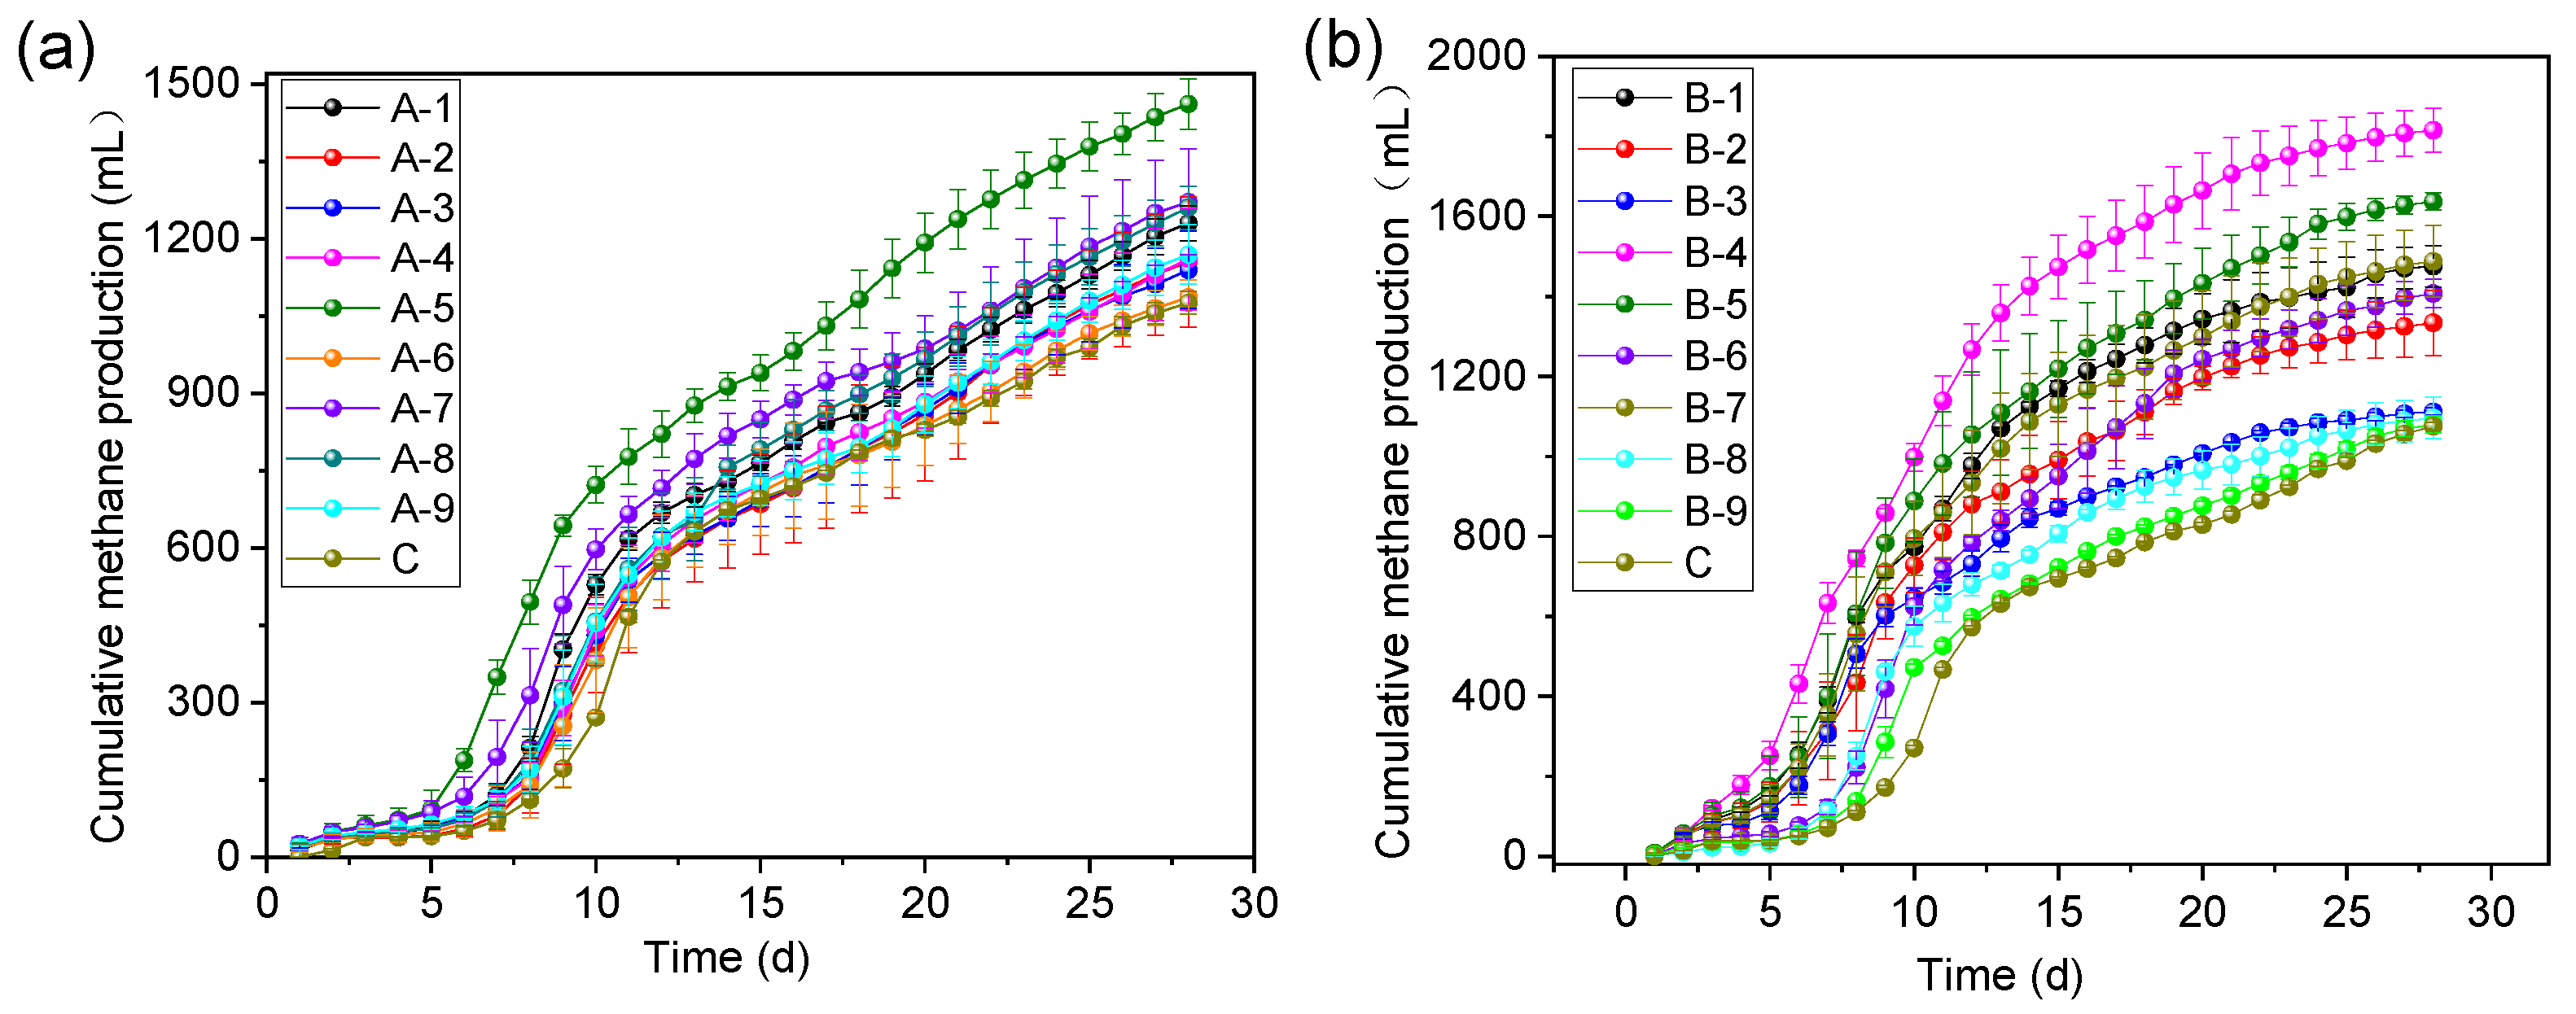
Figure 4.
Changes in the pH value of corn stalk during anaerobic fermentation with (a) CABC and (b) PABC as supplement.
Figure 4.
Changes in the pH value of corn stalk during anaerobic fermentation with (a) CABC and (b) PABC as supplement.
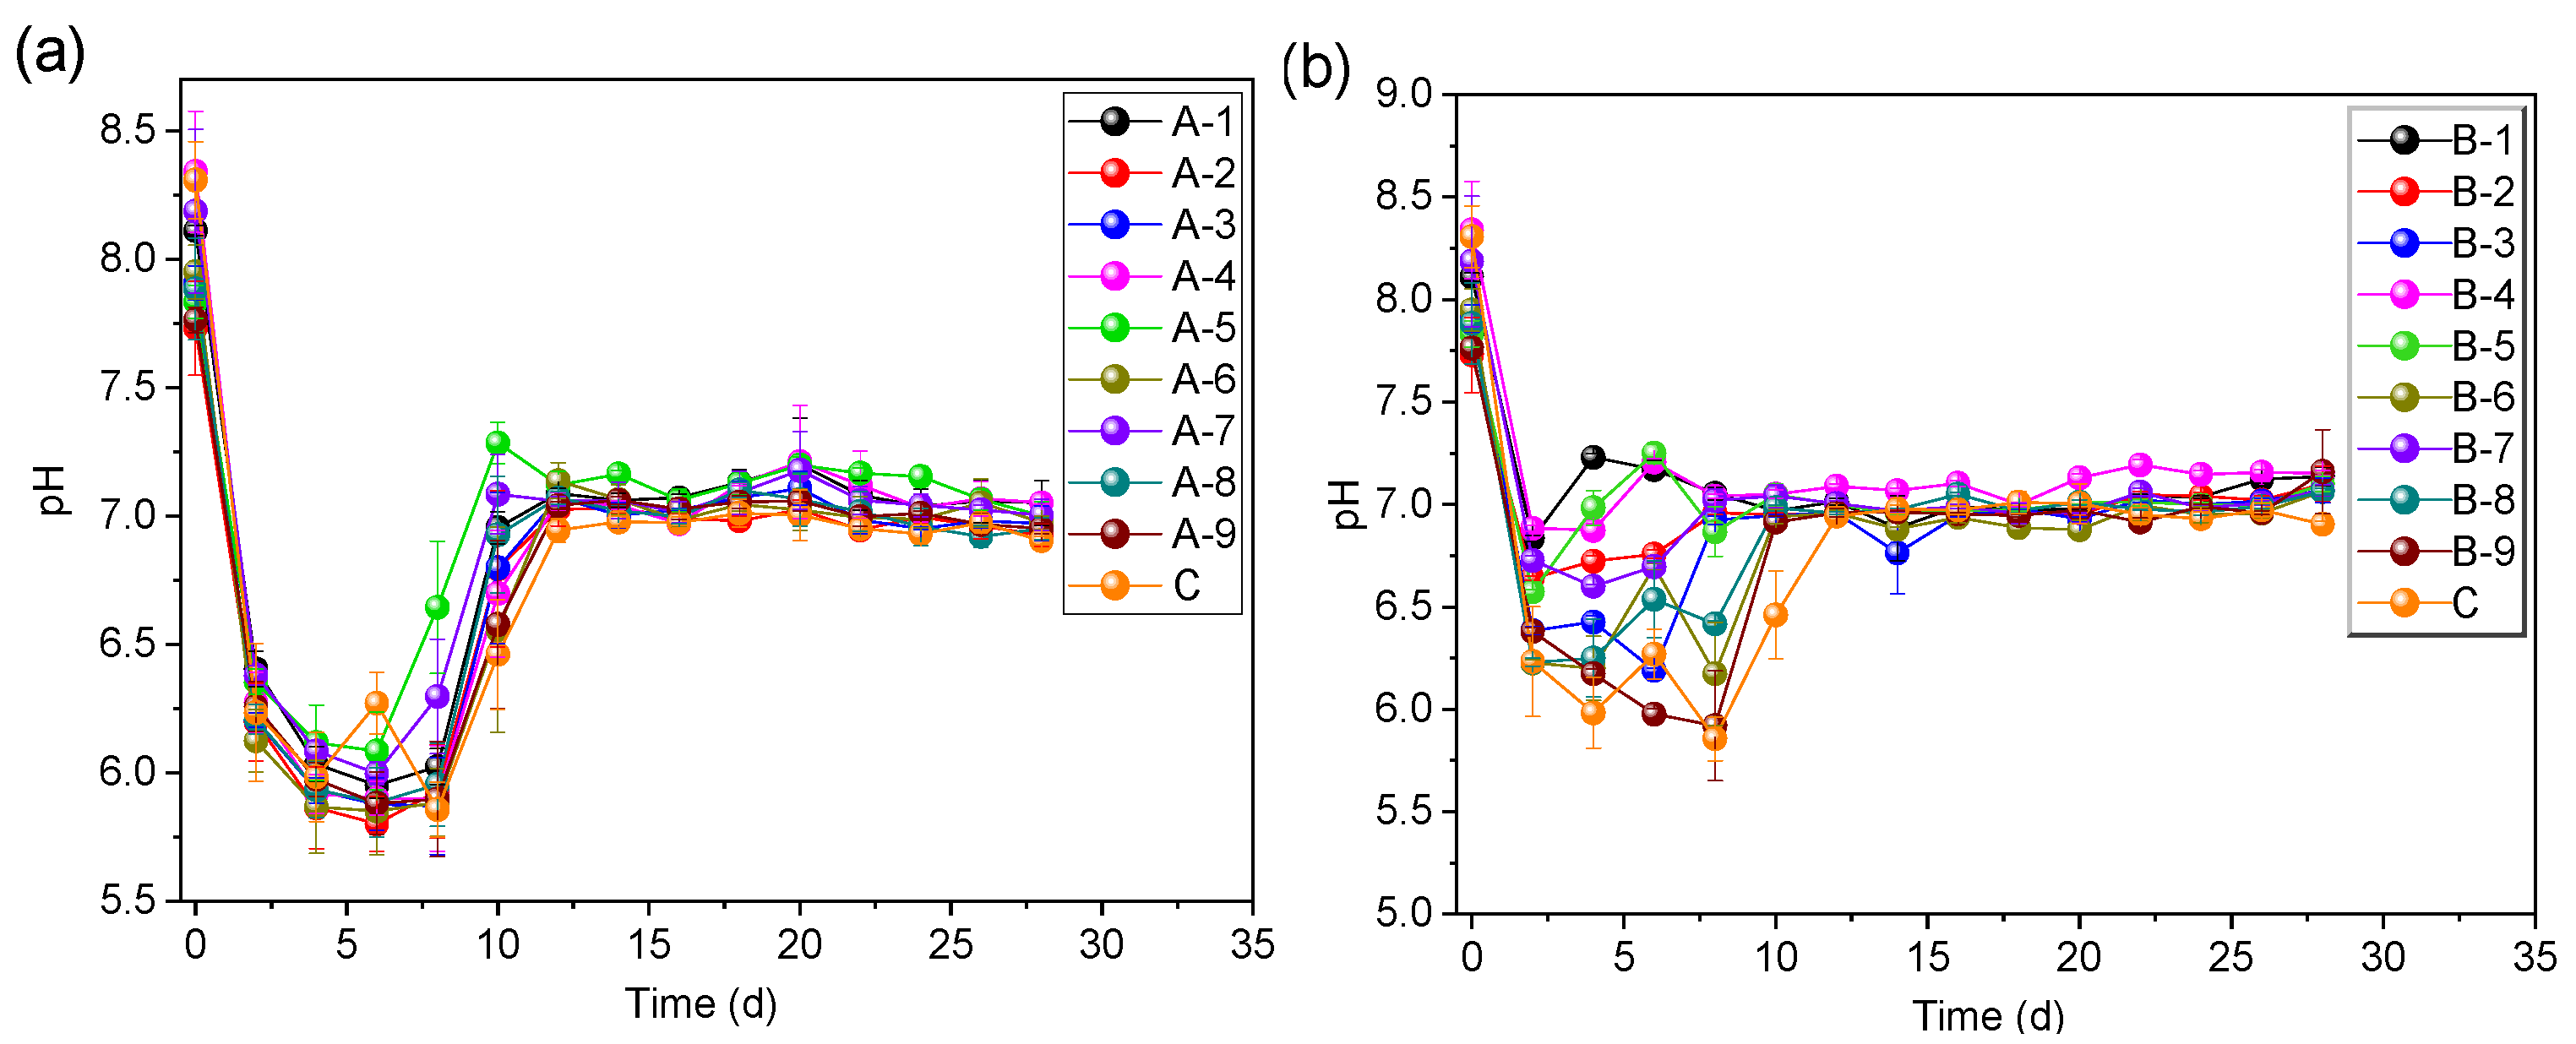
Figure 5.
SEM images of corn stalk: (a) before anaerobic fermentation, after anaerobic fermentation without supplement (b) and with (c) B-4 and (d) A-5 as supplement.
Figure 5.
SEM images of corn stalk: (a) before anaerobic fermentation, after anaerobic fermentation without supplement (b) and with (c) B-4 and (d) A-5 as supplement.
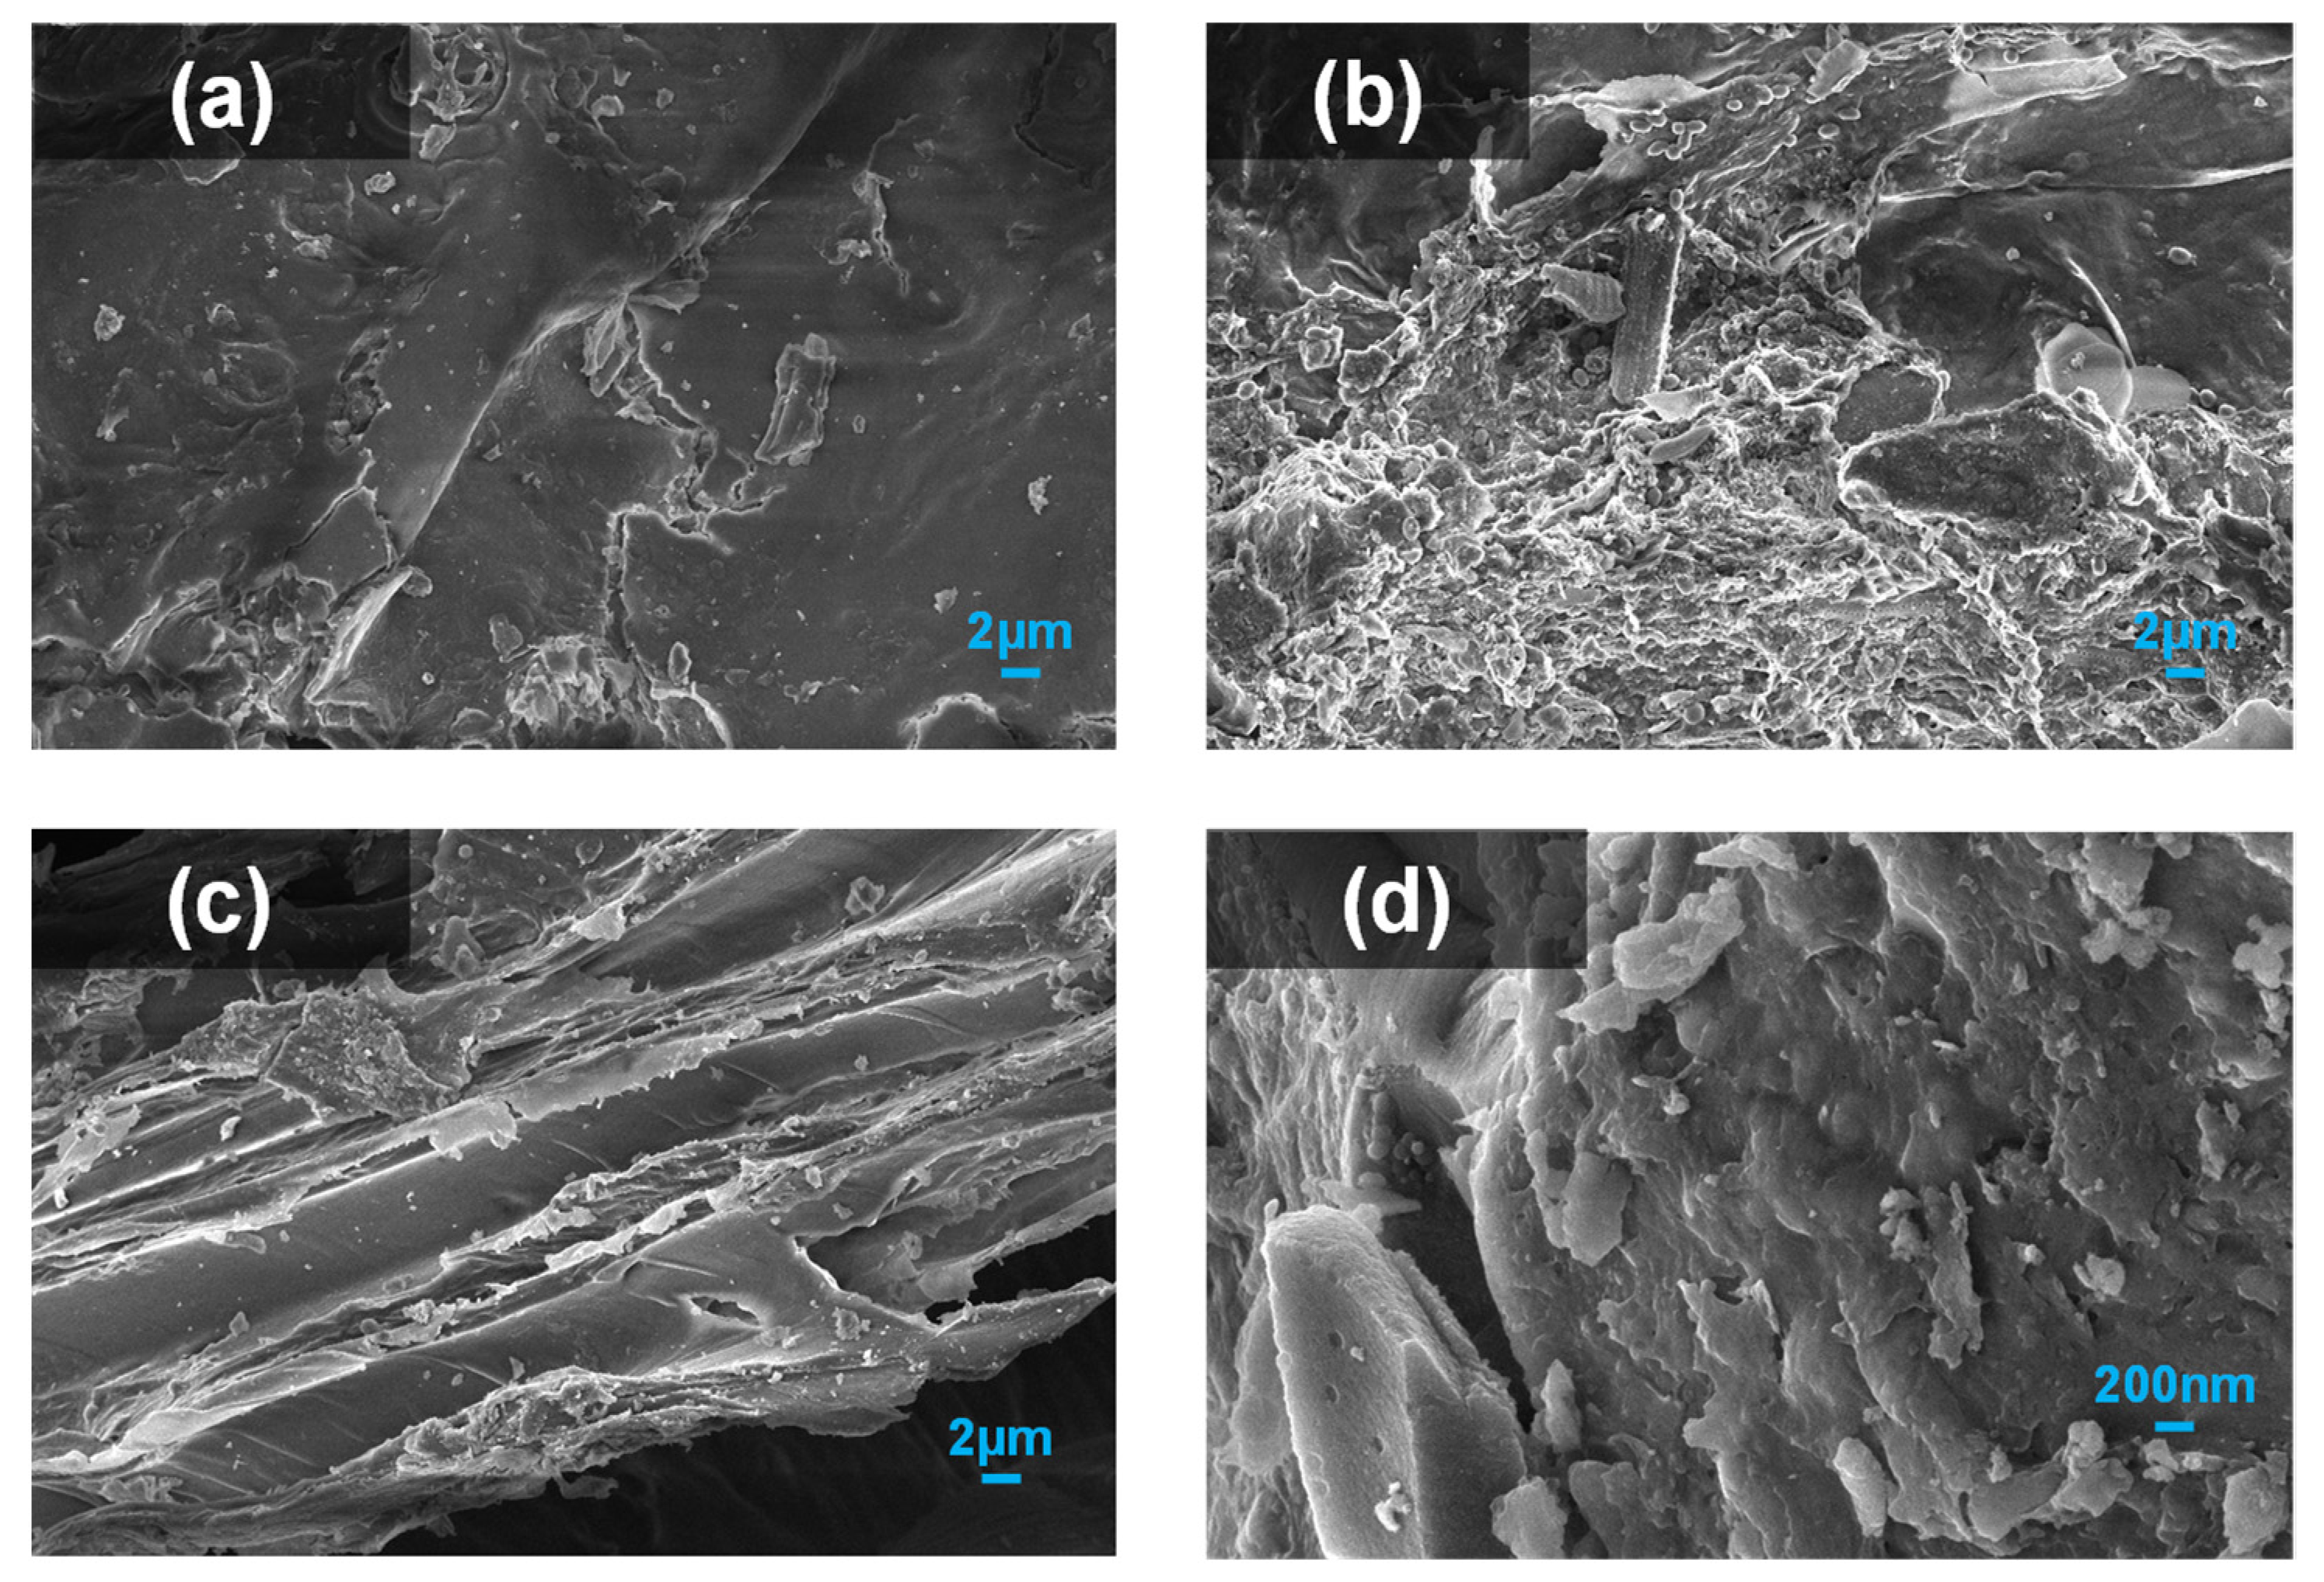
Figure 6.
XRD images of corn stalk before and after fermentation.

Figure 7.
The FT-IR spectra of the samples (a) CABC and (b) PABC.
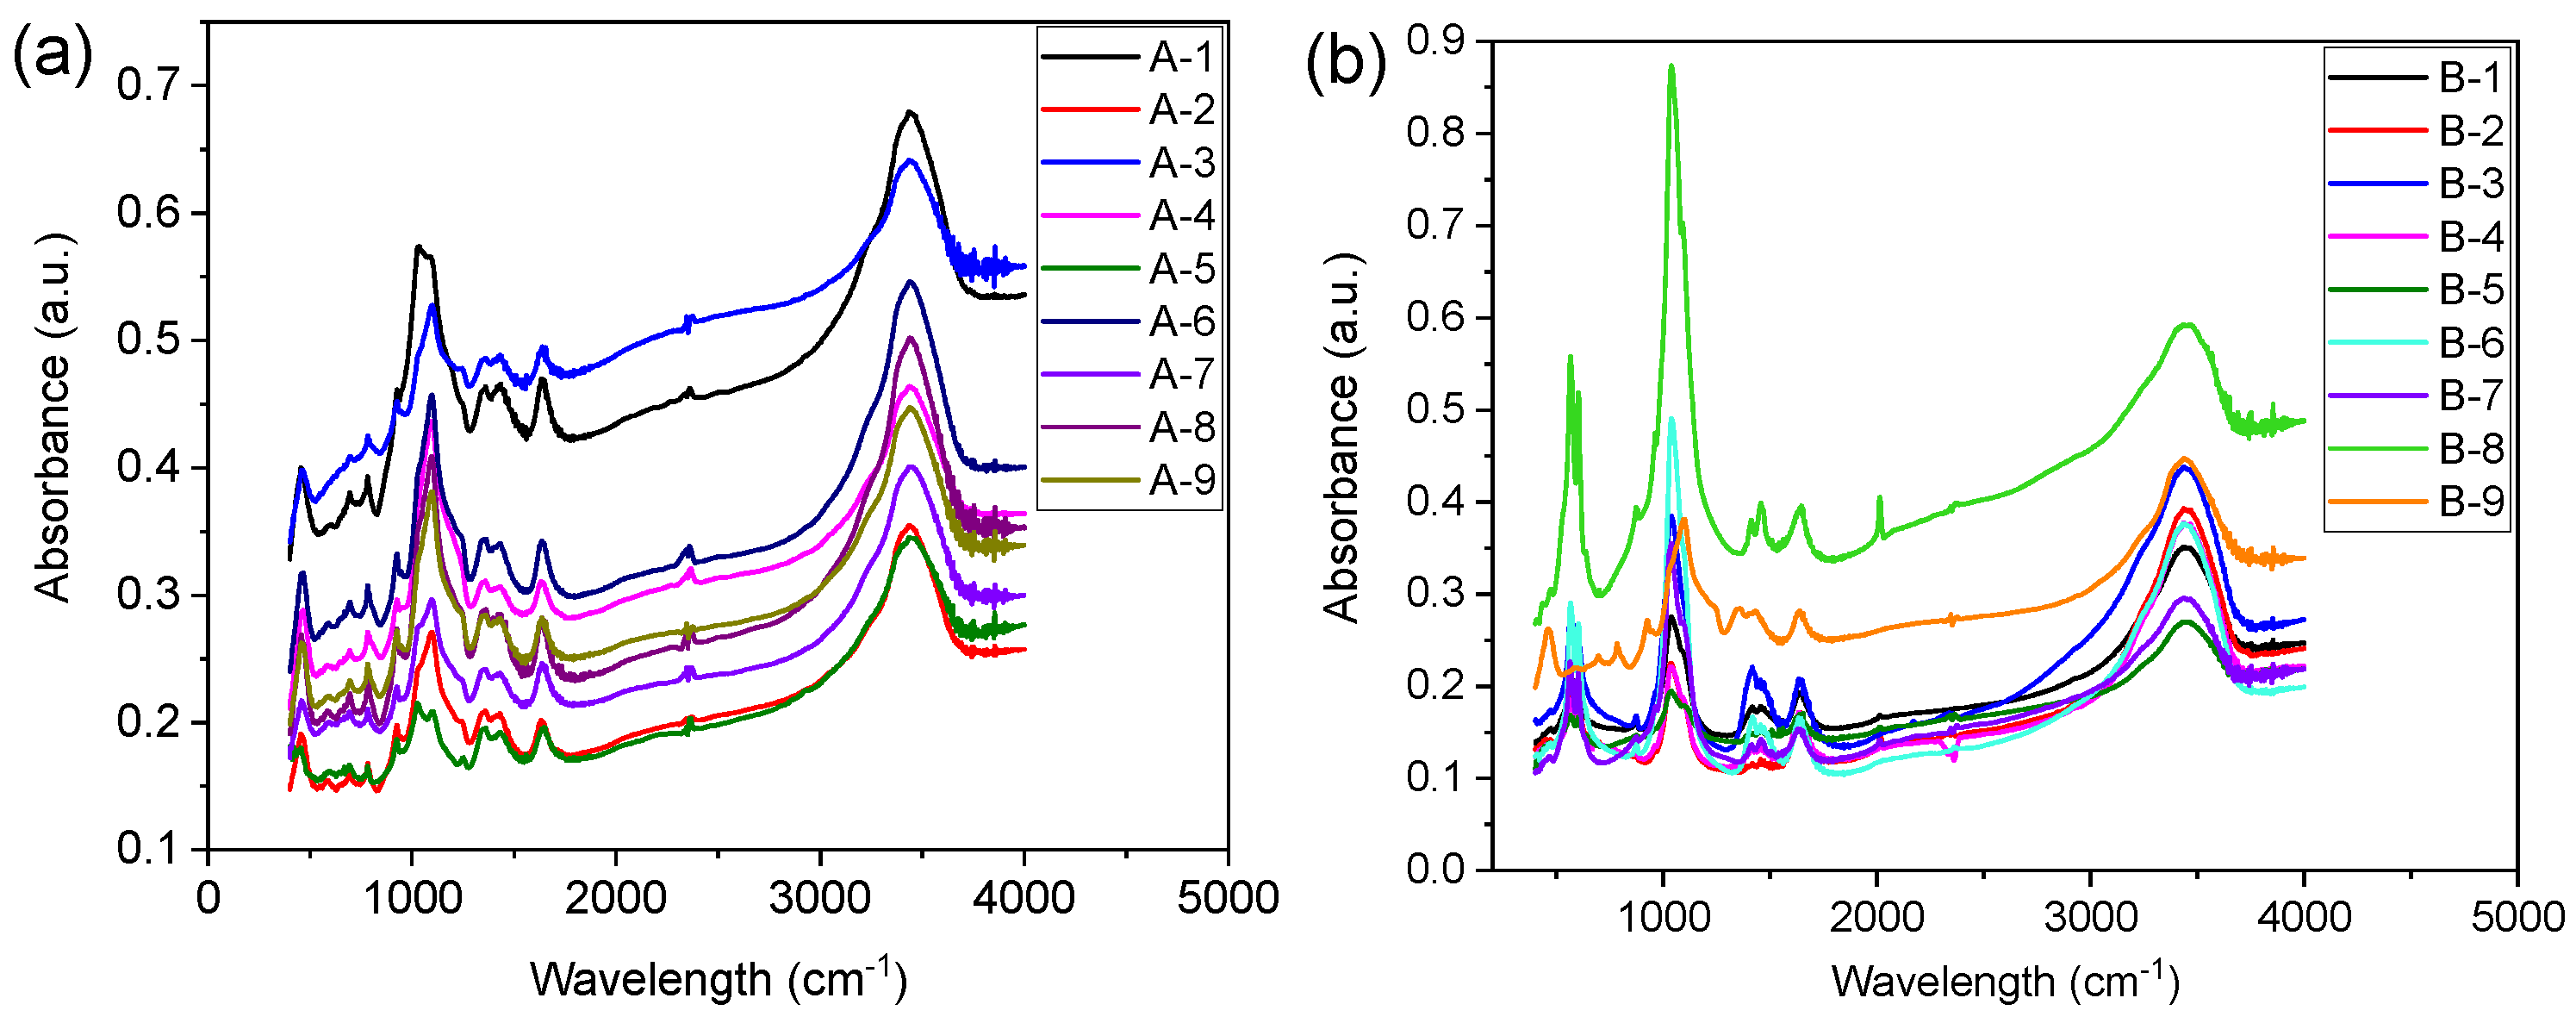
Figure 8.
The relationship between ABC properties and cumulative methane production of (a) CABC and (b) PABC.
Figure 8.
The relationship between ABC properties and cumulative methane production of (a) CABC and (b) PABC.


Table 1.
Preparation conditions and pore structure properties of ABC.
| Serial Number | Activation Temperature (°C) | Impregnation Ratio (g/g) | Activation Time (min) | Special Surface Area (m2/g) | Average Pore Size (nm) |
|---|---|---|---|---|---|
| A-1 | 600 | 2 | 30 | 140.85 | 3.69 |
| A-2 | 700 | 4 | 30 | 90.65 | 4.84 |
| A-3 | 800 | 6 | 30 | 102.72 | 4.24 |
| A-4 | 700 | 2 | 60 | 134.57 | 6.09 |
| A-5 | 800 | 4 | 60 | 74.24 | 5.95 |
| A-6 | 600 | 6 | 60 | 166.60 | 4.19 |
| A-7 | 800 | 2 | 90 | 155.13 | 4.67 |
| A-8 | 600 | 4 | 90 | 123.10 | 2.39 |
| A-9 | 700 | 6 | 90 | 113.23 | 4.47 |
| B-1 | 600 | 2 | 30 | 146.35 | 6.32 |
| B-2 | 700 | 4 | 30 | 129.34 | 5.27 |
| B-3 | 800 | 6 | 30 | 98.93 | 7.93 |
| B-4 | 700 | 2 | 60 | 111.01 | 6.52 |
| B-5 | 800 | 4 | 60 | 127.28 | 5.33 |
| B-6 | 600 | 6 | 60 | 86.75 | 8.43 |
| B-7 | 800 | 2 | 90 | 120.26 | 8.24 |
| B-8 | 600 | 4 | 90 | 95.37 | 6.80 |
| B-9 | 700 | 6 | 90 | 84.95 | 9.36 |
Table 2.
Basic properties of corn stalks and inoculated sludge.
| Samples | Moisture (%) | Total Solid (%) | Volatile Solid (%) | Ash (%) | C/N |
|---|---|---|---|---|---|
| Corn stalk | 3.1 | 96.9 | 91.9 | 5.1 | 38.04 |
| Inoculated sludge | 93.9 | 6.1 | 59.7 | 40.3 | 6.44 |
Publisher’s Note: MDPI stays neutral with regard to jurisdictional claims in published maps and institutional affiliations. |
© 2022 by the authors. Licensee MDPI, Basel, Switzerland. This article is an open access article distributed under the terms and conditions of the Creative Commons Attribution (CC BY) license (https://creativecommons.org/licenses/by/4.0/).
Share and Cite
MDPI and ACS Style
Zhang, Z.; Tian, S.; Liu, J.; Guo, P.-Y.; Shen, J. Influence of Animal/Plant Activated Biochar Properties on Methane Production from Corn Stalk by Anaerobic Fermentation. Fermentation 2022, 8, 397. https://doi.org/10.3390/fermentation8080397
AMA Style
Zhang Z, Tian S, Liu J, Guo P-Y, Shen J. Influence of Animal/Plant Activated Biochar Properties on Methane Production from Corn Stalk by Anaerobic Fermentation. Fermentation. 2022; 8(8):397. https://doi.org/10.3390/fermentation8080397
Chicago/Turabian StyleZhang, Zhen, Shujian Tian, Jun Liu, Peng-Yan Guo, and Jie Shen. 2022. "Influence of Animal/Plant Activated Biochar Properties on Methane Production from Corn Stalk by Anaerobic Fermentation" Fermentation 8, no. 8: 397. https://doi.org/10.3390/fermentation8080397
Note that from the first issue of 2016, this journal uses article numbers instead of page numbers. See further details here.