Article

Spent Yeast from Brewing Processes: A Biodiverse Starting Material for Yeast Extract Production

by
Friedrich Felix Jacob
1,*,
Lisa Striegel
2,
Michael Rychlik
2,
Mathias Hutzler
3 and
Frank-Jürgen Methner
1
1
Technische Universität Berlin—Institut für Lebensmitteltechnologie und Lebensmittelchemie—Fachgebiet Brauwesen, Seestraße 13, 13353 Berlin, Germany
2
Technische Universität München—Lehrstuhl für Analytische Lebensmittelchemie, Maximus-von-Imhof-Forum 2, 85354 Freising, Germany
3
Technische Universität München—Forschungszentrum Weihenstephan für Brau-und Lebensmittelqualität, Alte Akademie 3, 85354 Freising-Weihenstephan, Germany
*
Author to whom correspondence should be addressed.
Fermentation 2019, 5(2), 51; https://doi.org/10.3390/fermentation5020051
Submission received: 5 June 2019 / Revised: 14 June 2019 / Accepted: 20 June 2019 / Published: 24 June 2019
(This article belongs to the Special Issue Food Wastes: Feedstock for Value-Added Products)

Abstract

:
Spent yeast from beer manufacturing is a cost-effective and nutrient-rich starting material for the production of yeast extracts. In this study, it is shown how physiologically important ingredients in a yeast extract are influenced by the composition of the spent yeast from the brewing process. In pilot fermentations, the time of cropping (primary fermentation, lagering) of the spent yeast and the original gravity (12 ˚P, 16 ˚P, 20 ˚P) of the fermentation medium was varied, and four alternative non-Saccharomyces yeast strains were compared with two commercial Saccharomyces yeast strains. In addition, spent yeast was contaminated with the beer spoiler Lactobacillus brevis. The general nutrient composition (total protein, fat, ash) was investigated as well as the proteinogenic amino acid spectrum, the various folate vitamers (5-CH3-H4folate, 5-CHO-H4folate, 10-CHO-PteGlu, H4folate, PteGlu) and the biological activity (reduction, antioxidative potential) of a mechanically (ultrasonic sonotrode) and an autolytically produced yeast extract. All the investigated ingredients from the yeast extract were influenced by the composition of the spent yeast from the brewing process. The biodiversity of the spent yeast from the brewing process therefore directly affects the content of physiologically valuable ingredients of a yeast extract and should be taken into consideration in industrial manufacturing processes.

1. Introduction

Beer production generates large quantities of spent yeast during the fermentation and lagering process. Following primary fermentation, this equates to about 0.7–1.1 kg compressed yeast per hectoliterfinished beer [1]. According to the current state of brewing technology, spent yeast after primary fermentation is only used in small quantities to pitch the next batch [2]. The major share is obtained from a propagation plant, which provides highly viable and vital yeast that ferments vigorously [2]. At the end of the cold lagering process, yeast referred to as “lagering cellar yeast” is generated (0.5–0.9 kg compressed yeast per hl finished beer), together with precipitated turbidity particles and “barm beer” [1].
The spent yeast from the brewing process is suitable for use as an efficient starting material to produce yeast extract [1,3]. Yeast extract is generally defined as the soluble content of a yeast cell that remains once the cell wall has been destroyed and removed [4,5,6]. The variety of different physiologically valuable substances in yeast cells offers the possibility of using them as yeast extract in different areas of the food industry [3,7]. As “yeast food”, these extracts can therefore increase the free α-amino nitrogen (FAN) when fermenting beer worts with a high content of unmalted grains [8] or a high extract content (high-gravity worts) [9,10], and consequently improve the yeast’s nutrient supply and fermentation performance [11,12]. Free proteinogenic amino acids supply the majority of the FAN [12]. The quantity and composition of the relevant amino acids are ultimately critical to performance during fermentation [13] and also impact the beer’s aroma profile [14]. From a nutritional standpoint, yeast extracts from spent yeast supply a high concentration of essential and semi-essential amino acids for human beings [5,7]. Yeast extracts are also a good source of B vitamins [6,15]. Among these, the various naturally occurring folate vitamers play an essential role in the human diet, with the biologically active form 5-methyltetrahydrofolate (5-CH3-H4folate) fulfilling key metabolic tasks in human cells [16]. The bioactivity of yeast extracts, which is demonstrated in the form of reduction and anti-oxidative potential, also makes these extracts particularly interesting for the food industry [6,7,15,17].
The majority of globally produced beer is manufactured by fermenting high-gravity worts [18]. The extract content of the wort is increased by adding sugar syrup, which modifies the nutrient balance of the wort with respect to all physiologically active components [18]. The altered yeast metabolism during high-gravity fermentation not only changes the quality of the finished beer but also the material composition of the yeast [10,18]. In addition, the biodiversity of the generated spent yeast in breweries is increased through the use of various alternative non-Saccharomyces strains as pure starter cultures for beer production [19,20]. Improper storage or handling of the spent yeast can result in contamination with various microorganisms, which can impact the subsequent yeast extract production process [21]. The composition of ingredients in commercially available yeast extracts varies greatly [17]. One reason is the influence of different yeast extract manufacturing methods, which we have evaluated in previous studies [5,6]. Another reason lies in the diversity of yeast starting material [22]. To the best of our knowledge, no research has been undertaken until now about the influence of the biodiversity of spent yeast from the brewing process on the composition of ingredients in yeast extracts.
In this work, it was shown for the first time how the composition of various physiologically valuable substance groups of a yeast extract depends on the biodiversity of the spent yeast from beer production. Therefore, beer was produced on a pilot scale using 12 ˚P wort and different yeast strains (S. cerevisiae TUM 68, S. pastorianus TUM 34/70, Saccharomycodes ludwigii TUM SL 17, Saccharomycopsis fibuligera TUM 525, Brettanomyces bruxellensis TUM Bret 1 and Torulaspora delbrueckii T 90). Furthermore, different wort gravities (12 ˚P, 16 ˚P, 20 ˚P) were fermented with S. cerevisiae TUM 68 to investigate the influence of high-gravity brewing on a commercial yeast strain. The spent yeast generated after primary fermentation and lagering was then processed into yeast extract using a mechanical (ultrasonic sonotrode) and autolytic cell disruption method. All yeast extracts were investigated to determine their general composition (protein, fat and ash). The physiologically valuable protein content was analyzed in detail with regard to different free and protein-bound amino acids. The effects on the amino acid spectrum of the yeast extract through contamination of the spent yeast by the obligate beer spoiler Lactobacillus brevis were also observed. Additionally, we characterized the biological activity of the yeast extract based on its reduction and anti-oxidative potential. We also showed how the total folate content was allocated between the different folate vitamers (5-CH3-H4folate, 5-CHO-H4folate, 10-CHO-PteGlu, H4folate, PteGlu) in the fermentation medium or in the relevant spent yeast and then how it could be transferred to the yeast extract. These results should increase the knowledge on fluctuating nutritional composition of yeast extracts. Furthermore, the most appropriate brewer’s spent yeast could be selected to produce a yeast extract with the desired nutritional composition.

2. Materials and Methods

2.1. Yeast Propagation and Fermentation

A sterilized, hopped and standardized all malt wort concentrate (N53940; Döhler GmbH, Darmstadt, Germany) was used to produce the standardized propagation and fermentation wort. The all malt wort concentrate was diluted to an original gravity of 12 ˚P. To adjust the wort to the higher gravities of 16 ˚P and 18 ˚P, respectively, D-(+)-maltose monohydrate (Merck, Darmstadt, Germany) was added to 12 ˚P wort as an adjunct. Before use, worts were heat treated at 100 ˚C for 10 minutes for sterilization. The original gravity of the standardized fermentation wort corresponded to the original gravity of the standardized propagation wort. For the precise composition of the standardized all malt wort refer to Table 1.
The propagation procedure described below was used for all the yeast strains in the study. Saccharomyces cerevisiae TUM 68 (hereinafter Scer), Saccharomyces pastorianus TUM 34/70 (hereinafter Spas), Saccharomycodes ludwigii TUM SL17 (hereinafter Slud), Saccharomycopsis fibuligera TUM 525 (hereinafter Sfib), Brettanomyces bruxellensis TUM Bret1 (hereinafter Bbru) and Torulaspora delbrueckii TUM T90 (hereinafter Tdel) were sourced from the Yeast Center at the Weihenstephan Research Center for Brewing and Food Quality (RCW) of the Technical University of Munich (TUM) on agar slant. An inoculation loop of a pure agar slant colony was transferred to 40 mL standardized wort and incubated for 48 h at 20 °C on an orbital shaker (80 rpm). The 40 mL transferred into 400 mL standard wort and incubated again for 48 h at 20 °C on an orbital shaker (80 rpm). This process was repeated from 400 mL to 4 L standardized wort followed by an incubation at 48 h at 20 °C on an orbital shaker (80 rpm).
The fermentation procedure described below was used for all the yeast strains and standardized worts in the study. Standardized laboratory-scale brewing trials were performed using stainless steel vessels of 10 cm diameter × 33 cm height (2.5 L) with 20% headspace and clamped down lids according to Meier-Dörnberg et al. [23]. The propagated yeast was pitched in standardized and aerated (10 mg O2/L) wort in a Cornelius container (20 L) with a living cell count of 15 million CFU/mL. Each batch was then divided into three fermentation vessels. Fermentation took place at 18 °C and was unpressurized until final attenuation. The viscous primary fermentation yeast was cropped at the bottom of the vessel immediately after the final attenuation. The fermented supernatant was then stored in a carbonated and pressurized state (0.6 bar) for 14 days at 2 °C. Lagering cellar yeast was cropped from the bottom at the end of the cold lagering process again. The fermented supernatant and the spent yeast of each batch was immediately used for analysis and yeast extract production.

2.2. Yeast Pre-Treatment

After the yeast was cropped, it was immediately subjected to three washing processes to remove residual wort components. Each washing process was performed as follows: The viscous cropped spent yeast was diluted with distilled water to 10% dry matter, passed through a yeast sieve (mesh size 0.5 mm), centrifuged (1000 g, 5 min, 18 °C, 500 mL centrifuge tube) and the supernatant was discarded. The sedimented yeast in the centrifuge tube was then resuspended with distilled water for 5 minutes to 10% dry matter and the washing procedure was started afresh. The washed yeast was subsequently collected and diluted to 7% dry matter in distilled water before being fed into the disruption process.

2.3. Yeast Quality Control

The propagation yeast, the spent yeast, the washed spent yeast before disruption and the macerated yeast suspension were only used after passing quality control. Tests for quality control were already described in detail in our previous work [5,6] and had to give negative results for foreign yeasts and microorganisms.

2.4. Yeast Cell Disruption Methods

2.4.1. Ultrasonic Sonotrode

Cell disruption using cavitation was carried out using the ultrasonic homogenizer SONOPLUS HD 3400 (Bandelin). The sonotrode diameter was 25 mm with an operating frequency of 20 kHz. In a stainless steel vessel (400 mL) the process suspension (200 mL) was subjected for 30 minutes to a constant ultrasonic output of 400 W without pulsation. The resulting process heat was removed by means of a glycol-cooling bath to maintain a constant temperature of 7 °C. This disruption process was adopted according to Jacob et al. [5,6].

2.4.2. Standard Autolysis

To autolyze the yeast cells, 200 mL of the yeast suspension was heated in a reaction vessel (400 mL) for 24 h at 50 ˚C with constant stirring (100 rpm). Sodium chloride (0.086 mol/L) and ethyl acetate (0.051 mol/L) were added at the start of the process. This disruption process was adopted according to Jacob et al. [5,6].

2.4.3. Autolysis with Contamination of Lactobacillus brevis

Lactobacillus brevis BLQ 6 (sourced from the RCW) was cultivated in MRS broth medium (Sifin Diagnostics GmbH, Germany) for 3 days at 28 °C and harvested by centrifugation (2500 g, 10 min). The cells were washed with sterile water and centrifuged again. Lactobacillus brevis was added to an autolysis process (resulting in a final concentration in the autolysis suspension of 106 CFU/mL) that was conducted as described in Section 2.4.2.

2.4.4. Autolysis to Improve γ-aminobutyric Acid (GABA) Production

Process parameters of Masuda et al. were used to improve GABA production during autolysis [24]. Spent yeast (S. cerevisiae) after primary fermentation (12 ˚P) was washed (see Section 2.2) and added at a dry matter content of 7% to a solution containing sterile distilled water, monosodium glutamate (0.060 mol/L) (Merck, Darmstadt, Germany) and D-(+)-glucose monohydrate (0.266 mol/L) (Merck, Darmstadt, Germany). Following this, 200 mL of the reaction solution was adjusted to pH 6 with 2N HCl or 2N NaOH and incubated at 37 °C for 72 h with constant stirring (100 rpm). After 72 h the reaction solution was heated for 15 min at 85 °C. For the control, the process was conducted without monosodium glutamate or D-(+)-glucose monohydrate.

2.5. Production of Yeast Extract

After the yeast cell disruption process (Section 2.4.1, Section 2.4.2, Section 2.4.3 and Section 2.4.4) cell wall components first had to be separated from the cell extract. Therefore, the samples were centrifuged for 20 minutes at 10,000 g and 4 °C. The supernatant was carefully pipetted out the centrifuge tubes and freeze-dried (Christ Alpha 1–4 LSCbasic, condenser temperature: −55 °C, vacuum: 0.1 mbar, ice condenser capacity: 4 kg/24 h). In this way, a yeast extract powder was produced for the subsequent analyses that offered a constant basis for comparison.
The dry yeast extracts enabled the disruption methods to be directly compared in terms of the following analysis without the need to consider the effectiveness of the different methods. Results on the effectiveness of the three disruption methods can be reviewed in a previous work by Jacob et al. [5]. An overview of the sample description and related process details can be seen in Table 2.

2.6. Analysis

2.6.1. Protein and Amino Acids

Nitrogen content in the yeast extract was determined using the Kjeldahl method described in the MEBAK (Central European Brewing Technology Analysis Commission) brewing technology analysis methods (Method 2.6.1.1) [25]. Protein content of the yeast extracts was estimated by multiplying its nitrogen content by the factor 5.5 [26].
Free proteinogenic amino acids (except proline and cysteine) were quantified using high performance liquid chromatography (HPLC) according to MEBAK Method 2.6.4.1 [27]. The detailed procedure for proline and cysteine (Method 4.11.1) was taken from Buch für chemische Untersuchung von Futtermitteln (The chemical analysis of feedstuffs) [25]. To determine all free and protein-bound amino acids (total amino acid quantity), the resuspended yeast extracts underwent acid hydrolysis before measurements were taken according to Method 4.11.1 of the chemical analysis of feedstuffs [25].

2.6.2. Fat

Crude fat was determined according to Method 5.1.1 from the Methodenbuch für chemische Untersuchung von Futtermitteln (The chemical analysis of feedstuffs) [25].

2.6.3. Water and Ash Content

Water content was determined using MEBAK Method 2.2 [27], the ash content similarly according to Method 8.1 from the Methodenbuch für chemische Untersuchung von Futtermitteln (The chemical analysis of feedstuffs) [25].

2.6.4. Folate

Vitamin B9 (total folate) and folate derivatives (5-CH3-H4folate, 5-CHO-H4folate, 10-CHO-PteGlu, H4folate, PteGlu) were analyzed using LC-MS/MS according to the recently published method by Striegel et al. [28].

2.6.5. Antioxidative and Reduction Potential

The antioxidative potential of yeast extracts was measured using a Sigma-Aldrich kit, in which the antioxidants from a sample inhibit the formation of radical cations. Spectrophotometry was used to measure this inhibition proportionally by means of a color reaction. Trolox (TE), a vitamin E analog, was used as the control antioxidant.
Reduction potential of the yeast extract can be determined by MEBAK Method 2.15.2 [27]. The reductones of the sample reduce a certain quantity of Tillmann’s reagent (2,6-dichlorophenolindophenol, DPI) within a certain period, which can be measured spectrophotometrically (520 nm).

2.6.6. Wort Density

Wort density was measured using a DMA™ 35 Basic portable density meter (Anton Paar GmbH, Ostfildern, Germany), and the gravity was expressed in degree Plato (˚P). 1 ˚P corresponded to 1 g of extract per 100 g of liquid solution, where extract included both fermentable sugars and non-fermentable carbon sources.

2.6.7. Calculations of Apparent Attenuation

Apparent attenuation (%) of the wort was the proportion of the wort dissolved solids (extract), which was fermented during fermentation:
Apparent attenuation (%) = [(original gravity (˚P) − final gravity (˚P))/(original gravity (˚P))] × 100.

2.7. Statistical Evaluation

All experiments were performed in triplicate and the relevant results given as arithmetic means. At a confidence level of 95%, the expected range (confidence interval) for each mean was calculated from the variance using Student’s t-distribution. A single factor analysis of variance (ANOVA) and a paired t-test were performed to demonstrate differences between the results. “Significant” differences were described as having a p-value < 0.05. A test by Dixon was used to evaluate the results.

3. Results and Discussion

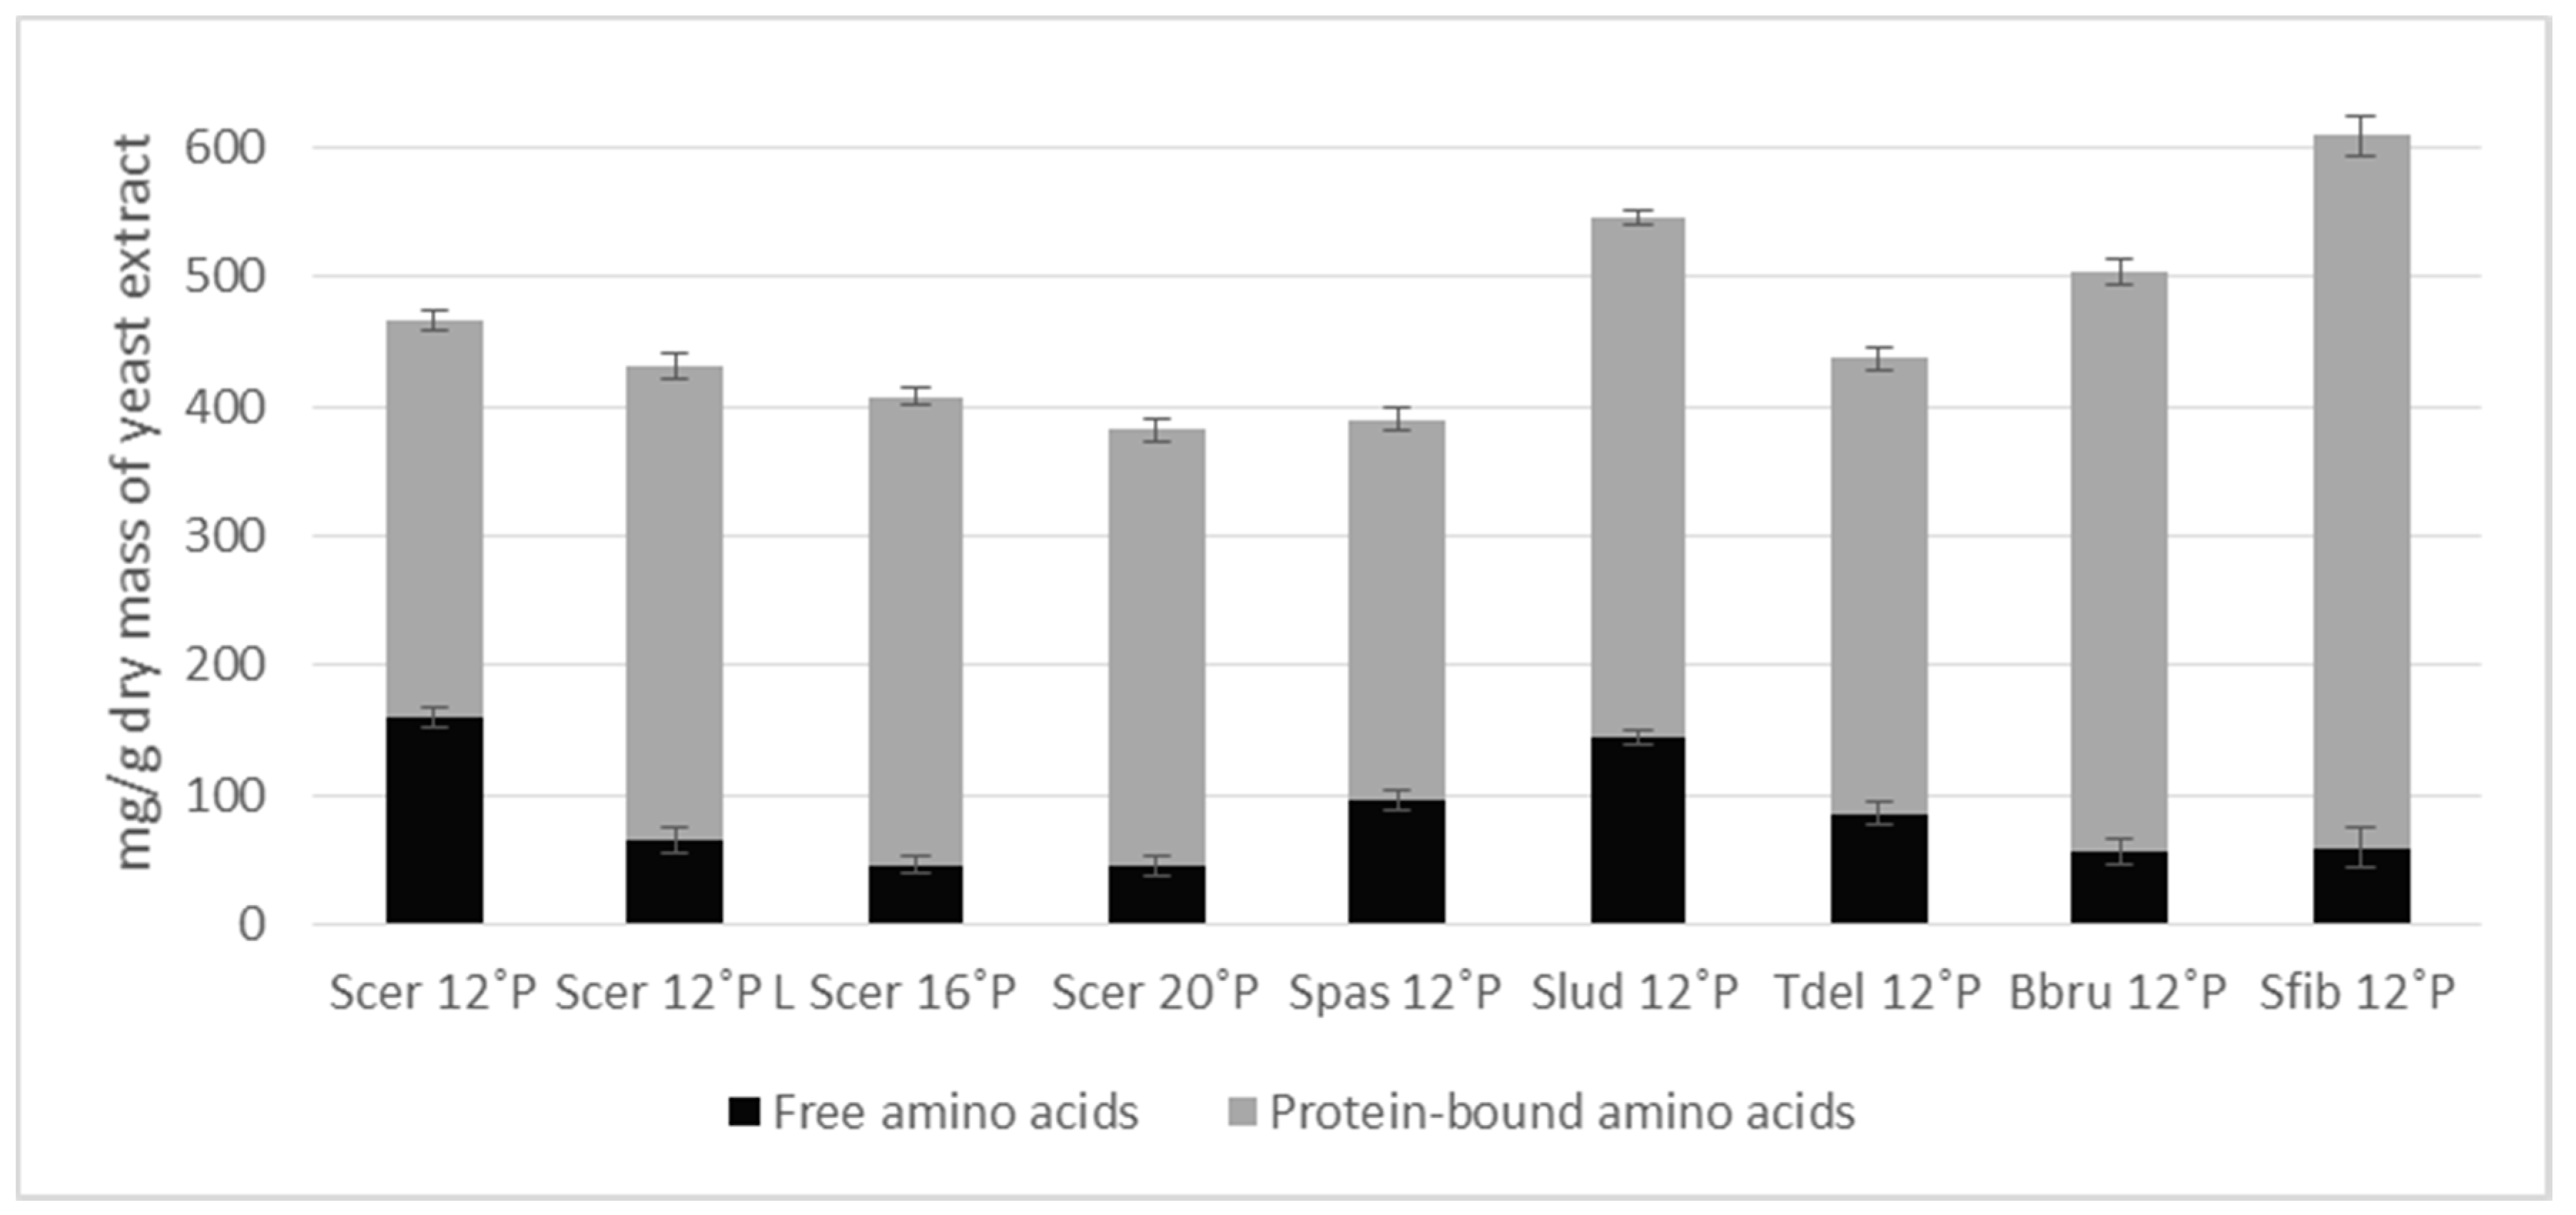
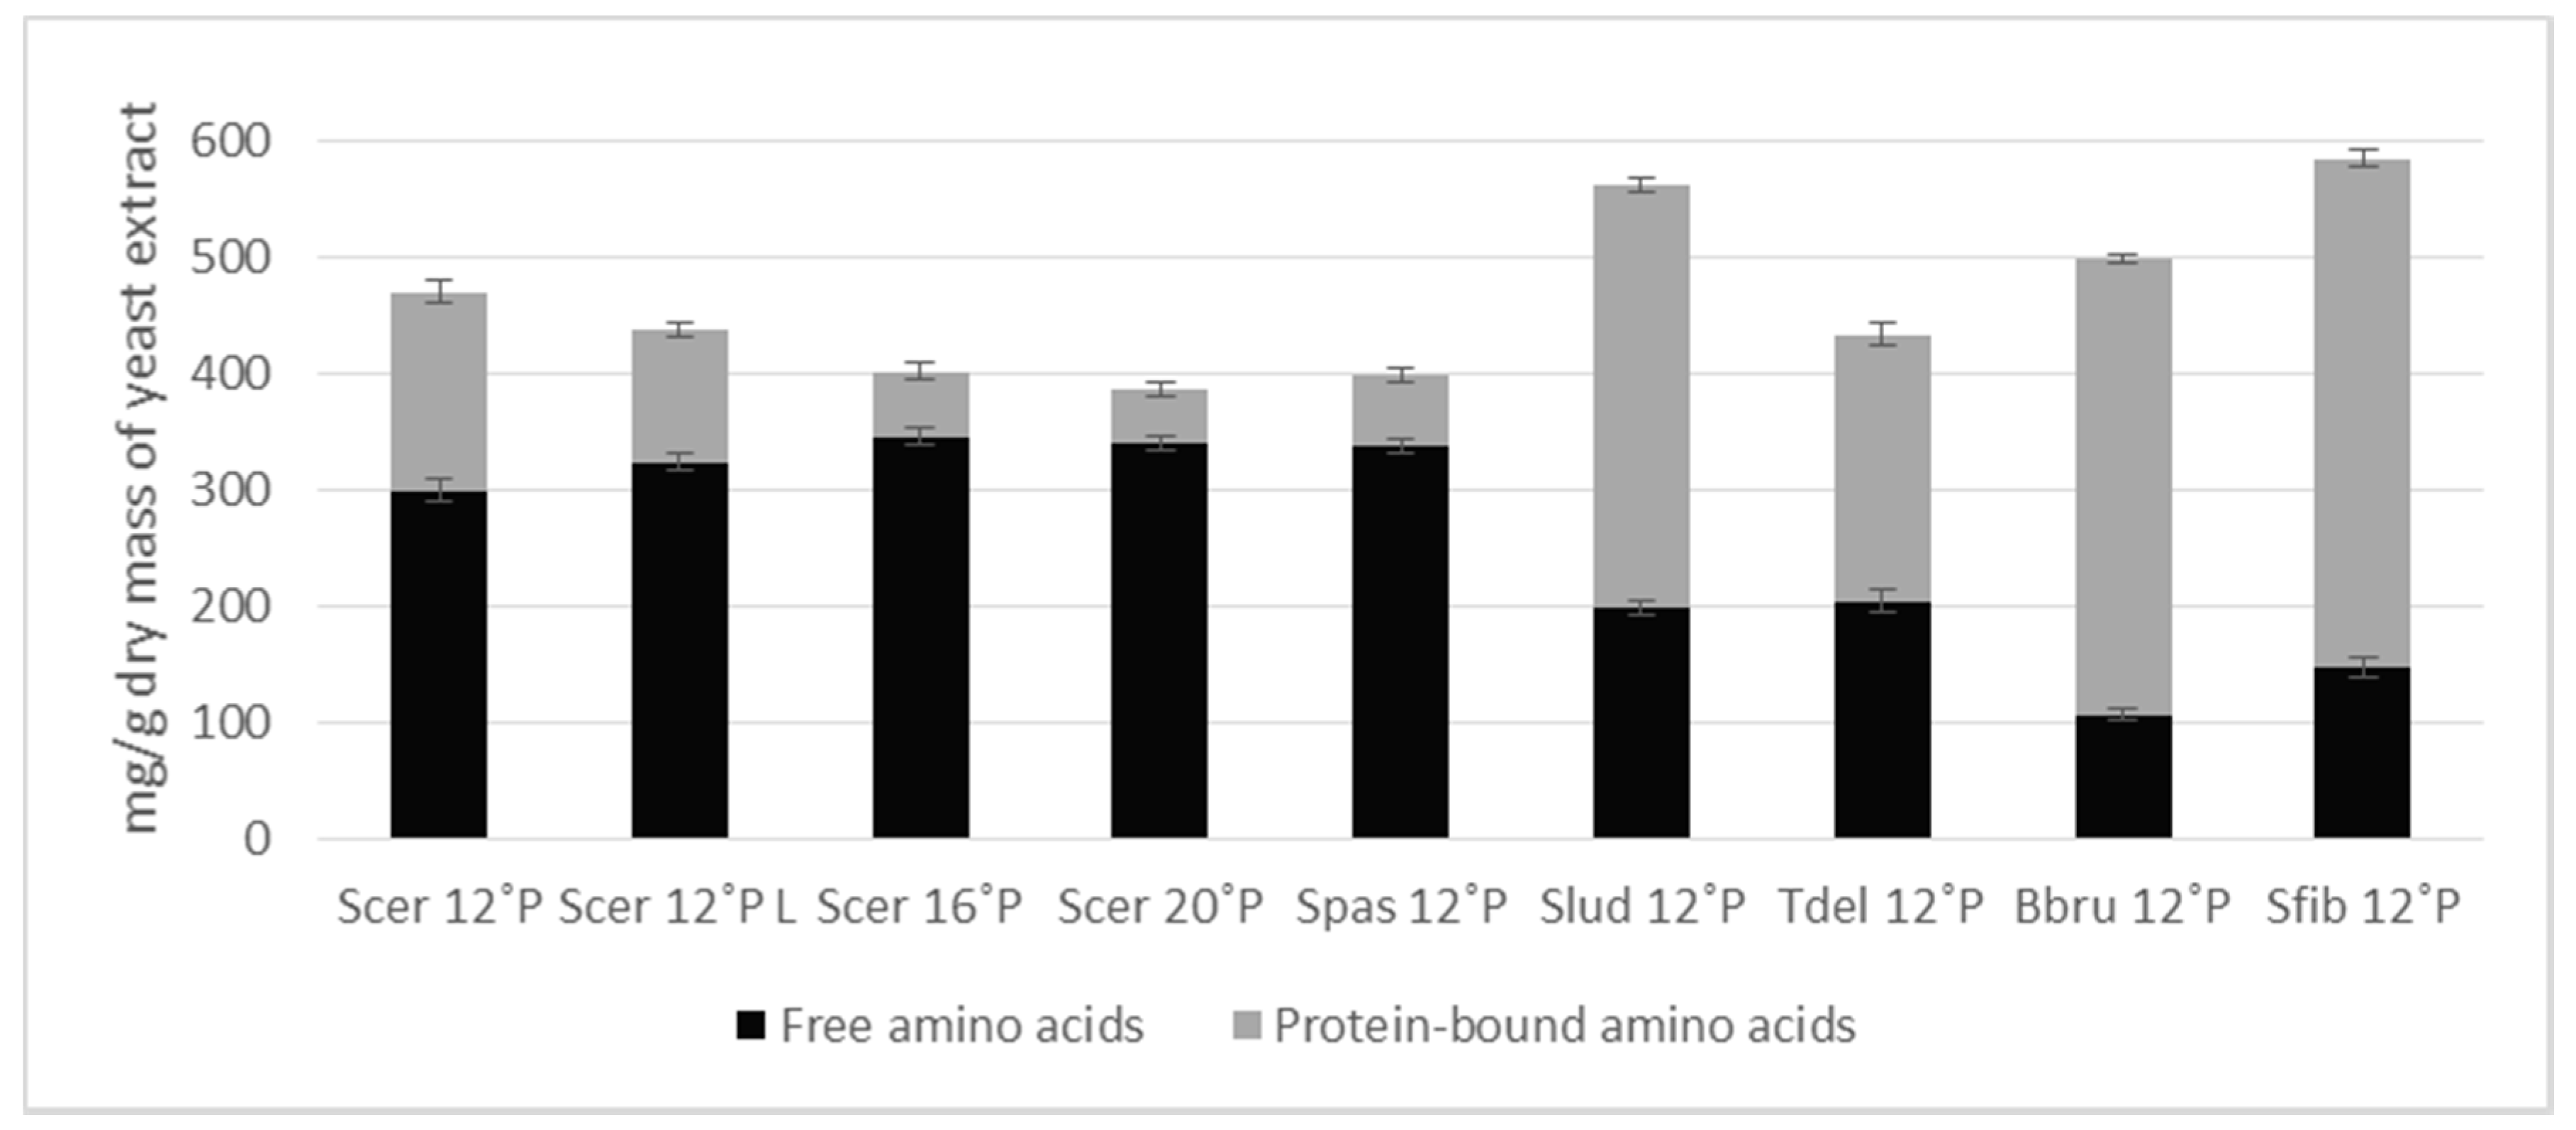
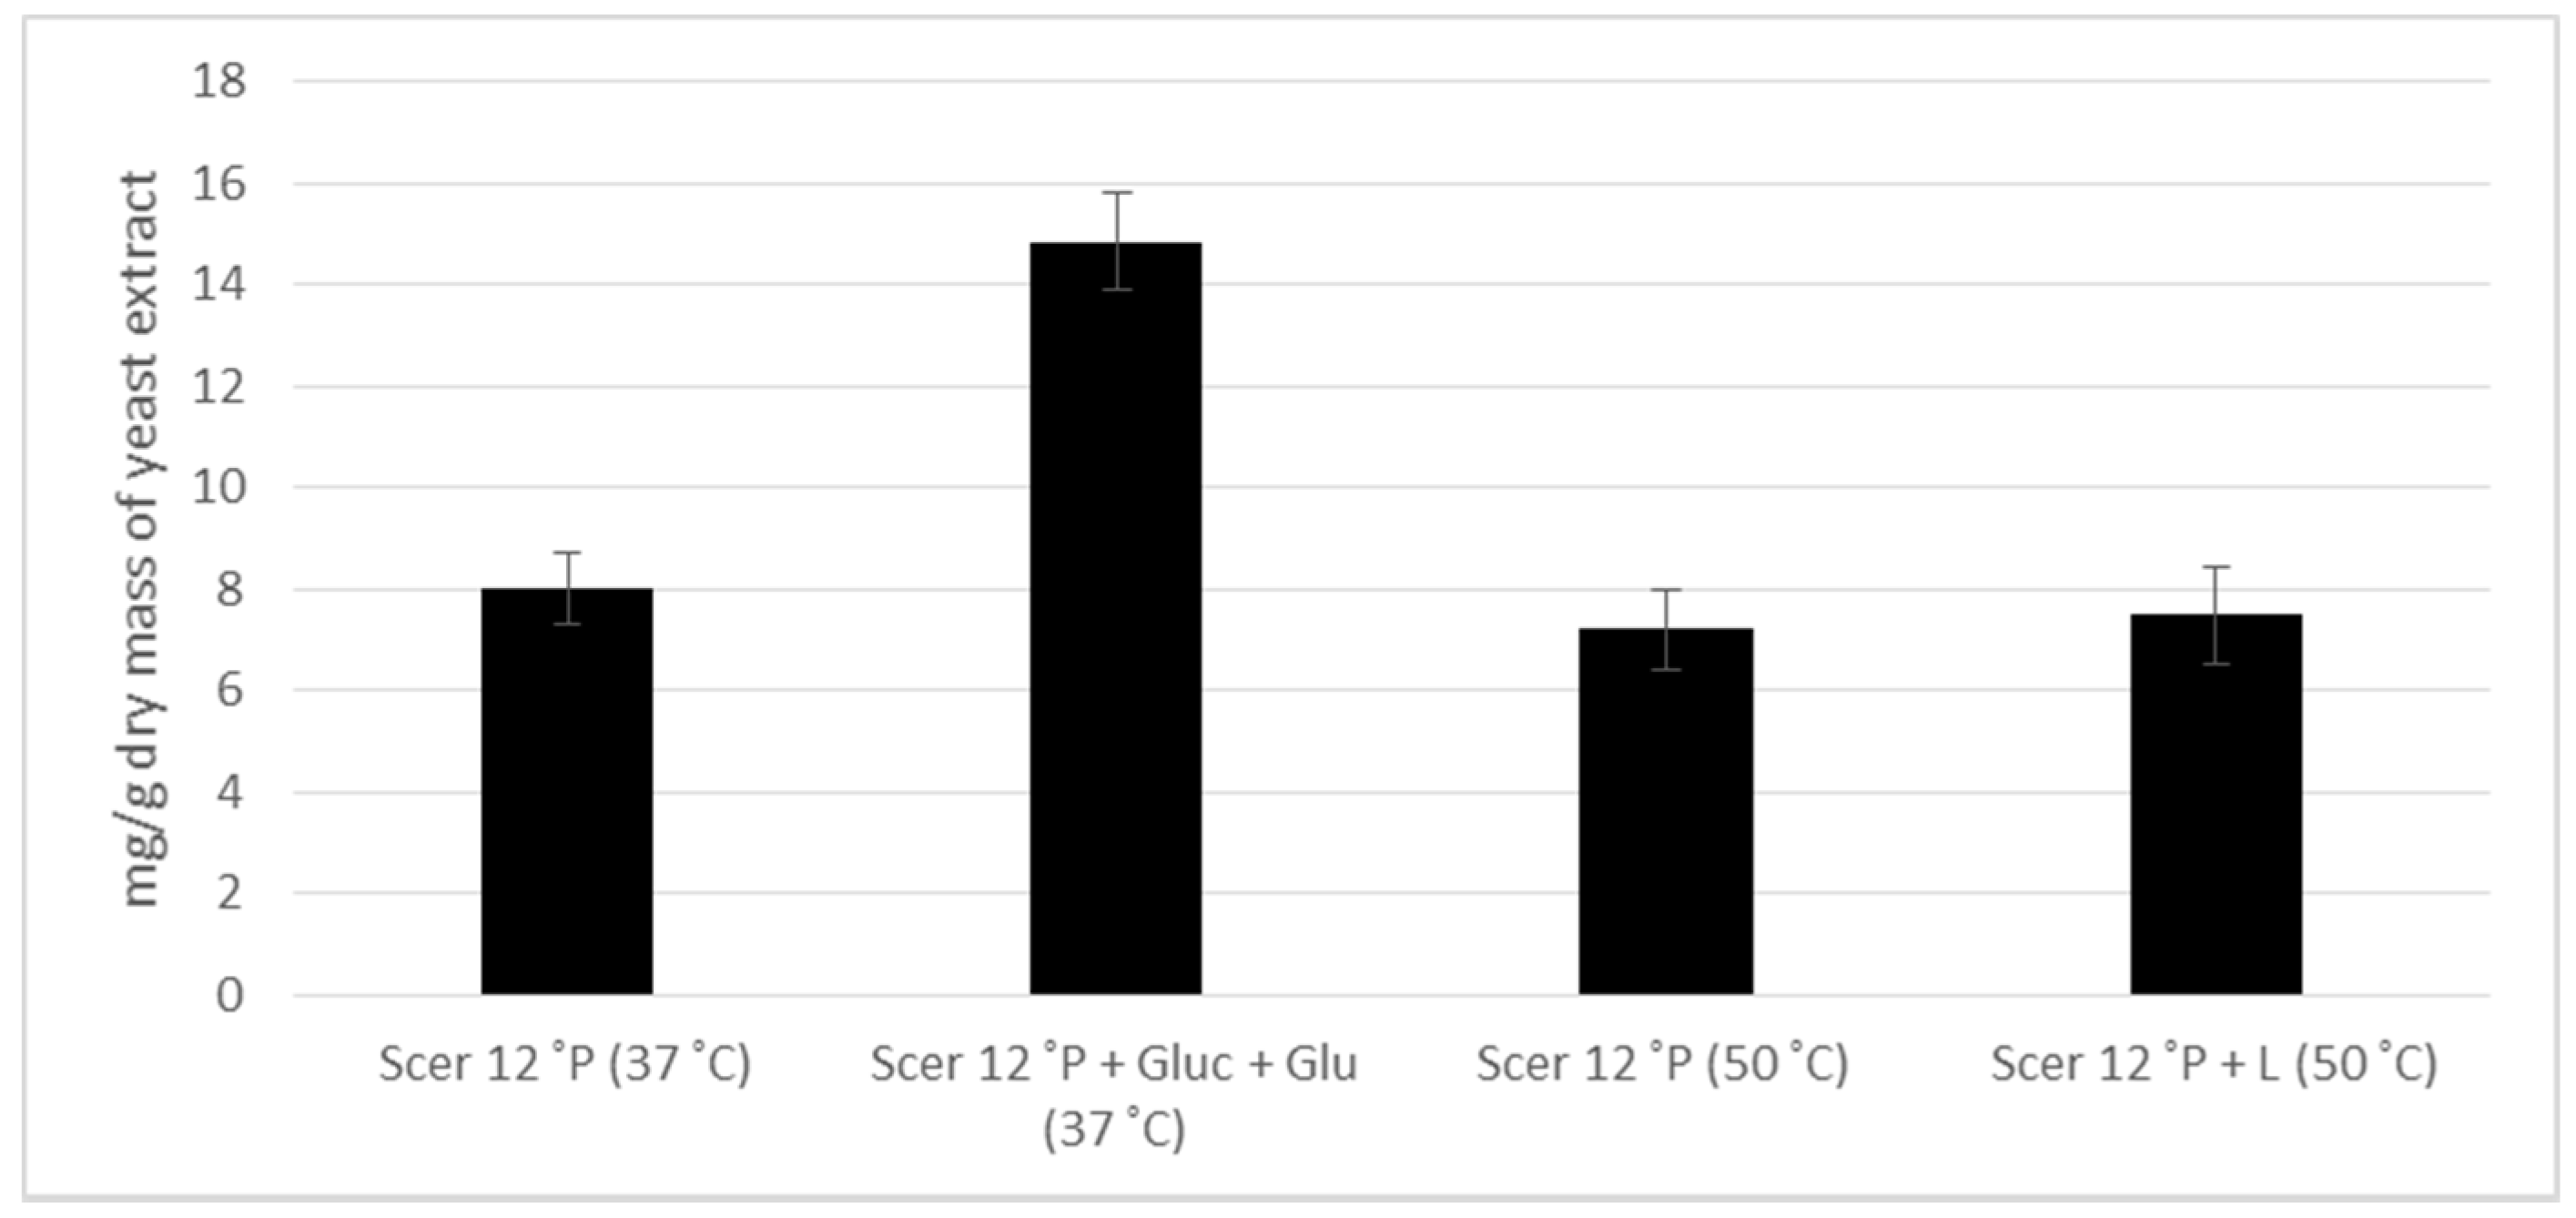
3.1. General Nutrient Composition

The nutrient value of the generated yeast extracts showed great variability. Table 3 lists the analysis results of the general nutrient composition of yeast extracts produced using the mechanical (ultrasonic sonotrode) method. To calculate the total protein content of the yeast extracts, the nitrogen quantity determined via Kjeldahl analysis was multiplied by the conversion factor 5.5 proposed by Reed et al. [26] This was proven to be a suitable conversion factor in our previous published papers in relation to yeast extracts [5,6] and was also used by Caballero-Cordoba et al. [29]. The factor of 6.25, which is generally used, overestimates the protein content as the total nitrogen volume contains the RNA nitrogen quantity (ribonucleic acids, 5–10% of the dry mass of yeast extract) as well as the proteinogenic nitrogen [5,6]. In the statistical evaluation of the obtained results, we established that the total protein content of the mechanically produced yeast extracts did not differ significantly (ANOVA p-value > 0.05) from the protein content of the autolytically produced yeast extracts (all nutritional data of the autolytically produced yeast extracts (Table S1) can be found in the supplementary materials). This observation was already noted and discussed in one of our previous papers [6]. Yeast extracts produced using primary fermentation yeast with different original wort contents (Scer 12 ˚P, Scer 16 ˚P, Scer 20 ˚P), differ significantly (ANOVA p-value < 0.05), with no significant difference between the fermentations Scer 16 ˚P and Scer 20 ˚P (t-test p-value > 0.05) (Table 3). This fact is justified in that adding maltose to the high-gravity worts (Scer 16 ˚P, Scer 20 ˚P) modified the nutrient balance compared with the normal-gravity worts (Scer 12 ˚P), and this caused a higher osmotic pressure at the start of fermentation and a higher alcohol content at the end of fermentation. Consequently, the yeast’s vitality and viability dropped [30], which is associated with reduced specific growth and fermentation rates [18,31]. For high-gravity fermentations, this is also linked to reduced amino acid uptake rates, higher residual FAN (freely available amino nitrogen) and increased accumulation of trehalose and glycogen [1,18]. Presumably, this reduces the protein content of the yeast cell dry mass and ultimately results in a lower total protein content in the yeast extract. In our trials, when using spent yeast from high-gravity fermentations (Scer 16 ˚P, Scer 20 ˚P), we established a protein content in yeast extract reduced by 8.5% when compared with spent yeast from normal-gravity (Scer 12 ˚P) fermentations.
We could also see a significant reduction (t-test p-value < 0.05) of the protein content (3%) in the yeast extract when using lagering cellar yeast (Scer 12 ˚P L) compared with primary fermentation yeast (Scer 12 ˚P) (Table 3). At the end of primary fermentation, part of the yeast was still suspended and settled as “lagering cellar yeast” only once cold lagering began. In this connection, Powell et al. showed that the unsettled yeast had a lower cell age with reduced fermentation performance and flocculation tendency, suggesting a modified physiological state [32]. A modified physiological state could explain the different protein contents of the yeast extract produced from lagering cellar yeast (Scer 12 ˚P L) and primary fermentation yeast (Scer 12 ˚P), too. During longer lagering phases, proteinogenic material in the yeast could also be lost via excretion, as established by Steckley et al. [33].
The protein content of the yeast extracts produced from primary fermentation yeast with different yeast strains also differed significantly (ANOVA p-value < 0.05). The non-Saccharomyces yeast strain S. fibuligera TUM 525 (Sfib 12 ˚P) gave the highest value at 598 mg/g yeast extract. The strain often used to produce alcohol-free or low-alcohol beer, S. ludwigii TUM SL 17 (Slud 12 ˚P), had the second-highest value at 574 mg/g yeast extract. The yeast strain B. bruxellensis TUM Bret 1 (Bbru 12 ˚P) provided 508 mg protein per g yeast extract. Only for the non-Saccharomyces yeast strain T. delbrueckii TUM T 90 (Tdel 12 ˚P) and the two commercially used yeast strains S. cerevisiae TUM 68 (Scer 12 ˚P) or S. pastorianus TUM 34/70 (Spas 12 ˚P) the protein content was less than 500 mg/g yeast extract. Spas 12 ˚P gave the lowest value overall in our trials (411.54 mg/g). For a S. pastorianus yeast strain, Vieira et al. determined values of 698 mg/g and 765 mg/g yeast extract when reusing the yeast two to four times in the fermentation process [34]. In another work, the same group determined a protein content of 641 mg/g yeast extract [15]. The sampling time during fermentation was unknown and the higher conversion factor of 6.25 was applied to calculate the protein content. For a brewery spent yeast, Podpora et al. established a protein content of 625 mg/g or 638 mg/g yeast extract, without giving details on the yeast strain or process conditions. Protein from the fermentation medium was also recorded for the yeast extract production and the higher conversion factor of 6.25 was applied [35].
There was no significant difference in the ash content of mechanically and autolytically produced yeast extracts (ANOVA p-value > 0.05), as demonstrated in our previous work when investigating various disruption methods [6]. The use of spent yeast from high-gravity fermentations (Scer 16 ˚P, Scer 20 ˚P) gave significantly lower values (t-test p-value < 0.05) for the ash content in the yeast extract than a spent yeast from normal-gravity fermentation (Scer 12 ˚P). This observation can be presumably attributed to the same effect that reduced the protein content in the yeast extract. Therefore, the ash percentage of the total dry mass could presumably be reduced by an increased trehalose and glycogen content due to the modified yeast metabolism. Another significantly lower result (t-test p-value < 0.05) was the ash concentration in the yeast extract caused by using lagering cellar yeast (Scer 12 ˚P L) rather than spent yeast obtained following primary fermentation (Scer 12 ˚P). The different physiological state of these two starting yeasts mentioned earlier is also suspected of influencing the cell ingredient composition. The ash content of the yeast extracts of all investigated yeast strains differed significantly (ANOVA p-value < 0.05). Only Bbru 12 ˚P and Scer 12 ˚P showed no significant difference (t-test p-value > 0.05). In literature, for the ash content, a range from 78 mg/g to 140 mg/g yeast extract is found [15,34,35]. Due to different yeast strains, fermentation media and yeast extract production processes, a direct comparison is not possible.
The fat content of all autolytically produced yeast extracts was between 0.04–0.05% of the dry mass and did not differ significantly (ANOVA p-value > 0.05). By using the mechanical cell disruption method, the fat content of the yeast extracts reached a maximum of 18.2 mg and a minimum of 9.68 mg per g yeast extract (Table 3). Neither the time of cropping the spent yeast (Scer 12 ˚P vs. Scer 12 ˚P L) or the original wort content (Scer 12 ˚P, Scer 16 ˚P, Scer 20 ˚P) in the fermentation process had any significant influence on the fat content of the yeast extract (ANOVA and t-test p-value > 0.05). Only the yeast strains Slud 17 12 ˚P and Bbru 12 ˚P differed significantly from the others (t-test p-value < 0.05). In general, the fat content of the yeast extracts was very low as already established in other studies [6,15,34].

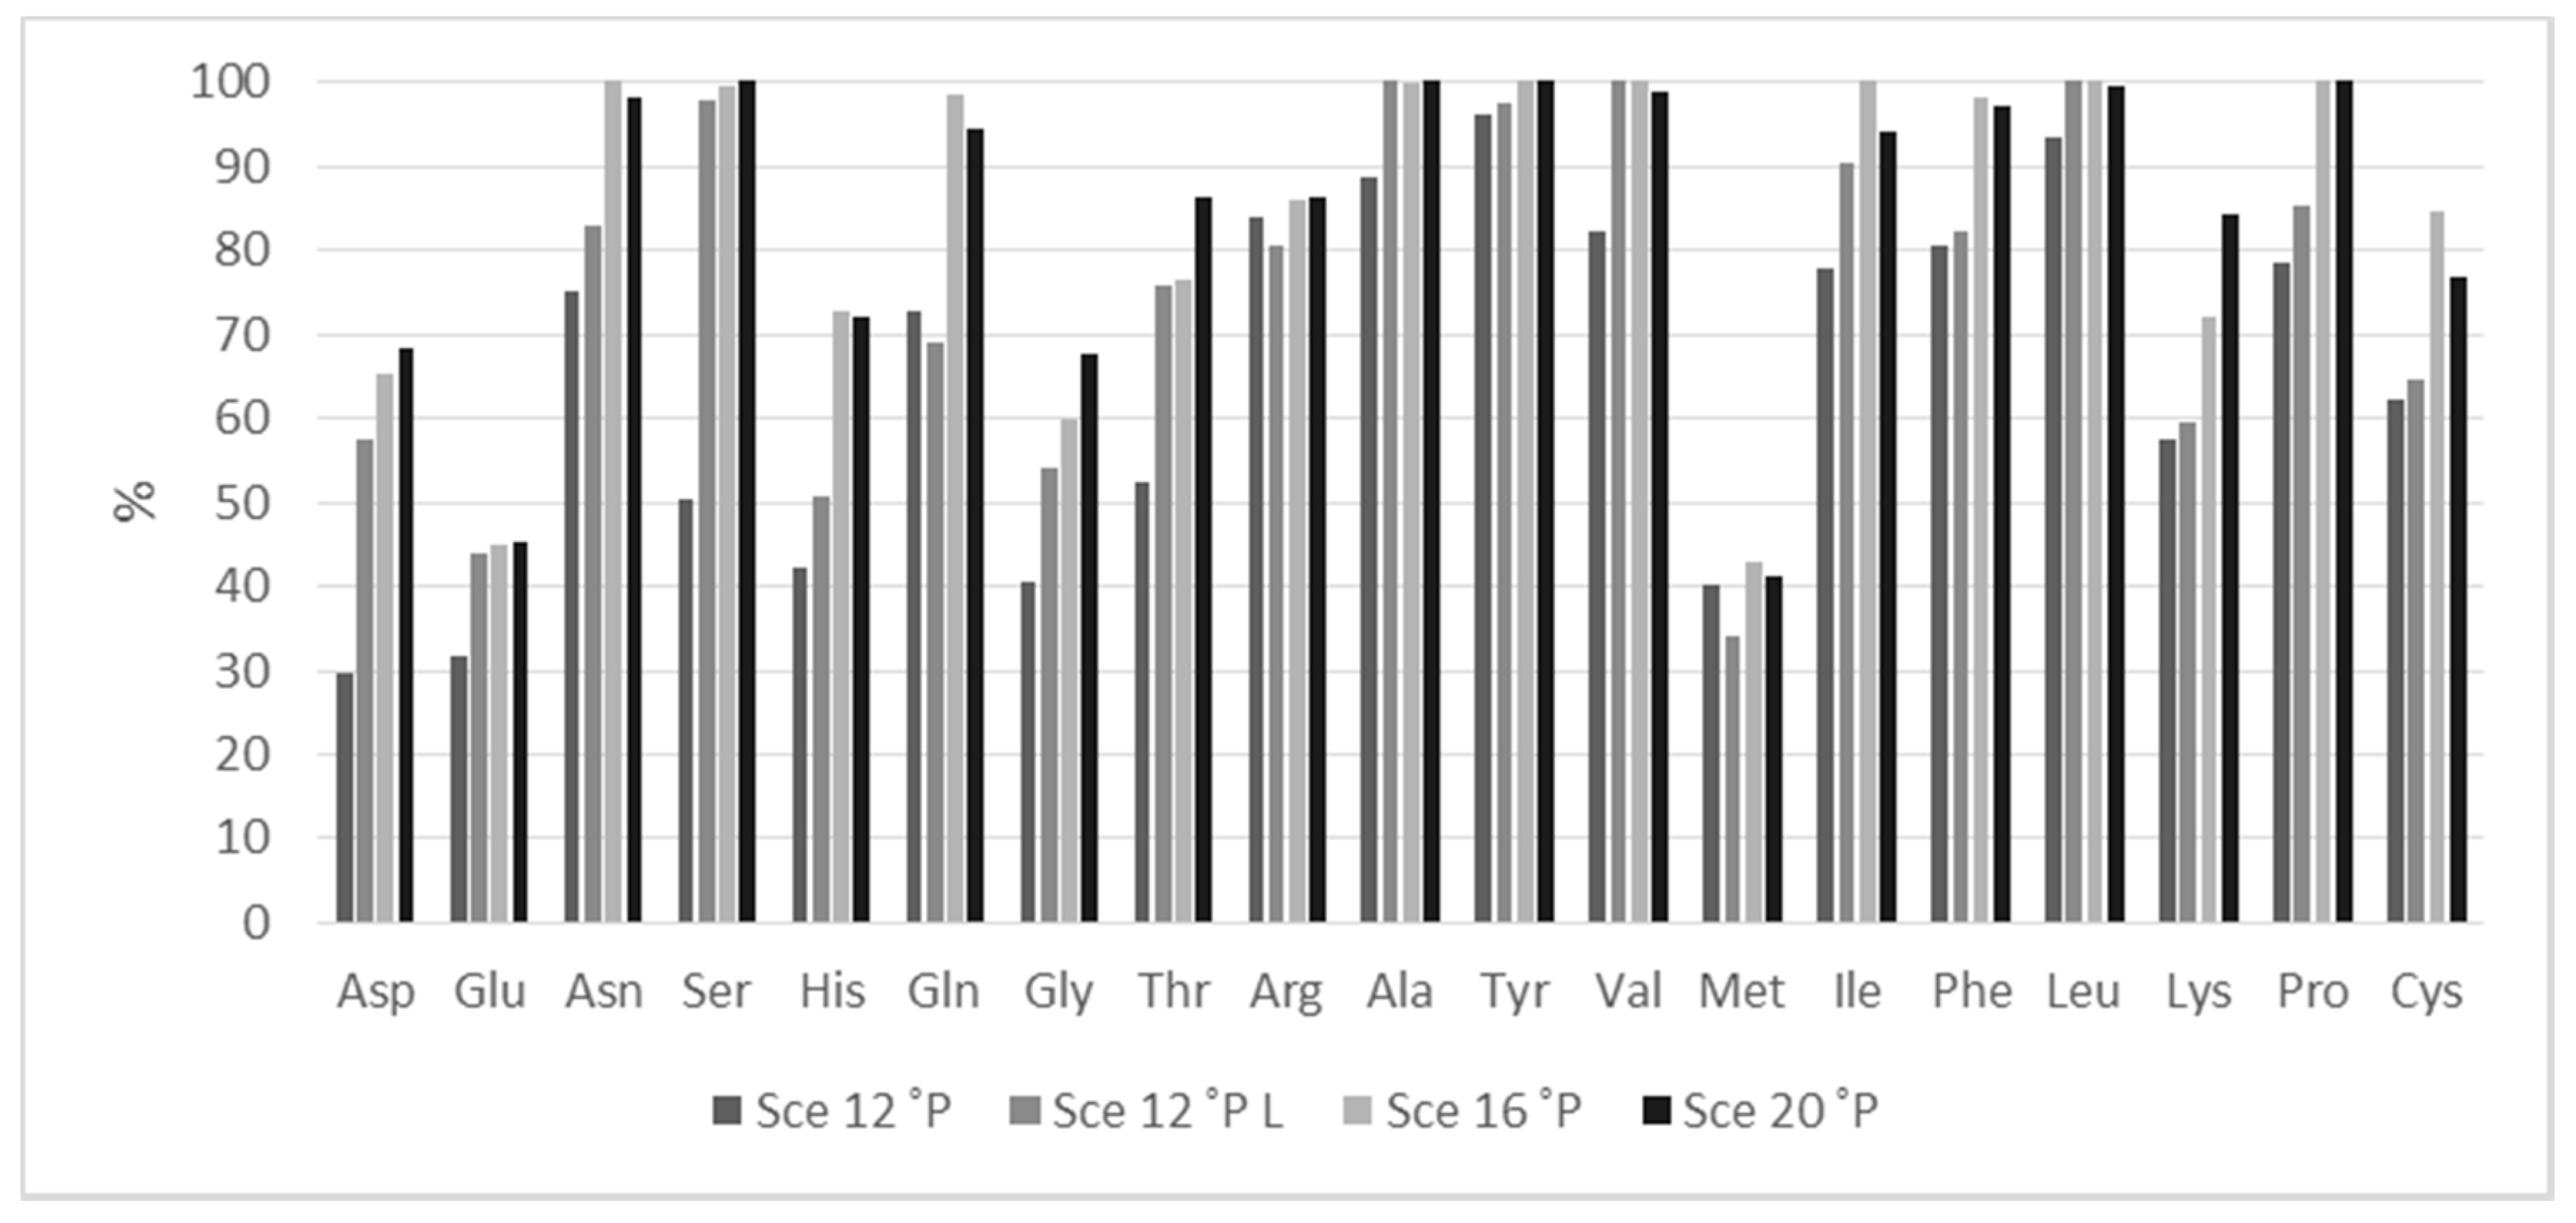
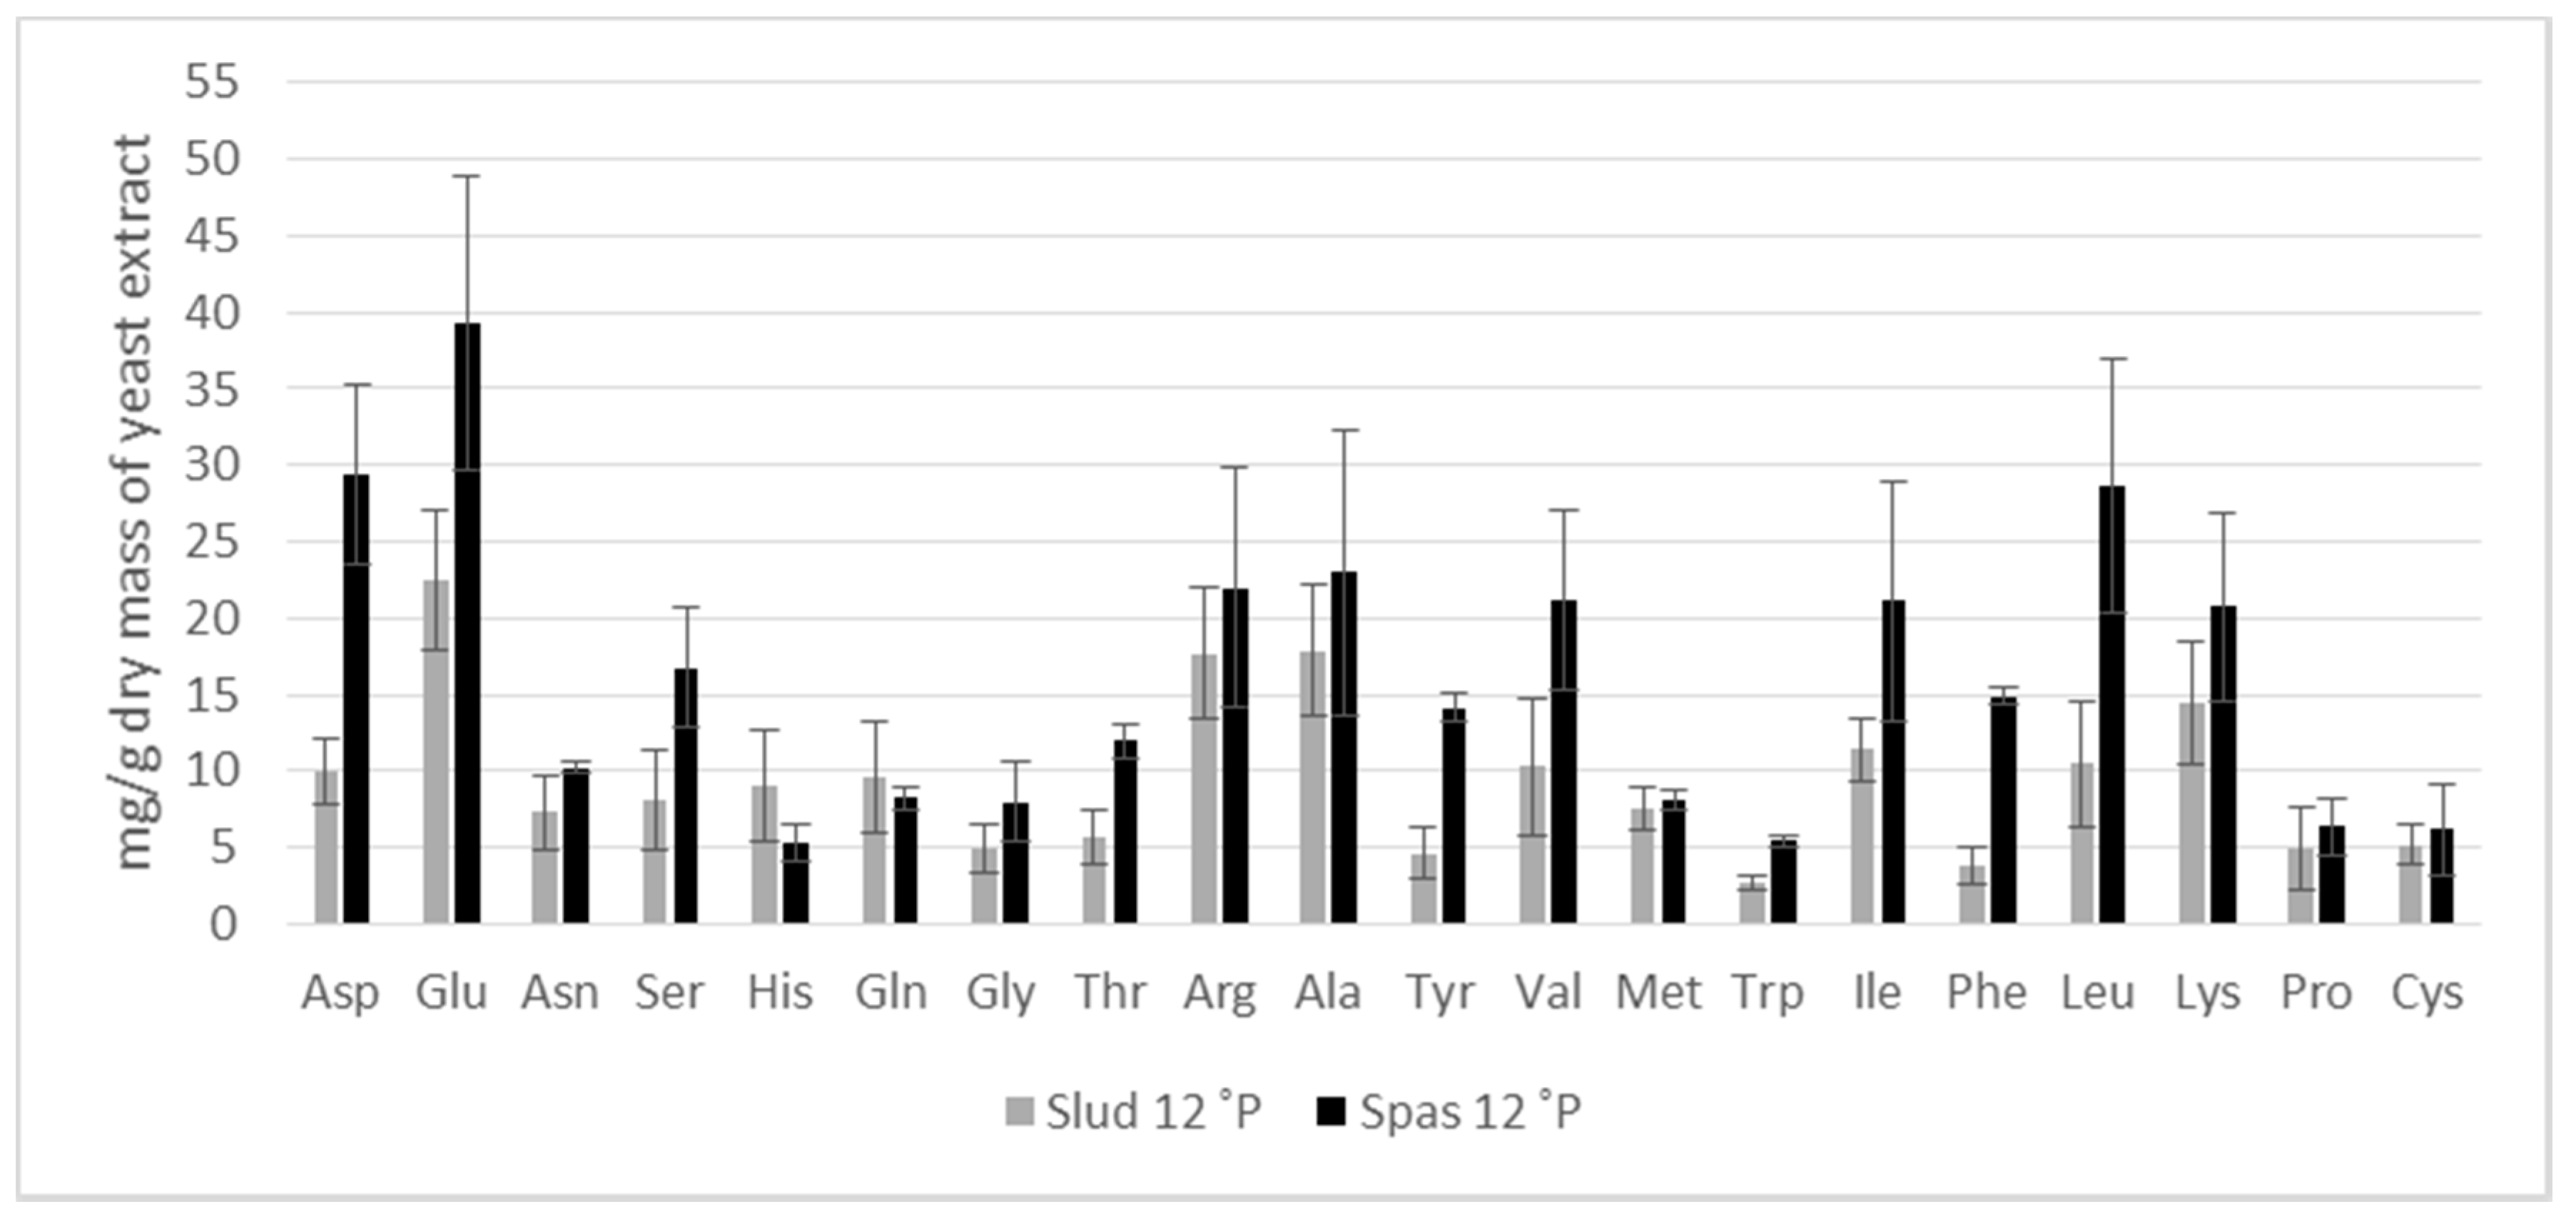
3.2. Amino Acid Composition

From a physiological point of view, the proteinogenic material composition is crucial. The essential amino acids (His, Thr, Val, Met, Ile, Phe, Leu Lys) are indispensable for human nutrition as these cannot be synthesized by the body and must be absorbed via food [36]. The rapid usability of proteinogenic material in microbiological culture media is especially assured for yeasts if this material is present in the form of free amino acids, i.e. individual amino acids are not linked via peptide bonds [13]. This ensures the amino acids can be transported via various mechanisms through the cell wall and cell membrane and then to be metabolized [13]. Specific amino acids are preferentially absorbed by the cell [13]. In addition, individual amino acids can significantly affect the aroma metabolism of a yeast and thereby influence the overall aroma of a fermentation by-product [14]. In a previous study, we showed how different cell disruption methods impacted the amino acid composition and the proteinogenic material [5]. Following an autolytic process, the content of free amino acids in the yeast extract was significantly higher than that produced via mechanical disruption methods due to enzymatic degradation processes [5]. This was also confirmed in the trials presented here, as revealed by the comparison between mechanical (Figure 1) and autolytic (Figure 2) methods for the relevant trial series (t-test p-value < 0.05).
However, the aim of this work was to evaluate the influence of the starting material on the amino acid composition of the yeast extract according to the two disruption methods. It was shown that producing the yeast extract via sonotrode (Figure 1) generated significant differences (ANOVA p-value < 0.05) in the content of free amino acids in the yeast extract when using spent yeast from fermentation processes with different gravities (Scer 12 ˚P, Scer 16 ˚P, Scer 20 ˚P). No significant difference was recorded between the Scer 16 ˚P and Scer 20 ˚P test series (t-test p-value > 0.05). Using lagering cellar yeast (Scer 12 ˚P L) also generated a significantly lower content of free amino acids (t-test p-value < 0.05). In the comparison of the test series Scer 12 ˚P, Scer 12 ˚P L, Scer 16 ˚P, Scer 20 ˚P, it was also apparent that lower total quantities of all amino acids resulted in lower quantities of free amino acids. The content of free amino acids following mechanical disruption was likely to be derived largely from the free amino acid pool in the cell [1,5], which is influenced by the extraction process [37]. Amino acids that were enzymatically released from the protein (despite a constant process temperature of 7 °C), were also present in the mechanically produced yeast extract as already evidenced in a previous paper [5]. The content of free amino acids in the yeast extract of yeast strains Scer 12 ˚P, Spas 12 ˚P, Slud 12 ˚P, Sfib 12 ˚P, Bbru 12 ˚P and Tdel 12 ˚P were significantly different (ANOVA p-value < 0.05 (Figure 1). There was no correlation between the total quantity of all amino acids (or bound amino acids) and the free amino acids in the yeast extract.
Significant differences were established for the test series Scer 12 ˚P and Scer 12 ˚P L (t-test p-value < 0.05) or Scer 12 ˚P, Scer 16 ˚P and Scer 20 ˚P (ANOVA p-value < 0.05) and no difference between Scer 16 ˚P and Scer 20 ˚P (t-test p-value > 0.05) following the autolytic process (Figure 2). When comparing the test series Scer 12 ˚P, Scer 12 ˚P L, Scer 16 ˚P, Scer 20 ˚P, it was also shown that the lower the total quantity of all amino acids, the higher the quantity of free amino acids. This indicated that the higher gravity in the fermentation process or due to the longer lagering period the spent yeast obtained during the autolytic yeast extract production process had a greater hydrolytic potential. The increased release of amino acids from the cell protein during the autolytic process was presumably attributed to a higher quantity of various proteinases in the yeast cells. An increased amount of proteinases in the fermentation medium was therefore reported for high-gravity fermentations, which is caused by excretion from the living yeast cell as well as by cell autolysis [38,39]. Fukal et al. also reported that yeast proteinases have high thermostability at a temperature of 50 ˚C [40], which corresponds to the autolysis process temperature selected in this study. It could also be evidenced that low yeast vitality is associated with greater proteinase excretion [38]. Yeast vitality at the end of lagering also drops substantially with beer production, whereby proteinase is released [38]. This could explain the increased proteolytic activity of the lagering cellar yeast during autolytic yeast extract production. Consequently, adding spent yeast from high-gravity fermentations and using lagering cellar yeast results in a higher amount of free amino acids in the yeast extract. From Figure 3 it is obvious that individual amino acids in the relevant test series (Scer 12 ˚P, Scer 12 ˚P L, Scer 16 ˚P, Scer 20 ˚P) are also released from the protein in different percentages. This means that not only the total quantity of free amino acids differed between the individual test series, but also the spectrum of individual free amino acids in the yeast extract. Yeast cells contain a variety of different proteolytic enzymes [41,42], which are likely to be present and active in different quantities in the respective test series. The range of individual free amino acids in the yeast extract therefore depends not only on the production method, as already shown [5], but also on the original wort content and the lagering period of the beer, from which the spent yeast originates. For the different yeast strains Scer 12 ˚P, Spas 12 ˚P, Slud 12 ˚P, Sfib 12 ˚P, Bbru 12 ˚P and Tdel 12 ˚P, we could show a significant difference (ANOVA p-value < 0.05) in the content of free amino acids in the autolytically produced yeast extracts (Figure 2). However, there was no correlation between the total quantity of amino acids and the free amino acids. The yeast extracts from spent yeast of non-Saccharomyces yeast contained a maximum of 200 mg free amino acids per g yeast extract. In contrast, the two commercially used yeast strains Scer 12 ˚P and Spas 12 ˚P provided 340 mg/g. Berlowska et al. determined 449.7 mg free amino acids per g yeast extract for a S. cerevisiae yeast strain [22]. For the analyzed non-Saccharomyces yeast species K. marxianus, S. stipitis and P. angusta, a free amino acid content was ranging of between 101.4 mg and 405.3 mg per g yeast extract [22]. It is not possible to directly compare these results with the current study due to the different production process and fermentation conditions. In the exemplary comparison, Figure 4 presents the detailed spectrum of free amino acids of yeast extracts, produced from spent yeast of the commercial yeast strain Spas 12 ˚P and the alternative non-Saccharomyces yeast strain Slud 12 ˚P. Significant differences (t-test p-value < 0.05) were found for the amino acids Asp, Glu, Asn, Ser, Gly, Thr, Tyr, Val, Trp, Ile, Phe and Leu. The amount of all individual amino acids (total, free) of conducted experiments can be found in Figures S1–S4 of the supplementary materials.
The proteinogenic amino acid composition of the yeast extract depends on the production method [5] and, as shown above, on the starting yeast. If hygiene standards are not maintained when producing beer and storing yeast, the starting yeast could potentially be contaminated with microorganisms. The most common beer-spoilage organism in early stages of the beer production process is the species Lactobacillus brevis [43]. The ability of this bacteria species to convert glutamic acid into the nutritionally valuable γ-aminobutyric acid (GABA) has been proven [44]. Masuda et al. demonstrated that this reaction also proceeds during the autolysis of different yeast strains [24]. An intrinsic enzymatic mechanism with the enzyme glutamate decarboxylase is responsible for this reaction [24]. An excess of glutamic acid as a substrate and glucose as an energy supplier can increase GABA formation [24]. In a previous study we could establish an increased GABA concentration in the yeast extract for the strain S. cerevisiae TUM 68 [5] and also presumed this was caused by the mechanism postulated by Masuda et al. [24]. As all other yeast strains in this study had lower GABA concentrations (see supplementary material) in their autolytically produced yeast extracts than S. cerevisiae TUM 68 (Scer 12 ˚P, 50 ˚C), we attempted to further increase GABA formation for the autolysis of S. cerevisiae TUM 68 (Scer 12 ˚P + Gluc + Glu, 37 ˚C), using the same process parameters as Masuda et al. At the same time, we investigated whether contamination of the yeast with L. brevis (Scer 12 ˚P + L, 50 ˚C) also produced an elevated GABA concentration in the autolytically produced yeast extract, or altered the proteinogenic amino acid composition. However, contamination with L. brevis (Scer 12 ˚P + L, 50 ˚C) influenced neither the proteinogenic amino acid spectrum of the yeast extract, nor did the GABA concentration differ significantly from the control sample (Figure 5) (t-test p-value > 0.05). The results coincided with the data from our previous study [5]. Champagne et al. also reported that they observed no significant influence of bacterial contamination on the extract yield, the total nitrogen, the FAN or the turbidity of an autolytically produced yeast extract [45]. The solvent ethyl acetate presumably inhibited the contaminants, reported by Champagne et al. [45] and in this study. Barrette et al. could therefore show a reduced viability in a bacteria population during autolytic yeast extract production using ethyl acetate [21]. Under the autolysis conditions of Masuda et al., the GABA concentration could be increased in the yeast extract of S. cerevisiae (Figure 5), which suggests an enzymatic mechanism with the enzyme glutamate decarboxylase being active. While the GABA concentration in our yeast extract of S. cerevisiae roughly doubled, Masuda et al. was able to increase the values for various Candida and Pichia strains by more than tenfold [24].

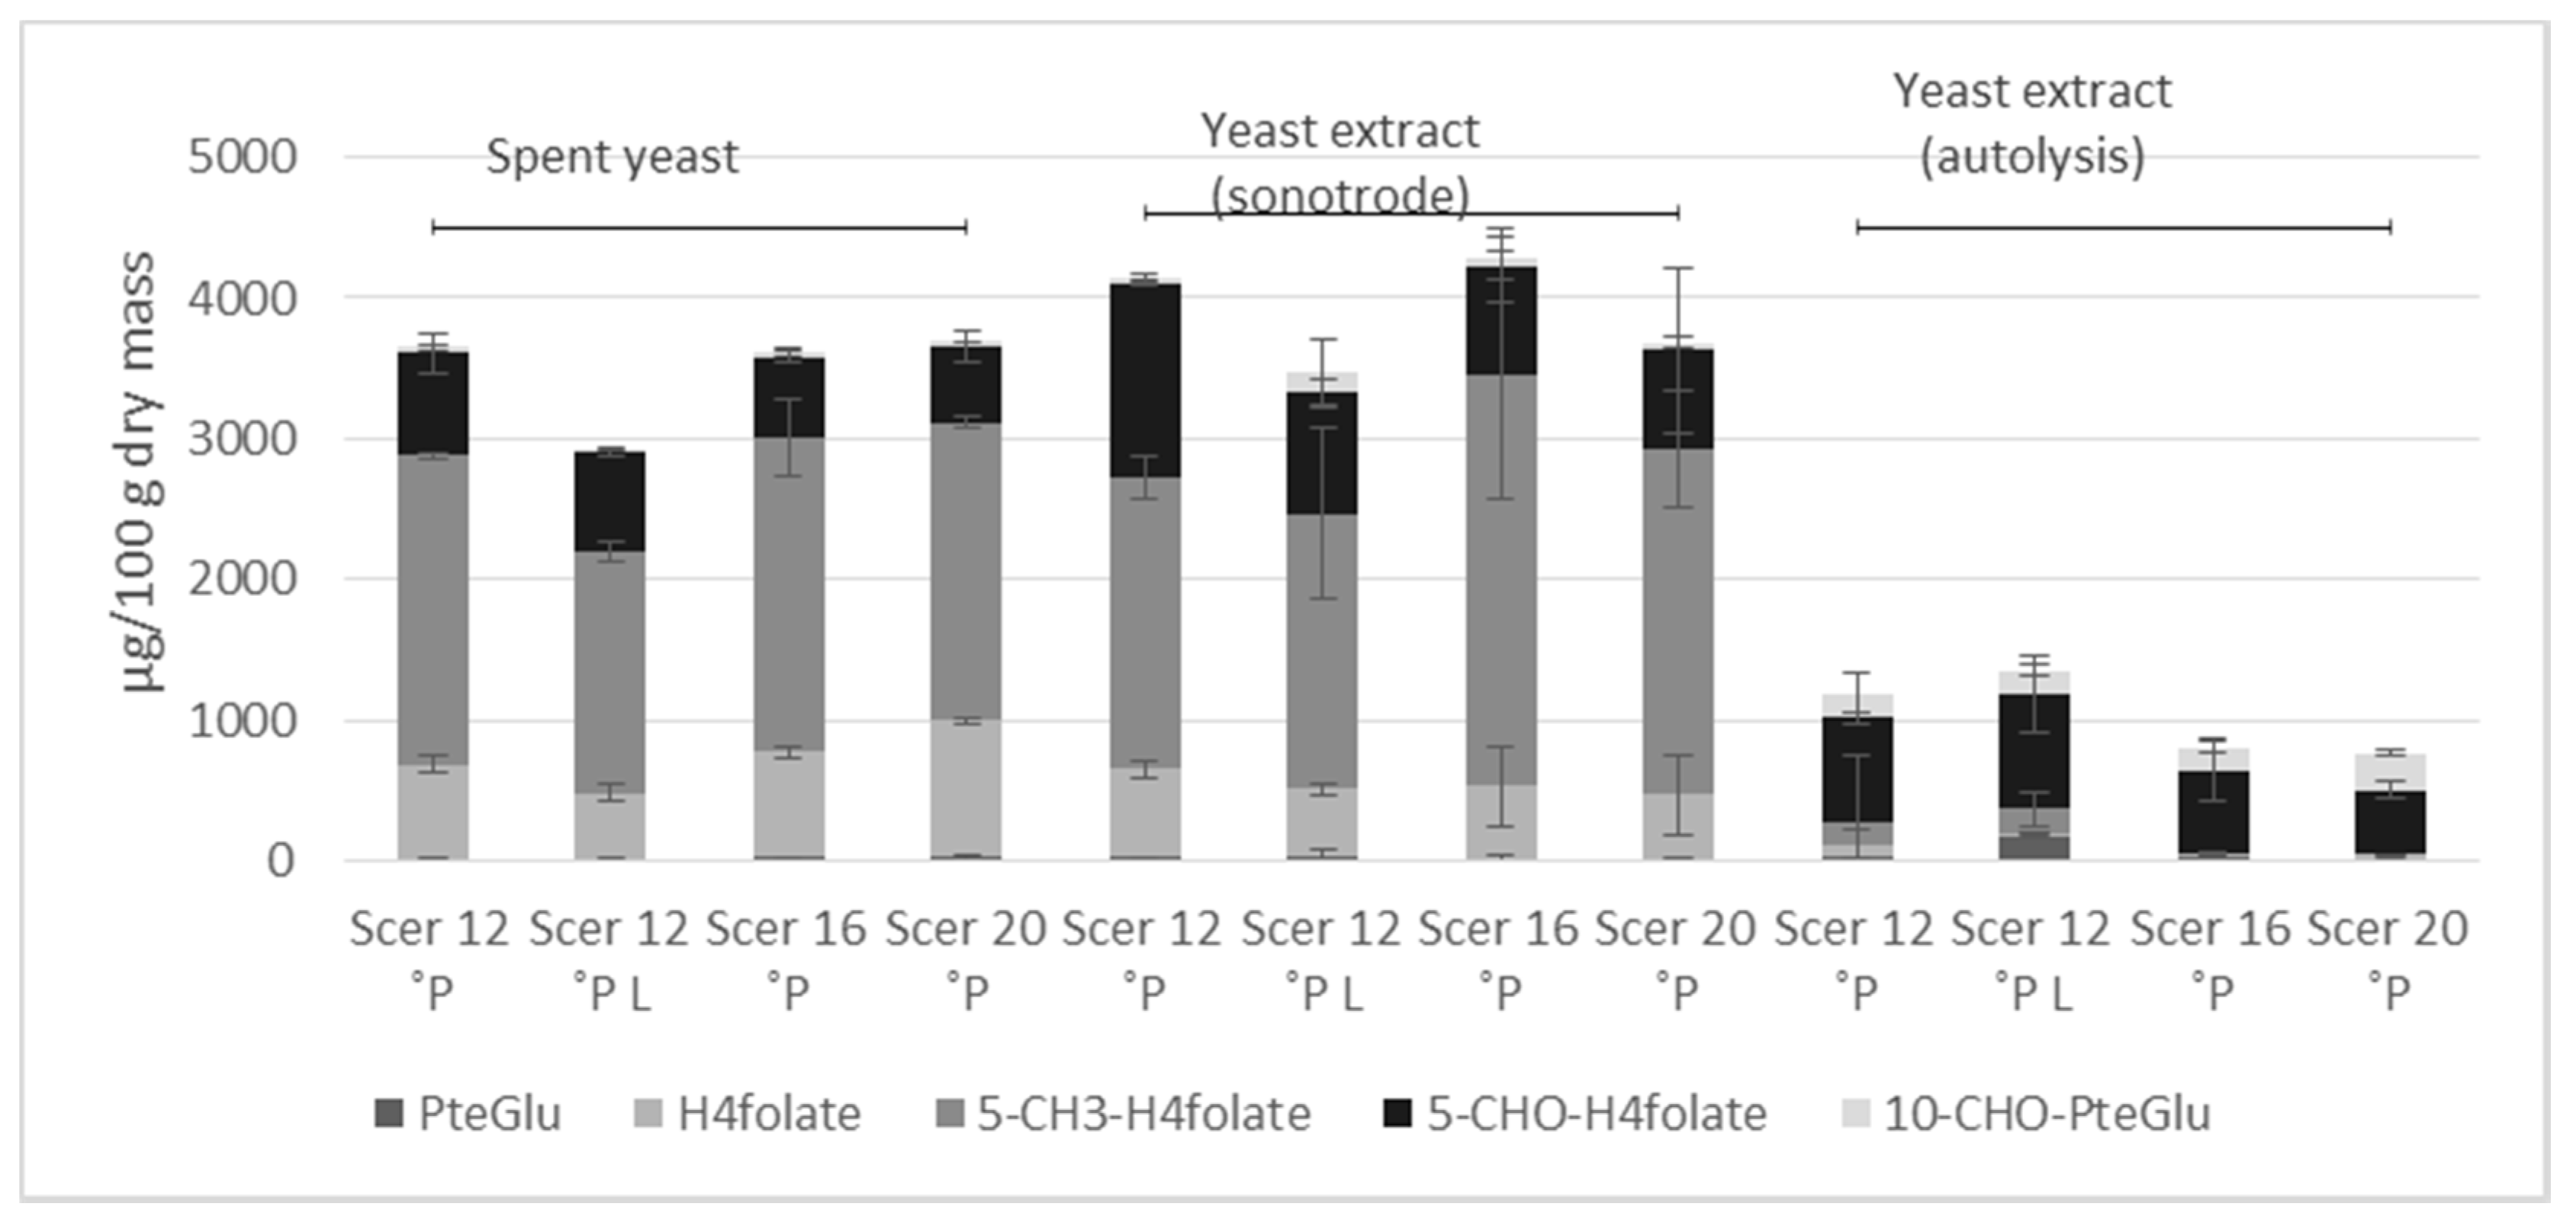
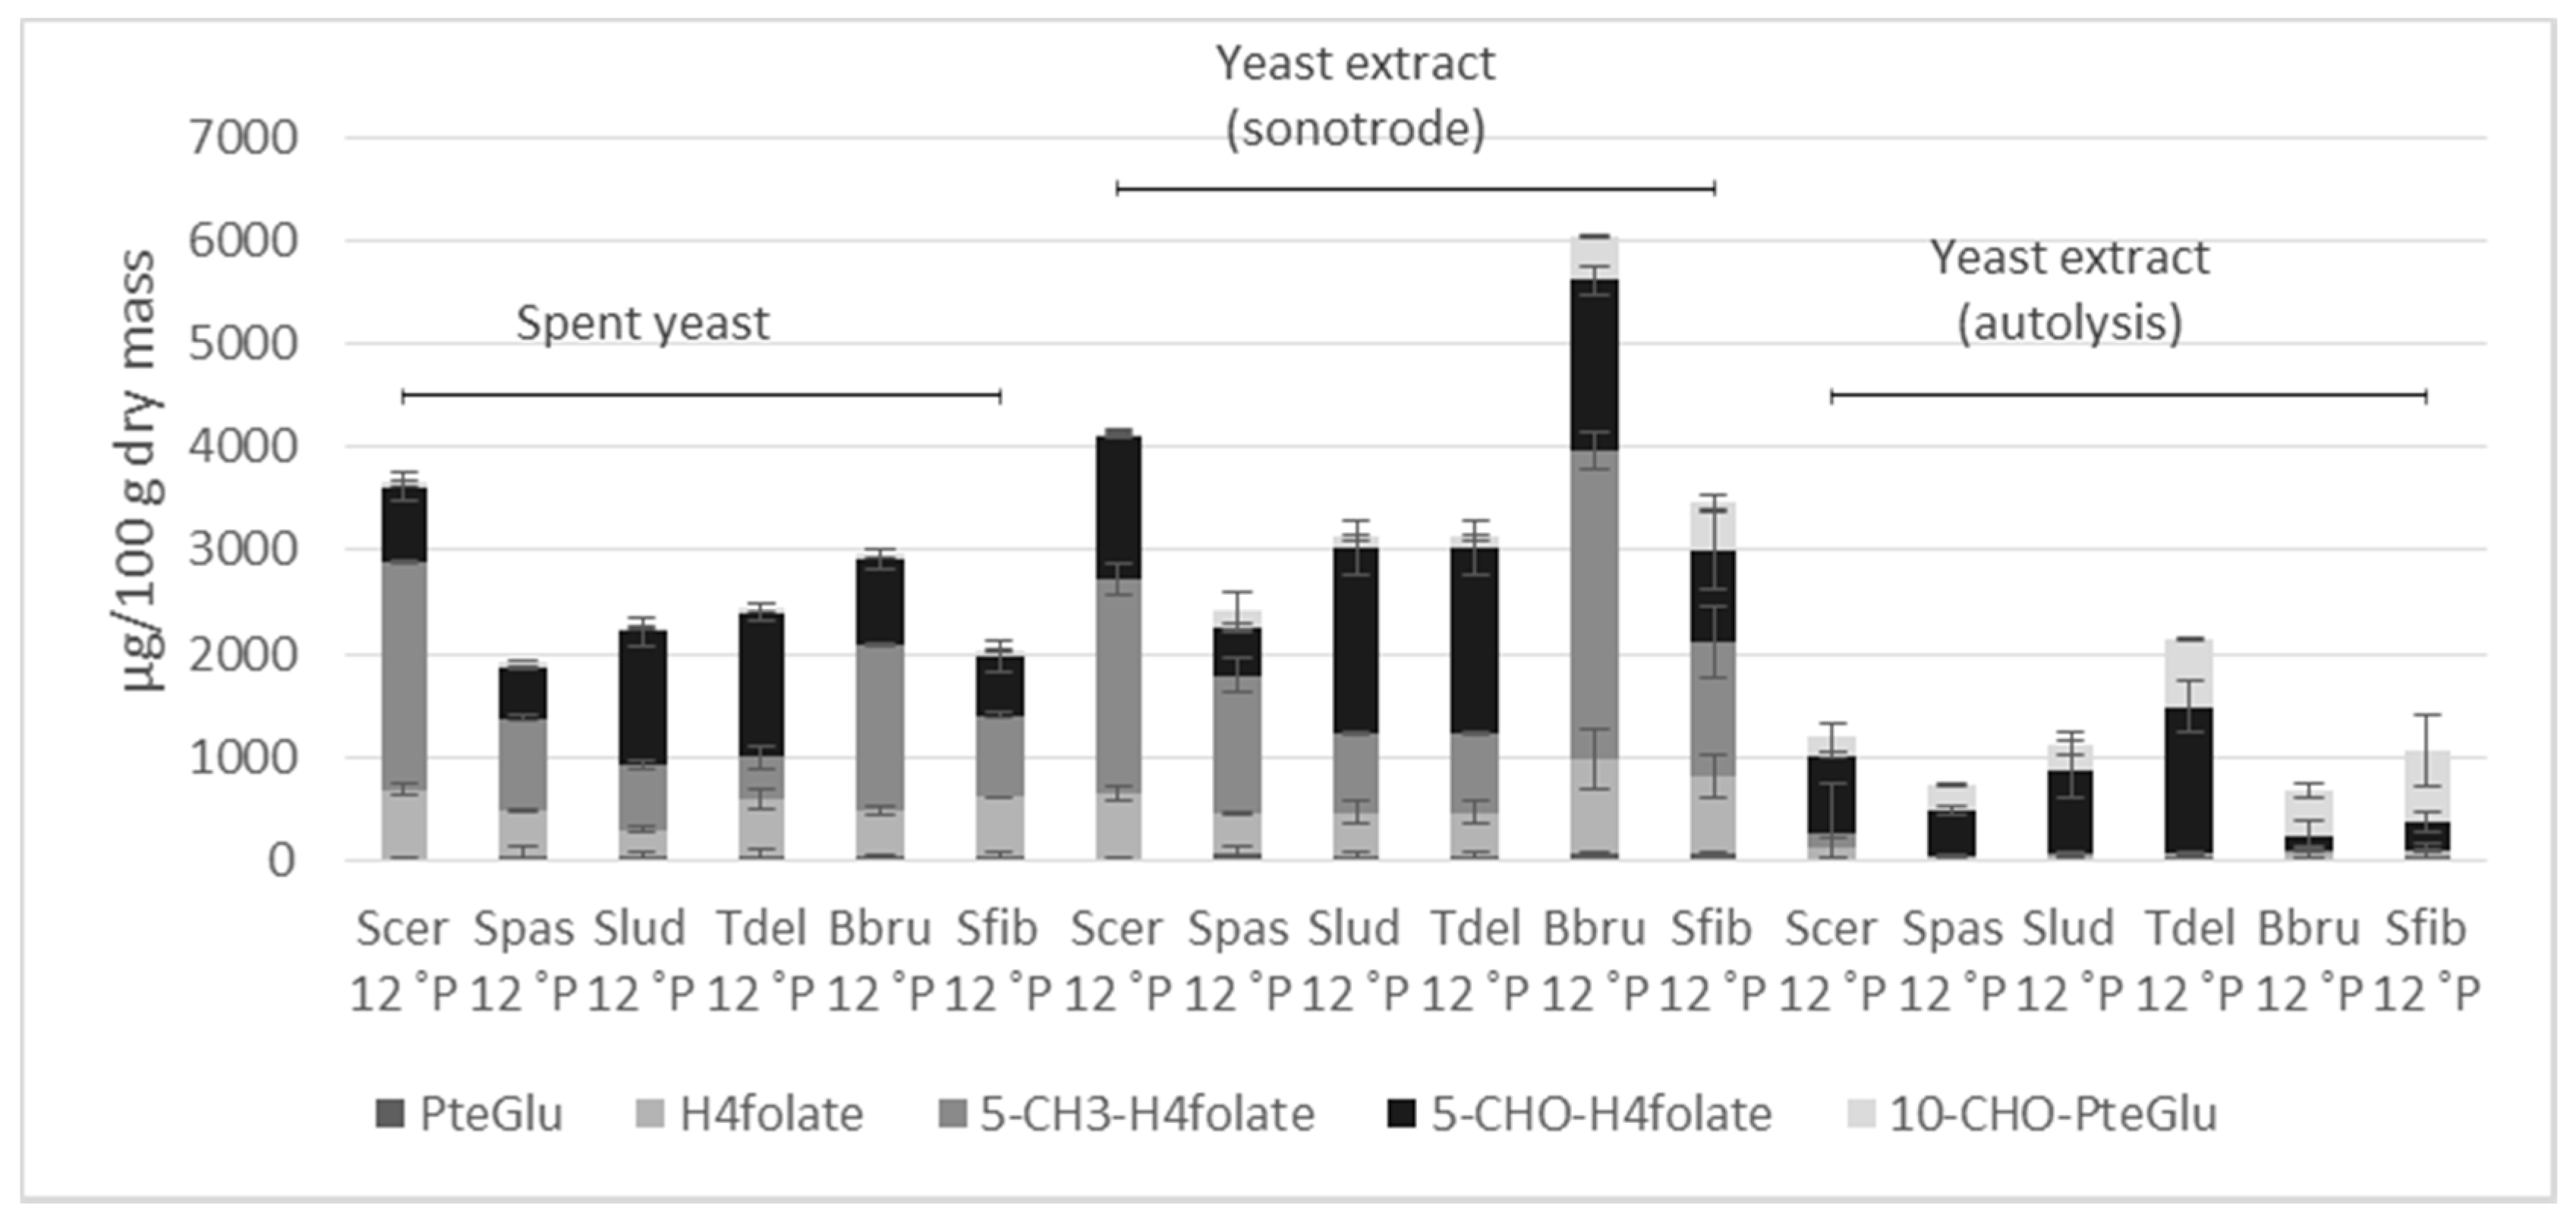
3.3. Folate Vitamer Distribution

Yeasts and yeast extracts are known for their high content of different B vitamins, which include folates (vitamin B9) [6,15]. Folates, especially tetrahydrofolate-(H4folate)-polyglutamates, play an essential role in various metabolic pathways such as amino acid synthesis in mitochondria and DNA replication in the cell nucleus [28]. The human body cannot generate vitamin B9 itself and therefore needs to obtain an adequate supply via diet [28]. In a previous study, we already showed that yeast extracts can be produced with a folate content between 1.35 and 4.94 mg/100 g using a spent yeast (S. cerevisiae TUM 68) from a top-fermenting brewing process [6]. In this context, we presented the influence of different mechanical and autolytic extraction methods on the content of the folate vitamers 5-CH3-H4folate, 5-CHO-H4folate, 10-CHO-PteGlu, H4folate, and PteGlu. Hjortmo et al. evidenced a total folate content in a range of 4000–1,4500 µg/100 g yeast dry matter for various yeast strains, wherein the sample material came from the exponential growth phase of the yeast population and a synthetic culture medium was used [46]. The spent yeast from beer preparation is cropped at the end of the fermentation process or as lagering cellar yeast and as such is already in the stationary phase of yeast cell growth. In this phase, the folate content of the yeast dry mass drops sharply and remains at a lower level than in the exponential growth phase [47]. The material composition of the culture medium also plays a critical role [47].
In order to provide a comprehensive picture of the process, we also established the folate content of the fermented medium and the spent yeast in addition to the autolytically and mechanically produced yeast extract. This showed that all fermented media had a low total folate content (6–17 µg/100 g), calculated from the folate vitamers 5-CH3-H4folate, 5-CHO-H4folate, 10-CHO-PteGlu, H4folate and PteGlu. No significant difference could be determined between the investigated fermented media of any test series (Scer 12 ˚P, Scer 12 ˚P L, Scer 16 ˚P, Scer 20 ˚P, Bbru 12 ˚P, Slud 12 ˚P, Tdel 12 ˚P, Spas 12 ˚P, Sfib 12 ˚P) (ANOVA p-value > 0.05). Hjortmo et al. could not show any folate in the fermented medium of a S. cerevisiae strain [47]. This can be explained by the fact that there were no more yeast cells in the supernatant [47]. In our work, however, the supernatants still contained suspended yeast cells, which were not removed by centrifuging before folate analysis. Regarding the yeast extract, the original wort content (Scer 12 ˚P, Scer 16 ˚P, Scer 20 ˚P) had no significant influence (ANOVA p-value > 0.05) on the total folate content of the spent yeast (Figure 6). High-gravity fermentations generally lead to lower specific yeast growth rates than normal-gravity fermentations [18]. For a continuous yeast culture (chemostat), Hjortmo et al. demonstrated a significant positive correlation between specific growth and the total folate content of a yeast population [47]. This has been evidenced for the exponential growth phase of a yeast population [47]. The primary fermentation yeast is in the stationary phase. In this case, the total folate content of the spent yeasts from the normal and high-gravity fermentations did not differ and presumably settled at around the same level, irrespective of the effect of the different specific growth rates experienced previously. In contrast, the precipitated lagering cellar yeast (Scer 12 ˚P L) had a significantly lower total folate content than that of the primary fermentation yeast (t-test p-value < 0.05). During the cold lagering process, the non-precipitated primary fermentation yeast stays in the stationary phase and precipitates within this period as lagering cellar yeast (12 ˚P L). No more cell division occurs during this period, which presumably caused the constant degradation of the folate vitamers required for amino acid synthesis and DNA replication. The ratio of the individual folate vitamers in the spent yeast (Scer 12 ˚P, Scer 12 ˚P L, Scer 16 ˚P, Scer 20 ˚P) did not change significantly (ANOVA p-value > 0.05). The yeast extracts produced via sonotrode had higher folate contents in each case than the corresponding spent yeasts. Removing the insoluble cell components (mainly cell walls) enriched the folate content. Once again, no significant influence (ANOVA p-value > 0.05) of the original wort content (Scer 12 ˚P, Scer 16 ˚P, Scer 20 ˚P) on the total folate content or the distribution of the individual folate vitamers could be observed. The total folate content of the autolytically produced yeast extracts was between 800 and 1400 µg/100 g and did not differ significantly (ANOVA p-value > 0.05).
In a comparison of the different yeast strains (Figure 7), Scer 12 ˚P with 3640 µg/100 g yeast dry mass had the highest total folate content in the spent yeast. A value of 2970 µg/100 g could be determined for the spent yeast of the yeast strain Bbru 12 ˚P. We established the lowest total folate content (1930 µg/100 g) for the yeast strain Spas 12 ˚P and could determine no significant difference to Sfib 12 ˚P (t-test p-value > 0.05). Between the strains Slud 12 ˚P and Tdel 12 ˚P there was also no significant difference in the total folate content of the spent yeast (t-test p-value > 0.05) (Figure 7). The quantity of the physiologically valuable folate vitamer 5-CH3-H4folate varied in the spent yeast of all the investigated yeast strains (ANOVA p-value < 0.05). It was also observed that the ratio of 5-CH3-H4folate to the other folate vitamers, 5-CHO-H4folate, 10-CHO-PteGlu, H4folate and PteGlu, differed significantly in the spent yeast of the particular yeast strains (ANOVA p-value < 0.05) (Figure 7). At 2200 µg/100 g the proportion of 5-CH3-H4folate was approximately 60% of the total folate content of the spent yeast Scer 12 ˚P, whereas this was only around 20% for Tdel 12 ˚P. The total folate content of the yeast extracts (sonotrode) from the spent yeasts Scer 12 ˚P, Bbru 12 ˚P and Spas 12 ˚P differed significantly from the other mechanically produced yeast extracts (t-test p-value < 0.05). The yeast extracts Slud 12 ˚P, Tdel 12 ˚P and Sfib 12 ˚P, however, did not differ significantly (t-test p-value > 0.05). The high total folate content (6000 µg/100 g) of the yeast extract from the spent yeast Bbru 12 ˚P was striking with regard to the total folate content of the corresponding spent yeast (2970 µg/100 g). The proportion of the physiologically valuable folate vitamers 5-CH3-H4folate of the total folate constant was also not constant in the mechanically produced yeast extracts. The total folate content of the autolytically produced yeast extracts in Figure 7 was between 800 and 2100 µg/100 g. Only the Tdel 12 ˚P yeast extract differed significantly (t-test p-value < 0.05) from the others. The influence of the different production methods (autolysis, sonotrode) on the total folate content and the folate vitamer distribution has already been discussed in our previous work [6].

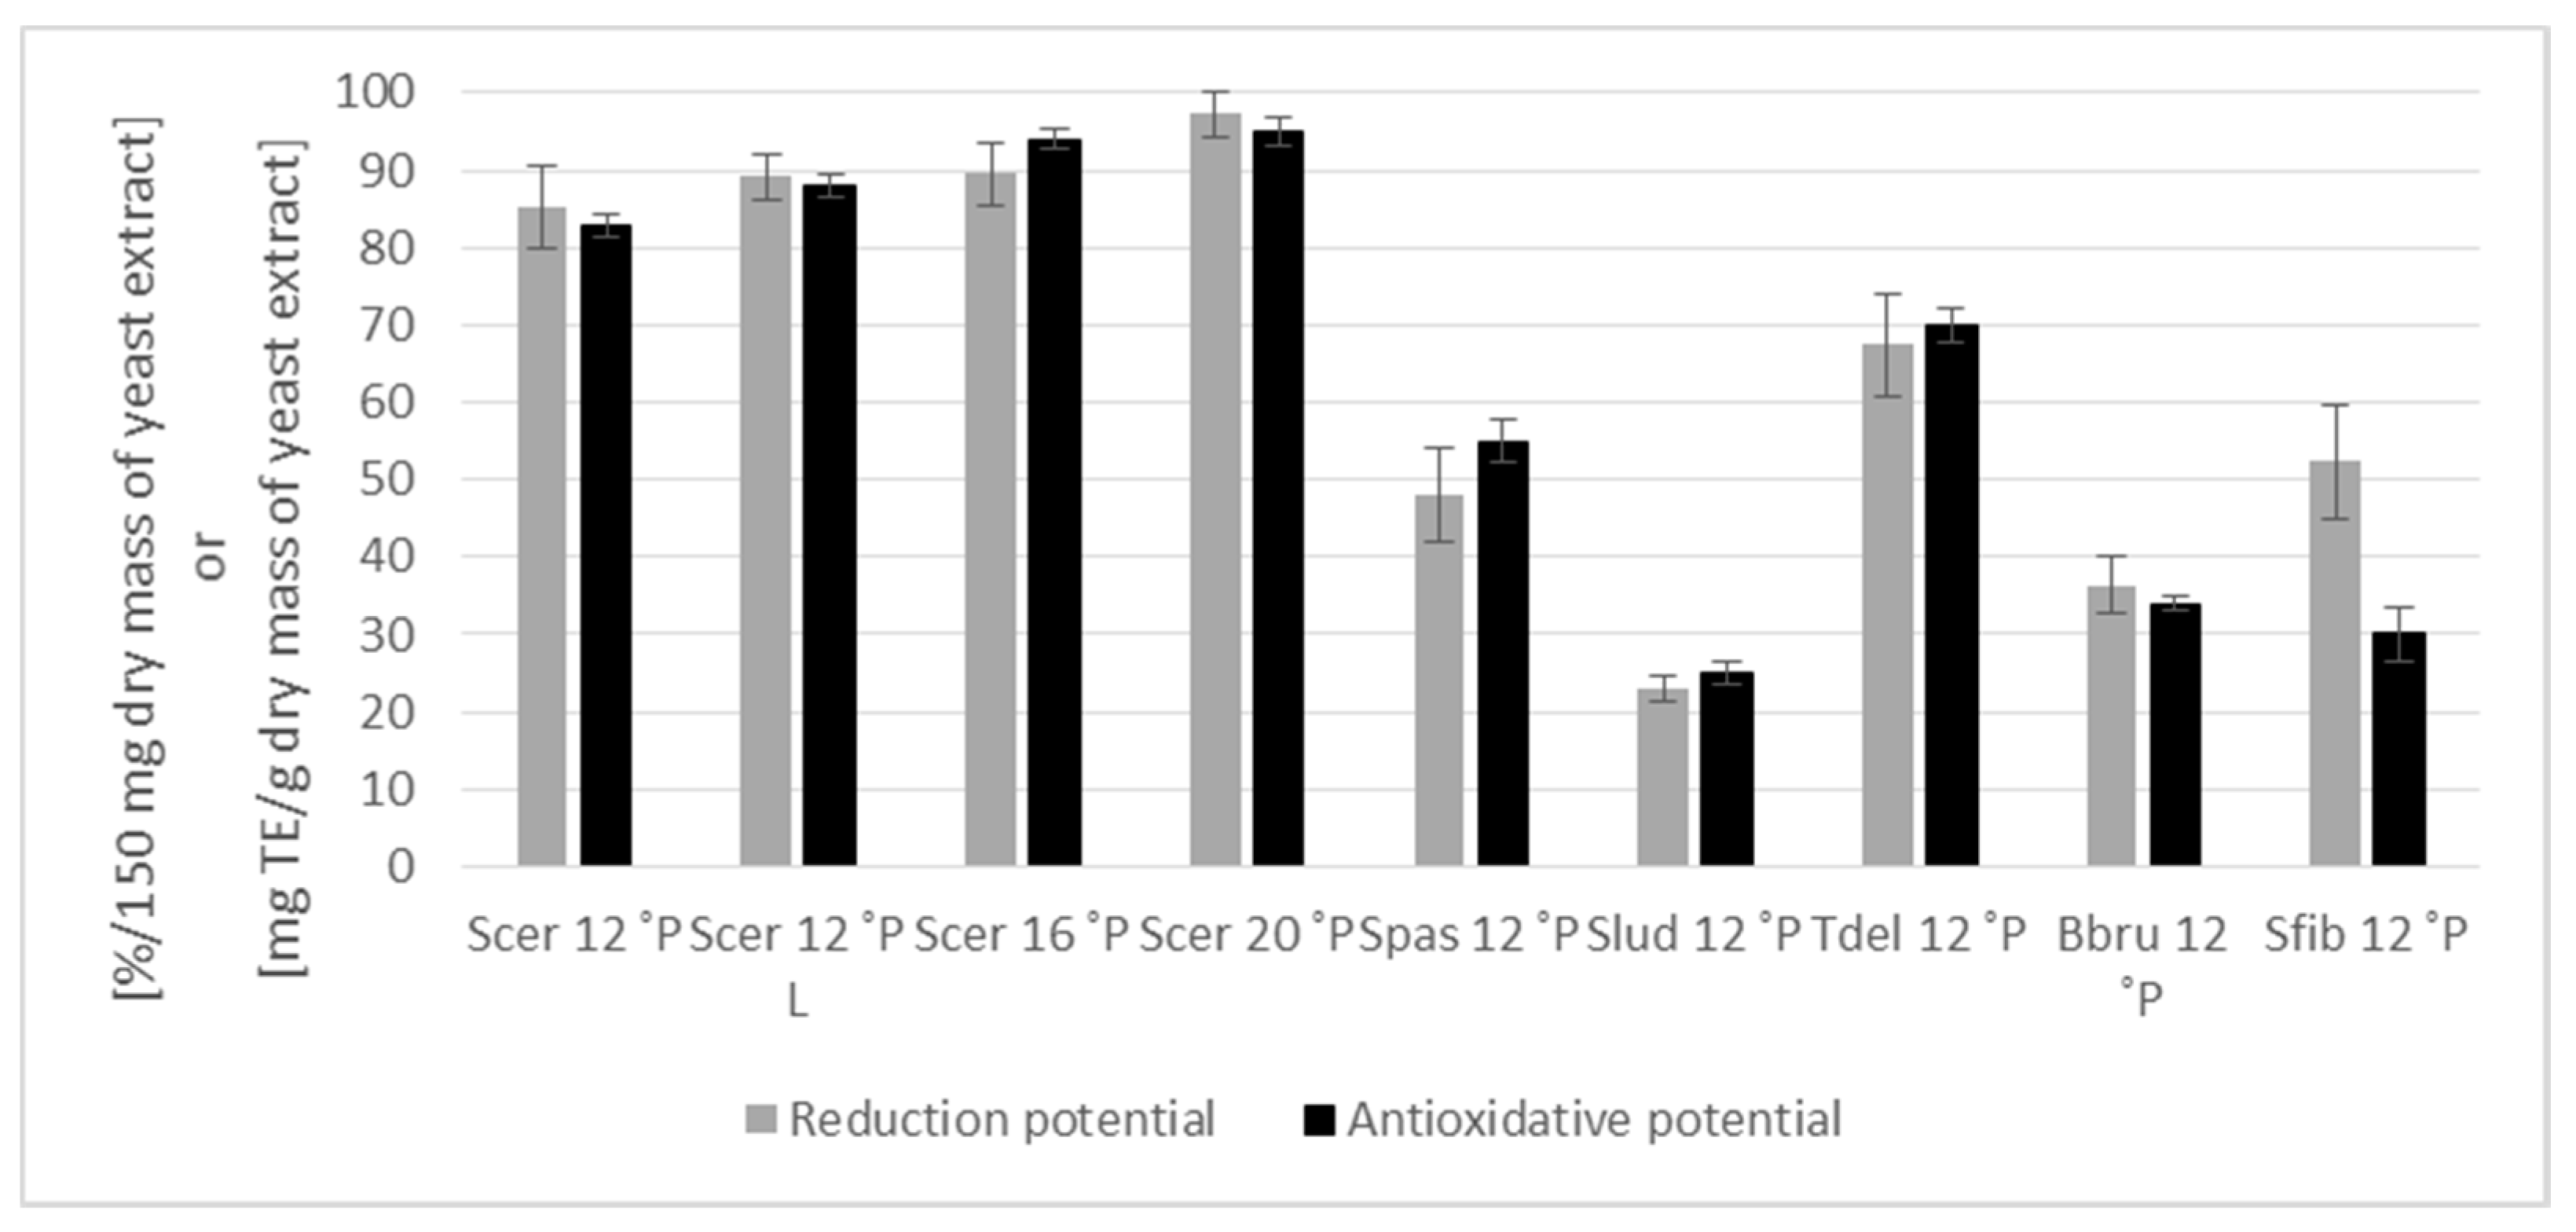
3.4. Biological Activity

Yeast cells have a wide range of different functional components, which impart bioactive properties to a yeast extract once extracted from the cell. These include peptides, amino acids, flavonoids, polyphenols and carotenoids [15,34,48]. Through autolysis, Vieira et al. increased the anti-oxidative potential of a mechanically produced yeast extract due to the release of phenolic components and amino acids [49]. When the thermal load is too high, the anti-oxidative potential drops, which, according to Vieira et al., is likely attributed to the breakdown of phenolic components, vitamins and bioactive peptides [49]. We evidenced this correlation in an earlier work as follows. We observed a significant drop in concentration of the bioactive peptide glutathione or the total polyphenol content following an autolytic yeast extract production method exposed to thermal stress compared with a mechanical process at an appropriate thermal load [6]. The process parameters of the two yeast extract production methods from our previous study [6] corresponded to those in these trials. Since the yeast extract of the autolytic process exhibited low bioactivity in the previous study, we only investigated the reductive and anti-oxidative potential of the mechanically produced yeast extract in this work (Figure 8). We found no significant difference in the reduction potential of the test series Scer 12 ˚P and Scer 12 ˚P L (t-test p-value > 0.05). There was a significant difference between Scer 12 °P, Scer 16 °P and Scer 20 °P (ANOVA p-value < 0.05), but with no significant difference between Scer 12 °P and Scer 16 °P (t-test p-value > 0.05). The results were similar for the anti-oxidative potential, with no significant difference between Scer 16 °P and Scer 20 °P. The biological activity of the yeast extracts of different yeast strains varied considerably, with (Scer 12 ˚P) having the highest values, followed by Tdel 12 ˚P and Spas 12 ˚P. Significant differences (ANOVA p-value < 0.05) could be established for all the investigated yeast strains in relation to the reductive and anti-oxidative potential. Only the reduction potential of Spas 12 ˚P and Sfib 12 ˚P were not significantly different (t-test p-value > 0.05). A wide range of different components such as peptides, vitamins, phenolic components and enzymes were responsible for the biological activity [6,15,49].

4. Conclusions

This study showed that the biodiversity of spent yeast from the brewing process means that it can substantially influence the composition of physiologically important ingredients in the resulting yeast extract. The yeast strain (commercial Saccharomyces and alternative non-Saccharomyces yeast strains), the original wort content of the fermentation medium and the spent yeast cropping time, have a direct impact on different components of the yeast extract. The general nutrient composition (protein, fat and ash content) of the yeast extracts displayed significant differences after using various spent yeasts. We have evidenced in detail that the release of proteinogenic amino acids during autolysis of the spent yeasts differed greatly and thereby influenced the yeast extracts’ FAN. The respective proteinogenic amino acid spectrum also varied. Contamination of the spent yeast with the beer spoiler L. brevis had no impact on the amino acid profile of the yeast extracts. Using relevant autolytic process conditions made it possible to increase the GABA concentration in the yeast extract of S. cerevisiae TUM 68, however a commercial use in this context is doubtful. It was possible to influence both the total folate content and the proportion of individual folate vitamers by using different yeast strains. Lagering cellar yeast as a starting material to produce yeast extract resulted in lower total folate contents in the yeast extract than primary fermentation yeast. The original wort content of the fermentation medium had no significant influence on the total folate of the spent yeast or the yeast extract. The biological activity (reduction and antioxidative potential) of the yeast extracts also depended on which spent yeast was used from the brewing process. The top-fermenting yeast strain S. cerevisiae TUM 68 gave particularly high values. In conclusion, the results indicate that brewer’s spent yeast should be carefully selected to produce a yeast extract with a defined nutritional composition. A further research objective would be to adapt the autolytic or mechanical production process for brewer’s spent yeast to influence the content of physiologically important ingredients in a yeast extract.

Supplementary Materials

The following are available online at https://www.mdpi.com/2311-5637/5/2/51/s1.

Author Contributions

F.F.J. designed and performed the experiments, analyzed the data and wrote the paper; L.S. and M.R. contributed reagents/materials/method/analysis tools for folate analysis and supported the practical implementation. M.H. selected/provided yeast and bacteria strains and isolated some of the strains in previous studies. M.R., M.H. and F.-J.M. revised the conception and manuscript, and agreed for submission.

Funding

This research received no external funding.

Acknowledgments

The authors thank Martin Neumeier (Technische Universität München–Lehrstuhl für Analytische Lebensmittelchemie, Freising, Germany) and Steffen Pfeil (Technische Universität München–Forschungszentrum Weihenstephan für Brau- und Lebensmittelqualität, Freising, Germany) for technical assistance.

Conflicts of Interest

The authors declare no conflict of interest.

References

  1. Annemüller, G.; Manger, H.J.; Lietz, P. The Yeast in the Brewery, 1st ed.; VLB Berlin: Berlin, Germany, 2011. [Google Scholar]
  2. Narziss, L.; Back, W. Die Bierbrauerei Band 2: Die Technologie der Würzebereitung; WILEY-VCH Verlag GmbH & Co. KGaA: Weinheim, Germany, 2009. [Google Scholar]
  3. Ferreira, I.M.P.L.V.O.; Pinho, O.; Vieira, E.; Tavarela, J.G. Brewer’s Saccharomyces yeast biomass: Characteristics and potential applications. Trends Food Sci. Technol. 2010, 21, 77–84. [Google Scholar] [CrossRef]
  4. Gibson, B.R. 125th anniversary review: Improvement of higher gravity brewery fermentation via wort enrichment and supplementation. J. Inst. Brew. 2011, 117, 268–284. [Google Scholar] [CrossRef]
  5. Jacob, F.F.; Hutzler, M.; Methner, F.-J. Comparison of various industrially applicable disruption methods to produce yeast extract using spent yeast from top-fermenting beer production: Influence on amino acid and protein content. Eur. Food Res. Technol. 2019, 245, 95–109. [Google Scholar] [CrossRef]
  6. Jacob, F.F.; Striegel, L.; Rychlik, M.; Hutzler, M.; Methner, F.J. Yeast extract production using spent yeast from beer manufacture: Influence of industrially applicable disruption methods on selected substance groups with biotechnological relevance. Eur. Food Res. Technol. 2019, 245, 1169–1182. [Google Scholar] [CrossRef]
  7. Podpora, B.; Świderski, F.; Sadowska, A.; Piotrowska, A.; Rakowska, R. Spent brewer’s yeast autolysates as a new and valuable component of functional food and dietary supplements. J. Food Process. Technol. 2015, 6, 1. [Google Scholar]
  8. Le Van, V.M.; Strehaiano, P.; Nguyen, D.L.; Taillandier, P. Microbial protease or yeast extract—Alternative additions for improvement of fermentation performance and quality of beer brewed with a high rice content. J. Am. Soc. Brew. Chem. 2001, 59, 10–16. [Google Scholar]
  9. Casey, G.P.; Magnus, C.A.; Ingledew, W.M. High gravity brewing—nutrient enhanced production of high-concentrations of ethanol by brewing yeast. Biotechnol. Lett. 1983, 5, 429–434. [Google Scholar] [CrossRef]
  10. Casey, G.P.; Magnus, C.A.; Ingledew, W.M. High-gravity brewing—Effects of nutrition on yeast composition, fermentative ability, and alcohol production. Appl. Environ. Microbiol. 1984, 48, 639–646. [Google Scholar]
  11. Van Zandycke, S.M.; Fischborn, T. The impact of yeast nutrients on fermentation performance and beer quality. Tech. Q. Master Brew. Assoc. Am. 2008, 45, 290–293. [Google Scholar] [CrossRef]
  12. Ingledew, W.M.; Sosulski, F.W.; Magnus, C.A. An assessment of yeast foods and their utility in brewing and enology. J. Am. Soc. Brew. Chem. 1986, 44, 166–170. [Google Scholar] [CrossRef]
  13. Lei, H.J.; Zheng, L.Y.; Wang, C.X.; Zhao, H.F.; Zhao, M.M. Effects of worts treated with proteases on the assimilation of free amino acids and fermentation performance of lager yeast. Int. J. Food Microbiol. 2013, 161, 76–83. [Google Scholar] [CrossRef]
  14. Procopio, S.; Krause, D.; Hofmann, T.; Becker, T. Significant amino acids in aroma compound profiling during yeast fermentation analyzed by PLS regression. LWT Food Sci. Technol. 2013, 51, 423–432. [Google Scholar] [CrossRef]
  15. Vieira, F.; Carvalho, J.; Pinto, E.; Cunha, S.; Almeida, A.; Ferreira, I. Nutritive value, antioxidant activity and phenolic compounds profile of brewer’s spent yeast extract. J. Food Compos. Anal. 2016, 52, 44–51. [Google Scholar] [CrossRef]
  16. Pentieva, K.; McNulty, H.; Reichert, R.; Ward, M.; Strain, J.J.; McKillop, D.J.; McPartlin, J.M.; Connolly, E.; Molloy, A.; Kramer, K.; et al. The short-term bioavailabilities of 6S-5-methyltetrahydrofolate and folic acid are equivalent in men. J. Nutr. 2004, 134, 580–585. [Google Scholar] [CrossRef] [PubMed]
  17. Jacob, F.F.; Michel, M.; Zarnkow, M.; Hutzler, M.; Methner, F.-J. The complexity of yeast extracts and its consequences on the utility in brewing: A review. BrewingScience 2019, 72, 50–62. [Google Scholar] [CrossRef]
  18. Piddocke, M.P.; Kreisz, S.; Heldt-Hansen, H.P.; Nielsen, K.F.; Olsson, L. Physiological characterization of brewer’s yeast in high-gravity beer fermentations with glucose or maltose syrups as adjuncts. Appl. Microbiol. Biotechnol. 2009, 84, 453–464. [Google Scholar] [CrossRef] [PubMed]
  19. Callejo, M.J.; García Navas, J.J.; Alba, R.; Escott, C.; Loira, I.; González, M.C.; Morata, A. Wort fermentation and beer conditioning with selected non-Saccharomyces yeasts in craft beers. Eur. Food Res. Technol. 2018. [Google Scholar] [CrossRef]
  20. Michel, M.; Meier-Dornberg, T.; Jacob, F.; Methner, F.J.; Wagner, R.S.; Hutzler, M. Review: Pure non-Saccharomyces starter cultures for beer fermentation with a focus on secondary metabolites and practical applications. J. Inst. Brew. 2016, 122, 569–587. [Google Scholar] [CrossRef]
  21. Barrette, J.; Champagne, C.P.; Goulet, J. Development of bacterial contamination during production of yeast extracts. Appl. Environ. Microbiol. 1999, 65, 3261–3263. [Google Scholar]
  22. Berlowska, J.; Dudkiewicz-Kołodziejska, M.; Pawlikowska, E.; Pielech-Przybylska, K.; Balcerek, M.; Czysowska, A.; Kregiel, D. Utilization of post-fermentation yeasts for yeast extract production by autolysis: The effect of yeast strain and saponin from Quillaja saponaria. J. Inst. Brew. 2017, 123, 396–401. [Google Scholar] [CrossRef]
  23. Meier-Dörnberg, T.; Michel, M.; Wagner, R.S.; Jacob, F.; Hutzler, M. Genetic and phenotypic characterization of different top-fermenting Saccharomyces cerevisiae ale yeast isolates. BrewingScience 2017, 70, 9–25. [Google Scholar]
  24. Masuda, K.; Guo, X.F.; Uryu, N.; Hagiwara, T.; Watabe, S. Isolation of marine yeasts collected from the pacific ocean showing a high production of gamma-aminobutyric acid. Biosci. Biotechnol. Biochem. 2008, 72, 3265–3272. [Google Scholar] [CrossRef] [PubMed]
  25. Naumann, C.; Bassler, R.; Seibold, R.; Barth, C. Methodenbuch Band 3, die Chemische Untersuchung von Futtermitteln; VDLUFA-Verlag: Darmstadt, Germany, 1976. [Google Scholar]
  26. Reed, G.; Nagodawithana, T.W. Yeast Technology, 2nd ed.; Van Nostrand Reinhold: New York, NY, USA, 1991. [Google Scholar]
  27. Jacob, F. MEBAK Brautechnische Analysemethoden Würze Bier Biermischgetränke; Selbstverlag der MEBAK: Freising/Weihenstephan, Germany, 2012. [Google Scholar]
  28. Striegel, L.; Chebib, S.; Netzel, M.E.; Rychlik, M. Improved stable isotope dilution assay for dietary folates using LC-MS/MS and its application to strawberries. Front. Chem. 2018, 6, 11. [Google Scholar] [CrossRef] [PubMed]
  29. Caballero-Cordoba, G.M.; Sgarbieri, V.C. Nutritional and toxicological evaluation of yeast (Saccharomyces cerevisiae) biomass and a yeast protein concentrate. J. Sci. Food Agric. 2000, 80, 341–351. [Google Scholar] [CrossRef]
  30. Pratt, P.L.; Bryce, J.H.; Stewart, G.G. The effects of osmotic pressure and ethanol on yeast viability and morphology. J. Inst. Brew. 2003, 109, 218–228. [Google Scholar] [CrossRef]
  31. Casey, G.P.; Chen, E.C.H.; Ingledew, W.M. High-gravity brewing: Production of high levels of ethanol without excessive concentrations of esters and fusel alcohols. J. Am. Soc. Brew. Chem. 1985, 43, 179–182. [Google Scholar] [CrossRef]
  32. Powell, C.D.; Quain, D.E.; Smart, K.A. The impact of brewing yeast cell age on fermentation performance, attenuation and flocculation. FEMS Yeast Res. 2003, 3, 149–157. [Google Scholar] [CrossRef] [Green Version]
  33. Steckley, J.D.; Grieve, D.G.; Macleod, G.K.; Moran, E.T. Brewers-yeast slurry, 1. Composition as affected by length of storage, temperature, and chemical treatment. J. Dairy Sci. 1979, 62, 941–946. [Google Scholar] [CrossRef]
  34. Vieira, E.; Cunha, S.C.; Ferreira, I.M.P.L.V.O. Characterization of a potential bioactive food ingredient from inner cellular content of brewer’s spent yeast. Waste Biomass Valori. 2018, 1–8. [Google Scholar] [CrossRef]
  35. Podpora, B.; Swiderski, F.; Sadowska, A.; Rakowska, R.; Wasiak-Zys, G. Spent brewer’s yeast extracts as a new component of functional food. Czech. J. Food Sci. 2016, 34, 554–563. [Google Scholar] [CrossRef]
  36. Reeds, P.J. Dispensable and indispensable amino acids for humans. J. Nutr. 2000, 130, 1835–1840. [Google Scholar] [CrossRef] [PubMed]
  37. Hans, M.A.; Heinzle, E.; Wittmann, C. Quantification of intracellular amino acids in batch cultures of Saccharomyces cerevisiae. Appl. Microbiol. Biotechnol. 2001, 56, 776–779. [Google Scholar] [CrossRef] [PubMed]
  38. Cooper, D.J.; Stewart, G.G.; Bryce, J.H. Yeast proteolytic activity during high and low gravity wort fermentations and its effect on head retention. J. Inst. Brew. 2000, 106, 197–201. [Google Scholar] [CrossRef]
  39. Ormrod, I.H.L.; Lalor, E.F.; Sharpe, F.R. The release of yeast proteolytic-enzymes into beer. J. Inst. Brew. 1991, 97, 441–443. [Google Scholar] [CrossRef]
  40. Fukal, L.; Kas, J.; Rauch, P. Properties of yeast proteinases. J. Inst. Brew. 1986, 92, 357–359. [Google Scholar] [CrossRef]
  41. Maddox, I.S.; Hough, J.S. Proteolytic enzymes of Saccharomyces carlsbergensis. Biochem. J. 1970, 117, 843–852. [Google Scholar] [CrossRef]
  42. Lenney, J.F.; Dalbec, J.M. Purification and properties of 2 proteinases from Saccharomyces cerevisiae. Arch. Biochem. Biophys. 1967, 120, 42–48. [Google Scholar] [CrossRef]
  43. Schneiderbanger, J.; Grammer, M.; Jacob, F.; Hutzler, M. Statistical evaluation of beer spoilage bacteria by real-time PCR analyses from 2010 to 2016. J. Inst. Brew. 2018, 124, 173–181. [Google Scholar] [CrossRef] [Green Version]
  44. Ohtomo, M.; Kimura, K.; Watanabe, S.; Toeda, K. Production of components containing gamma-aminobutyric acid from rice bran by Lactobacillus brevis IFO12005. Seibutsu-Kogaku Kaishi 2006, 84, 479–483. [Google Scholar]
  45. Champagne, C.P.; Barrette, J.; Goulet, J. Interaction between pH, autolysis promoters and bacterial contamination on the production of yeast extracts. Food Res. Int. 1999, 32, 575–583. [Google Scholar] [CrossRef]
  46. Hjortmo, S.; Patring, J.; Jastrebova, J.; Andlid, T. Inherent biodiversity of folate content and composition in yeasts. Trends Food Sci. Technol. 2005, 16, 311–316. [Google Scholar] [CrossRef]
  47. Hjortmo, S.; Patring, J.; Andlid, T. Growth rate and medium composition strongly affect folate content in Saccharomyces cerevisiae. Int. J. Food Microbiol. 2008, 123, 93–100. [Google Scholar] [CrossRef] [PubMed]
  48. Kanauchi, O.; Igarashi, K.; Ogata, R.; Mitsuyama, K.; Andoh, A. A yeast extract high in bioactive peptides has a blood-pressure lowering effect in hypertensive model. Curr. Med. Chem. 2005, 12, 3085–3090. [Google Scholar] [CrossRef] [PubMed]
  49. Vieira, E.F.; Melo, A.; Ferreira, I.M.P.L.V.O. Autolysis of intracellular content of brewer’s spent yeast to maximize ACE-inhibitory and antioxidant activities. LWT Food Sci. Technol. 2017, 82, 255–259. [Google Scholar] [CrossRef]
Figure 1. Free and protein-bound amino acids in yeast extracts made from spent yeast of beer production via mechanical disruption method (ultrasonic sonotrode); influence of original gravity (12 ˚P, 16 ˚P, 20 ˚P), time of yeast cropping (after primary fermentation vs. after cold beer lagering (L)) and yeast strain (Scer, Spas, Slud, Tdel, Bbru, Sfib); for results of ANOVA and pairwise t test, see text; data are expressed as mean values ± confidence limits.
Fermentation 05 00051 g001
Figure 2. Free and protein-bound amino acids in yeast extracts made from spent yeast of beer production via autolysis; influence of original gravity (12 ˚P, 16 ˚P, 20 ˚P), time of yeast cropping (after primary fermentation vs. after cold beer lagering (L)) and yeast strain (Scer, Spas, Slud, Tdel, Bbru, Sfib); for results of ANOVA and pairwise t test, see text; data are expressed as mean values ± confidence limits.
Fermentation 05 00051 g002
Figure 3. Percentage share of free amino acids of yeast extract (from S. cerevisiae TUM 68) protein released via autolysis; influence of original gravity (12 ˚P, 16 ˚P, 18 ˚P) and time of yeast cropping (after primary fermentation vs. after cold beer lagering (L)).
Fermentation 05 00051 g003
Figure 4. Free proteinogenic amino acid spectrum in yeast extracts made from spent yeast (S. pastorianus TUM 34/70 and S. ludwigii TUM SL 17) after primary fermentation via autolysis; for results of ANOVA and pairwise t-test, see text; data are expressed as mean values ± confidence limits.
Fermentation 05 00051 g004
Figure 5. Gamma-aminobutyric acid in yeast extracts made from surplus yeast (S. cerevisiae TUM 68) after primary fermentation via autolysis (37 ˚C, 72 h or 50 ˚C, 24 h); Scer 12 ˚P (control); Scer 12 ˚P + Gluc + Glu (Scer 12 ˚P + glucose + glutamic acid); Scer 12 ˚P + L (Scer 12 ˚P + Lactobacillus brevis); for results of ANOVA and pairwise t-test, see text; data are expressed as mean values ± confidence limits.
Fermentation 05 00051 g005
Figure 6. Distribution of the folate vitamers 5-CH3-H4folate, 5-CHO-H4folate, 10-CHOPteGlu, H4folate and PteGlu in spent yeast (S. cerevisiae TUM 68) and in the corresponding yeast extract (via sonotrode or autolysis); influence of original gravity (12 ˚P, 16 ˚P, 20 ˚P), time of yeast cropping (after primary fermentation vs. after cold beer lagering (L)); for results of the pairwise t-test, see text; data are expressed as mean values ± confidence limits.
Fermentation 05 00051 g006
Figure 7. Distribution of the folate vitamers 5-CH3-H4folate, 5-CHO-H4folate, 10-CHOPteGlu, H4folate and PteGlu in spent yeast, yeast extracts (via sonotrode or autolysis) ; influence of yeast strain (Scer, Spas, Slud, Tdel, Bbru, Sfib); for results of the pairwise t-test, see text; data are expressed as mean values ± confidence limits.
Fermentation 05 00051 g007
Figure 8. Reduction potential of yeast extract made from spent yeast (S. cerevisiae TUM 68) of beer production via mechanical disruption method (sonotrode); influence of original gravity (12 ˚P, 16 ˚P, 20 ˚P), time of yeast cropping (after primary fermentation vs. after cold beer lagering (L)) and yeast strain (Scer, Spas, Slud, Tdel, Bbru, Sfib); for results of ANOVA and pairwise t-test, see text.
Fermentation 05 00051 g008
Table 1. Wort composition.
ParameterAmount
Original gravity (°P)12.00
pH5.17
Spec. weight SL 20/20 ˚C1.04
Zinc (mg/L)0.15
FAN (mg/100 mL)25.00
Total AS (mg/100 mL)201.38
Total sugar (g/L)80.03
EBC-Bittering units (EBU)20.00
Glucose (g/L)10.46
Fructose (g/L)2.17
Sucrose (g/L)1.02
Maltose (g/L)49.34
Maltotriose (g/L)13.79
Table 2. Sample overview and process details of cropped surplus yeast after primary fermentation (F.) and cold lagering (L.); data are expressed as mean values; confidence limits were determined to be lower than 5% of the average value.
Sample NameYeast SpeciesYeast StrainOriginal Gravity (˚P)Apparent Attenuation (%)Yeast Crop After
Scer 12˚PSaccharomyces cerevisiaeTUM 681279F.
Scer 12˚P LSaccharomyces cerevisiaeTUM 681279L.
Scer 16˚PSaccharomyces cerevisiaeTUM 681685F.
Scer 20˚PSaccharomyces cerevisiaeTUM 682089F.
Spas 12˚PSaccharomyces pastorianusTUM 34/701280F.
Slud 12˚PSaccharomycodes ludwigiiTUM SL 171211F.
Tdel 12˚PTorulaspora delbrueckiiTUM T 901245F.
Bbru 12˚PBrettanomyces bruxellensisTUM Bretta 11240F.
Sfib 12˚PSaccharomycopsis fibuligeraTUM 5251260F.
Table 3. General nutritional composition of yeast extracts made from spent yeast of beer production via a mechanical disruption method (ultrasonic sonotrode); influence of original gravity (12 ˚P, 16 ˚P, 20 ˚P), time of yeast cropping (after primary fermentation vs. after cold beer lagering (L)) and yeast strain (Scer, Spas, Slud, Tdel, Bbru, Sfib); for results of ANOVA and pairwise t-test, see text; data are expressed as mean values ± confidence limits; Cal.: calculated sum parameter of carbohydrates, RNA, non-nitrogen fraction and others components.
Sample NameScer 12˚PScer 12˚P LScer 16˚PScer 20˚PSpas 12˚PSlud 12˚PTdel 12˚PBbru 12˚PSfib 12˚P
Protein (mg/g dw) (N × 5.5)480.08 ± 10.25448.53 ± 4.93411.80 ± 9.61395,26 ± 5.67411.54 ± 8.62574.28 ± 11.23446.81 ± 8.57508.34 ± 8.75598.01 ± 13.88
Fat (mg/g dw)10.6 ± 0.3210.5 ± 0.3110.3 ± 0.3610.4 ± 0,5211.8 ± 0.7215.5 ± 0.439.88 ± 0.5318.2 ± 0.379. 68 ± 0.69
Ash (mg/g dw)130.55 ± 2.49120.11 ± 3.4584.20 ± 2.7387.10 ± 3.0282.10 ± 1.98110.40 ± 2.5779.12 ± 1.94130.64 ± 2.4789.70 ± 3.24
Cal. (mg/g dw)378.77420.86493.70507.24494.56299.82464.19342.82302.61
Moisture (%)9.30 ± 0.119.35 ± 0.139.41 ± 0.109.46 ± 0.129.34 ± 0.139.43 ± 0.129.31 ± 0.139.32 ± 0.119.29 ± 0.14

