The Effect of Salt and Temperature on the Growth of Fresco Culture


Department of Nutrition and Food Quality Assessment, Faculty of Chemical and Food Technology, Slovak, University of Technology, Radlinského 9, 81237 Bratislava, Slovakia
*
Author to whom correspondence should be addressed.
Fermentation 2019, 5(1), 2; https://doi.org/10.3390/fermentation5010002
Submission received: 26 October 2018
/
Revised: 11 December 2018
/
Accepted: 17 December 2018
/
Published: 20 December 2018
(This article belongs to the Special Issue Safety and Microbiological Quality)
Abstract
:The effect of environmental factors, including temperature and water activity, has a considerable impact on the growth dynamics of each microbial species, and it is complicated in the case of mixed cultures. Therefore, the aim of this study was to describe and analyze the growth dynamics of Fresco culture (consisting of 3 different bacterial species) using predictive microbiology tools. The growth parameters from primary fitting were modelled against temperature using two different secondary models. The intensity of Fresco culture growth in milk was significantly affected by incubation temperature described by Gibson’s model, from which the optimal temperature for growth of 38.6 °C in milk was calculated. This cardinal temperature was verified with the Topt = 38.3 °C calculated by the CTMI model (cardinal temperature model with inflection), providing other cardinal temperatures, i.e., minimal Tmin = 4.0 °C and maximal Tmax = 49.6 °C for Fresco culture growth. The specific growth rate of the culture under optimal temperature was 1.56 h−1. The addition of 1% w/v salt stimulated the culture growth dynamics under temperatures down to 33 °C but not the rate of milk acidification. The prediction data were validated and can be used in dairy practice during manufacture of fermented dairy products.

1. Introduction
Predictive microbiology is a very useful approach to characterize the growth of microorganisms in relation to selected environmental factors. The fundamentals for predictive microbiology were derived in 1949 from the Monod’s definition according to which “the growth of bacterial cultures, despite the immense complexity of the phenomena to which it testifies, generally obeys relatively simple laws”. Thus, the responses of a microbial population to environmental factors are reproducible [1]. Predictive microbiology would not only enable us to focus on foodborne and spoilage microorganisms but it should also predict the behavior of starter cultures during fermentation, at least of dairy products [2,3].
In milk fermentations, lactic acid bacteria (LAB) are the dominant microbiota. Their metabolic activity leads to desired degradation of saccharides, lipids, proteins and other milk components forming a wide range of metabolites, which have a positive effect on the technological and sensory properties of the final product [4,5,6]. The products obtained by their use are characterized by increased hygienic safety, prolonged storage stability and more attractive sensory properties [7]. Another positive feature of some LAB is their ability to improve or maintain the good health of consumers [8]. It is also important that LAB have a great ability to enter associative relationships in mixed cultures, since the symbiotic interrelationships among microbiota are of fundamental importance in food fermentation. The growth and metabolism of some LAB strains may be stimulated by another LAB member, particularly under environmental conditions, where one or both bacteria are not able to grow without the other [9,10]. Therefore, the choice of an appropriate active starter culture for controlled fermentation processes is of utmost importance [11]. Moreover, the growth and metabolism of microorganisms, alone or in mixed populations, are affected by many intrinsic (e.g., salt addition) and extrinsic (e.g., temperature) factors. Sensitivity of bacterial cultures to actual salt addition is strongly dependent on bacterial species and strain, and therefore the salt concentration can have stimulating or inhibiting effects on bacterial metabolic activity. One of the starter cultures used in cheese technology, e.g., in Mozzarella type or Cottage cheese production [4,12] is also Fresco DVS 1010 culture consisting of 3 different species—Lactococcus lactis ssp. lactis, able to grow at up to 4% of NaCl, Lc. lactis ssp. cremoris, able to grow at up to 2% of NaCl and Streptococcus salivarius ssp. thermophilus, able to grow at 2.5% NaCl [13].
Since the temperature and salt concentration are among the most important factors for bioprocess control, a description of the effect of temperature and water activity on the microbial growth parameters is required. That is why this work deals with the quantification of the effect that temperature and salt addition have on the growth of Fresco DVS 1010 culture. Mathematical modelling coupled with experimental analysis allows us to understand the growth dynamics of studied mixed culture under specific conditions. These data will help optimize the process of cheese manufacturing conditions when a mixed culture of LAB will be used as a starter culture.
2. Materials and Methods
2.1. Microorganisms
Fresco DVS 1010 culture (Fresco culture; Christian Hansen, Hørsholm, Denmark) consisting of Lactococcus lactis subsp. lactis, Lc. lactis subsp. cremoris and Streptococcus salivarius ssp. thermophilus was used. This commercial culture was kept frozen at −40 °C until use.
2.2. Inoculation and Cultivation Conditions
A few grains of the frozen Fresco culture were inoculated into 100 mL of sterile milk and incubated at 30 °C for 5 h until the stationary phase was reached. Appropriate dilutions of this culture were used to inoculate 300 mL of pre-tempered ultra-pasteurized milk (1.5 g/L fat content, Rajo, Bratislava, Slovakia) so that the initial concentration was as close as possible to 104 CFU/mL. The incubation was performed in three parallel stages under static conditions at appropriately chosen temperatures in the range from 5 to 47 °C.
2.3. The Effect of NaCl Addition on the Growth of Fresco Culture
The effect of NaCl addition (1, 2 and 3%, w/v) was studied in milk (1.5 g/L fat content, Rajo, Bratislava, Slovakia) at temperatures of 12, 15, 18, 21, 25, 30 and 37 °C in three parallel stages. The conditions of inoculation (initial counts of approximately 103 CFU/mL) were mentioned above. The value of water activity was controlled by an aw-meter (Aw-Sprint TH500, Novasina, Lachen, Switzerland).
2.4. Total Counts of Fresco Culture in Growth Media
At chosen time intervals, the number of bacteria in the culture was determined according to EN ISO 4833-1 [14] on M17 agar (Biokar Diagnostics, Beauvais, France).
2.5. Fitting the Growth Curves and Calculating the Growth Parameters
The growth data of Fresco culture were analyzed, fitted and calculated, using DMFit Excel Add-in package version 3.5 (ComBase managed by United States Department of Agriculture-Agricultural Research Service, Washington, DC, USA and University of Tasmania Food Safety Centre Hobart, Australia) that incorporates the mechanistic modeling technique of Baranyi and Roberts [15]. The counts were plotted against time and fitted to a model for the estimation of the growth rate (Gr), the initial (N0) and maximal (Nmax) density. The growth parameters from the individual parallel experiments were analyzed in the secondary phase of modeling by statistical tools of the Microsoft Office version 2007 (Microsoft, Redmond, WA, USA) and the Statistica data analysis software system, version 8.0 (StatSoft, Inc., Tulsa, OK, USA).
2.6. Secondary Models
To empirically describe the influence of selected environmental factor on the data in the whole temperature range, the cardinal temperature model with inflection (CTMI) was introduced. This model uses three cardinal temperatures directly included as parameters of the model. Its advantage is the direct definition of cardinal temperature values for the growth of selected bacteria [16]. The effect of temperature on the specific growth rate (μ = ln 10 × Gr) is described by the equations:
where T is actual incubation temperature, Tmin is the notional temperature below which the growth is not observed, Tmax is the notional temperature above which the growth is not observed and Topt is the temperature at which the maximal growth (Gropt) is observed [16].
The specific growth rate (μ) was also modeled as a function of the incubation temperature T by the model introduced by Gibson et al. [17]. Again, the maximal specific growth rate was modeled as a function of the incubation temperature. For that purpose and inspired by the water activity (aw) transformation originally introduced by Gibson et al. [17], the following transformation of temperature (Tw) was applied.
Tmax was given by the CTMI model and was also confirmed by the estimation from data points in the high-temperature region as recommended by Ratkowsky et al. [18]. The natural logarithm of the specific growth rates was modeled by the following quadratic function as introduced by Gibson et al. [17]:
The coefficients C0, C1 and C2 were estimated by linear regression. Finally, the optimum value for the maximal growth rate was calculated.
The same models were used for the prediction of Fresco culture growth dynamics at selected NaCl concentrations as a function of temperature.
2.7. Validation of the Models
To validate the mathematical equations describing Fresco culture responses to various environmental conditions, several mathematical and statistical indices were used. The ordinary least-squares criterion and regression coefficient (R2) were used to describe the fit of the model to the data. The variance percentage (%V) as given by Daughtry et al. [19] gives the goodness of the fit of the model; the root mean square error (RMSE) as given by TeGiffel & Zwietering [20] as well as the sum of the squared residuals (RSS) as reported Zwietering et al. [21] and standard error of prediction (%SEP) as reported Zurera-Cosano et al. [22] were used as a measure of “goodness-of-fit”. Finally, accuracy (Af), bias (Bf) and discrepancy (Df) factors as introduced by Baranyi et al. [23] were used for internal validation of the models.
3. Results
To describe the effect of the incubation temperature on Fresco culture growth, experiments were carried out in the ultra-pasteurised milk. The average initial counts of Fresco culture (N0) in all experiments were 4.30 ± 0.39 log CFU/mL (%V = 9.0). All growth curves were characterized by a typical sigmoidal shape and were successfully fitted with the model of Baranyi & Roberts [15] with R2 = 0.994 ± 0.006. The temperature of 5 °C was the minimal temperature at which the growth of the culture was noticed, though the growth was very slow, represented by time to double of 30.6 h where td = ln2/μ [23]. Further increase in temperature led to more and more intensive growth of bacterial populations. Comparing the growth rate at 7, 10, 12 and 15 °C, the intensity of multiplication increased about 70%, 38%, 27% and 50% in comparison to growth rate at 5 °C. This almost linear trend continued until 40 °C, when the fastest growth of Gr = 0.961 log CFU/mL·h−1 was reached. Further increase of the incubation temperature had a negative effect on the growth dynamics, since the growth rate decreased to Gr = 0.582 log CFU/mL·h−1 at 43 °C and Gr = 0.349 log CFU/mL·h−1 at 47 °C.
Although the growth dynamics were strongly influenced by the incubation temperature; the growth increment and the final densities of Fresco culture were constant even at low temperatures. At the lowest temperature, the stationary phase was reached after almost 27 days (674 h); on the other hand, at 40 °C the stationary phase was reached only after 8 h of incubation. It is important to note that the average counts in the stationary phase of Nmax = 8.85 ± 0.44 log CFU/mL (%V = 4.9) were reached at all studied temperatures. On the other hand, during the growth of some lactic acid bacteria as a monoculture, e.g., Lactobacillus rhamnosus GG [24], Lb. acidophilus NCFM Howaru [25] or Lb. plantarum [26] strong influence of temperature on the final number of bacterial cells was observed. The cause might be Fresco being a mixed culture, since Champagne et al. [27] noticed about 20% increase in growth of cells and about 13% higher growth dynamics of Lc. lactis in the presence of S. thermophilus compared to growth of lactococci alone. On the other hand, growth increment and growth dynamics of S. thermophilus were not influenced by the presence of Lc. lactis. We supposed that bacterial partners did not compete for nutrients at the same time. Moreover, thanks to the metabolism and subsequent production of substrates needed for the growth of the second bacterial partner, its growth might be stimulated.
3.1. The Effect of Incubation Temperature on Fresco Culture Growth Rate
From the primary growth curves of Fresco culture in milk, the growth rate Gr (expressed as the logarithm of colony forming units per millilitre and per hour) or the specific growth rate μ (expressed as reciprocal hours) was derived from 3 replicate curves at each temperature, and values are summarized in Table 1. Individual data were subsequently used in the secondary phase of predictive modeling and graphical presentations. Each part of the growth curve was also influenced by environmental factors or conditions prior to growth analysis, so the secondary models represent an essential approach to describe the influence of selected factors on microbial growth.
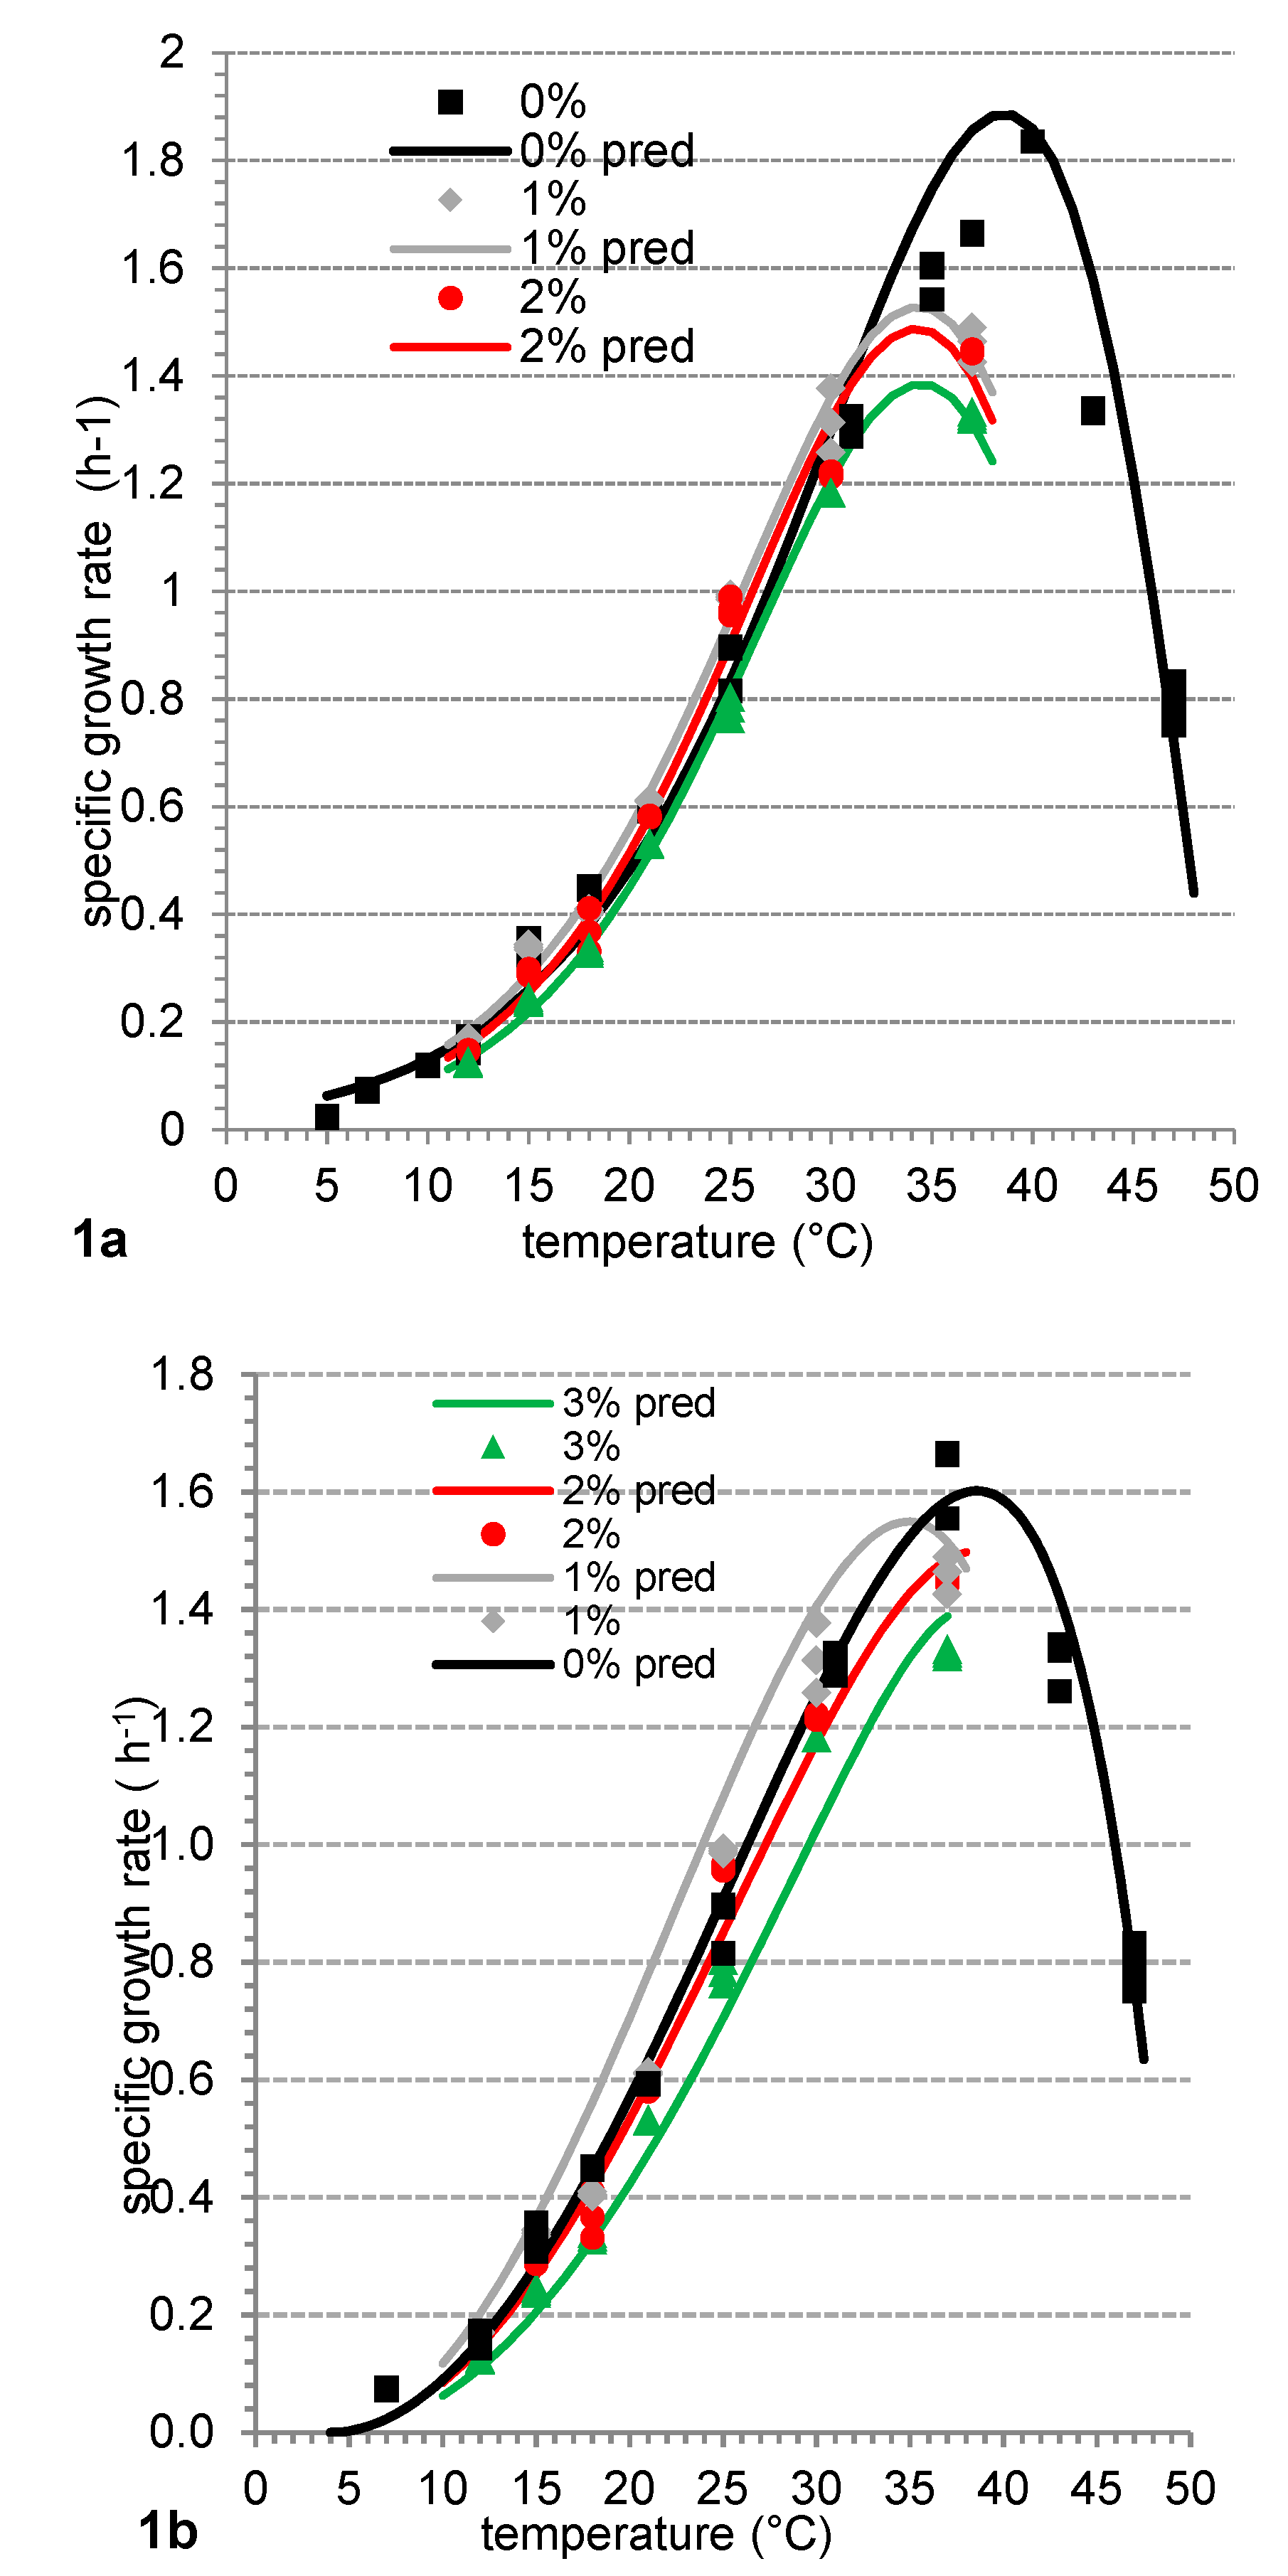
To predict the effect of the incubation temperature on the growth dynamics of Fresco culture in milk, an empirical CTMI model was used. Since the parameter settings of the CTMI model are based on their biological interpretation and due to the lack of structural correlation between parameters, the simple and accurate estimation of cardinal temperature values is allowed [16]. The most optimal conditions for Fresco culture growth in milk are expected at 38.3 °C. Under the optimal temperature conditions, the 4th parameter of the CTMI model provides the maximal specific growth rate of 1.56 h−1. This can be used by dairy technologists and microbiologists in dairy practice after its recalculation to time to doubling time and it is expected to be 26.7 min in milk.
By using the CTMI model (Figure 1), the other cardinal temperatures were estimated: minimal temperature (below which no growth occurs) is 4.0 °C, maximal temperature allowing growth is 49.6 °C. These findings also confirmed that our estimations of the maximal temperature of 49 °C based on the recommendation of Ratkowsky et al. [18] needed for Gibson’s model were sufficiently precise. With respect to different modeling techniques, the narrow range of each cardinal temperature for Fresco culture is expected with defined errors in expectation, considering the discrepancies calculated in the validation process that is an inevitable part of the mathematical prediction of microbial growth under specific environmental conditions.
The estimation of optimal temperature for growth of Fresco culture was also confirmed by Gibson’s model with the temperature transformation (Equation (3)). The specific growth rate of Fresco culture was plotted against calculated Tw values (Equation (2)) and was fitted with a regression model (Equation (4)) with good fitting in the range beyond Topt (R2 = 0.984).
Based on this equation, the optimal temperature of Topt = 38.6 °C for Fresco culture growth in milk was calculated, which is in perfect agreement with the optimal temperature calculated by the CTMI model. From the food practice point of view, predictive microbiology can provide some easily interpretable data, such as how fast microorganisms grow in a given product or when the stationary phase will be reached. The prediction of time necessary to increase culture density at the selected temperature of the process is a main concern for food technologists. That is why the predictions of the time (tx) needed for increase of Fresco culture in milk regarding x logarithmic counts (x = 1, 2,…) at a selected temperature can be a useful application of Gibson’s model. In this approach it was assumed that time tx is inversely related to the growth kinetic (ln μ) described by the model according to the equation ln tx = x/μ, where .
It is also important to mention the desirable function of lactic acid bacteria, i.e., their inhibitive potential against some bacteria. During raw milk fermentation, coagulase-positive staphylococci, pathogenic or saprophytic Escherichia coli are the most frequent undesirable species with highly adverse health effect on consumers. In our previous works [28,29,30], we proved that Fresco culture has strong inhibitive potential against Staphylococcus aureus or Escherichia coli growth in milk co-culture and did not influence the growth of Geotrichum candidum that might play an important role during fresh cheese ripening [30].
3.2. The Effect of NaCl on the Growth Dynamics of Fresco Culture
Besides the growth of Fresco culture in milk without additional salt (aw = 0.995 ± 0.002; %V = 1.9), the effect of 1% (1 g/100 mL) salt addition (aw = 0.992 ± 0.001; %V = 0.11), 2% (2 g/100 mL) NaCl addition (aw = 0.987 ± 0.003; %V = 0.28) and 3% (3 g/100 mL) NaCl addition (aw = 0.979 ± 0.002; %V = 0.21) was studied at temperatures 12, 15, 18, 21, 25, 30 and 37 °C. All growth curves were again characterized by a typical sigmoid shape and were successfully fitted with the model of Baranyi & Roberts [15] at R2 = 0.997 ± 0.003.
The growth dynamics of Fresco culture were stimulated by the 1% salt addition as was seen by a higher growth rate as well as by a shorter lag phase duration. However, a further increase in the salt concentration in the media led to the deceleration of Fresco culture growth. It is apparent from both Gibson’s model (Figure 1a) as well as the CTMI model (Figure 1b). However, this stimulation of growth dynamics by 1% salt addition was observed only at temperatures below 33 °C. At 37 °C, Fresco culture grew about 20% slower in media with 1% salt addition compared to the control. However, 2 or 3% addition of NaCl led generally to a lowering of Fresco culture growth dynamics. Liu et al. [31] observed slowing of Lc. lactis ssp. cremoris 2260 growth in M17 broth at 22 °C by about 33% in media with aw = 0.98 compared to media without the salt addition. In the case of our studies, Fresco culture grew at 21 °C about 10% slower in media with aw = 0.977 compared to media without salt addition. This might be the result of the presence of compatible solutes (carnitine, betaine, proline, etc.) in milk [32] that protect Fresco culture to withstand unfavorable environmental conditions. Similarly, Uguen et al. [33] observed slowing of Lc. lactis ssp. lactis ADRIA 85LO30 growth, approximately 3-fold, in the presence of 23.4 g/L of NaCl while the addition of osmoprotective compounds (betaine, dimethylsulfonioacetate, dimethylsulfoniopropionate, L-carnitine) into the same media with 23.4 g/L NaCl led to slowing of the growth dynamics but only by about 24%.
Use of lactic acid bacteria starter culture is limited not only by their growth activity but also by their fast acidification activity that is also influenced by many intrinsic and extrinsic factors. During growth of Fresco culture in milk, the slowest pH value decline was observed naturally at the lowest temperatures and at the highest salt addition. At higher incubation temperatures, the rate of pH value decrease (rpH) was more intensive as can be seen from Table 1 and Table 2. However, as the salt concentration increased, the rate of pH change decreased and the lag phase of pH change was longer, even when the differences at 1% of salt concentration were not so dramatic. Larsen & Añón [34] noticed that even though the growth of S. thermophilus ATCC 19258 was not influenced by the presence of glycerol, the acidification ability was slowed down by about 10% compared to the acidification rate in media without glycerol. Moreover, Liu et al. [31] observed that by decreasing water activity value from 0.99 to 0.88, the acidification rate of Lc. lactis ssp. cremoris 2254 was lowered by 13.5 to 42.4%, depending on pH.
3.3. Validation
As there was a lack of comparable growth data for Fresco culture in the literature, only an internal validation was performed. Obtained validation indices are summarized in Table 3. The accuracy indices for the model predictions compared to the original data of Fresco culture were from 1.055 to 1.146 for Gibson’s model and from 1.070 to 1.193 for the CTMI model. As proposed by Ross et al. [35], the relative error in growth estimates under controlled laboratory conditions was expected to be around 10% per independent variable. Therefore, if the temperature was the only factor, the best expected accuracy factor was approximately 1.1. For other lactic acid bacteria, we found similar accuracy factors, e.g., Af of 1.09 1.16 for the growth of Leuconostoc mesenteroides in a broth culture [22], for the growth of Lactobacillus rhamnosus GG in milk, Af of 1.102–1.201 [36], for the growth of Lactobacillus acidophilus NCFM in milk and in MRS broth, accuracy factor of 1.188–1.256 [25].
Except for the CTMI model at 1% and 3% of NaCl, all other applied models can be acceptable with high accuracy since, as proposed by Zurera-Cosano et al. [22], the model can be considered as good if the bias factor is in the range of 0.95–1.01. The bias factor higher than 1.0 (Gibson’s model at 0% NaCl and CTMI at 1% NaCl) revealed overestimation of the growth rate that would lead to the slower real growth of Fresco culture in milk than is predicted by the models but with the defined errors expressed by the discrepancy factors. Taking the %Df and %SEP values into account, the predictions of growth rate of the culture can still be considered acceptable, since they range from 5.5 to 19.3 % in the case of %Df and from 3.2 to 16.1% in the case of %SEP. However, the well-thought interpretation of the obtained data is as important as their achievement.
4. Conclusions
In this work we studied the effect of temperature and salt concentration on the growth of mixed Fresco culture with the use of predictive models. Based on the models, the cardinal temperatures for Fresco culture growth were calculated and may be taken into account during dairy product manufacture and storage to ensure product stability and shelf-life. The addition of salt up to 1% stimulated the growth of Fresco culture, but not the rate of acidification of milk media. The inhibition of Fresco culture acidification was not significant and therefore the addition of salt can be used to inhibit pathogenic bacteria sensitive to lower water activity values. Moreover, all used models are suitable for the estimation of Fresco culture growth dynamics in dairy products and can be applied to increase storage stability and sensory attractiveness of products.
Author Contributions
P.Š., T.M. and A.M. were carried out the experimental work and analyzed the data, Ľ.V. set up the experimental design, A.M. and Ľ.V. wrote the paper.
Funding
This research was funded by grants VEGA No. 1/0532/18 and APVV-15-0006.
Acknowledgments
We would like to thank MSc. Michal Kaliňák for corrections.
Conflicts of Interest
The authors declare no conflict of interest.
References
- Ross, T.; McMeekin, T.A. Predictive microbiology. Int. J. Food Microbiol. 1994, 23, 241–264. [Google Scholar] [CrossRef]
- Aghababaie, M.; Khanahmadi, M.; Beheshti, M. Developing a detailed kinetic model for the production of yogurt starter bacteria in single strain cultures. Food Bioprod. Process. 2014, 94, 657–667. [Google Scholar] [CrossRef]
- Alvarez, M.M.; Aguirre-Ezkauriatza, E.J.; Ramírez-Medrano, A.; Rodríguez-Sánchez, Á. Kinetic analysis and mathematical modeling of growth and lactic acid production of Lactobacillus casei var. rhamnosus in milk whey. J. Dairy Sci. 2010, 93, 5552–5560. [Google Scholar] [CrossRef] [PubMed]
- Lahtinen, S.; Salminen, S.; Von Wright, A.; Ouwehand, A.C. Lactic Acid Bacteria: Microbiological and Functional Aspects, 4th ed.; CRC Press: Boca Raton, FL, USA, 2011; 779p, ISBN 978-1139836781. [Google Scholar]
- Ljungh, A.; Wadström, T. Lactobacillus Molecular Biology: From Genomics to Probiotics, 1st ed.; Horizon Scientific Press: Norfolk, FL, USA, 2009; 205p, ISBN 978-1904455417. [Google Scholar]
- Marth, E.C.; Steel, J.L. Applied Dairy Microbiology, 2nd ed.; Marcel Dekker, Inc.: New York, NY, USA, 2001; 736p, ISBN 978-0824705367. [Google Scholar]
- Kavitake, D.; Kandasamy, S.; Devi, P.B.; Shetty, P.H. Recent developments on encapsulation of lactic acid bacteria as potential starter culture in fermented foods. Food Biosci. 2018, 21, 34–44. [Google Scholar] [CrossRef]
- Mancuskova, T.; Medved’ova, A.; Ozbolt, M. The medical functions of probiotics and their role in clinical nutrition. Curr. Nutr. Food Sci. 2017, 13, 1–8. [Google Scholar] [CrossRef]
- Sasaki, Y.; Horiuchi, H.; Kawashima, H.; Mukai, T.; Yamamoto, Y. NADH oxidase of S. thermophilus 1131 is required for the effective yogurt fermentation with L. delbrueckii subsp. bulgaricus 2038. Biosci. Microbiota Food Health 2014, 33, 31–40. [Google Scholar] [CrossRef]
- Wang, T.; Xu, Z.; Lu, S.; Xin, M.; Kong, J. Effects of glutathione on acid stress resistance and symbiosis between S. thermophilus and L. delbrueckii subsp. bulgaricus. Int. Dairy J. 2016, 61, 22–28. [Google Scholar] [CrossRef]
- Neysens, P.; Messens, W.; De Wuyst, L. Effect of NaCl on growth and bacteriocin production by L. amylovorus DCE 471. Int. J. Food Microbiol. 2003, 88, 29–39. [Google Scholar] [CrossRef]
- Fresco DVS 1010 Culture. Available online: www.chr-hansen.com/en (accessed on 25 May 2018).
- Ramchandran, L.; Sanciolo, P.; Vasiljevic, T.; Broome, M.; Powell, I.; Diuke, M. Improving cell yield and lactic acid production of L. lactis ssp. cremoris by a novel submerged membrane fermentation process. J. Membr. Sci. 2012, 403, 179–187. [Google Scholar] [CrossRef]
- EN ISO 4833-1:2013. In Microbiology of the Food Chain—Horizontal Method for the Enumeration of Microorganisms—Part 1: Colony Count at 30 °C by the Pour Plate Technique; International Organization for Standardization: Geneva, Switzerland, 2013; 13p.
- Baranyi, J.; Roberts, T.A. A dynamic approach to predicting bacterial growth in food. Int. J. Food Microbiol. 1994, 23, 277–294. [Google Scholar] [CrossRef]
- Rosso, L.; Lobry, J.; Flanders, J. Unexpected correlation between temperatures of microbial growth highlighted by new model. J. Theor. Biol. 1993, 162, 447–463. [Google Scholar] [CrossRef]
- Gibson, A.; Baranyi, J.; Pitt, J.I.; Eyles, M.J.; Roberts, T.A. Predicting fungal growth—The effect of water activity on A. flavus and related species. Int. J. Food Microbiol. 1994, 23, 419–431. [Google Scholar] [CrossRef]
- Ratkowsky, D.A.; Lowry, R.K.; McMeekin, T.A.; Stokes, A.N.; Chandler, R.E. Model for bacterial culture growth rate throughout the entire biokinetic temperature range. J. Bacteriol. 1983, 154, 1222–1226. [Google Scholar]
- Daughtry, B.J.; Davey, K.R.; King, K.D. Temperature dependence of growth kinetics of food bacteria. Food Microbiol. 1997, 14, 21–30. [Google Scholar] [CrossRef]
- TeGiffel, M.C.; Zwietering, M.H. Validation of predictive models describing the growth of L. monocytogenes. Int. J. Food Microbiol. 1999, 46, 135–149. [Google Scholar] [CrossRef]
- Zwietering, M.H.; De Koos, J.T.; Hasenack, B.E.; De Wit, J.C.; Riet, K. Modelling of bacterial growth as a function of temperature. Appl. Environ. Microbiol. 1991, 57, 1094–1101. [Google Scholar] [PubMed]
- Zurera-Cosano, G.; Garciá-Gimeno, R.M.; Rodríguez-Pérez, R.; Hervás-Martínez, C. Performance of response surface model for predition of L. mesenteroides growth parameters under different experimental conditions. Food Control 2006, 17, 429–438. [Google Scholar] [CrossRef]
- Baranyi, J.; Pin, C.; Ross, T. Validating and comparing predictive models. Int. J. Food Microbiol. 1999, 48, 159–166. [Google Scholar] [CrossRef]
- MedveĎová, A.; Liptáková, D.; Valík, L. Characterization of the growth of L. rhamnosus GG in milk at suboptimal temperature. J. Nutr. Food Res. 2008, 47, 60–67. [Google Scholar]
- Medvedova, A.; Mancuskova, T.; Valik, L. Growth of L. acidophilus NCFM in dependence on temperature. Acta Aliment. 2016, 45, 104–111. [Google Scholar] [CrossRef]
- Matejčeková, Z.; Liptáková, D.; Spodniaková, S.; Valík, Ľ. Characterisazion of the growth of L. plantarum in milk in dependence on temperature. Acta Chim. 2016, 9, 104–108. [Google Scholar] [CrossRef]
- Champagne, C.P.; Gagnon, D.; St. Gelais, D.; Vullemard, J.C. Interactions between L. lactis and S. thermophilus strains in Cheddar cheese processing conditions. Int. Dairy J. 2009, 19, 669–674. [Google Scholar] [CrossRef]
- Valík, L.; Ačai, P.; Medved’ová, A. Application of competitive models in predicting the simultaneous growth of S. aureus and lactic acid bacteria in milk. Food Control 2018, 87, 145–152. [Google Scholar] [CrossRef]
- Ačai, P.; Valík, L.; Medved’ová, A.; Rosskopf, F. Modelling and predicting the simultaneous growth of E. coli and lactic acid bacteria in milk. Food Sci. Technol. Int. 2016, 22, 475–484. [Google Scholar] [CrossRef] [PubMed]
- Šípková, A.; Valík, L.; Liptáková, D.; Pelikánová, J. Effect of lactic acid bacteria on the growth dynamics of Geotrichum candidum in fresh cheeses during storage. J. Food Nutr. Res. 2014, 53, 224–231. [Google Scholar]
- Liu, S.Q.; Asmundson, V.; Gopal, P.K.; Holland, R.; Crow, V.L. Influence of reduced water activity on lactose metabolism by Lactococcus lactis ssp. cremoris at different pH values. Appl. Environ. Microbiol. 1998, 64, 2111–2116. [Google Scholar] [PubMed]
- Woollard, D.C.; Indyk, H.E.; Woollard, G.A. Carnitine in milk: A survey of content, distribution and temporal variation. Food Chem. 1999, 66, 121–127. [Google Scholar] [CrossRef]
- Uguen, P.; Hamelin, J.; Le Pennec, J.P.; Blanco, C. Influence of osmolarity and the presence of an osmoprotectant on Lactococcus lactis growth and bacteriocin production. Appl. Environ. Microbiol. 1999, 65, 291–293. [Google Scholar]
- Larsen, R.F.; Añón, M.C. Effect of water activity of milk on acid production by Streptococcus thermophilus and Lactobacillus bulgaricus. J. Food Sci. 1989, 54, 917–921. [Google Scholar] [CrossRef]
- Ross, T.; Dalgaard, P.; Tienungon, S. Predictive modelling of the growth and survival of Listeria in fishery products. Int. J. Food Microbiol. 2000, 62, 231–246. [Google Scholar] [CrossRef]
- Valík, L.; Medved’ová, A.; Čižniar, M.; Liptáková, D. Evaluation of temperature effect on growth rate of Lactobacillus rhamnosus GG in milk using secondary models. Chem. Pap. 2013, 67, 737–742. [Google Scholar] [CrossRef]
Figure 1.
Plots of the specific growth rates (μ) versus temperature (T) for Fresco culture in milk according to (a) Gibson’s model and (b) CTMI model (solid line). Symbols indicate the μ calculated from the growth curves at each incubation temperature. The continuous lines indicate the fitted μ versus T function according to each model for 0% (■), 1% (♦), 2% (●) and 3% (▲) of salt.

Table 1.
Effect of temperature on the growth and metabolic activity of Fresco culture in milk.
| T | Gr | λ | Nmax | rpH | lagpH |
|---|---|---|---|---|---|
| 5 | 0.010 ± 0.001 | 146.8 ± 8.96 | 8.94 ± 0.06 | −0.033 | 547.0 |
| 7 | 0.032 ± 0.001 | 43.0 ± 4.44 | 8.17 ± 0.02 | −0.004 | 130.0 |
| 12 | 0.071 ± 0.007 | 3.4 ± 0.17 | 8.87 ± 0.09 | −0.053 | 54.3 |
| 15 | 0.140 ± 0.011 | 6.7 ± 1.80 | 9.26 ± 0.05 | −0.048 | 24.1 |
| 18 | 0.196 ± 0.001 | 4.2 ± 0.10 | 8.97 ± 0.03 | −0.087 | 19.9 |
| 21 | 0.257 ± 0.000 | - | 9.33 ± 0.02 | −0.308 | 17.3 |
| 25 | 0.390 ± 0.008 | 1.2 ± 0.02 | 9.27 ± 0.14 | −0.324 | 7.9 |
| 31 | 0.567 ± 0.008 | 2.2 ± 0.04 | 9.35 ± 0.05 | −0.612 | 9.7 |
| 37 | 0.722 ± 0.027 | 0.5 ± 0.05 | 8.59 ± 0.05 | −0.451 | 4.5 |
| 40 | 0.961 ± 0.217 | 1.87 ± 0.54 | 8.68 ± 0.07 | −0.234 | 12.3 |
| 43 | 0.582 ± 0.019 | 0.8 ± 0.08 | 8.40 ± 0.21 | −0.381 | 7.5 |
| 47 | 0.349 ± 0.018 | - | 7.90 ± 0.21 | −0.070 | - |
T—Incubation temperature (°C), Gr—growth rate (log CFU/mL·h−1), λ—lag phase duration (h), Nmax—counts of Fresco culture in the stationary phase (log CFU/mL), rpH —rate of pH value decrease (h−1), lagpH—lag of pH value (h).
Table 2.
The effect of temperature and water activity on the growth and metabolic activity of Fresco culture in milk.
Table 2.
The effect of temperature and water activity on the growth and metabolic activity of Fresco culture in milk.
| T | aw | Gr | λ | Nmax | rpH | lagpH |
|---|---|---|---|---|---|---|
| 12 | 0.991 | 0.074 ± 0.000 | 3.8 ± 0.1 | 9.36 ± 0.01 | −0.175 | 101.2 |
| 0.987 | 0.064 ± 0.000 | 7.7 ± 0.2 | 9.11 ± 0.04 | −0.101 | 112.2 | |
| 0.981 | 0.054 ± 0.001 | 14.0 ± 1.4 | 9.13 ± 0.13 | −0.040 | 116.3 | |
| 15 | 0.993 | 0.147 ± 0.002 | 3.5 ± 0.3 | 9.27 ± 0.03 | −0.126 | 42.0 |
| 0.988 | 0.127 ± 0.003 | 4.1 ± 0.2 | 9.21 ± 0.08 | −0.113 | 51.9 | |
| 0.981 | 0.105 ± 0.002 | 6.6 ± 0.0 | 9.15 ± 0.04 | −0.075 | 63.4 | |
| 18 | 0.993 | 0.175 ± 0.002 | 0.2 ± 0.5 | 9.12 ± 0.06 | −0.086 | 23.5 |
| 0.989 | 0.159 ± 0.017 | 2.0 ± 0.6 | 9.01 ± 0.06 | −0.098 | 32.3 | |
| 0.981 | 0.145 ± 0.002 | 4.6 ± 0.6 | 8.61 ± 0.08 | −0.056 | 38.7 | |
| 21 | 0.992 | 0.265 ± 0.001 | 0.7 ± 0.1 | 9.33 ± 0.02 | −0.209 | 21.2 |
| 0.989 | 0.253 ± 0.001 | 1.0 ± 0.0 | 9.60 ± 0.01 | −0.155 | 21.2 | |
| 0.977 | 0.231 ± 0.000 | 2.1 ± 0.0 | 9.09 ± 0.06 | −0.358 | 32.4 | |
| 25 | 0.992 | 0.430 ± 0.002 | 1.2 ± 0.0 | 9.28 ± 0.00 | −0.176 | 12.3 |
| 0.988 | 0.420 ± 0.008 | 1.8 ± 0.2 | 9.32 ± 0.00 | −0.172 | 12.7 | |
| 0.977 | 0.342 ± 0.009 | 1.9 ± 0.1 | 8.91 ± 0.06 | −0.132 | 18.4 | |
| 30 | 0.990 | 0.570 ± 0.019 | 0.4 ± 0.2 | 9.14 ± 0.11 | −0.181 | 9.8 |
| 0.981 | 0.527 ± 0.011 | 0.1 ± 0.3 | 9.08 ± 0.26 | −0.168 | 9.0 | |
| 0.977 | 0.514 ± 0.010 | 0.7 ± 0.3 | 9.17 ± 0.16 | −0.182 | 11.2 | |
| 37 | 0.992 | 0.634 ± 0.014 | 0.3 ± 0.0 | 8.98 ± 0.02 | −0.297 | 7.0 |
| 0.986 | 0.629 ± 0.003 | 0.6 ± 0.0 | 9.38 ± 0.02 | −0.231 | 8.6 | |
| 0.980 | 0.576 ± 0.003 | 1.2 ± 0.0 | 8.72 ± 0.04 | −0.178 | 12.1 |
T—Incubation temperature (°C), Gr—growth rate (log CFU/mL·h−1), λ—lag phase duration (h), Nmax—counts of Fresco culture in stationary phase (log CFU/mL), rpH —rate of pH decrease (h−1), lagpH—lag of pH value (h).
Table 3.
The equations of Gibson’s model, the coefficients of the CTMI model and the indices of the internal validation for Fresco culture growth.
Table 3.
The equations of Gibson’s model, the coefficients of the CTMI model and the indices of the internal validation for Fresco culture growth.
| Equation/Coefficients of the Equation | ||||||||
|---|---|---|---|---|---|---|---|---|
| Af | Bf | %Df | R2 | %V | RSS | RMSE | %SEP | |
| CTMI model | ||||||||
| 0 % | 1.070 | 0.995 | 7.0 | 0.987 | 98.3 | 0.069 | 0.051 | 6.1 |
| 1 % | 1.193 | 1.156 | 19.3 | 0.949 | 93.3 | 0.231 | 0.093 | 12.3 |
| 2 % | 1.090 | 0.987 | 9.0 | 0.985 | 98.0 | 0.067 | 0.049 | 6.9 |
| 3 % | 1.134 | 0.904 | 13.4 | 0.949 | 93.1 | 0.185 | 0.083 | 13.3 |
| 0 % | 1.146 | 1.010 | 14.6 | 0.984 | 98.3 | 0.129 | 0.058 | 16.1 |
| 1 % | 1.082 | 0.999 | 8.2 | 0.988 | 98.6 | 0.032 | 0.039 | 5.2 |
| 2 % | 1.090 | 0.999 | 9.0 | 0.987 | 98.5 | 0.060 | 0.055 | 8.0 |
| 3 % | 1.055 | 0.999 | 5.5 | 0.995 | 99.5 | 0.008 | 0.020 | 3.2 |
© 2018 by the authors. Licensee MDPI, Basel, Switzerland. This article is an open access article distributed under the terms and conditions of the Creative Commons Attribution (CC BY) license (http://creativecommons.org/licenses/by/4.0/).
Share and Cite
MDPI and ACS Style
Medveďová, A.; Šipošová, P.; Mančušková, T.; Valík, Ľ. The Effect of Salt and Temperature on the Growth of Fresco Culture. Fermentation 2019, 5, 2. https://doi.org/10.3390/fermentation5010002
AMA Style
Medveďová A, Šipošová P, Mančušková T, Valík Ľ. The Effect of Salt and Temperature on the Growth of Fresco Culture. Fermentation. 2019; 5(1):2. https://doi.org/10.3390/fermentation5010002
Chicago/Turabian StyleMedveďová, Alžbeta, Petra Šipošová, Tatiana Mančušková, and Ľubomír Valík. 2019. "The Effect of Salt and Temperature on the Growth of Fresco Culture" Fermentation 5, no. 1: 2. https://doi.org/10.3390/fermentation5010002
Note that from the first issue of 2016, this journal uses article numbers instead of page numbers. See further details here.