Article

Photoautotrophic Production of Docosahexaenoic Acid- and Eicosapentaenoic Acid-Enriched Biomass by Co-Culturing Golden-Brown and Green Microalgae

Chair of Biochemical Engineering, School of Engineering and Design, Technical University of Munich, Boltzmannstr. 15, 85748 Garching, Germany
*
Author to whom correspondence should be addressed.
Fermentation 2024, 10(4), 220; https://doi.org/10.3390/fermentation10040220
Submission received: 12 March 2024 / Revised: 15 April 2024 / Accepted: 15 April 2024 / Published: 18 April 2024

Abstract

:
Marine microalgae offer a sustainable alternative source for the human diet’s essential omega-3-fatty acids, including docosahexaenoic acid (DHA, C22:6) and eicosapentaenoic acid (EPA, C20:5). However, none of them can produce DHA and EPA in a nutritionally balanced ratio of 1:1. As shown recently, the phototrophic co-cultivation of the golden-brown microalgae Tisochrysis lutea (DHA producer) with the green microalgae Microchloropsis salina (EPA producer) can provide microalgae biomass with a balanced DHA-to-EPA ratio with increased productivity compared to monocultures. This study evaluates whether other golden-brown (Isochrysis galbana) and green microalgae (Nannochloropsis oceanica, Microchloropsis gaditana) can enable the phototrophic batch production of omega-3 fatty acids in a nutritionally balanced ratio in co-culture. All co-cultivations applying a physically dynamic climate simulation of a repeated sunny summer day in Australia in LED-illuminated flat-plate gas lift photobioreactors resulted in increased biomass concentrations compared to their respective monocultures, achieving balanced DHA-to-EPA ratios of almost 1:1. Using urea instead of nitrate as a nitrogen source increased the EPA content by up to 80% in all co-cultures. Light spectra measurements on the light-adverted side of the photobioreactor showed that increased biomass concentrations in co-cultures could have been related to enhanced light use due to the utilization of different wavelengths of the two microalgae strains, especially with the use of green light (500–580 nm) primarily by golden-brown microalgae (I. galbana) and orange light (600–620 nm) predominantly used by green microalgae (N. oceanica). Phototrophic co-cultivation processes thus promise higher areal biomass yields if microalgae are combined with complimentary light-harvesting features.

1. Introduction

In recent years, microalgae have become a promising source of pharmaceutical and nutraceutical compounds. Marine microalgae, particularly, have demonstrated the ability to produce proteins, carotenoids, and lipids, including the long-chain polyunsaturated omega-3-fatty acids docosahexaenoic acid (DHA, C22:6) and eicosapentaenoic acid (EPA, C20:5) [1,2]. DHA and EPA are bioactive compounds and are beneficial for humans in preventing and treating several diseases, such as cardiac, cardiovascular, and inflammatory diseases [3,4]. The recommended daily human intake of DHA and EPA is approx. 250–500 mg in total. Considering this requirement, 1.4 million tonnes of omega-3 fatty acids need to be supplied by aquaculture, fisheries, and other marine sources [5,6].
This demand will further increase due to the continuous population growth. Current estimates indicate that only 0.8 million tonnes of DHA/EPA are supplied via aquaculture annually, resulting in an enormous gap in demand and supply [3]. Additionally, a global survey highlighted the substantial deficiency of DHA and EPA worldwide, especially in North America, Europe, and Brazil [7]. Global warming, rising sea levels, and a plateau in sustainable fish stocks exacerbated the global supply, emphasizing the need for alternative sustainable sources [8,9].
The phototrophic production of omega-3 fatty acids with marine microalgae provides an alternative source of DHA and EPA. Further, CO2 capture, a lack of competition for arable land, and the use of natural sunlight and saline water are other advantages offered by microalgae processes performed in economically feasible large-scale outdoor photobioreactors [10,11,12]. Promising microalgae strains with high DHA or EPA contents are, for example, Isochyrsis galbana, Tisochyrsis lutea, Nannochloropsis sp., and Pavlova sp. None of these microalgae can produce omega-3 fatty acids in a nutritionally balanced ratio [13,14,15,16].
The marine microalga Isochrysis galbana is widely used in aquaculture to produce lipids, especially the omega-3 fatty acid DHA [17,18,19]. The golden-brown microalgae belongs to Haptophyta and lacks a cell wall. The absence of a cell wall increases the digestibility of fish and thus improves feed applications. It can also reduce energy requirements in downstream processing due to the increased extractability of the fatty acids [20,21].
The marine green microalgae Nannochloropsis sp. belongs to the class of Eustigmatophyceae. Many studies observed high lipid accumulation, including the omega-3 fatty acid EPA with up to 50 mgEPA gDW−1 [22,23]. Nannochloropsis sp. was already cultivated outdoors on a large scale, achieving high cell densities, and this microalgae is accepted as a food supplement in many countries [4,24,25].
Other microorganisms, such as Pythium sp. (oomycete) or brown macroalgae, have also lately been shown to be promising alternative EPA producers [26]. Further, the heterotrophic production of omega-3 fatty acids with marine microorganisms, such as Schizochytrium spp. and Cryptecodinium cohnii, results in high PUFA (polyunsaturated fatty acid) contents. Lee Chang et al. (2014) [27] reported a total DHA content of up to almost 70% of total fatty acids with the strain Thraustochytrium sp. using glucose as a carbon source. Despite high DHA concentrations in heterotrophic processes, Schizochytrium and Cryptecodinium generally lack the production of EPA [9]. In addition, the heterotrophic production of omega-3 fatty acids is relatively expensive [8].
Photoautotrophic microalgae processes would be easily scalable in open photobioreactors, making them more economical [28]. High DHA and EPA contents of the biomass, along with the simultaneous phototrophic production of these two omega-3 fatty acids, is possible by producing either EPA or DHA-enriched microalgae biomass and mixing them or through the co-cultivation of suitable EPA and DHA producers. As the recommended human intake of DHA and EPA is in a balanced ratio of 1:1, a nutritionally valuable food supplement should contain similar amounts of DHA and EPA [29]. The phototrophic co-cultivation of the golden-brown microalgae T. lutea (DHA producer) with the green microalgae Microchloropsis salina (EPA producer) was recently studied in a flat-plate gas lift photobioreactor with LED illumination. A balanced DHA-to-EPA ratio (26 ± 2 mgDHA gCDW and 23 ± 4 mgEPA gCDW) was achieved after a process time of 8 days applying a dynamic climate simulation of a repeated summer day in Australia [30]. Furthermore, the biomass and DHA areal productivity in co-culture increased by 31% and 33%, respectively, compared to two monocultures of the same microalgae strains.
Microalgae accumulate omega-3 fatty acids mainly under nitrogen-replete conditions in their exponential growth phase, as PUFAs are part of their cell membranes, and their formation is crucial for cell growth [31,32]. Increasing biomass growth through improved process conditions may thus enhance DHA and EPA contents in phototrophic microalgae cultivation processes.
Environmental factors, such as light, temperature, pH, salinity, CO2-availability, and nutrients, impact microalgae growth [33]. Nitrogen accounts for 4–8% of the dry weight of microalgae and is crucial for synthesizing proteins, chlorophyll, energy transfer molecules, and genetic material [34]. Typical nitrogen sources for microalgae cultivation are nitrate, ammonium, and urea, while nitrate is the conventional nitrogen source because it is the most stable compound in oxidized aqueous environments [35]. Nevertheless, increased biomass formation by microalgae has been associated with the use of urea [36,37]. Schädler et al. (2020) [38] observed increased phototrophic biomass productivity with M. salina in high-density phototrophic microalgae processes with water recycling using urea instead of potassium nitrate, preventing microalgae growth inhibition due to K+ ion accumulation. In addition, urea and ammonia are much cheaper than nitrate, possibly reducing the overall cost of large-scale microalgae processes.
This study evaluates whether the previously described simultaneous production of DHA and EPA with a phototrophic co-cultivation process involving the golden-brown microalgae T. lutea with the green microalgae M. salina could be transferred to other combinations of golden-brown and green marine microalgae strains, resulting in the same advantages regarding their biomass growth and omega-3 fatty acid production. Additionally, we investigated the effect of the nitrogen source urea on biomass and omega-3 fatty acid production.
We studied the phototrophic mono- and co-cultivation of the golden-brown microalgae I. galbana (DHA producer) and the green microalgae M. salina, employing different nitrogen sources (nitrate and urea). Further, we used I. galbana as the DHA-producing strain and co-cultivated it with two other EPA-producing green microalgae strains from the genus Nannochloropsis sp. (N. oceanica and M. gaditana). To explore the potential scalability of these processes to larger outdoor conditions, we applied a dynamic climate simulation of a repeated summer day in Australia (day–night cycles of incident light (PAR) and temperature) for all batch processes performed in flat-plate gas lift photobioreactors with LED illumination.
To test the hypothesis of increased biomass growth in co-culture due to improved light utilization, we measured the remaining light spectra on the light-adverted side of the flat-plate gas lift photobioreactor at different process times and biomass concentrations, both in monoculture and co-culture. The collected data aim to elucidate which microalgae strain utilizes which wavelengths preferentially to identify differences observed in both mono- and co-cultures.

2. Materials and Methods

2.1. Microalgae Strains, Seed Culture Maintenance, and Media Composition

The golden-brown marine microalgae Isochrysis galbana CL153180 was obtained from the Carolina Biological Supply Company (Burlington, NJ, USA) and served as a DHA producer. For EPA production, the marine green microalgae strain Microchloropsis salina SAG 40.85 was purchased from the Culture Collection of Algae at the University of Göttingen (Göttingen, Germany), while Nannochloropsis oceanica CCAP849/10 and Microchlorosis gaditana CCAP849/5 were obtained from the Culture Collection of Algae and Protozoa from the Scottish Association for Marine Science (Argyll, UK). Microalgae strains were maintained in 100 mL sterile Erlenmeyer shaking flasks under laboratory light and room temperature. Sterile f/2 media with adapted nitrogen (400 mg L−1) and phosphorus (18 mg L−1) concentrations were used for strain maintenance, seed cultures, and batch processes in flat-plate gas-lift photobioreactors. Na2H2PO4·2H2O served as the phosphorus source, while NaNO3 or urea was the nitrogen source. Artificial seawater with the following composition was used to prepare f/2 media: NaCl (25 g L−1), MgCl2 (5.2 g L−1), NaSO4 (4.09 g L−1), CaCl2 (1.16 g L−1), KCl (0.695 g L−1), NaHCO3 (0.201 g L−1), KBr (0.101 g L−1), H3BO3 (0.027 g L−1) and NaF (0.003 g L−1) (“Sea Salt” ASTM D 1141-98, Lake Products Company, Florissant, MO, USA).

2.2. Pre-Cultures and Process Conditions

Pre-cultures were conducted in 250 mL bubble column reactors using a modified Infors incubator system (Infors, Bottmingen, Switzerland) at a constant temperature of 25 °C and a continuous light irradiance of 83 ± 17 µmol m−2 s−1 [39]. A constant gassing rate of 12 L h−1 with 2% CO2 (v/v) enabled the culture mixing and carbon dioxide supply. Reaching an OD750 of approximately 2–3 (late exponential phase), the cultures were used to inoculate the flat-plate gas-lift photobioreactors, achieving an inoculation OD750 of 0.2. Sterilized 1.8 L flat plate gas-lift photobioreactors (Labfors Lux 5, Infors HT, Bottmingen, Switzerland) equipped with 260 high-performance LEDs with a characteristic spectrum in the visible range of light (400–800 nm) and an illuminated surface area of 0.9 m−2 were used for all described batch processes. A temperature chamber attached to the light-averted side of the PBR ensured temperature control. The light pathway of the reactors was 20 mm. Optical sensors (Easyferm Plus ARC and VisiFerm DO ECS 120 H0, Hamilton Germany GmbH, Hoechst, Germany) permitted pH and dissolved oxygen measurements. Mixing was provided by a constant gassing rate of 2 L min−1, and a constant pH 8.0 was achieved by the controlled addition of CO2 (0–10% (v/v)) when the value exceeded pH 8.2. Due to previously obtained results, an inoculation ratio of 1:3 (DHA-producing strains versus EPA-producing strains) was chosen for all co-cultures [30]. Media for the batch processes contained either 1.8 g L−1 NO3 or 0.85 g L−1 urea as a nitrogen source. As previously described, a daily repeated physically dynamic climate simulation of a sunny summer day in Australia was applied for all batch processes [30]. The chosen target climate was 19 January 2018, in Newcastle, Australia, with a maximal temperature of 30 °C and a maximal incident phototrophic photon flux density (PPFD) of 2000 µmol m−2 s−1 (mean PPFD of 879 µmol m−2 s−1). This particular geographical location has been selected, because the eastern coast of Australia offers a suitable climate for algae growth, characterized by high solar irradiation and a constant daytime temperature of around 30 °C. All conducted co-cultivations are summarized in Table 1.

2.3. Flow Cytometry for Cell Ratio Measurements

The autofluorescence of microalgae facilitated the distinction between the golden-brown microalgae I. galbana and the applied green microalgae strains in co-culture. A flow cytometer (BD FACS Melody Cell Sorter; BD Biosciences, San Jose, CA, USA) was used to determine individual cell counts. Data analysis was carried out using BD FACSChorusTM software (BD Bioscience). An event rate of 1000 events per second was set. The fluorescence intensity of the microalga I. galbana was increased compared to the green microalgae strains when cell samples were excited by a red laser at 640 nm, with emission measurements taken using the 660/10 nm bandpass, allowing for the separation of the two microalgae strains in co-culture. Plotted histograms displayed the cell counts vs the fluorescence intensity in a bi-exponential manner. A specific linear correlation factor between cell counts and the OD750 was established before every co-culture experiment by manually mixing samples with different ratio combinations of both strains characterized by their OD750. The samples were diluted with 25 g L−1 NaCL to obtain an OD750 of 0.2.

2.4. Spectra and Photon Flux Density Measurements

To determine the use of the wavelengths within the photosynthetically active radiation (PAR) range during a process, light spectra measurements (400–700 nm) on the light-adverted side of the flat-plate gas lift photobioreactor were taken five times a day at different light irradiances and biomass concentrations using a miniature spectrometer (Flame, Ocean Optics, Ostfildern, Germany). For comparison, the light spectra of the LEDs on the light-adverted side of the reactor were also obtained when the reactor was filled only with media. The relative absorbance intensity was calculated due to changing light irradiance due to the climate simulation. The low observed intensity within a specific wavelength range was correlated with the strain’s high utilization of those wavelengths and vice versa.

2.5. Determination of Urea and Nitrate

The nitrate concentration was measured using a calorimetric enzyme assay (Nitrite/Nitrate colorimetric method, Roche Diagnostics GmbH, Penzberg, Germany). After 1 mL of the sample was centrifuged at 14,000 rpm for 2 min, the resulting supernatant was diluted with doubled-distilled water to obtain a final concentration in the 0.05–0.3 g L−1 range. The photometric measurement of the nitrate concentration relied on the enzyme nitrate reductase, which enables the reduction of nitrate to nitrite.
The urea concentration of the supernatant of the sample (14,000 rpm, 2 min) was determined photometrically using a urea/ammonium assay (Urea/ammonia, r-biopharm, Darmstadt, Germany) depending on a coupled enzymatic reaction involving urease and glutamate dehydrogenase.

2.6. Determination of Optical Density, Cell Dry Weight, and Salinity

The microalgae suspension’s optical density (OD750) was measured in triplicate using a UV-Vis spectrometer (Genesys 10 UV-Vis, Thermo Fisher, Waltham, MA, USA). Distilled water with 25 g L−1 NaCl served as a blank.
The cell dry weight concentration was determined in triplicate via gravimetric analysis. A defined volume of the microalgae culture was loaded onto a pre-dried and weighed glass microfiber filter (GF/C, Whatman, GE Healthcare, Buckinghamshire, UK). Filters were then rinsed with distilled water, dried at 80 °C for 48 h to ensure mass stability, and reweighed. The weight difference between the loaded and unloaded filters was utilized to calculate the cell dry weight concentration.
Salinity (ppt) was measured using a refractometer (Hanna Instruments, Deutschland GmbH, Vöhringen, Germany).

2.7. Lipid Transesterification and GC Analysis

For the determination of DHA and EPA, 5 mg of pure microalgae biomass, which had been subjected to lyophilization at −50 °C and 0.12 mbar for 48 h (Lyophilizer Alpha 1–2 LD plus, Martin Christ Gefriertrocknungsanlagen GmbH, Osterode am Harz, Germany), was transferred to analysis vials. The exact amount weighed may vary due to different biomass concentrations and the salinity. As previously described, an adapted extraction and transesterification protocol was conducted [40]. Gas chromatography (GC-2010, Shimadzu, Kyoto, Japan) with a fused silica FAMEWAX column (Restek GmbH, Bad Homburg, Germany) was used for fatty acid methyl ester (FAME) separation. Settings regarding the gas chromatography method have already been described [30]. A marine oil mix (Marine Oil FAME Mix, C14:0 to C24:1, Restek, Bad Homburg, Germany) served as an external standard for peak identification, while C12-triacylglyceride (Sigma-Aldrich, St. Louis, MI, USA) was used as an internal standard. The DHA and EPA contents were determined by relating the fatty acid concentration obtained by calculating the ratio of the peak area to the total peak area to the actual cell dry weight concentration.

3. Results and Discussion

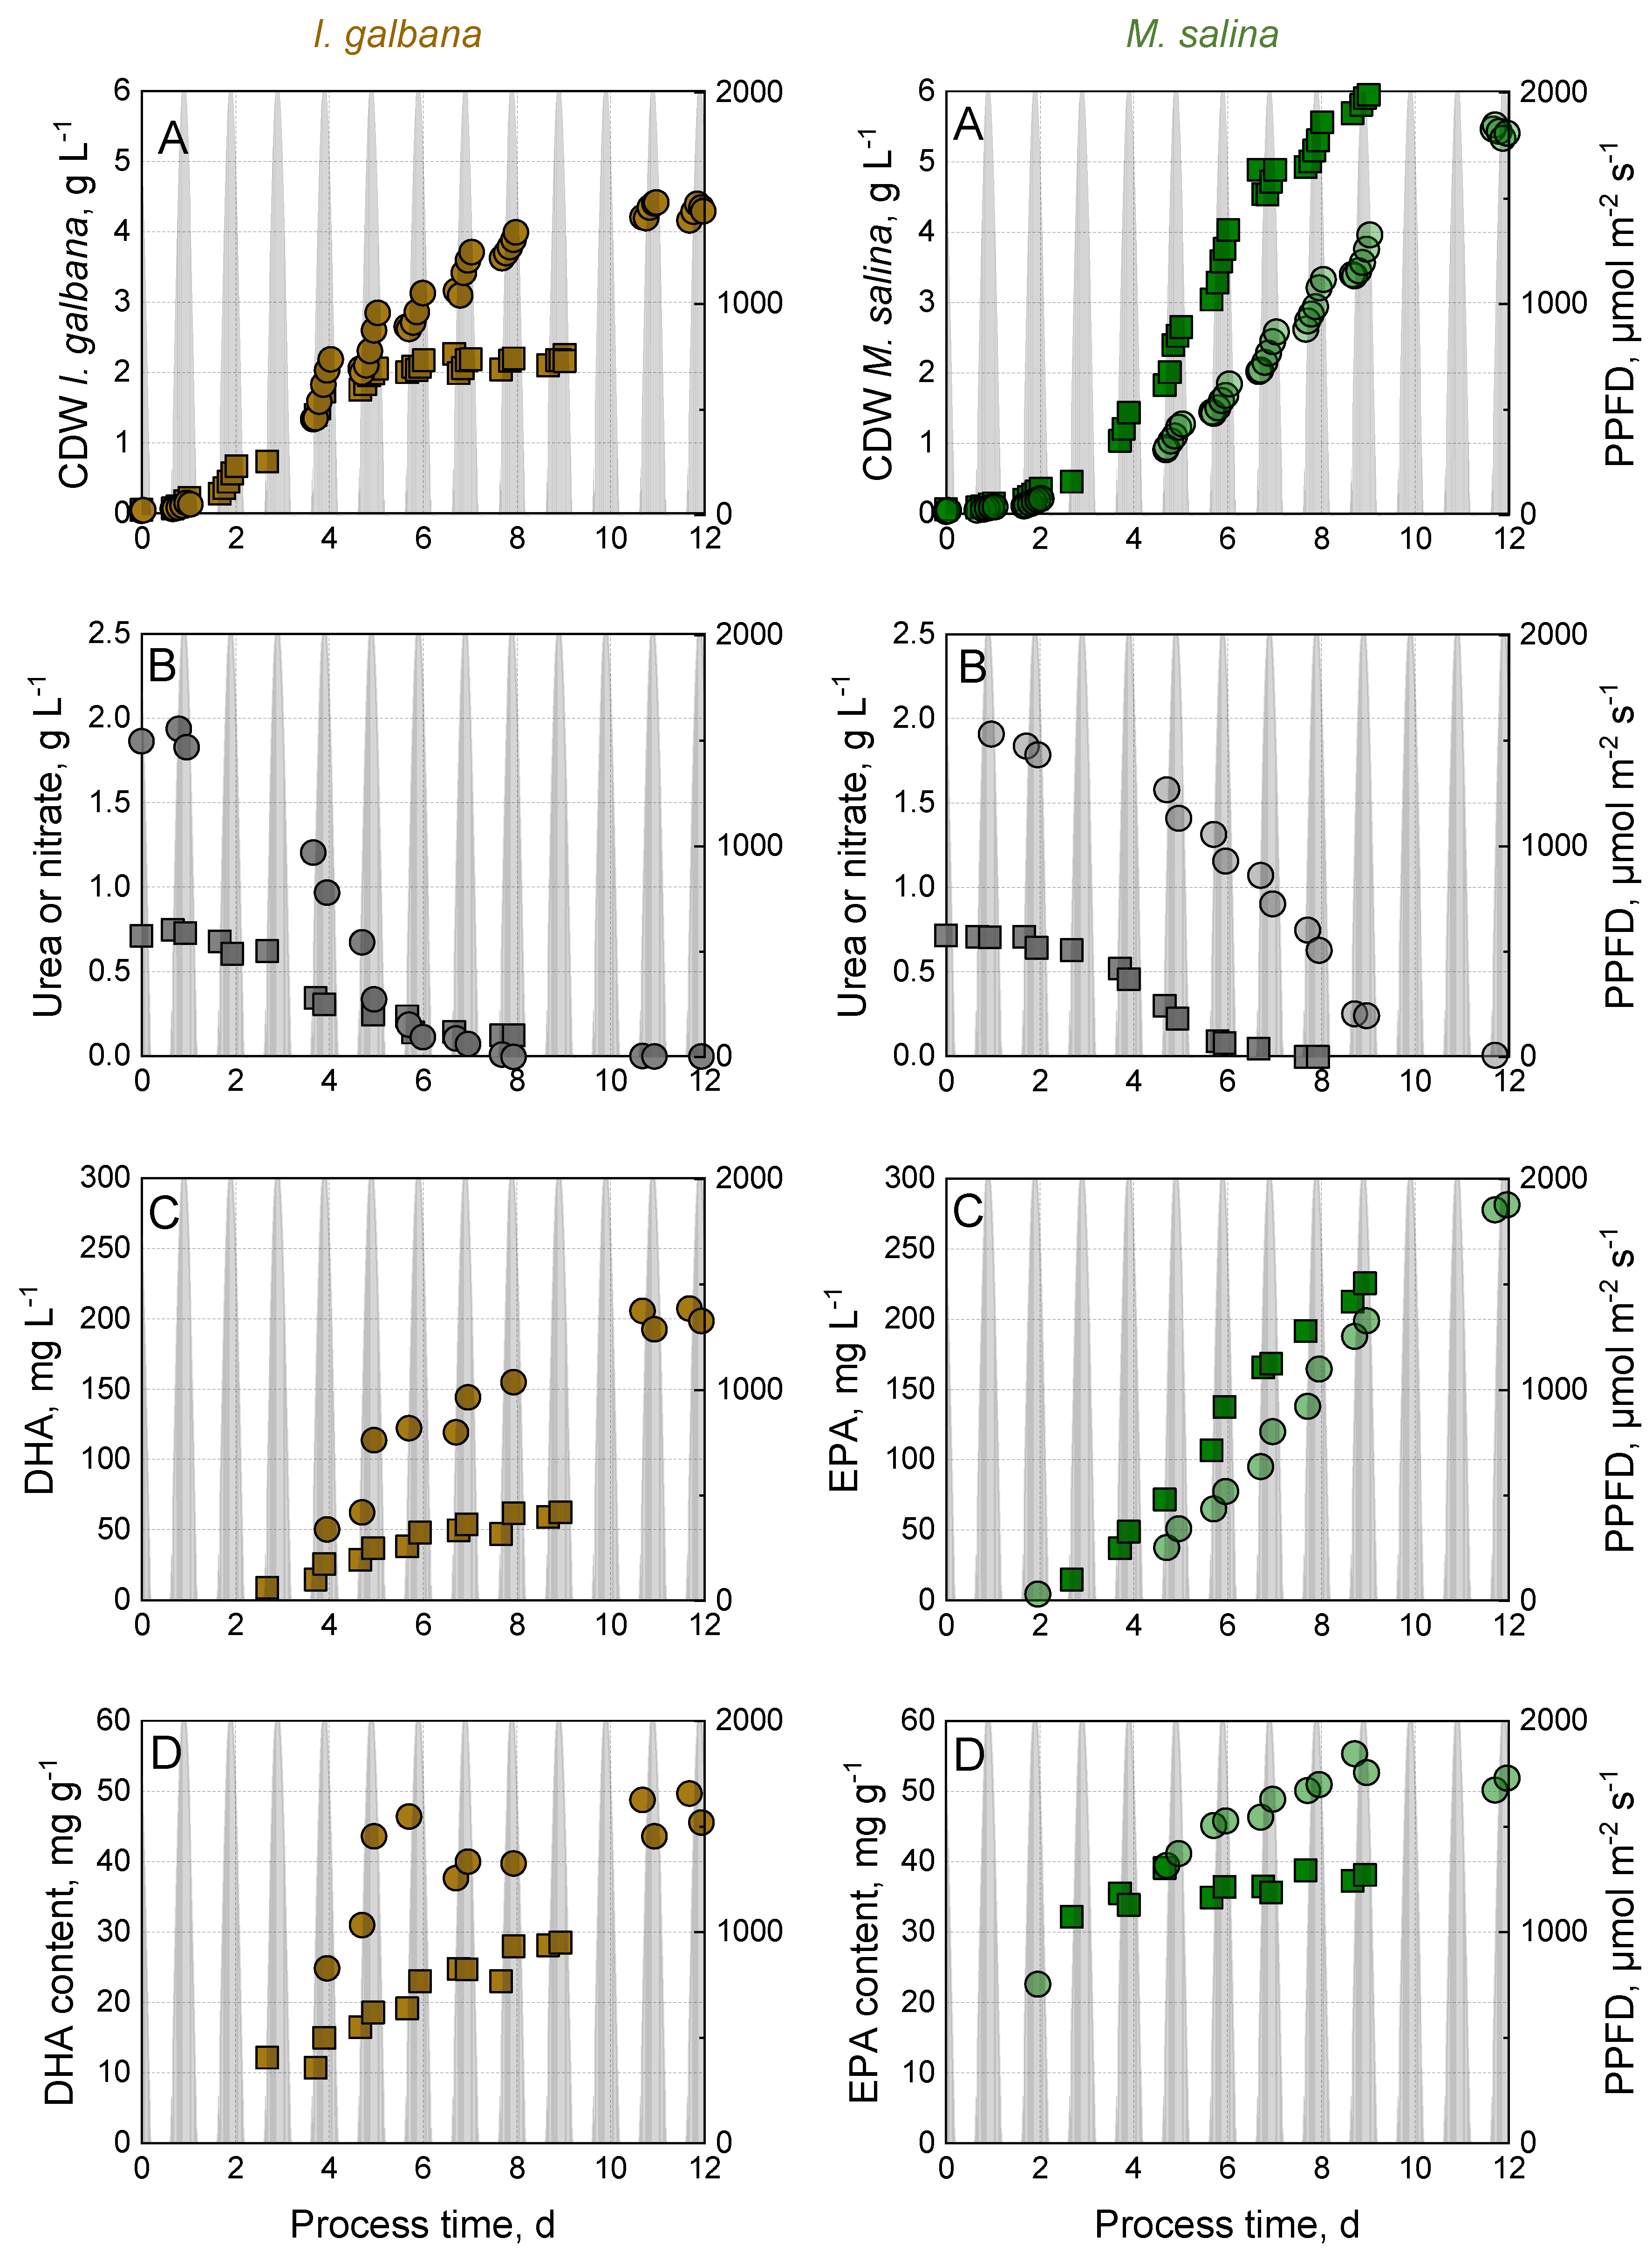
3.1. Effect of Nitrogen Source on Growth and Omega-3-Fatty Acid Production by I. galbana and M. salina in Monoculture

First, we investigated the influence of two different types of nitrogen sources (nitrate and urea) on biomass growth and omega-3 fatty acid production in phototrophic batch processes of monocultures of I. galbana and M. salina using flat-plate gas-lift photobioreactors (Figure 1). A nitrogen concentration of 400 mg L−1 was used. The dynamic climate simulation of a repeated sunny summer day in Australia (day–night cycles of incident light and temperature) was applied in all batch processes. After eight days, the phototrophic batch process with I. galbana using nitrate resulted in a maximal cell dry weight concentration (CDW) of 4.0 g L−1 and a constant DHA content of 39 ± 1 mgDHA gCDW−1. The sustained DHA production was accompanied by the total consumption of the initially supplied nitrate. Since growth kinetics and DHA production by I. galbana were consistent with the literature, we only conducted the monoculture batch processes once [19,41,42]. The use of urea in the phototrophic batch process with I. galbana led to the stationary growth phase after a process time of only 5.7 days, resulting in a constant cell dry weight concentration of 2.2 ± 0.1 g L−1 and a DHA content of up to 29 mgDHA gCDW. A urea concentration of 0.15 g L−1 remained in the medium. Hence, using the same amount of nitrogen, the biomass concentration of I. galbana was doubled using nitrate as a nitrogen source. Furthermore, the cells consumed the total initially supplied nitrate, while the urea usage was only 80%. Regardless of the nitrogen source, the DHA production was observed to be growth-related under nitrogen-replete conditions.
Growth-related DHA production was already observed with the marine golden-brown microalgae T. lutea under the same process conditions as nitrate [30]. No clear trend is reported in the literature regarding the results of using different nitrogen sources with golden-brown microalgae strains. Liu et al. (2013) [43] found similar maximal DHA contents of 17 mg gDW−1 and similar phototrophic growth when using either nitrate or urea as a nitrogen source (200 mg L−1 N) in 100 mL glass bubble photobioreactors with a continuous light illumination of 60 µmol m−2 s−1 employing the same I. galbana strain. Fidalgo et al. (1998) [44] demonstrated an increased growth rate and higher DHA content with urea as a nitrogen source for I. galbana TISO. The cells were cultured in a controlled incubator with a 12:12 h light–dark circle at 115 µmol m−2 s−1 and a constant temperature of 18 °C.
After eight days, the phototrophic batch process with M. salina using urea yielded an increased cell dry weight concentration (5.3 g L−1 instead of 3.2 g L−1) compared to the process with nitrate as a nitrogen source (Figure 1). The initially supplied urea was consumed after 6.7 days. Despite further biomass growth in the batch process utilizing urea, the process was stopped after 8 days because the nitrogen source had already been fully consumed. Comparing both batch processes with different nitrogen sources, the nitrogen usage was 100% with urea, while only 37% of the nitrate was used after eight days. Despite the increased growth rate while using urea, the EPA content was decreased by 30% compared to the phototrophic batch process with nitrate.
A higher cell dry weight concentration using urea instead of nitrate has already been shown with M. salina in open thin layer cascade photobioreactors applying a dynamic climate simulation of a sunny summer day in Almeria, Spain [38]. Further, urea as a nitrogen source yielded the highest cell density of M. salina, comparing five different types of nitrogen sources using open 30 L aquaria and natural sunlight. In this study, the EPA percentage of all fatty acids was also decreased with urea as a nitrogen source [36]. Further, batch processes with M. salina in flat-plate gas-lift photobioreactors applying a very similar climate simulation (south of Spain) were conducted, and comparable results regarding growth kinetics and EPA production were obtained. Regarding this and the consistency of the data with the literature [22], we only conducted the batch processes once.

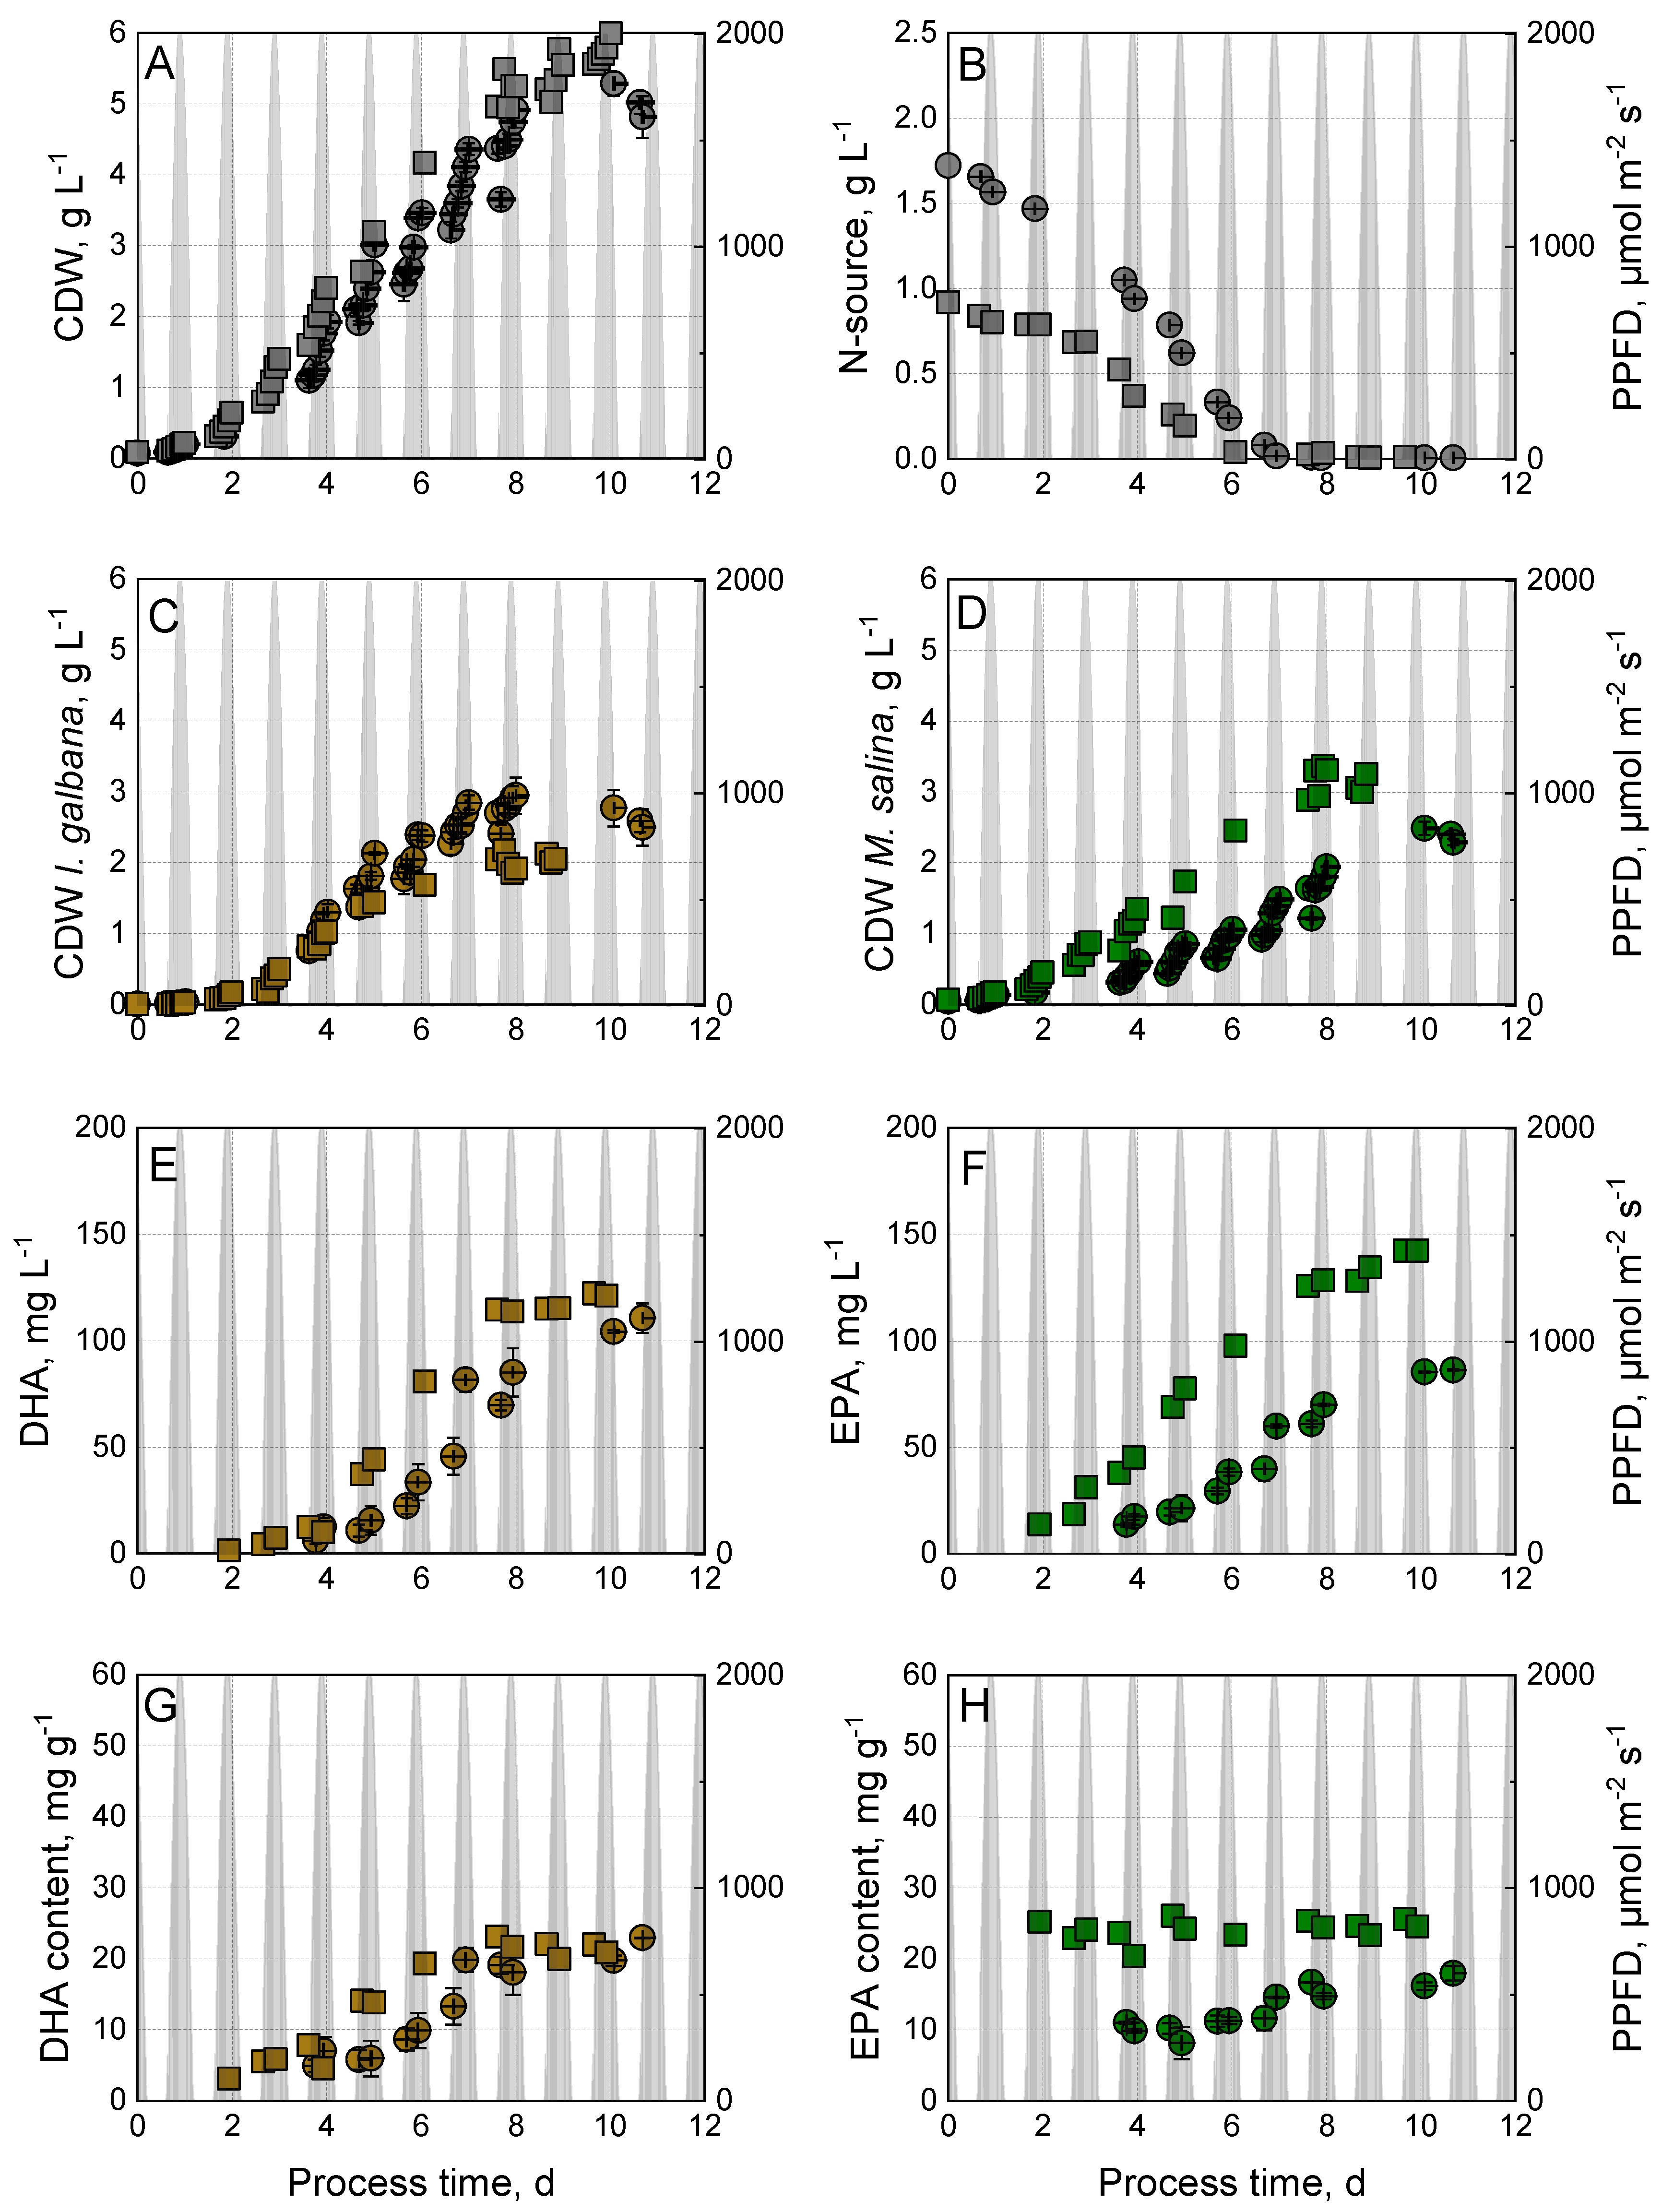
3.2. Effect of Nitrogen Source on Growth and Omega-3-Fatty Acid Production by I. galbana and M. salina in Co-Culture

Nitrate use increased the DHA or EPA content of I. galbana and M. salina in phototrophic monocultures compared to urea as a nitrogen source. To obtain DHA- and EPA-enriched biomass, a phototrophic co-cultivation process of both microalgae strains was conducted using nitrate as a nitrogen source and applying the same process conditions as in the monocultures (Figure 2). An inoculation ratio of 1:3 (I. galbana versus M. salina) was chosen due to the differences in growth rates observed in monocultures (Figure 1).
Figure 2 shows the biomass concentration and the DHA and EPA production with the co-cultivation process as a function of the process time. A maximum CDW concentration of 4.8 ± 0.2 g L−1 was achieved after eight days in the phototrophic co-culture process (Figure 2). The golden-brown microalgae I. galbana reached a 3.0 ± 0.3 g L−1 cell dry weight and entered the stationary growth phase when the initially supplied nitrate was consumed on day seven. The green microalgae M. salina remained in the linear growth phase until day eight, reaching a cell dry weight concentration of 1.9 ± 0 g L−1. The total omega-3-fatty acid concentration was 155.7 mg L−1 (85.5 ± 11 mg L−1 DHA and 70.2 ± 1 mg L−1 EPA) after a process time of 8 days resulting in 20 ± 2 mgDHA gCDW−1 and 16 ± 1 mgEPA gCDW−1. Further biomass growth of M. salina after nitrogen depletion did not increase the EPA content.
The comparison of the phototrophic co-cultivation process with the two individual monocultures shows an increased biomass concentration by 33 ± 4% at day eight based on the same illuminated reactor surface (1:1 mixing of the two monocultures compared to the co-culture). After 8 days, the initially supplied nitrate was consumed, leading us to select this process time for comparing mono- and co-culture processes. The DHA concentration and DHA content in co-culture remained unchanged within the estimation error compared to a mixture of the monocultures (Table 2). In contrast, the EPA concentration and EPA content in co-cultures were significantly lower in co-culture compared to the 1:1 mixture of the monocultures. Compared to the monocultures, an increase in biomass concentration in co-culture has already been observed in phototrophic batch processes with the golden-brown microalgae T. lutea and M. salina [30].
The improved growth of I. galbana in co-culture despite an unfavorable inoculation ratio of 1:3 (I. galbana versus M. salina) led to a dominance of the golden-brown microalgae strain in the photobioreactor and a reduced EPA content compared to the mixture of the two monocultures. The phototrophic growth of M. salina was improved in monoculture with urea as a nitrogen source (Figure 1). Therefore, another co-cultivation process was performed with I. galbana and M. salina using urea as a nitrogen source. For the consistency of the results, the same inoculation ratio of 1:3 (I. galbana versus M. salina) was chosen.
After eight days of cultivation, the phototrophic co-cultivation process with urea reached a total cell dry weight concentration of 5.2 g L−1 (Figure 2). The initial supplied urea was already consumed after a cultivation period of six days, causing the stationary growth phase of I. galbana with a CDW concentration of 2.0 ± 0.1 g L−1. The green microalgae M. salina reached a constant cell dry weight concentration of 3.2 ± 0.2 g L−1 at a cultivation time of 7.6 days. Urea deficiency resulted in a constant DHA content of 22 ± 1 mgDHA gCDW−1. The EPA content remained unchanged throughout the process with 24 ± 1 mgEPA g CDW−1. Stable EPA content with urea as a nitrogen source over the whole process time has already been observed in the phototrophic monoculture with M. salina (Figure 1).
Compared to the co-cultivation process of both marine microalgae strains with nitrate as a nitrogen source, urea resulted in an increased DHA content of the biomass by 22% and an enhanced EPA content by 63%, reaching a similar total biomass concentration (4.8 ± 0.2 g L−1, and 5.0 g L−1, respectively) after a process time of 8 days. A balanced DHA-to-EPA ratio of 0.9 was measured in the microalgae biomass. Thus, urea favored the DHA and EPA production in co-culture.
Conversion of the consumed nitrogen source in ammonia is necessary to form cellular compounds. Microalgae can easily assimilate urea via hydrolysis with urease. On the contrary, nitrate must be reduced to ammonium by nitrate reductase and nitrite reductase. Hence, the utilization of nitrate demands metabolic energy, making it bioenergetically less favorable when compared to reduced nitrogen sources, such as ammonia salts or urea [35,45,46]. High amounts of ammonia can also be toxic for microalgae by inhibiting growth. Unionized ammonia can freely diffuse through lipid membranes and inhibit photosynthesis. Many green microalgae can bind ammonia by containing detoxifying enzymes [47,48]. The toxicity levels of ammonia depend on the microalgae strain [49].
In monoculture, the CDW concentration of I. galbana was reduced by 82% using urea instead of nitrate (Figure 1). This resulted in a decreased DHA content compared to the process with nitrate, suggesting that the high amounts of ammonia, due to the hydrolysis of urea, inhibited growth and limited DHA production. Despite similar CDW concentrations of I. galbana in mono- and co-culture (1.9 g L−1 and 2.2 g L−1), the production of DHA in the co-culture process with M. salina was surprisingly increased by a factor of 3.7 compared to its respective monoculture, resulting in an enhanced DHA content (22 mgDHA gCDW−1) (Table 2). In monoculture, M. salina achieved a 65% higher biomass concentration using urea instead of nitrate. In the co-culture with urea, the biomass concentration was also increased by 66% compared to nitrate, resulting in an enhanced EPA content. The increased DHA production by I. galbana in co-culture may be caused by M. salina assimilating the ammonia, thereby preventing the accumulation of excessive ammonia in the medium.
An additional phototrophic batch process with I. galbana and M. salina in co-culture using ammonia chloride as the nitrogen source (400 mg L−1 nitrogen) led to decreasing CDW concentrations of the I. galbana cells in less than 24 h, while the biomass concentration of M. salina was still increasing. This observation substantiates our hypothesis. As the pH in the batch cultivations was set to pH 8.0 and the pKA of ammonia is 9.25, during the cultivation, a fraction of ammonia was present in the unionized form, which probably led to the death of I. galbana, whereas M. salina was able to detoxify the ammonia [49,50].
A comparison of two monocultures of I. galbana and M. salina with one co-culture using urea and regarding the same illuminated reactor surface (1:1 mixing of the two monocultures compared to the co-culture) revealed clear advantages with the co-culture: the biomass concentration was increased by 33%, the DHA content by 57%, and the EPA content by 23% (Table 3).
The green microalgae strain M. salina is a suitable EPA producer in phototrophic co-cultivation processes with golden-brown microalgae to obtain EPA- and DHA-enriched microalgae biomass. Co-cultivations with T. lutea [30] or I. galbana resulted in an increased biomass concentration in the co-culture, achieving a balanced ratio of DHA to EPA. Subsequently, our focus shifted towards validating the co-cultivation concept of combining green and golden-brown microalgae involving the DHA-producing golden-brown microalgae I. galbana paired with other EPA-producing green microalgae strains. Other promising EPA producers include microalgae strains from the genus Nannochloropsis, such as Nannochloropsis oceanica or Microchloropsis gaditana [4].

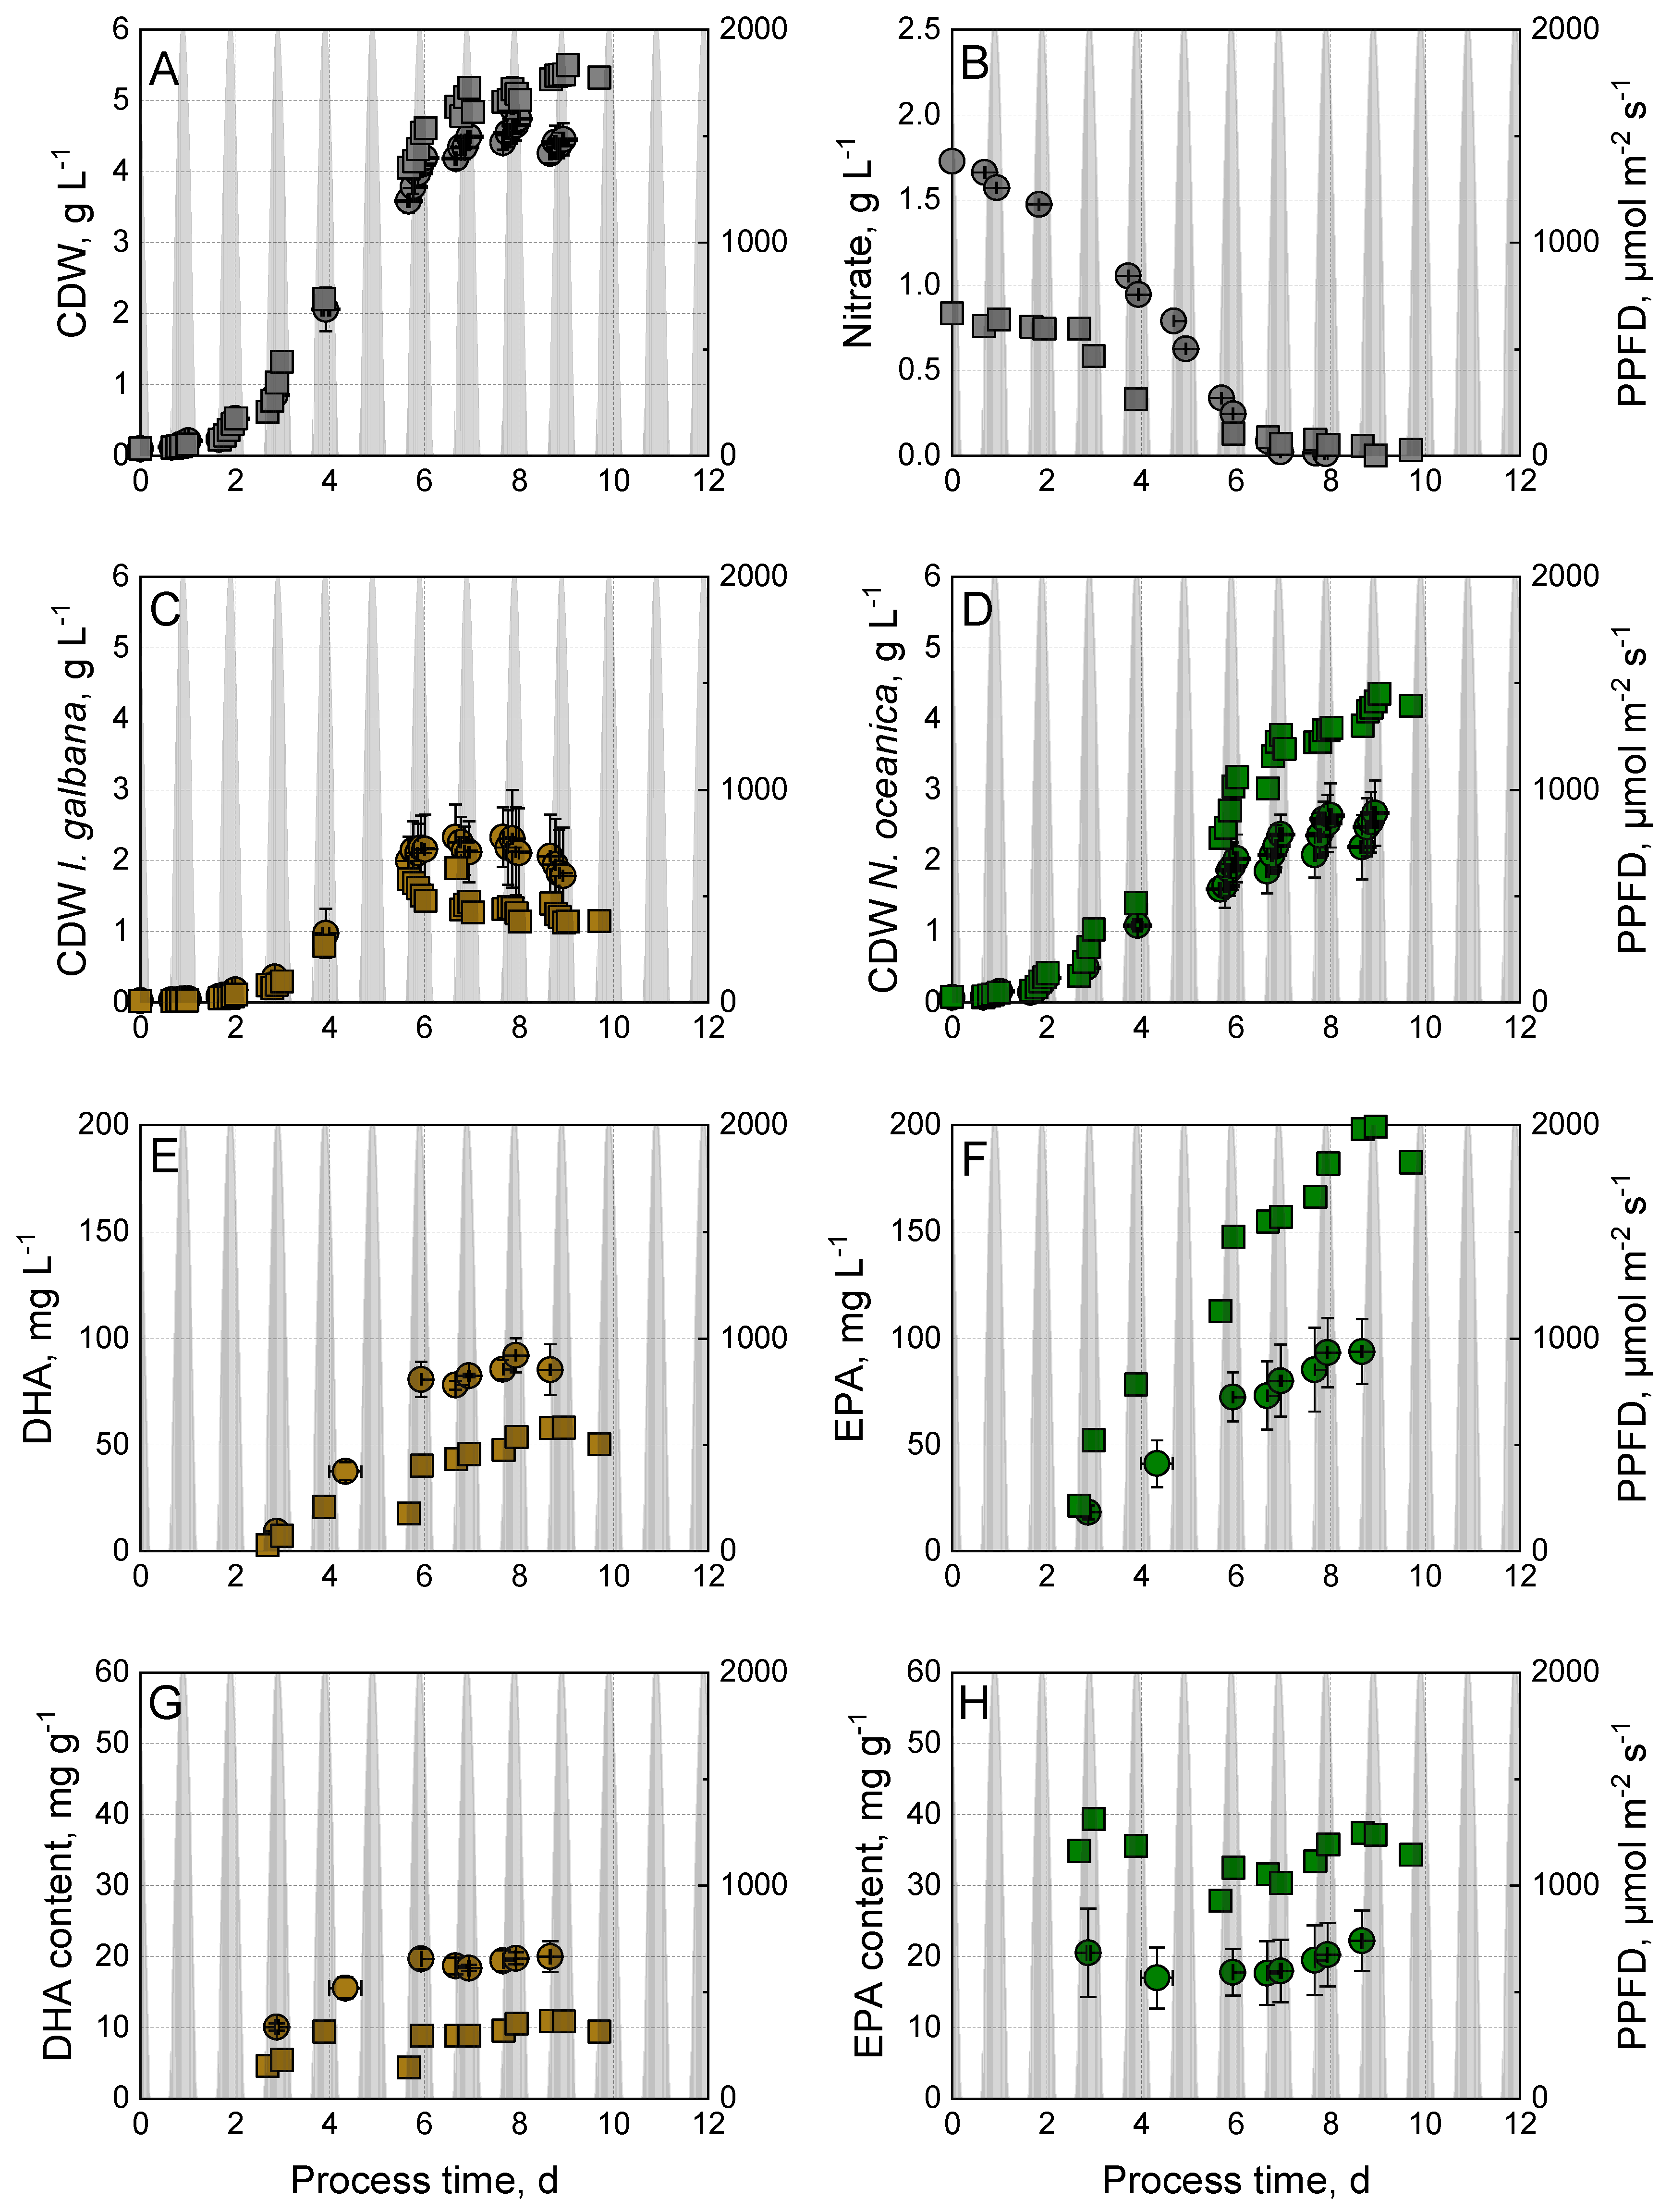
3.3. Phototrophic Co-Culture of I. galbana and N. oceanica Using Nitrate or Urea

The general concept of the co-cultivation of a DHA- and an EPA-producing strain should be proven with other microalgae strains. Therefore, a phototrophic batch process was performed with I. galbana as a DHA producer and N. oceanica as an EPA producer with nitrate by applying the same process conditions (n = 2). In addition, the same inoculation ratio of 1:3 (I. galbana versus N. oceanica) was chosen. Figure 3 shows the dynamics of the biomass concentration and the DHA and EPA of the co-cultivation process. An additional phototrophic batch process with N. oceanica was conducted with nitrate using the same process conditions as the previously described monocultures.
In co-culture, total consumption of the initially supplied nitrate was observed after a process time of 6.7 days, resulting in a constant biomass concentration of 4.5 ± 0.2 g L−1 (Figure 3).
I. galbana entered its stationary growth phase already after a process time of 5.7 days at a CDW concentration of 2.1 ± 0.2 g L−1. Despite nitrate depletion, the marginal growth of N. oceanica was observed, reaching a maximal cell dry weight concentration of 2.7 ± 0.5 g L−1 on day 9. Due to the declining biomass concentration of I. galbana, the phototrophic batch process was finished after nine days.
Regarding the omega-3-fatty acid production at a process time of 8 days, a balanced DHA-to-EPA ratio of 1:1 (20 ± 1 mgDHA gCDW−1 and 22 ± 4 mgEPA gCDW−1) was achieved.
The comparison of the two monocultures (1:1 mixture) with the co-culture based on the same illuminated reactor surface showed an increased biomass concentration of 18% ± 4% in co-culture and similar DHA content (Table 4). In monoculture, N. oceanica produced high amounts of EPA (maximal EPA content: 57 mgEPA gCDW−1). The EPA content of the microalgae biomass in co-culture seems to be reduced by 22 ± 20%, but the estimation error is high. Nevertheless, the phototrophic co-culture process led to higher biomass concentrations with a balanced DHA-to-EPA ratio of 1:1.
Chen et al. (2018) [32] also reported a high EPA content of 41.4 mgEPA gCDW−1 with N. oceanica CY2 and NaNO3 as a nitrogen source using 5 L plastic bags at a constant temperature of 25 °C and an aeration with 2% CO2. Meng et al. (2015) [51] showed an EPA content of 52.3 mgEPA gCDW−1 with N. oceanica IMET1 using 500 mL glass bubble column reactors at a constant temperature of 25 °C and a 14:10 h day–night light cycle.
The biomass growth and EPA production of N. oceanica in co-culture were similar to those of M. salina in the co-culture process with T. lutea [30]. After a process time of 8 days, a higher biomass concentration of 4.7 ± 0.2 g L−1 was achieved compared to the co-cultivation process with T. lutea and M. salina (4.2 ± 0.3 g L−1).
The same phototrophic co-cultivation process with an inoculation ratio of 1:3 (I. galbana versus N. oceanica) was performed in flat-plate gas-lift photobioreactors substituting nitrate with urea (Figure 3). A constant biomass concentration of 5.1 ± 0.1 g L−1 CDW was achieved after a process time of 6.7 days. Under urea-replete conditions, I. galbana reached a maximal cell dry weight concentration of 1.8 g L−1, followed by a decline to 1.3 ± 0.1 g L−1. N. oceanica reached a maximal CDW concentration of 4.4 g L−1 on day 9. A constant DHA content of 10 ± 1 mgDHA gCDW−1 was measured, while the average EPA content over the whole process time was 34 mgEPA gCDW−1. An increase in DHA productivity, as was observed in the phototrophic co-culture process of I. galbana and M. salina, was not measured with I. galbana and N. oceanica. Nevertheless, the use of urea enhanced the EPA content of the microalgae biomass by 80% compared with the co-culture applying nitrate as the nitrogen source. Furthermore, more biomass was produced with urea.

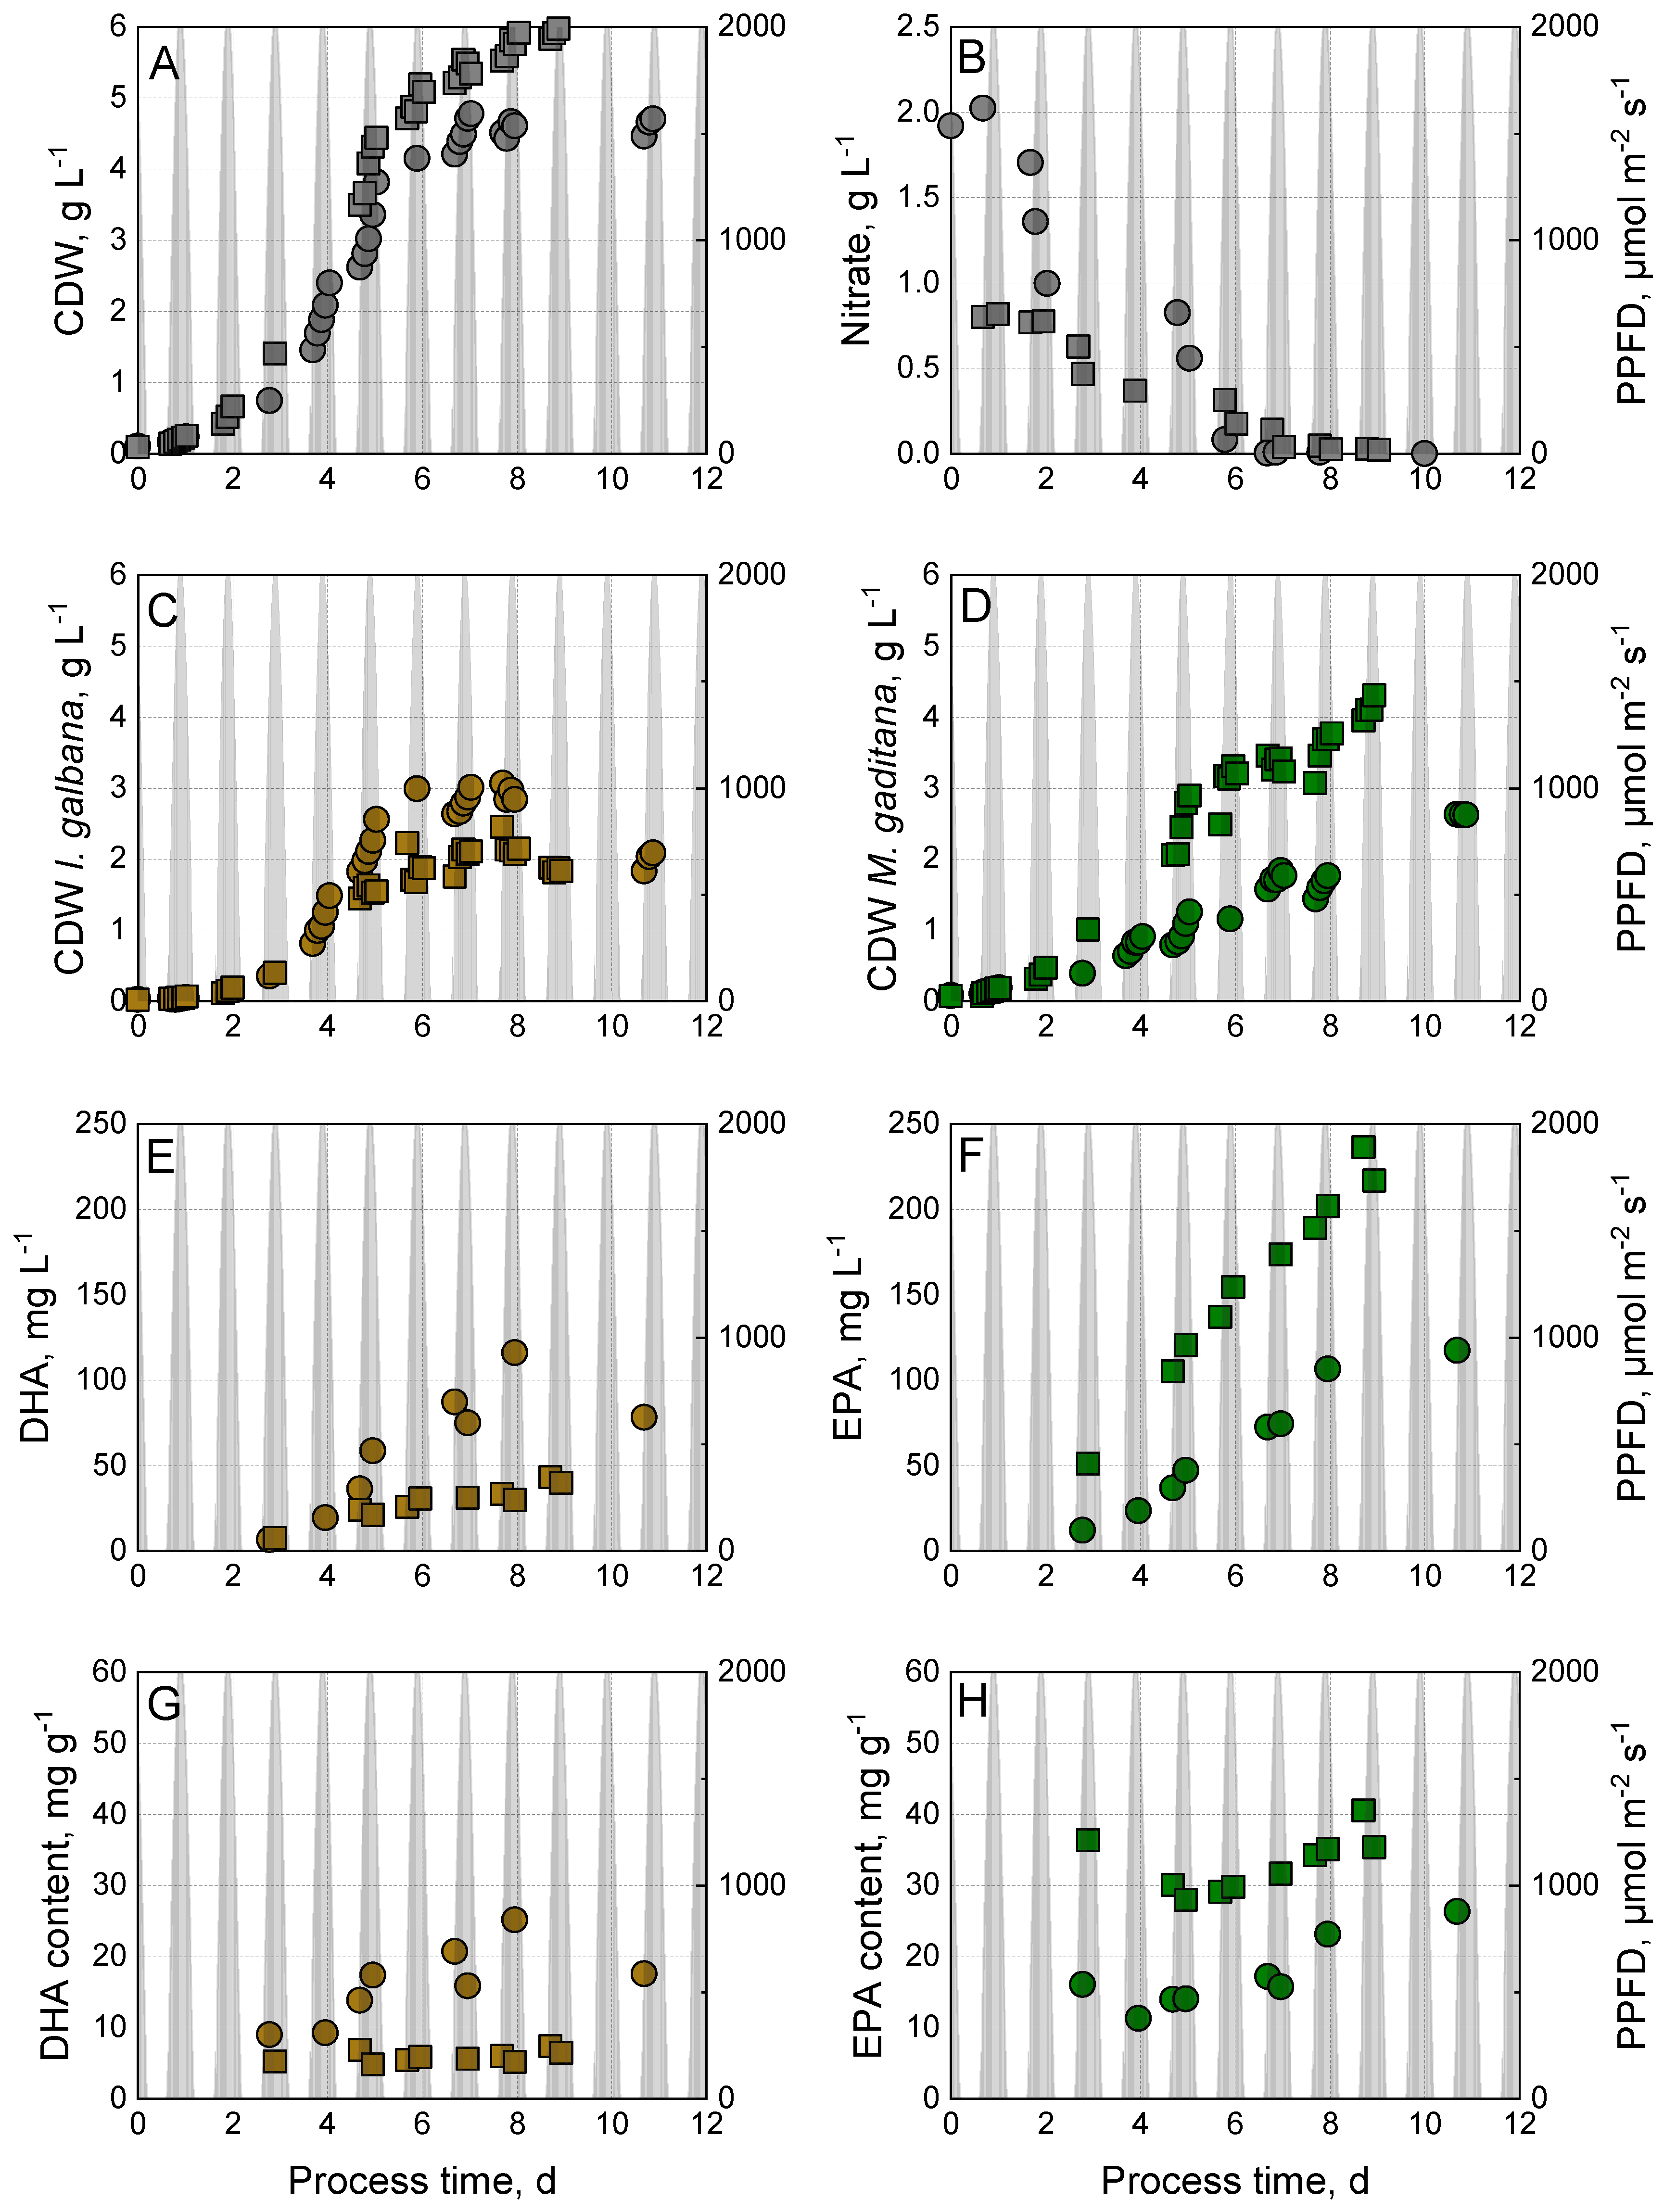
3.4. Phototrophic Co-Cultivation of I. galbana and M. gaditana Using Nitrate or Urea

Another co-cultivation process using I. galbana as a DHA producer and M. gaditana as an EPA producer was conducted in flat-plate gas-lift photobioreactors applying the same process conditions as before (Figure 4). Nitrate and urea were tested as nitrogen sources.
After a cultivation time of 8 days, a cell dry weight concentration of 4.6 g L−1 was measured with nitrate as a nitrogen source. The initially supplied nitrate was consumed after six days, leading to the stationary growth phase of I. galbana with a CDW concentration of 2.7 ± 0.4 g L−1. On day ten, the biomass concentration of I. galbana declined. M. gaditana reached its maximal cell dry weight concentration on day 11 (2.6 g L−1 CDW). On day eight, 64% (w/w) of the microalgae in the reactor were I. galbana. Nevertheless, the dominance of the golden-brown microalgae strain did not result in an unbalanced DHA-to-EPA ratio (25 mgDHA gCDW−1 and 23 mgEPA gCDW−1). The comparison of the co-culture with a 1:1 mixture of the two monocultures resulted in an enhanced biomass growth of 15%, an increased DHA content of 25%, and similar EPA production (Table 5). The phototrophic co-culture of I. galbana and M. gaditana using urea as a nitrogen source resulted in a non-balanced ratio of DHA to EPA with seven times more EPA than DHA (5 mgDHA gCDW−1 and 35 mgEPA gCDW−1, respectively) (Figure 4). After eight days, a high biomass concentration of 5.8 g L−1 CDW was reached. Ren et al. (2014) [37] reported an increased growth rate of the marine microalgae Nannochloropsis gaditana replacing nitrate with urea in f/2 media in 1 L Erlenmeyer flasks at a constant temperature of 24 °C and a light intensity of 220 µmol m−2 s−1.

3.5. Comparison of Phototrophic Co-Culture Processes with Golden-Brown Microalgae (DHA Producer) and Green Microalgae (EPA Producer)

In this study, we showed the simultaneous production of DHA and EPA by co-culturing I. galbana as a DHA-producing microalgae strain with varying green EPA-producing microalgae strains (M. salina, N. oceanica, and M. gaditana) applying a physically simulated climate simulation of a sunny summer day in Australia in flat-plate gas lift photobioreactors with LED illumination. The results are summarized in Table 6.
All co-cultivation processes achieved high total cell dry weight concentrations of around 5 g L−1. Furthermore, all co-culture processes led to an increase in biomass productivity compared to their monocultures.
Using urea enhanced the biomass concentration in all batch processes due to the higher biomass productivity of the EPA-producing green microalgae strain. Higher biomass concentrations in phototrophic batch processes with Nannochloropsis strains using urea compared to nitrate are consistent with results reported in the literature [24,36].
Previously, we showed a phototrophic co-cultivation process with the golden-brown microalgae T. lutea and the green microalgae M. salina, achieving DHA and EPA contents in the biomass in a balanced ratio (26 ± 2 mgDHA gCDW and 23 ± 4 mgEPA gCDW). Combining the golden-brown microalgae I. galbana with either M. salina (urea) or M. gaditana (nitrate) showed similar high DHA and EPA contents in the biomass at increased biomass concentrations (marked in grey in Table 6). Using urea resulted in highly increased EPA contents using I. galbana with either M. salina, N. oceanica, or M. gaditana of 22%, 80%, and 52%, respectively.

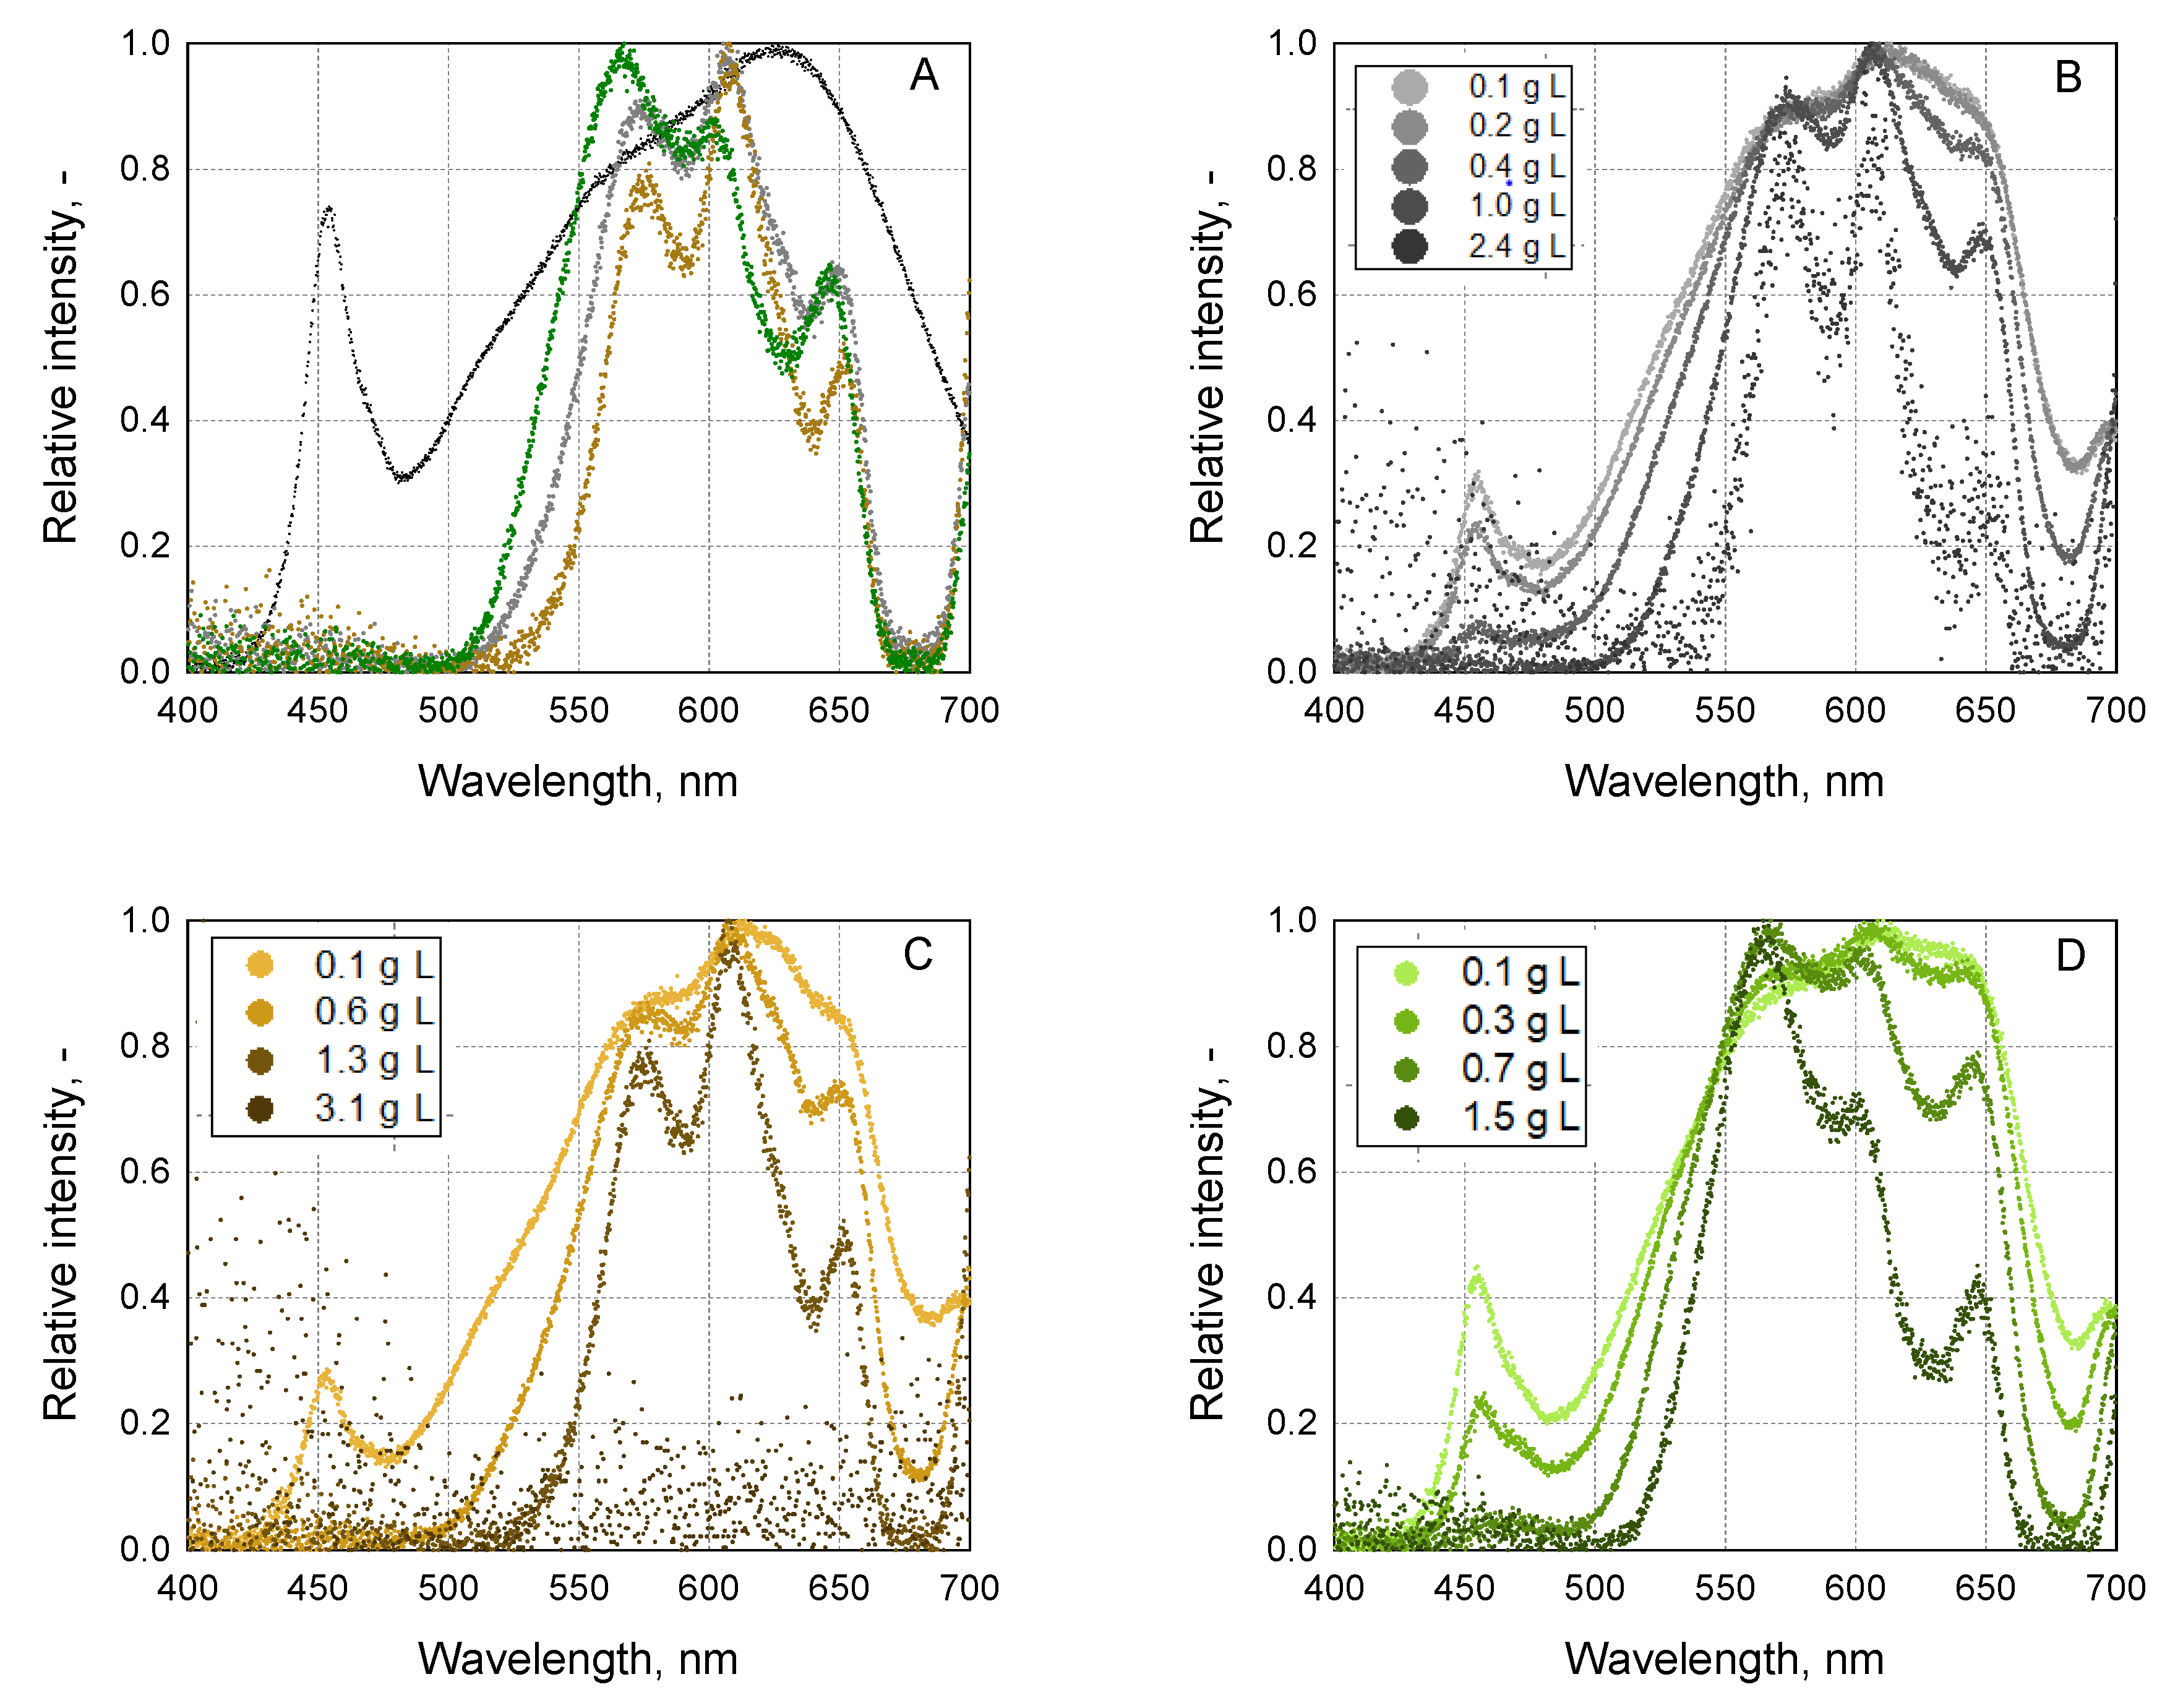
3.6. Enhanced Light Utilization in Co-Cultures of Golden-Brown and Green Microalgae

All phototrophic co-cultivation batch processes showed increased biomass growth compared to their monocultures. We suggested that this increase is due to enhanced light utilization using different wavelengths of the two phylogenetically different microalgae strains. To substantiate this hypothesis, light spectra measurements (relative intensity in the range of 400–700 nm) on the light-adverted side of the flat-plate gas lift photobioreactor at different biomass concentrations and process times were performed to obtain more information about the use of wavelengths in monocultures and co-cultures. A reduced absorption intensity in specific wavelength ranges was used as an indicator of the high absorption of these wavelengths by the microalgae and, therefore, a high light utilization. The spectra of the LEDs (PAR) measured on the light-adverted side of the photobioreactor solely filled with medium is shown as a reference (black line). Due to variations in the biomass concentration and light irradiance, the relative intensity is displayed. Figure 5 shows the results of the light spectra measurements during the co-cultivation of I. galbana and N. oceanica as an example. Similar results have been obtained with the other co-cultivations.
Figure 5A shows the light spectra obtained from I. galbana and N. oceanica in monoculture and co-culture at the same biomass concentration of 1.1 ± 0.2 g L−1 CDW and the same incident photon flux density of 2000 µmol m−2 s−1. I. galbana indicated enhanced light absorption within the wavelengths from 500 to 580 nm compared to N. oceanica. Within this range, the co-culture showed an absorption intensity falling between the two monocultures. In the 600–620 nm wavelength range, N. oceanica showed increased light absorption, while I. galbana did not use these wavelengths. In co-cultivation, the use of this wavelength range resembled that of I. galbana in monoculture. Dark red light (wavelength 640 nm) was observed to be used by the microalgae I. galbana. In this range, N. oceanica in monoculture and the co-culture process showed a decreased absorption intensity (=low use). In summary, the light spectra measurement revealed a clear difference in the wavelength use of the two microalgae strains in monoculture, especially for green, orange, and dark red light. The co-culture spectra showed characteristics of both spectra obtained in monocultures. Hence, we suggest the utilization of complementary wavelengths of light in co-cultivation, potentially leading to increased light absorption and improved biomass yields.
The golden-brown microalgae T. lutea, a marine microalgae strain with high genetic similarity to the strain I. galbana used in this study, as well as the microalgae strain Isochyrsis aff galbana, are known for their high content of the carotenoid fucoxanthin [21,52,53,54]. Fucoxanthin, chlorophyll a/c, and proteins form a complex called FCP in the thylakoid membrane [55]. Bound in a complex, the fucoxanthin absorption spectrum is extended from 450–540 nm in solution to 390–580 nm [56]. The high fucoxanthin content of the microalgae I. galbana compared to N. oceanica may explain the decreased absorption intensity of these wavelengths (500–580 nm) and, therefore, the enhanced use of the PAR in this range in monoculture. The use of green light by the strain Isochyrsis galbana has already been shown in literature; Li and Liu (2020) [57] reported an increase in the photosynthetic efficiency by using green light, indicating that green light promoted the photosynthesis of the strain Isochrysis galbana.
Figure 5B–D shows the light utilization with increasing biomass concentrations at varying process times of I. galbana in monoculture, of N. oceanica in monoculture, and of I. galbana and N. oceanica in co-culture (light spectra measurements at the highest incident light irradiation of 2000 µmol m−2 s−1). In both monocultures and the co-culture, there was no detection of blue (400–500 nm) or dark red light (680–700 nm) on the light-averted side of the photobioreactor when the biomass concentration exceeded 1 g L−1 CDW. Both microalgae strains prefer these wavelengths.
This preferred use of blue (400–500 nm) and red light (from 650 nm) has already been observed by Keeling (2013) [58] based on their pigment content. Further, the most significant differences in light use with increasing biomass concentrations were found in the absorption of green light (500–580 nm) (primarily by I. galbana) and orange light (600–620 nm) predominantly used by N. oceanica).

4. Conclusions

The photoautotrophic co-cultivation of golden-brown microalgae (DHA-producer) and green microalgae (EPA producer) to provide microalgae biomass with these omega-3 fatty acids simultaneously and in a balanced ratio is beneficial as more biomass can be produced per illuminated area compared to monocultures of these microalgae, most probably due to a complimentary and, therefore, enhanced light utilization in co-culture. This has been shown, so far, for varying combinations of golden-brown microalgae (T. lutea, I. galbana) and green microalgae (M. salina, N. oceanica, M. gaditana). Furthermore, the choice of the nitrogen source is important. Using more cost-efficient urea as a nitrogen source increased the DHA and EPA content of the biomass in the phototrophic co-culture process with I. galbana and M. salina by 22% and 63%, respectively, compared to the co-culture process with nitrate. Using urea also enhanced EPA content in the co-cultivation process of I. galbana with either N. oceanica or M. gaditana. Phototrophic co-cultivation processes appear to be a promising approach to achieve higher areal biomass yields if microalgae are combined with complimentary light-harvesting features. This opens the door to more efficient microalgae biomass production with an increased content of complementary bioactive compounds for feed and food applications.

Author Contributions

Conceptualization, A.-L.T. and D.W.-B.; methodology, A.-L.T.; investigation, A.-L.T. and J.S.; discussion and analysis, A.-L.T., J.S. and D.W.-B.; writing—original draft preparation and visualization, A.-L.T.; writing—review and editing, D.W.-B. supervision, project administration, funding acquisition, D.W.-B. All authors have read and agreed to the published version of the manuscript.

Funding

Funding was provided by the Technical University of Munich (TUM), Munich, Germany.

Institutional Review Board Statement

Not applicable.

Informed Consent Statement

Not applicable.

Data Availability Statement

Data are contained within the article.

Acknowledgments

The support of Anna-Lena Thurn by the TUM Graduate School is acknowledged.

Conflicts of Interest

The authors declare no conflicts of interest.

References

  1. Barta, D.G.; Coman, V.; Vodnar, D.C. Microalgae as sources of omega-3 polyunsaturated fatty acids: Biotechnological aspects. Algal Res. 2021, 58, 102410. [Google Scholar] [CrossRef]
  2. Khan, M.I.; Shin, J.H.; Kim, J.D. The promising future of microalgae: Current status, challenges, and optimization of a sustainable and renewable industry for biofuels, feed, and other products. Microb. Cell Factories 2018, 17, 36. [Google Scholar] [CrossRef] [PubMed]
  3. Tocher, D.R. Omega-3 long-chain polyunsaturated fatty acids and aquaculture in perspective. Aquaculture 2015, 449, 94–107. [Google Scholar] [CrossRef]
  4. Chua, E.T.; Schenk, P.M. A biorefinery for Nannochloropsis: Induction, harvesting, and extraction of EPA-rich oil and high-value protein. Bioresour. Technol. 2017, 244, 1416–1424. [Google Scholar] [CrossRef] [PubMed]
  5. Hamilton, H.A.; Newton, R.; Auchterlonie, N.A.; Müller, D.B. Systems approach to quantify the global omega-3 fatty acid cycle. Nat. Food 2020, 1, 59–62. [Google Scholar] [CrossRef]
  6. Aranceta, J.; Perez-Rodrigo, C. Recommended dietary reference intakes, nutritional goals and dietary guidelines for fat and fatty acids: A systematic review. Br. J. Nutr. 2012, 107 (Suppl. S2), S8–S22. [Google Scholar] [CrossRef] [PubMed]
  7. Stark, K.D.; Van Elswyk, M.E.; Higgins, M.R.; Weatherford, C.A.; Salem, N., Jr. Global survey of the omega-3 fatty acids, docosahexaenoic acid and eicosapentaenoic acid in the blood stream of healthy adults. Prog. Lipid Res. 2016, 63, 132–152. [Google Scholar] [CrossRef] [PubMed]
  8. Tocher, D.R.; Betancor, M.B.; Sprague, M.; Olsen, R.E.; Napier, J.A. Omega-3 Long-Chain Polyunsaturated Fatty Acids, EPA and DHA: Bridging the Gap between Supply and Demand. Nutrients 2019, 11, 89. [Google Scholar] [CrossRef]
  9. Oliver, L.; Dietrich, T.; Marañón, I.; Villarán, M.C.; Barrio, R.J. Producing Omega-3 Polyunsaturated Fatty Acids: A Review of Sustainable Sources and Future Trends for the EPA and DHA Market. Resources 2020, 9, 148. [Google Scholar] [CrossRef]
  10. Draaisma, R.B.; Wijffels, R.H.; Slegers, P.M.; Brentner, L.B.; Roy, A.; Barbosa, M.J. Food commodities from microalgae. Curr. Opin. Biotechnol. 2013, 24, 169–177. [Google Scholar] [CrossRef] [PubMed]
  11. Polishchuk, A.; Valev, D.; Tarvainen, M.; Mishra, S.; Kinnunen, V.; Antal, T.; Yang, B.; Rintala, J.; Tyystjärvi, E. Cultivation of Nannochloropsis for eicosapentaenoic acid production in wastewaters of pulp and paper industry. Bioresour. Technol. 2015, 193, 469–476. [Google Scholar] [CrossRef] [PubMed]
  12. Borowitzka, M.A. Culturing microalgae in outdoor ponds. In Algal Culturing Techniques; Andersen, R.A., Ed.; Elsevier/Academic Press: Burlington, VT, USA, 2005; pp. 205–218. [Google Scholar]
  13. Aussant, J.; Guihéneuf, F.; Stengel, D.B. Impact of temperature on fatty acid composition and nutritional value in eight species of microalgae. Appl. Microbiol. Biotechnol. 2018, 102, 5279–5297. [Google Scholar] [CrossRef] [PubMed]
  14. Gu, W.; Kavanagh, J.M.; McClure, D.D. Photoautotrophic production of eicosapentaenoic acid. Crit. Rev. Biotechnol. 2021, 41, 731–748. [Google Scholar] [CrossRef] [PubMed]
  15. Guihéneuf, F.; Stengel, D.B. Interactive effects of light and temperature on pigments and n-3 LC-PUFA-enriched oil accumulation in batch-cultivated Pavlova lutheri using high-bicarbonate supply. Algal Res. 2017, 23, 113–125. [Google Scholar] [CrossRef]
  16. Nogueira, N.; Nascimento, F.; Cunha, C.; Cordeiro, N. Nannochloropsis gaditana grown outdoors in annular photobioreactors: Operation strategies. Algal Res. 2020, 48, 101913. [Google Scholar] [CrossRef]
  17. Sukenik, A.; Zmora, O.; Carmeli, Y. Biochemical quality of marine unicellular algae with special emphasis on lipid composition. II. Nannochloropsis sp. Aquaculture 1993, 117, 313–326. [Google Scholar] [CrossRef]
  18. Wikfors, G.H.; Patterson, G.W. Differences in strains of Isochrysis of importance to mariculture. Aquaculture 1994, 123, 127–135. [Google Scholar] [CrossRef]
  19. Sun, Z.; Wang, X.; Liu, J. Screening of Isochrysis strains for simultaneous production of docosahexaenoic acid and fucoxanthin. Algal Res. 2019, 41, 101545. [Google Scholar] [CrossRef]
  20. Gao, F.; Woolschot, S.; Cabanelas, I.T.D.; Wijffels, R.H.; Barbosa, M.J. Light spectra as triggers for sorting improved strains of Tisochrysis lutea. Bioresour. Technol. 2021, 321, 124434. [Google Scholar] [CrossRef]
  21. Kim, S.M.; Kang, S.-W.; Kwon, O.N.; Chung, D.; Pan, C.-H. Fucoxanthin as a major carotenoid in Isochrysis aff. galbana: Characterization of extraction for commercial application. J. Korean Soc. Appl. Biol. Chem. 2012, 55, 477–483. [Google Scholar] [CrossRef]
  22. Hulatt, C.J.; Wijffels, R.H.; Bolla, S.; Kiron, V. Production of Fatty Acids and Protein by Nannochloropsis in Flat-Plate Photobioreactors. PLoS ONE 2017, 12, e0170440. [Google Scholar] [CrossRef] [PubMed]
  23. Gu, W.; Kavanagh, J.M.; McClure, D.D. Towards a sustainable supply of omega-3 fatty acids: Screening microalgae for scalable production of eicosapentaenoic acid (EPA). Algal Res. 2022, 61, 102564. [Google Scholar] [CrossRef]
  24. Schadler, T.; Caballero Cerbon, D.; de Oliveira, L.; Garbe, D.; Bruck, T.; Weuster-Botz, D. Production of lipids with Microchloropsis salina in open thin-layer cascade photobioreactors. Bioresour. Technol. 2019, 289, 121682. [Google Scholar] [CrossRef] [PubMed]
  25. Rodolfi, L.; Chini Zittelli, G.; Bassi, N.; Padovani, G.; Biondi, N.; Bonini, G.; Tredici, M.R. Microalgae for oil: Strain selection, induction of lipid synthesis and outdoor mass cultivation in a low-cost photobioreactor. Biotechnol. Bioeng. 2009, 102, 100–112. [Google Scholar] [CrossRef] [PubMed]
  26. Russo, G.L.; Langellotti, A.L.; Martín-García, B.; Verardo, V.; Romano, R.; Sacchi, R.; Masi, P. New Biotechnological Production of EPA by Pythium irregulare Using Alternative Sustainable Media Obtained from Food Industry By-Products and Waste. Sustainability 2023, 15, 1147. [Google Scholar] [CrossRef]
  27. Lee Chang, K.J.; Nichols, C.M.; Blackburn, S.I.; Dunstan, G.A.; Koutoulis, A.; Nichols, P.D. Comparison of Thraustochytrids Aurantiochytrium sp., Schizochytrium sp., Thraustochytrium sp., and Ulkenia sp. for Production of Biodiesel, Long-Chain Omega-3 Oils, and Exopolysaccharide. Mar. Biotechnol. 2014, 16, 396–411. [Google Scholar] [CrossRef] [PubMed]
  28. Borowitzka, M.A. Commercial production of microalgae: Ponds, tanks, tubes and fermenters. J. Biotechnol. 1999, 70, 313–321. [Google Scholar] [CrossRef]
  29. Remize, M.; Brunel, Y.; Silva, J.L.; Berthon, J.Y.; Filaire, E. Microalgae n-3 PUFAs Production and Use in Food and Feed Industries. Mar. Drugs 2021, 19, 113. [Google Scholar] [CrossRef] [PubMed]
  30. Thurn, A.-L.; Stock, A.; Gerwald, S.; Weuster-Botz, D. Simultaneous photoautotrophic production of DHA and EPA by Tisochrysis lutea and Microchloropsis salina in co-culture. Bioresour. Bioprocess. 2022, 9, 130. [Google Scholar] [CrossRef]
  31. Harwood, J.L. Algae: Critical Sources of Very Long-Chain Polyunsaturated Fatty Acids. Biomolecules 2019, 9, 708. [Google Scholar] [CrossRef] [PubMed]
  32. Chen, C.-Y.; Nagarajan, D.; Cheah, W.Y. Eicosapentaenoic acid production from Nannochloropsis oceanica CY2 using deep sea water in outdoor plastic-bag type photobioreactors. Bioresour. Technol. 2018, 253, 1–7. [Google Scholar] [CrossRef] [PubMed]
  33. Juneja, A.; Ceballos, R.M.; Murthy, G.S. Effects of Environmental Factors and Nutrient Availability on the Biochemical Composition of Algae for Biofuels Production: A Review. Energies 2013, 6, 4607–4638. [Google Scholar] [CrossRef]
  34. Wehr, J.D. Algae: Anatomy, Biochemistry, and Biotechnology by Barsanti, L. & Gualtieri, P. J. Phycol. 2006, 43, 412–414. [Google Scholar] [CrossRef]
  35. Converti, A.; Scapazzoni, S.; Lodi, A.; Carvalho, J.C.M. Ammonium and urea removal by Spirulina platensis. J. Ind. Microbiol. Biotechnol. 2006, 33, 8–16. [Google Scholar] [CrossRef] [PubMed]
  36. Campos, H.; Boeing, W.J.; Dungan, B.N.; Schaub, T. Cultivating the marine microalga Nannochloropsis salina under various nitrogen sources: Effect on biovolume yields, lipid content and composition, and invasive organisms. Biomass Bioenergy 2014, 66, 301–307. [Google Scholar] [CrossRef]
  37. Ren, M.; Ogden, K. Cultivation of Nannochloropsis gaditana on mixtures of nitrogen sources. Environ. Prog. Sustain. Energy 2014, 33, 551–555. [Google Scholar] [CrossRef]
  38. Schädler, T.; Neumann-Cip, A.-C.; Wieland, K.; Glöckler, D.; Haisch, C.; Brück, T.; Weuster-Botz, D. High-Density Microalgae Cultivation in Open Thin-Layer Cascade Photobioreactors with Water Recycling. Appl. Sci. 2020, 10, 3883. [Google Scholar] [CrossRef]
  39. Havel, J.; Franco-Lara, E.; Weuster-Botz, D. A parallel bubble column system for the cultivation of phototrophic microorganisms. Biotechnol. Lett. 2008, 30, 1197–1200. [Google Scholar] [CrossRef] [PubMed]
  40. Pfaffinger, C.E.; Severin, T.S.; Apel, A.C.; Göbel, J.; Sauter, J.; Weuster-Botz, D. Light-dependent growth kinetics enable scale-up of well-mixed phototrophic bioprocesses in different types of photobioreactors. J. Biotechnol. 2019, 297, 41–48. [Google Scholar] [CrossRef]
  41. Ge, F.; Song, K.; Yang, Z.; Li, J.; Yan, F.; Zhang, M.; Huang, B.; Fu, G.; Zheng, H. Enhancing Docosahexaenoic Acid Production of Isochrysis galbana from Starch-Rich Food Processing Byproducts. Fermentation 2023, 9, 158. [Google Scholar] [CrossRef]
  42. Zheng, H.; Ge, F.; Song, K.; Yang, Z.; Li, J.; Yan, F.; Wu, X.; Zhang, Q.; Liu, Y.; Ruan, R. Docosahexaenoic acid production of the marine microalga Isochrysis galbana cultivated on renewable substrates from food processing waste under CO2 enrichment. Sci. Total Environ. 2022, 848, 157654. [Google Scholar] [CrossRef]
  43. Liu, J.; Sommerfeld, M.; Hu, Q. Screening and characterization of Isochrysis strains and optimization of culture conditions for docosahexaenoic acid production. Appl. Microbiol. Biotechnol. 2013, 97, 4785–4798. [Google Scholar] [CrossRef]
  44. Fidalgo, J.P.; Cid, A.; Torres, E.; Sukenik, A.; Herrero, C. Effects of nitrogen source and growth phase on proximate biochemical composition, lipid classes and fatty acid profile of the marine microalga Isochrysis galbana. Aquaculture 1998, 166, 105–116. [Google Scholar] [CrossRef]
  45. Sassano, C.E.N.; Carvalho, J.C.M.; Gioielli, L.A.; Sato, S.; Torre, P.; Converti, A. Kinetics and bioenergetics of Spirulina platensis cultivation by fed-batch addition of urea as nitrogen source. Appl. Biochem. Biotechnol. 2004, 112, 143–150. [Google Scholar] [CrossRef]
  46. Roopnarain, A.; Sym, S.; Gray, V.M. Effect of nitrogenous resource on growth, biochemical composition and ultrastructure of Isochrysis galbana (Isochrysidales, Haptophyta). Phycol. Res. 2015, 63, 43–50. [Google Scholar] [CrossRef]
  47. Abeliovich, A.; Azov, Y. Toxicity of ammonia to algae in sewage oxidation ponds. Appl. Environ. Microbiol 1976, 31, 801–806. [Google Scholar] [CrossRef]
  48. Belkin, S.; Boussiba, S. High internal pH conveys ammonia resistance in Spirulina platensis. Bioresour. Technol. 1991, 38, 167–169. [Google Scholar] [CrossRef]
  49. Chen, S.Y.; Pan, L.I.; Hong, M.I.; Lee, A.N. The effects of temperature on the growth of and ammonia uptake by marine microalgae. Bot. Stud. 2012, 53, 125–133. [Google Scholar]
  50. Abeliovich, A. Water Pollution and Bioremediation by Microalgae: Water Purification: Algae in Wastewater Oxidation Ponds. In Handbook of Microalgal Culture; Wiley: Hoboken, NJ, USA, 2003; pp. 430–438. [Google Scholar] [CrossRef]
  51. Meng, Y.; Jiang, J.; Wang, H.; Cao, X.; Xue, S.; Yang, Q.; Wang, W. The characteristics of TAG and EPA accumulation in Nannochloropsis oceanica IMET1 under different nitrogen supply regimes. Bioresour. Technol. 2015, 179, 483–489. [Google Scholar] [CrossRef]
  52. Gao, F.; Teles, I.; Wijffels, R.H.; Barbosa, M.J. Process optimization of fucoxanthin production with Tisochrysis lutea. Bioresour. Technol. 2020, 315, 123894. [Google Scholar] [CrossRef]
  53. Pereira, H.; Sá, M.; Maia, I.; Rodrigues, A.; Teles, I.; Wijffels, R.H.; Navalho, J.; Barbosa, M. Fucoxanthin production from Tisochrysis lutea and Phaeodactylum tricornutum at industrial scale. Algal Res. 2021, 56, 102322. [Google Scholar] [CrossRef]
  54. Bendif, E.M.; Probert, I.; Schroeder, D.C.; de Vargas, C. On the description of Tisochrysis lutea gen. nov. sp. nov. and Isochrysis nuda sp. nov. in the Isochrysidales, and the transfer of Dicrateria to the Prymnesiales (Haptophyta). J. Appl. Phycol. 2013, 25, 1763–1776. [Google Scholar] [CrossRef]
  55. Wang, W.; Yu, L.-J.; Xu, C.; Tomizaki, T.; Zhao, S.; Umena, Y.; Chen, X.; Qin, X.; Xin, Y.; Suga, M.; et al. Structural basis for blue-green light harvesting and energy dissipation in diatoms. Science 2019, 363, eaav0365. [Google Scholar] [CrossRef] [PubMed]
  56. Premvardhan, L.; Bordes, L.; Beer, A.; Büchel, C.; Robert, B. Carotenoid Structures and Environments in Trimeric and Oligomeric Fucoxanthin Chlorophyll a/c2 Proteins from Resonance Raman Spectroscopy. J. Phys. Chem. B 2009, 113, 12565–12574. [Google Scholar] [CrossRef] [PubMed]
  57. Li, Y.; Liu, J. Analysis of light absorption and photosynthetic activity by Isochrysis galbana under different light qualities. Aquac. Res. 2020, 51, 2893–2902. [Google Scholar] [CrossRef]
  58. Keeling, P.J. The number, speed, and impact of plastid endosymbioses in eukaryotic evolution. Annu. Rev. Plant Biol. 2013, 64, 583–607. [Google Scholar] [CrossRef] [PubMed]
Figure 1. Phototrophic batch processes with I. galbana (left, brown) and M. salina (right, green) in flat-plate gas-lift photobioreactors applying physically simulated climate conditions in monocultures. Batch processes with two different nitrogen sources are shown: nitrate (filled grey circles) and urea (filled grey squares). All performed monoculture batch processes were conducted once. (A) Cell dry weight concentration, (B) nitrogen source concentration, (C) DHA (brown) or EPA (green) concentration, and (D) DHA (brown) or EPA (green) content of total cell dry weight. The batch processes were operated at a working volume of 1.8 L, pH 8.0, and an initial nitrogen concentration of 400 mg L−1 (1.8 g L−1 nitrate or 0.85 g L−1 urea). The initial cell density of the monocultures was an OD750 of 0.2. The dynamic climate simulation’s incident phototrophic photon flux density (PPFD) is shown as the grey shaded area.
Fermentation 10 00220 g001
Figure 2. Phototrophic batch processes with I. galbana (brown) and M. salina (green) in co-cultures with an inoculation ratio of 1:3 in flat-plate gas-lift photobioreactors applying physically simulated climate conditions. Flow cytometry allowed for the distinction between the two microalgae strains. The results of batch processes with two different nitrogen sources are shown: nitrate (filled circles) and urea (filled squares). The batch process with nitrate was performed twice (min–max values are shown), and the batch process with urea was performed once. (A) Total cell dry weight concentration, (B) nitrogen source concentration, (C) cell dry weight concentration of I. galbana, (D) cell dry weight concentration of M. salina, (E) DHA concentration, (F) EPA concentration, (G) DHA content, and (H) EPA content of total cell dry weight. The batch processes were operated at a working volume of 1.8 L, pH 8.0, and an initial nitrogen supply of 400 mg L−1 (1.8 g L−1 nitrate and 0.85 g L−1 urea). The initial cell density was an OD750 of 0.2. The dynamic climate simulation’s incident phototrophic photon flux density (PPFD) is shown as the grey shaded area.
Fermentation 10 00220 g002
Figure 3. Phototrophic batch processes with I. galbana (brown) and N. oceanica (green) in co-cultures with an inoculation ratio of 1:3 in flat-plate gas-lift photobioreactors applying physically simulated climate conditions. Flow cytometry allowed for the distinction between the two microalgae strains. The results of batch processes with two different nitrogen sources are shown: nitrate (filled circles) and urea (filled squares). The batch process with nitrate was performed twice (min–max values are shown), and the batch process with urea was performed once. (A) Total cell dry weight concentration, (B) nitrogen source concentration, (C) cell dry weight concentration of I. galbana, (D) cell dry weight concentration of N. oceanica, (E) DHA concentration, (F) EPA concentration, (G) DHA content, and (H) EPA content of total cell dry weight. The batch processes were operated at a working volume of 1.8 L, pH 8.0, and an initial nitrogen supply of 400 mg L−1 (1.8 g L−1 nitrate and 0.85 g L−1 urea). The initial cell density was OD750 of 0.2. The dynamic climate simulation’s incident phototrophic photon flux density (PPFD) is shown as the grey shaded area.
Fermentation 10 00220 g003
Figure 4. Phototrophic batch processes with I. galbana (brown) and M. gaditana (green) in co-cultures with an inoculation ratio of 1:3 in flat-plate gas-lift photobioreactors applying physically simulated climate conditions. Flow cytometry allowed for the distinction between the two microalgae strains. The batch processes using nitrate and urea were performed once. The results of batch processes with two different nitrogen sources are shown: nitrate (filled circles) and urea (filled squares). (A) Total cell dry weight concentration, (B) nitrogen source concentration, (C) cell dry weight concentration of I. galbana, (D) cell dry weight concentration of M. gaditana, (E) DHA concentration, (F) EPA concentration, (G) DHA content, and (H) EPA content of total cell dry weight. The batch processes were operated at a working volume of 1.8 L, pH 8.0, and an initial nitrogen supply of 400 mg L−1 (1.8 g L−1 nitrate and 0.85 g L−1 urea). The initial cell density was OD750 of 0.2. The dynamic climate simulation’s incident phototrophic photon flux density (PPFD) is shown as the grey shaded area.
Fermentation 10 00220 g004
Figure 5. Light spectra measurements on the light-adverted side of the flat-plate gas-lift photobioreactor at different process times and biomass concentrations. The light measurements were always taken at the same location in the reactor (in the middle of the reactor). (A) Comparison of the measured spectra of I. galbana (brown) in monoculture, N. oceanica (green) in monoculture, and a co-culture of I. galbana and N. oceanica (grey) at an average biomass concentration of 1.1 ± 0.2 g L−1 and an incident PPFD of 2000 µmol m−2 s−1. (B) Spectra of the co-culture of I. galbana and N. oceanica at different biomass concentrations and the same incident PPFD of 2000 µmol m−2 s−1. (C) Spectra of the monoculture of I. galbana at different biomass concentrations and the same incident PPFD of 2000 µmol m−2 s−1. (D) Spectra of the monoculture of N. oceanica at different biomass concentrations and the same incident PPFD of 2000 µmol m−2 s−1.
Fermentation 10 00220 g005
Table 1. Summary of all conducted co-cultivations.
Co-CultivationsNitrogen SourceInoculation Ratio
I. galbana and
M. salina
Nitrate1:3
Urea1:3
I. galbana and
N. oceanica
Nitrate1:3
Urea1:3
I. galbana and
M. gaditana
Nitrate1:3
Urea1:3
Table 2. Comparison of photoautotrophic monocultures of the DHA-producing golden-brown microalgae I. galbana and the EPA-producing green microalgae M. salina with the co-cultivation of the two microalgae at a harvest time after eight days (consumption of initially supplied nitrate in co-culture) relative to the illuminated surface of the flat plate gas-lift photobioreactors using nitrate as a nitrogen source.
t = 8 dI. galbanaM. salinaCo-CultureCo-Culture
CDW, g L−14.03.24.8 ± 0.2+33 ± 4%
DHA, mg L−177.5-85.5 ± 11+10 ± 13%
DHA, mgDHA gCDW−120-18 ± 3-
EPA, mg L−1-82.570.2 ± 1−15 ± 1%
EPA, mgEPA gCDW−1-20.515 ± 0−27 ± 0%
Table 3. Comparison of photoautotrophic monocultures of the DHA-producing golden-brown microalgae I. galbana and the EPA-producing green microalgae M. salina with a co-cultivation of the two microalgae at a harvest time of eight days (consumption of initially supplied urea in co-culture) relative to the illuminated surface of the flat plate gas-lift photobioreactors using urea as a nitrogen source.
t = 8 dI. galbanaM. salinaCo-CultureCo-Culture
CDW, g L−12.25.35.0+33%
DHA, mg L−131-114+3.7-fold
DHA, mgDHA gCDW−114-22+57%
EPA, mg L−1-96.0129+34%
EPA, mgEPA gCDW−1-19.524+23%
Table 4. Comparison of photoautotrophic monocultures of the DHA-producing golden-brown microalgae I. galbana and the EPA-producing green microalgae N. oceanica with a co-cultivation of the two microalgae at a harvest time of eight days (consumption of initially supplied nitrate in co-culture) relative to the illuminated surface of the flat plate gas-lift photobioreactors using nitrate as a nitrogen source.
t = 8 dI. galbanaN. oceanicaCo-CultureCo-Culture
CDW, g L−14.05.04.7 ± 0.2+18 ± 4%
DHA, mg L−177.5-92 ± 8+19 ± 9%
DHA, mgDHA gCDW−120-20 ± 1-
EPA, mg L−1-12893 ± 16−27 ± 17%
EPA, mgEPA gCDW−1-25.520 ± 4−22 ± 20%
Table 5. Comparison of photoautotrophic monocultures of the DHA-producing golden-brown microalgae I. galbana and the EPA-producing green microalgae M. gaditana with co-cultivation of the two microalgae at a harvest time of eight days (consumption of initially supplied nitrate in co-culture) relative to the illuminated surface of the flat plate gas-lift photobioreactors using nitrate as a nitrogen source.
t = 8 dI. galbanaM. gaditanaCo-CultureCo-Culture
CDW, g L−14.04.64.6+15%
DHA, mg L−177.5-116+49%
DHA, mgDHA gCDW−120-25+25%
EPA, mg L−1-122107−12%
EPA, mgEPA gCDW−1-2523−8%
Table 6. Comparison of cell dry weight concentrations and DHA and EPA contents in the biomass of the co-cultivation processes flat plate gas-lift photobioreactors at a harvest time of eight days.
Nitrogen SourceCDW,
g L−1
CDW-
Golden-Brown Microalgae,
g L−1
CDW-
Green MICROALGAE,
g L−1
DHA,
mgDHA gCDW−1
EPA,
mgEPA gCDW−1
I. galbana and
M. salina
Nitrate4.8 ± 0.22.9 ± 0.21.8 ± 018 ± 315 ± 0
Urea5.31.93.42224
I. galbana and
N. oceanica
Nitrate4.7 ± 0.22.1 ± 0.62.6 ± 0.520 ± 120 ± 4
Urea5.11.33.81136
I. galbana and
M. gaditana
Nitrate4.62.81.82523
Urea5.82.13.7535
T. lutea and
M. salina [29]
Nitrate4.2 ± 0.32.1 ± 0.12.0 ± 0.326 ± 223 ± 4
Disclaimer/Publisher’s Note: The statements, opinions and data contained in all publications are solely those of the individual author(s) and contributor(s) and not of MDPI and/or the editor(s). MDPI and/or the editor(s) disclaim responsibility for any injury to people or property resulting from any ideas, methods, instructions or products referred to in the content.

