
Graphene Oxide: A Comparison of Reduction Methods
by
 ,
,
Natália Garrote de Barros
1,
Abel Cardoso Gonzaga Neto
1,
Kleber Bitencourt Vaccioli
1,
Hugo Rafael Vallejo Angulo
1,
Leonardo Gondim de Andrade e Silva
2,
Samuel Marcio Toffoli
1 and
Ticiane Sanches Valera
1,* 1
Department of Metallurgical and Materials Engineering, Polytechnic School, University of São Paulo (USP), Av. Professor Mello Moraes 2463, São Paulo 05508-030, SP, Brazil
2
Instituto de Pesquisas Energéticas e Nucleares, IPEN/CNEN, Cidade Universitária, Av. Prof. Lineu Prestes 2242, São Paulo 05508-000, SP, Brazil
*
Author to whom correspondence should be addressed.
C 2023, 9(3), 73; https://doi.org/10.3390/c9030073
Submission received: 8 June 2023
/
Revised: 10 July 2023
/
Accepted: 12 July 2023
/
Published: 27 July 2023
(This article belongs to the Special Issue Advanced in Low Dimensional Carbon: Processing and Applications)
Abstract
:This paper presents a comparison of traditional thermal and chemical reduction methods with more recent ionizing radiation reduction via gamma rays and electron beams (e-beams). For GO, all synthesis protocols were adapted to increase production scale and are a contribution of this work. The typical Raman D-band of the GO was prominent (ID/IG ratio increased sixfold). When comparing the GO reduction techniques, dramatic differences in efficiency and GO particle characteristics were observed. Although thermal and chemical reduction are effective reduction methods, as shown through the use of FTIR spectroscopy and the C/O ratio from EDS chemical analysis, the thermal process renders great weight losses, whereas chemical processing may involve the use of hazardous chemical compounds. On the other hand, comparing the gamma rays and e-beam for 80 kGy, the Raman spectra and chemical analysis suggested that the e-beam caused a greater GO reduction: C/O ratio from EDS of 5.4 and 4.1, respectively. In addition to being fast and effective, ionizing radiation reduction processes allow easier control of the reduction degree by adjusting the radiation dose. When the dose increased from 40 to 80 kGy, the Raman spectra and EDS showed that the ID/IG and C/O ratios increased by 15 and 116%, respectively.
1. Introduction
In recent decades, 2D materials have attracted a lot of attention in materials engineering because of their high thermal conductivity, optical transparency and high surface area. Among the different 2D materials, metal dichalcogenides [1], boron nitride [2], carbon nitride [3], MXenes [4], and graphene stand out [5,6].
Graphene is a one-atom-thick layer composed of hexagonally bonded carbons in sp2 hybridization [7]. Graphene can be produced from graphite via chemical vapor deposition (CVD) [8], mechanical [9], chemical [10] or electrochemical [11,12,13] methods. After the first graphene sheet was synthesized via mechanical exfoliation, many researchers became interested in studying this material due to its electrical and thermal conductivity and gas barrier properties as well as the high Young’s modulus [5,14].
However, to produce graphene in large quantities, the graphite oxidation process is preferable to produce graphite oxide, followed by exfoliation to graphene oxide (GO) and reduction to obtain reduced graphene oxide (rGO) [15]. GO can be produced via different methodologies. It was first described by Brodie (1859), who applied fuming HNO3 (nitric acid) and KClO3 (potassium chlorate) as intercalant and oxidant agents, respectively [16]. The complexity of this method and its hazardous process led to the need to create new methodologies for GO production. Hummers (1958) developed a protocol where H2SO4 (sulfuric acid), NaNO3 (sodium nitrate) and KMnO4 (potassium permanganate) were used to oxidize graphite [17]. The benefit of the latter method was the removal of HNO3 via the addition of KMnO4 as an oxidizing agent. Nevertheless, some improvements were needed, such as an increase in the oxidation level to mitigate the number of unoxidized graphite particles in the produced material [18,19,20,21]. Consequently, several modifications have been made to the Hummers method, originating the modified Hummers method [22]. Hou et al. demonstrated that increasing the amount of H2SO4 and KMnO4 increased the oxidation degree [23]. Aixart et al. found that the degree of exfoliation increased proportionally with the reaction time [24]. Ucar et al. verified that applying a pre-oxidation step before the modified Hummers method could increase the oxygen content on the graphene oxide sheets [25].
The majority of publications utilized a graphite content ranging from 0.5 to 3 g per batch of GO production, which may not be representative of studies aimed at producing GO in large scale [23,26,27,28,29,30].
During the process of graphite oxidation using the Hummers method, sp2 bonds are interrupted due to the insertion of oxygen-containing groups (hydroxy, epoxy, carbonyls, carboxyl, ketones, alcohols, and lactones) on their basal planes and edges, which significantly alter the van der Waals interactions between the layers and endow GO with strong hydrophilicity. Some GO properties are impacted by the conversion to an sp3 structure, such as the decrease in electrical and thermal conductivities when compared to the ones of pristine graphene [31,32].
With the purpose of restoring the intrinsic properties of graphene, GO can be converted into reduced graphene oxide (rGO) via the removal of oxygen-containing groups. There are numerous methodologies to reduce graphene oxide. Thermal and chemical reductions are the procedures with the highest number of publications [33,34]. Feng et al. reviewed the latest developments of different strategies to reduce GO, and they concluded that the precise oxidation of GO via a reliable technique was still questionable and, consequently, it was very difficult to control the degree of reduction precisely and repeatedly [35].
There is a growing interest in reducing GO using thermal energy to obtain rGO with structural and electrical properties similar to the ones of graphene sheets [36]. It has been reported that between 140 and 180 °C, the vaporization process of intercalated water molecules dominates, whereas, for the range of temperatures between 180 and 600 °C, the main carboxyl groups are removed. In the temperature range of 600–800 °C, all the residual carboxyl and partial hydroxyl groups are released. A further increase in the temperature to around 1000 °C causes the removal of the residual hydroxyl and partial epoxide groups leading to the generation of a large number of structural defects caused by C=C cracking [37]. Sieradzka et al. studied the effects of graphite particle size on the morphological structure of thermally reduced rGO and clearly showed that such morphologies affected the electrical properties of reduced graphene oxides [38].
Another well-known method is chemical reduction because of its large-scale reduction potential [35,39]. Hydrazine monohydrate (N2H4⋅H2O) is the most used chemical reducing agent despite the fact that it is a very toxic chemical component. Furthermore, the N2H4 reduction process incorporates C-N groups into the graphene sheet. Sodium borohydride (NaBH4) is an alternative to reduce graphene oxide via chemical reduction despite the fact that it is also toxic. Despite the potential for large-scale production, other papers showed that the initial amounts of GO to produce rGO are still low, up to 0.5 g [37,40,41]. A more recent method that has been attracting the attention of researchers is the electrochemical method, which shows potential for large-scale production, being both green and sustainable and allowing for the oxidation and defect control of the rGO produced [11,12,13]. The reduction of graphene oxide via ionizing radiation has also been recently studied [19,42,43]. This technique consists of reducing the GO by submitting its particles to gamma radiation or to an electron beam (e-beam) [44]. The principle of this method is to create active free radicals with reduction potential (product of radiolysis) to chemically react with GO, therefore reducing it. When a suspension of GO in water/alcohol is submitted to radiation, the water molecules will decompose into oxidizing and reducing species: hydroxyl radical (•OH), hydrogen radical (•H), and hydrated electrons (eaq−). The presence of alcohol in the dispersion decreases the concentration of oxidative species (•OH), creating a high-capacity reducing solution, which reduces the GO particles [42,43,44,45,46]. The goal is to produce rGO faster, more efficiently, and that is also easily scalable [47,48].
There are few studies reported in the literature about the electron beam reduction method. An advantage of this technique is the possibility of reducing GO without the use of toxic agents. Yang et al. studied several radiation doses: 5, 15, 20, and 40 kGy. They could not obtain rGO with these levels, but they found that the interplanar spacing decreased, indicating the removal of some oxide groups from GO [47]. On the other hand, Jung et al. applied the radiation dose of 50, 100, and 200 kGy and showed that the electrical conductivity increased proportionally with the radiation dose [48].
Regarding the gamma radiation method, it is a less recent methodology than the e-beam method. It uses radioactive isotopes as the energy source. It was applied by Atta et al. to reduce GO with 100 kGy [49]. Jacovone et al. reduced GO with radiation doses of 20, 40, and 80 kGy [50]. Ansón-Casaos et al. applied radiation doses of 60, 90, and 150 kGy [51]. Although these studies have explored the GO reduction by ionizing radiation, the lack of complete characterizations of the reduced materials has not allowed a conclusive comparison of the effects of several radiation doses.
In this context, the objective of this work was to produce GO using a scalable method and with an appropriate degree of oxidation and submit it to four different reduction methods, comparing the traditional GO thermal and chemical reduction methods with the more recent ionizing radiation reduction using gamma rays and e-beam. Characterizations of the GO and rGO were performed using Raman, XRD, SEM, EDS, and AFM techniques. Among the numerous articles reporting studies on these techniques, to our knowledge, few use different reduction processes starting from the same GO and provide an appropriate characterization of the rGO produced. All production protocols, from graphite to graphene oxide, were adapted to increase production scale and are a contribution of this work. Therefore, to increase the amount of initial graphite and ensure its proper oxidation, four main adjustments were performed on the original method described by Hummers [17]: (1) addition of the pre-oxidation step, (2) increasing the dosage of H2SO4, (3) increasing the reaction time, and (4) inclusion of the centrifugation process to remove unoxidized particles of graphite from the obtained material.
2. Materials and Methods
The graphite specified as Grafmax FP 120, with a carbon content of 99.98%, was supplied by the National Graphite company (São Paulo, Brazil). For GO and rGO productions, the following chemical compounds (reagent grade) were used: sulfuric acid (H2SO4), potassium persulfate (K2S2O8), diphosphorus pentoxide (P2O5), sodium nitrate (NaNO3), potassium permanganate (KMnO4), hydrogen peroxide (H2O2), hydrochloric acid (HCl), sodium borohydride (NaBH4), and ethyl alcohol 99.5% (C2H6O). Chemical reagents were purchased from Synth (Diadema, Brazil) and Sigma-Aldrich Brasil (São Paulo, Brazil).
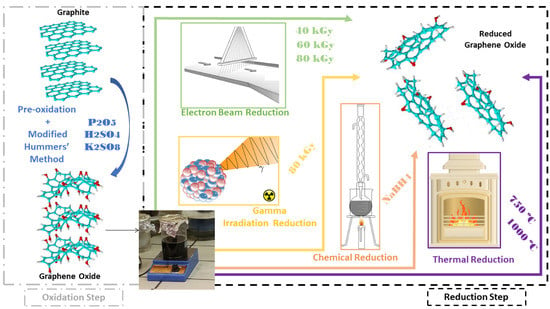
In this work, the synthesis of GO was carried out starting from graphite through the Hummers method [17] with a pre-oxidation step. Additionally, a centrifugation step was included at the end of the process. The GO obtained was reduced using 4 different methods: chemical, thermal, gamma radiation, and electron beam. Figure 1 shows the synthesis routes for all samples. Graphite, GO, and rGO obtained by all methods were characterized, and the nomenclatures are shown in Table 1.
2.1. Preparation of Graphene Oxide
Graphite (10 g) was pre-oxidized with sulfuric acid, potassium persulfate and diphosphorus pentoxide. The dispersion remained at 80 °C for 6 h under continuous stirring. After that, this dispersion was washed with distilled water and filtered until achieving a pH of around 7. Subsequently, the material pre-oxidized was dried in an oven at 60 °C for 24 h. Next, the pre-oxidized graphite was subjected to the modified Hummers’ method: 460 mL of sulfuric acid and 5.0 g of sodium nitrate were added to the pre-oxidized graphite, stirring continuously, and keeping it in an ice bath (temperature around 5 °C) for 30 min. After that, 30.0 g of potassium permanganate was added slowly for 30 min, and keeping the reaction cooled for another 30 min. After this time, the dispersion was heated to 40 °C for a period of 2 h. Then, 920 mL of deionized water was added. The dispersion remained under stirring for another 15 min. After that, 50 mL of hydrogen peroxide solution was added to the dispersion and stirred for 30 min. Gradually the dispersion changed from dark greenish black to a yellow color, indicating a high level of oxidation. The dispersion was then filtered using a Büchner funnel in a vacuum system with 1 L of HCl. Then, the material retained in the funnel was dialyzed with deionized water for 4 days until neutral pH. Afterward, the material was subjected to an ultrasonication process for 1 h, using a probe of 19 mm and 70% of amplitude (Ultrathermostatic Quimis, 120 W, 40 kHz), followed by centrifugation at 2000 rpm for 15 min. A centrifugation process was applied to remove particles that were not completely oxidized.
2.2. Preparation of Reduced Graphene Oxide by Chemical Reduction
The dispersion containing 1 g of GO was subjected to ultrasound for 60 min, with an amplitude of 60% (Ultrathermostatic Quimis, 120 W, 40 kHz). After that, deionized water was added until the dispersion completed 1 L. Then, 6 g of sodium borohydride was added, followed by heating for 3 h at 120 °C. After heating, the dispersion was filtered with deionized water, diluted in 4 L, and then filtered again [41]. The resulting dispersion was lyophilized.
2.3. Preparation of Reduced Graphene Oxide via Thermal Reduction
The thermal reduction was carried out by heating the lyophilized GO in an atmosphere of N2 (flow of 0.12 m3/h) using an oven at 750 °C and 1000 °C. After reaching the temperature, the GO was kept at a constant temperature for 45 s [37].
2.4. Preparation of Reduced Graphene Oxide by Gamma Radiation Reduction
The GO dispersion was diluted in a solution of 50% (v/v) ethanol and deionized water. The dispersion was submitted to radiation in the cobalt-60 compact type multipurpose irradiator of the Radiation Technology Center (CETER) at IPEN (Instituto de Pesquisas Energéticas e Nucleares, São Paulo, Brazil). As the radiation hitting the sample’s surface varies according to the distance to the radioactive source [52], the irradiation was performed in two stages, rotating the sample by 180° between stages. The total radiation dose was 80 kGy, applied at a dose rate of 7.8 kGy/h [42]. The resulting dispersion was lyophilized.
2.5. Preparation of Reduced Graphene Oxide by Electron Beam Reduction
The GO dispersion was diluted in a solution of 50% (v/v) ethanol and deionized water. The irradiation process was carried out in the JOB 188 electron beam accelerator (Dynamitron®, Edgewood, NY, USA), a commercial equipment of the CETER—IPEN. To guarantee the complete radiation of the samples, the dispersion did not exceed 3 mm in thickness. The dose rate was 2.68 kGy/h, and the total radiation doses were 40, 60, and 80 kGy [47]. The resulting dispersion was lyophilized.
2.6. Characterization
Raman spectroscopy was performed on lyophilized samples. At least 3 spectra were obtained for each sample, using a Raman spectrometer, confocal Raman microscope Alpha300 R (WITec, Ulm, Germany), with a green wavelength of 532 nm and 45 mW. The calculation of the crystallite size of the samples was done by the equation described below [53,54]:
where IG/ID is the ratio between the intensities of the G and D bands. The λlaser refers to the laser wavelength (nm).
Samples were also analyzed using Fourier transform infrared spectroscopy (FTIR), using a Nicolet iS10 (Thermo Scientific, Waltham, MA, USA), using the attenuated total reflectance (ATR) apparatus. X-ray diffractometry (XRD) analysis was performed in a Miniflex diffractometer (Rigaku, Cedar Park, TX, USA), with copper as the x-rays source (λ = 1.5418 Å), steps of 0.02°, and soaking time of 5 s. The interlayer spacing of GO and rGO was calculated using Bragg’s equation [38]. A scanning electron microscope (SEM) was applied to analyze GO and rGO morphologies using a FEI Company field emission Inspect F50 instrument (Hillsboro, OR, USA). All samples were coated with gold for conduction purposes. Energy-dispersive spectrometry (EDS) was used to analyze the chemical composition of the graphene oxides and reduced graphene oxides. The reported results were an average of at least 10 measurements from different regions on the sample. Atomic force microscopy (AFM) was performed using the Bruker MultiMode 8 atomic force microscope (Billerica, MA, USA) on samples prepared on a mica surface.
3. Results
3.1. Raman Spectroscopy
Raman spectroscopy data and curves are shown in Table 2 and Figure 2. The Raman spectrum of the GRF (Figure 2a) shows the G band positioned at 1593 cm−1, presenting an area 4.8 times larger than the D band, identified at 1366 cm−1. The ID/IG ratio was 0.18, showing the higher intensity of the G band, as a result of regularity in the stacking of the graphitic structure, with a full width at half maximum (FWHM) of ~23 cm−1. This band corresponds to sp2 carbon vibrations of the graphene layers. On the other hand, the D band, with an FWHM value of ~50 cm−1, indicates the presence of heteroatoms, point dislocations in the structure, and other defects [55,56]. The 2D band, the second highest intensity in the spectrum, is positioned at 2730 cm−1, also due to the interactions between the stacked graphene layers [57]. The crystallite size (La) obtained was 104 nm.
GO Raman spectra can be shown in Figure 2b. Both D and G bands are also observed in the GO spectrum, with an ID/IG ratio of 1.05. This value refers to the presence of sp3 hybridization regions, resulting in the prominent D band. Both bands are wider than the ones observed for graphite, indicating a decrease in the sp2 domains. This broadening was confirmed using the FWHM values, which were 208 and 170 cm−1, for the D and G bands, respectively. The La decreased from 104 to 18.3 nm, reflecting the lower content of graphitic domains (i.e., disruption of the graphitic stacking order) [55,56,57].
Figure 2c shows the Raman spectra of the rGO produced via thermal reduction. Despite both ID/IG ratios of rGOt750 and rGOt1000 being similar in comparison with the one for GO, the D and G bands were narrowed, as confirmed by the lower value of the FWHM for GO, indicating that rGOt750 and rGOt1000 have less oxygen-containing groups in their structures when compared to GOs [56]. La did not change significantly when compared to GO. The 2D bands are barely identifiable, positioned around 2660 cm−1.
The Raman spectra of the GO reduced by electron beam (rGOe40, rGOe60, rGOe80) are shown in Figure 2d. The ID/IG ratio increased proportionally with the radiation dose: 1.07, 1.14, and 1.23 for rGOe40, rGOe60, and rGOe80, respectively. These results suggest an increase in the number of new domains, with a higher density of defects, such as grain boundaries and a higher number of edges present in the carbon backbone, due to the reduction process [56]. The FWHM of the D and G bands decreased with the increasing dose. This difference is probably due to the lower quantity of oxygen-containing groups in the graphene layers. Crystallite sizes decreased with the increase in the radiation dose level [47]. rGOe80 and rGOg presented similar Raman spectra, although the ID/IG ratio for rGOe80 resulted in a small increase (around 1.5%) in comparison to the one for rGOg. In addition, the lower FWHM in D and G bands suggests that e-beam radiation causes higher GO reduction than gamma rays [49]. rGOq (Figure 2e) showed the D (1341 cm−1) and G (1588 cm−1) bands with widths narrower than those of unreduced GO. The ratio of the intensities of the D and G bands, 1.21, was similar to the ones of rGOg and rGOe80 [56].
According to Saito et al. [58], the presence of disorder activates certain vibrational modes, which, in ordered structures, are inexpressive, such as the D and D′ band modes and the D + D′ combination mode. The authors reported the evolution of the 2D band and the D + D′ band in monolayer graphene submitted to ion bombardment. The combined modes of D + D′, at 2930 cm−1, could only be observed at higher doses of ion bombardment. Similar results were also found when graphene was subjected to electron beam bombardment, as presented by Childres et al. [59], which was also discussed by Selhorst and co-authors [60]. Therefore, the 2D and D + D′ bands observed in the curves of rGOg and rGOe, Figure 2d,e, suggest that the radiation doses used in the present study introduced defects in the rGO structures.
To prove the reproducibility of the protocols proposed in this work, Figure S1 shows Raman spectra of the first and second production batches of GO and rGOs. All samples showed reproducibility in the curve profile and in the ID/IG ratio.
3.2. X-ray Diffraction (XRD)
The XRD curves for GRF, GO, and rGO are shown in Figure 3 and Table 3. Graphite exhibits very sharp diffraction peaks at 2θ = 26.3° and 54.6°, corresponding to an interplanar spacing of 3.4 Å and 1.7 Å, assigned to the (002) and (004) planes of the graphite’s hexagonal structure, respectively. The GOs XRD pattern exhibits a peak at 2θ ~10°, corresponding to an interplanar spacing of 8.7 Å, attributed to the (001) plane of GO [61]. The insertion of oxygen-containing functional groups during the oxidation process, such as epoxy and carbonyl groups, impacts the spacing increase between the layers [62]. Furthermore, these hydrophilic oxygen-containing functional groups absorb water molecules, thereby also contributing to the increase in the interlayer spacing. The absorbed water molecules in the basal plane galleries and structural defects cause the interplanar spacing to vary in the range of 6.1 Å, for dry GO, to 12 Å, for hydrated GO [63].
The ordered crystal structure was partially restored when GO was reduced. This is verified by the reappearance of a wide diffraction peak, due to the irregular stacking of the graphene layers, from 22° to 25°, corresponding to an interplanar spacing around 4 Å, assigned to the plane (002) of rGO. In addition, the peaks around 2θ = 42° (for GO) and 2θ = 44° (for reduced GOs) are related to a short-range order within the layers of the stacked graphene, which are present in the semicrystalline, typical profile of the turbostratic graphite structure [64,65,66].
Furthermore, it also presents a peak around 10° for the reduced GOs, with the exception of the one thermally reduced, which may suggest that part of the GO was not completely reduced [67]. Conversely, the XRD curve of the thermally reduced material revealed a completely amorphous structure because of the lack of diffraction peaks. When comparing the curves of rGOe40, rGOe60, and rGOe80, it was observed that the peak intensities at around 22° increase as the dose rises, suggesting that the reduction was most effective for 80 kGy [47,49].
3.3. Fourier Transform Infrared Spectroscopy (FTIR)
FTIR spectra of GO and reduced GO samples can be seen in Figure 4. It is possible to identify the presence of oxygen-containing functional groups in the GO spectrum, indicating that groups were covalently bonded to the basal plane of the graphitic structure. An intense and broad band between 3700 and 3000 cm−1 is related to O-H stretching, which can be attributed to the hydroxyl and COOH groups present in the GO [63]. The band at approximately 1730 cm−1 corresponds to the carboxyl/carbonyl (C=O) stretching groups [61]. The band at around 1615 cm−1 is generated by the structural vibrations of the graphitic domains, being attributed to the C=C stretching of the aromatic rings. The band at 1170 cm−1 is associated with the C-O-C stretching, referring to the epoxy groups. The sharp band around 1045 cm−1 is attributed to O-H deformations, characteristic of C-OH groups [63,68,69]. The spectra of all reduced GO samples showed a decrease in band intensities related to the carbon–oxygen functional groups, in particular for the sample thermally reduced at 1000 °C [47].
3.4. Energy-Dispersive Spectrometry (EDS)
EDS analysis (Table 4) was performed to compare the elemental compositions of the GO and rGO samples. The EDS results corroborate FTIR analysis, suggesting that all reduction methods contributed to the oxygen percentage decrease in rGO when compared to the ones for GO.
The C/O ratios ranged between 1.6 and 6.2. The following sequence represents the C/O values in ascending order: GO, rGOe40, rGOe60, rGOq, rGOt750, rGOg, rGOe80, and rGOt1000. The rGOe80 and rGOt1000 exhibited the lowest oxygen contents among all reduced GO. With regard to rGOq the presence of residual sodium was identified, most likely due to contamination caused by sodium borohydride, the reduction agent used in this process [63,70].
3.5. Scanning Electron Microscopy (SEM)
The morphological structure of GRF, GO and rGO were analyzed using scanning electron microscopy. The micrographs are shown in Figure 5. In general, graphite presented particles larger than 50 μm (Figure 5a). However, the images show that after the oxidation process, the size of the particles decreased (Figure 5b). The morphology of graphite shows compacts of platelets and flat particles with well-defined edges. On the other hand, the GO particles show a more open structure, with irregular curved edges and the presence of folded surfaces, due to the expansion of the interlayer spacings and the lower amount of ordered stacked sheets caused by particle breaks and the attachment of the oxygen-containing functional groups [61]. After the reduction process (Figure 5c–i), the particles presented morphologies with greater roughness as a result of the defects generated in the structure of the basal plane via the removal of the oxygen-containing groups. The roughness was more evident for rGOe40, rGOe60, and rGOe80 (Figure 5d–f). Regarding the rGOt750 and rGOt1000 (Figure 5h–i), the particles presented much smaller sizes, around 10 µm. Nevertheless, for these thermally reduced GO, a re-stacking was not allowed, as observed by XRD patterns [61,63,71]. In addition, during the thermal reduction treatment, micro-explosions occur when the oxygen-containing groups are released, resulting in small and porous particles and a high loss of material (above 90%), comprising the disadvantages of such a method.
3.6. Atomic Force Microscopy (AFM)
AFM analysis was performed to determine the thickness of isolated GO and rGO flakes. Figure 6 shows both the image and the thickness profile (three directions scan per image) of GO, rGOq, rGOe80, and rGOg flakes. It can be seen in Figure 6a a GO particle with approximately 3 µm of width and thickness varying from 1 to 1.5 nm. This suggests that the oxidized graphite was properly exfoliated to obtain thin flakes of graphene oxide [12,44]. Figure 6b–d show the thicknesses of reduced GOs: around 2 nm for rGOq, around 2 nm for rGOe80, and around 8 nm for rGOg. When compared to the GO flake, the thicknesses of the reduced GO particles increased. This means that the oxygen-containing groups were removed, which makes the layers come close together, and a re-stacking of the layers took place. Both rGOq and rGOe80 flakes can be classified as multi-layer graphene, whereas rGOg can be classified as graphite nanoflakes or nanoplates [7].
4. Conclusions
The protocols for GO production, starting from graphite, were adapted from the original method described by Hummers [17] to increase production scale and ensure graphite oxidation. The addition of pre-oxidation and centrifugation processes rendered a higher amount of GO per batch.
It was possible to observe through the Raman spectra of the GO that the typical D band was prominent, and both D and G bands are wider than the ones observed for graphite, which is caused by the insertion of the large number of oxygen-containing groups and other defects in the graphene layers. The combined analyses of the XRD patterns and FTIR and EDS spectra confirmed the graphite oxidation and the obtention of GO particles. In addition, the C/O atomic ratio was 1.6. According to Bianco et al. [7], GO C/O ratios must be less than 3.0 and typically closer to 2.0.
When comparing the GO reduction techniques, the traditional thermal and chemical reduction, as well as the more recent ionizing radiation reduction using gamma rays and e-beam, dramatic differences in the efficiency, and the GO particle characteristics, were observed.
It was found that, as extensively reported in the literature, thermal reduction is an effective reduction method. The rGOt1000 presented the lowest oxygen content, with a C/O ratio of 6.2. Furthermore, the particles presented the smallest sizes, and the XRD curves revealed a complete lack of diffraction peaks, revealing that the re-stacking was not allowed. However, the disadvantage of this method is the high loss of material during the thermal reduction (above 90%) caused by micro-explosions during the release of the oxygen-containing functional groups.
The results for rGOq showed a satisfactory reduction, as evidenced by the decrease in the absorption band intensities corresponding to the oxygen-containing functional groups in the FTIR spectrum and an intermediate oxygen content (EDS) when compared to the other reduction methods. It is important to highlight that the final product contained sodium as a contaminant (EDS), and the procedure may involve the use of hazardous compounds, such as hydrazine monohydrate (N2H4⋅H2O) and sodium borohydride (NaBH4).
Regarding the radiation reduction methods, both gamma rays and e-beam were effective in obtaining rGO. Particularly, when comparing the two techniques for the same radiation dose, that is, rGOe80 and rGOg, the Raman spectra suggested that the e-beam technique caused a higher GO reduction than the gamma ray technique, as corroborated by the C/O atomic ratio from the EDS analysis, which resulted in 5.4 and 4.1, for rGOe80 and rGOg, respectively.
Finally, comparing the effects of different e-beam radiation doses, 40, 60, and 80 kGy, the Raman spectra and EDS chemical analysis showed that the ID/IG ratios and C/O atomic ratios increased with the radiation dose, whereas the interplanar spacing decreased when the radiation dose increased. In other words, the reduction power increased with the radiation dose.
Furthermore, both radiation methods allow for easier control of the reduction degree when compared to the previous methods by adjusting the reduction radiation dose. However, it should be pointed out that both methods involve radiation production, which limits access to proper facilities and require the inherent care related to the use of high-energy radiation.
Supplementary Materials
The following supporting information can be downloaded at: https://www.mdpi.com/article/10.3390/c9030073/s1, Figure S1: Raman spectra of the first and second production batches of GO and rGOs: (a) GO; (b) rGOq, (c) rGOe40, (d), rGOe60, (e) rGOe80, (f) rGOg, (g) rGOt750, and (h) rGOt1000.
Author Contributions
Conceptualization, N.G.d.B. and T.S.V.; investigation, H.R.V.A., A.C.G.N., K.B.V. and N.G.d.B.; methodology, K.B.V., A.C.G.N., N.G.d.B. and T.S.V.; supervision, T.S.V.; validation, N.G.d.B.; visualization, A.C.G.N. and N.G.d.B.; writing, original draft, N.G.d.B., S.M.T. and A.C.G.N.; writing, review and editing, S.M.T., L.G.d.A.e.S. and T.S.V. All authors have read and agreed to the published version of the manuscript.
Funding
This research was funded by CAPES (Coordination for the Improvement of Higher Education Personnel)—Brazil, Proex number 0727/2020.
Data Availability Statement
The data presented in this study are available upon request to the corresponding author.
Acknowledgments
The authors would like to thank the Laboratory of Microelectronics (LME) of Department of Electronic Systems Engineering, Polytechnic School, USP, and also Marcio Yee (UNIFESP). This research used facilities of the Brazilian Nanotechnology National Laboratory (LNNano), part of the Brazilian Centre for Research in Energy and Materials (CNPEM), process AFM24938.
Conflicts of Interest
The authors declare no conflict of interest.
References
- Yang, R.; Fan, Y.; Zhang, Y.; Mei, L.; Zhu, R.; Qin, J.; Hu, J.; Chen, Z.; Ng, Y.H.; Voiry, D.; et al. 2D Transition Metal Dichalcogenides for Photocatalysis. Angew. Chem. Int. Ed. 2023, 62, e202218016. [Google Scholar] [CrossRef]
- Thirumalraj, B.; Sriram, B.; Muthukutty, B.; Zheng, L.; Wang, S.-F.; Choe, H.; Kwon, K. Layered metal chalcogenide of SnSe nanosheets integrated with 2D-hexagonal boron nitride for accurate and low-level detection of nitrofurazone. Chem. Eng. J. 2023, 455, 140521. [Google Scholar] [CrossRef]
- Ashraf, M.; Hemasiri, N.H.; Kazim, S.; Ullah, N.; Khan, M.; Ganiyu, S.A.; Alhooshani, K.R.; Tahir, M.N.; Ahmad, S. Interface engineering of a hole-transport layer/perovskite with low-band-gap 2D-carbon nitrides for solar cell fabrication. Sustain. Energy Fuels 2023, 7, 763–768. [Google Scholar] [CrossRef]
- Liu, L.; Feng, J.; Xue, Y.; Chevali, V.; Zhang, Y.; Shi, Y.; Tang, L.; Song, P. 2D MXenes for Fire Retardancy and Fire-Warning Applications: Promises and Prospects. Adv. Funct. Mater. 2023, 33, 2212124. [Google Scholar] [CrossRef]
- Geng, D.; Yang, H.Y. Recent Advances in Growth of Novel 2D Materials: Beyond Graphene and Transition Metal Dichalcogenides. Adv. Mater. 2018, 30, e1800865. [Google Scholar] [CrossRef]
- Baboukani, A.R.; Khakpour, I.; Drozd, V.; Wang, C. Liquid-Based Exfoliation of Black Phosphorus into Phosphorene and Its Application for Energy Storage Devices. Small Struct. 2021, 2, 2000148. [Google Scholar] [CrossRef]
- Bianco, A.; Cheng, H.-M.; Enoki, T.; Gogotsi, Y.; Hurt, R.H.; Koratkar, N.; Kyotani, T.; Monthioux, M.; Park, C.R.; Tascon, J.M.; et al. All in the graphene family—A recommended nomenclature for two-dimensional carbon materials. Carbon 2013, 65, 1–6. [Google Scholar] [CrossRef]
- Saedi, M.; Mohseni, S.M.; Groot, I.M. Thermodynamic analysis of graphene CVD grown on liquid metal: Growth on liquid metallic gallium or solid gallium oxide skin? Mater. Chem. Phys. 2022, 275, 125203. [Google Scholar] [CrossRef]
- Novoselov, K.S.; Jiang, D.; Schedin, F.; Booth, T.J.; Khotkevich, V.V.; Morozov, S.V.; Geim, A.K. Two-dimensional atomic crystals. Proc. Natl. Acad. Sci. USA 2005, 102, 10451–10453. [Google Scholar] [CrossRef]
- Tambe, P. Synthesis and characterization of acid treated reduced graphene oxide. Mater. Today Proc. 2021, 49, 1294–1297. [Google Scholar] [CrossRef]
- Ratova, D.-M.V.; Mikheev, I.V.; Chermashentsev, G.R.; Maslakov, K.I.; Kottsov, S.Y.; Stolbov, D.N.; Maksimov, S.V.; Sozarukova, M.M.; Proskurnina, E.V.; Proskurnin, M.A. Green and Sustainable Ultrasound-Assisted Anodic Electrochemical Preparation of Graphene Oxide Dispersions and Their Antioxidant Properties. Molecules 2023, 28, 3238. [Google Scholar] [CrossRef] [PubMed]
- Suranshe, S.S.; Patil, A. Strategically improving electrical conductivity of reduced graphene oxide through a series of reduction processes. Mater. Lett. 2023, 333, 133648. [Google Scholar] [CrossRef]
- Khakpour, I.; Baboukani, A.R.; Allagui, A.; Wang, C. Bipolar Exfoliation and In Situ Deposition of High-Quality Graphene for Supercapacitor Application. ACS Appl. Energy Mater. 2019, 2, 4813–4820. [Google Scholar] [CrossRef]
- McDonald, M.P.; Morozov, Y.; Hodak, J.H.; Kuno, M. Spectroscopy and Microscopy of Graphene Oxide and Reduced Graphene Oxide. In Graphene Oxide; Gao, W., Ed.; Springer International Publishing: Cham, Switzerland, 2015; pp. 29–60. [Google Scholar] [CrossRef]
- Powell, C.; Beall, G.W. Graphene oxide and graphene from low grade coal: Synthesis, characterization and applications. Curr. Opin. Colloid Interface Sci. 2015, 20, 362–366. [Google Scholar] [CrossRef]
- Collins Brodie, B. XIII. On the atomic weight of graphite. Philos. Trans. R. Soc. Lond. 1859, 149, 249–259. [Google Scholar] [CrossRef] [Green Version]
- Hummers, W.S., Jr.; Offeman, R.E. Preparation of Graphitic Oxide. J. Am. Chem. Soc. 1958, 80, 1339. [Google Scholar] [CrossRef]
- Tienne, L.G.P.; Candido, L.D.S.; Cruz, B.D.S.M.D.; Gondim, F.F.; Ribeiro, M.P.; Simão, R.A.; Marques, M.D.F.V.; Monteiro, S.N. Reduced graphene oxide synthesized by a new modified Hummer’s method for enhancing thermal and crystallinity properties of Poly(vinylidene fluoride). J. Mater. Res. Technol. 2022, 18, 4871–4893. [Google Scholar] [CrossRef]
- Sontakke, A.D.; Tiwari, S.; Purkait, M.K. A comprehensive review on graphene oxide-based nanocarriers: Synthesis, functionalization and biomedical applications. Flatchem 2023, 38, 100484. [Google Scholar] [CrossRef]
- Alkhouzaam, A.; Qiblawey, H.; Khraisheh, M.; Atieh, M.; Al-Ghouti, M. Synthesis of graphene oxides particle of high oxidation degree using a modified Hummers method. Ceram. Int. 2020, 46, 23997–24007. [Google Scholar] [CrossRef]
- Ikram, R.; Jan, B.M.; Ahmad, W. An overview of industrial scalable production of graphene oxide and analytical approaches for synthesis and characterization. J. Mater. Res. Technol. 2020, 9, 11587–11610. [Google Scholar] [CrossRef]
- Zhu, Y.; Murali, S.; Cai, W.; Li, X.; Suk, J.W.; Potts, J.R.; Ruoff, R.S. Graphene and Graphene Oxide: Synthesis, Properties, and Applications. Adv. Mater. 2010, 22, 3906–3924. [Google Scholar] [CrossRef]
- Hou, Y.; Lv, S.; Liu, L.; Liu, X. High-quality preparation of graphene oxide via the Hummers’ method: Understanding the roles of the intercalator, oxidant, and graphite particle size. Ceram. Int. 2020, 46, 2392–2402. [Google Scholar] [CrossRef]
- Aixart, J.; Díaz, F.; Llorca, J.; Rosell-Llompart, J. Increasing reaction time in Hummers’ method towards well exfoliated graphene oxide of low oxidation degree. Ceram. Int. 2021, 47, 22130–22137. [Google Scholar] [CrossRef]
- Ucar, N.; Yuksek, I.O.; Olmez, M.; Can, E.; Onen, H. The effect of oxidation process on graphene oxide fiber properties. Mater. Sci. 2019, 37, 83–89. [Google Scholar] [CrossRef] [Green Version]
- Papageorgiou, D.G.; Kinloch, I.A.; Young, R.J. Graphene/elastomer nanocomposites. Carbon 2015, 95, 460–484. [Google Scholar] [CrossRef]
- Drewniak, S.; Pustelny, T.; Muzyka, R.; Stolarczyk, A.; Konieczny, G. Investigations of selected physical properties of graphite oxide and thermally exfoliated/reduced graphene oxide in the aspect of their applications in photonic gas sensors. Photon. Lett. Pol. 2015, 7, 47–49. [Google Scholar] [CrossRef] [Green Version]
- Sohail, M.; Saleem, M.; Ullah, S.; Saeed, N.; Afridi, A.; Khan, M.; Arif, M. Modified and improved Hummer’s synthesis of graphene oxide for capacitors applications. Mod. Electron. Mater. 2017, 3, 110–116. [Google Scholar] [CrossRef]
- Liu, J.; Zheng, Z.; Li, F.; Lei, W.; Gao, Y.; Wu, Y.; Zhang, L.; Wang, Z.L. Nanoparticle chemically end-linking elastomer network with super-low hysteresis loss for fuel-saving automobile. Nano Energy 2016, 28, 87–96. [Google Scholar] [CrossRef] [Green Version]
- Wu, R.; Wang, Y.; Chen, L.; Huang, L.; Chen, Y. Control of the oxidation level of graphene oxide for high efficiency polymer solar cells. RSC Adv. 2015, 5, 49182–49187. [Google Scholar] [CrossRef]
- Nagaoka, D.A.; Grasseschi, D.; Domingues, S.H. Can reduced graphene oxide look like few-layer pristine graphene? Diam. Relat. Mater. 2021, 120, 108616. [Google Scholar] [CrossRef]
- Chen, J.; Li, L. Effect of oxidation degree on the thermal properties of graphene oxide. J. Mater. Res. Technol. 2020, 9, 13740–13748. [Google Scholar] [CrossRef]
- Kavitha, C. A review on reduced Graphene oxide hybrid nano composites and their prominent applications. Mater. Today Proc. 2021, 49, 811–816. [Google Scholar] [CrossRef]
- Hada, M.; Miyata, K.; Ohmura, S.; Arashida, Y.; Ichiyanagi, K.; Katayama, I.; Suzuki, T.; Chen, W.; Mizote, S.; Sawa, T.; et al. Selective Reduction Mechanism of Graphene Oxide Driven by the Photon Mode versus the Thermal Mode. ACS Nano 2019, 13, 10103–10112. [Google Scholar] [CrossRef]
- Feng, J.; Ye, Y.; Xiao, M.; Wu, G.; Ke, Y. Synthetic routes of the reduced graphene oxide. Chem. Pap. 2020, 74, 3767–3783. [Google Scholar] [CrossRef]
- Sengupta, I.; Chakraborty, S.; Talukdar, M.; Pal, S.K.; Chakraborty, S. Thermal reduction of graphene oxide: How temperature influences purity. J. Mater. Res. 2018, 33, 4113–4122. [Google Scholar] [CrossRef]
- Agarwal, V.; Zetterlund, P.B. Strategies for reduction of graphene oxide—A comprehensive review. Chem. Eng. J. 2021, 405, 127018. [Google Scholar] [CrossRef]
- Sieradzka, M.; Ślusarczyk, C.; Fryczkowski, R.; Janicki, J. Insight into the effect of graphite grain sizes on the morphology, structure and electrical properties of reduced graphene oxide. J. Mater. Res. Technol. 2020, 9, 7059–7067. [Google Scholar] [CrossRef]
- Koreshkova, A.N.; Gupta, V.; Peristyy, A.; Nesterenko, P.N.; Rodemann, T.; Paull, B. Ion chromatographic determination of hydrazine in excess ammonia for monitoring graphene oxide reduction reaction. Talanta 2019, 2005, 120081. [Google Scholar] [CrossRef]
- Hu, J.; Kong, G.; Zhu, Y.; Che, C. Ultrafast room-temperature reduction of graphene oxide by sodium borohydride, sodium molybdate and hydrochloric acid. Chin. Chem. Lett. 2021, 32, 543–547. [Google Scholar] [CrossRef]
- Poorali, M.-S.; Bagheri-Mohagheghi, M.-M. Comparison of chemical and physical reduction methods to prepare layered graphene by graphene oxide: Optimization of the structural properties and tuning of energy band gap. J. Mater. Sci. Mater. Electron. 2016, 27, 260–271. [Google Scholar] [CrossRef]
- Zhang, B.; Li, L.; Wang, Z.; Xie, S.; Zhang, Y.; Shen, Y.; Yu, M.; Deng, B.; Huang, Q.; Fan, C.; et al. Radiation induced reduction: An effective and clean route to synthesize functionalized graphene. J. Mater. Chem. 2012, 22, 7775–7781. [Google Scholar] [CrossRef]
- Ershov, B.G. Kinetics, mechanism and intermediates of some radiation-induced reactions in aqueous solutions. Russ. Chem. Rev. 2004, 73, 101–113. [Google Scholar] [CrossRef]
- Santana, J.G.; Akbulut, M.; Temperini, M.L.; Rangari, V.K.; Güven, O.; Moura, E. Synergistic effect of e-beam irradiation and graphene oxide incorporation on thermal, mechanical, and barrier properties of poly (ethylene-co-vinyl alcohol) film. Radiat. Phys. Chem. 2022, 199, 110343. [Google Scholar] [CrossRef]
- Changotra, R.; Guin, J.P.; Varshney, L.; Dhir, A. Assessment of reaction intermediates of gamma radiation-induced degradation of ofloxacin in aqueous solution. Chemosphere 2018, 208, 606–613. [Google Scholar] [CrossRef] [PubMed]
- Soroka, I.; Chae, N.; Jonsson, M. On the mechanism of γ-radiation-induced corrosion of copper in water. Corros. Sci. 2021, 182, 109279. [Google Scholar] [CrossRef]
- Yang, Y.; Chen, L.; Li, D.-Y.; Yi, R.-B.; Mo, J.-W.; Wu, M.-H.; Xu, G. Controllable reduction of graphene oxide by electron-beam irradiation. RSC Adv. 2019, 9, 3597–3604. [Google Scholar] [CrossRef] [PubMed]
- Jung, J.-M.; Jung, C.-H.; Oh, M.-S.; Hwang, I.-T.; Shin, K.; Hwang, J.; Park, S.-H.; Choi, J.-H. Rapid, facile, and eco-friendly reduction of graphene oxide by electron beam irradiation in an alcohol–water solution. Mater. Lett. 2014, 126, 151–153. [Google Scholar] [CrossRef]
- Atta, M.M.; Maksoud, M.I.A.A.; Sallam, O.I.; Awed, A.S. Gamma irradiation synthesis of wearable supercapacitor based on reduced graphene oxide/cotton yarn electrode. J. Mater. Sci. Mater. Electron. 2021, 32, 3688–3698. [Google Scholar] [CrossRef]
- Jacovone, R.M.S.; Tominaga, F.K.; Brandão, O.A.B.; Garcia, R.H.L.; Sakata, S.K. Synthesis of Reduced Graphene Oxide by Gamma Irradiation. In Proceedings of the International Nuclear Atlantic Conference, Santos, Brazil, 21–25 October 2019; Associação Brasileira De Energia Nuclear: Santos, SP, Brazil, 2019; pp. 2398–2405. [Google Scholar]
- Ansón-Casaos, A.; Puértolas, J.; Pascual, F.; Hernández-Ferrer, J.; Castell, P.; Benito, A.; Maser, W.; Martínez, M. The effect of gamma-irradiation on few-layered graphene materials. Appl. Surf. Sci. 2014, 301, 264–272. [Google Scholar] [CrossRef] [Green Version]
- Somessari, S.L.; Somessari, E.S.R.; Da Silveira, C.G.; Calvo, W.A.P. Analysis of the Power System from an Electron Beam Accelerator and the Correlation with the Theoretical Dosimetry for Radiation Processing. J. Phys. Sci. Appl. 2015, 5, 356–366. [Google Scholar] [CrossRef] [Green Version]
- Ribeiro-Soares, J.; Oliveros, M.; Garin, C.; David, M.; Martins, L.; Almeida, C.; Martins-Ferreira, E.; Takai, K.; Enoki, T.; Magalhães-Paniago, R.; et al. Structural analysis of polycrystalline graphene systems by Raman spectroscopy. Carbon 2015, 95, 646–652. [Google Scholar] [CrossRef] [Green Version]
- Kaushal, A.; Dhawan, S.K.; Singh, V. Determination of crystallite size, number of graphene layers and defect density of graphene oxide (GO) and reduced graphene oxide (RGO). AIP Conf. Proc. 2019, 2115, 030106. [Google Scholar] [CrossRef]
- Rantitsch, G.; Lämmerer, W.; Fisslthaler, E.; Mitsche, S.; Kaltenböck, H. On the discrimination of semi-graphite and graphite by Raman spectroscopy. Int. J. Coal Geol. 2016, 159, 48–56. [Google Scholar] [CrossRef]
- Muzyka, R.; Drewniak, S.; Pustelny, T.; Chrubasik, M.; Gryglewicz, G. Characterization of Graphite Oxide and Reduced Graphene Oxide Obtained from Different Graphite Precursors and Oxidized by Different Methods Using Raman Spectroscopy. Materials 2018, 11, 1050. [Google Scholar] [CrossRef] [PubMed] [Green Version]
- Roscher, S.; Hoffmann, R.; Ambacher, O. Determination of the graphene–graphite ratio of graphene powder by Raman 2D band symmetry analysis. Anal. Methods 2019, 11, 1180–1191. [Google Scholar] [CrossRef] [Green Version]
- Saito, R.; Hofmann, M.; Dresselhaus, G.; Jorio, A.; Dresselhaus, M.S. Raman spectroscopy of graphene and carbon nanotubes. Adv. Phys. 2011, 60, 413–550. [Google Scholar] [CrossRef]
- Childres, I.; Jauregui, L.A.; Park, W.; Cao, H.; Chen, Y.P. Raman Spectroscopy of Graphene and Related Materials. New Developments in Photon and Materials Research. 1. 2013. Available online: https://www.physics.purdue.edu/quantum/files/Raman_Spectroscopy_of_Graphene_NOVA_Childres.pdf (accessed on 11 July 2023).
- Selhorst, R.; Susner, M.A.; Muzzio, R.; Kao, I.-H.; Carpena-Núñez, J.; Islam, A.E.; Katoch, J.; Maruyama, B.; Rao, R. Electron-beam chemistry in graphene—Effect of environmental SEM parameters on patterning and defect engineering. Vacuum 2023, 207, 111686. [Google Scholar] [CrossRef]
- Caicedo, F.M.C.; López, E.V.; Agarwal, A.; Drozd, V.; Durygin, A.; Hernandez, A.F.; Wang, C. Synthesis of graphene oxide from graphite by ball milling. Diam. Relat. Mater. 2020, 109, 108064. [Google Scholar] [CrossRef]
- Zaaba, N.I.; Foo, K.L.; Hashim, U.; Tan, S.J.; Liu, W.W.; Voon, C.H. Synthesis of Graphene Oxide using Modified Hummers Method: Solvent Influence. Procedia Eng. 2017, 184, 469–477. [Google Scholar] [CrossRef]
- Al-Gaashani, R.; Najjar, A.; Zakaria, Y.; Mansour, S.; Atieh, M.A. XPS and structural studies of high quality graphene oxide and reduced graphene oxide prepared by different chemical oxidation methods. Ceram. Int. 2019, 45, 14439–14448. [Google Scholar] [CrossRef]
- Fujimoto, H. Theoretical X-ray scattering intensity of carbons with turbostratic stacking and AB stacking structures. Carbon 2003, 41, 1585–1592. [Google Scholar] [CrossRef]
- Popova, A. Crystallographic analysis of graphite by X-Ray diffraction. Coke Chem. 2017, 60, 361–365. [Google Scholar] [CrossRef]
- Stobinski, L.; Lesiak, B.; Malolepszy, A.; Mazurkiewicz, M.; Mierzwa, B.; Zemek, J.; Jiricek, P.; Bieloshapka, I. Graphene oxide and reduced graphene oxide studied by the XRD, TEM and electron spectroscopy methods. J. Electron Spectrosc. Relat. Phenom. 2014, 195, 145–154. [Google Scholar] [CrossRef]
- Pavoski, G.; Maraschin, T.; Fim, F.D.C.; Balzaretti, N.M.; Galland, G.B.; Moura, C.S.; Basso, N.R.D.S. Few Layer Reduced Graphene Oxide: Evaluation of the Best Experimental Conditions for Easy Production. Mater. Res. 2017, 20, 53–61. [Google Scholar] [CrossRef] [Green Version]
- Nguyen, V.C.; Kheireddine, S.; Dandach, A.; Eternot, M.; Vu, T.T.H.; Essayem, N. Acid Properties of GO and Reduced GO as Determined by Microcalorimetry, FTIR, and Kinetics of Cellulose Hydrolysis-Hydrogenolysis. Catalysts 2020, 10, 1393. [Google Scholar] [CrossRef]
- Perera, D.; Abeywickrama, A.; Zen, F.; Colavita, P.E.; Jayasundara, D.R. Evolution of oxygen functionalities in graphene oxide and its impact on structure and exfoliation: An oxidation time based study. Mater. Chem. Phys. 2018, 220, 417–425. [Google Scholar] [CrossRef]
- Chuah, R.; Gopinath, S.C.B.; Anbu, P.; Salimi, M.N.; Yaakub, A.R.W.; Lakshmipriya, T. Synthesis and characterization of reduced graphene oxide using the aqueous extract of Eclipta prostrata. 3 Biotech 2020, 10, 364. [Google Scholar] [CrossRef]
- Romero, A.; Lavin-Lopez, M.; Sanchez-Silva, L.; Valverde, J.; Paton-Carrero, A. Comparative study of different scalable routes to synthesize graphene oxide and reduced graphene oxide. Mater. Chem. Phys. 2018, 203, 284–292. [Google Scholar] [CrossRef] [Green Version]
Figure 1.
Schematic illustration of GO and rGO syntheses.

Figure 2.
Raman spectra of: (a) GRF; (b) GO; (c) rGOt750 and rGOt1000; (d) rGOe40, rGOe60, and rGOe80; (e) rGOq, rGOg, and rGOe80.
Figure 2.
Raman spectra of: (a) GRF; (b) GO; (c) rGOt750 and rGOt1000; (d) rGOe40, rGOe60, and rGOe80; (e) rGOq, rGOg, and rGOe80.


Figure 3.
XRD patterns of (a) graphite, GO, rGOt750, rGOq; (b) rGOq, rGOe80, rGOe60, and rGOe40.

Figure 4.
FTIR spectra of GO, rGOq, rGOe40, rGOe60, rGOe80, rGOg, rGOt750, and rGOt1000.

Figure 5.
SEM micrographs: (a) GRF; (b) GO; (c) GOq; (d) GOe40; (e) GOe60; (f) GOe80; (g) GOg; (h) GOt750; (i) GOt1000.
Figure 5.
SEM micrographs: (a) GRF; (b) GO; (c) GOq; (d) GOe40; (e) GOe60; (f) GOe80; (g) GOg; (h) GOt750; (i) GOt1000.


Figure 6.
AFM of (a) GO; (b) rGOq; (c) rGO; (d) rGOg. Three thickness profile direction scans per image (1–3).
Figure 6.
AFM of (a) GO; (b) rGOq; (c) rGO; (d) rGOg. Three thickness profile direction scans per image (1–3).


Table 1.
Nomenclatures of different samples produced.
| Nomenclature | Samples Description |
|---|---|
| GRF | Graphite |
| GO | Graphene oxide |
| rGOq | Reduced graphene oxide by chemical reduction |
| rGOt750 | Reduced graphene oxide by thermal reduction at 750 °C |
| rGOt1000 | Reduced graphene oxide by thermal reduction at 1000 °C |
| rGOe40 | Reduced graphene oxide by electron beam reduction at 40 kGy |
| rGOe60 | Reduced graphene oxide by electron beam reduction at 60 kGy |
| rGOe80 | Reduced graphene oxide by electron beam reduction at 80 kGy |
| rGOg | Reduced graphene oxide by gamma radiation |
Table 2.
Data obtained from the Raman spectra of all reduced graphene oxides.
| D Band/FWHM (cm−1) | G Band/FWHM (cm−1) | 2D Band (cm−1) | La (nm) | ID/IG | |
|---|---|---|---|---|---|
| GRF | 1366/49.9 | 1593/22.8 | 2730 | 104.0 | 0.18 |
| GO | 1370/207.6 | 1608/170.1 | 2668 | 18.3 | 1.05 |
| rGOq | 1341/99.8 | 1588/89.5 | 2679 | 15.9 | 1.21 |
| rGOe80 | 1343/75.1 | 1572/71.8 | 2665 | 15.6 | 1.23 |
| rGOe60 | 1343/81.5 | 1574/77.7 | 2679 | 16.9 | 1.14 |
| rGOe40 | 1343/92.7 | 1578/82.5 | 2669 | 17.9 | 1.07 |
| rGOg | 1341/83.6 | 1576/74.5 | 2679 | 15.9 | 1.21 |
| rGOt750 | 1344/193.9 | 1585/174.3 | 2657 | 19.3 | 1.00 |
| rGOt1000 | 1344/170.6 | 1585/111.5 | 2647 | 18.7 | 1.03 |
Table 3.
The structural parameters of the GRF, GO, and rGO are determined using XRD technique: 2θ (diffraction angle), and d (interlayer space).
Table 3.
The structural parameters of the GRF, GO, and rGO are determined using XRD technique: 2θ (diffraction angle), and d (interlayer space).
| 2θ (°) | d (Å) | |
|---|---|---|
| GRF | 26.3 | 3.4 |
| GO | 42.3/10.1 | 2.1/8.7 |
| rGOq | 43.1/25.3/10.9 | 2.1/3.5/8.1 |
| rGOg | 43/22.2/11.3 | 2.1/4.0/7.8 |
| rGOt750 | 43.8/24.7 | 2.1/3.6 |
| rGOe80 | 42.8/22.2/11.1 | 2.1/4.0/7.9 |
| rGOe60 | 42.7/22.1/10.7 | 2.1/4.0/8.2 |
| rGOe40 | 42.7/22.6/10.5 | 2.1/3.9/8.4 |
Table 4.
Semi-quantitative elemental composition, by EDS, of GO and rGO, and the corresponding C/O ratio.
Table 4.
Semi-quantitative elemental composition, by EDS, of GO and rGO, and the corresponding C/O ratio.
| C (%) | O (%) | Na (%) | C/O | |
|---|---|---|---|---|
| GO | 60.8 | 39.2 | 0 | 1.6 |
| rGOq | 70.3 | 23.7 | 6.0 | 3.0 |
| rGOe80 | 84.4 | 15.6 | 0 | 5.4 |
| rGOe60 | 74.4 | 25.6 | 0 | 2.9 |
| rGOe40 | 71.7 | 28.3 | 0 | 2.5 |
| rGOg | 80.3 | 19.7 | 0 | 4.1 |
| rGOt750 | 79.1 | 20.9 | 0 | 3.8 |
| rGOt1000 | 86.1 | 13.9 | 0 | 6.2 |
Disclaimer/Publisher’s Note: The statements, opinions and data contained in all publications are solely those of the individual author(s) and contributor(s) and not of MDPI and/or the editor(s). MDPI and/or the editor(s) disclaim responsibility for any injury to people or property resulting from any ideas, methods, instructions or products referred to in the content. |
© 2023 by the authors. Licensee MDPI, Basel, Switzerland. This article is an open access article distributed under the terms and conditions of the Creative Commons Attribution (CC BY) license (https://creativecommons.org/licenses/by/4.0/).
Share and Cite
MDPI and ACS Style
de Barros, N.G.; Gonzaga Neto, A.C.; Vaccioli, K.B.; Angulo, H.R.V.; de Andrade e Silva, L.G.; Toffoli, S.M.; Valera, T.S. Graphene Oxide: A Comparison of Reduction Methods. C 2023, 9, 73. https://doi.org/10.3390/c9030073
AMA Style
de Barros NG, Gonzaga Neto AC, Vaccioli KB, Angulo HRV, de Andrade e Silva LG, Toffoli SM, Valera TS. Graphene Oxide: A Comparison of Reduction Methods. C. 2023; 9(3):73. https://doi.org/10.3390/c9030073
Chicago/Turabian Stylede Barros, Natália Garrote, Abel Cardoso Gonzaga Neto, Kleber Bitencourt Vaccioli, Hugo Rafael Vallejo Angulo, Leonardo Gondim de Andrade e Silva, Samuel Marcio Toffoli, and Ticiane Sanches Valera. 2023. "Graphene Oxide: A Comparison of Reduction Methods" C 9, no. 3: 73. https://doi.org/10.3390/c9030073
Note that from the first issue of 2016, this journal uses article numbers instead of page numbers. See further details here.