Communication

Convenient Preparation of Graphene Oxide from Expandable Graphite and Its Characterization by Positron Annihilation Lifetime Spectroscopy

1
Department of Polymer Engineering and Science, Montanuniversität, Otto-Glöckel Straβe 2, 8700 Leoben, Austria
2
Department of Aerospace Science and Technology, Politecnico di Milano, via La Masa 34, 20156 Milano, Italy
3
Istituto Nazionale di Fisica Nucleare INFN, Sezione di Milano, via Celoria 16, 20133 Milano, Italy
4
Dipartimento di Chimica, Università Degli Studi di Milano, via Golgi, 19, 20133 Milano, Italy
*
Author to whom correspondence should be addressed.
Present address: Laboratory for Soft and Living Materials, Department of Materials, ETH Zürich, Vladimir-Prelog-Weg 5, 8093 Zürich, Switzerland.
Submission received: 12 December 2018 / Revised: 4 January 2019 / Accepted: 7 January 2019 / Published: 11 January 2019

Abstract

:
Graphene oxide (GO) is conveniently prepared from expandable graphite using a simplified Hummers’ method. The product is thoroughly characterized by usual techniques (UV-vis, Fourier-transform infrared (FTIR) and Raman spectroscopies, zeta potential, electron microscopy, X-ray diffraction, nitrogen adsorption) to confirm the success of synthesis. Positron annihilation lifetime spectroscopy (PALS) is then used to extract information on the microenvironment in between the layers of graphene oxide.

Graphical Abstract

1. Introduction

Carbon and carbon-based materials have been of incredible importance since the dawn of civilization. Carbon uses are countless and increased in complexity and sophistication over time: as pigments (e.g., carbon black), jewels (e.g., diamond) and fuels (e.g., coke), making composites (e.g., carbon fibers) and steel, purifying air and water (e.g., active carbon) and many more. Carbon can exist in different allotropic forms: diamond, graphite, fullerenes, nanotubes, and graphene. This latter can be described as a single layer of graphite, a two-dimensional hexagonal lattice of sp2-bound carbon atoms. Since the publication of a seminal report in 2004 [1], graphene has triggered an enormous interest thanks to its peculiar physical properties, such as its electrical and thermal conductivity, as well as for the many possibilities offered by its chemical modification [2,3].
Methods for producing graphene are variegated and include both physical and chemical approaches. However, wet methods based on the oxidative exfoliation of graphite and the consequent reduction of graphene oxide are among the most convenient ways of graphene preparation, especially on an industrial scale. In 1958, W. S. Hummers Jr. and R. E. Offeman reported an improved method for the preparation of graphitic oxide, a product of oxidation of graphite [4]. By subsequent exfoliation of graphite oxide (e.g., by means of ultra-sonication), graphene oxide is obtained. That procedure, now commonly referred to as the Hummers’ method, has become the most popular for the preparation of graphene oxide.
The preparation of graphene oxide with wet oxidation methods usually starts from graphite. Here we describe a convenient method for the preparation of graphene oxide which makes use of expandable graphite, resulting in a simplified process. The obtained graphene oxide has been characterized thoroughly by means of conventional techniques (UV-vis, FTIR and Raman spectroscopy, X-ray powder diffraction, BET) as well as by means of positron annihilation lifetime spectroscopy (PALS).

2. Materials and Methods

Expandable graphite (code 3494, nominal size > 75 μm, expansion ratio 90:1 cm3 g−1) was obtained from Asbury Graphite Mills (Asbury, NJ, USA). Concentrated (98%) sulfuric acid, potassium permanganate and concentrated (30%) hydrogen peroxide were of analytical or ACS reagent grade, obtained from Sigma-Aldrich (Wien, Austria) and used as received. Water obtained by a Milli-Q purification system (Merck Millipore, Wien, Austria) was thoroughly used. All the analyses performed on graphene oxide, except for zeta potential, were carried out on the powder obtained by lyophilization of its aqueous suspension.
Zeta potential analyses were performed with a ZetaSizer APSNano (Malvern Panalytical, London, UK) using 10 mM NaCl as the supporting electrolyte. Scanning electron microscopy (SEM) was performed with a JEOL JSM 7600f (JEOL Ltd., Tokyo, Japan). To facilitate imaging, the samples were spread on carbon tape and metallized with Au-Pd alloy. Raman spectra were obtained with a Horiba Jobin Yvon LabRam HR800 (HORIBA Scientific Ltd., Kyoto, Japan). The Brunauer-Emmett-Teller (BET) specific surface area was obtained from N2 adsorption/desorption isotherms at 77 K using a Micromeritics Tristar II apparatus (Tristar II 3020). The specific surface area was determined by the instrumental software. Before measurements, sample powders were heat-treated at 150 °C for 4 h under a N2 flow to remove adsorbed foreign species.
X-ray powder diffraction (XRPD) patterns were obtained in Bragg-Brentano geometry at room temperature by a Philips PW3020 diffractometer (Malvern Panalytical, Malvern, UK) equipped with a Cu tube (Cu-Kα1,2 radiation) and a thin nickel foil to suppress the Cu-Kβ radiation. The diffraction patterns were recorded in the 5° ≤ 2θ ≤ 60° range at a step size of 0.05° and a counting time of 15 s step−1. The diffraction peaks have been fitted with pseudo-Voigt functions using the program WinplotR [5] to settle their 2θ position and integral intensity. Synchrotron radiation diffraction data were collected at the ID15A beamline of ESRF for real space analysis. The sample was loaded into 1.0 mm diameter Quartz capillary and mounted on a goniometric head on top of a rotation stage of the ID15A beamline of ESRF at 215.3 mm distance from the detector, a Dectris Pilatus 2 M CdTe (Dectris, Baden, Switzerland). Additionally, an empty Quartz capillary of the same diameter was measured in the same conditions for background subtraction. 82 frames of 20 s each were collected for the sample and 50 frames of 20 s each for the empty capillary. Sample-detector distance, detector tilt, beam position, and wavelength (λ = 0.18233 Å) were calibrated using the diffraction pattern of CeO2 via the library pyFAI [6]. Raw diffraction images were scaled, averaged, and subtracted by the background (an empty quartz capillary) using the library FabIO [7]. The images were then radially integrated using pyFAI and corrected for the polarization of the incident X-ray beam. For each sample the so-called pair distribution function (PDF) was calculated as the G(r) described in the literature [8] using the program PDFGetX2 [9]. To avoid excessive noise, maximum value of the modulus of the momentum transfer Qmax = 4πsin(θmax)/λ used for PDF calculation was Qmax = 18 Å–1. Data at higher Q values were discarded for their poor signal to noise ratio due to the negligible elastic coherent scattering of carbon.
Positron annihilation lifetime spectroscopy (PALS) measurements were carried out by inserting the positron source, 22Na enveloped between two identical Kapton® foils (thickness 7.6 μm each), between two layers of GO sample in a typical ‘sandwich’ configuration. The thickness of the sample was enough to stop all the injected positrons. The source-sample assembly was placed inside a cylindrical copper cup covered at one extremity by filter paper and inserted in a pumping system. Indeed, the measurements were carried out in a vacuum better than 10−4 mbar. Before starting the measurements, the sample was evacuated for 8 h. Three positron annihilation lifetime spectra were collected through a conventional fast–fast coincidence setup having a resolution of about 290 ps. Each spectrum, containing at least 2 × 10⁶ counts, was analyzed through the computer code LT [10] after subtraction of the background and with a suitable correction for the positrons annihilated in Kapton®.

Preparation of Graphene Oxide (GO)

Graphene oxide was prepared by the oxidation of expanded graphite. In a crystallizing dish, 3 g of expandable graphite were expanded by heating with a domestic microwave oven (800 W, cycles of 20 s each). Irradiation cycles were continued until no further increase in volume was noticeable and the evolution of fumes stopped. Before the subsequent treatments, the expanded graphite was cooled down to room temperature.
To obtain graphene oxide, 1 g of expanded graphite was mixed with 46 mL of concentrated sulfuric acid under stirring in a 250 mL Erlenmeyer flask. After cooling in an ice bath, 6 g of potassium permanganate were added slowly in small portions. The mixture turned green due to the formation of permanganic anhydride (Caution! Permanganic anhydride is a powerful oxidizing agent). After 15 min, 10 mL of 30% hydrogen peroxide were added in small portions under stirring. The mixture turned golden yellow/orange in color. It was stirred for additional 15 min and then centrifuged at 8000 rpm for 5 min. Pellets with gold luster were obtained, which were re-dispersed in water by the aid of sonication. As soon as the pellets dispersed, the viscosity of the suspension increased dramatically, and its color turned to a honey hue, indicating successful exfoliation. After dilution with water, large aggregates as well as unreacted graphite were removed by centrifugation (7000 rpm, 5 min). The graphene oxide was collected and purified by repeated centrifugation (8000 rpm, 60 min) and re-dispersion in water until the pH of the supernatant was neutral. The concentration of the final suspension was determined gravimetrically to be 3.2 mg mL−1.

3. Results and Discussion

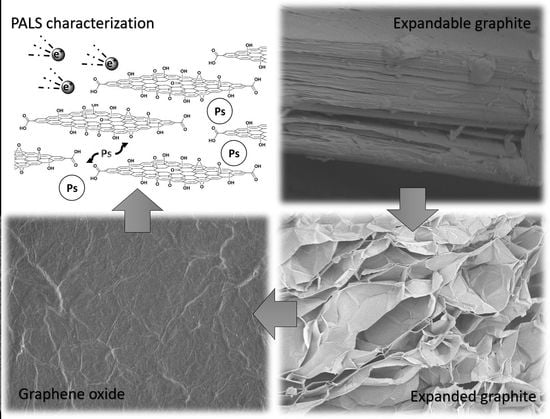
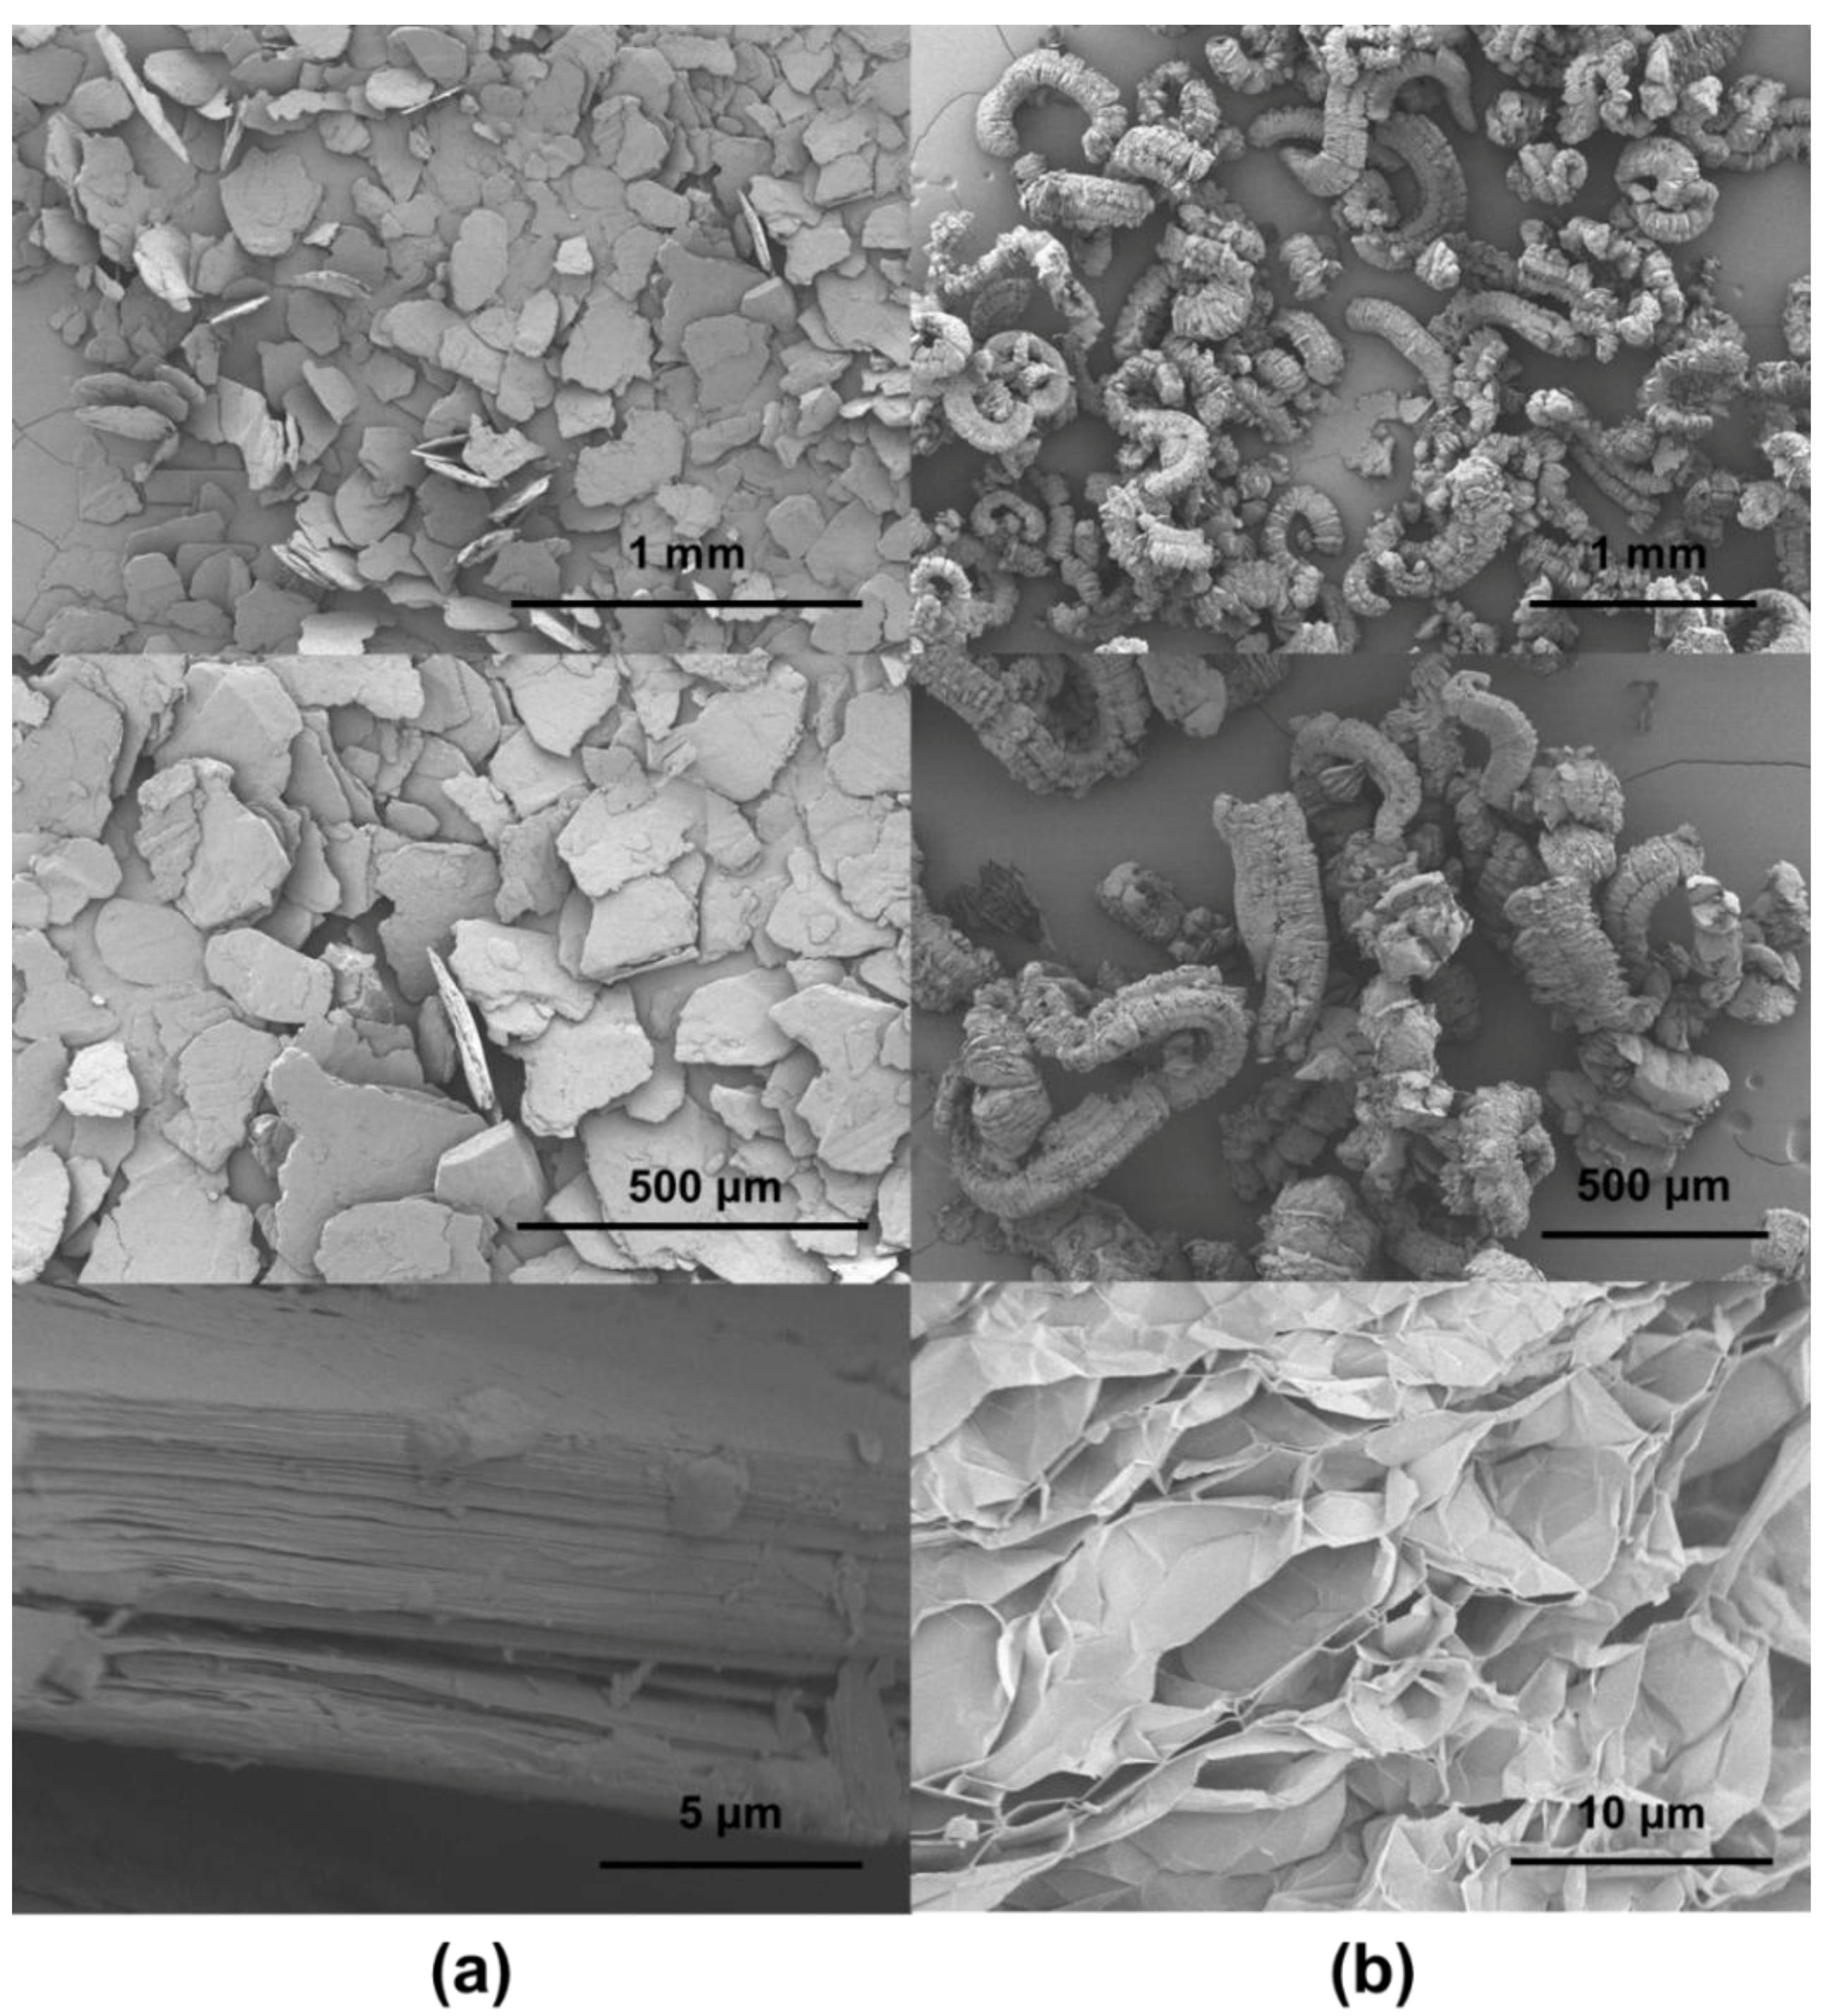
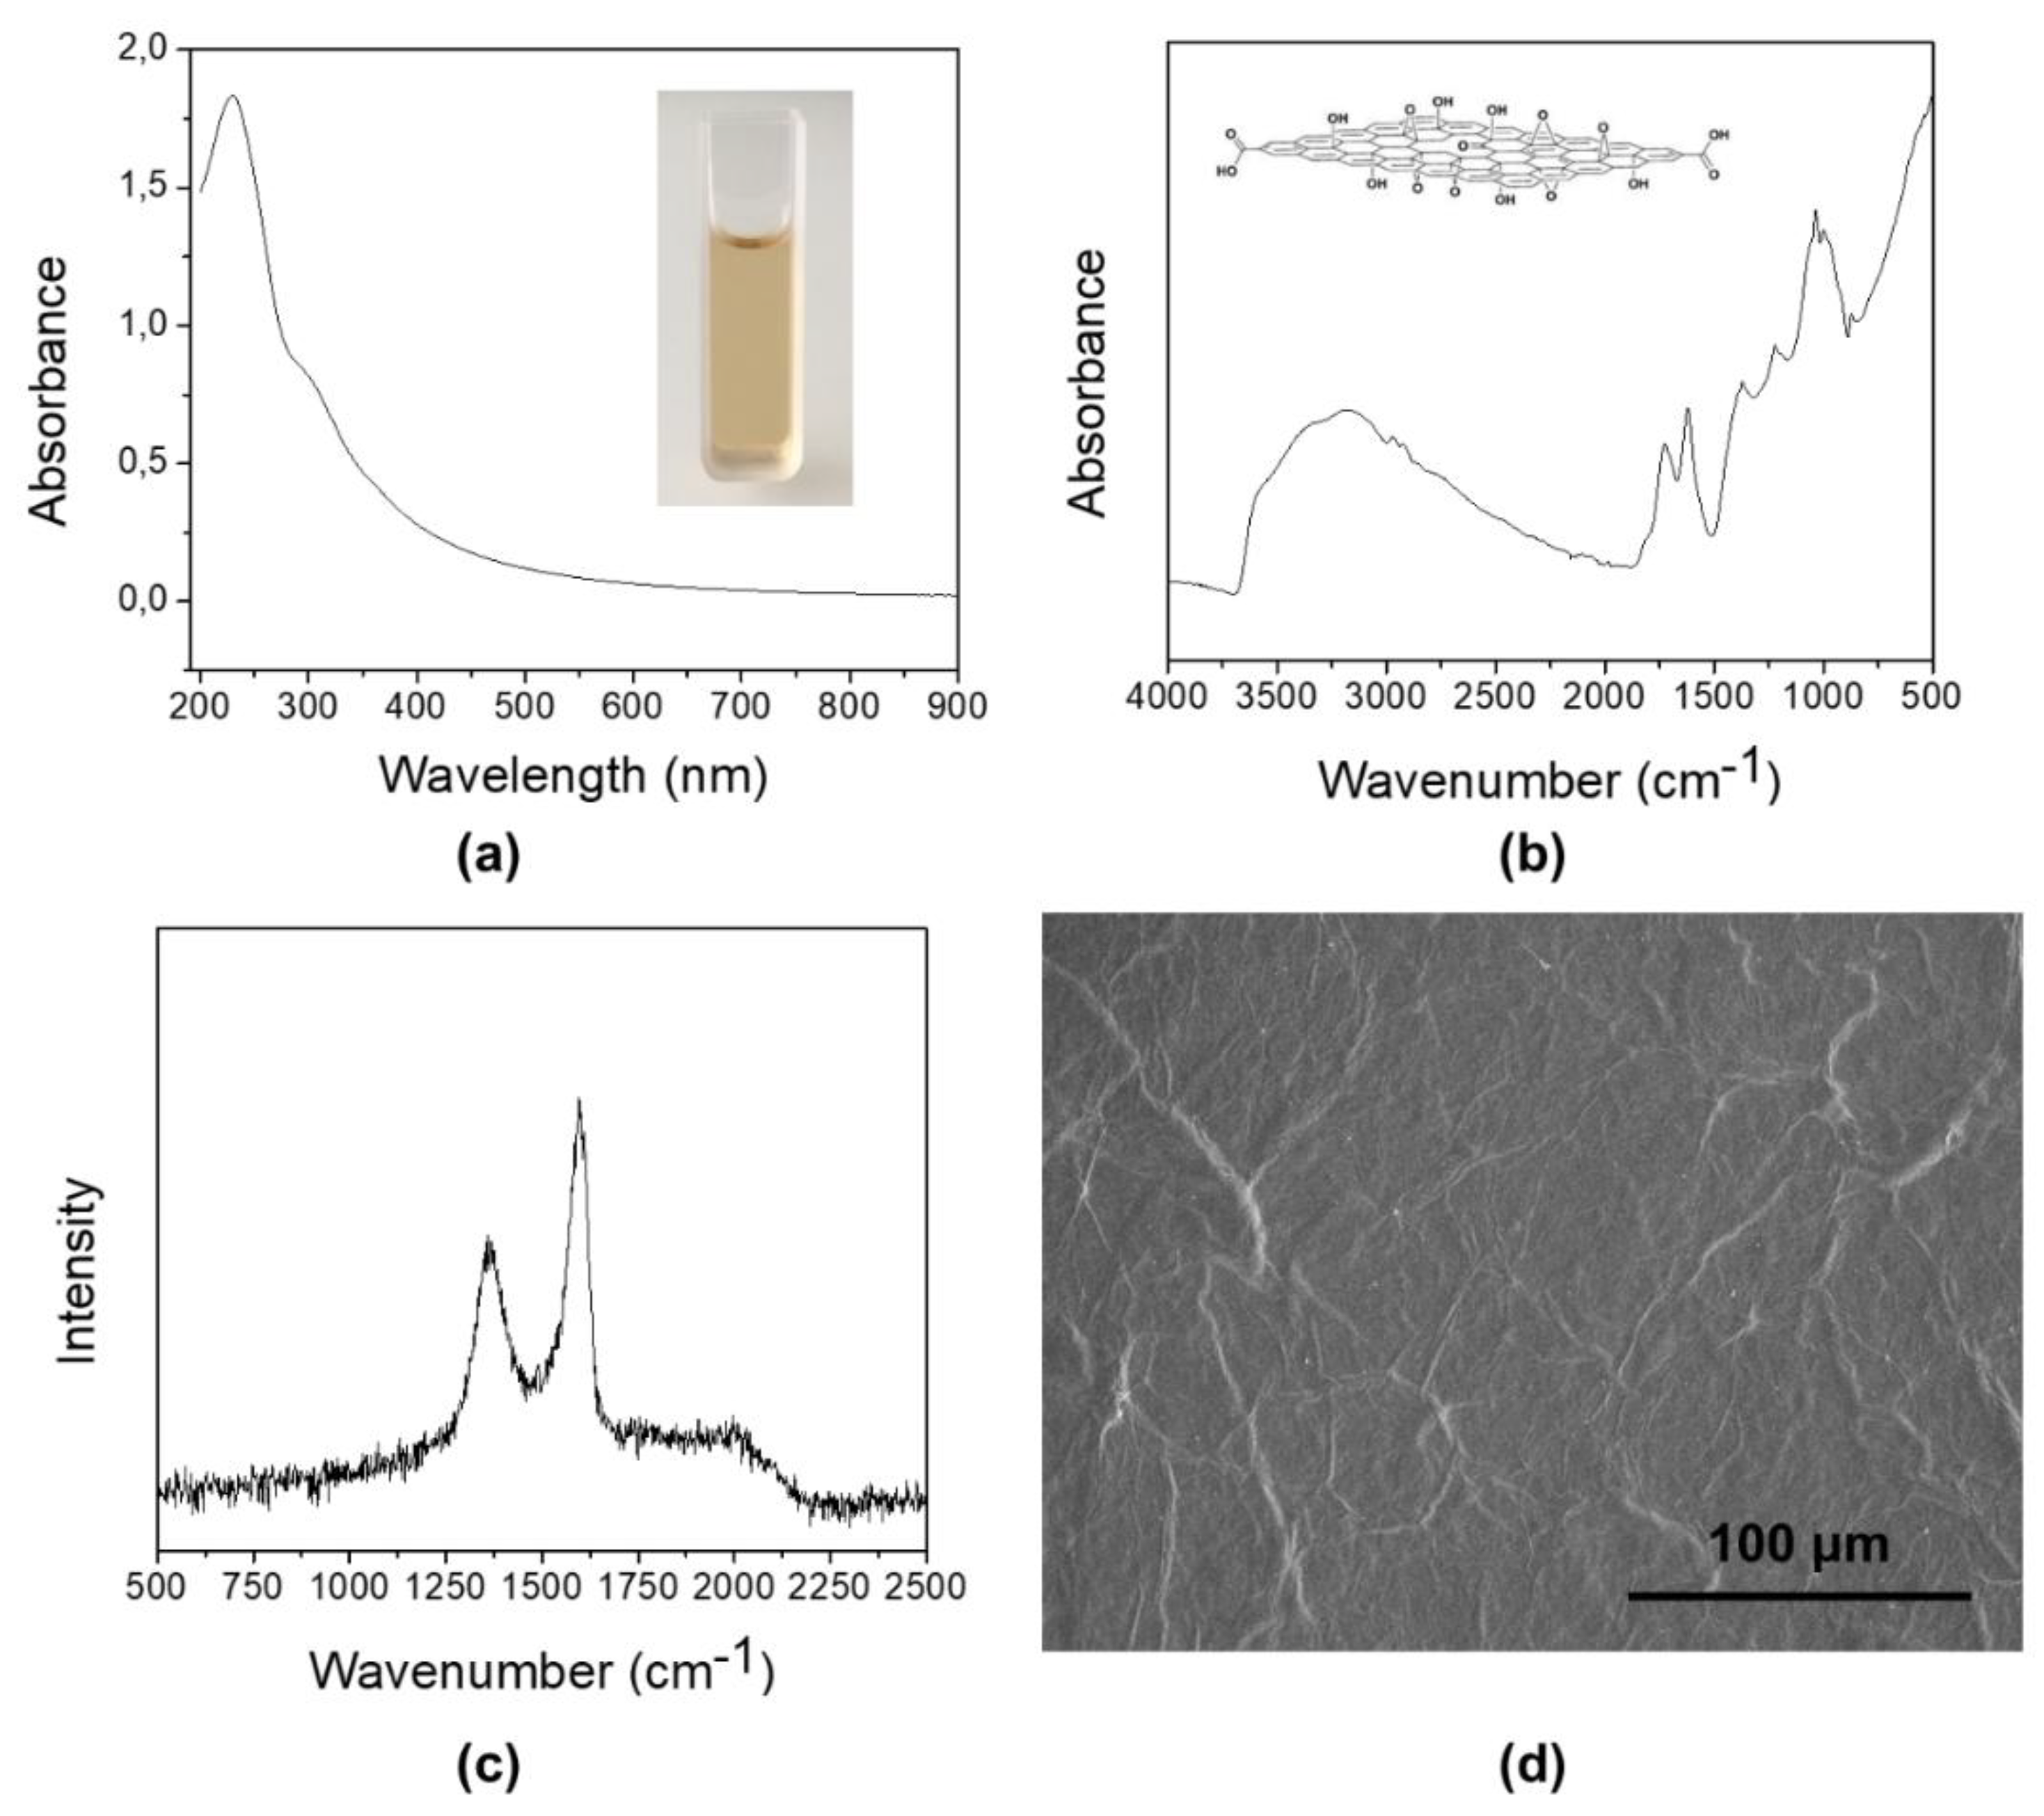
3.1. Graphene Oxide from Expanded Graphite by a Simplified Hummers’ Method

Expandable graphite is an intercalation compound of graphite that expands and partially exfoliates upon thermal treatment. It is obtained by treating flake graphite with various intercalation species (most often sulfuric acid), which migrate between the graphene layers in the graphite crystal and there remain as stable species. When exposed to a rapid increase in temperature, these intercalation compounds decompose into gaseous products (sulfur and carbon oxides in case of sulfuric acid), resulting in the buildup of a high interlayer pressure. This pressure develops enough force to push apart graphite basal planes, with a consequent increase in volume, lowering of bulk density and increase in surface area [11]. Expandable graphite is a convenient industrial product, which finds use especially as a fire-retardant filler thanks to its intumescent properties [12].
The possibility to use commercial expanded graphite to produce graphene oxide has been reported in a previous report, thus only the wet chemical oxidation was described [13]. Here, in addition, we demonstrate that thermal expansion can be conveniently achieved using microwave irradiation. Compared to the conventional oven expansion treatment, this process is faster and more controllable (with reduced risk of overheating and combustion). The resulting expansion is evident from the scanning electron microscopy images: Figure 1a shows the pristine expandable graphite while Figure 1b displays after the expansion. In this latter case, typical wormlike structures are obtained, which result from the increased distance between the graphite layers. In this state, however, simple dispersion in a solvent, even aided by sonication, will not result in complete exfoliation. To achieve complete exfoliation with formation of graphene oxide it is necessary to deeply oxidize graphite, such as by means of a modified Hummers’ method.
The Hummers’ method is based on the in situ generation of permanganic anhydride, a powerful oxidizing agent, in a mixture of potassium permanganate and concentrated sulfuric acid. The exfoliation is completed by the addition of hydrogen peroxide, which helps separate the graphene flakes by reacting vigorously with the permanganic anhydride producing gases (oxygen and water vapor), and eventually by sonication. The overall process takes less than one hour to be completed.
Eventually, a stable aqueous suspension of graphene oxide was obtained. The measured zeta potential was −47 ± 2.8 mV, a value in accordance with previous literature results and which indicates the presence of carboxylic acid moieties in the GO structure [14]. The UV-vis spectrum of a dilute aqueous suspension (Figure 2a) shows a characteristic monotonic absorbance profile from 900 nm to 350 nm, followed by a shoulder at around 300 nm which is due to the π–π* transition of C=O bonds. The absorbance increases up to about 230 nm, culminating in a peak due to the electronic transitions of oxygen moieties [15]. The FTIR spectrum, reported in Figure 2b, is more informative and confirms the presence of hydroxyl, carbonyl, and epoxy or ether groups [16,17]. More in detail: a broad band between 3700 cm−1–3000 cm−1 is the result of the presence of adsorbed water and structural hydroxyl groups, the band located at 1720 cm−1 can be assigned to the stretching vibration of the C=O bonds of carboxyl groups on the edges of layer planes, while that at 1619 cm−1 can be assigned to the stretching of C=C bonds; eventually, the intense band with two peaks, one at 1034 cm−1 and 997 cm−1, can be indicative of the presence of ether or epoxy groups (C–O–C bonds).
The Raman spectrum (Figure 2c) shows two distinctive peaks, one at ~1357 cm−1 and the other at ~1598 cm−1. The former is usually referred to as a D peak (which is originated by sp3-hybridized carbon atoms), while the latter as a G peak (originated by the stretching of sp2 bonds); they are assigned respectively to the graphitized structure and its local defects. The ID/IG ratio can thus be used to estimate the relative order of the graphitized structure in the synthesized GO. It is generally accepted that the lower this ratio, the less disorder and defects are present in GO [18,19]. Since for our sample ID/IG = 1.18, we could conclude that, being D-band prominent in respect to G-band, the size of the in-plane sp2 domains is not extended as in graphene. A representative SEM image of the completely exfoliated sheets of GO is shown in Figure 2d. The specific surface area, measured by means of nitrogen BET, was about 7.15 ± 0.05 m2 g−1.

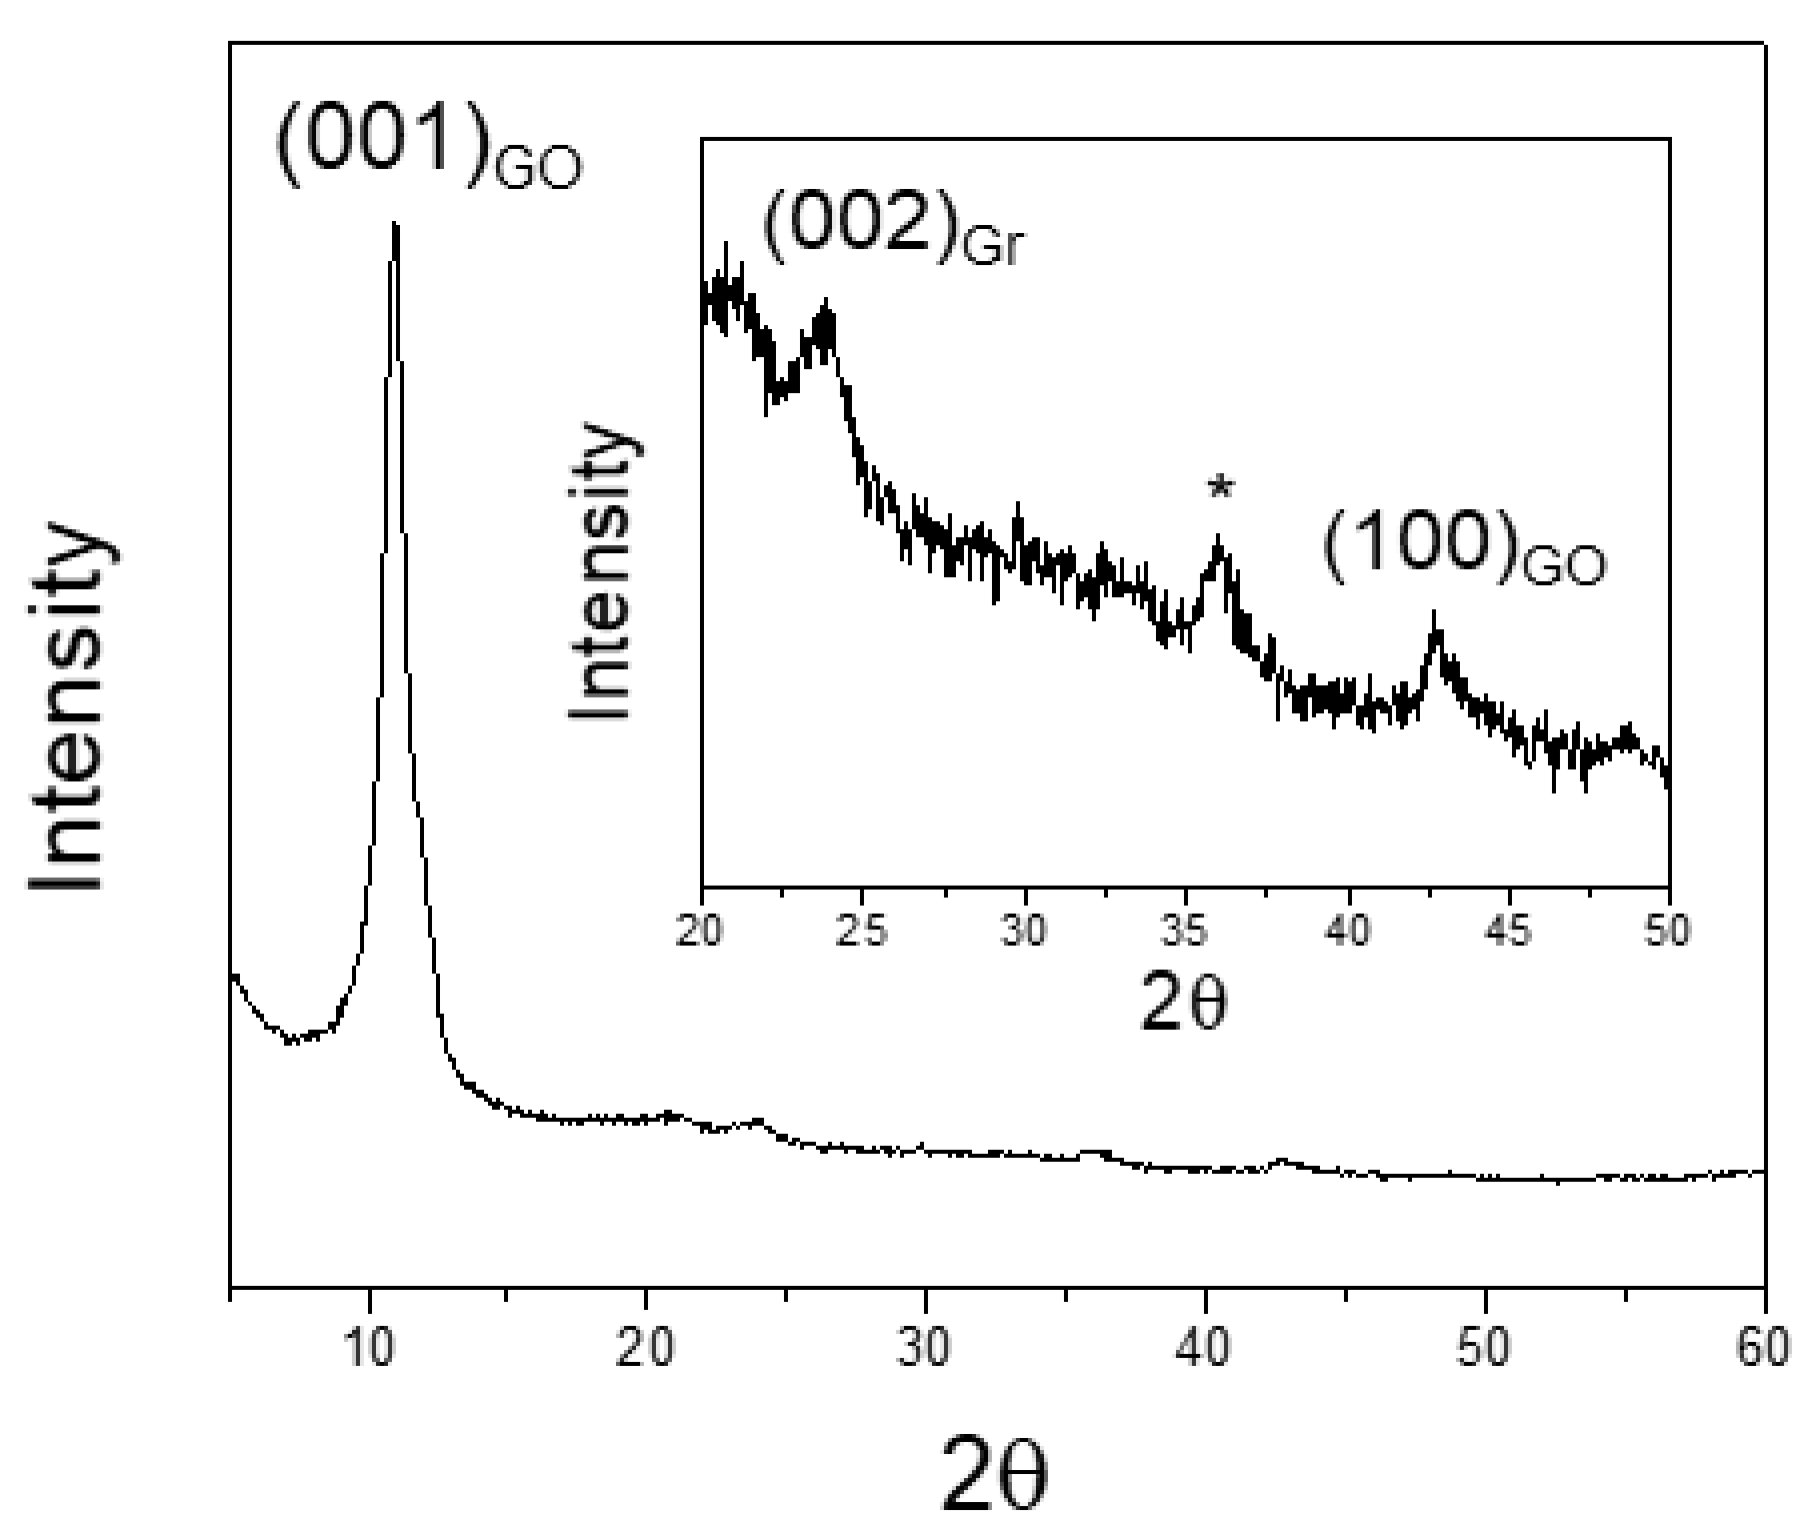
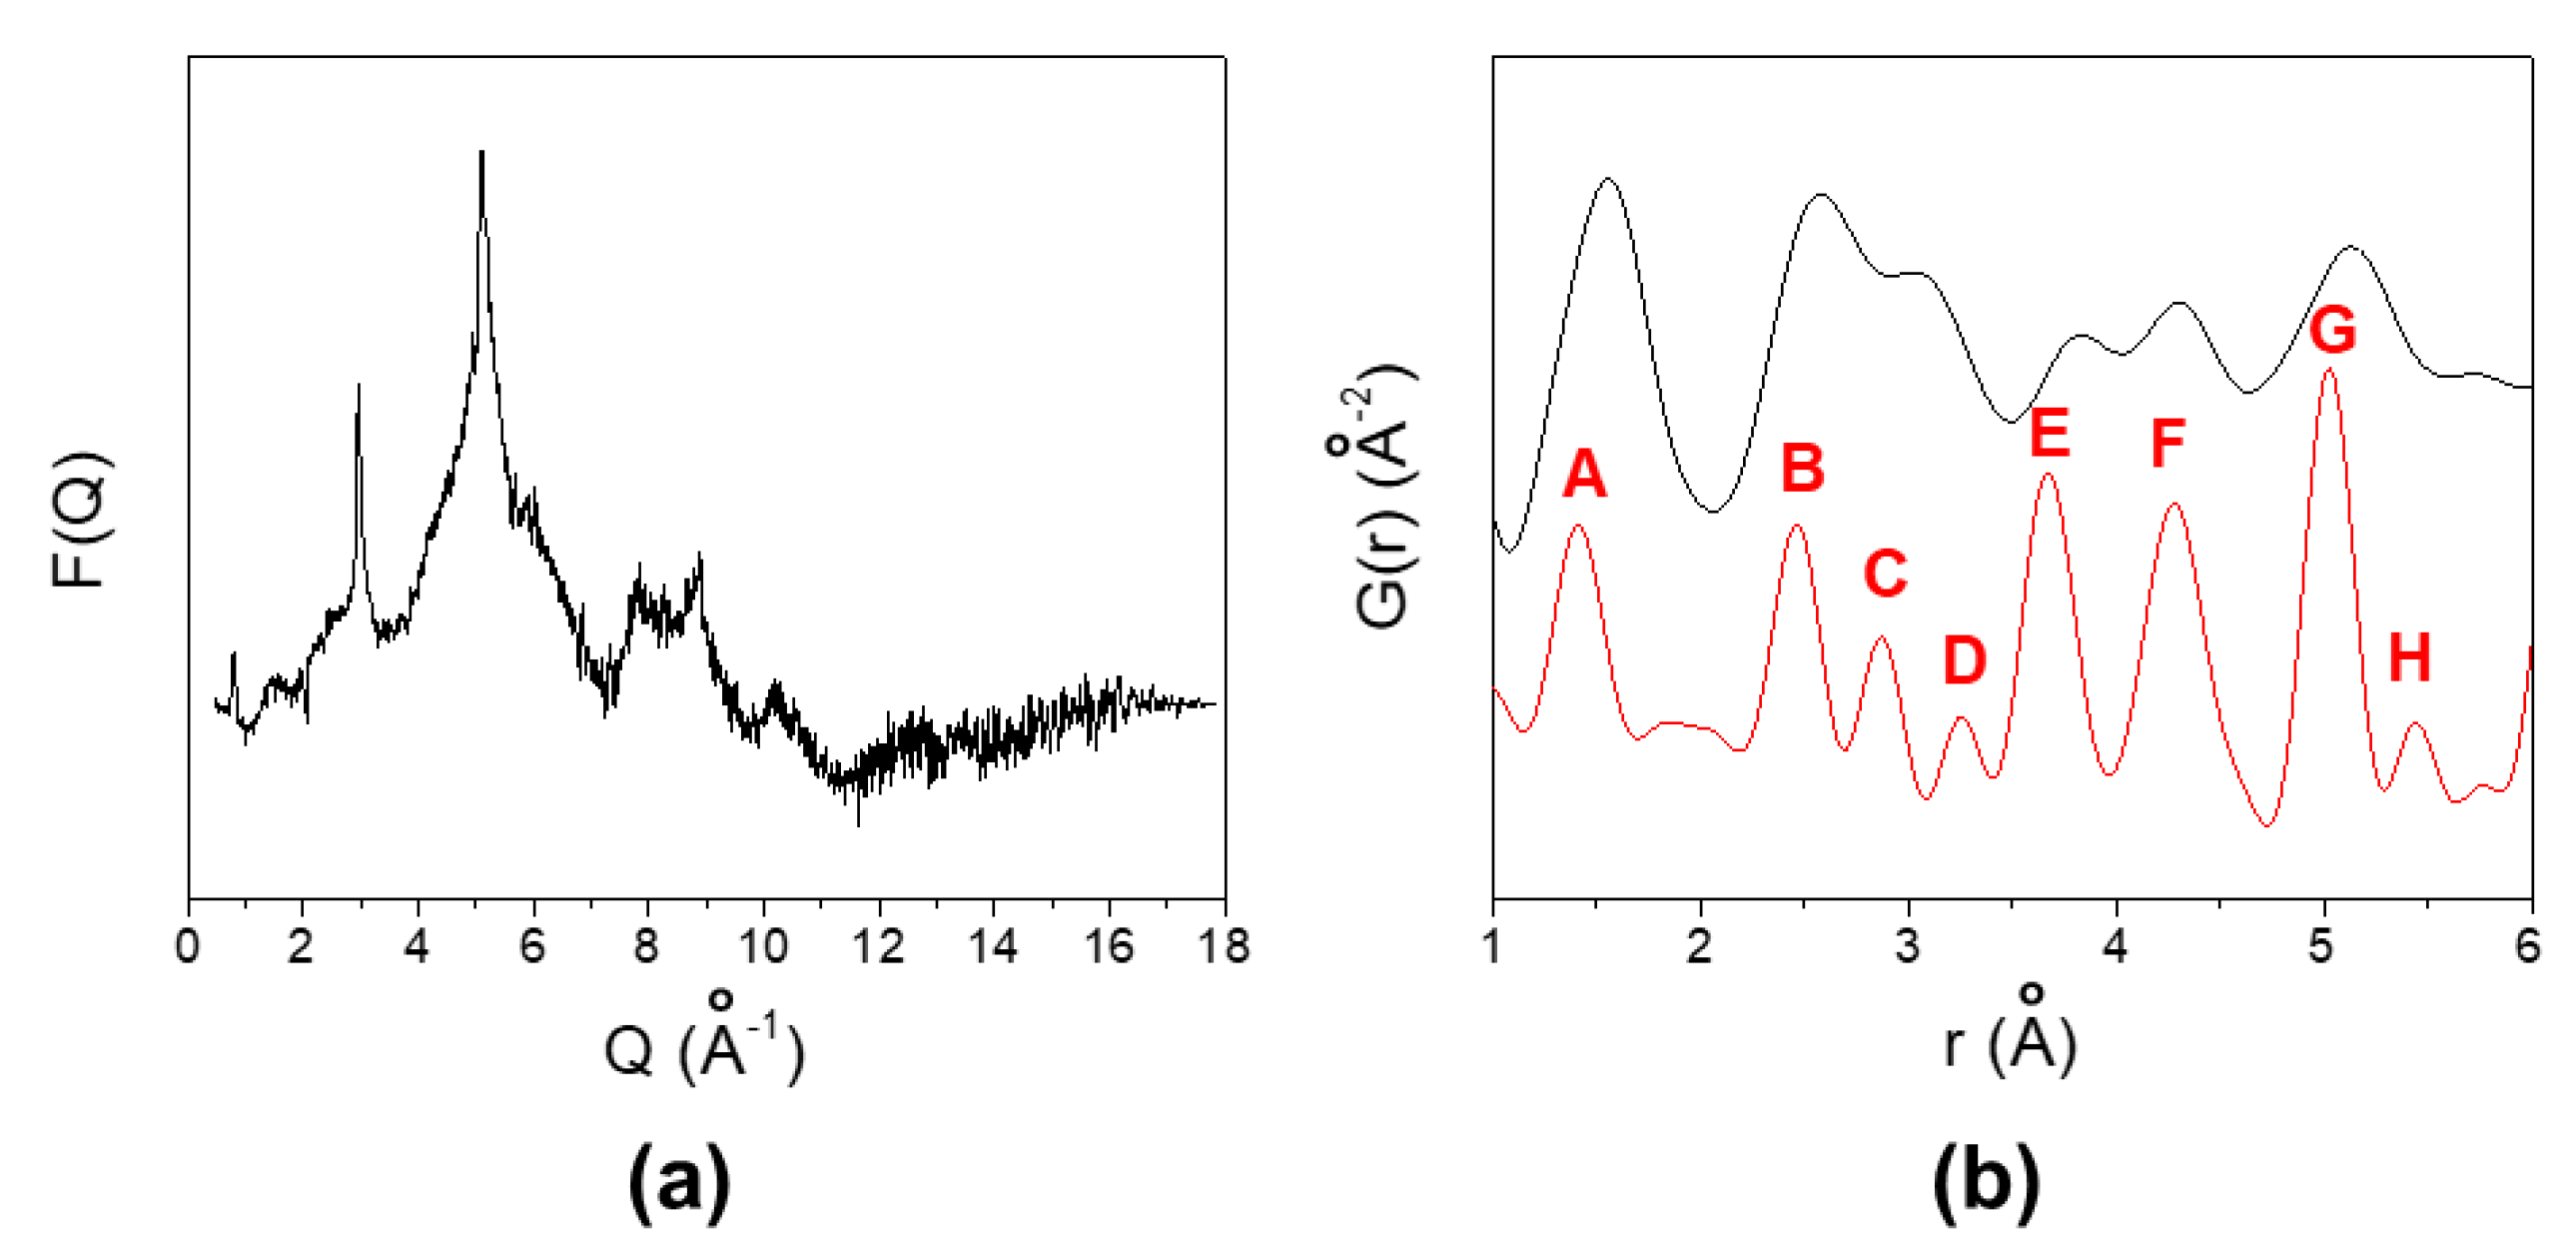
3.2. X-ray Powder Diffraction (XRPD) Results

The X-ray powder diffraction pattern obtained for our graphene oxide is shown in Figure 3. The numbers in brackets in correspondence to the Bragg peaks are the Miller indexes of reflections based on graphite hexagonal cell. The pattern is dominated by an intense peak at 10.91°: (001)GO ascribable to stacking of GO planes along the c direction with interlayer distance d(001)GO = 8.10 Å, confirming the high oxidation degree of this GO sample [20]. Two tiny peaks are also visible at 23.78°, and 42.74° (see inset of Figure 3), attributed to (002)Gr, and (100)GO reflection respectively. The inter-plane distance of the former peak d(002)Gr = 3.734 Å is perfectly compatible with the (002) reflection of a graphite cell with c ≈ 6.7 Å [19]. We have to underline that a very small amount of graphite exists in the sample: the integral intensity of (001)GO is ≈ 2 × 10⁴ counts, compared to less than 102 counts for (002)Gr. A rough estimation of the hexagonal a cell parameter of GO can be gained by the position of (100)GO reflection (d(100)GO = 2.114 Å) through the equation a = d(100)_GO sin(120°) ≈ 2.44 Å. The intensity of this peak is very small because of the extreme preferential orientation of the sample in Bragg-Brentano geometry. A third, unindexed peak around 35.90°, labelled with an asterisk, is also visible (Figure 3, inset).
Figure 4 shows the F(Q) = Q(S(Q) − 1) function, obtained from the data collected at ID15 beamline after background subtraction, suitable corrections and normalization [8,9]. In the panel B of the same Figure is reported the low r part of the G(r) function of GO after Fast Fourier Transformation (black curve) together to the calculated G(r) of graphite, based on Reference [21], for sake of comparison. The same Qmax = 18.0 Å−1 of the experimental data has been used for the calculated G(r) to get the same r resolution. Labels indicate the C couples of atoms involved in each G(r) peak as described in detail in Reference [22].
In pure graphite, the A, B and C peaks relate the intraplane ortho (1.42 Å), meta (2.46 Å) and para (2.84 Å) C–C distances, respectively. In the experimental data, the nearest distances appear around r ≈ 1.56 Å, suggesting a marked (sp3)–(sp3) nature of the C–C bond in the GO sample. We must warn that the A peak contains the contribution also of C–O bonds formed during oxidation. The B and C peaks are shifted towards larger r values too (2.58 and 3.06 Å, respectively). All the peaks are broader than the calculated ones, suggesting the presence of large disorder: bonds of different nature (and length) contribute to each peak. Only interplane bonds contribute to the D and H peaks. Their intensity vanishes for the GO sample, in line with the huge expansion of the interlayer distance. Finally, both intra- and interplane distances contribute to E–G peaks. Again, both their low intensity and broadening in respect to the graphite model are in accord with increasing disorder and decreased structural coherence on increasing interatomic distances.

3.3. Positron Annihilation Lifetime Spectroscopy (PALS) of GO

Positron annihilation lifetime spectroscopy (PALS) is a non-destructive experimental technique able to supply information on defects in metals [23] and semiconductors [24] as well as on voids in non-metallic materials, especially polymers [25,26,27,28,29,30]. For this last class of materials, the probe is positronium (Ps), an unstable electron-positron bound state which may be formed when a positron introduced in the sample and rapidly thermalized encounters an electron of the medium. Ps is a ‘hole seeker’, since it localizes in the open spaces of the host structure. In a vacuum, lifetime of ortho-Ps (o-Ps), the ground state with parallel spins of the two particles, amounts to 142 ns. In a cavity of a medium o-Ps interacts with the surrounding electrons and annihilation with an ‘external’ electron (that is, not belonging to Ps) becomes possible. This process, called ‘pickoff annihilation’, decreases the lifetime of o-Ps: the smaller the size of the hole, the lower the lifetime. This correlation is the essence of Ps applications to porous structures: indeed, by assuming a suitable geometry for the cavity, it is possible to convert o-Ps lifetime into a size of the hole.
Positron annihilation lifetime spectroscopy (PALS) results were analyzed in three discrete components obtaining the values of lifetime and intensity listed in Table 1.
We attribute the shortest lifetime component to positrons annihilating in the bulk as well as to p-Ps annihilations. This last contribution cannot be resolved as a distinct component, owing to both the resolution of the apparatus and the intensity of the signal itself, which can be expected to be of the order of one third of the intensity of the longest component. The intermediate component originates from positrons annihilating into the cavities in the material; their lifetime is higher than the shortest one, since the electron density surrounding the positron is lower with respect to the bulk. The longest component is attributed to the decay of o-Ps trapped in open volumes. It is difficult to compare our results with those of the literature since there are very few PALS studies on “pure” graphene oxide: indeed, almost all available studies describe GO-based composites or membranes with different polymers or molecular additives. Furthermore, the comparison is made more difficult due to the very different preparations of the samples. Tang et al. [31] measured PALS spectra for both dry and wet GO but they did not report the value of o-Ps lifetime, their analysis being based on the intermediate component of the spectrum. They found that the corresponding intensity I3 increased from 1.2% (dry sample) to 5.5% for the wet sample. We found an intensity I3 which is intermediate between these values. Our lifetimes are in agreement, within the uncertainties, with those reported by Gong et al. [32], although the intensities are rather different.
o-Ps lifetime is generally translated into a typical size of the host cavity by using the Tao-Eldrup equation [33,34], which supplies, in spherical approximation, the corresponding radius R (Equation (1)):
τ 3 = τ 0 [ 1 R R + δ R + 1 2 π s i n ( 2 π R R + δ R ) ] 1
where τ0 0.5 ns is the annihilation lifetime of o-Ps in the presence of a high electron density and ΔR (=0.166 nm) is an empirical parameter [34,35] describing the penetration of the Ps wavefunction into the bulk. By using the value in Table 1 for τ3, a radius R = 0.32 nm is obtained. However, since most of the space available in GO is found in the interlayer distance, a more suitable model for the void hosting Ps is a cavity in a shape of parallelepiped, with two dimensions, a2 and a3, larger than the third one l, which corresponds to the interlayer distance. In this case a modified equation, based on the same assumptions of the Tao-Eldrup equation (Equation (2)), can be used [36]:
τ 3 = τ 0 [ 1 ( l l + 2 Δ R + 1 π s i n l l + 2 Δ R ) ( a 2 a 2 + 2 Δ R + 1 π s i n a 2 a 2 + 2 Δ R ) ( a 3 a 3 + 2 Δ R + 1 π s i n a 3 a 3 + 2 Δ R ) ] 1
where a2 = a3 = kl. We chose k = 10. We obtained l = 0.32 nm, which is about 0.5 nm less with respect to the value found from XRD measurements. In analyzing this result, however, it is necessary to consider the volume occupied by the oxygen-containing functional groups, which are localized in the gap. In other words, while XRD reveals a ‘pure’ interlayer distance, the layer experienced by Ps is affected by the steric constraints imposed by the presence of the interlayer bonds, mainly due to hydroxyl, carbonyl and epoxide groups, which decrease the effective interlayer distance by about 0.28 nm. That water can be entrapped between layers of graphene oxide is known from previous studies [37], and the presence of water molecules will decrease the volume available for Ps: one water monolayer would correspond to a thickness of 0.25 nm. Functional groups containing oxygen exert an influence on Ps by acting as inhibitors of its formation. Indeed, free positrons are attracted by these strongly electronegative groups and annihilate with the surrounding electrons, thus reducing the probability of Ps formation. This contributes to the low value of the corresponding intensity I3.

4. Conclusions

In the present work, we demonstrated that graphene oxide can be conveniently prepared from expandable graphite through a simplified Hummers’ method. The characterization techniques implemented allowed us to follow the different stages of the synthesis and to demonstrate the quality of the obtained product, which is comparable to that obtained by other state-of-the-art methods. Furthermore, positron annihilation lifetime spectroscopy (PALS) was used to probe the interlayer space of graphene oxide. The difference observed for the values of the interlayer distance as obtained with X-ray diffraction and with PALS has been explained by the steric hindrance originated by the oxygen-based functional groups (such as hydroxyl, epoxy and carboxylic acid) decorating both sides of the graphene oxide layers as well as by the entrapped water molecules. These groups may also be responsible for the reduced positronium formation due to Ps quenching. In conclusion, we are confident that the application of positron annihilation lifetime spectroscopy will be helpful to provide a better understanding of the micro- and nanostructure of graphene-based materials.

Author Contributions

G.P. provided the graphene oxide and wrote the manuscript. G.C. and F.Q. performed and analyzed the results of PALS measurements. M.S. performed the analysis of XRPD data. M.L. performed the BET analysis. All coauthors provided advice and helped writing the manuscript.

Funding

This research received no external funding.

Acknowledgments

Alberto Savoini (Eni Donegani Research Centre for Renewable Energies and the Environment, Novara, Italy) is kindly acknowledged for having performed the Raman analyses. The authors gratefully thank ESRF-European Synchrotron for beam time and Stefano Checchia for assistance during experiment ch5514. They also thank Iolanda Biraghi for lab-XRPD measurements.

Conflicts of Interest

The authors declare no conflict of interest.

References

  1. Novoselov, K.S.; Geim, A.K.; Morozov, S.V.; Jiang, D.; Zhang, Y.; Dubonos, S.V.; Grigorieva, I.V.; Firsov, A.A. Electric field in atomically thin carbon films. Science 2004, 306, 666–669. [Google Scholar] [CrossRef] [PubMed]
  2. Allen, M.J.; Tung, V.C.; Kaner, R.B. Honeycomb carbon: A review of graphene. Chem. Rev. 2010, 110, 132–145. [Google Scholar] [CrossRef]
  3. Georgakilas, V.; Otyepka, M.; Bourlinos, A.B.; Chandra, V.; Kim, N.; Kemp, K.C.; Hobza, P.; Zboril, R.; Kim, K.S. Functionalization of graphene: Covalent and non-covalent approaches, derivatives and applications. Chem. Rev. 2012, 112, 6156–6214. [Google Scholar] [CrossRef] [PubMed]
  4. Hummers, W.S.; Offeman, R.E. Preparation of Graphitic Oxide. J. Am. Chem. Soc. 1958, 80, 1339. [Google Scholar] [CrossRef]
  5. Roisnel, T.; Rodríquez-Carvajal, J. WinPLOTR: A Windows Tool for Powder Diffraction Pattern Analysis. Mater. Sci. Forum 2001, 378–381, 118–123. [Google Scholar] [CrossRef]
  6. Ashiotis, G.; Deschildre, A.; Nawaz, Z.; Wright, J.P.; Karkoulis, D.; Picca, F.E.; Kieffer, J. The fast azimuthal integration Python library: PyFAI. J. Appl. Crystallogr. 2015, 48, 510–519. [Google Scholar] [CrossRef] [PubMed]
  7. Knudsen, E.B.; Sørensen, H.O.; Wright, J.P.; Goret, G.; Kieffer, J. FabIO: Easy access to two-dimensional X-ray detector images in Python. J. Appl. Crystallogr. 2013, 46, 537–539. [Google Scholar] [CrossRef]
  8. Egami, T.; Billinge, S.J.L. Underneath Bragg Peaks; Pergamon: New York, NY, USA, 2003. [Google Scholar]
  9. Qiu, X.; Thompson, J.W.; Billinge, S.J.L. PDFgetX2: A GUI-driven program to obtain the pair distribution function from X-ray powder diffraction data. J. Appl. Crystallogr. 2004, 37, 678. [Google Scholar] [CrossRef]
  10. Kansy, J. Microcomputer program for analysis of positron annihilation lifetime spectra. Nucl. Instrum. Methods Phys. Res. Sect. A Accel. Spectrom. Detect. Assoc. Equip. 1996, 374, 235–244. [Google Scholar] [CrossRef]
  11. Focke, W.W.; Badenhorst, H.; Mhike, W.; Kruger, H.J.; Lombaard, D. Characterization of commercial expandable graphite fire retardants. Thermochim. Acta 2014, 584, 8–16. [Google Scholar] [CrossRef]
  12. Modesti, M.; Lorenzetti, A.; Simioni, F.; Camino, G. Expandable graphite as an intumescent flame retardant in polyisocyanurate-polyurethane foams. Polym. Degrad. Stab. 2002, 77, 195–202. [Google Scholar] [CrossRef]
  13. Sun, L.; Fugetsu, B. Mass production of graphene oxide from expanded graphite. Mater. Lett. 2013, 109, 207–210. [Google Scholar] [CrossRef] [Green Version]
  14. Konkena, B.; Vasudevan, S. Understanding aqueous dispersibility of graphene oxide and reduced graphene oxide through pKa measurements. J. Phys. Chem. Lett. 2012, 3, 867–872. [Google Scholar] [CrossRef] [PubMed]
  15. Arrais, A.; Diana, E.; Boccaleri, E. A study on the carbon soot derived from the wood combustion and on the relative alkali-extractable fraction. J. Mater. Sci. 2006, 41, 6035–6045. [Google Scholar] [CrossRef]
  16. Arrais, A.; Diana, E.; Rossetti, R.; Boccaleri, E. Spectral and chemical evidence for the direct formation of carboxylic groups in aerobically oxidised water-soluble fullerenes. Carbon 2007, 13, 2502–2510. [Google Scholar] [CrossRef]
  17. Hontoria-Lucas, C.; López-Peinado, A.J.; de López-González, J.D.; Rojas-Cervantes, M.L.; Martín-Aranda, R.M. Study of oxygen-containing groups in a series of graphite oxides: Physical and chemical characterization. Carbon N. Y. 1995, 33, 1585–1592. [Google Scholar] [CrossRef]
  18. Wu, J.B.; Lin, M.L.; Cong, X.; Liu, H.N.; Tan, P.H. Raman spectroscopy of graphene-based materials and its applications in related devices. Chem. Soc. Rev. 2018, 47, 1822–1873. [Google Scholar] [CrossRef] [Green Version]
  19. Kudin, K.N.; Ozbas, B.; Schniepp, H.C.; Prud’homme, R.K.; Aksay, I.A.; Car, R. Raman spectra of graphite oxide and functionalized graphene sheets. Nano Lett. 2008, 8, 36–41. [Google Scholar] [CrossRef]
  20. Krishnamoorthy, K.; Veerapandian, M.; Yun, K.; Kim, S.J. The chemical and structural analysis of graphene oxide with different degrees of oxidation. Carbon N. Y. 2013, 53, 38–49. [Google Scholar] [CrossRef]
  21. Wyckoff, R.W.G. Crystal Structure; Interscience Publishers: New York, NY, USA, 1963. [Google Scholar]
  22. Longhi, M.; Marzorati, S.; Checchia, S.; Sacchi, B.; Santo, N.; Zaffino, C.; Scavini, M. Sugar-based catalysts for oxygen reduction reaction. Effects of the functionalization of the nitrogen precursors on the electrocatalytic activity. Electrochim. Acta 2016, 222, 781–792. [Google Scholar] [CrossRef]
  23. Sormann, H.; Kontrym-Sznajd, G. Many-body effects on the electron-positron momentum density in simple and transition metals: Comparison with positron annihilation spectroscopy data. Phys. Rev. B Condens. Matter Mater. Phys. 2006, 73, 075111. [Google Scholar] [CrossRef]
  24. Tuomisto, F.; Makkonen, I. Defect identification in semiconductors with positron annihilation: Experiment and theory. Rev. Mod. Phys. 2013, 85, 1583–1631. [Google Scholar] [CrossRef] [Green Version]
  25. Jean, Y.C.; Van Horn, J.D.; Hung, W.S.; Lee, K.R. Perspective of positron annihilation spectroscopy in polymers. Macromolecules 2013, 46, 7133–7145. [Google Scholar] [CrossRef]
  26. Panzarasa, G.; Aghion, S.; Soliveri, G.; Consolati, G.; Ferragut, R. Positron annihilation spectroscopy: A new frontier for understanding nanoparticle-loaded polymer brushes. Nanotechnology 2016, 27, 02LT03. [Google Scholar] [CrossRef] [PubMed]
  27. Panzarasa, G.; Aghion, S.; Marra, G.; Wagner, A.; Liedke, M.O.; Elsayed, M.; Krause-Rehberg, R.; Ferragut, R.; Consolati, G. Probing the Impact of the Initiator Layer on Grafted-from Polymer Brushes: A Positron Annihilation Spectroscopy Study. Macromolecules 2017, 50, 5574–5581. [Google Scholar] [CrossRef]
  28. Pandini, S.; Bignotti, F.; Baldi, F.; Sartore, L.; Consolati, G.; Panzarasa, G. Thermomechanical and large deformation behaviors of antiplasticized epoxy resins: Effect of material formulation and network architecture. Polym. Eng. Sci. 2017, 57, 553–565. [Google Scholar] [CrossRef]
  29. Dehghani, E.S.; Aghion, S.; Anwand, W.; Consolati, G.; Ferragut, R.; Panzarasa, G. Investigating the structure of crosslinked polymer brushes (brush-gels) by means of Positron Annihilation Spectroscopy. Eur. Polym. J. 2018, 99, 415–421. [Google Scholar] [CrossRef]
  30. Consolati, G.; Panzarasa, G.; Quasso, F. Morphology of free volume holes in an amorphous polyether-polyester polyurethane of biomedical interest. Polym. Test. 2018, 68, 208–212. [Google Scholar] [CrossRef]
  31. Tang, Y.P.; Paul, D.R.; Chung, T.S. Free-standing graphene oxide thin films assembled by a pressurized ultrafiltration method for dehydration of ethanol. J. Memb. Sci. 2014, 458, 199–208. [Google Scholar] [CrossRef]
  32. Gong, W.; He, D.; Tao, J.; Zhao, P.; Kong, L.; Luo, Y.; Peng, Z.; Wang, H. Formation of defects in the graphite oxidization process: A positron study. RSC Adv. 2015, 5, 88908–88914. [Google Scholar] [CrossRef]
  33. Tao, S.J. Positronium annihilation in molecular substances. J. Chem. Phys. 1972, 56, 5499. [Google Scholar] [CrossRef]
  34. Eldrup, M.; Lightbody, D.; Sherwood, J.N. The temperature dependence of positron lifetimes in solid pivalic acid. Chem. Phys. 1981, 63, 51–58. [Google Scholar] [CrossRef]
  35. Nakanishi, H.; Wang, S.J.; Jean, Y.C. Positron Annihilation Studies of Fluids; Sharma, S.C., Ed.; World Scientific: Singapore, 1988. [Google Scholar]
  36. Jasinska, B.; Koziol, A.E.; Goworek, T. Void shapes and o-Ps lifetimes in molecular crystals. Acta Phys. Pol. A 1999, 95, 557–561. [Google Scholar] [CrossRef]
  37. He, H.; Riedl, T.; Lerf, A.; Klinowski, J. Solid-state NMR studies of the structure of graphite oxide. J. Phys. Chem. 1996, 100, 19954–19958. [Google Scholar] [CrossRef]
Figure 1. Scanning electron microscopy (SEM) images of expandable graphite: (a) before expansion; (b) after expansion. Exfoliation of the graphite sheets is clearly visible after thermal expansion.
Carbon 05 00006 g001
Figure 2. (a) UV-vis spectroscopy of a dilute aqueous suspension of graphene oxide. The inset shows the visual appearance of the suspension. (b) FTIR spectrum of graphene oxide. The inset shows a typical representation of a GO layer decorated with different oxygen-based functional groups (hydroxyls, carboxylic acids, ketones, ethers). (c) Raman spectrum of graphene oxide. (d) Scanning electron microscopy (SEM) image of a multilayer graphene oxide deposited on a silicon substrate from its aqueous suspension.
Carbon 05 00006 g002
Figure 3. X-ray powder diffraction (XRPD) pattern of graphene oxide (GO). Numbers into brackets in correspondence to Bragg peaks are the Miller indexes of reflections based on graphite hexagonal cell. GO and Gr subscripts refer to graphene oxide and graphite, respectively. The inset highlights the high 2θ range.
Carbon 05 00006 g003
Figure 4. (a) F(Q) function; (b) experimental G(r) of GO sample (black line) and calculated G(r) of graphite (red line). For the meaning of A–H labels, see Reference [22].
Carbon 05 00006 g004
Table 1. Lifetime and intensity components obtained from the PALS spectra of GO.
Lifetime Components τ (ns)Intensity Components I (%)
τ1 = 0.20 ± 0.02 I1 = 54.2 ± 7.0
τ2 = 0.44 ± 0.03I2 = 42.0 ± 5.0
τ3 = 2.42 ± 0.04I3 = 3.8 ± 0.1

