Article

Analysis of Core Annular Flow Behavior of Water-Lubricated Heavy Crude Oil Transport

by
Salim Al Jadidi
1,
Shivananda Moolya
1 and
Anbalagan Satheesh
2,*
1
Department of Mechanical and Industrial Engineering, University of Technology and Applied Sciences, P.O. Box 74, Al-Khuwair 133, Oman
2
Department of Thermal and Energy Engineering, School of Mechanical Engineering, Vellore Institute of Technology, Vellore 632014, India
*
Author to whom correspondence should be addressed.
Fluids 2023, 8(10), 267; https://doi.org/10.3390/fluids8100267
Submission received: 3 August 2023 / Revised: 31 August 2023 / Accepted: 1 September 2023 / Published: 28 September 2023
(This article belongs to the Special Issue Multiphase Flow and Granular Mechanics)

Abstract

:
A possible method for fluid transportation of heavy oil through horizontal pipes is core annular flow (CAF), which is water-lubricated. In this study, a large eddy simulation (LES) and a sub-grid-scale (SGS) model are used to examine CAF. The behavior of heavy oil flow through turbulent CAF in horizontal pipes is numerically investigated. The Smagorinsky model is utilized to capture small-scale unstable turbulent flows. The transient flow of oil and water is first separated under the behavior of the core fluid. Two different conditions of the horizontal pipes, one with sudden expansion and the other with sudden contraction, are considered in the geometry to investigate the effects of different velocities of oil and water on the velocity distribution, pressure drop, and volume fraction. The model was created to predict the losses that occur due to fouling and wall friction. According to the model, increasing water flow can reduce fouling. Additionally, the water phase had an impact on the CAF’s behavior and pressure drop. Also, the increased stability in the CAF reduces the pressure drop to a level that is comparable to water flow. This study demonstrated that a very viscous fluid may be conveyed efficiently utilizing the CAF method.

1. Introduction

Pipelines are typically used to transfer heavy oil from the location of production to ports or refineries, where it can be then delivered to other locations. The main challenge for heavy oil pipeline transport technology is the high viscosity of oil. Oil carriers seek extremely cost-effective and efficient solutions to reduce excessive prices. Using core annular flow (CAF), which is a good strategy for coping with the challenges brought on by the high viscosity, this research examines the water-lubricated transport of heavy viscous oil. In this method of transportation, a horizontal pipe is used to convey heavy oils that are positioned in the center and covered with a thin water coating. The flow is no longer a single-phase flow, and the presence of injected water during the transportation of heavy oil has a substantial impact. The use of an oil–water mixture creates a two-phase flow, but because of the mixture’s complicated structure, it is more difficult to estimate fluid flow using hydrodynamics. Due to changes in the pipeline pressure drop, variations in the water fraction may have an impact on the power needed to pump the fluid. As a result, the pressure gradient can be affected by the presence of water. This study examines the effects of changes in the pressure gradient and fouling in the horizontal pipe wall. The decrease in the transportation cost of oil is due to the decrease in wall friction, leading to a reduction in power consumption. The properties of CAF across horizontal pipes have been simulated using CFD. The method employed in this case (McGraw–Hill and CRC) [1,2] to solve the Navier–Stokes equations for complex geometries is CFD [3,4]. The work thus establishes the method for investigating the behavior of the turbulent flow of extremely viscous fluids through CAF horizontal pipes using the CFD model.
Large eddy simulation is the most widely used numerical model due to the non-linearity in the N–S equation. Many pioneers have used, improved, and expanded the LES model and have produced numerous studies in the area proposed by Smagorinsky [5], Lilly [6], Deardorff [7,8,9], Schumann [10], and Wang [11]. The sub-grid-scale (SGS) models were previously created [12,13] and utilized in meteorological simulations at the turn of the 20th century, serving as the foundation for the development of the LES model. Smagorinsky [5] was one of the first to suggest using an eddy viscosity model to compute the energy cascade in spatially resolved time-dependent simulations, making the Smagorinsky mode the first presentation of the LES model [8,9], along with Schumann [10]. Furthermore, it is proposed that the Smargorinsky model’s SGS tensor components match the resolved strain rate tensor. Lilly [14] derived the Smagorinsky constant for the Samargorinsky model for homogeneous and isotropic turbulence after this model’s inception. A thorough description and explanation of LES were provided by Bartosiewicz [15], Pope [16], Kaushik [17], Sagaut [18], and Sagaut and Deck [19]. Additionally, reviews of the LES model have been presented by academics like Rogallo and Moin [20], Galperin and Orszag [21], Lesieur and M’etais [22], and Meneveau and Katz [23]. Some researchers have used the LES model to observe turbulent two-phase oil–water flow in pipelines, with notable contributions from Unger and Friedrich [24], Eggels [25], and Orlandi and Fatica [26], among others. The first LES method was estimated for fully developed turbulent pipe flow by Unger and Friedrich [27], while Eggels and Nieuwstadt [28] used the LES approach to model turbulent flow in a spinning conduit.
The LES model was run by Boersma and Nieuwstadt [29] for turbulent flow in a curved conduit. A dynamic sub-grid scale (DSGS) model was also used by Yang [30] to simulate a fully developed turbulent rotating pipe flow. The LES technique has not yet been used in any studies to evaluate turbulent flow through a CAF horizontal pipe in the field of heavy oil transportation. LES calculations for turbulent heat transfer in an annulus were given by Kawamura et al. [31] and Satake and Kawamura [32]. The outcomes of a spectral element LES for turbulent pipe flow were reported and described by Murray Rudman and Hug Blackburn [33]. A study of LES for compressible turbulent pipe flow with heat transfer was presented by Xiaofeng and Xu [34]. A recent study on the effects of flow properties on annular flow in sudden contraction and expansion pipes was performed by Huang et al. [35]. The outcomes demonstrated that the surfactant could increase the pipeline’s transport capacity and water annulus stability. Camarri and Salyetti [36,37] performed large eddy simulations for the treatment of wall boundary conditions. The Reynolds transport theorem is used to derive conservation laws that apply to the CFD technique. The range of a solution length scale is often narrowed by LES, which operates on N–S equations. Sunday et al. [38] performed a numerical analysis and sensitive study of oil–water two-phase flow in a pipeline of different orientations. Various flow parameters were used to analyze the flow pattern. The suggested numerical model could be applied to analyze the flow pattern in oil–water transportation pipelines. Zhang et al. [39] performed a three-dimensional flow analysis of crude oil flow on an inclined pipeline. Based on the literature, it is found that few LES investigations were performed in previous studies that considered turbulent flows in horizontal pipes. This lack of research is mainly due to the requirement for specific input–output data for LES models. The variations in pipe cross-sections and orientations limit the use of simple computational grids. Additionally, the computation cost is higher.
Therefore, further investigation is required to analyze turbulent horizontal pipe flows by considering different geometries. In this study, heavy oil–water two-phase flow through a CAF is modeled using the liquid–liquid two-phase flow of volume of fluid (VOF) approach. Therefore, the current study focuses on heavy oil flow while incorporating recent developments in LES applications. In addition, the SGS model and the Smagorinsky model are combined for application to CAF contraction and expansion in horizontal pipes. To create an effective and active numerical program, the primary goal of this work is to explore the behavior of CAF using the LES approach. This will involve simulating the turbulent flows of heavy oil during the contraction and expansion of horizontal pipes.

2. Numerical Simulation

A three-dimensional model built by Kaushik et al. was utilized in conjunction with the LES model to assess CAF behavior [17]. The Large Eddy Simulation (LES) method for predicting turbulent flows employs the Navier–Stokes equations to solve completely time-dependent, three-dimensional flow fields. The flow solution in an LES will become physically unstable, just like a real turbulent fluid. Only eddies smaller than the mesh size need to be represented using a so-called sub-grid-scale model, not large-scale turbulence. A tremendous amount of potentially useful information can be produced through LES. The simulations produce statistics due to the time-dependent evolution of eddies in three dimensions, which are difficult to obtain from more traditional methods of turbulence prediction, such as closure modeling. In addition, structural information that is inevitably absent from predictions based on statistical modeling is included in the simulations regarding the development, evolution, and dynamical relevance of coherent turbulent structures. LES can, therefore, provide information on the physical processes deriving from statistics on turbulence. Accurately modeling the turbulent flows that are observed in engineering practice continues to be the fundamental challenge in computational fluid dynamics. One of the key problems with simulation and modeling is that turbulence occurs on a range of length and time scales. Larger eddies are more general.
Large eddy simulation (LES) is a method that is quickly becoming a practical tool for predicting complex turbulent flows. Figure 1 shows a two-dimensional drawing of geometry. Two pipes with diameters of 0.02 m and 0.025 m have been considered in this study, and the span is fixed at 0.6 m across both pipes. To understand the flow behavior, a sample condition is considered in the present study, and the properties of water and oil are listed in Table 1. According to geometry, heavy crude oil flows through the pipe’s core and via a tiny pipe with a nozzle that has a diameter of 0.008 m while a layer of water flows through the annulus. The ANSYS ICM and ANSYS CFD FLUENT software suites (Ansys fluent 14.0), which are used to simulate FLUENT 13.0, were utilized to build the flow domain and the meshes. To look at the growth of CAF, the computation for unsteady flow was performed. Unsteady flow, immiscibility of one liquid with another, unchanging liquid characteristics, and coaxial entry of liquids through straight pipes utilized as nozzles were among the assumptions made.

3. Governing Equations and Boundary Conditions

3.1. Governing Equations

Continuity equation:
The continuity equation by using the notation is as shown in Equation (1) for the compressible flow,
ρ t + . ρ u = 0
In the above equation, ρ is the density and u represent the velocity. The continuity equation is simplified for the incompressible fluid as:
. u = 0
In this study, the gravitational acceleration is ignored, and the momentum equation is stated as:
t   ρ u + . ρ u u = p + . τ
where p represents the pressure and τ is the viscous stress tensor. The stress tensor for Newtonian fluid is derived as.
τ = μ u + u T 2 3 I   .   u
where, T, I, and μ represent the transpose matrix of u , the unit tensor, and the molecular viscosity, respectively. Navier–Stokes equation is obtained after substituting Equation (4) into Equation (3)
t   ρ u + . ρ u u = p + . μ u + u T + S M
where S M is the source term −2/3 μ 2 u.
Energy equation:
t   ρ e + . ρ u e = p . u + . k T + Φ + S e
In the above equation, T, Φ, e and S e represents absolute temperature, viscous dissipation, specific internal energy, and specific internal energy source, respectively.

3.2. Inlet Boundary Condition

A tiny pipe is utilized as the nozzle in both instances, and the fluid velocity is set at the input, making it easier for the horizontal pipe to contract and expand. Water is injected into the annular area between the oil and the pipe wall, with heavy oil being delivered centrally as the core. The oil velocity is specified in the small pipe entrance, and the water velocity is specified in the annular face between the small pipe and the main pipe (as shown in Figure 1). The radial velocity ( U r ) is zero in all the simulated studies.
The inlet boundary conditions are.
For sudden contractions,
U z = U o i l   at   z   =   0   m   and   0     r     0.01   m
U z = U w a t e r   at   z   =   0.06   m   and   0.01   m     r     0.012   m
For sudden expansion,
U z = U o i l   at   z   =   0   m   and   0   m     r     0.004   m
U z = U w a t e r   at   z   =   0.06   m   and   0.004   m     r     0.006   m

3.3. Outlet Boundary Condition

The diffusion fluxes for variables facing the exit direction and gauge pressure are set to zero at the outlet, and a pressure outlet boundary is employed. The backflow turbulent intensity and turbulent viscosity ratio are fixed at 5% and 10%, respectively.

4. Near-Wall Treatment for the LES Model

Rather than employing a wall function approach to tackle solid wall boundaries, the near-wall regions of flow are resolved in the simulations described in this paper by providing sufficiently small mesh spacing. In such instances, it was proven that [40] the turbulent eddy viscosity must be changed using wall damping, which switches off turbulent eddy viscosity in the near-wall zone. The simplest kind of near-wall treatment modeling for large eddy simulation merely adds a few more restrictions to eddy viscosity. In contrast to the idea that the eddy viscosity should be zero when there is no turbulence, the typical Smagorinsky model’s eddy viscosity is nonzero at the solid boundaries. The simple solution to this issue is to modify the length scale to include a damping function in the manner of Van Driest, as shown in Equation (7).
( y + ;   A + ,   m ,   n )   1 exp y + n A + n m
Different values for A + , m and n have been used. The use of this formulation requires the accurate computation of wall shear to compute y + , where y + is the distance in wall units based on the local instantaneous friction velocity, which has generally been accomplished through high grid resolution in near-wall regions. The dimensionless distance y+ is defined by Equation (8).
y + = ρ   u τ   y p μ
A van Driest damping model, which gives the correct near-wall asymptotic behavior of the SGS stresses was introduced by Piomelli, Ferziger, and Moin [41], where the turbulent mixing length C s Δ is modified using Equation (9).
C s Δ 1 exp ( r + / A + 3 ] 1 / 2
With r + indicating the dimensionless wall normal distance (R − r)/( u τ / v ), and the constant A + = 26. The damping has a substantial effect on r +   < 40. Mesh spacing close to the wall is a critical consideration for wall-resolving LES. For wall-resolving LES, the first mesh point should be situated at r +   < 1.0 and r + 1, by Piomelli’s [42] instructions.

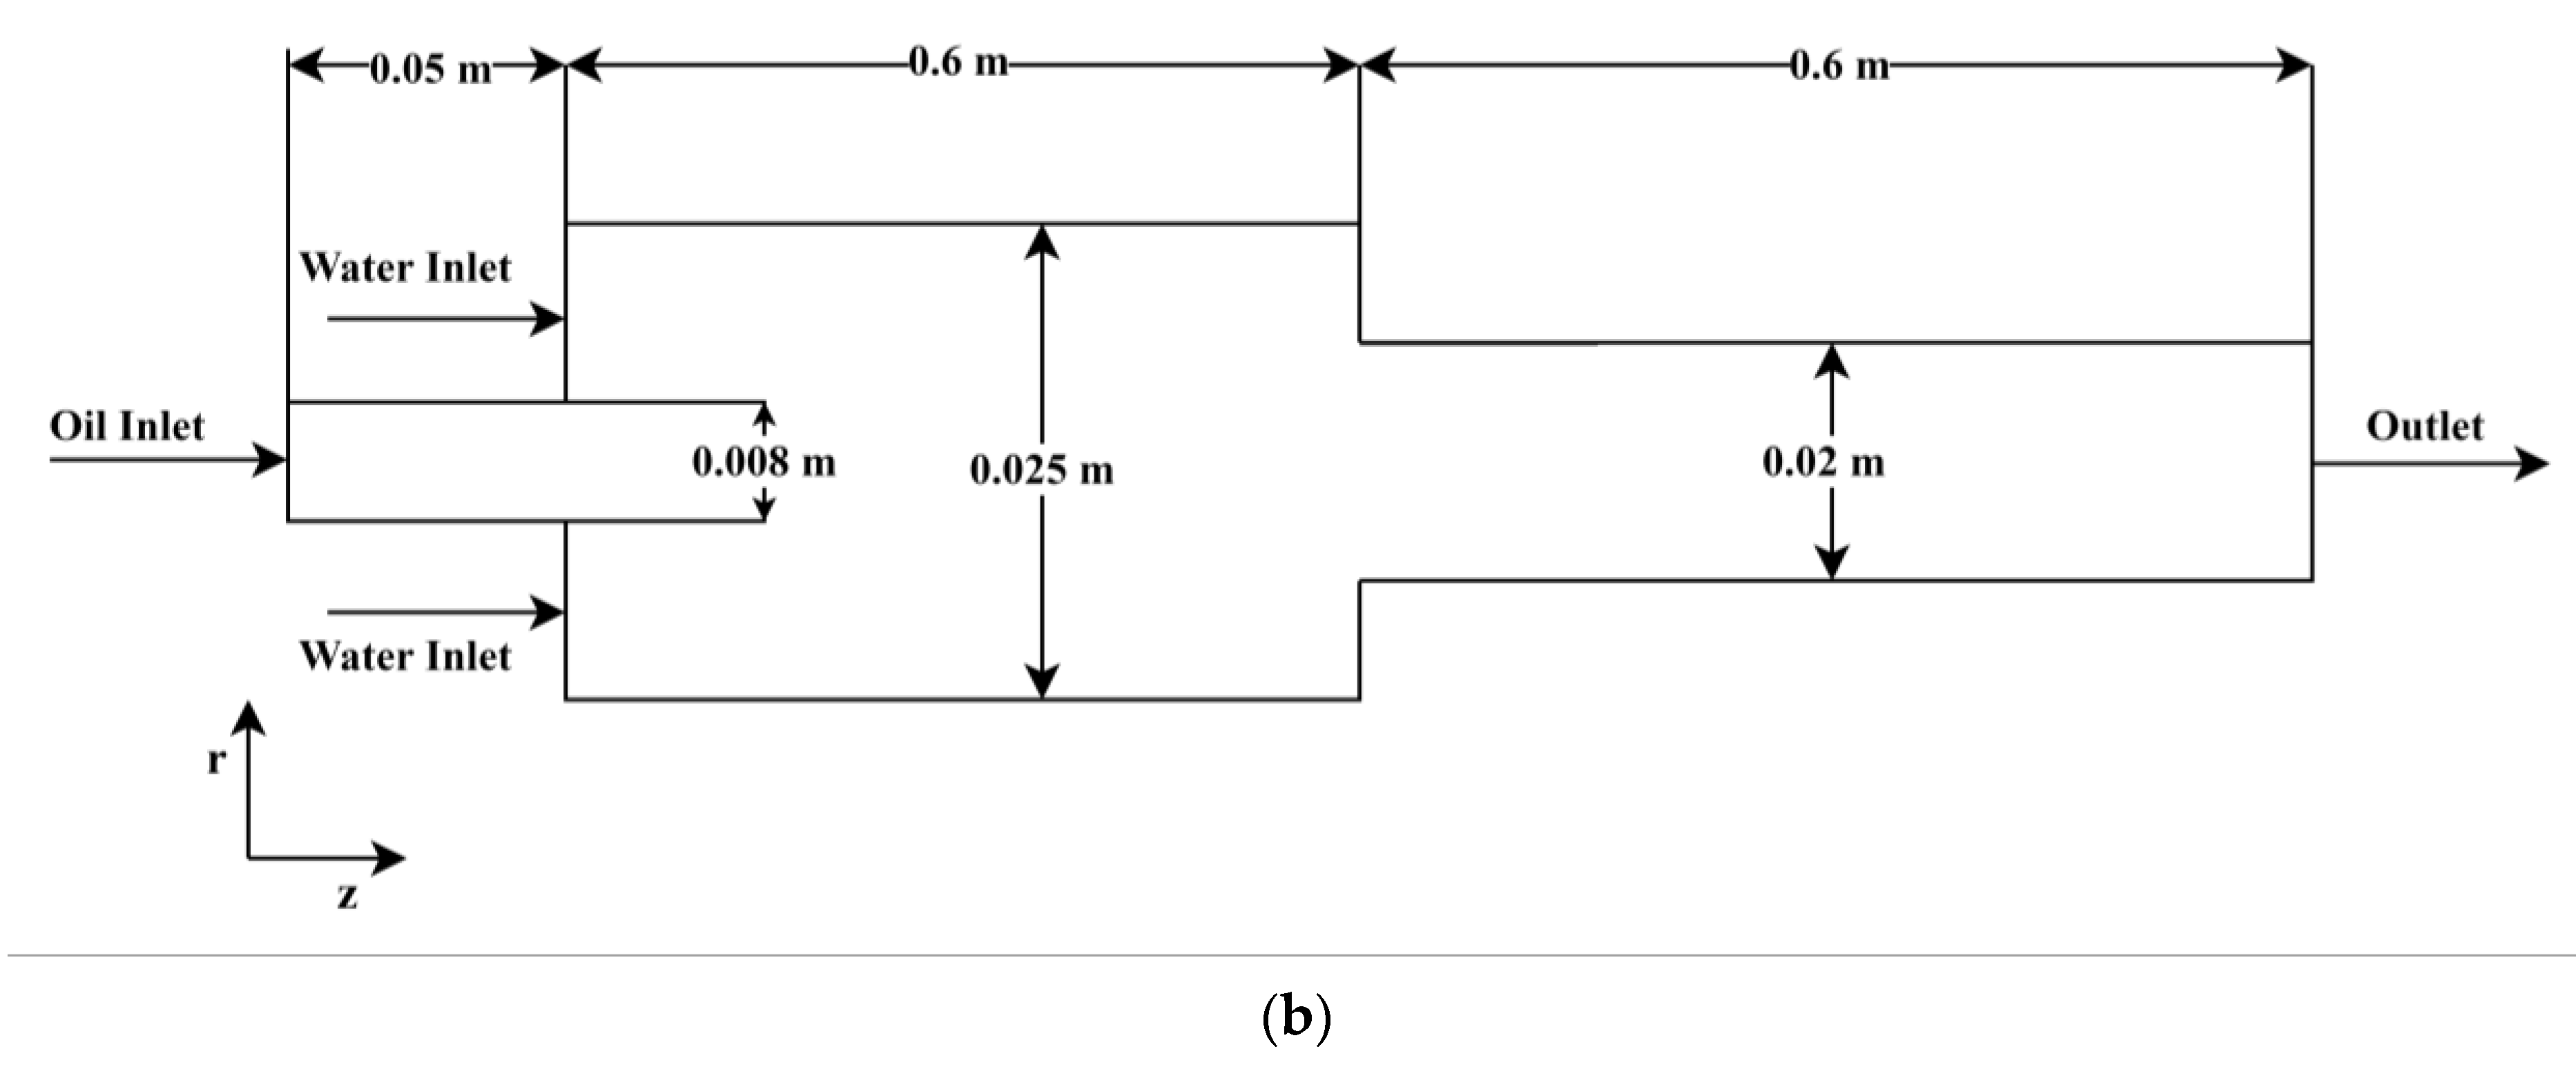
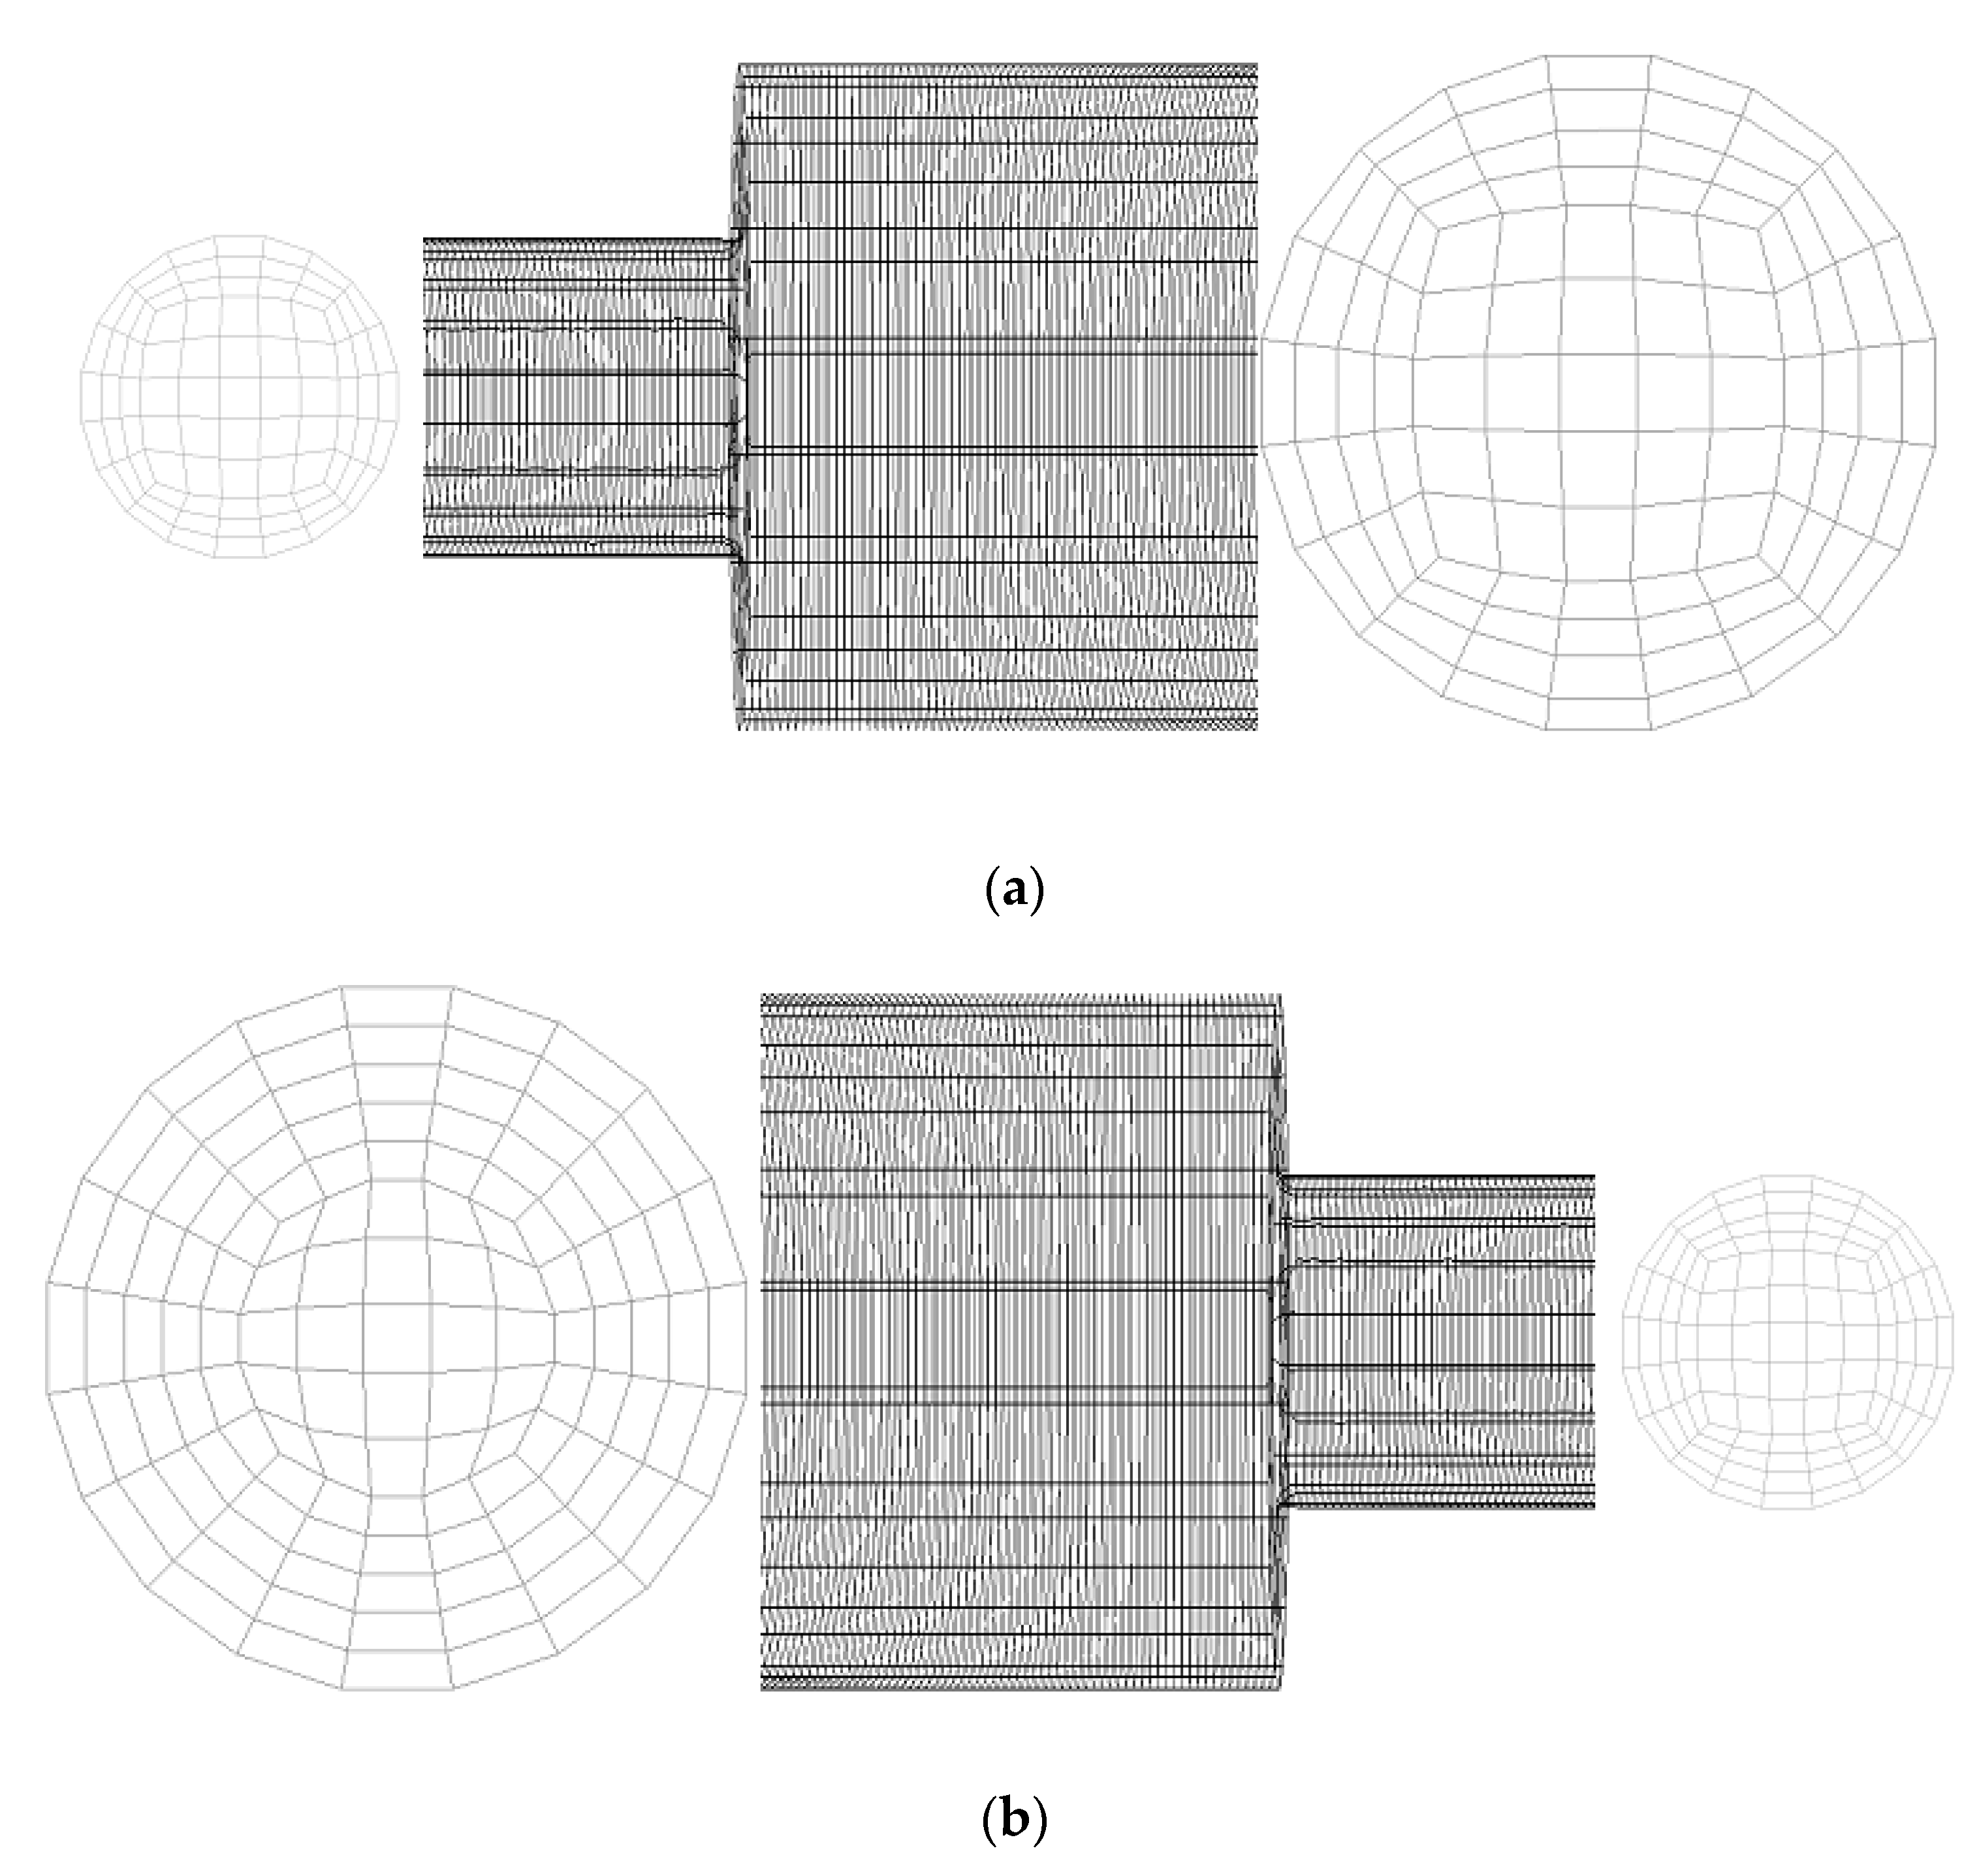
5. Physical Model and Meshing

To determine the ideal mesh size for computational simulations, computational grids with 36,469, 48,660, 55,641, 66,735, 77,011, and 152,146 cells in 3D geometry are developed and tested for the mesh-independent investigation. Figure 2 shows the structured grid created for the present study. Mesh components from the O grid meshing method were selected in this study. The detailed computational setup used for the present numerical investigation is provided in Table 2. Figure 3 shows the oil–water flow distribution in a sudden expansion pipe for the selected grid sizes. The results of the volume fraction contour are consistent with Kaushik et al. [17]. Hence, the simulation evaluating the domain with 55,641 cells for expansion and 66,735 cells for contraction is chosen for the further simulations carried out in the present numerical analysis. The present numerical results are compared with the simulation data reported by Kaushik et al. [17]. Similar conditions given in the literature are used in this investigation. Figure 4 and Figure 5 show the validation of the present numerical study with the reported literature, and it is observed that the numerical results match well with the literature.

6. Results and Discussion

The simulation studies were carried out for this work using the ANSYS FLUENT CFD program, which focuses on heavy oil flow transportation using the LES method. In addition, the SGS model and the Smagorinsky model are combined to apply to CAF contraction and expansion in horizontal pipes. The coarse mesh cell count utilized was insufficient to reflect the flow behavior accurately and smoothly inside the horizontal pipe. As the fluid velocity rose near the top surface and the bottom wall, the results on a very fine mesh were completely inaccurate as well. This may be due to the enormous numerical errors that the numerous cells have introduced. Therefore, the findings were comparable to the others when the grid was medium and the number of cells was appropriate. Although wall friction did not significantly reduce the flow velocity near the bottom wall as was anticipated, this might be improved by near-wall mesh enhancement and refined mesh. The positive results for smooth stream flow acquired in this section can be used to support the findings. The analysis also produced reasonable results without changing the answer. To accurately describe the velocity growth from zero at the wall to the stream velocity above, mesh refinement is also necessary for close to non-slip condition walls. The walls of this model were thought to be non-slip walls. Therefore, the near-wall refining meshes are necessary at inlet and outflow since enough cells are required. In this work, simulations were run in each of the mesh cells with inputs of 0.5 volume fractions of oil and water at various ranges of superficial velocities, from 0.3 to 1.0 m/s for water and 0.3 to 1.2 m/s for oil.

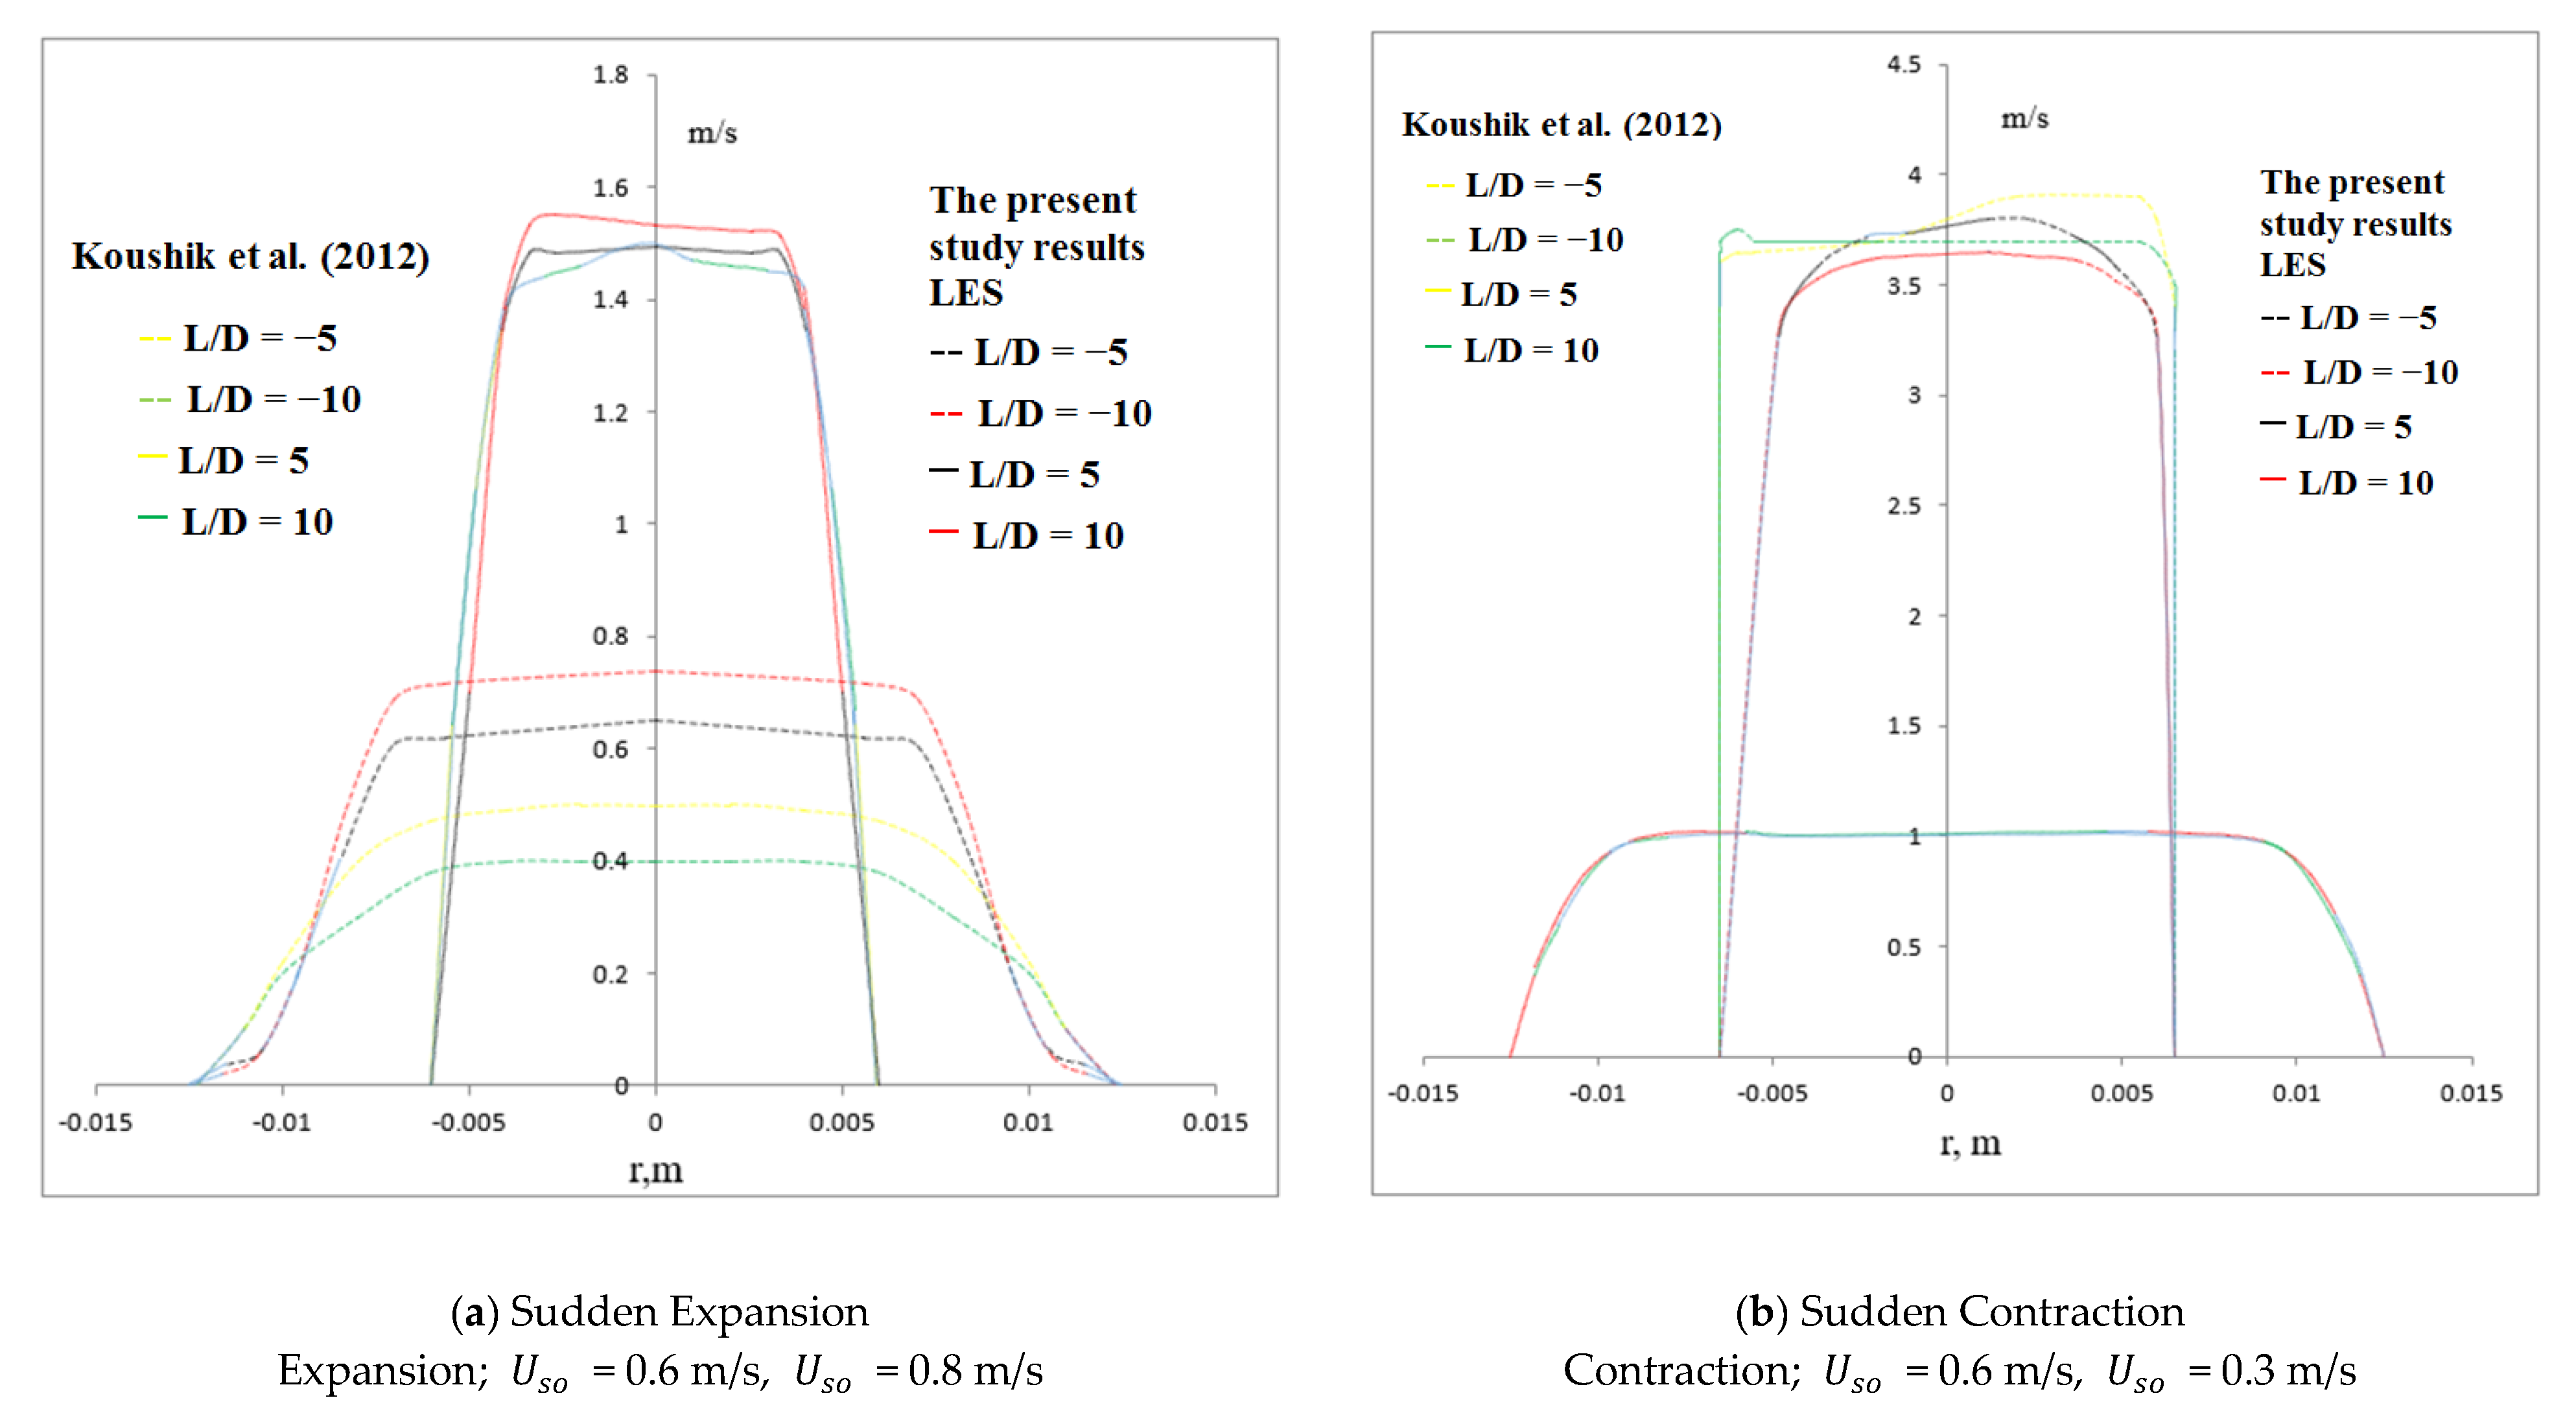
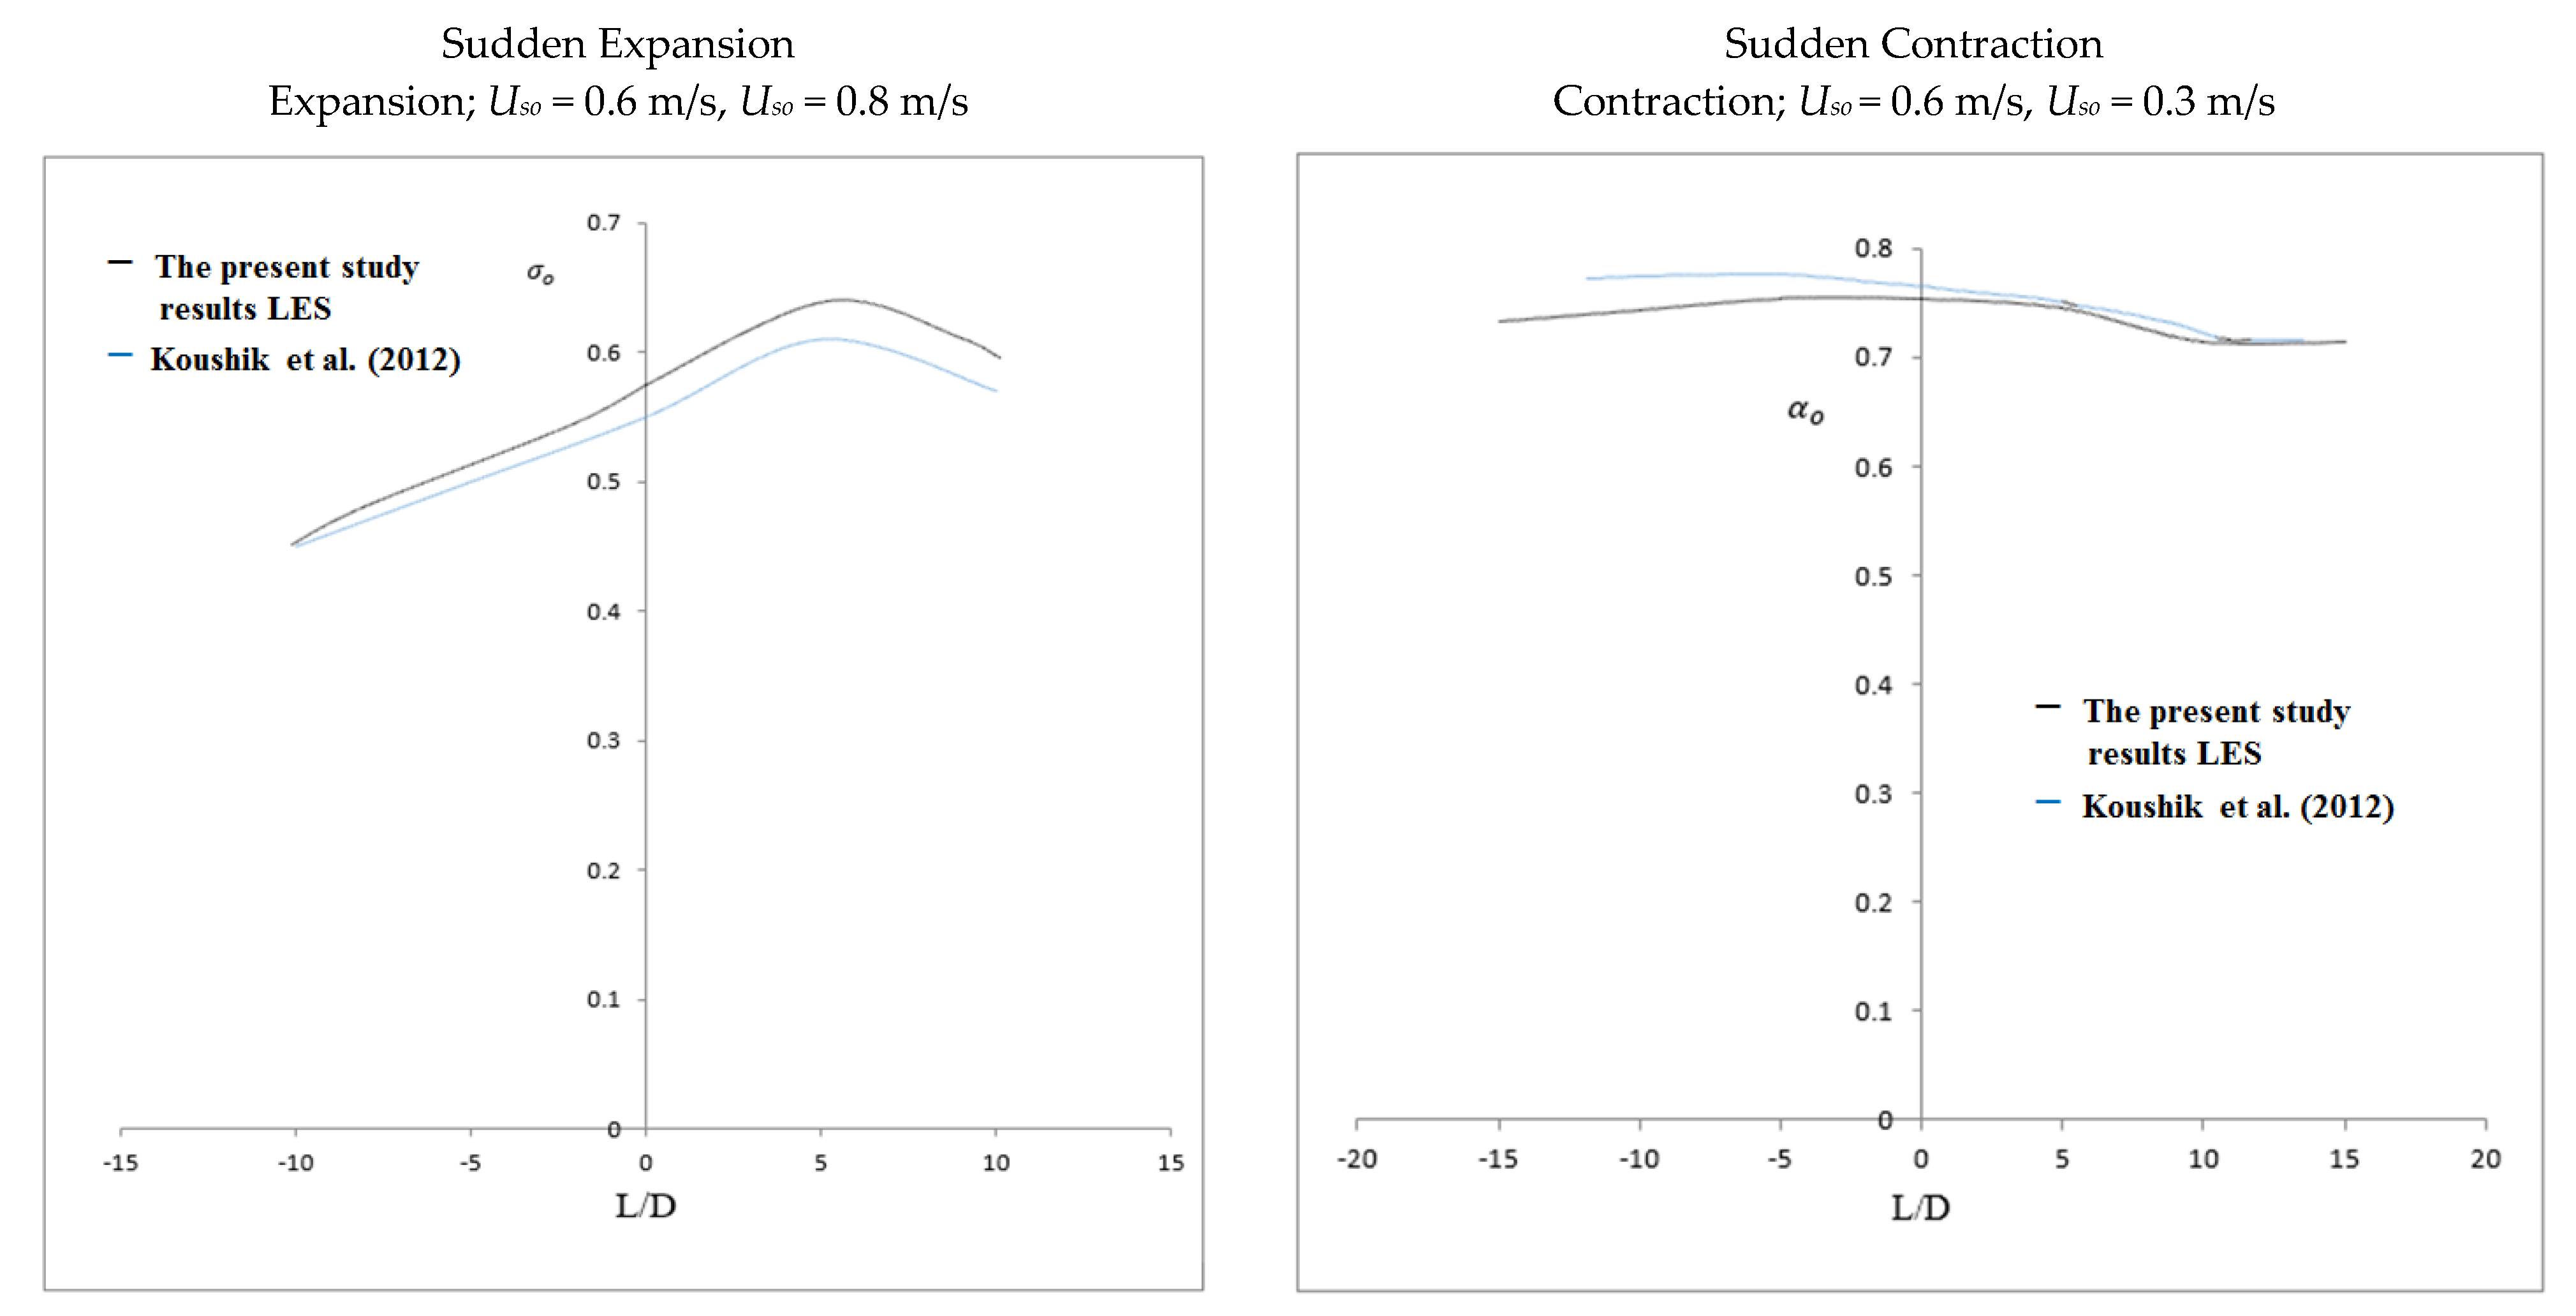
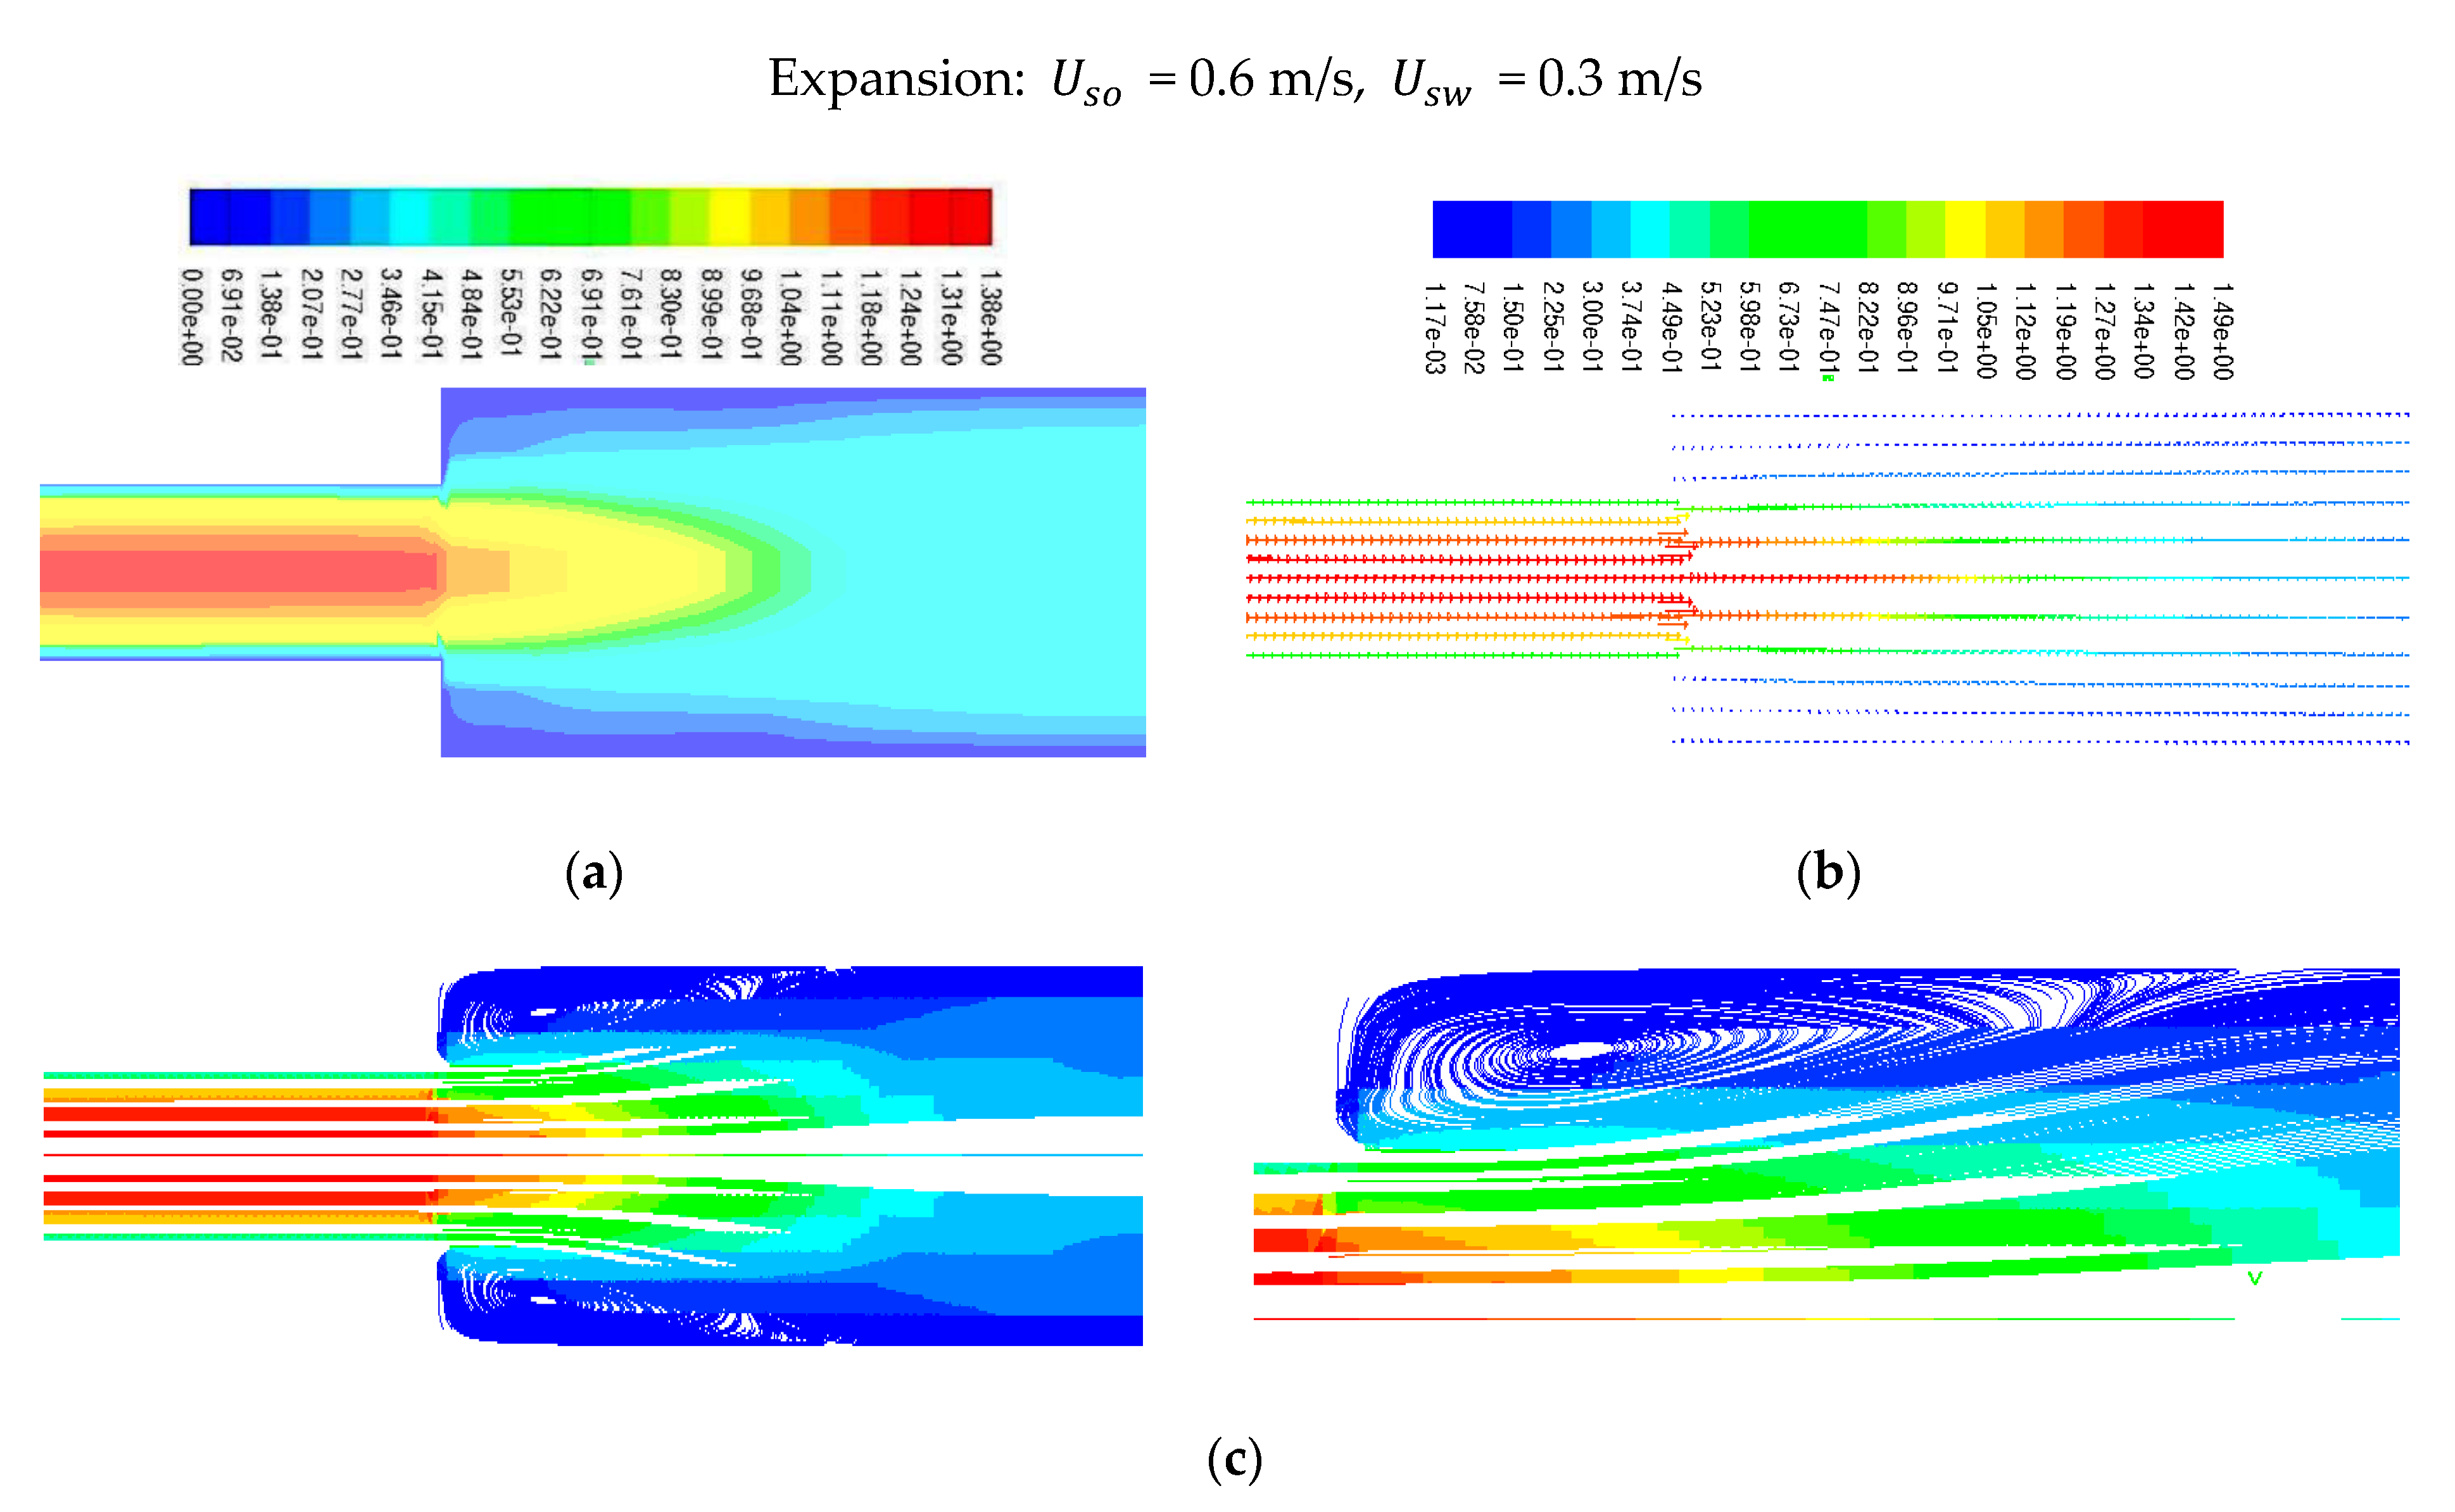
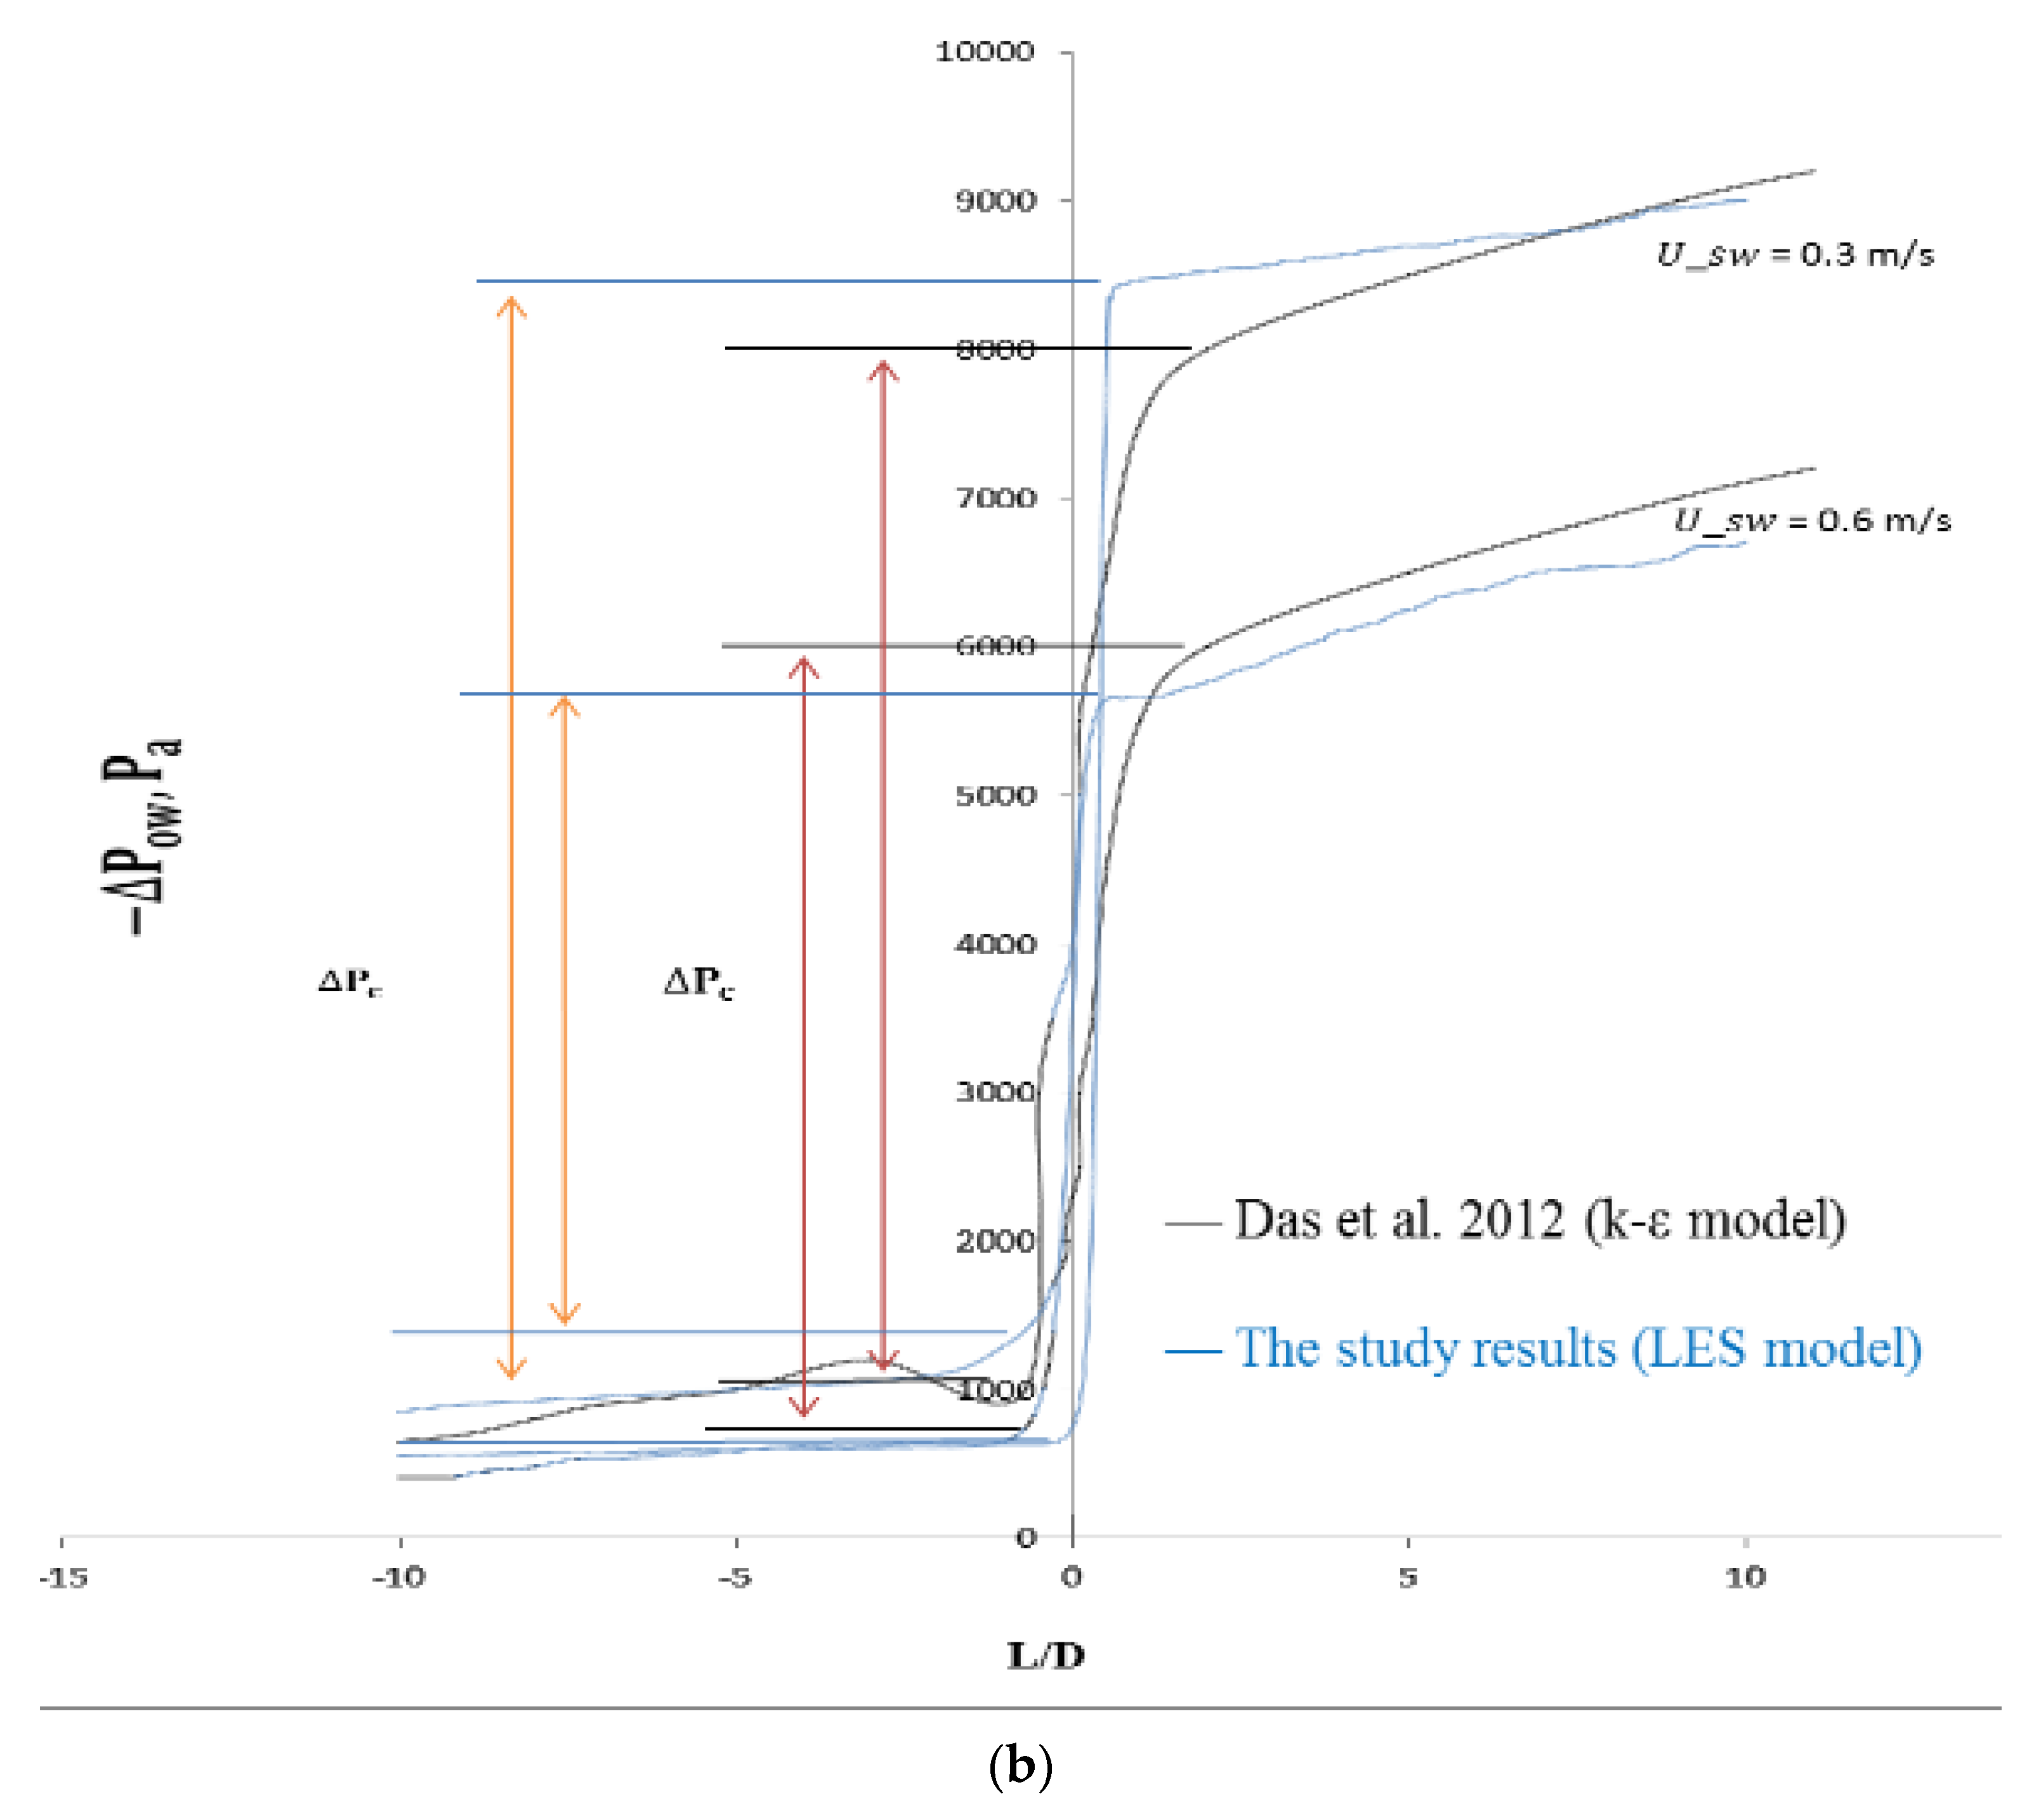
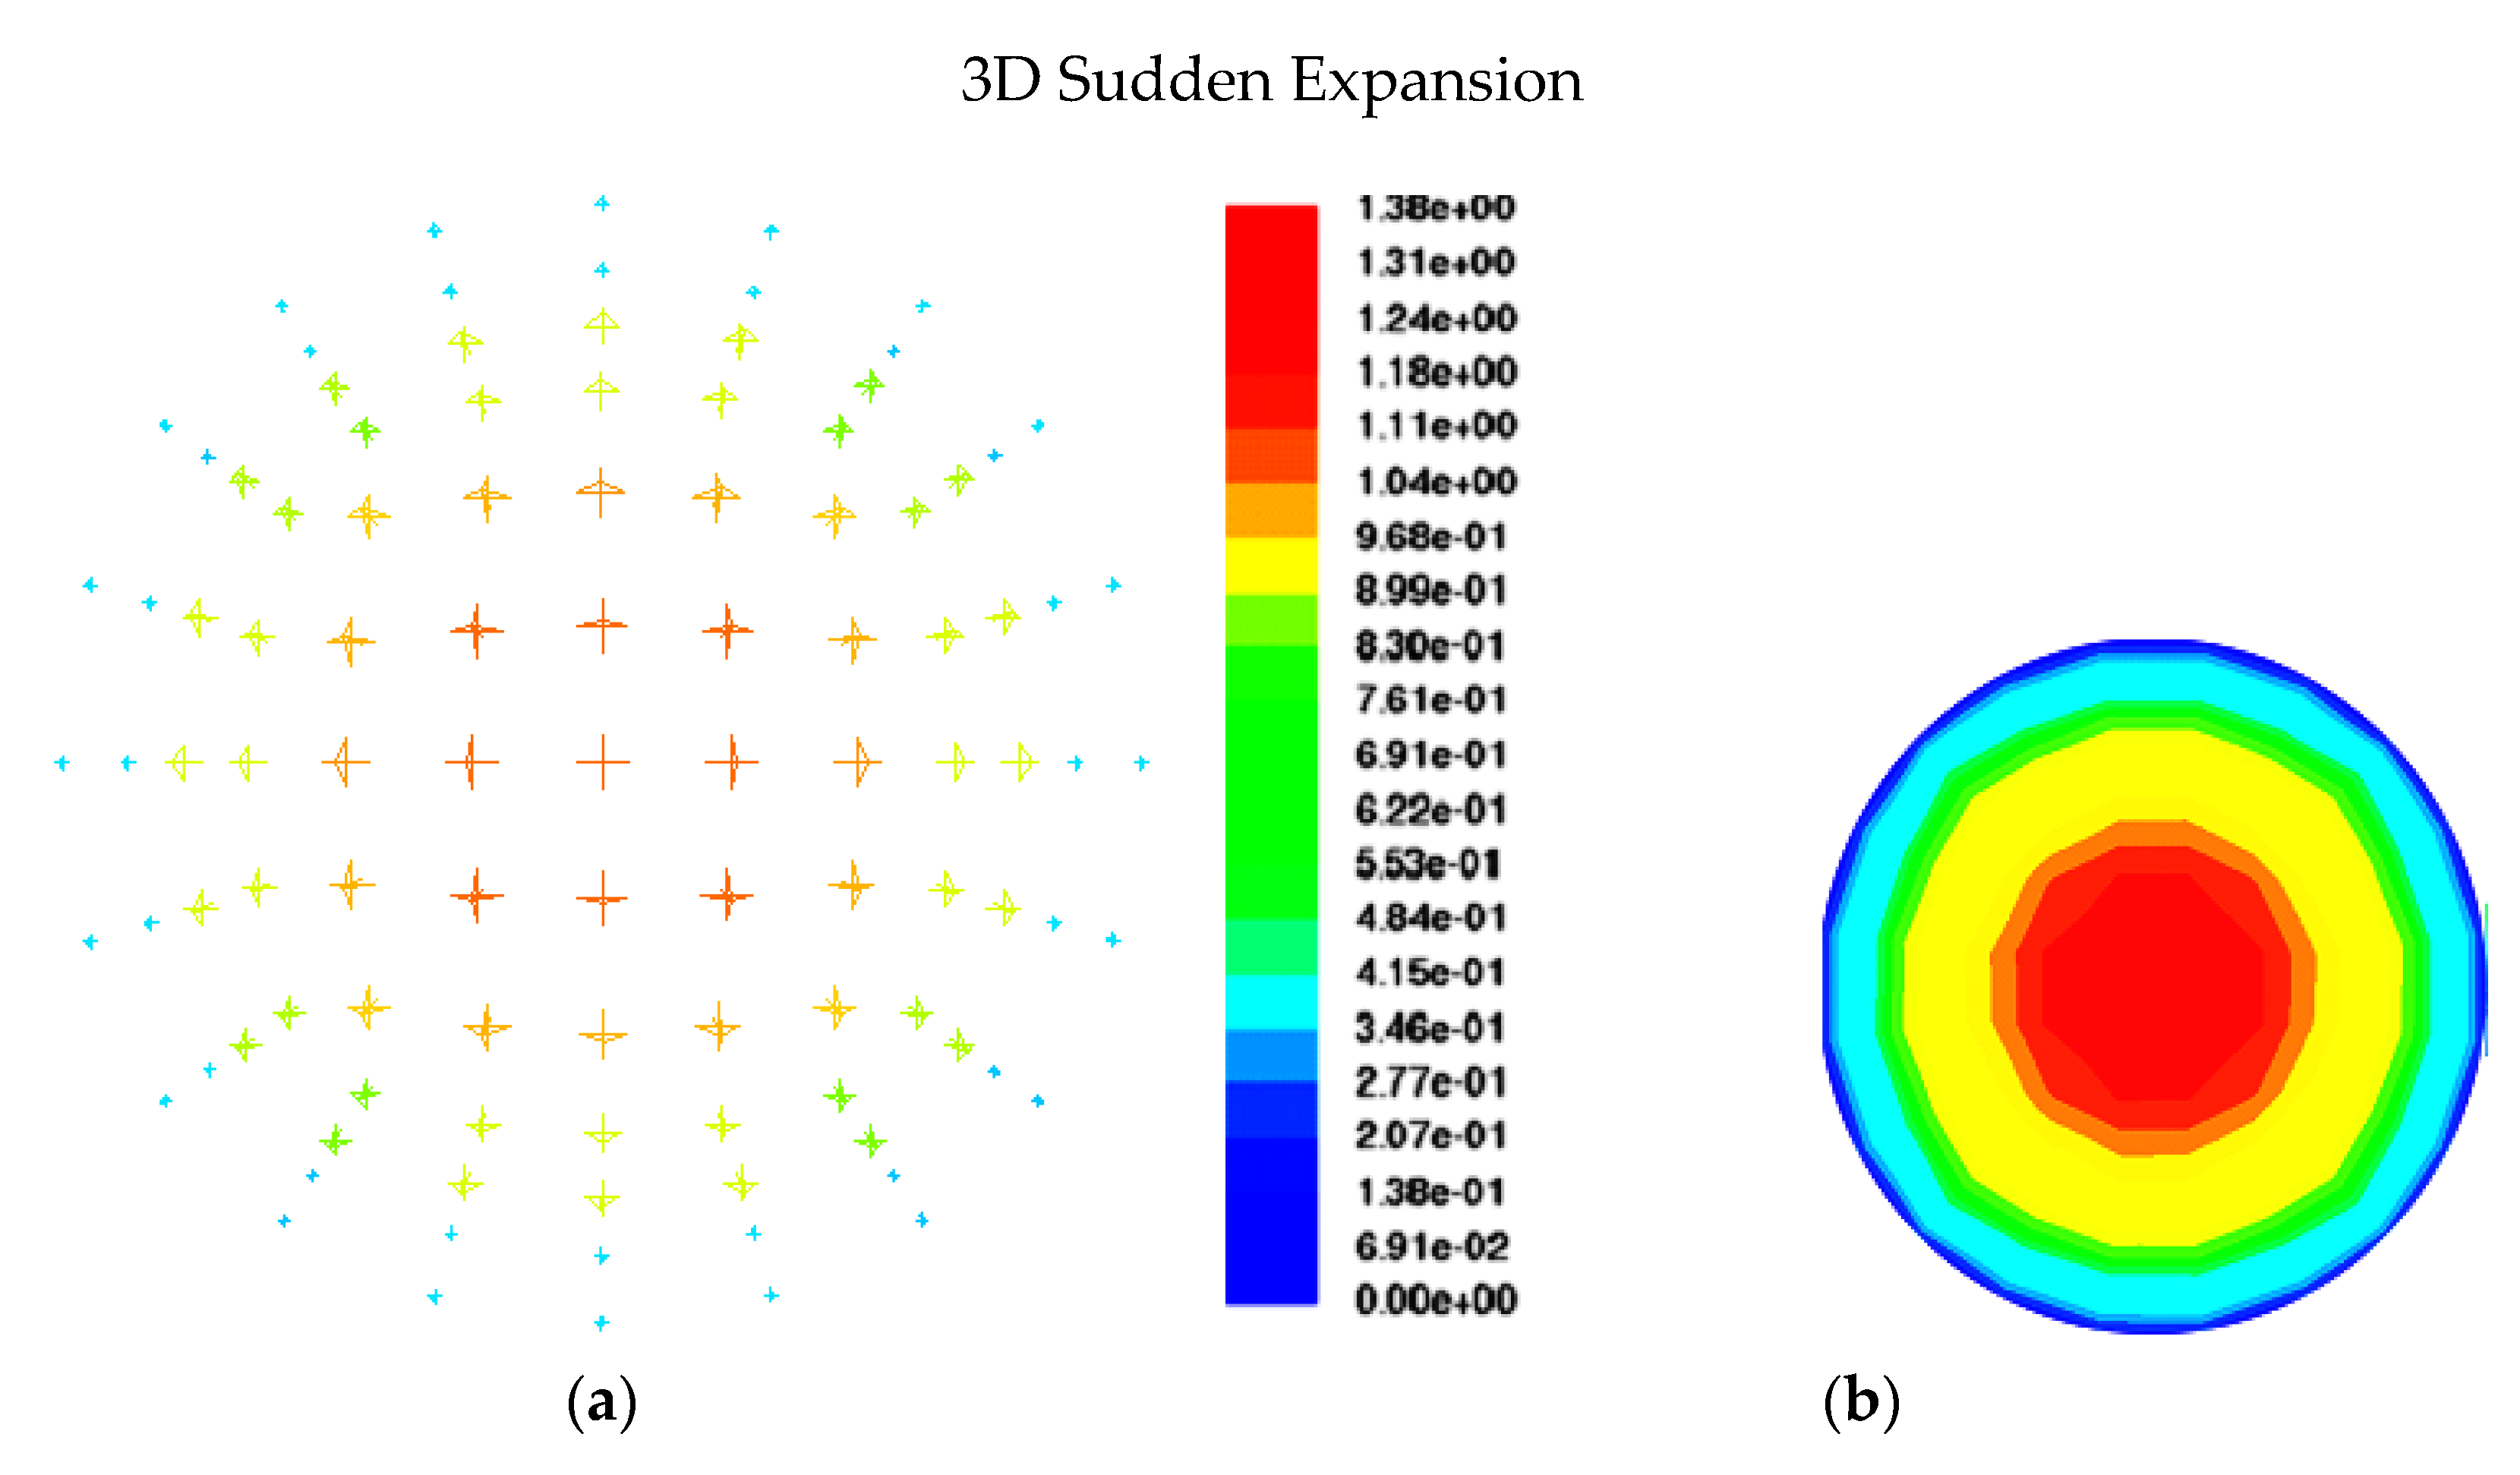
6.1. Sudden Expansion Model

In a 3D sudden expansion model with velocities of U s o = 0.6 m/s, U s w = 0.6 m/s, Figure 6a–c shows velocity magnitude, velocity vectors, and path lines at points of rapid expansion of the model. It demonstrates that the velocity starts to rise as the object goes away from the wall, where it is zero at the walls. The generation of vectors and path lines, as well as the flow reversal at the model’s top and bottom corners, are depicted in the pictures. Therefore, these figures show the zoomed-in sections in the expansion region.

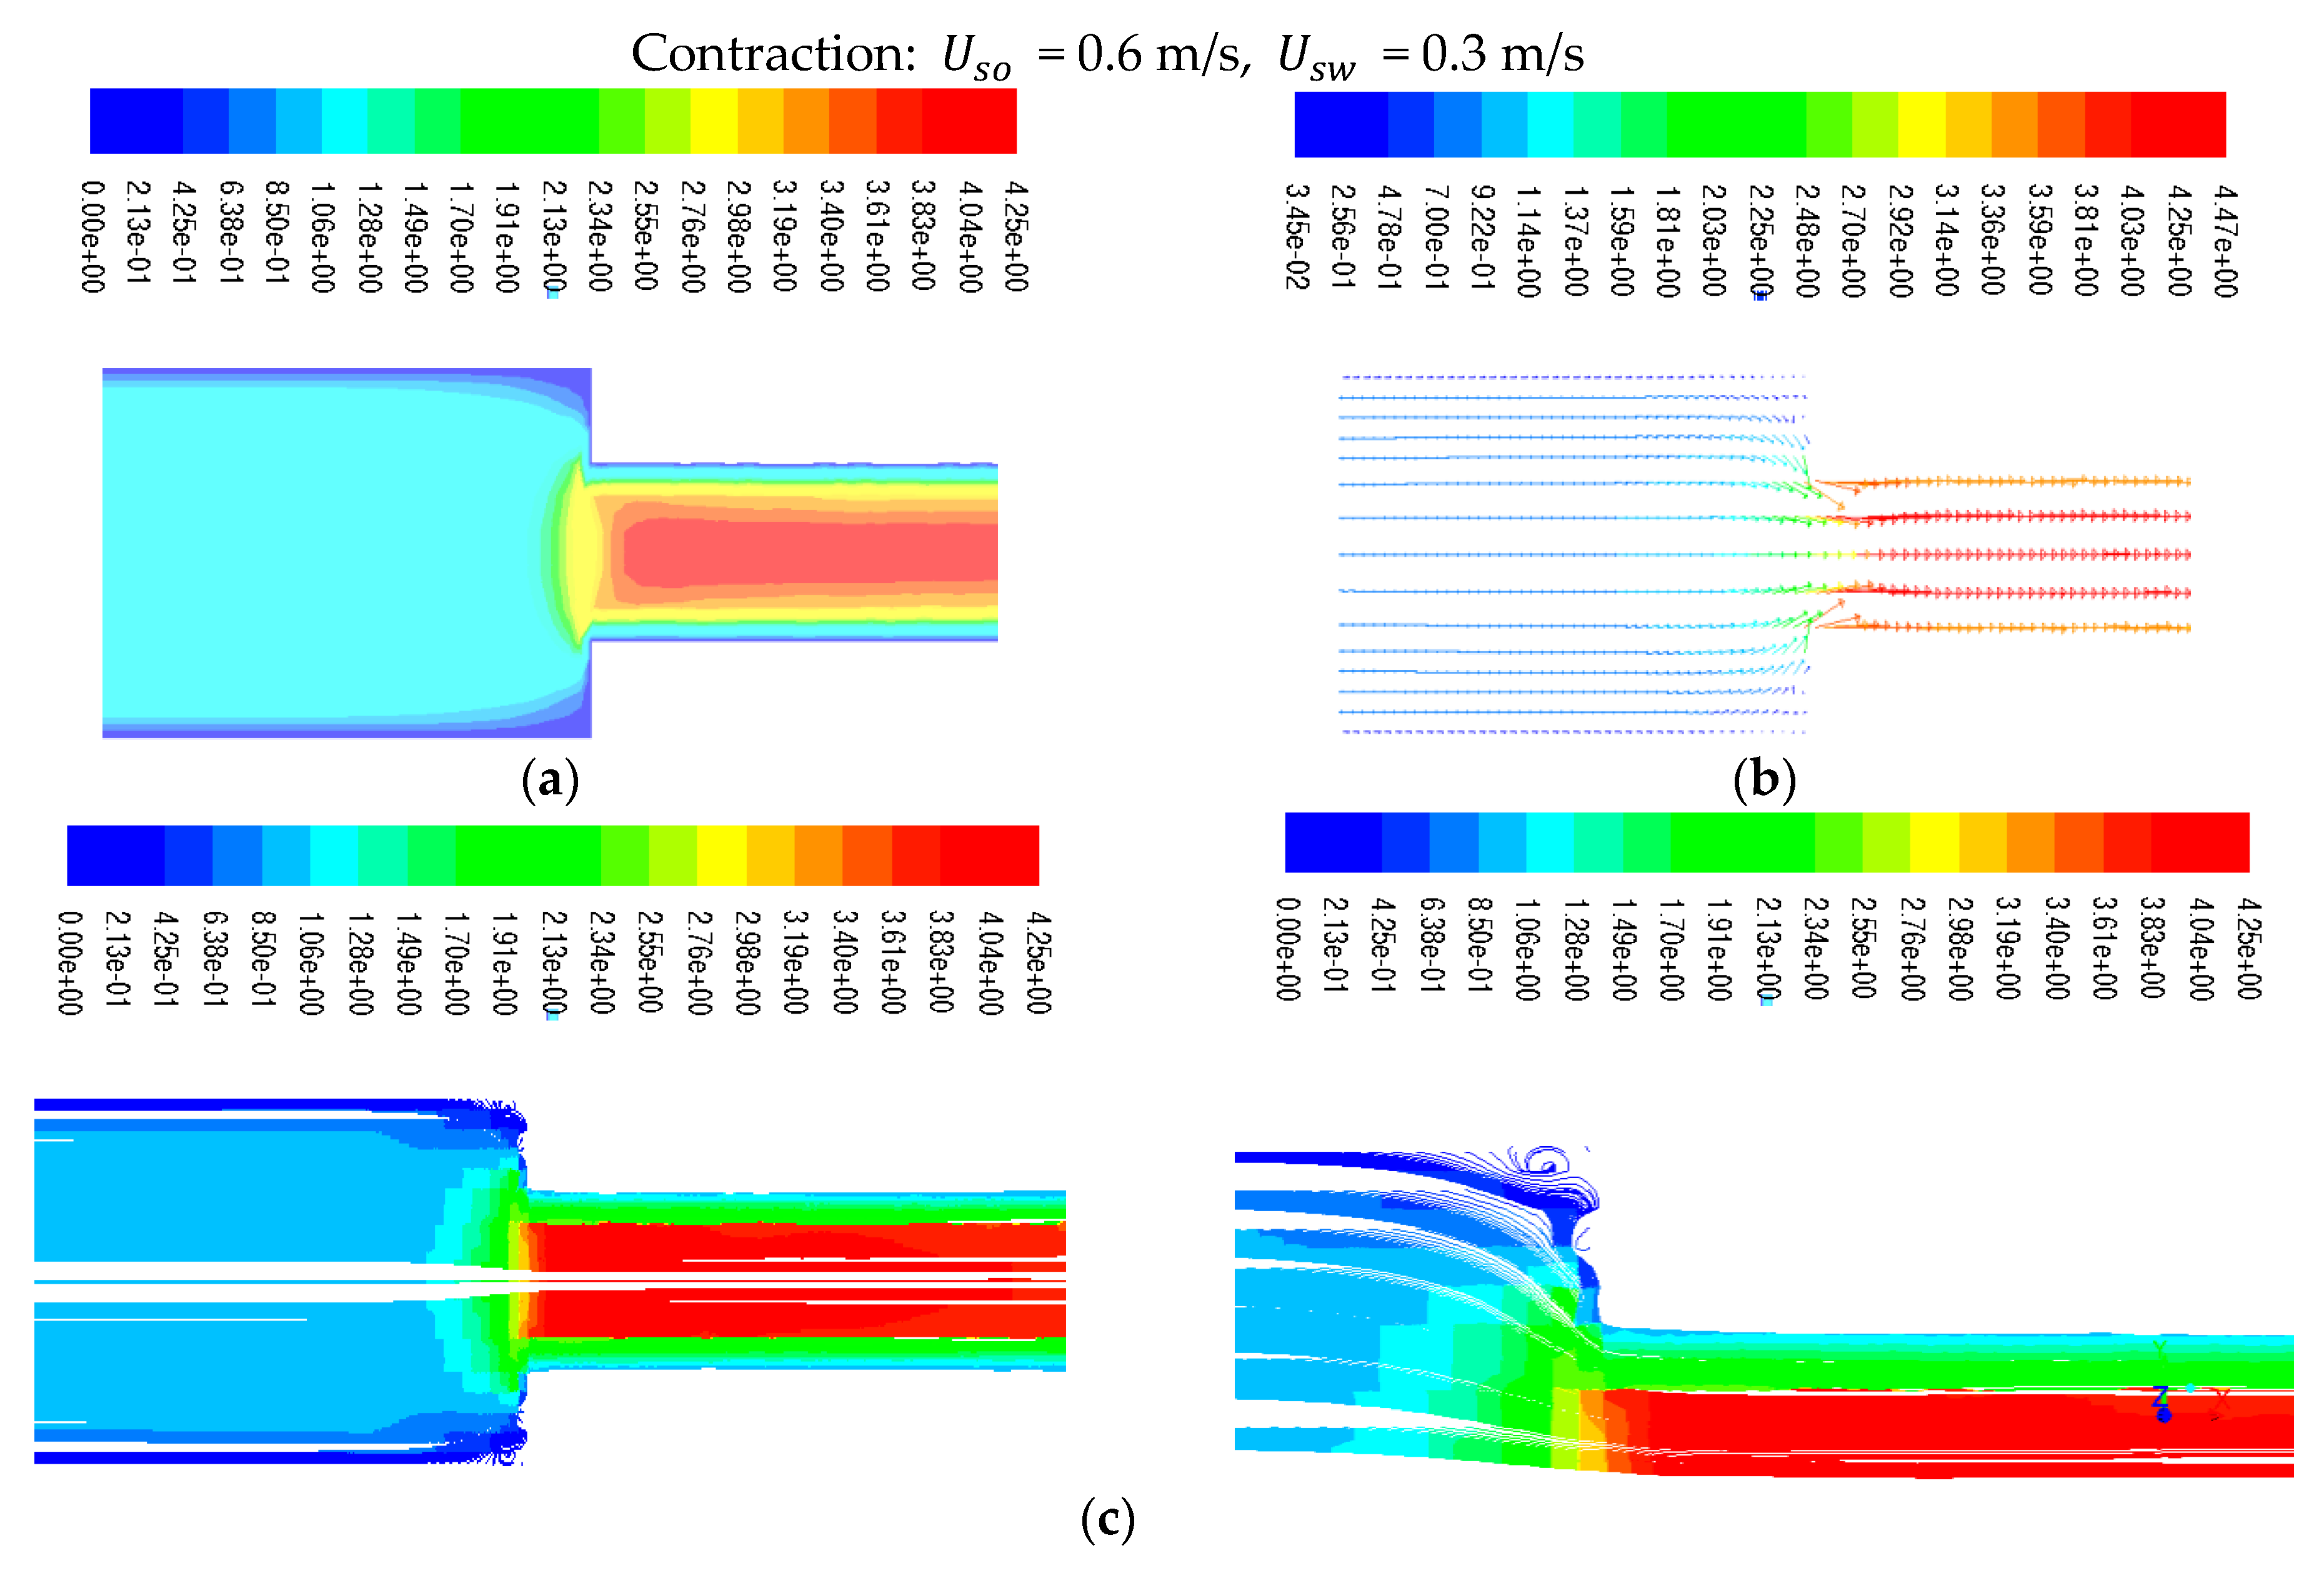
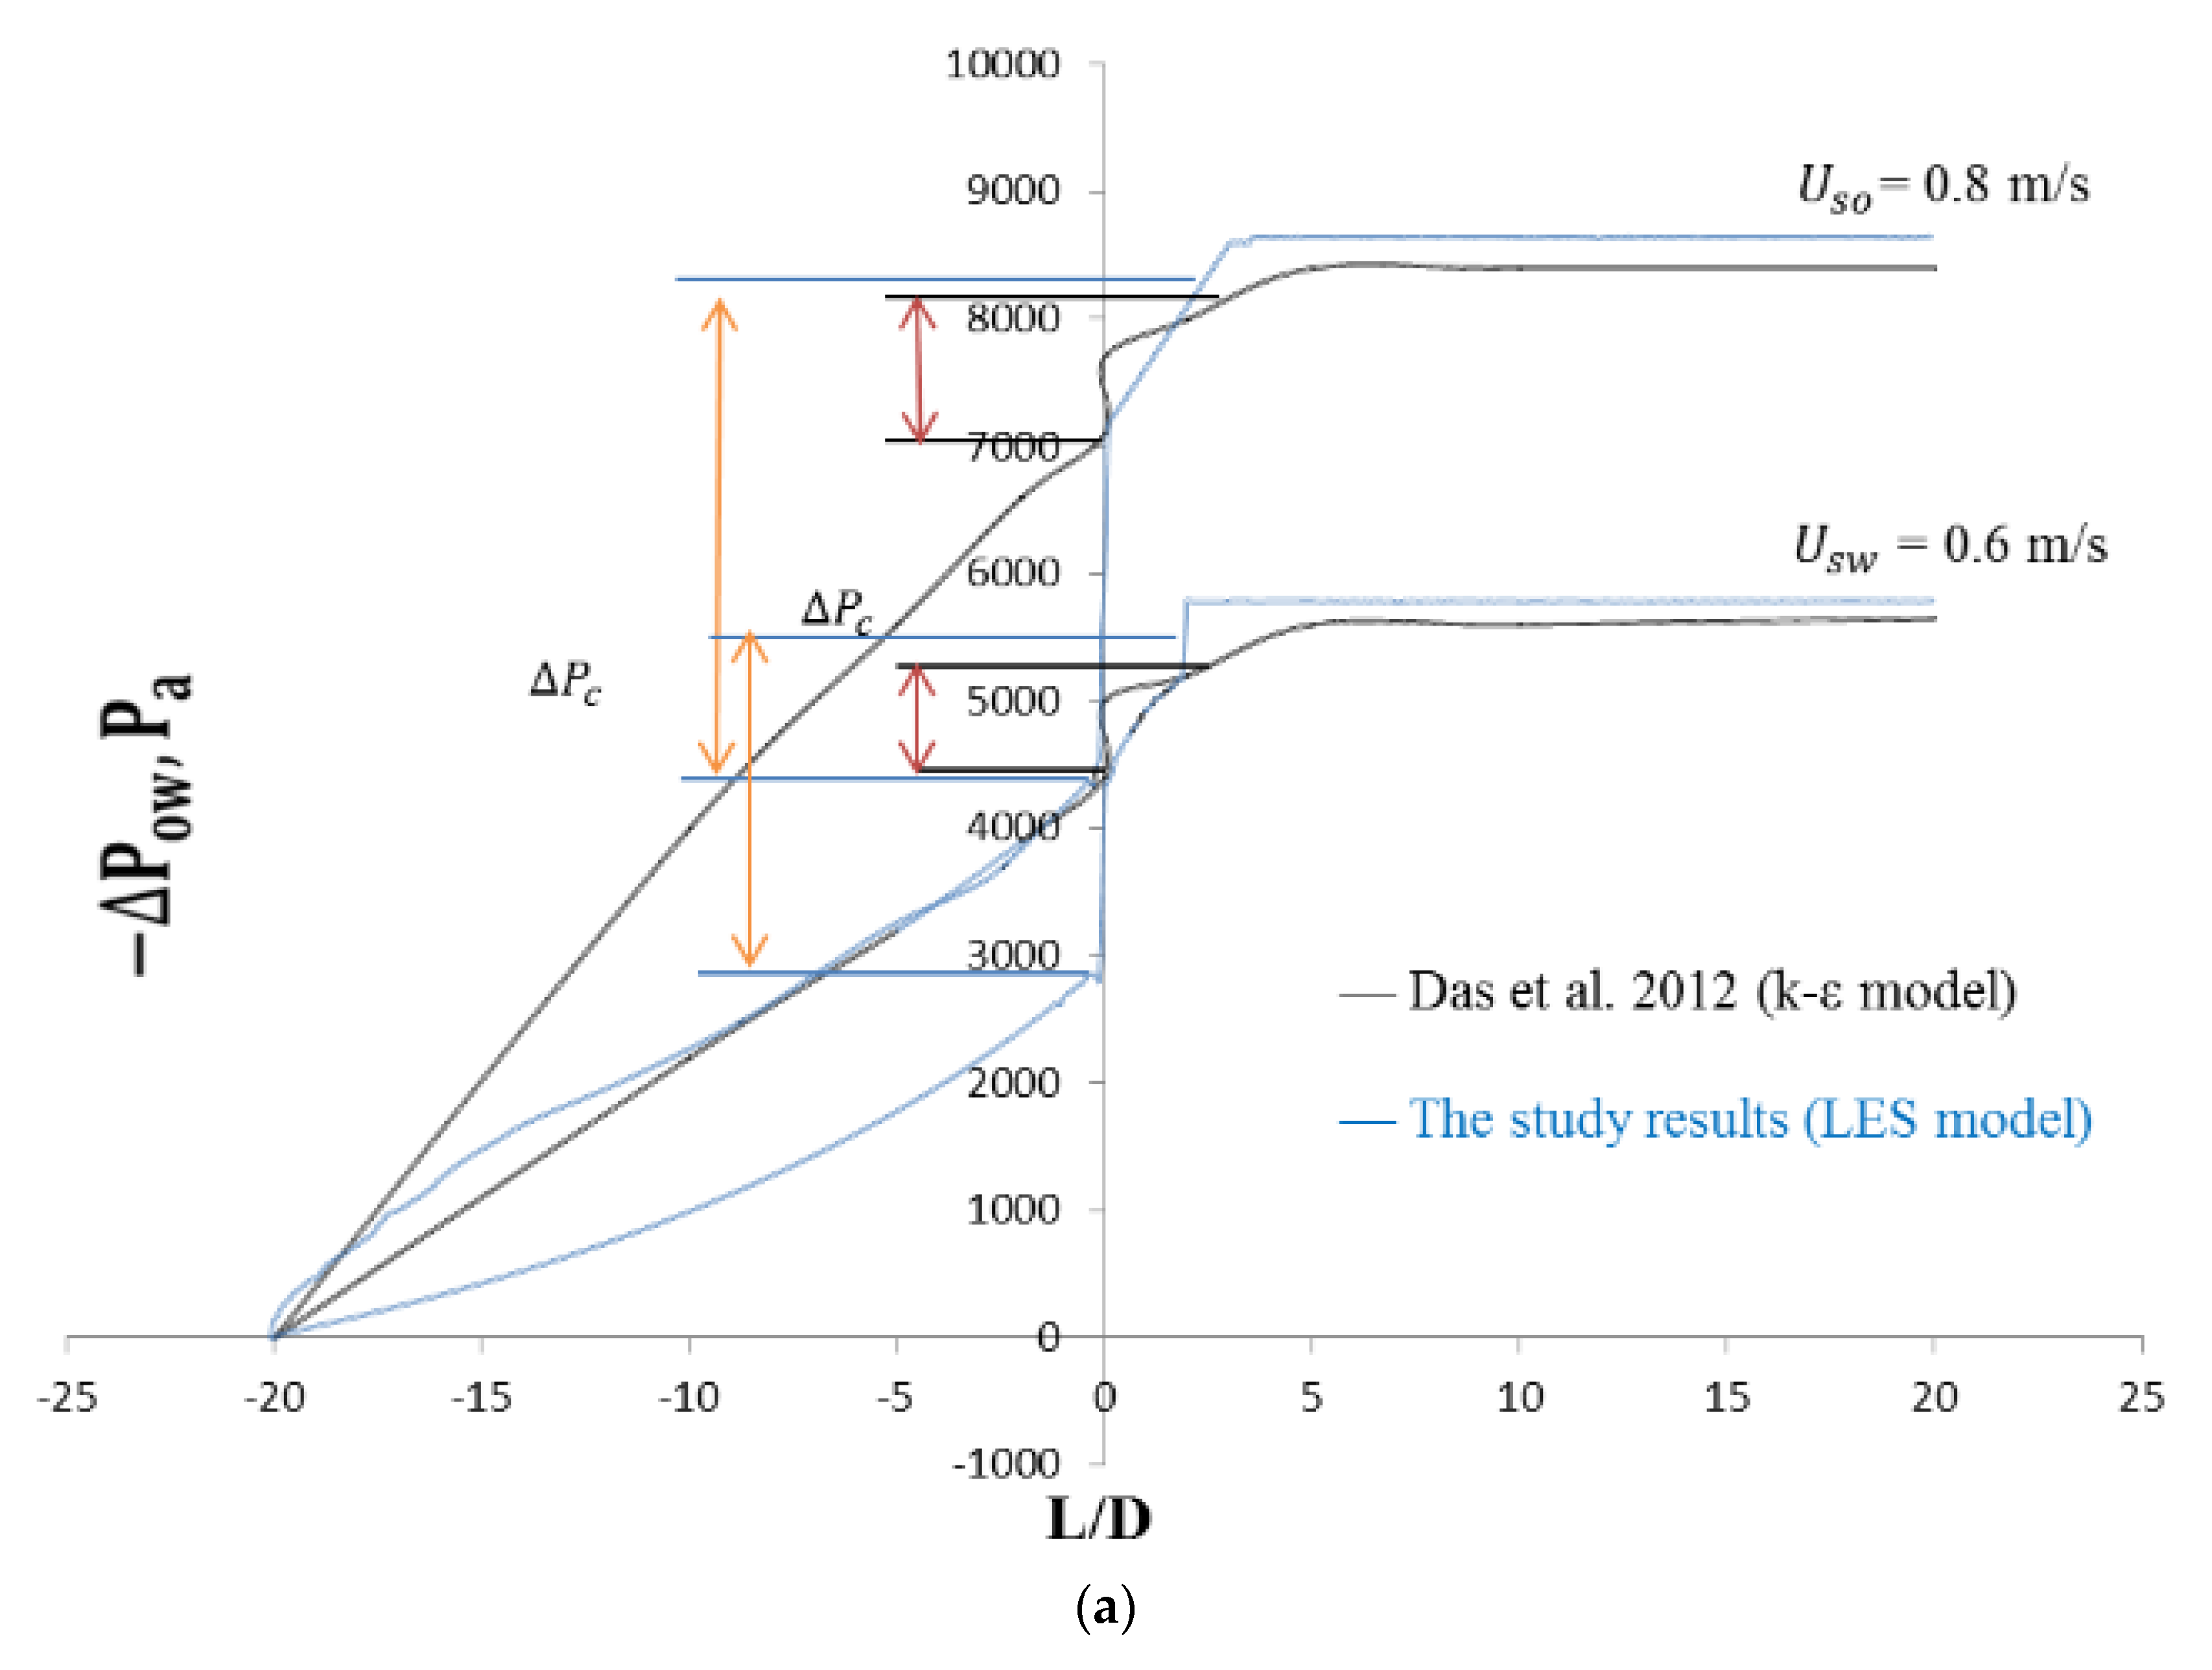
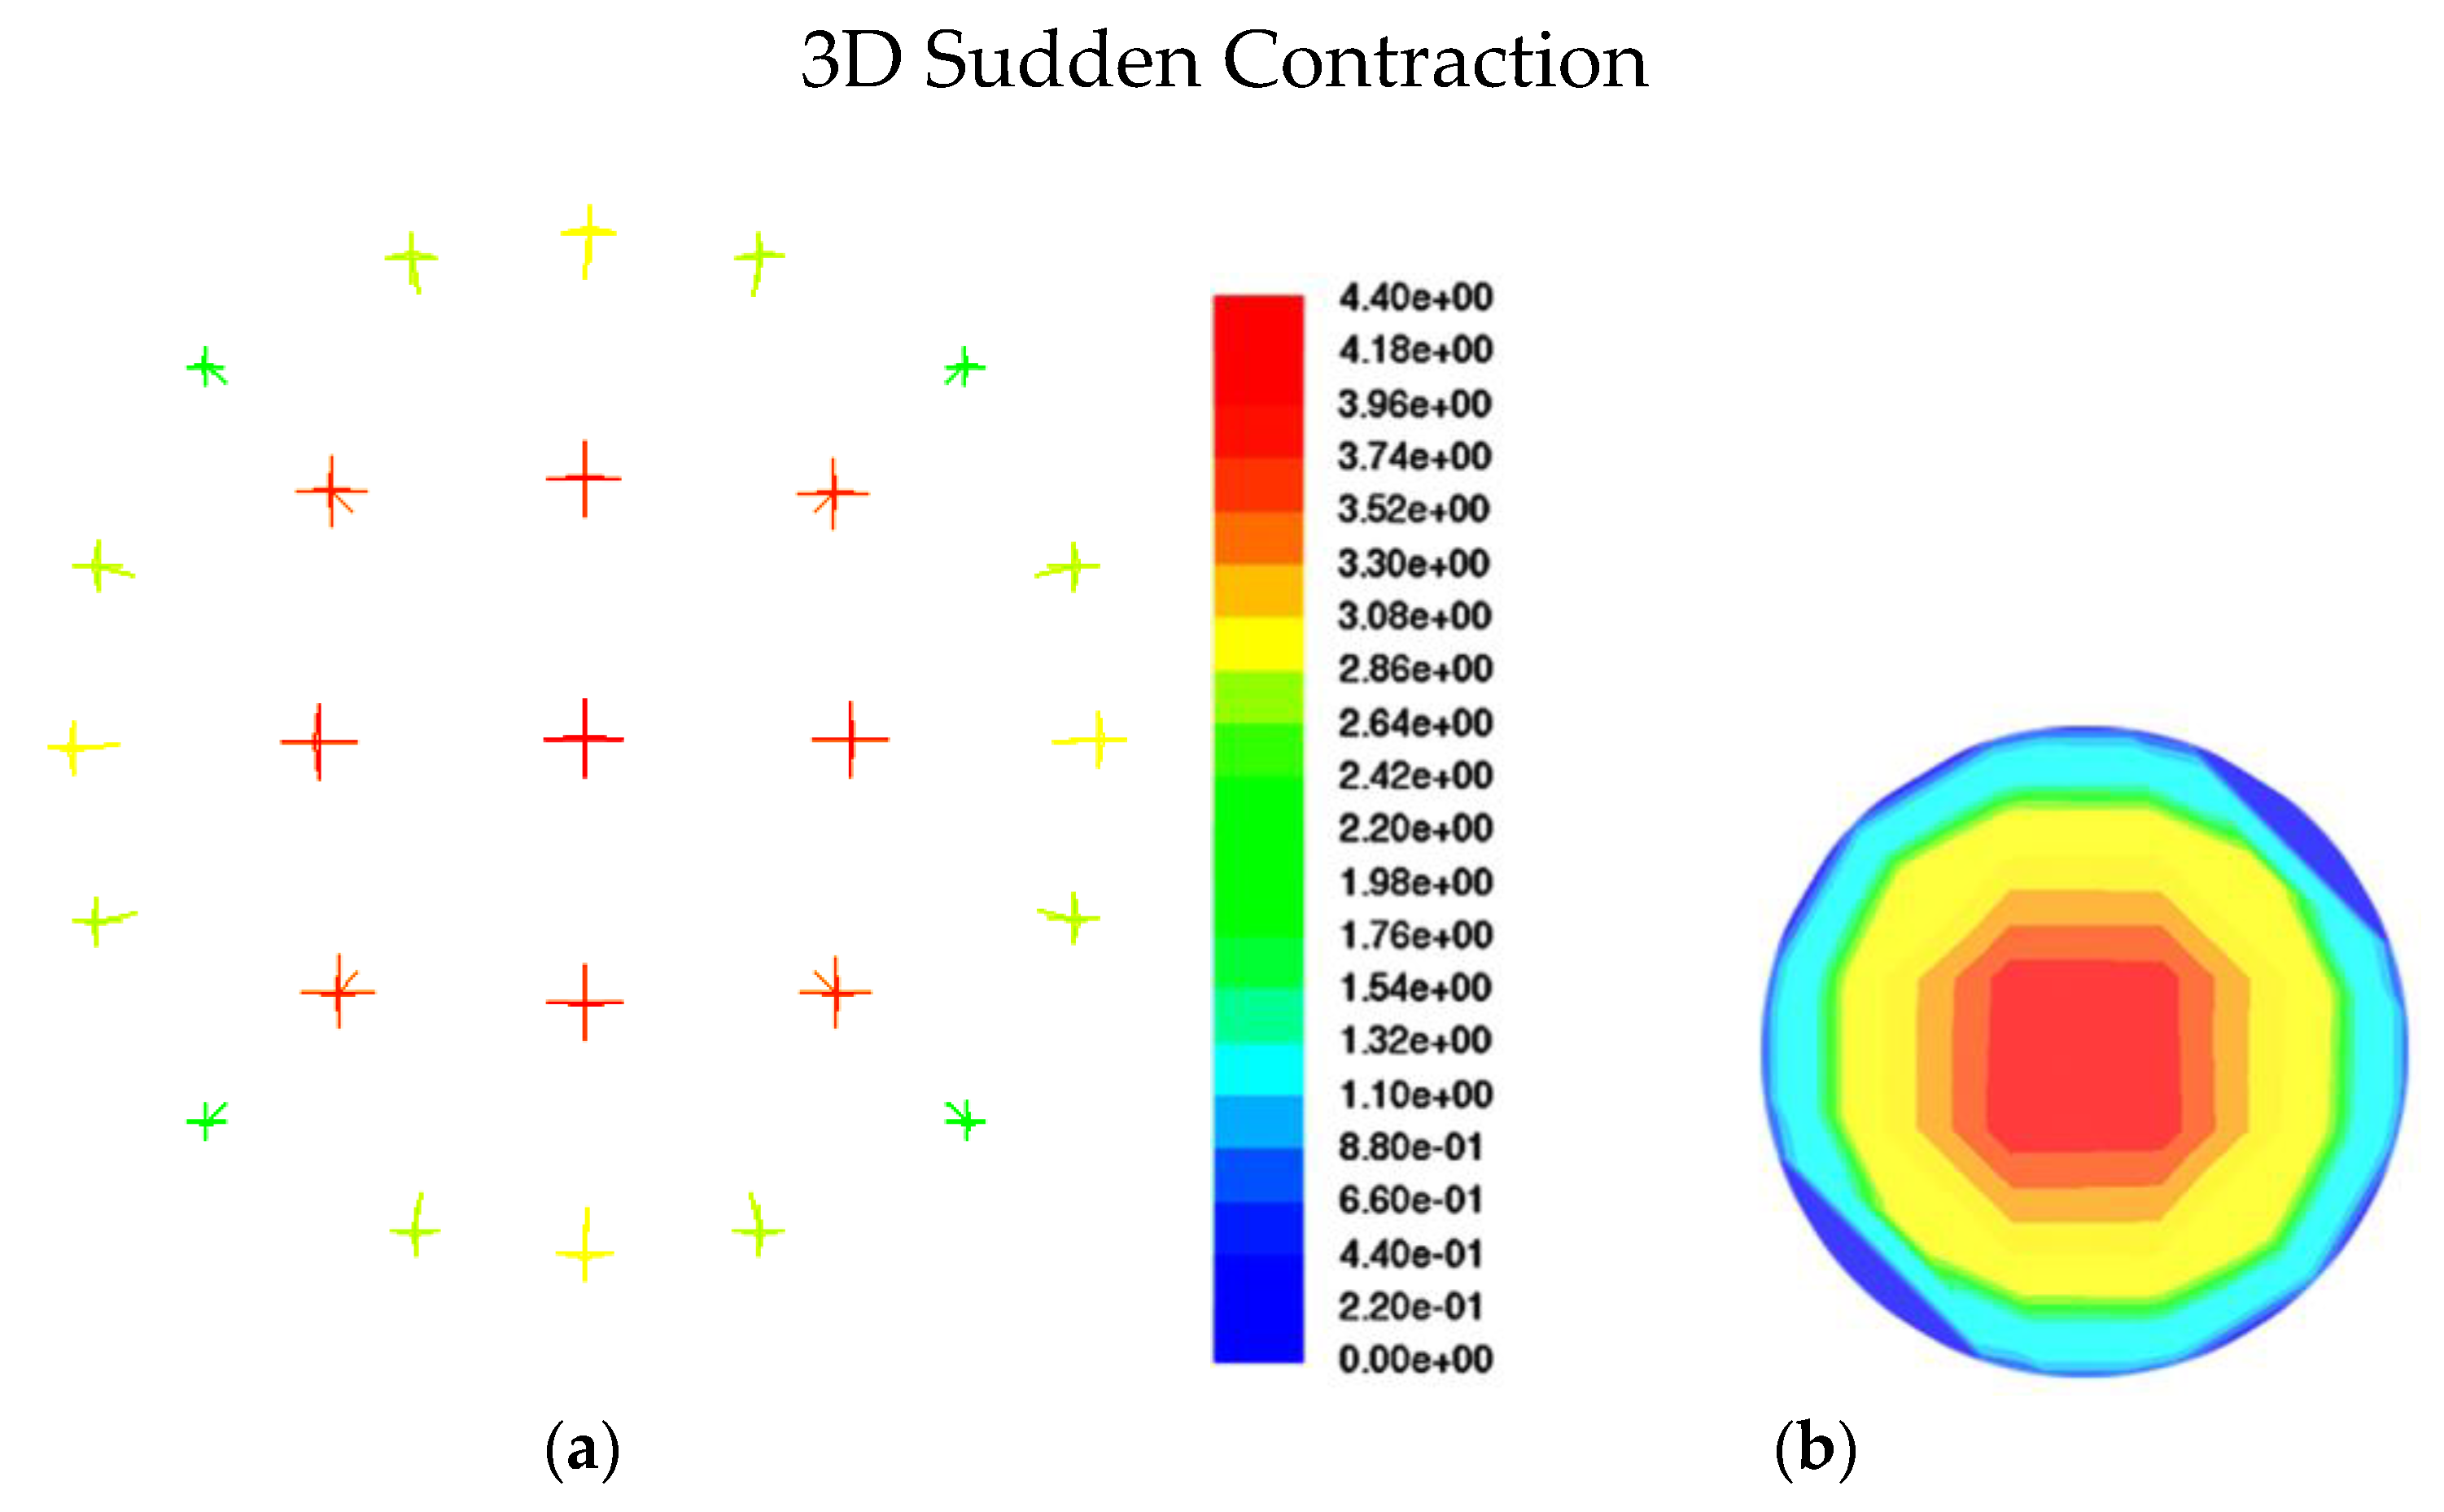
6.2. Sudden Contraction Model

In a sudden contraction model with inlet velocities of U s o = 0.6 m/s, and U s w = 0.3 m/s, Figure 7a–c illustrates the velocity magnitude, velocity magnitude vectors, and path lines, respectively. The fluid velocity is zero close to the wall and rises as it goes farther away from it. The zoomed-in part of the fitting model displays the figures where flow reversal can be seen at the top and bottom corners of the model. In contrast to sudden expansion, sudden contraction causes a lower and less severe flow reversal.

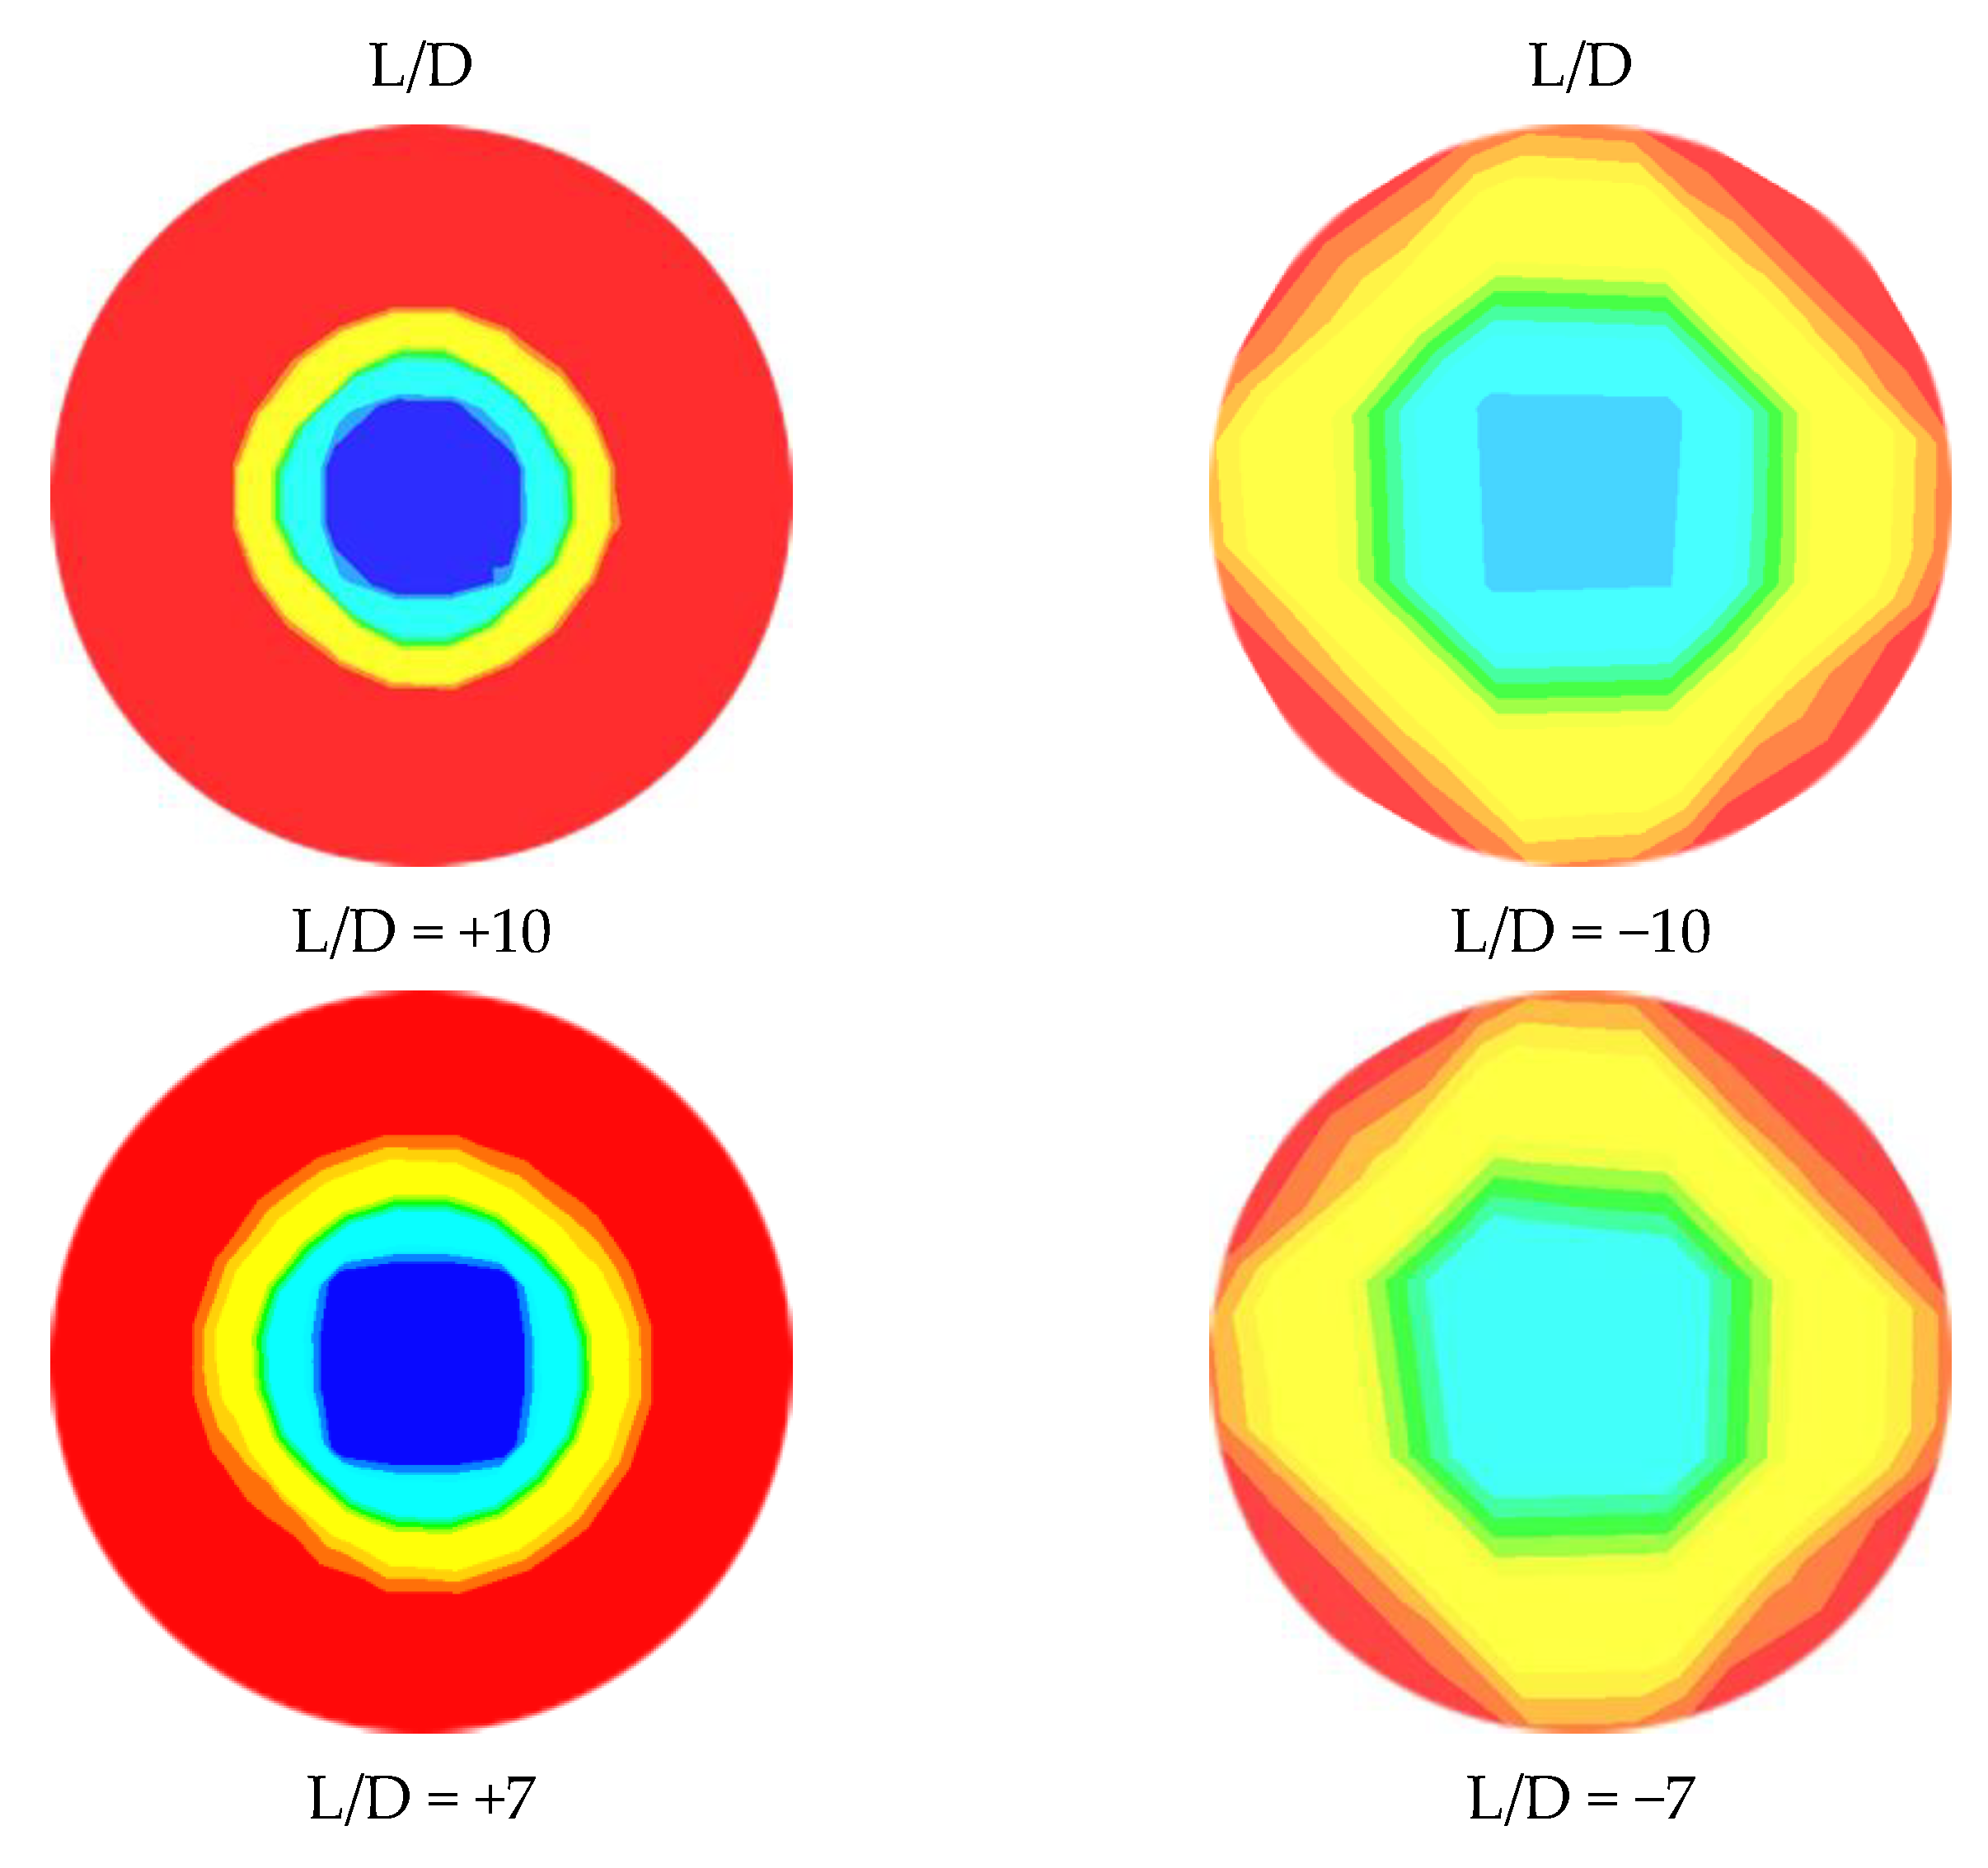
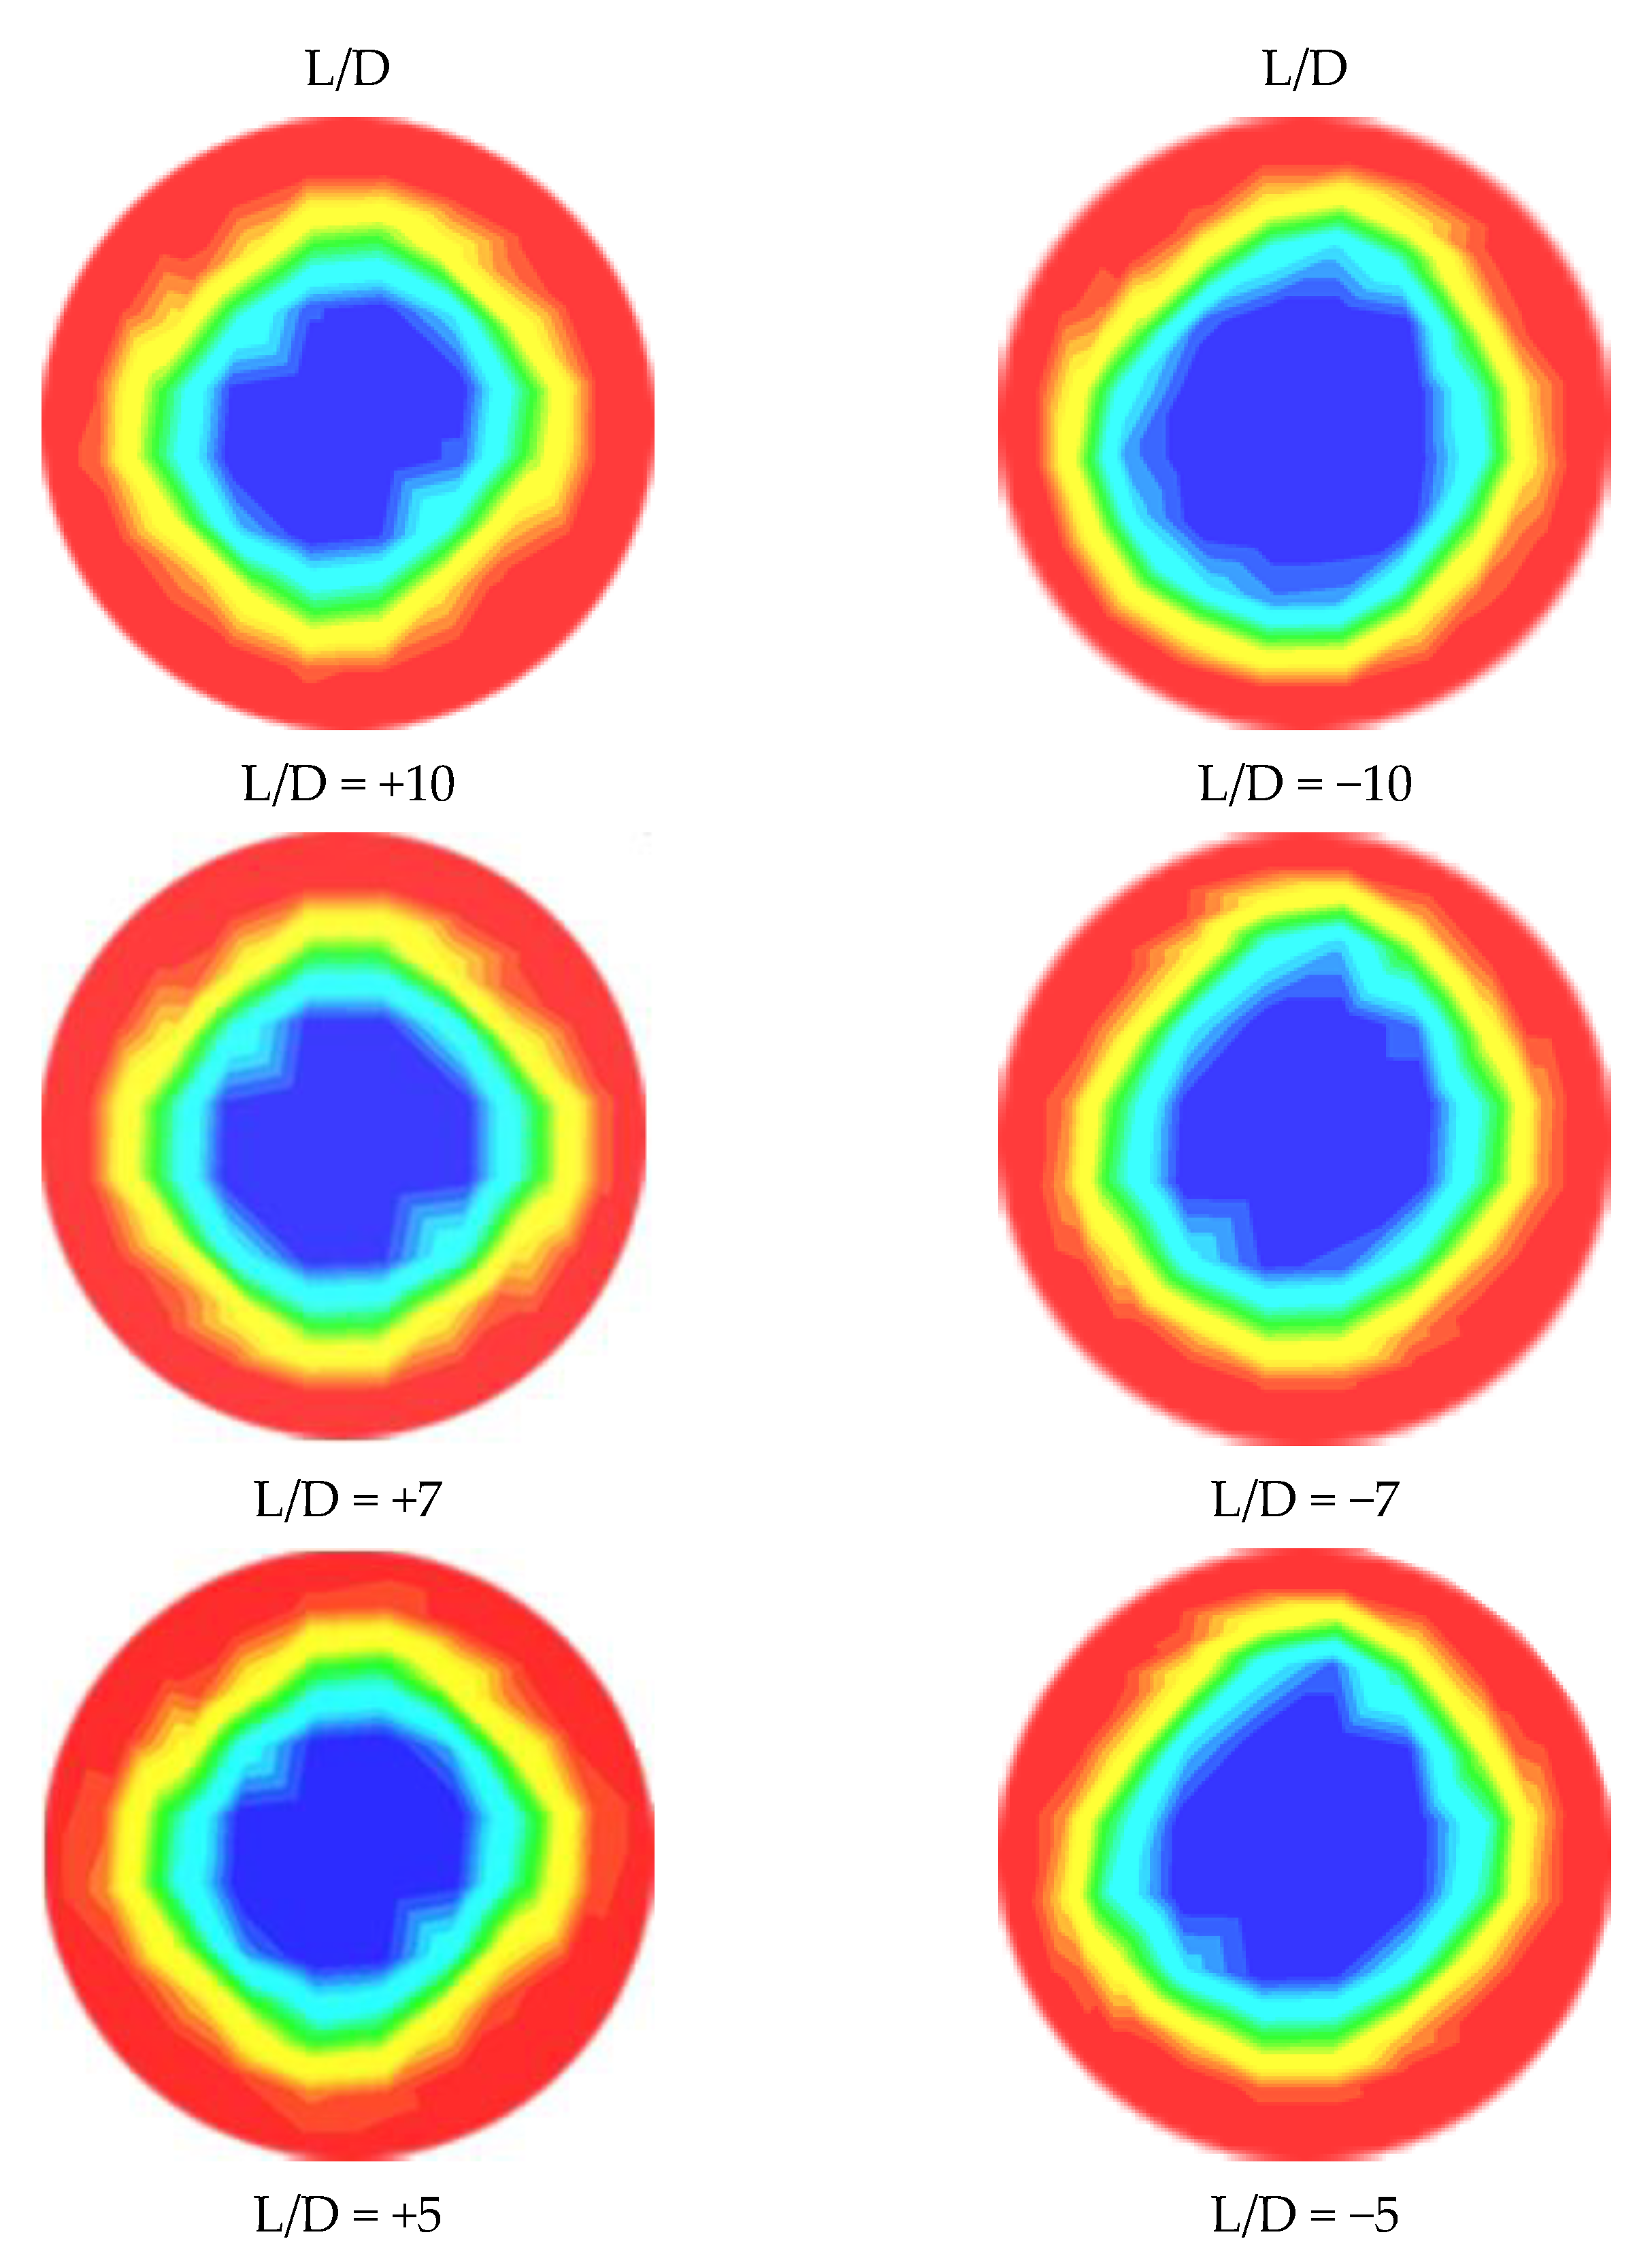
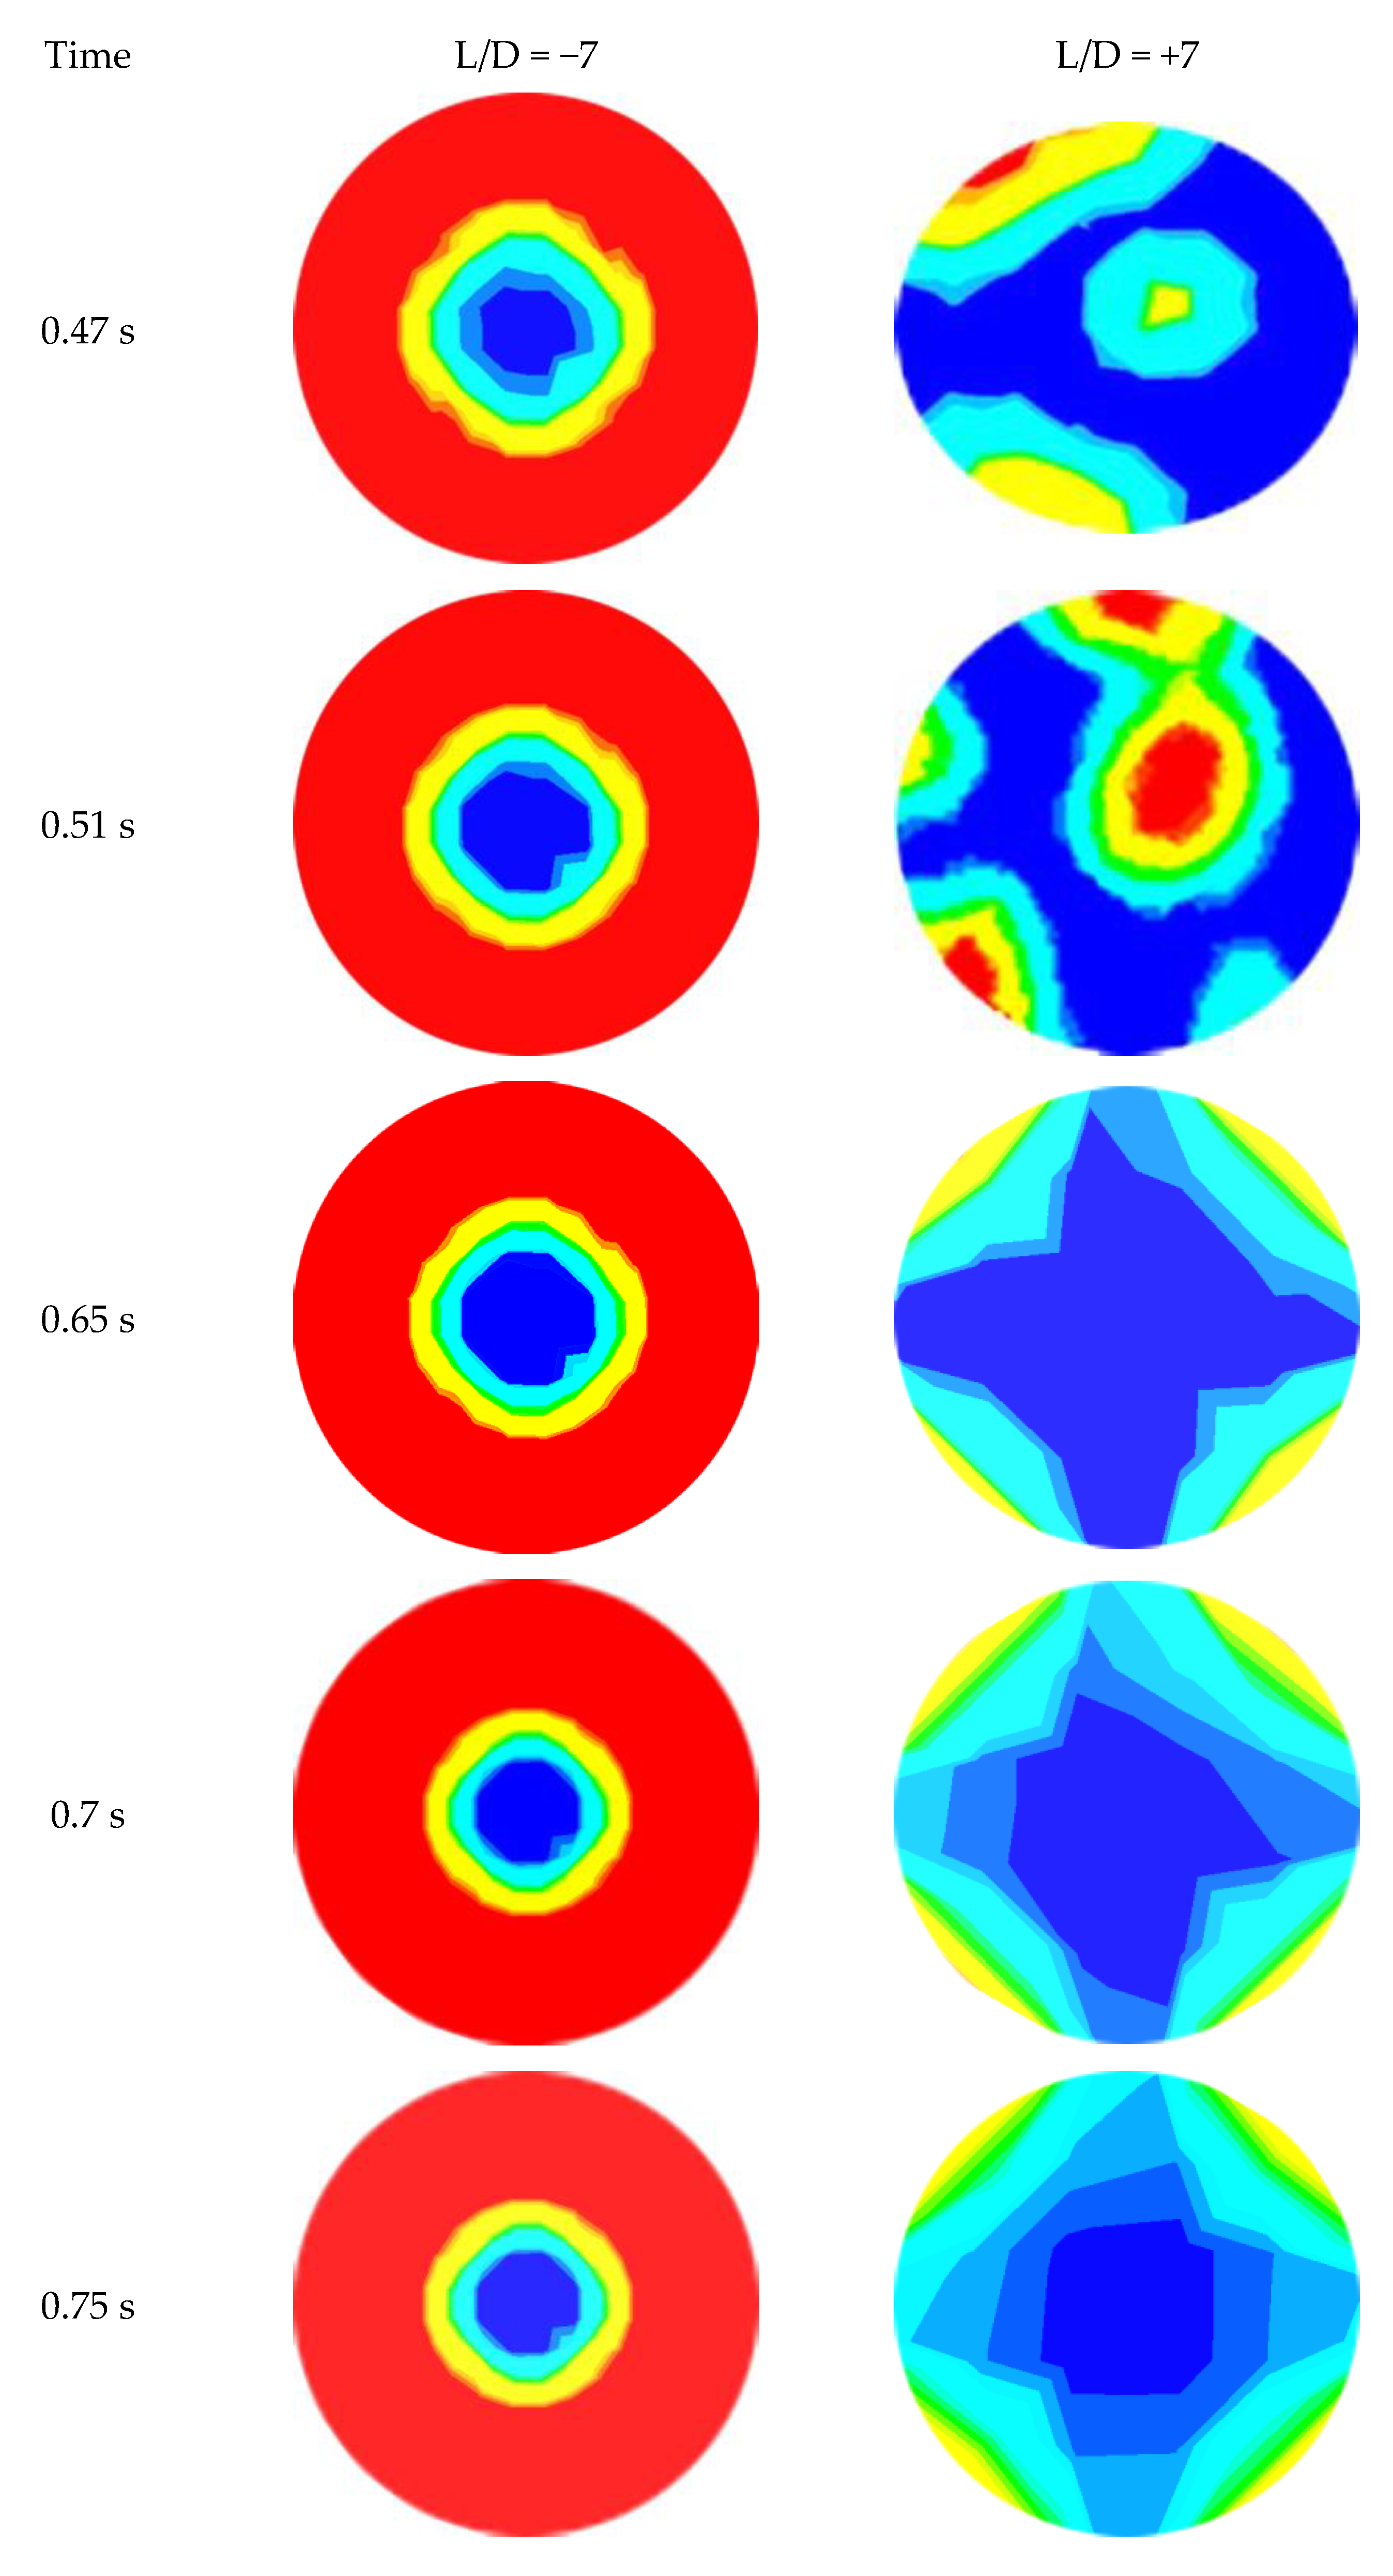
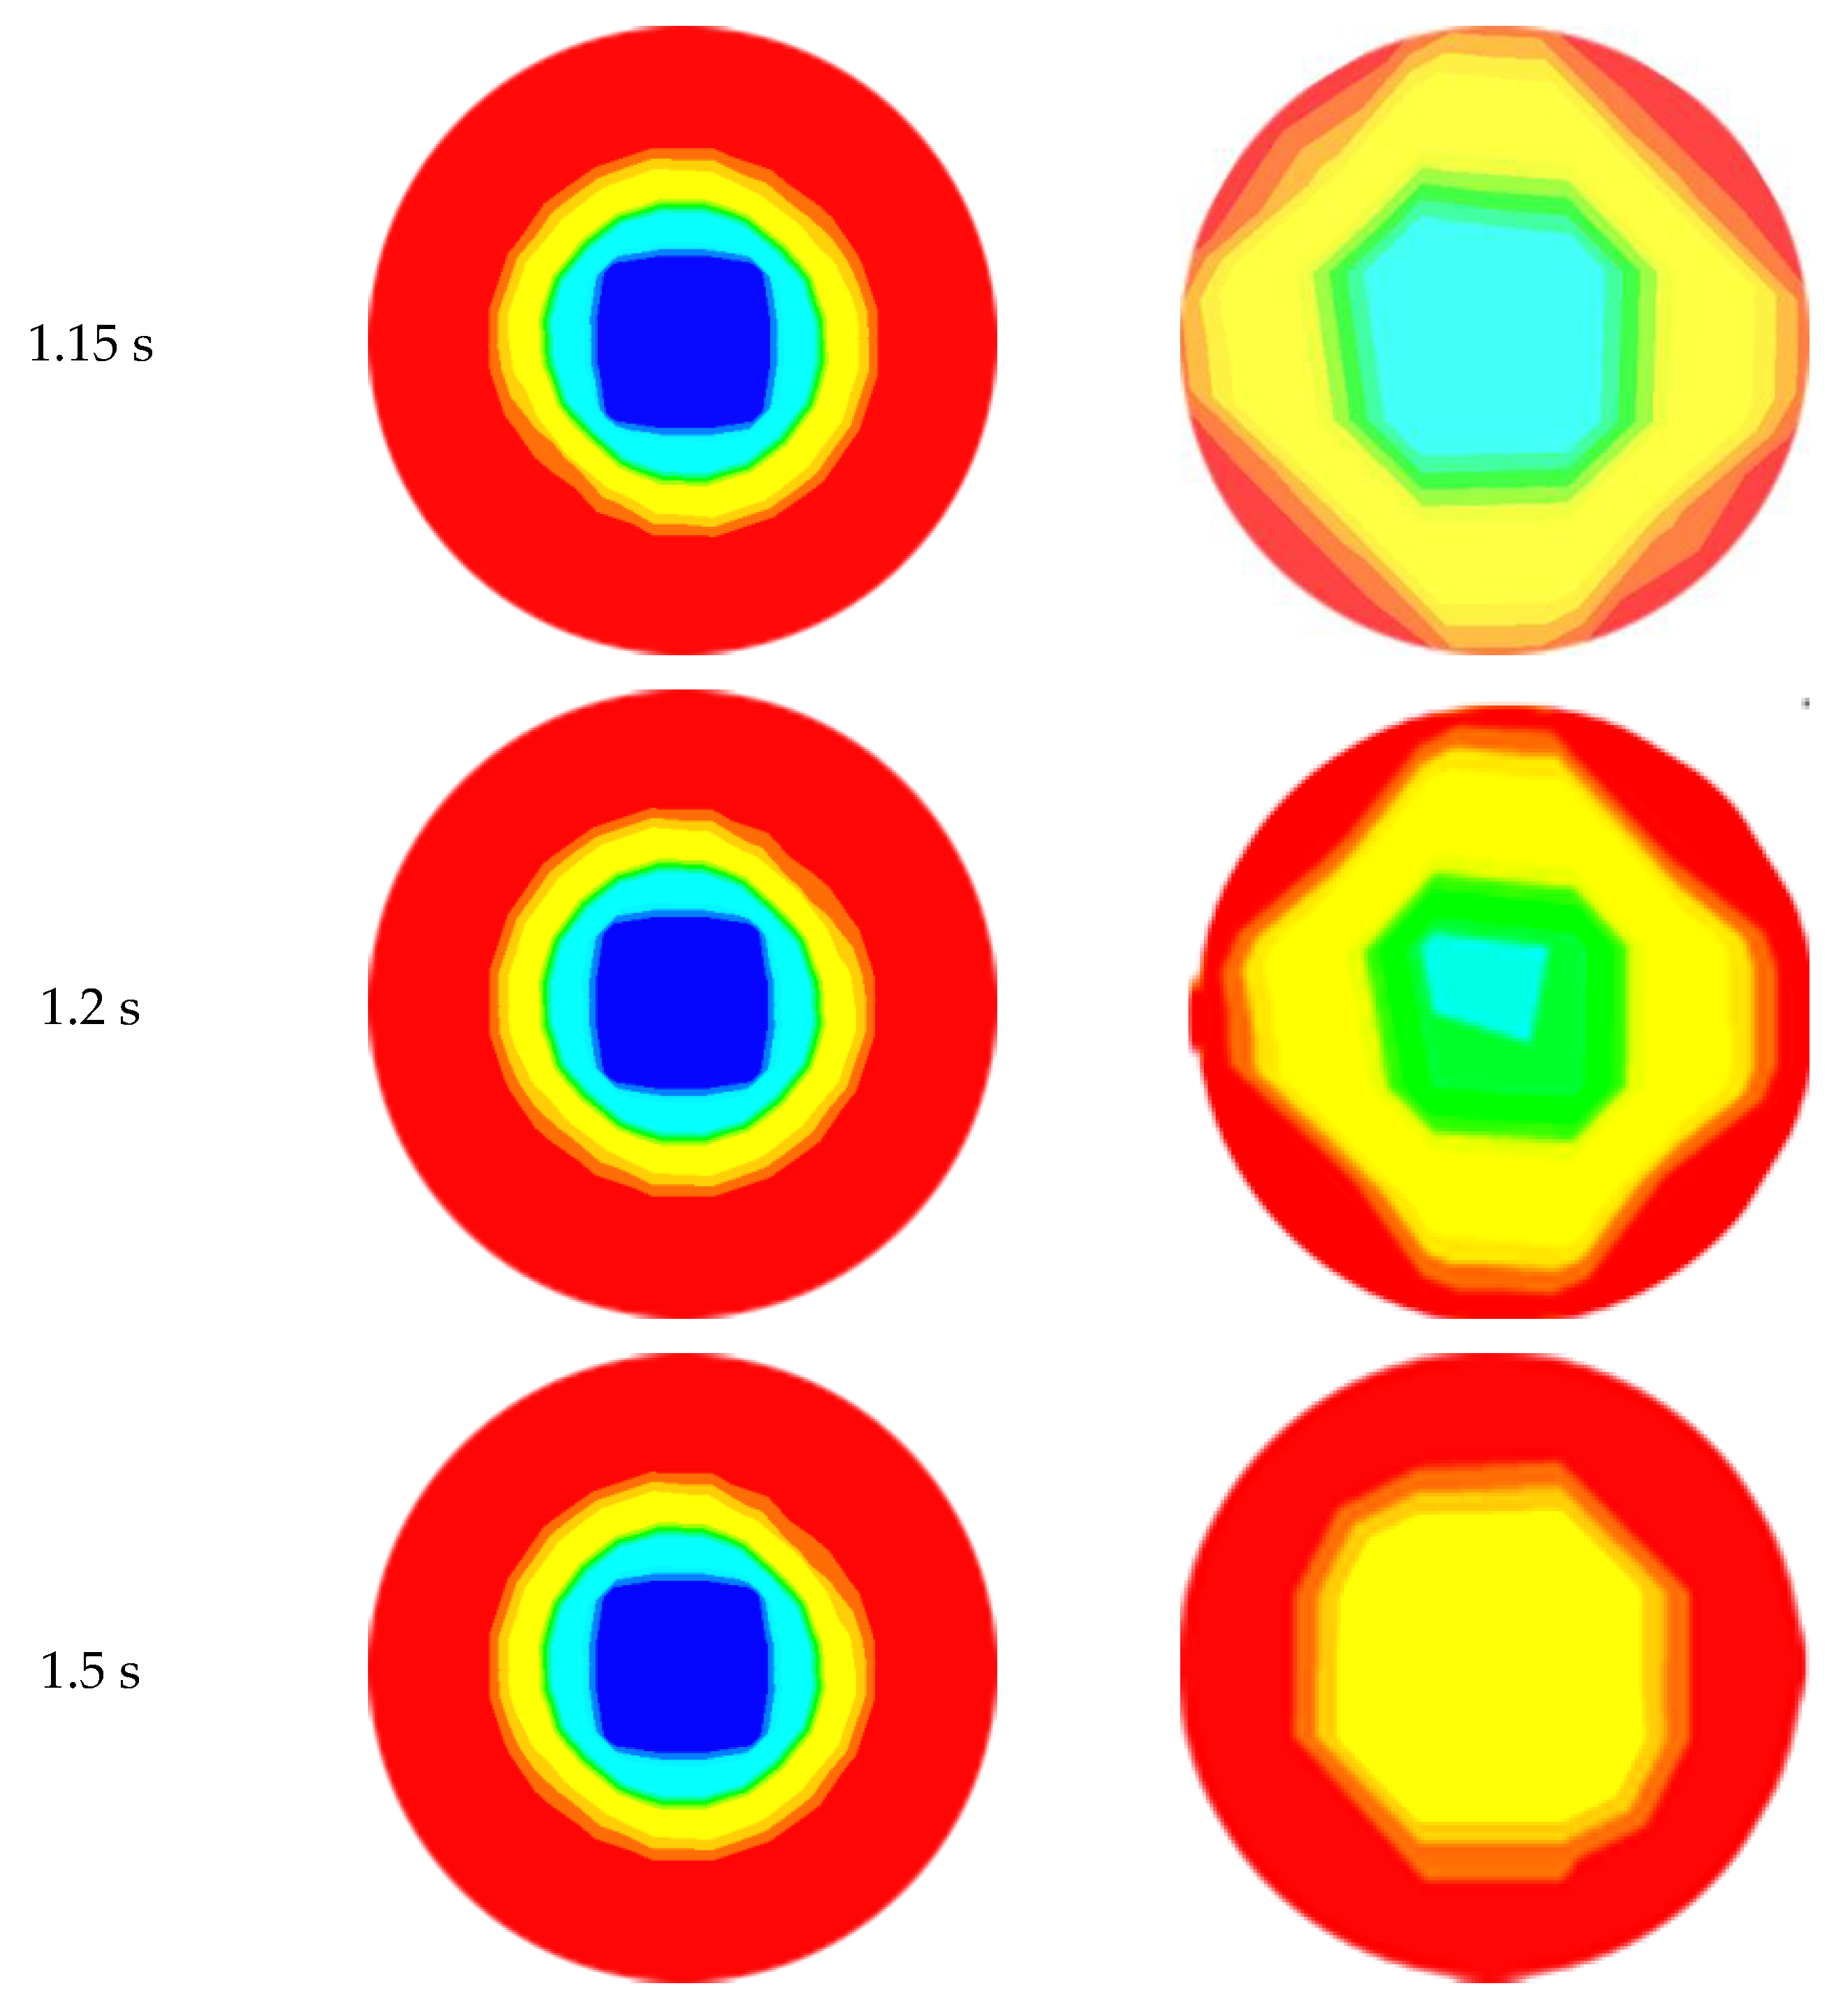
6.3. Development of Core Annular Flow

The diffusion of the water layer in the development of CAF in an abrupt contraction of a horizontal pipe at U s o = 0.6 m/s and U s w = 0.3 m/s at dissimilar time intervals (45, 60, 80, and 92 s) is represented in Figure 8. From the figure, it is apparent that heavy oil flows through the horizontal pipe at the center, as the core, while the water forms a film around the inner wall of the pipe. The right-hand side of this figure (downstream section) shows the gradual development of CAF with time. The figure also depicts the propagation of the thin layer of water through the evolution of CAF. The red color refers to water, and the dark blue color refers to oil. From the CFD calculation, CAF developed approximately at t = 0.92 s, when U s o = 0.6 m/s and U s w = 0.3 m/s. Therefore, the growth of annular flow here agrees with the findings from the Kaushik et al. [17] study. Figure 9 and Figure 10 indicate the cross-sectional contours of phase distribution at different axial plane locations at t = 1.02 s for sudden contraction and sudden expansion, respectively. To determine the full region of annular flow, simulations are also run in a variety of combinations with the superficial velocities. The findings showed accurate predictions and annular flow patterns with VOF approaches. As demonstrated in Figure 9 and Figure 10 for contraction and expansion, during the oil and water phases at higher velocities, a thin water layer was seen on top of the oil layer, and the interface was slightly disturbed. All the figures’ portions are colored red to denote the water phase, whereas those shaded dark blue denote the oil phase. By using simulated oil–water CAF flow, the contours of the oil volume fraction located in L/D = ± 5, ± 7 , and ± 10 of the contraction and expansion pipe length are presented in Figure 9 and Figure 10. Different velocities indicate different inversion points. From the contours, it is observed that the segment of oil in the top region shows a high portion of oil. It also shows a smaller amount of water inversion in this phase. Figure 11 indicates the contours of phase circulation and abrupt contraction at L/D = −7.0 and L/D = 7.0 at different times. It is observed from Figure 8, Figure 9 and Figure 11 that as water velocity rose, the oil flow increased. However, at greater phase velocities, when the oil–water contact is characterized by short irregular waves, this model fails to adequately describe the waviness of the interface. Finally, this figure shows the waves at the oil–water interface fluctuating through time and space, but it also shows that further research is needed to understand the link between these waves and their influence on the outcomes.

6.4. Fouling at Sudden Expansion

Fouling happens downstream of abrupt expansion, according to previous research, both experimental and simulation-based, and this can be problematic when transporting heavy crude oil. In this study, many attempts are made to find an appropriate method or suitable manner by which to avoid this problem, as it is observed that when the water velocity increases from ( U s w ) 0.3 m/s to 1.2 m/s at constant oil velocity ( U s o = 0.3 m/s), or ( U s w = 0.6 m/s to U s w = 1.2 m/s at constant oil velocity ( U s o = 0.6 m/s), the trend toward fouling is reduced. Figure 12 indicates that fouling is lessened when water velocity is increased. From the previous studies, it was observed that fouling can be decreased by enlarging the expansion pipe diameter, although further investigations and studies are required to justify and analyze the two-phase oil–water flow distribution. In addition, it is observed that the pressure drop increased with both U s o and U s w . Since the viscosity of oil is more than 200 times that of water, an increase in oil velocity at a constant water velocity increases the oil fraction, which in turn increases effective viscosity. As a result, the frictional pressure drop increases, as shown in Figure 12, changing the superficial velocities of the oil from U s o = 0.6 to 1.2 m/s with constant water U s w = 0.6 m/s, and also when the superficial velocities of the oil  U s o and water U s w are changed. On the other hand, the increase in the water fraction has less of an impact on the effective viscosity. Hence, a steady increase in a drop in pressure is seen with changes in U s w . Gravity has the power to affect the mixture after expansion since it can also be a cause of fouling in the downstream zone, where the velocities are lower. As a result, it is suggested that the best course of action is to enhance water velocity because the fluid (oil) at the core has the potential to travel toward the top wall and lead to fouling. However, it has also been suggested that, with the same oil and water velocity, the pipe’s diameter be raised. As a result, the core fluid must travel a greater distance, which reduces fouling.

6.5. Hydrodynamic Study

The fluid stream paths along the axial planes of expansion and contraction are depicted in Figure 6c and Figure 7c, respectively. The velocity magnitude gives the vector its color, and the contours of the velocity magnitudes are provided next to each figure of a path line. When an area suddenly expands or contracts, the recirculating flow that is seen when the area changes is always quite noticeable. In cases of sudden contraction, a tiny recirculating flow is occasionally noted, and little clear recirculating flow is observed. Additionally, it has been made possible to comprehend and analyze the pressure fluctuations associated with both contraction and expansion. Figure 13a and Figure 13b compare the pressure variations between this Investigation and the Kaushik et al. [17] study at various places for contraction and expansion, respectively. These comparisons reveal some distinctions. For instance, the pressure rate is only slightly growing, whereas Kaushik et al. [17] analysis shows that the pressure rate is gradually rising. According to this research, pressure on the plane of area change suddenly decreases in circumstances of both expansion and contraction. As seen in Figure 13a,b, a quick decrease in pressure is seen near the plane of area change after an abrupt contraction. When L/D increases, the pressure drop that occurs immediately after a rapid contraction increases sharply. Figure 13b, however, illustrates the pressure drop with abrupt expansion as L/D rises. This illustrates that while the pressure drops change more gradually downstream, they are steeper upstream. To calculate and evaluate the pressure decrease at the plane of the area change, future research can employ these profiles. Additionally, the cross-section vector and velocity contours for contraction and expansion, respectively, are shown in Figure 14a,b and Figure 15a,b throughout this investigation. According to the figures, the magnitude of velocity in the radial direction varied gradually. The velocity appears to be highest in the middle of the pipe, gradually dropping off during both contraction and expansion until it ultimately drops to zero at the wall. Consideration should be given to the velocity profile for various axial locations of the pipes to fully comprehend these phenomena. For this, the velocity fluctuations for both contraction and expansion were assessed. The volume percent of oil is depicted in Figure 5a as progressively decreasing upstream and gradually decreasing by a length in the downstream region until it reaches a constant value at the conclusion. Figure 5b, however, displays a different pattern. When compared to the nearest point of expansion, the oil volume fraction steadily rises and then begins to drop. According to the numbers, the volume proportion of oil is the largest close to the entrance and steadily drops with the length until it reaches a constant value. As a result, there is a higher oil proportion at the intake, and as the fluids travel towards the exit, their velocity rises, and the volume fraction is discovered to be constant. Further studies and investigations are required to justify and understand the influence of U s o and U s w on the oil volume fraction for contraction and expansion. These investigations are necessary to fully comprehend the flow phenomenon.

7. Conclusions

In the present study, an unsteady, three-dimensional, two-phase oil–water mixture in a horizontal pipe core annular flow is numerically investigated. Large eddy simulation (LES) and a sub-grid-scale (SGS) model are used to examine flow characteristics. The Smagorinsky model is utilized to capture small-scale unstable turbulent flows. Pressure and velocity parameters are set up to correspond to the values provided by Kaushik et al. [17] in the solver and validate the numerical results. The following results are obtained from the present analysis:
  • Oil–water CAF was predicted using CFD calculations with ANSYS Fluent 13.0 for 0.6 m horizontal pipe length contractions and expansions.
  • Based on convergence, the prediction of the oil–water CAF pattern, and the smoothness of the interface, the VOF multiphase model with the LES model and two equations turbulent model was chosen.
  • To determine the ideal mesh size to use in the simulation process, unstructured mesh research was accomplished.
  • A drastic change in pressure of 4000 Pa is observed near the plane of area change when the superficial flow velocity of water is 0.6 m/s in a sudden contraction pipe. This change in pressure is for the water velocity of 0.3 m/s, which is 6000 Pa.
  • The change in pressure observed near the plane of area change in the sudden expansion pipe is marginally less compared to the sudden contraction pipe.
  • Predictions of pressure based on various flow velocities were noted. It is evident that as velocity rises, the pressure gradient does as well.
  • The split water layer and wavy interface of the oil–water system were completely predicted by the CFD simulation, but separated oil layers were not accurately predicted. Therefore, before simulating other stratified points, such issues should be resolved.
As a result, future studies will methodically strive toward developing a flawless model. This will include a thorough examination of the two-phase flow model and the impact of the computational domain on timing the change and temporal variation between the volume fraction, velocities, and pressure drop, preventing fouling in the horizontal pipe wall and lowering wall friction. Eventually, less electricity was used, which led to a decrease in the price of transportation.

Author Contributions

S.A.J.: conceptualization, investigation, methodology, validation, post-processing, writing the first draft. S.M.: paper writing, Corrections. A.S.: writing, review and editing, formal analysis and improving the manuscript. All authors have read and agreed to the published version of the manuscript.

Funding

The authors declare that no funding was received.

Data Availability Statement

Data will be made available upon request.

Acknowledgments

Authors acknowledge that no funding is received for carrying out this research work. Author 1 thank Shian Gao, Department of Engineering, The University of Leicester, Leicester LEi 7RH, UK for his excellent guidance in carrying out this research work.

Conflicts of Interest

The authors declare that they have no known competing financial interest or personal relationship that could have appeared to influence the work reported in this paper.

References

  1. Anderson, J.D. Computational Fluid Dynamics; McGraw-Hill: New York, NY, USA, 1995. [Google Scholar]
  2. Anderson, D.; Tannehill, J.C.; Richard, H.; Pletcher, H.; Ramakanth, M.; Shankar, V. Computational Fluid Mechanics and Heat Transfer, 4th ed.; CRC Press: Boca Raton, FL, USA, 2020. [Google Scholar]
  3. Chung, T.J. Computational Fluid Dynamics; Cambridge University Press: Cambridge, UK, 2014. [Google Scholar]
  4. Verteeg, H.; Malalasekera, W. An Introduction to Computational Dynamics: The Finite Volume Method; Longman Group Ltd.: London, UK, 1995. [Google Scholar]
  5. Smagorinsky, J.S. General circulation experiments with the primitive equations, part I: The basic experiment. Mon. Weather. Rev. 1963, 91, 99–164. [Google Scholar] [CrossRef]
  6. Lilly, D.K. The representation of small-scale turbulence in numerical simulation experiments. In Proceedings of the IBM scientific Computing Symposium on Environmental Sciences IBM Data Processing Division, Whithe Plains, NY, USA, 14–16 November 1966; pp. 195–210. [Google Scholar]
  7. Deardorff, J.W. The use of sub-grid transport equations in a three-dimensional model of atmospheric turbulence. J. Fluids Eng. 1973, 95, 429–438. [Google Scholar] [CrossRef]
  8. Deardorff, J.W. A numerical study of three-dimensional turbulent channel flow at large Reynolds numbers. J. Fluid Mech. 1970, 41, 453–480. [Google Scholar] [CrossRef]
  9. Deardroff, J.W. Three-dimensional numerical study of the height and mean structure of a heated planetary boundary layer. Bound.-Lay. Meteorol. 1974, 7, 81–106. [Google Scholar] [CrossRef]
  10. Schumann, U. Sub-grid scale model for finite difference simulations of turbulent flows in plane channel. J. Comput. Phys. 1975, 18, 376–404. [Google Scholar] [CrossRef]
  11. Wang, W.P. Coupled Compressible and Incompressible Finite Volume Formulations for the Large Eddy Simulation of Turbulent Flow with and without Heat Transfer. Ph.D. Thesis, Iowa State University, Ames, IA, USA, 1995. [Google Scholar]
  12. Herring, J.R. Sub-grid scale modeling—An introduction and overview. In Turbulent Shear Flows I; Durst, F., Launder, B.E., Schmidt, F.W., Whitelaw, J.H., Eds.; Springer: Berlin/Heidelberg, Germany, 1979; pp. 347–352. [Google Scholar]
  13. Patankar, S.V. Numerical Heat Transfer and Fluid Flow; Hemisphere: Washington, DC, USA, 1980. [Google Scholar]
  14. Lilly, D.K. On the Application of the Eddy Viscosity Concept in the Inertial Sub-Range of Turbulence; National Center for Atmospheric Research: Boulder, CO, USA, 1966. [Google Scholar]
  15. Bartosiewicz, Y.; Duponcheel, M. Large-eddy simulation: Application to liquid metal fluid flow and heat transfer. In Thermal Hydraulics Aspects of Liquid Metal Cooled Nuclear Reactors; Woodhead Publishing: Sawston, UK, 2019; pp. 245–271. [Google Scholar]
  16. Pope, S.B. Large-eddy simulation using projection onto local basis functions. In Fluid Mechanics and the Environment: Dynamical Approaches; Lumley, J.L., Ed.; Springer: Berlin/Heidelberg, Germany, 2000. [Google Scholar]
  17. Kaushik, V.; Ghosh, S.; Das, G.; Das, P. CFD simulation of core annular flow through sudden contraction and expansion. J. Pet. Sci. Eng. 2012, 86–87, 153–164. [Google Scholar] [CrossRef]
  18. Sagaut, P. Large Eddy Simulation for Incompressible Flows, and Introduction; Springer: Berlin/Heidelberg, Germany; New York, NY, USA, 2006. [Google Scholar]
  19. Sagaut, P.; Deck, S. Large eddy simulations for aerodynamics: Status and perspectives. Phil. Trans. R. Soc. A 2009, 367, 2849–2860. [Google Scholar] [CrossRef] [PubMed]
  20. Rogallo, R.S.; Moin, P. Numerical simulation of turbulent flows. Ann. Rev. Fluid Mech. 1984, 16, 99–137. [Google Scholar] [CrossRef]
  21. Galperin, B.; Orszag, S.A. (Eds.) Large Eddy Simulation of Complex Engineering and Geophysical Flows; Cambridge University Press: Cambridge, UK, 1993. [Google Scholar]
  22. Lesieur, M.; M’etais, O. New trends in large-eddy simulations of turbulence. Annu. Rev. Fluid. Mech. 1996, 28, 45–82. [Google Scholar] [CrossRef]
  23. Meneveau, C.; Katz, J. Scale-invariance and turbulence models for large-eddy simulation. Ann. Rev. Fluid Mech. 2000, 415, 1–32. [Google Scholar] [CrossRef]
  24. Unger, F.; Friedrich, R. Large Eddy Simulation of Fully-developed Pipe Flow. In Proceedings of the Eighth Symposium on Turbulent Shear Flows, Munich, Germany, 9–11 September 1991; pp. 1931–1936. [Google Scholar]
  25. Eggels, J.G.M. Direct and Large Eddy Simulation of Turbulent Flow in Cylindrical Pipe Geometry. Ph.D. Thesis, Delft University of Technology, Delft, The Netherlands, 1994. [Google Scholar]
  26. Orlandi, P.; Fatica, M. Direct simulations of turbulent flow in a pipe rotating about its axis. J. Fluid Mech. 1997, 343, 43–72. [Google Scholar] [CrossRef]
  27. Unger, F.; Friedrich, R. Large eddy simulation of fully-developed turbulent pipe flow. In Flow Simulation of High Performance Computers I; Hirschel, E.H., Ed.; NNFM: Zorneding, Germany, 1991; Volume 38, pp. 201–216. [Google Scholar]
  28. Eggles, J.G.M.; Nieuwstadt, F.T.M. Large-eddy Simulation of Turbulent Flow in an Axially Rotating Pipe. In Proceeding of the 9th Symposium on Turbulent Shear Flows, Kyoto, Japan, 16–18 August 1993; pp. 3101–3104. [Google Scholar]
  29. Boersma, B.J.; Nieuwstadt, F.T.M. Large-Eddy Simulation of Turbulent Flow in a Curved Pipe. Trans. ASME 1996, 118, 248–254. [Google Scholar] [CrossRef]
  30. Yang, Z.-Y. Large Eddy Simulation of Fully Developed Turbulent Flow in a Rotating Pipe. Int. J. Numer. Methods Fluids 2000, 33, 681–694. [Google Scholar] [CrossRef]
  31. Kawamura, H.; Nakamura, S.; Satake, S.; Kunugi, T. Large Eddy Simulations of Turbulent Heat Transfer in a Concentric Annulus. Therm. Sci. Eng. 1994, 2, 16–25. [Google Scholar]
  32. Satake, S.; Kawamura, H. Large eddy simulation of turbulent flow in concentric annuli with a thin inner rod. In Turbulent Shear Flow 9; Springer: Berlin/Heidelberg, Germany, 1995; pp. 259–281. [Google Scholar]
  33. Rudman, M.; Blackburn, H.M. Large Eddy Simulation of turbulent pipe flow. In Proceedings of the Second International Conference of CFD in the Minerals and Process Industries CSIRO, Melbourne, Australia, 6–8 December 1999. [Google Scholar]
  34. Xu, X. Large Eddy Simulation of Compressible Turbulent Pipe Flow with Heat Transfer. Ph.D. Thesis, Iowa State University, Ames, IA, USA, 2003. [Google Scholar]
  35. Huang, J.; Jiang, F.; Yan, J. Study on Flow Characteristics of Annual Flow in Sudden Expansion and Contract Pipe. In Proceedings of the International Petroleum and Petrochemical Technology Conference, Beijing, China, 31 May–2 June 2023; Volume 5, pp. 169–185. [Google Scholar]
  36. Camarri, S.; Salvetti, M.V. On the Approximate Treatment of Wall Boundary Conditions in Large-Eddy Simulation; Technical Report ADIA 2002-3; Department of Aerospace Engineering, University of Pisa: Pisa, Italy, 2002. [Google Scholar]
  37. Camarri, S.; Salvetti, M.V. Towards the Large-Eddy Simulation of Complex Engineering Flows with Unstructured Grids; Technical Report RR-3844; INRIA: Le Chesnay-Rocquencourt, France, 1999. [Google Scholar]
  38. Sunday, N.; Settar, A.; Chetehouna, K.; Gascoin, N. Numerical study and sensitivity analysis of two-phase oil-water flow and heat transfer in different flowline orientations using OpenFOAM. Case Stud. Therm. Eng. 2022, 40, 102465. [Google Scholar] [CrossRef]
  39. Zhang, L.; Du, C.; Wang, H.; Zhao, J. Three-dimensional numerical simulation of heat transfer and flow of waxy crude oil in inclined pipe. Case Stud. Therm. Eng. 2022, 37, 102237. [Google Scholar] [CrossRef]
  40. Stephen, B. Pope. Ten questions concerning the large-eddy simulation of turbulent flows. New J. Phys. 2004, 6, 35. [Google Scholar]
  41. Piomelli, U.; Ferziger, J.H.; Moin, P. Models for Large Eddy Simulations of Turbulent Channel Flows Including Transpiration; Technical Report TF-32; Department of Mechanical Engineering, Stanford University: Stanford, CA, USA, 1987. [Google Scholar]
  42. Piomelli, U. Large-eddy simulations: Where we stand. In Advances in DNS/LES; Liu, C., Liu, Z., Eds.; AFOSR: Arlington, VA, USA, 1997; pp. 93–104. [Google Scholar]
Figure 1. Schematic of flow domain of (a) sudden expansion and (b) sudden contraction in larger horizontal pipes.
Fluids 08 00267 g001aFluids 08 00267 g001b
Figure 2. A three-dimensional structured grid for (a) sudden expansion and (b) sudden contraction.
Fluids 08 00267 g002
Figure 3. Oil volume fraction contours for mesh sizes.
Fluids 08 00267 g003
Figure 4. Radial profile of velocity at different axial positions (a) sudden expansion and (b) sudden contraction.
Fluids 08 00267 g004
Figure 5. Variation of time-average volume fraction of oil along the axis.
Fluids 08 00267 g005
Figure 6. (ac) Velocity magnitude, vectors, and Path lines colored by velocity magnitude along the axial plane.
Fluids 08 00267 g006
Figure 7. (ac) Velocity magnitude, vectors, and Path lines colored by velocity magnitude along an axial plane.
Fluids 08 00267 g007
Figure 8. Development of core flow with time: U s o = 0.6 m/s, U s w = 0.3 m/s at contraction—contour of oil volume fraction at contraction small pipe.
Fluids 08 00267 g008
Figure 9. Phase distribution at different axial locations of contraction at t = 1.15 s; U s o = 0.6 m/s, U s w = 0.3 m/s.
Fluids 08 00267 g009aFluids 08 00267 g009b
Figure 10. Phase distribution at different axial locations of expansion at t = 1.2 s; U s o = 0.6 m/s, U s w = 0.6 m/s.
Fluids 08 00267 g010
Figure 11. Phase distribution at L/D = −7.0 and L/D = 7.0 locations of contraction at different time; U s o = 0.6 m/s, U s w = 0.3 m/s.
Fluids 08 00267 g011aFluids 08 00267 g011bFluids 08 00267 g011c
Figure 12. Fouling at expansion and the contour of oil volume fraction occurs downstream of the expansion at a small pipe.
Fluids 08 00267 g012
Figure 13. (a) Axial distribution of pressure drop at U s o = 0.6 m/s for the sudden expansion; (b) Axial distribution of pressure drop at U_so = 0.3 m/s for sudden contraction.
Fluids 08 00267 g013aFluids 08 00267 g013b
Figure 14. (a) Contraction mixture velocity vectors at U s o = 0.6 m/s, U s w = 0.3 m/s, L/D = −10 for the optimum mesh size; (b) contraction mixture velocity contours at U s o = 0.6 m/s, U s w = 0.3 m/s, L/D = −10 for the optimum mesh size.
Fluids 08 00267 g014
Figure 15. (a) Expansion mixture velocity vectors at U s o = 0.6 m/s, U s w = 0.3 m/s, L/D = −10 for the optimum mesh size; (b) expansion mixture velocity contours at U s o = 0.6 m/s, U s w = 0.3 m/s, L/D = −10 for the optimum mesh size.
Fluids 08 00267 g015
Table 1. Fluid phase physical properties.
P r o p e r t y Unit W a t e r   P h a s e O i l   P h a s e
Density   ρ kg / m 3 999 960
Viscosity   μ Pa . s 0.001003 0.22
Interfacial   tension N / m 0.039 @ 25   ° C 0.039 @ 25   ° C
Table 2. Computational setup.
T u r b u l e n t   M o d e l L E S ,   S m a g o r i n s k y L i l l y   M o d e l
Material oil ,   and   water
N u m e r i c a l   D e t a i l s
Pressure Velocity   Coupling PISO
Descretisation   Momentum Bounded   Central   differencing
Pressure PRESTO
Gradient Least   square   cells   based
Time Bounded   sec ond   order   implicit
B o u n d a r y   c o n d i t i o n s
Inlet velocity
outlet pressure , ambient
S i m u l a t i o n   f a c t o r
Total   simulation   time 80   to   190   s
Start   data   sampling 40   s
Time   step 0.001 to 0.005
courant   number 0.5   to   0.85  
Residual   Criteria 1 × 10 07
Disclaimer/Publisher’s Note: The statements, opinions and data contained in all publications are solely those of the individual author(s) and contributor(s) and not of MDPI and/or the editor(s). MDPI and/or the editor(s) disclaim responsibility for any injury to people or property resulting from any ideas, methods, instructions or products referred to in the content.

