Erosion Mechanism of a Cavitating Jet on Groove Roughness


1
Faculty of Engineering, Niigata University, 8050, Ikarahi-2, Nishi, Niigata 950-2181, Japan
2
Faculty of Engineering, Shinshu University, 4-17-1 Wakasato, Nagano 380-8553, Japan
3
Graduate School of Science and Technology, Niigata University, 8050, Ikarashi-2, Nishi, Niigata 950-2181, Japan
*
Author to whom correspondence should be addressed.
Fluids 2021, 6(1), 6; https://doi.org/10.3390/fluids6010006
Submission received: 30 November 2020
/
Revised: 20 December 2020
/
Accepted: 21 December 2020
/
Published: 26 December 2020
(This article belongs to the Special Issue Cavitating Flows)
Abstract
:The erosion behavior of a cavitating jet on groove roughness was investigated experimentally using mass-loss characteristics, scanning electron microscopy (SEM) observation, time-resolved shadowgraph, and schlieren flow visualizations. The wall morphology of the cavitating-jet erosion on the groove roughness indicated an increased mass loss, which was highly increased along the groove rather than across the groove. Furthermore, increased erosion pits were observed on the groove bottom along the grooves. The shadowgraph imaging of the cavitating jet on the rough wall showed noncircular cavitation bubble distributions along and across the grooves, which corresponds to the increased number of cavitation bubbles along the grooves and the decreased number of bubbles across the grooves. This result is consistent with the erosion morphology of the groove roughness. Schlieren imaging indicated that the frequency and intensity fluctuation of the shockwave formation did not change significantly on the groove roughness along and across the grooves. The findings in the study show that the increased erosion mechanism on groove roughness is caused by the increased number of impulsive forces and the shockwave focusing effect on the groove bottom.
1. Introduction
Cavitating jets are applied to the fabrication, cutting, and peening of metal materials in industrial processing, owing to the highly erosive nature of the bubble behavior near the wall generated in a cavitating jet. For this reason, the erosion characteristics of wall materials in cavitating jet has been a topic of interest for years. The cavitation erosion is caused by the periodic formation of a cavitation cloud consisting of bubbles along the shear layer, which develops from the exit of the cavitation nozzle. When the cavitation bubbles approach the target wall and collapse in the vicinity of the wall, impulsive forces are generated periodically at the instant of bubble collapse, resulting in the erosion of the wall materials. The fundamentals of cavitating jets and the erosive behavior have been studied in the literature [1,2,3,4,5,6].
The periodic formation of the cavitation cloud is a key topic to understanding the increased erosion behavior of the cavitating jet. Therefore, there are a number of experimental and numerical investigations on the cavitation cloud formation and erosion mechanism of cavitating jets [7,8,9,10,11,12,13,14,15,16,17,18]. These studies show that the cavitation cloud is caused by the re-entrant jet mechanism of the flow through the orifice in the cavitation nozzle [7,9,10,11,12]. When the cavitation cloud approaches the wall region driven by the jet flow, the cavitation bubbles collapse periodically in the local low-pressure region of the jet and generate periodic impulsive forces to damage the wall materials, which results in the formation of pits on the wall [18,19,20].
To understand the relationship between the cavitating-jet behavior and the erosion mechanism of the cavitating jet, high-speed observations of cavitating jets have been carried out in studies, using optical imaging such as shadowgraph [2,3,10,11,13,14,16] and schlieren [6,18], while the impulsive forces on the wall were detected by polyvinylidene difluoride (PVDF) sensors [9,10,13,19,20]. These experimental results indicate that the major cavitating-jet damage can result from the formation of periodic impulsive forces that are caused by the shockwave formations near the wall. The formation of pits on the wall in a cavitating jet is likely to be caused by the shockwave formation at the instant of bubble collapse in the vicinity of the wall and the micro-jet [6,21,22,23,24,25,26,27]. However, past studies are limited to cavitation erosion on a smooth wall.
There are very few studies on the cavitation erosion that occurs on rough walls in comparison with that on smooth walls. This may be due to the complexity of the erosion mechanism on a rough wall. Nevertheless, the cavitation erosion on rough walls is very important from the point of view of industrial applications because most of the industrial wall materials suffer from the influence of wall roughness. Subsequently, it is a known fact that the cavitation erosion is highly enhanced by wall roughness, which is observed experimentally by an ultrasonic vibrometer test [28,29,30,31]. The experimental results show that the roughness height smaller than 25 μm does not affect the cavitation erosion behavior, whereas the erosion is enhanced with an increase in the initial surface roughness [28]. However, this result seems to be highly dependent on the experimental conditions under the influence of an ultrasonic vibrometer [29]. Recent experimental results that were obtained from an ultrasonic vibrometer support the growth of erosion rate with increasing surface roughness [30,31], while the variation of cavitation bubble size is observed on surface roughness smaller than 1 μm [32]. In this respect, the erosion mechanism of a rough wall in a cavitating jet is a new topic of interest. Furthermore, the erosion enhancement mechanism of a cavitating jet has not been investigated in previous studies because the mass-loss characteristics of the wall material do not explain the complex mechanism of cavitation erosion on rough walls.
In this study, the cavitating-jet erosion behavior on groove roughness is investigated experimentally using mass-loss measurements and scanning electron microscopy (SEM) observations. Furthermore, the mechanism of increased erosion of the cavitating jet on the groove roughness is investigated by using shadowgraph and schlieren flow visualizations in two orthogonal directions across and along the groove roughness.
2. Experimental Apparatus and Procedure
2.1. Experimental Setup
Figure 1a shows the experimental setup for a cavitating jet emerging from a cavitation nozzle into a still water environment in a cavitation test tank [6]. The cavitation nozzle consists of an orifice and a cavity that generates periodic oscillations of the shear layer along the cavitating jet [9,10]. The details of the cavitation nozzle geometry are described in Figure 1b, which shows an orifice of 0.8 mm in diameter and a cavity of 6.4 mm in diameter and height. The cavitating jet issues from a nozzle at the top of the test tank into the water in the tank, where the water surface is kept at 50 mm above the nozzle exit. The water surface was covered with a urethane plate to nullify the surface oscillations. The test tank had a hexagonal cross-sectional dimension (opposite side distance) of 400 mm with a height of 460 mm made of acrylic resin material filled with water. The working fluid water was kept at a constant temperature of 25 ± 0.5 °C using a heating unit with a temperature controller. The injection pressure of the nozzle was controlled by a valve connected to a plunger pump, and the flow rate was measured by estimating the bulk flow volume in a unit time with an accuracy of ±1.5%. The injection pressure can be varied in the range of 4 to 12 MPa; however, the present experiments were conducted at a fixed nozzle pressure of 12 MPa. The mean velocity through the orifice in the cavitation nozzle was 101 m/s from the bulk flow rate, and the cavitation coefficient was σ = (2(P − Pv)/ρU2) = 0.0083 (P = local pressure at nozzle, Pv = vapor pressure, U = mean velocity through the orifice, ρ = density of water) [33]. The cavitating jet impinges normal to the test specimen located inside the test tank at 30 mm, where the maximum erosion occurred when the cavitating jet was at a nozzle pressure of 12 MPa [16].
The test specimen was made up of aluminum (Al 1070) and was machined to a diameter of 30 mm with a thickness of 8 mm for a smooth wall, whereas the grooved specimen was fabricated by the discharge processing machine, as shown in Figure 1c. The grooved specimen consists of semicircular grooves of depth d = 0.19 mm and pitch p = 0.76 mm, as illustrated in Figure 1c. These grooves were machined in the full width of the test specimen. The smooth specimen was surface-finished by emery paper (grit number #4000) after surface machining, which results in the maximum roughness height of 1.5 μm, while the grooved specimen has a maximum roughness height of 4.7 μm. It should be noted that these heights are much smaller than the critical roughness height of 25 μm obtained from the cavitation erosion test in the ultrasonic-vibrometer study [28]. The Vickers hardness of the test specimens was 29.1 on the smooth specimen and 33.8 on the grooved specimen.
The erosion characteristics of the test specimen were evaluated by measuring the mass-loss characteristics of the specimen after exposing it to the cavitating jet for up to 4 min. The erosion characteristics were measured using a high-precision scale with an accuracy of 0.01 mg. The morphology of the wall was evaluated by optical microscope observation with a digital camera (spatial resolution 2000 × 3000 pixels) and scanning electron microscope (SEM).
2.2. Shadowgraph and Schlieren Flow Visualizations
The shadowgraph and schlieren flow visualizations of the cavitating jet were carried out to understand the cavitation bubble behavior and the subsequent shockwave formation in a cavitating jet, respectively. The former technique allows us to observe the interface between the water and cavitation bubbles, while the latter technique can detect the shockwave formation in the cavitating jet owing to its high sensitivity to density variations. However, schlieren visualization does not allow for clear observation of the cavitating-jet interface owing to the out-of-focus effect because the focus is on the shockwave. It should be noted that the shockwave formation is closely related to the mechanism of cavitating-jet erosion, as reported in the literature [6].
The experimental setups for the shadowgraph and schlieren flow visualizations are shown in Figure 2a,b, respectively. The time-resolved observation of cavitation bubbles in a water environment was successfully carried out using shadowgraph imaging (Figure 2a). The in-line illumination was provided by a light-emitting diode (LED) light of 1 W, and the observation was conducted using a high-speed camera with a spatial resolution of 264 × 384 pixels with 8 bits operating at 100 kHz.
The schlieren imaging in Figure 2b enables the detection of minor density differences in the shockwave formation of the cavitating jet, which is not visible in the shadowgraph images. The experimental arrangement consisted of a CW Nd:YAG laser (5 W), beam expander, concave mirror, and complementary metal–oxide–semiconductor (CMOS) camera with a concave lens of focal length f = 10 mm. It should be noted that the diameter of the concave mirror was 150 mm with a focal length f = 1200 mm. The shockwave images in the cavitating jet were captured by the same high-speed camera with a spatial resolution of 264 × 384 pixels with 8 bits operating at 100 kHz, as used in the shadowgraph imaging. It should also be noted that the exposure time of the high-speed camera was set to 250 ns. The camera was located in-line with the laser beam through the concave mirror and slit-type darkfield illumination. The shadowgraph and schlieren images across and along the groove direction were taken by rotating the specimen at right angles. The details of the shadowgraph and schlieren visualization methods are described in Refs. [6,34].
3. Results and Discussion
3.1. Erosion Behavior on Rough Wall
Figure 3 shows the mass-loss characteristics of the test specimen with smooth and rough walls in the cavitating jet, where the standoff distance was set to 30 mm from the nozzle exit and the nozzle pressure was at 12 MPa. The experiment of mass-loss characteristics on a rough wall indicates that the erosion initiation starts with a large erosion rate immediately after the injection of the cavitating jet, whereas that of the smooth wall shows the presence of a certain incubation period of approximately 20 s followed by the linear growth of erosion with a smaller erosion rate. The scattering of the mass-loss measurement is shown by error bars obtained from two repeated experiments. The increased erosion rate owing to the influence of groove roughness is approximately 10 times higher than that of the smooth one. However, the mechanism of the increased erosion rate by the rough wall is not clear. This will be studied by the shadowgraph and schlieren flow visualizations in Section 3.3 and Section 3.4, respectively.
Figure 4a–c shows direct observations of cavitating-jet erosion on smooth and rough walls at a standoff distance of 30 mm and at a nozzle pressure of 12 MPa, which were taken by a digital camera with a target area of observation of 18.5 × 18.5 mm2. The observations were made after a cavitating-jet injection for 240 s on the smooth wall (Figure 4a), and on the rough walls after 30 s and 90 s of cavitating-jet injection (Figure 4b,c, respectively). The observation of the smooth wall shows that the erosion appears almost circular, approximately 12 mm in diameter, and the rest of the area that is in and out of the circle does not suffer from cavitating-jet erosion [17]. This result reflects the fact that the cavitation bubble collapse occurs at the distributed circular-erosion-area by the impingement of the cavitating jet. The cavitation erosion was considered to be caused by the formation of pits, which in turn was caused by the cavitation bubble collapse. The cavitation pits result from the shockwave formation arising from the cavitation bubble collapse near the wall [18].
On the other hand, the erosion pattern on the rough wall indicates a noncircular distribution of erosion, which elongates in the direction along the grooves (y-axis) and shrinks across the grooves (x-axis) in comparison with that on the smooth wall. This feature of erosion on the groove roughness can be caused by the different rates of cavitation bubbles developed along and across the grooves, owing to the influence of wall roughness, which will be discussed in the following sections. The increased erosion along the groove roughness can be caused by the increased number of cavitation bubbles along the grooves, which was observed on the top and bottom of the erosion pattern in Figure 4c. The decreased erosion across the grooves was observed on the left and right of the erosion pattern, wherein fewer cavitation bubbles were expected, as shown in Figure 4c. This can be reflected by the difference in the near-wall velocity fields of the cavitating jet on groove roughness.
Figure 5a–c shows the depth distributions of the erosion pattern in Figure 4a–c, respectively, which were obtained from the depth measurements of the smooth wall and rough wall by laser displacement sensor traversing in the x-axis and y-axis. The uncertainty in depth measurement is ±15 μm. The results for the smooth wall (Figure 5a) and rough walls (Figure 5b,c) were taken at 240 s, 30 s, and 90 s, respectively. The depth distributions on the smooth wall (Figure 5a) show the presence of small depth fluctuation around x, y = ±6 mm in the x and y axes of the erosion pattern. There is a minor decrease and increase in the wall height on both sides of the erosion area caused by the erosion and plastic deformation of the wall material, respectively. On the other hand, the erosion depth distributions on the groove roughness in Figure 5b,c show the different features of the erosion pattern in the x and y axes, which correspond to the distribution across and along the grooves. It was observed that the depth distribution across the grooves shows the maximum depth around x = ±5 mm. However, the maximum depth along the grooves was found around y = ±7 mm. These results indicate that the erosion pattern is shrunken across the grooves and elongated along the grooves. The high erosion peaks were observed along the grooves in Figure 5c, which resulted from the plastic deformation on the groove bottom. The wider depth distributions on the groove bottoms and sharper groove peaks reflect that the mass loss occurs on the groove bottom. Therefore, these results are almost consistent with the observations of the erosion pattern in Figure 4b,c. Hence, the cavitating-jet erosion on groove roughness is highly modified by the influence of the direction of groove roughness, which can be caused by the cavitation bubble distribution near the grooves.
3.2. SEM Observations of Erosion Behavior
Figure 6a,b shows the SEM observations of the smooth wall before and after erosion for t = 240 s of cavitating-jet injection, respectively. The SEM image of cavitating-jet erosion on a smooth wall shows the formation of small pits approximately 10–20 μm in diameter, which is consistent with the literature [18]. The SEM observation of the smooth wall (Figure 6b) shows pits together with dents of several hundreds of micrometers in diameter.
Figure 7a–e shows the SEM observations of cavitating-jet erosion on groove roughness before erosion (Figure 7a) and after erosion (erosion pattern 1) for t = 30 s (Figure 7b) and for t = 90 s (Figure 7c), and after erosion (erosion pattern 2) for t = 30 s (Figure 7d) and at t = 90 s (Figure 7e), which are marked by 1 and 2 in Figure 4b,c, respectively. The SEM images (Figure 7b,c) on the erosion pattern 1 show the uniform erosion on the groove bottom, and small pit formation of 10–20 μm occurs on the entire walls (t = 30 s, 90 s). The growth of the wall material over the groove top is clearly observed along the groove top, which was caused by the plastic deformation of the wall on the groove bottom. The observations on the rough wall images (Figure 7d,e) on the erosion pattern 2 show increased erosion pits of an order of hundreds of micrometers in diameter, and they are largely observed in the groove bottom. These results indicate that large erosion pits with diameters of several hundreds of micrometers corresponding to the increased erosion are generated on the groove bottom, as observed in the mass-loss measurement in Figure 3. The generation of large erosion pits on the groove bottom could be caused by the influence of the shockwave focusing effect, which was similarly observed on the groove bottom of the liquid droplet impingement erosion on a rough wall [35,36,37,38]. A detailed examination shows that the large pits were generated on the groove bottom, whereas small pits were observed on the entire wall surface, as observed on the smooth wall. It is expected that the large pits are caused by the increased cavitation erosion of dents on the smooth wall because they are of similar size. The SEM observation of the erosion pattern (e) at t = 90 s shows the growth of plastic deformation over the groove top, which is waving because of the influence of large pits. These results indicate that the cavitating-jet erosion on groove roughness grows with the increasing number of large pits on the groove bottom, while the erosion behavior is similar to that of the smooth wall.
3.3. Shadowgraph Imaging of Cavitating Jet
Figure 8a–c shows the shadowgraph images of the cavitating jet impinging on the smooth wall (Figure 8a) and rough wall (Figure 8b,c, respectively) for several times t after the start of cavitating-jet injection. The image size covers 30 × 30 mm2 of the flow field of the cavitating jet, and the upper and lower edges of the image correspond to the nozzle exit and wall, respectively. The rough wall images show the observations along the grooves (Figure 8b) and across the grooves (Figure 8c), which correspond to the flow field observations in the x–z and y–z planes, respectively, where z is a vertical coordinate perpendicular to the wall. These images show that the periodic behavior of the cavitating jet was observed along the shear layer of the jet followed by the impingement and spreading of the jet in the radial direction. The cavitating jet is well visible in the images, owing to the blocked illumination by the cavitation bubbles spreading over the shear layer of the jet [16]. These observations of the cavitating jet are almost independent of the groove roughness. With increasing time t, the shadowgraph images become dark because of the increased number of cavitation bubbles, which blocks the inline illumination. Therefore, the dark area starts around the test specimen in the initial periods and spreads to the region near the nozzle with increasing time. The detailed examination of shadowgraph images on smooth and rough walls in the x–z and y–z planes indicates that the growth rate of the number of cavitation bubbles is larger along the grooves than across the grooves. These results indicate that the erosion behavior owing to bubble collapse is more widely distributed along the grooves than across the grooves, which is consistent with the erosion behavior observed on the rough wall in Figure 4b,c. The growth rate of the number of cavitation bubbles on the smooth wall lies between those along and across the grooves.
To confirm the non-uniform image intensity distributions along and across the groove roughness, the average intensities of the shadowgraph images on smooth and rough walls were evaluated, and the results are shown in Figure 9, which are plotted against the time after the cavitating-jet injection. It is observed that the intensity of the shadowgraph images decreases with increasing elapsed time, independent of the wall roughness. However, the intensity distribution on the groove roughness (b) shows different decay rates in the x–z and y–z planes. These results indicate that a larger number of cavitation bubbles is generated in the direction along the grooves than across the grooves. A larger number of cavitation bubbles in the x–z plane was considered to possibly result in an increased cavitation erosion along the grooves of the rough wall, which agrees qualitatively with the erosion pattern on groove roughness in Figure 4b,c.
3.4. Schlieren Imaging of Cavitating Jet
Figure 10a–c shows the schlieren images of the cavitating jet on the smooth wall (Figure 10a) and rough walls (Figure 10b,c), respectively. The images (Figure 10b,c) show the flow observations of groove roughness in the x–z and y–z planes, respectively. These images show that the shockwave formation occurs near the wall independent of the groove roughness. Shockwaves were generated near the walls and resulted in semispherical intensity distributions over the walls. Shockwave formation near the wall can generate impulsive forces on the walls, independent of the roughness. However, the impulsive forces can be highly magnified on the groove bottom of the rough wall owing to the shockwave focusing effect. This may result in increased impulsive forces on the groove bottom [37,38]. As a result, pit formation was highly amplified in the groove bottom, which grew into large pits, as observed in the SEM images in Figure 7b–e. This can be the mechanism of the increased erosion rate of the cavitating jet on the groove bottom. These schlieren images show that the mean intensity of the images decreases with increasing time, and the rate of decrease is higher on the rough wall along the grooves than across the grooves, whereas, for smooth wall, the rate is located between those observed for rough walls. This is similar to the observations of shadowgraph images in Figure 8.
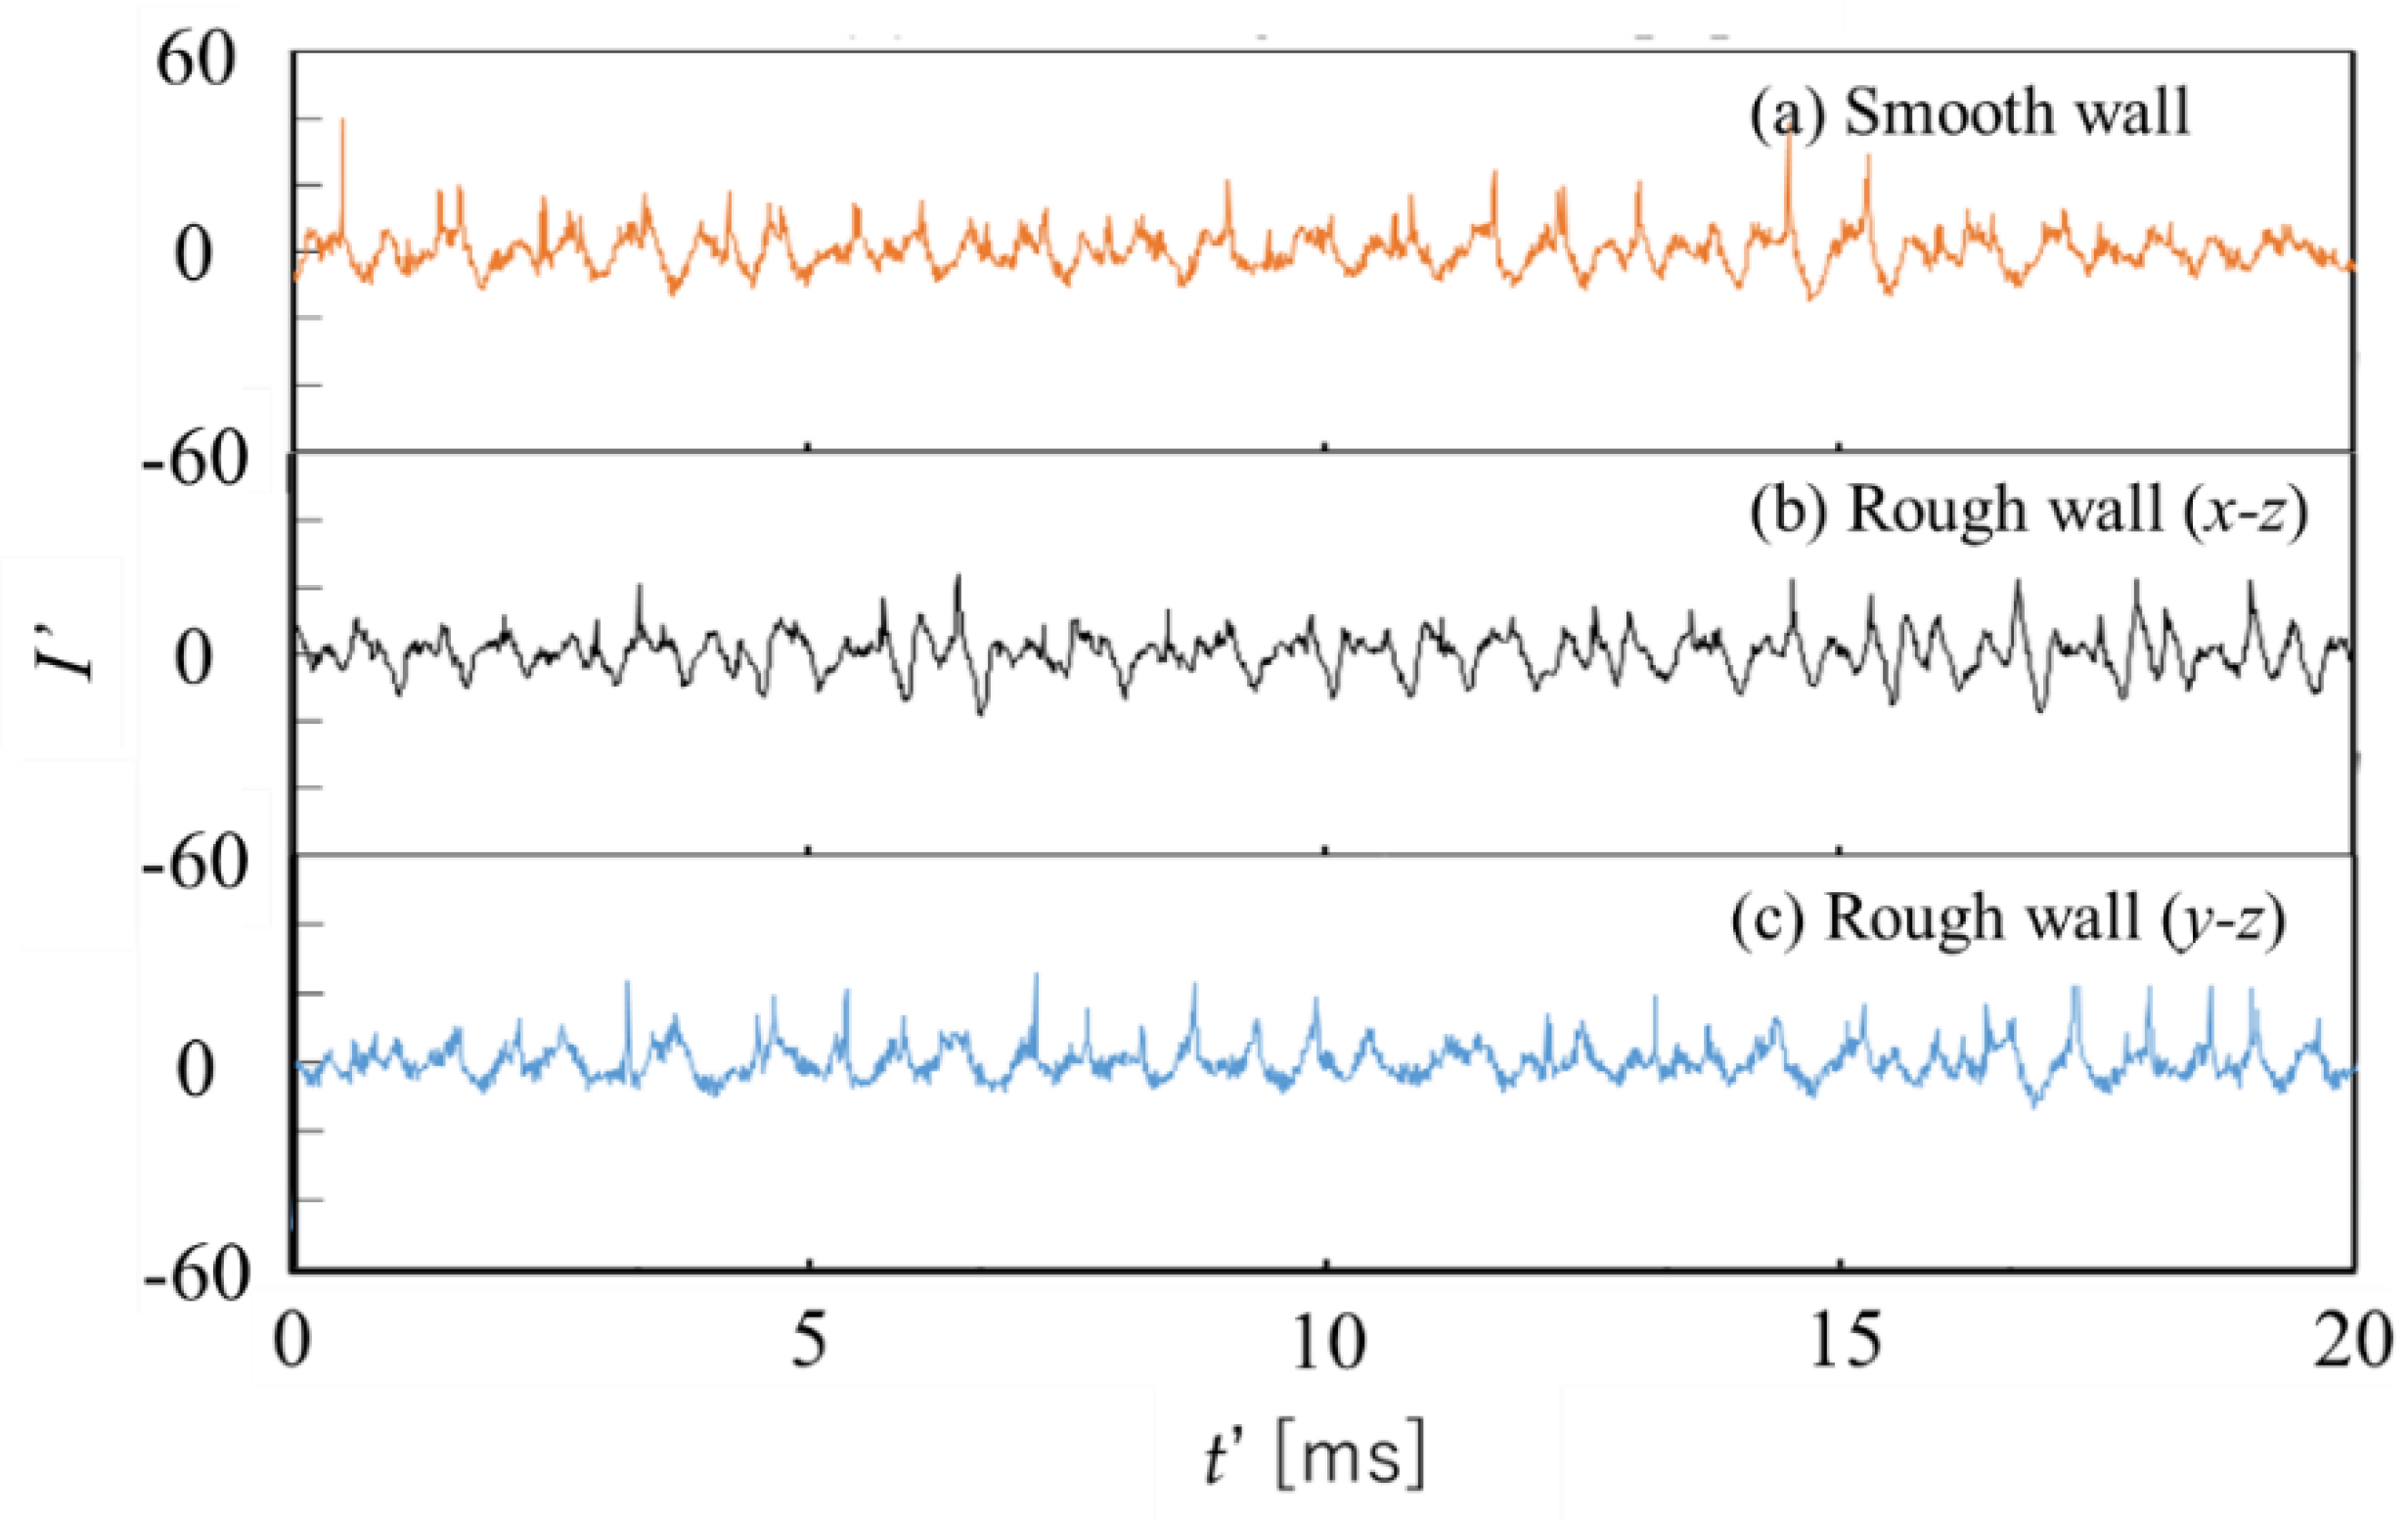
Figure 11a–c shows time-variations of schlieren image intensities on the smooth wall (Figure 11a) and rough walls (Figure 11b,c), respectively. It should be noted that I’ is the fluctuating intensity averaged over the image, and the results are shown for 20 ms starting from t = 0.1 s of schlieren images in Figure 10. These results indicate that the appearance of shockwave formation generates high-intensity spikes near the wall, and they occur almost periodically with an average period of 0.6 ms (1600 Hz), which is independent of the wall roughness. It was found that there is no clear difference in the average frequency of high-intensity spikes on the smooth and rough walls. Furthermore, the experimental results indicate that the fluctuating intensities of the shockwave formation do not change with the groove roughness. Thus, the increased erosion mechanism of the cavitating jet along the groove roughness was caused by the increased number of cavitation bubbles along the grooves, which is consistent with the shadowgraph observations of the cavitating jet. This may result in increased pits formation on the groove bottom arising from the shockwave focusing effect.
4. Conclusions
To understand the erosion mechanism of a cavitating jet on a rough wall, mass-loss characteristics, SEM observation, and shadowgraph and schlieren flow visualizations were conducted on smooth and rough walls.
The mass-loss characteristics and the observation of erosion morphology showed an enhancement by cavitating-jet erosion on the groove roughness. The SEM observation indicated that an increased erosion could be caused by the formation of pits and dents along the groove bottom.
The time-resolved shadowgraph images indicated the noncircular intensity distributions along and across the groove roughness, which were caused by the increased and decreased cavitation bubbles along the grooves and across the grooves, respectively. This resulted in an increased erosion pattern along the grooves and a decreased erosion across the grooves, which are consistent with the observed erosion behavior on the groove roughness.
The schlieren flow visualizations showed that the frequency and the intensities of shockwaves on the rough wall were almost independent of the observation directions––along and across the grooves. Therefore, the increased erosion behavior along the groove roughness can be caused by the increased number of impulsive forces owing to cavitation bubble collapses associated with a shockwave focusing effect on the groove bottom.
Author Contributions
Conceptualization, N.F.; investigation, R.S., M.O.; visualization, T.Y.; writing—original draft preparation, N.F.; writing—review and editing, N.F., T.Y.; project administration, N.F.; funding acquisition, N.F. All authors have read and agreed to the published version of the manuscript.
Funding
This research was funded by JSPS KAKENHI Grant Number JP18K04632 and Niigata University.
Acknowledgments
This work was partly supported by JSPS KAKENHI Grant Number JP18K04632 and financial support from Niigata University. The authors thank Kei Fujisawa from University of Florida, and Norikazu Sato from Graduate School of Science and Technology from Niigata University in the preliminary experiment of this research.
Conflicts of Interest
The authors declare that there is no conflict of interest that could be perceived as prejudicing the impartiality of the research reported.
Nomenclature
| D | depth |
| d | roughness height |
| f | focal length of lens |
| I | mean intensity of image |
| I’ | rms intensity of image |
| P | pressure |
| p | roughness pitch |
| Pv | vapor pressure |
| U | mean velocity |
| t | time after cavitating-jet injection |
| t’ | time |
| w | mass loss |
| x, y | coordinates (See Figure 4) |
| z | co-ordinate normal to wall |
| ρ | density of water |
| σ | cavitation coefficient (= 2(P − Pv)/ρU2) |
References
- Yamaguchi, A.; Shimizu, S. Erosion due to impingement of cavitating jet. J. Fluids Eng. 1987, 109, 442–447. [Google Scholar]
- Soyama, H.; Yanauchi, Y.; Sato, K.; Ikohagi, T.; Oba, R.; Oshima, R. High-speed observation of ultrahigh-speed submerged water jets. Exp. Therm. Fluid Sci. 1996, 12, 411–416. [Google Scholar]
- Sato, K.; Saito, Y. Unstable cavitation behavior in a circular-cylindrical orifice flow. JSME Int. J. Ser. B 2002, 45, 638–645. [Google Scholar]
- Franc, J.P.; Michel, J.M. Fundamentals of Cavitation; Kluwer Academic Publishers: Kluwer, The Netherlands, 2004. [Google Scholar]
- Hutli, E.A.F.; Nedeljkovic, M.S. Frequency in shedding/discharging cavitation cloud determined by visualization of a submerged cavitating jet. J. Fluids Eng. 2008, 130, 021304. [Google Scholar] [CrossRef]
- Fujisawa, N.; Fujita, Y.; Yanagisawa, K.; Fujisawa, K.; Yamagata, T. Simultaneous observation of cavitation collapse and shock wave formation in cavitating jet. Exp. Therm. Fluid Sci. 2018, 94, 159–167. [Google Scholar]
- Callenaere, M.; Franc, J.P.; Michel, J.-M.; Riondet, M. The cavitation instability induced by the development of a re-entrant jet. J. Fluid Mech. 2001, 444, 223–256. [Google Scholar]
- Dular, M.; Bachert, B.; Stoffel, B.; Sirok, B. Relationship between cavitation structures and cavitation damage. Wear 2004, 257, 1176–1184. [Google Scholar]
- Soyama, H. Enhancing the aggressive intensity of a cavitating jet by means of the nozzle outlet geometry. J. Fluids Eng. 2011, 133, 101301. [Google Scholar] [CrossRef]
- Sato, K.; Taguchi, Y.; Hayashi, S. High speed observation of periodic behavior in a convergent-divergent nozzle for cavitating water jet. J. Flow Contr. Meas. Vis. 2013, 1, 102–107. [Google Scholar]
- Hayashi, S.; Sato, K. Unsteady behavior of cavitating waterjet in an axisymmetric convergent-divergent nozzle; High speed observation and image analysis based on frame difference method. J. Flow Contr. Meas. Vis. 2014, 2, 94–104. [Google Scholar]
- Stanley, C.; Barber, T.; Rosengarten, G. Re-entrant jet mechanism for periodic cavitation shedding in a cylindrical orifice. Int. J. Heat Fluid Flow 2014, 50, 169–176. [Google Scholar]
- Dular, M.; Petkovsek, M. On the mechanisms of cavitation erosion–Coupling high speed videos to damage patterns. Exp. Therm. Fluid Sci. 2015, 68, 359–370. [Google Scholar]
- Watanabe, R.; Kikuchi, T.; Yamagata, T.; Fujisawa, N. Shadowgraph imaging of cavitating jet. J. Flow Contr. Meas. Vis. 2015, 3, 106–110. [Google Scholar]
- Peng, G.; Okada, K.; Yang, C.; Oguma, Y.; Shimizu, S. Numerical simulation of unsteady cavitation in a high-speed water jet. Int. J. Fluid Mach. Syst. 2016, 9, 66–74. [Google Scholar]
- Watanabe, R.; Yanagisawa, K.; Yamagata, T.; Fujisawa, N. Simultaneous shadowgraph imaging and acceleration pulse measurement of cavitating jet. Wear 2016, 358–359, 72–79. [Google Scholar]
- Fujisawa, N.; Kikuchi, T.; Fujisawa, K.; Yamagata, T. Time-resolved observations of pit formation and cloud behavior in cavitating jet. Wear 2017, 386–387, 99–105. [Google Scholar]
- Fujisawa, N.; Horiuchi, T.; Fujisawa, K.; Yamagata, T. Experimental observation of the erosion pattern, pits, and shockwave formation in a cavitating jet. Wear 2019, 418–419, 265–272. [Google Scholar]
- Wang, Y.-C.; Chen, Y.-W. Application of piezoelectric PVDF film to the measurement of impulsive forces generated by cavitation bubble collapse near a solid boundary. Exp. Therm. Fluid Sci. 2007, 32, 403–414. [Google Scholar]
- Franc, J.-P.; Riondet, M.; Karimi, A.; Chahine, G.L. Impact load measurements in an erosive cavitating flow. J. Fluids Eng. 2011, 133, 121301. [Google Scholar] [CrossRef]
- Plesset, M.S.; Chapman, R.B. Collapse of an initially spherical vapor cavity in the neighborhood of a solid boundary. J. Fluid Mech. 1971, 47, 283–290. [Google Scholar]
- Lauterborn, W.; Bolle, H. Experimental investigations of cavitation bubble collapse in the neighborhood of a solid boundary. J. Fluid Mech. 1975, 72, 391–399. [Google Scholar] [CrossRef]
- Fujikawa, S.; Akamatsu, T. Experimental investigations of cavitation bubble collapse by a water shock tube. Bull. JSME 1978, 21, 223–230. [Google Scholar] [CrossRef]
- Shima, A.; Takayama, K.; Tomita, Y.; Miura, N. An experimental study on effects of a solid wall on the motion of bubbles and shock waves in bubble collapse. Acta Acust. United Acust. 1981, 48, 293–301. [Google Scholar]
- Vogel, A.; Lauterborn, W.; Timm, R. Optical and acoustic investigations of the dynamics of laser-produced cavitation bubbles near a solid boundary. J. Fluid Mech. 1989, 206, 299–338. [Google Scholar] [CrossRef]
- Lindau, O.; Lauterborn, W. Cinematographic observation of the collapse and rebound of a laser- produced cavitation bubble near a wall. J. Fluid Mech. 2003, 479, 327–348. [Google Scholar] [CrossRef]
- Wang, Y.-C.; Huang, C.-H.; Lee, Y.-C.; Tsai, H.-H. Development of a PVDF sensor array for measurement of the impulsive pressure generated by cavitation bubble collapse. Exp. Fluids 2006, 41, 365–373. [Google Scholar] [CrossRef]
- Numachi, F.; Oba, R.; Chida, I. Effect of surface roughness on cavitation performance of hydrofoils, Rep.1. J. Basic Eng. 1965, 87, 495–502. [Google Scholar] [CrossRef]
- Ahmed, S.M.; Hokkirigawa, K.; Oba, R.; Kikuchi, K. SEM observation of the vibratory cavitation; Fracture mode during the incubation period and the small roughness effect. JSME Int. J. 1991, 34, 298–303. [Google Scholar] [CrossRef] [Green Version]
- Chiu, K.Y.; Cheng, F.T.; Man, H.C. Evolution of surface roughness of some metallic materials in cavitation erosion. Ultrasonics 2005, 43, 713–716. [Google Scholar] [CrossRef]
- Lin, J.; Wang, Z.; Cheng, J.; Kang, M.; Fu, X.; Hong, S. Effect of initial surface roughness on cavitation erosion resistance of arc-sprayed Fe-based amorphous/nanocrystalline coatings. Coatings 2017, 7, 200. [Google Scholar] [CrossRef] [Green Version]
- Altay, R.; Sadaghiani, A.K.; Sevgen, M.I.; Sisman, A.; Kosar, A. Numerical and experimental studies on the effect of surface roughness and ultrasonic frequency on bubble dynamics in acoustic cavitation. Energies 2020, 13, 1126. [Google Scholar] [CrossRef] [Green Version]
- Soyama, H. Effect of nozzle geometry on a standard cavitation erosion test using a cavitating jet. Wear 2013, 297, 895–902. [Google Scholar] [CrossRef]
- Settles, G.S. Schlieren and Shadowgraph Techniques, Visualizing Phenomena in Transparent Media; Springer Science & Business Media: Berlin/Heidelberg, Germany, 2012; pp. 111–122. [Google Scholar]
- Fujisawa, K.; Yamagata, T.; Fujisawa, N. Liquid droplet impingement erosion on groove roughness. Nucl. Eng. Des. 2018, 330, 368–376. [Google Scholar] [CrossRef]
- Fujisawa, K.; Ohki, M.; Fujisawa, N. Influence of surface roughness on liquid droplet impingement erosion. Wear 2019, 432–433, 202955. [Google Scholar] [CrossRef]
- Fujisawa, N.; Komatsu, M.; Yamagata, T. Experimental study on erosion initiation via liquid droplet impingement on smooth and rough walls. Wear 2020, 452–453, 203316. [Google Scholar] [CrossRef]
- Fujisawa, N. Liquid droplet impingement erosion on multiple grooves. Wear 2020, 462–463, 203513. [Google Scholar] [CrossRef]
Figure 1.
Experimental setup for cavitating jet (Unit in mm). (a) Experimental setup; (b) Cavitation nozzle; (c) Groove roughness.
Figure 1.
Experimental setup for cavitating jet (Unit in mm). (a) Experimental setup; (b) Cavitation nozzle; (c) Groove roughness.
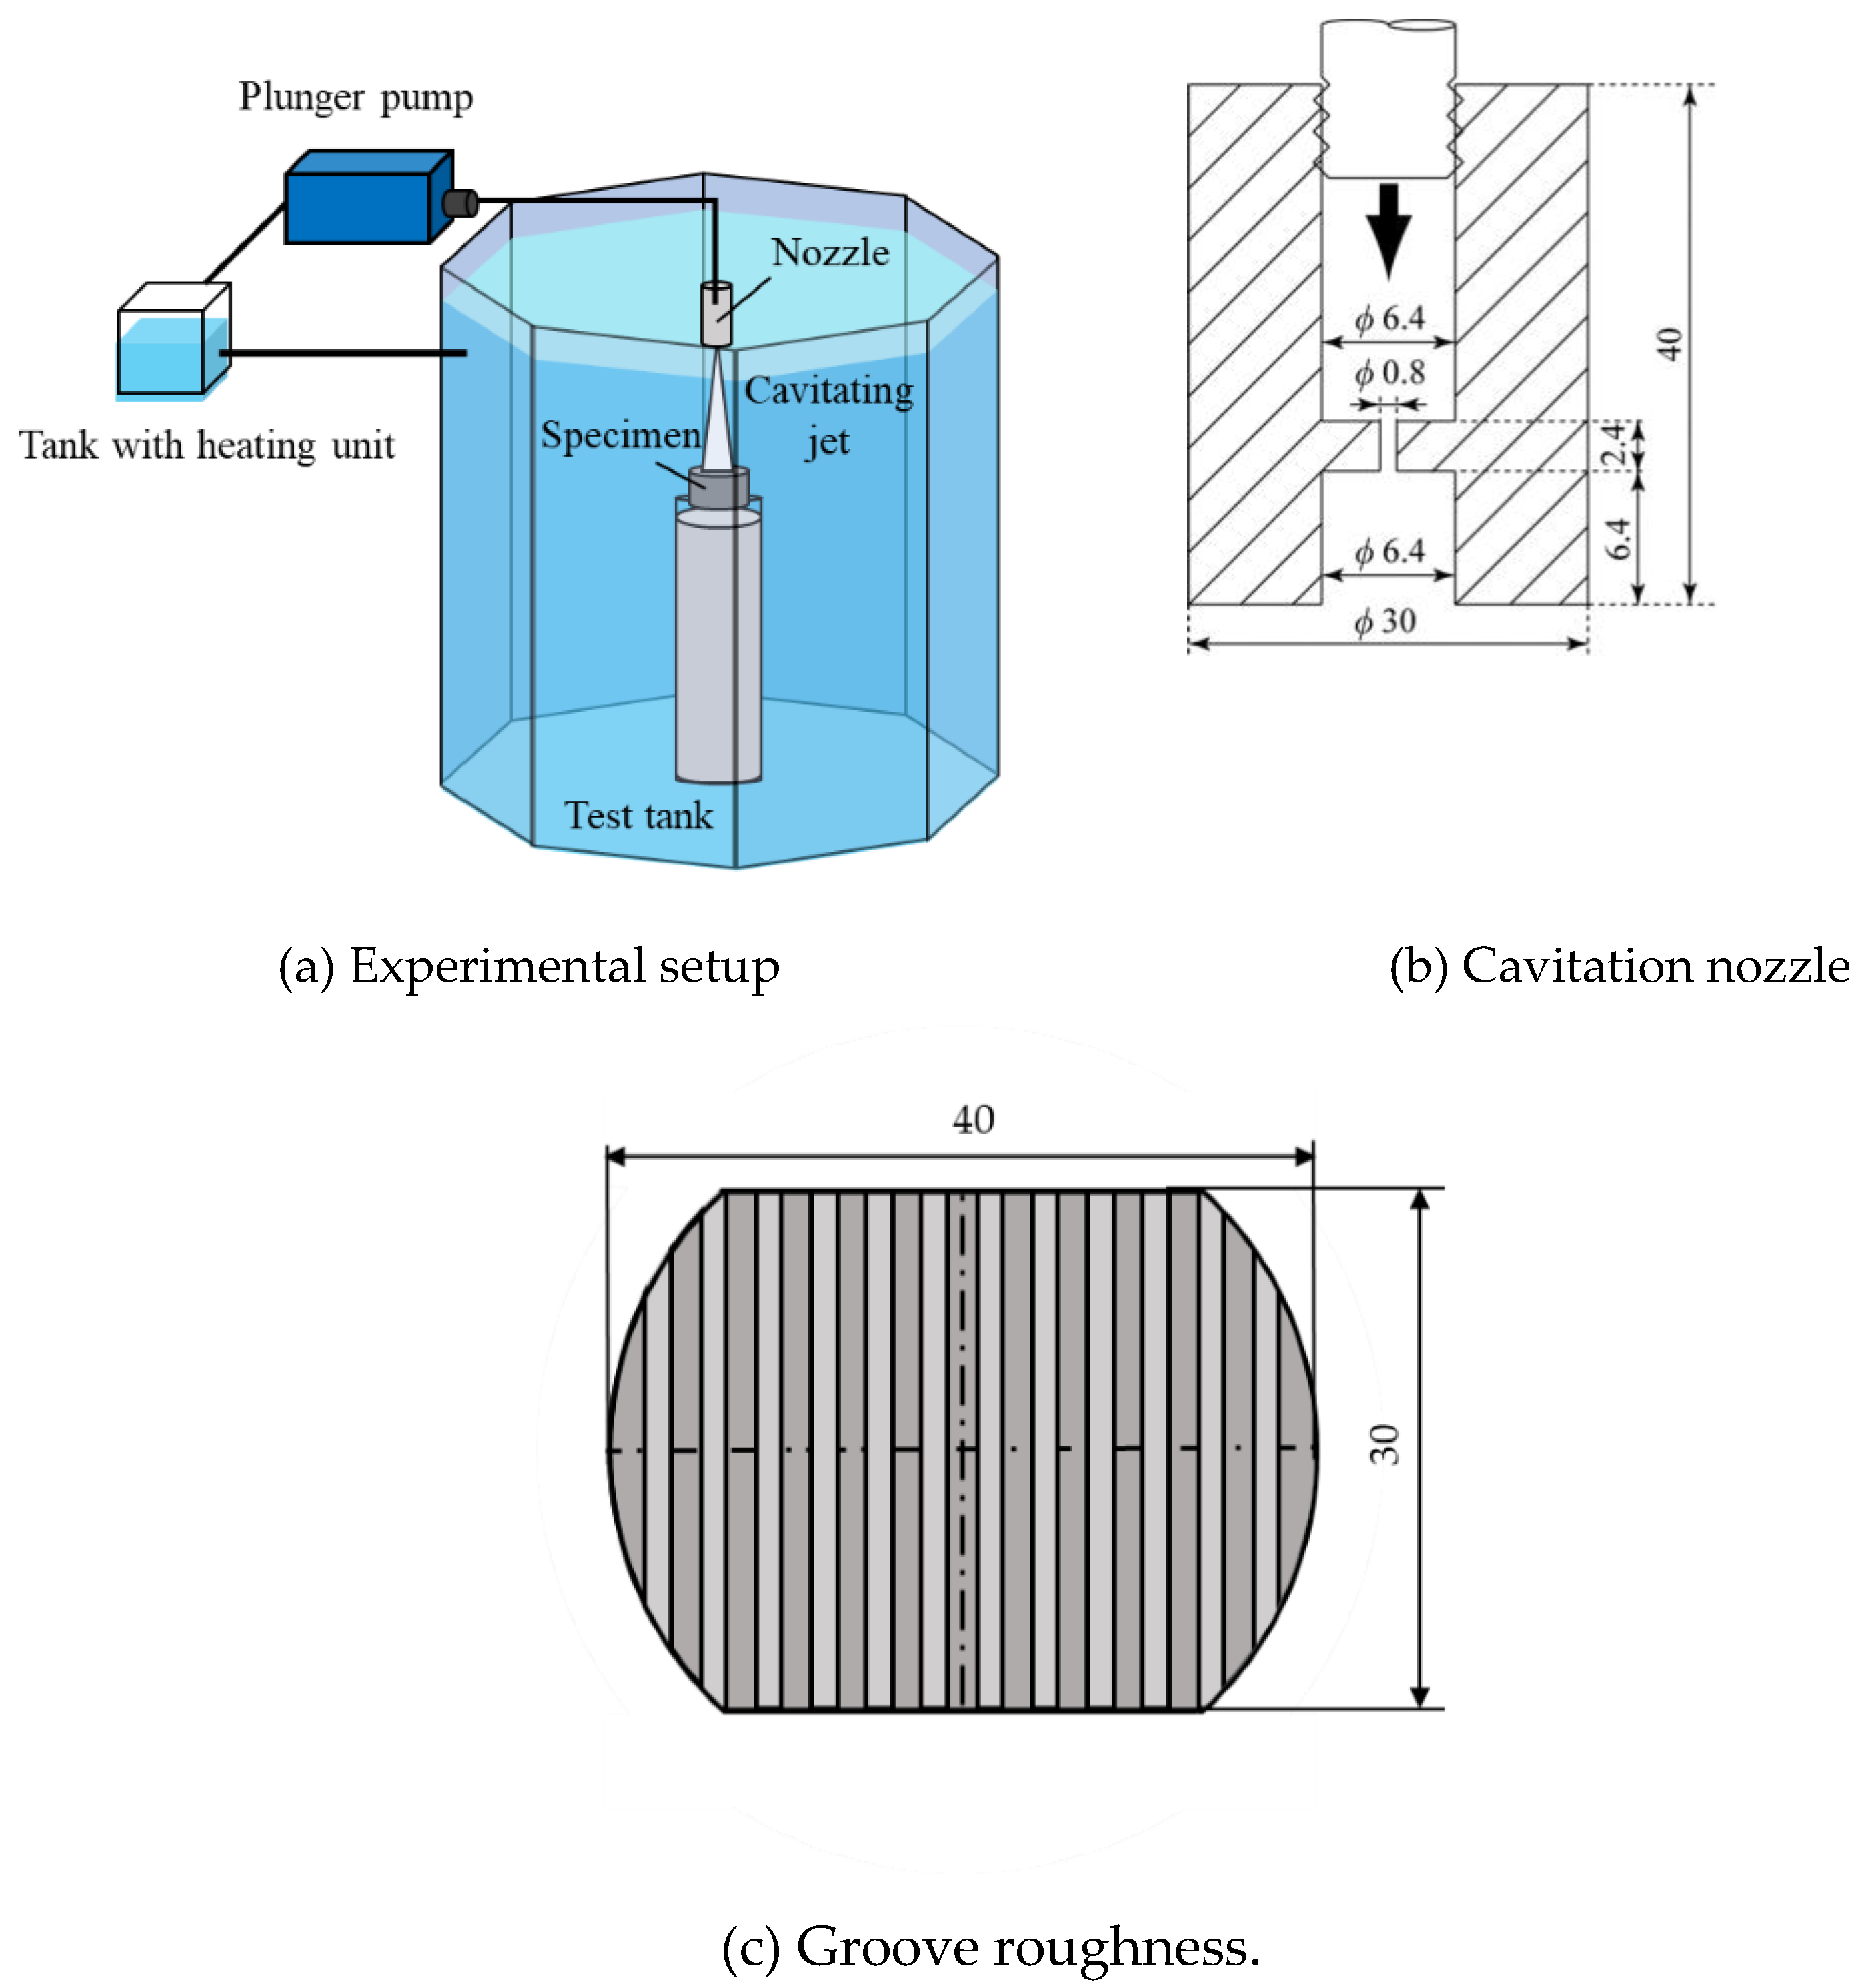
Figure 2.
Experimental arrangement of flow visualization. (a) Shadowgraph; (b) Laser schlieren.
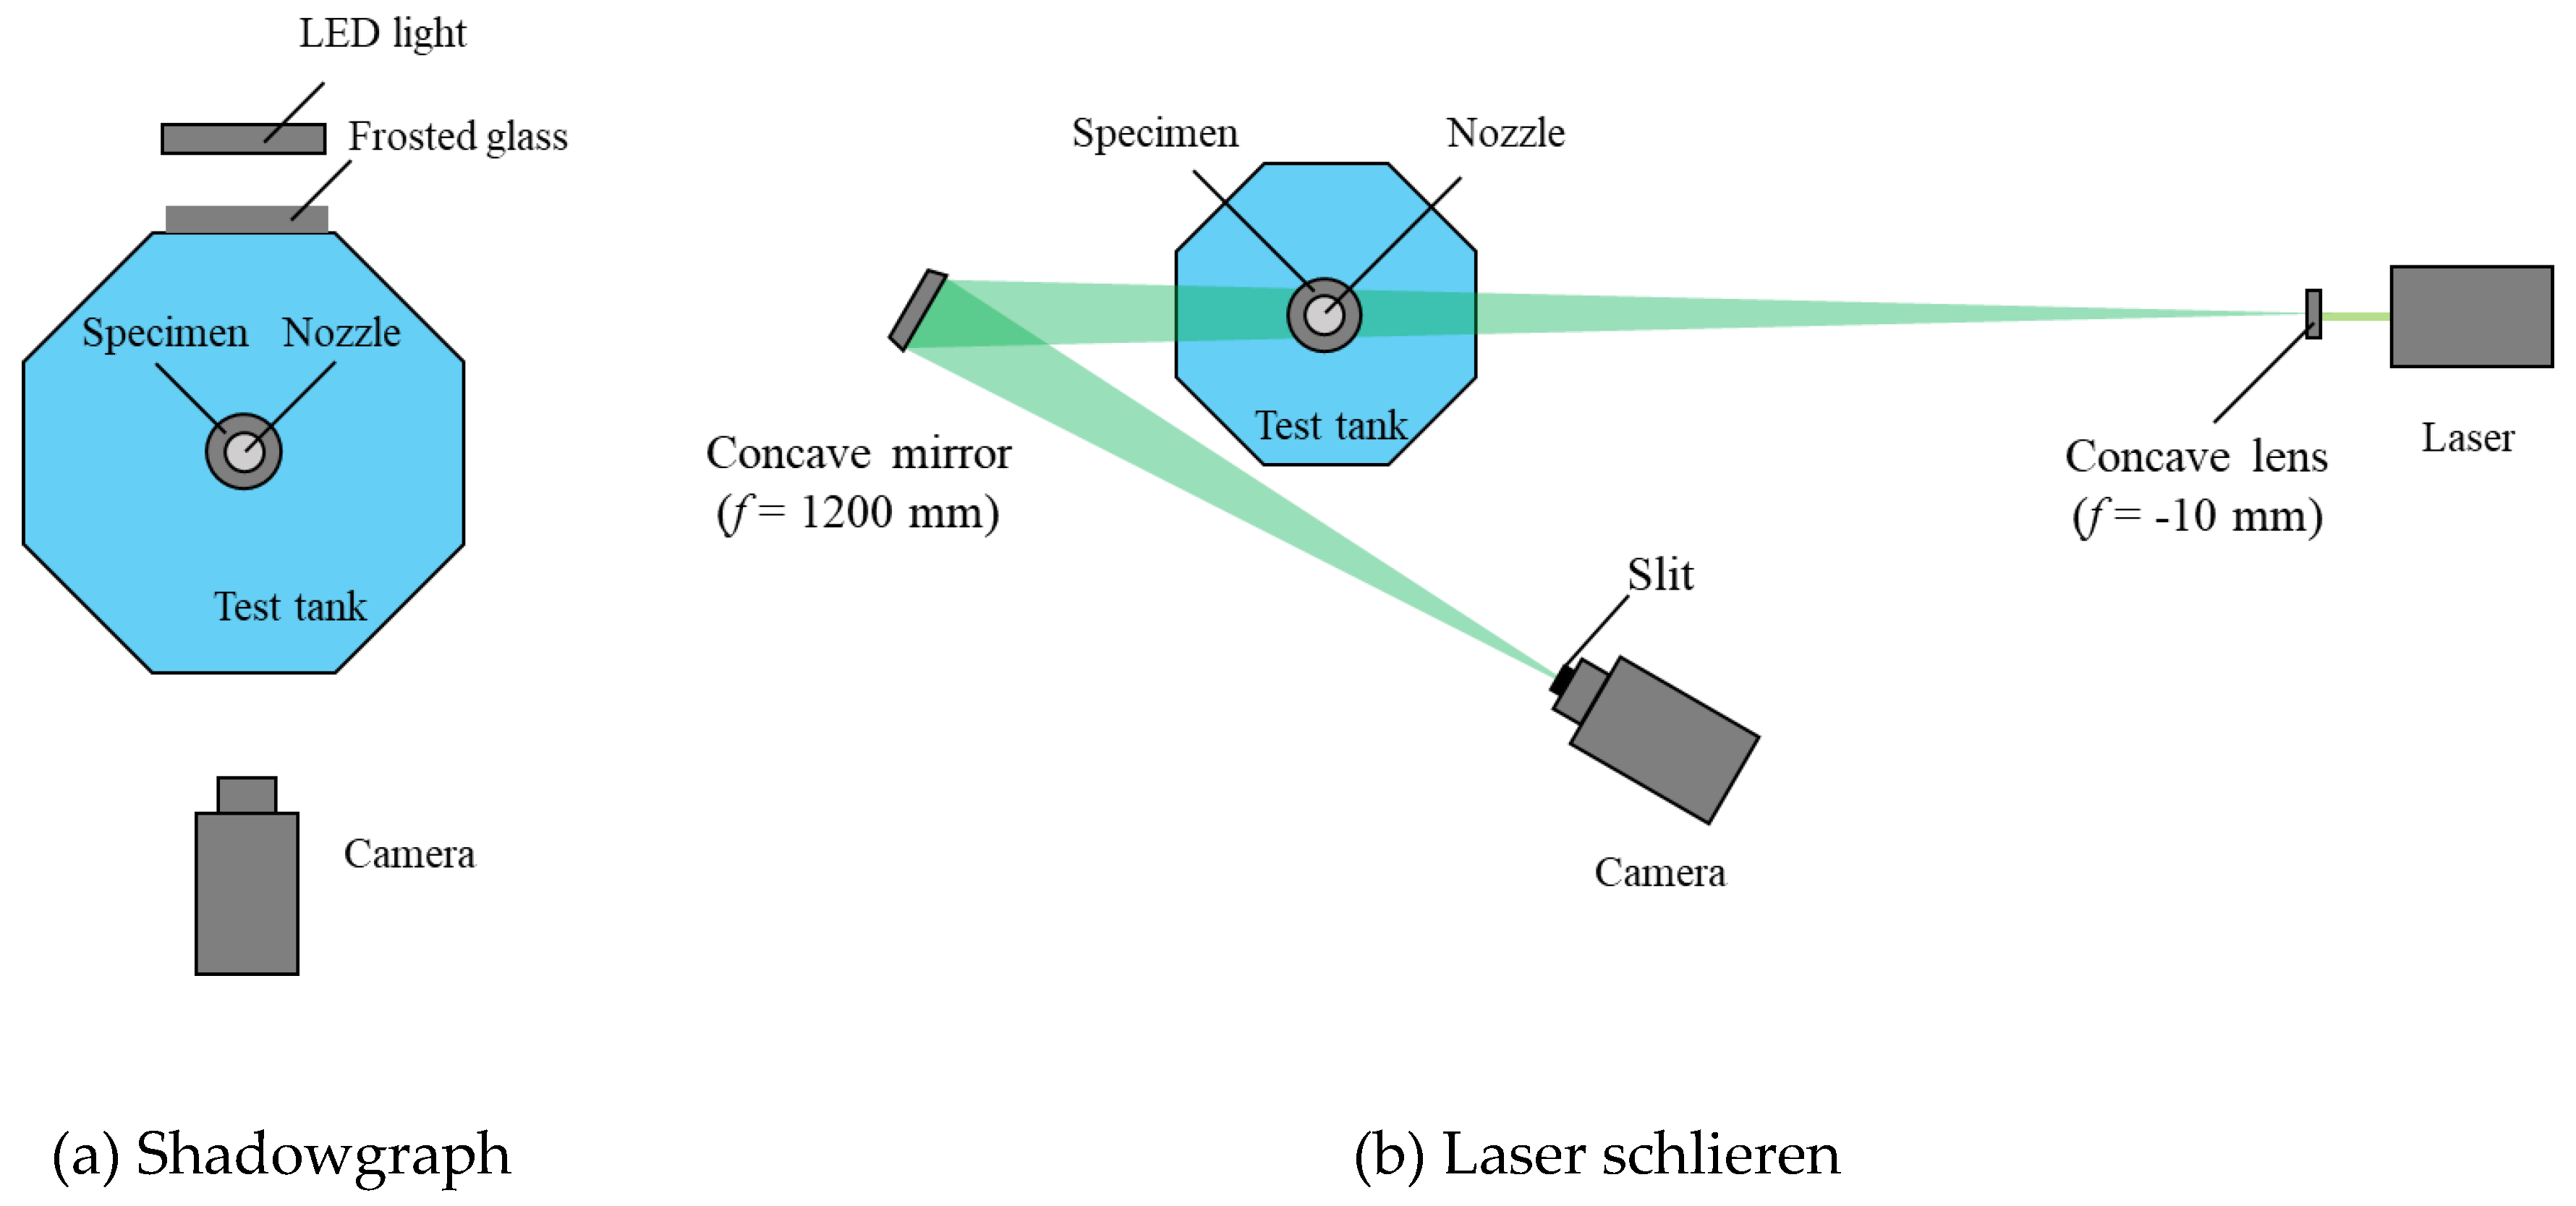
Figure 3.
Time variations of mass-loss measurement.
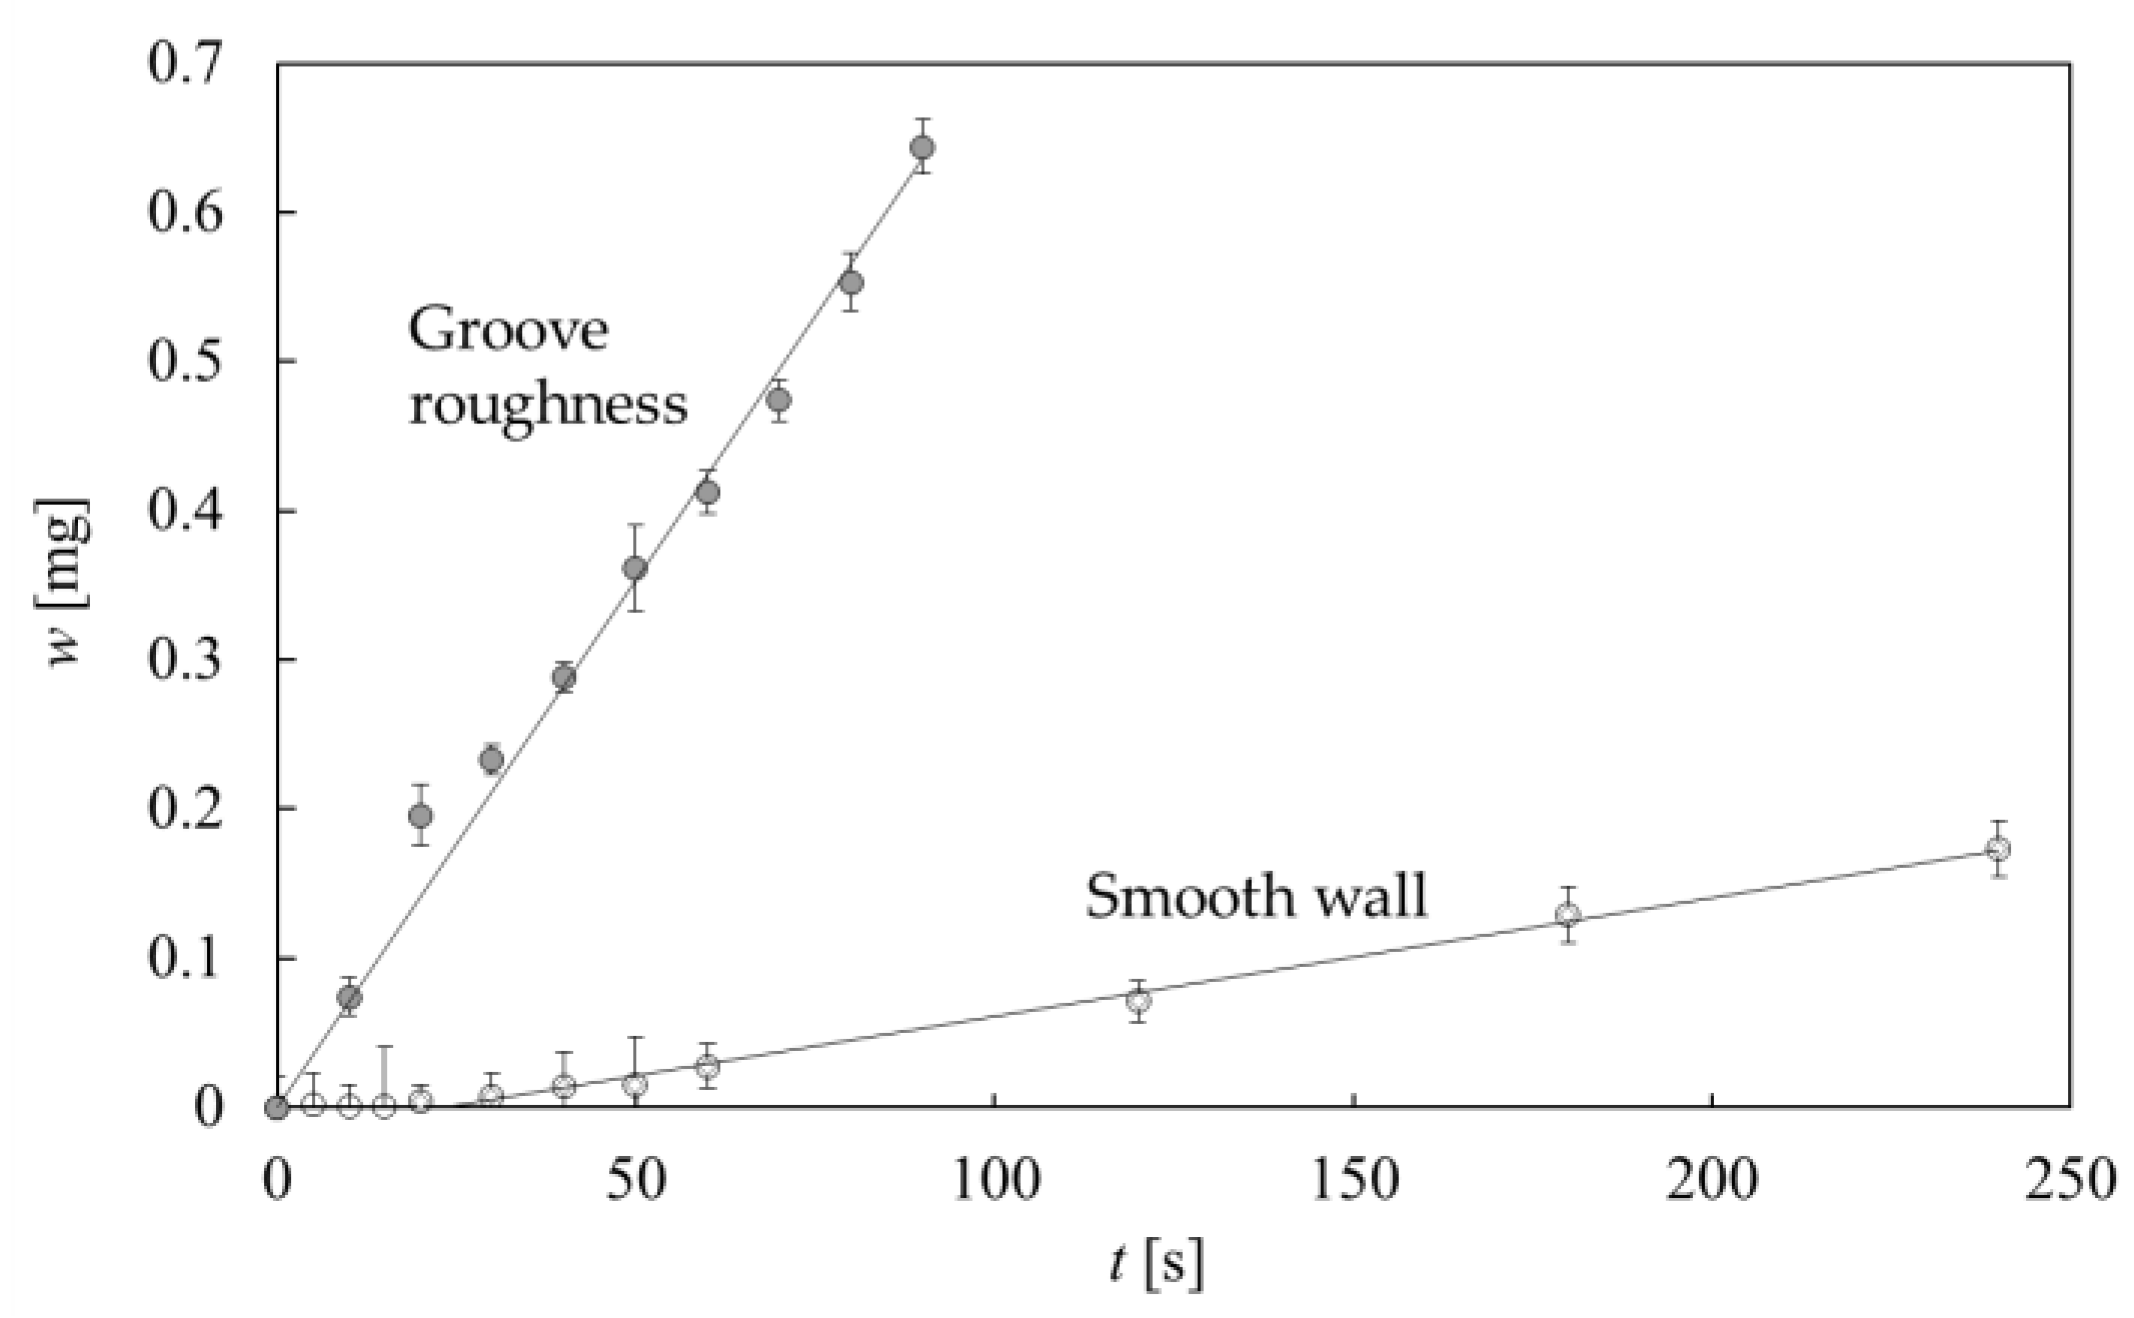
Figure 4.
Digital camera images of erosion pattern (tick marks for every 2 mm). (a) Smooth wall (t = 240 s); (b) Rough wall (t = 30 s); (c) Rough wall (t = 90 s).
Figure 4.
Digital camera images of erosion pattern (tick marks for every 2 mm). (a) Smooth wall (t = 240 s); (b) Rough wall (t = 30 s); (c) Rough wall (t = 90 s).

Figure 5.
Depth distributions of erosion pattern. (a) Smooth wall (t = 240 s); (b) Rough wall (t = 30 s); (c) Rough wall (t = 90 s).
Figure 5.
Depth distributions of erosion pattern. (a) Smooth wall (t = 240 s); (b) Rough wall (t = 30 s); (c) Rough wall (t = 90 s).

Figure 6.
Scanning electron microscopy (SEM) observations of cavitation erosion on smooth wall. (a) Smooth wall (t = 0 s); (b) Smooth wall (t = 240 s).
Figure 6.
Scanning electron microscopy (SEM) observations of cavitation erosion on smooth wall. (a) Smooth wall (t = 0 s); (b) Smooth wall (t = 240 s).
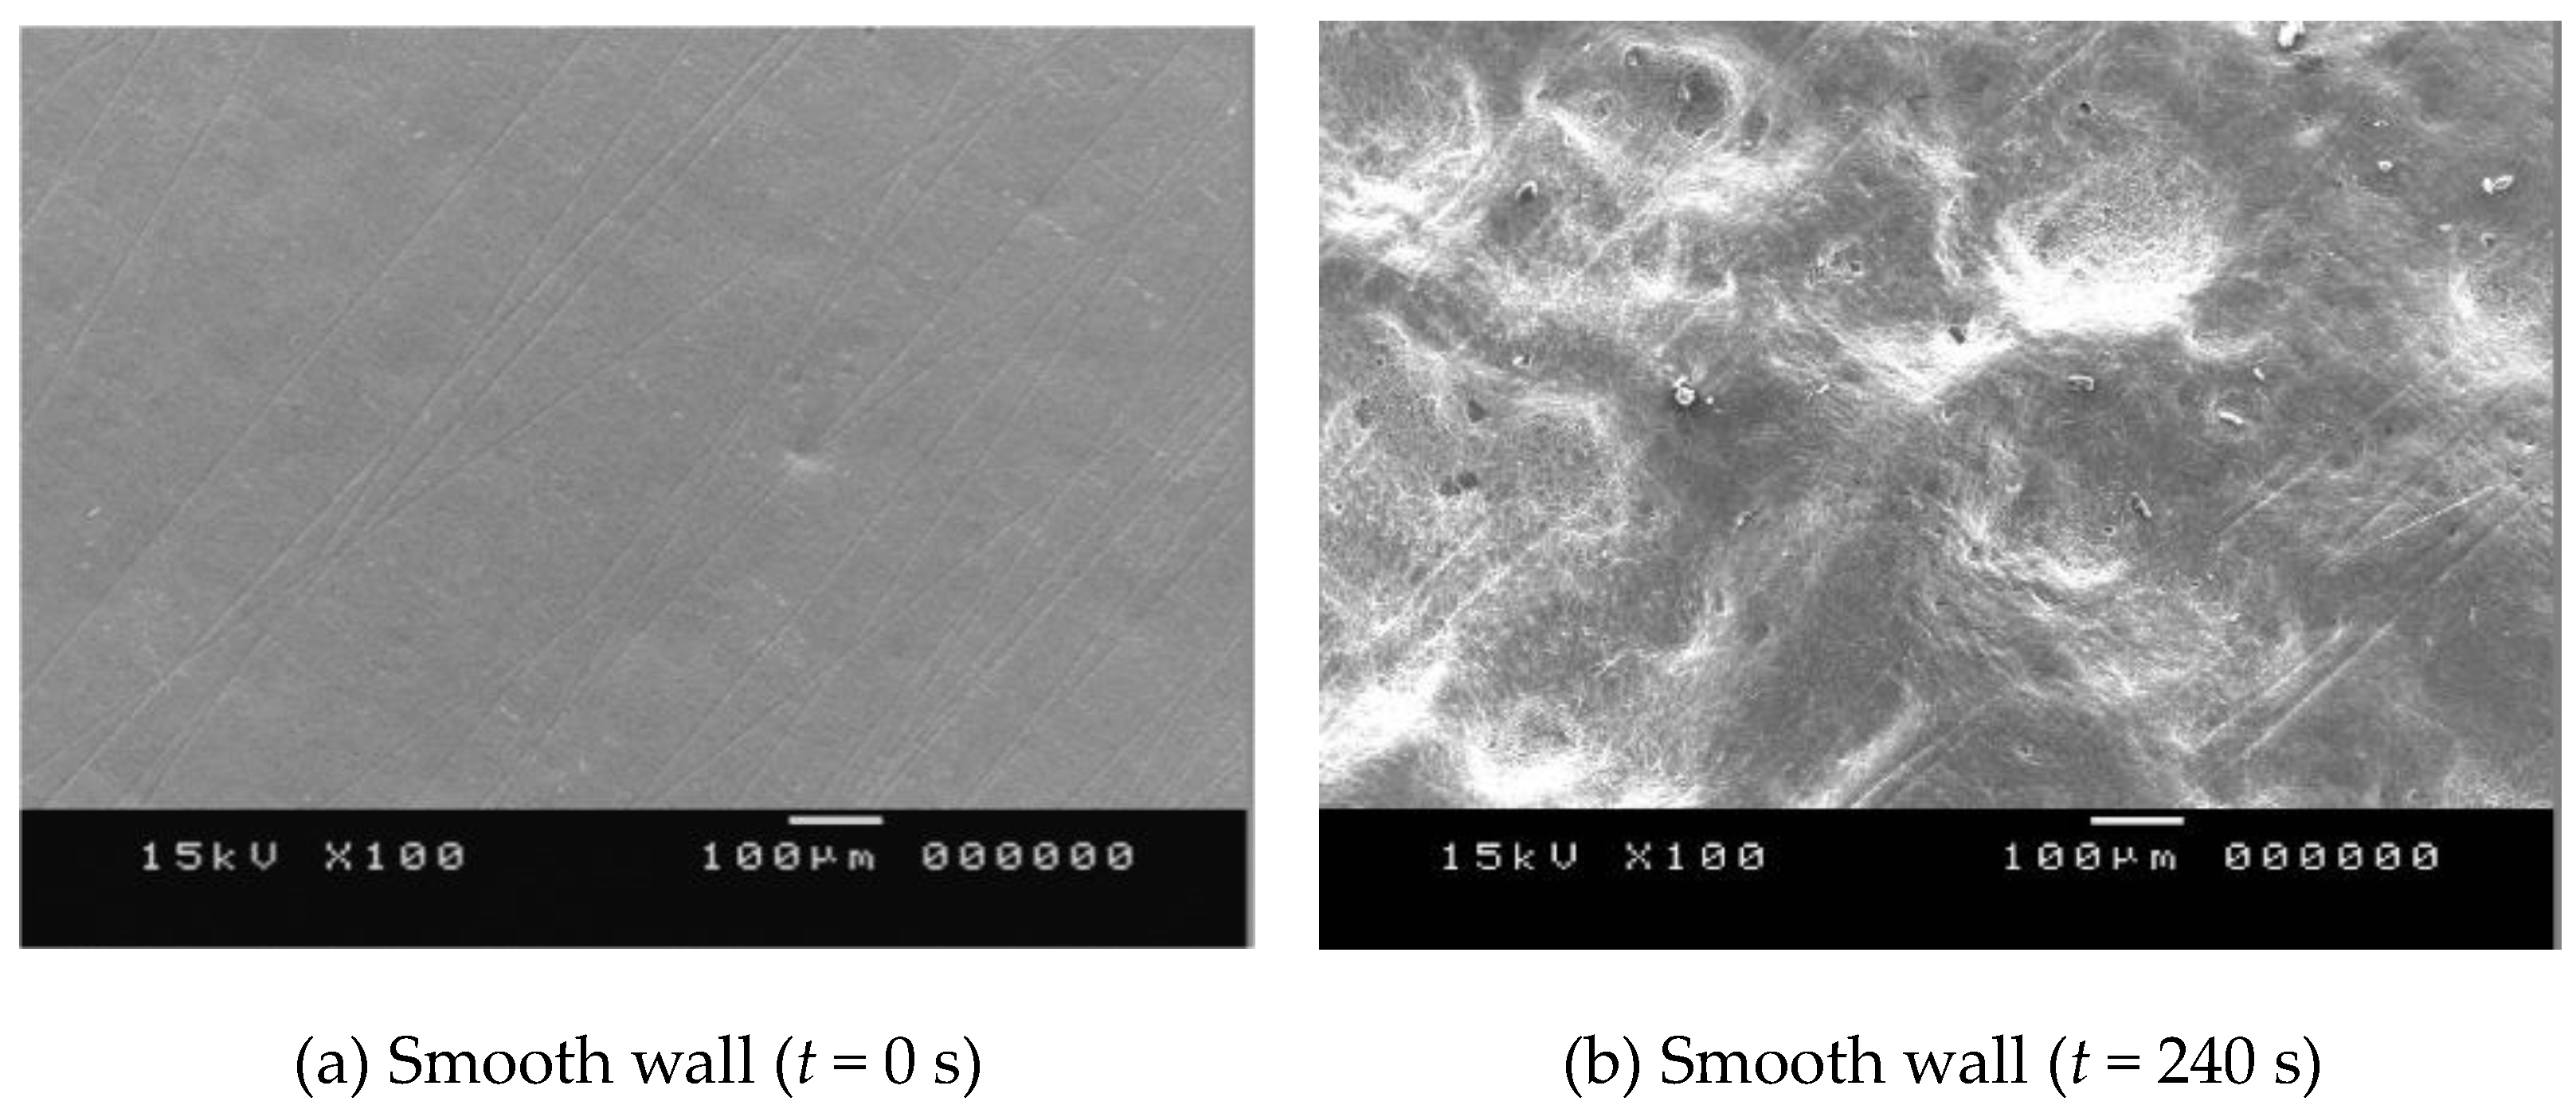
Figure 7.
SEM observations of cavitation erosion on groove roughness. (a) Groove roughness (t = 0 s); (b) Erosion pattern 1 (t = 30 s); (c) Erosion pattern 1 (t = 90 s); (d) Erosion pattern 2 (t = 30 s); (e) Erosion pattern 2 (t = 90 s).
Figure 7.
SEM observations of cavitation erosion on groove roughness. (a) Groove roughness (t = 0 s); (b) Erosion pattern 1 (t = 30 s); (c) Erosion pattern 1 (t = 90 s); (d) Erosion pattern 2 (t = 30 s); (e) Erosion pattern 2 (t = 90 s).
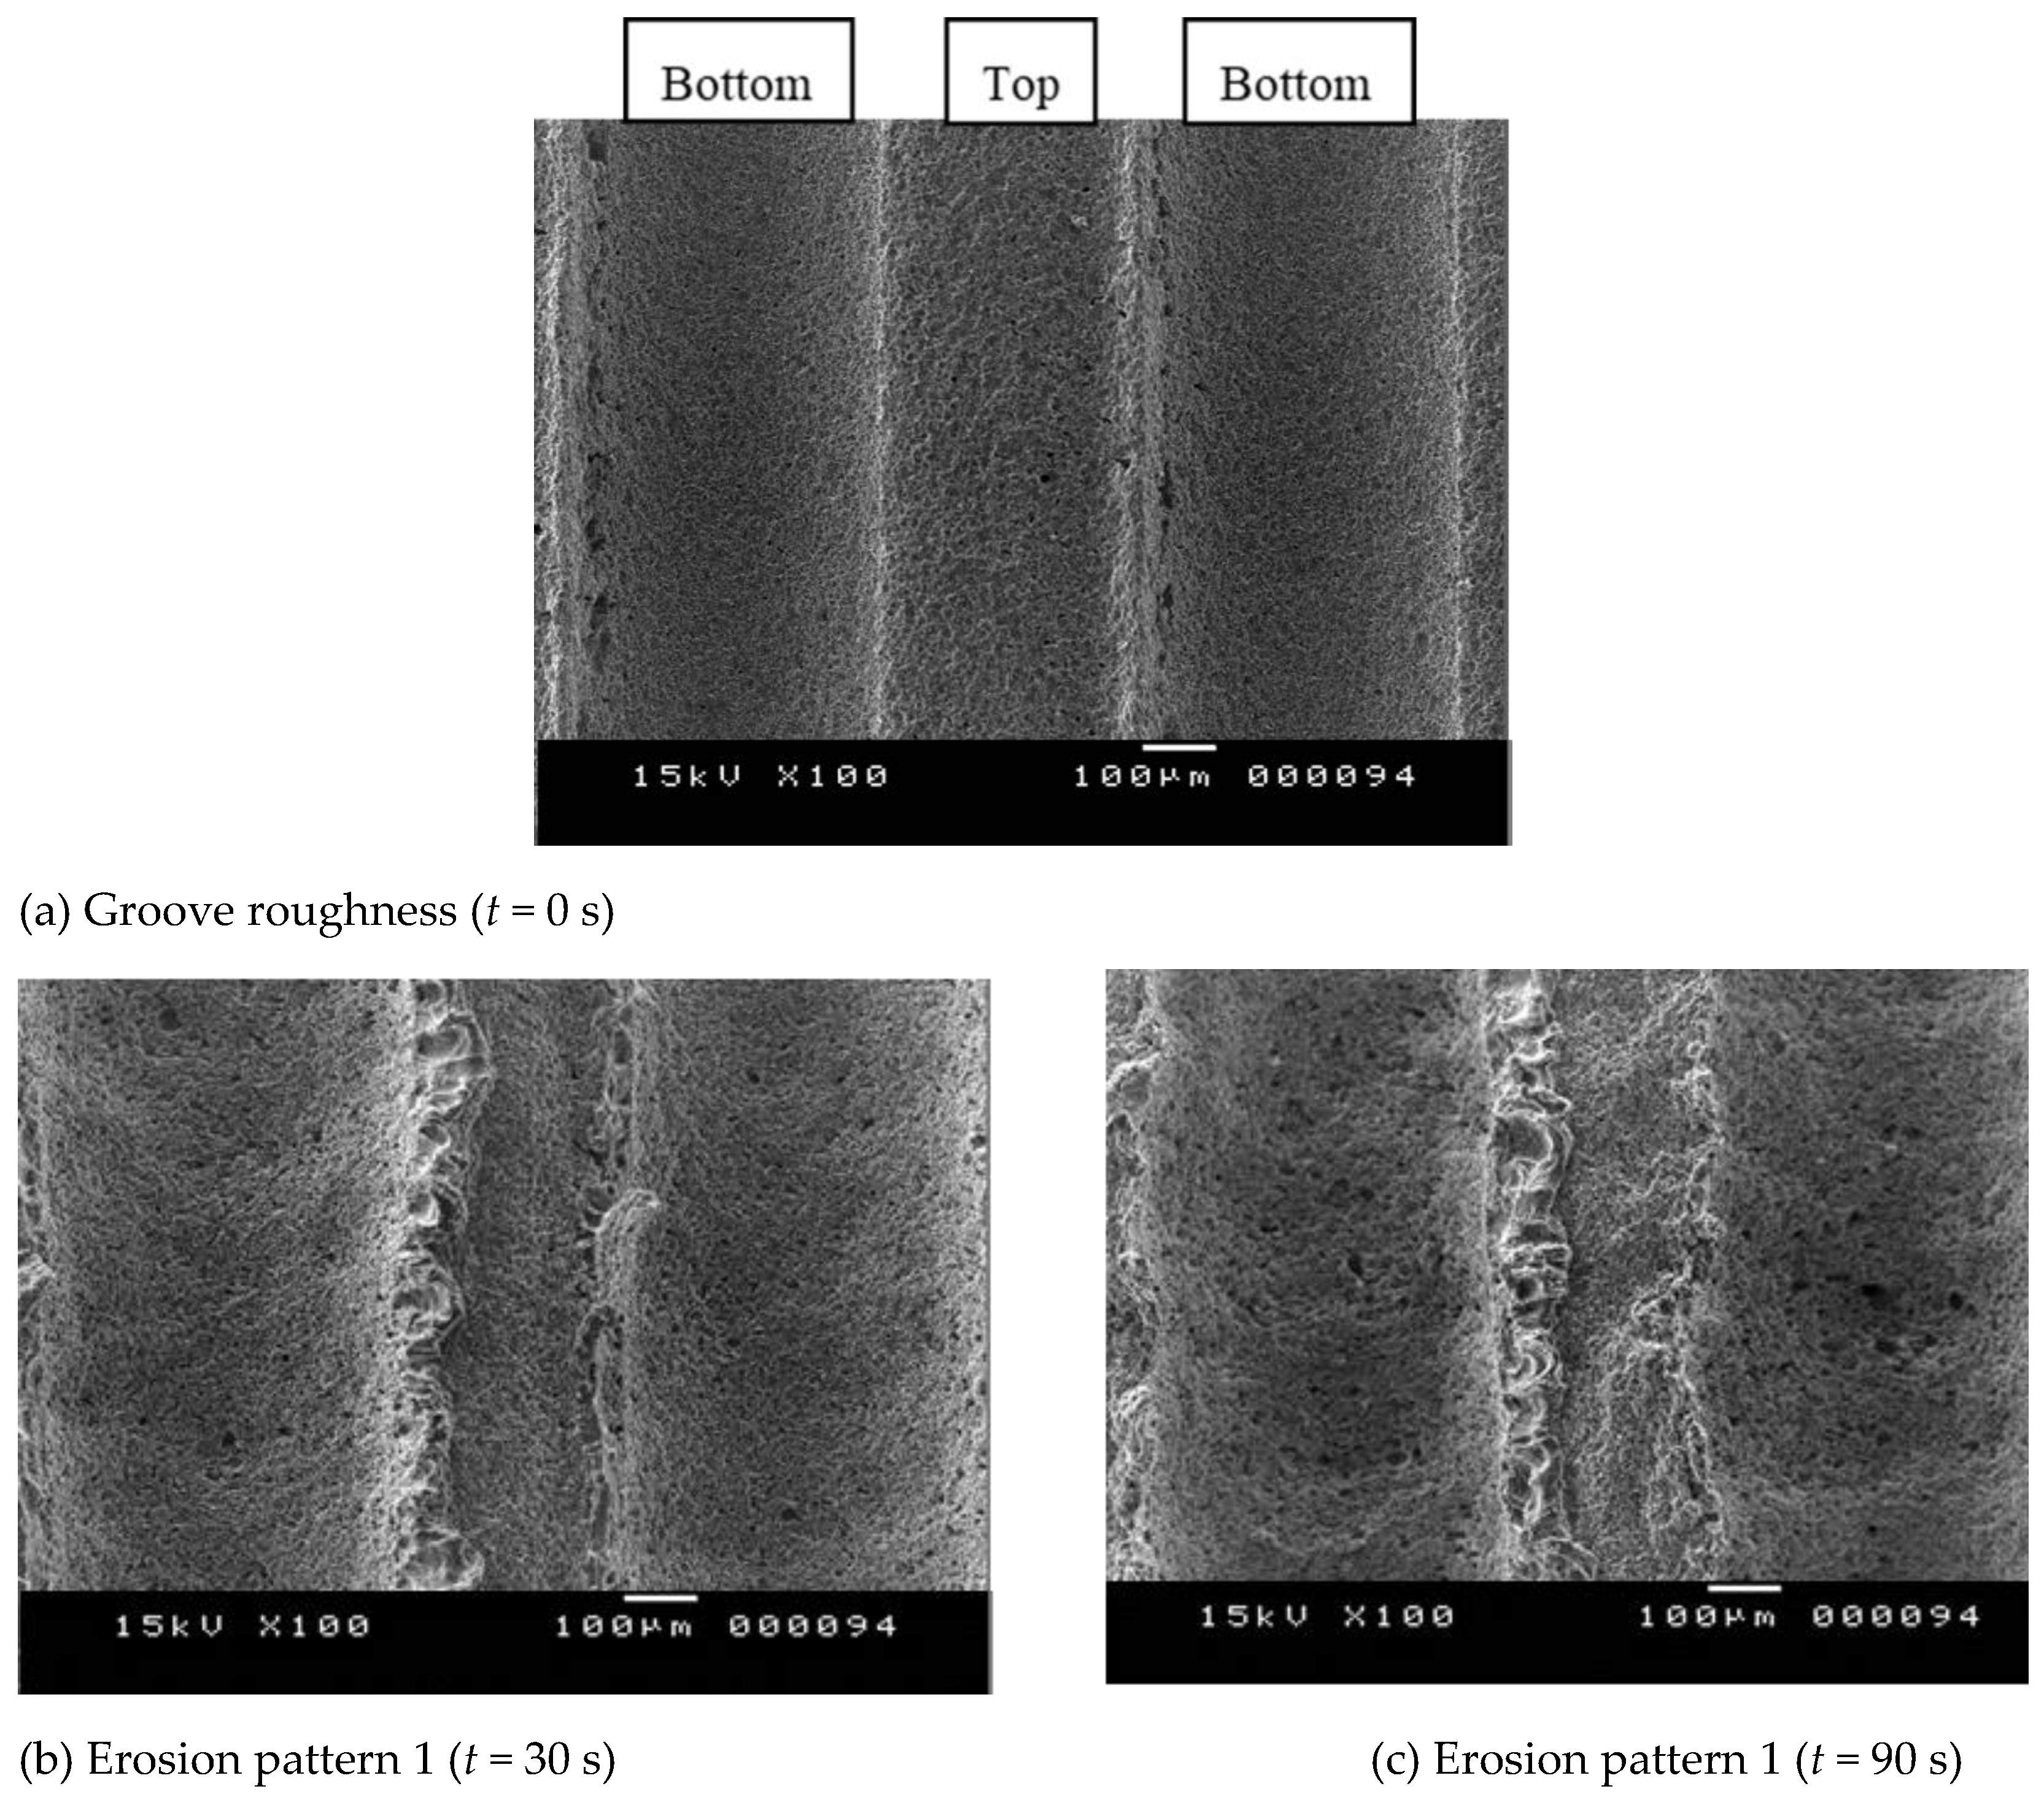

Figure 8.
Shadowgraph images of cavitating jet (unit in mm). (a) Smooth wall; (b) Rough wall (x–z); (c) Rough wall (y–z).
Figure 8.
Shadowgraph images of cavitating jet (unit in mm). (a) Smooth wall; (b) Rough wall (x–z); (c) Rough wall (y–z).
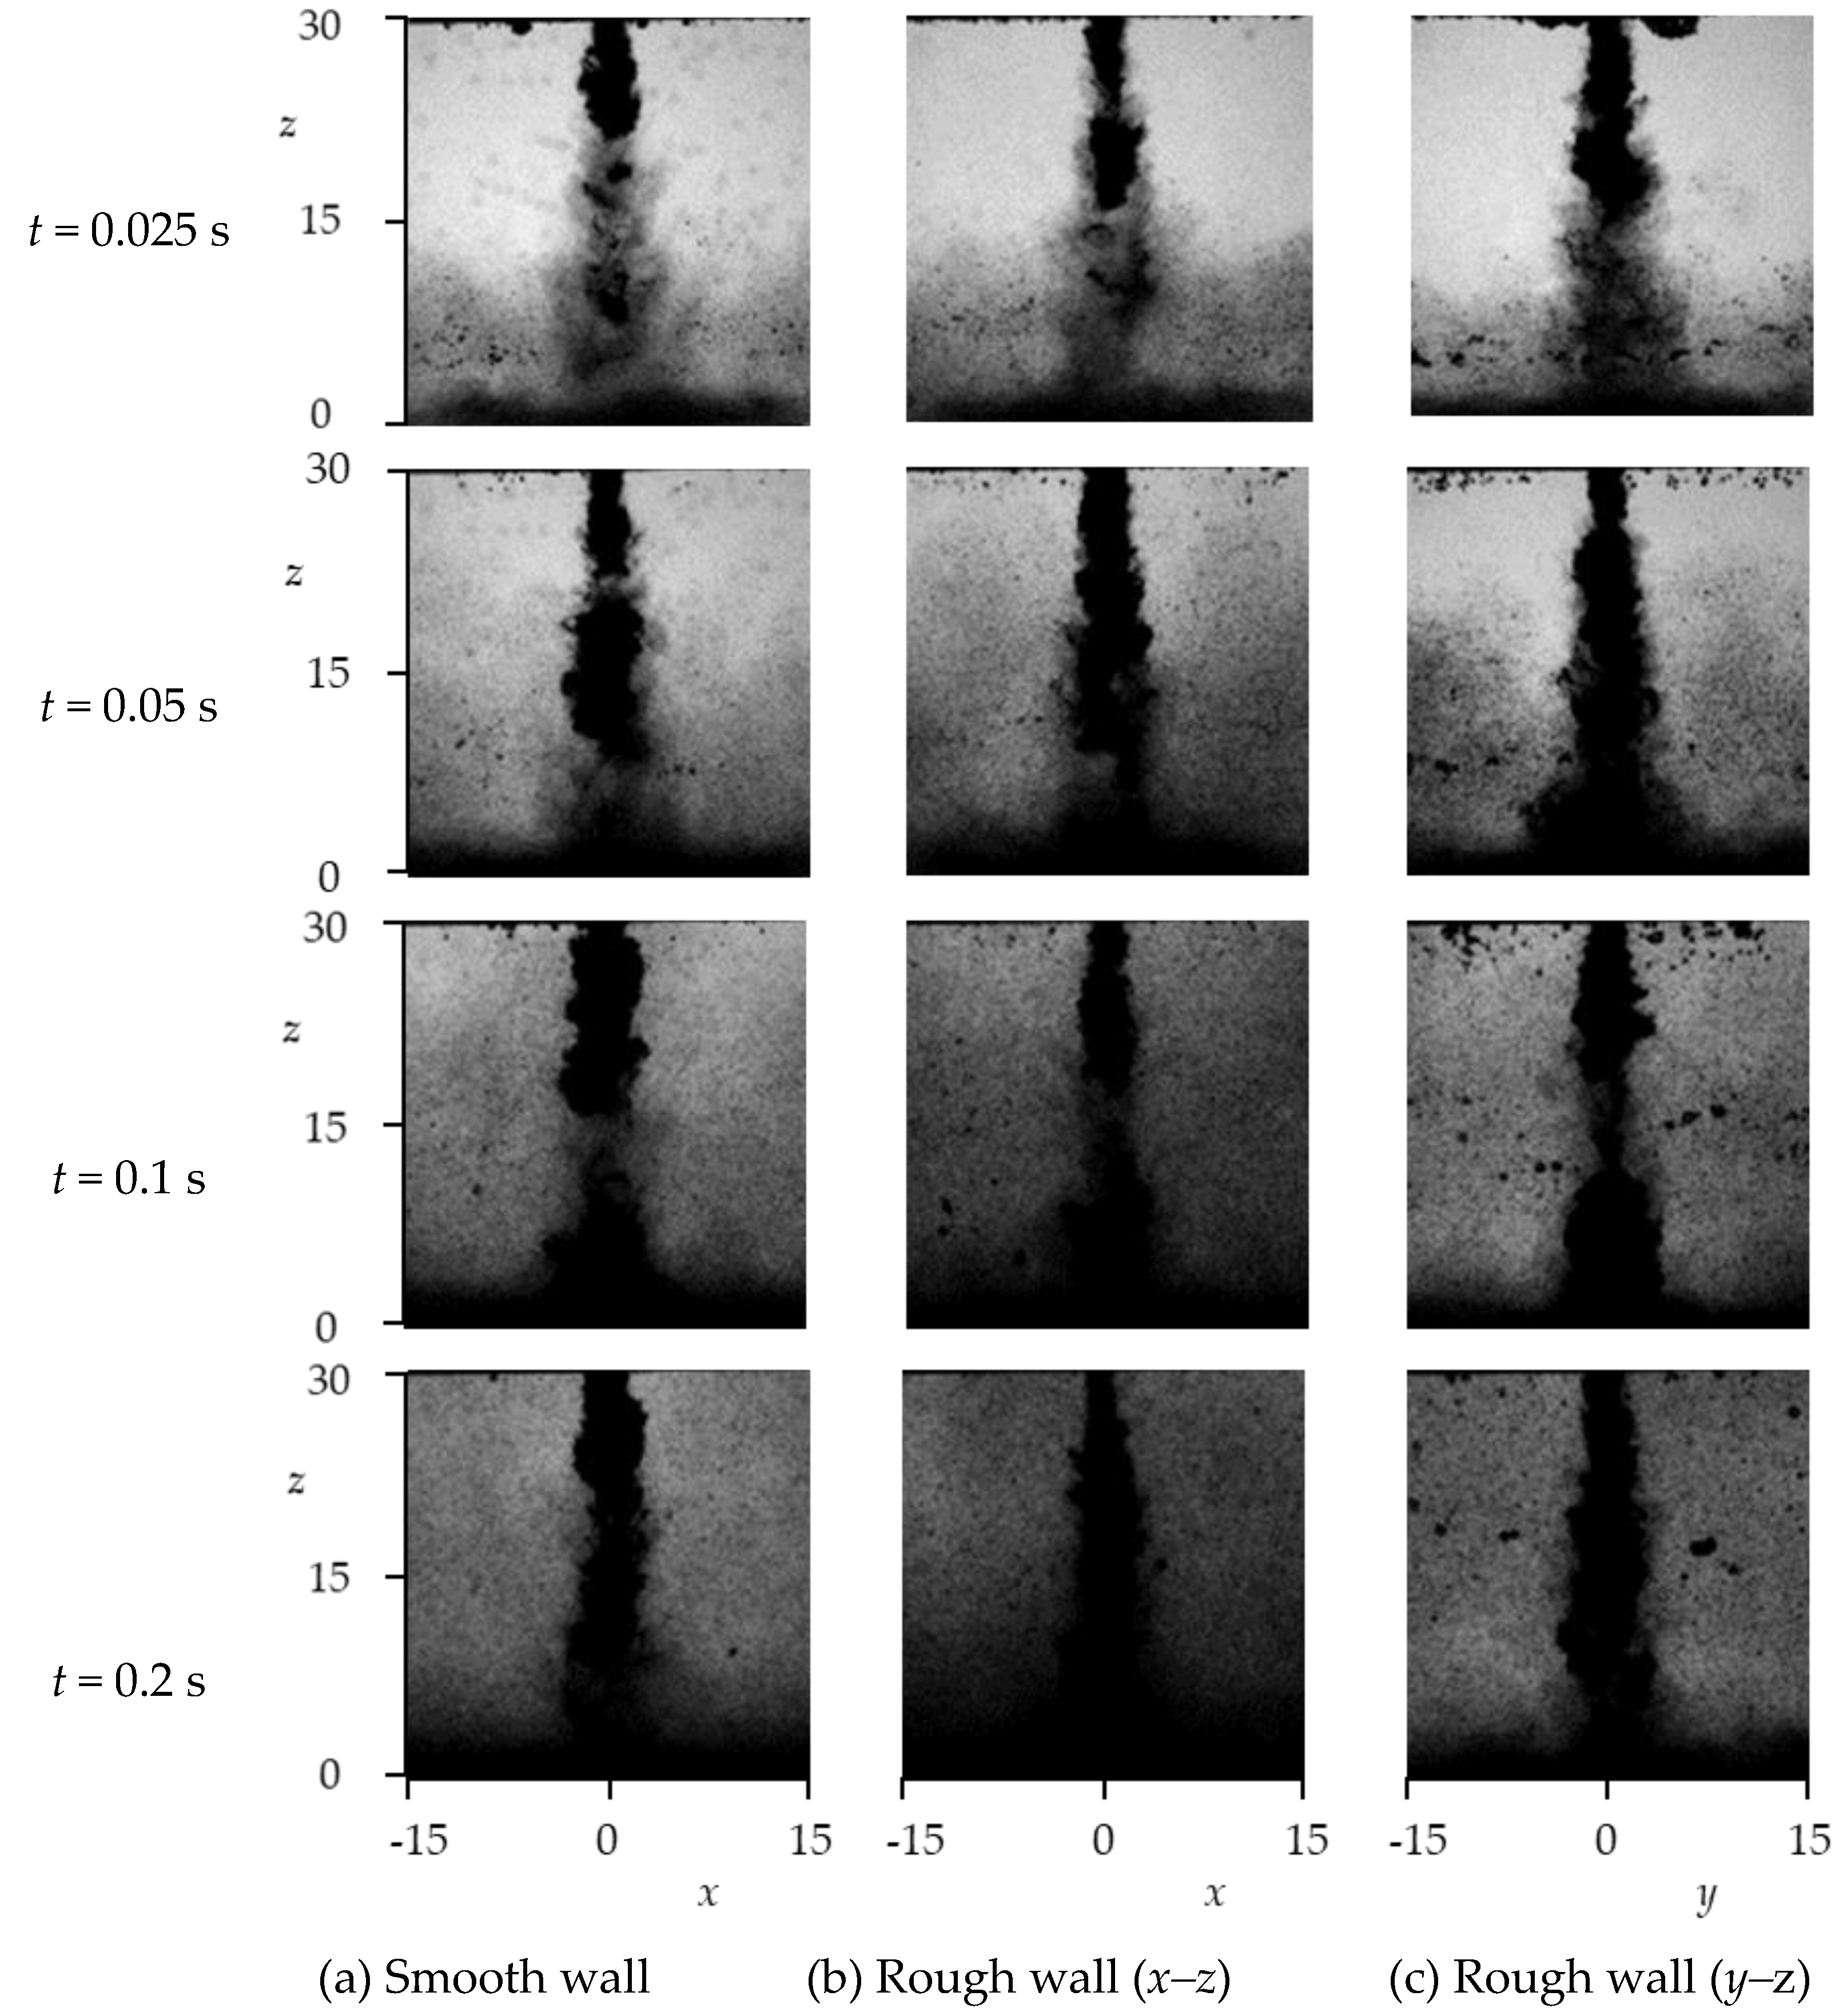
Figure 9.
Time-variations of shadowgraph image intensities.

Figure 10.
Schlieren images of cavitating jet (unit in mm). (a) Smooth wall; (b) Rough wall (x–z); (c) Rough wall (y–z).
Figure 10.
Schlieren images of cavitating jet (unit in mm). (a) Smooth wall; (b) Rough wall (x–z); (c) Rough wall (y–z).
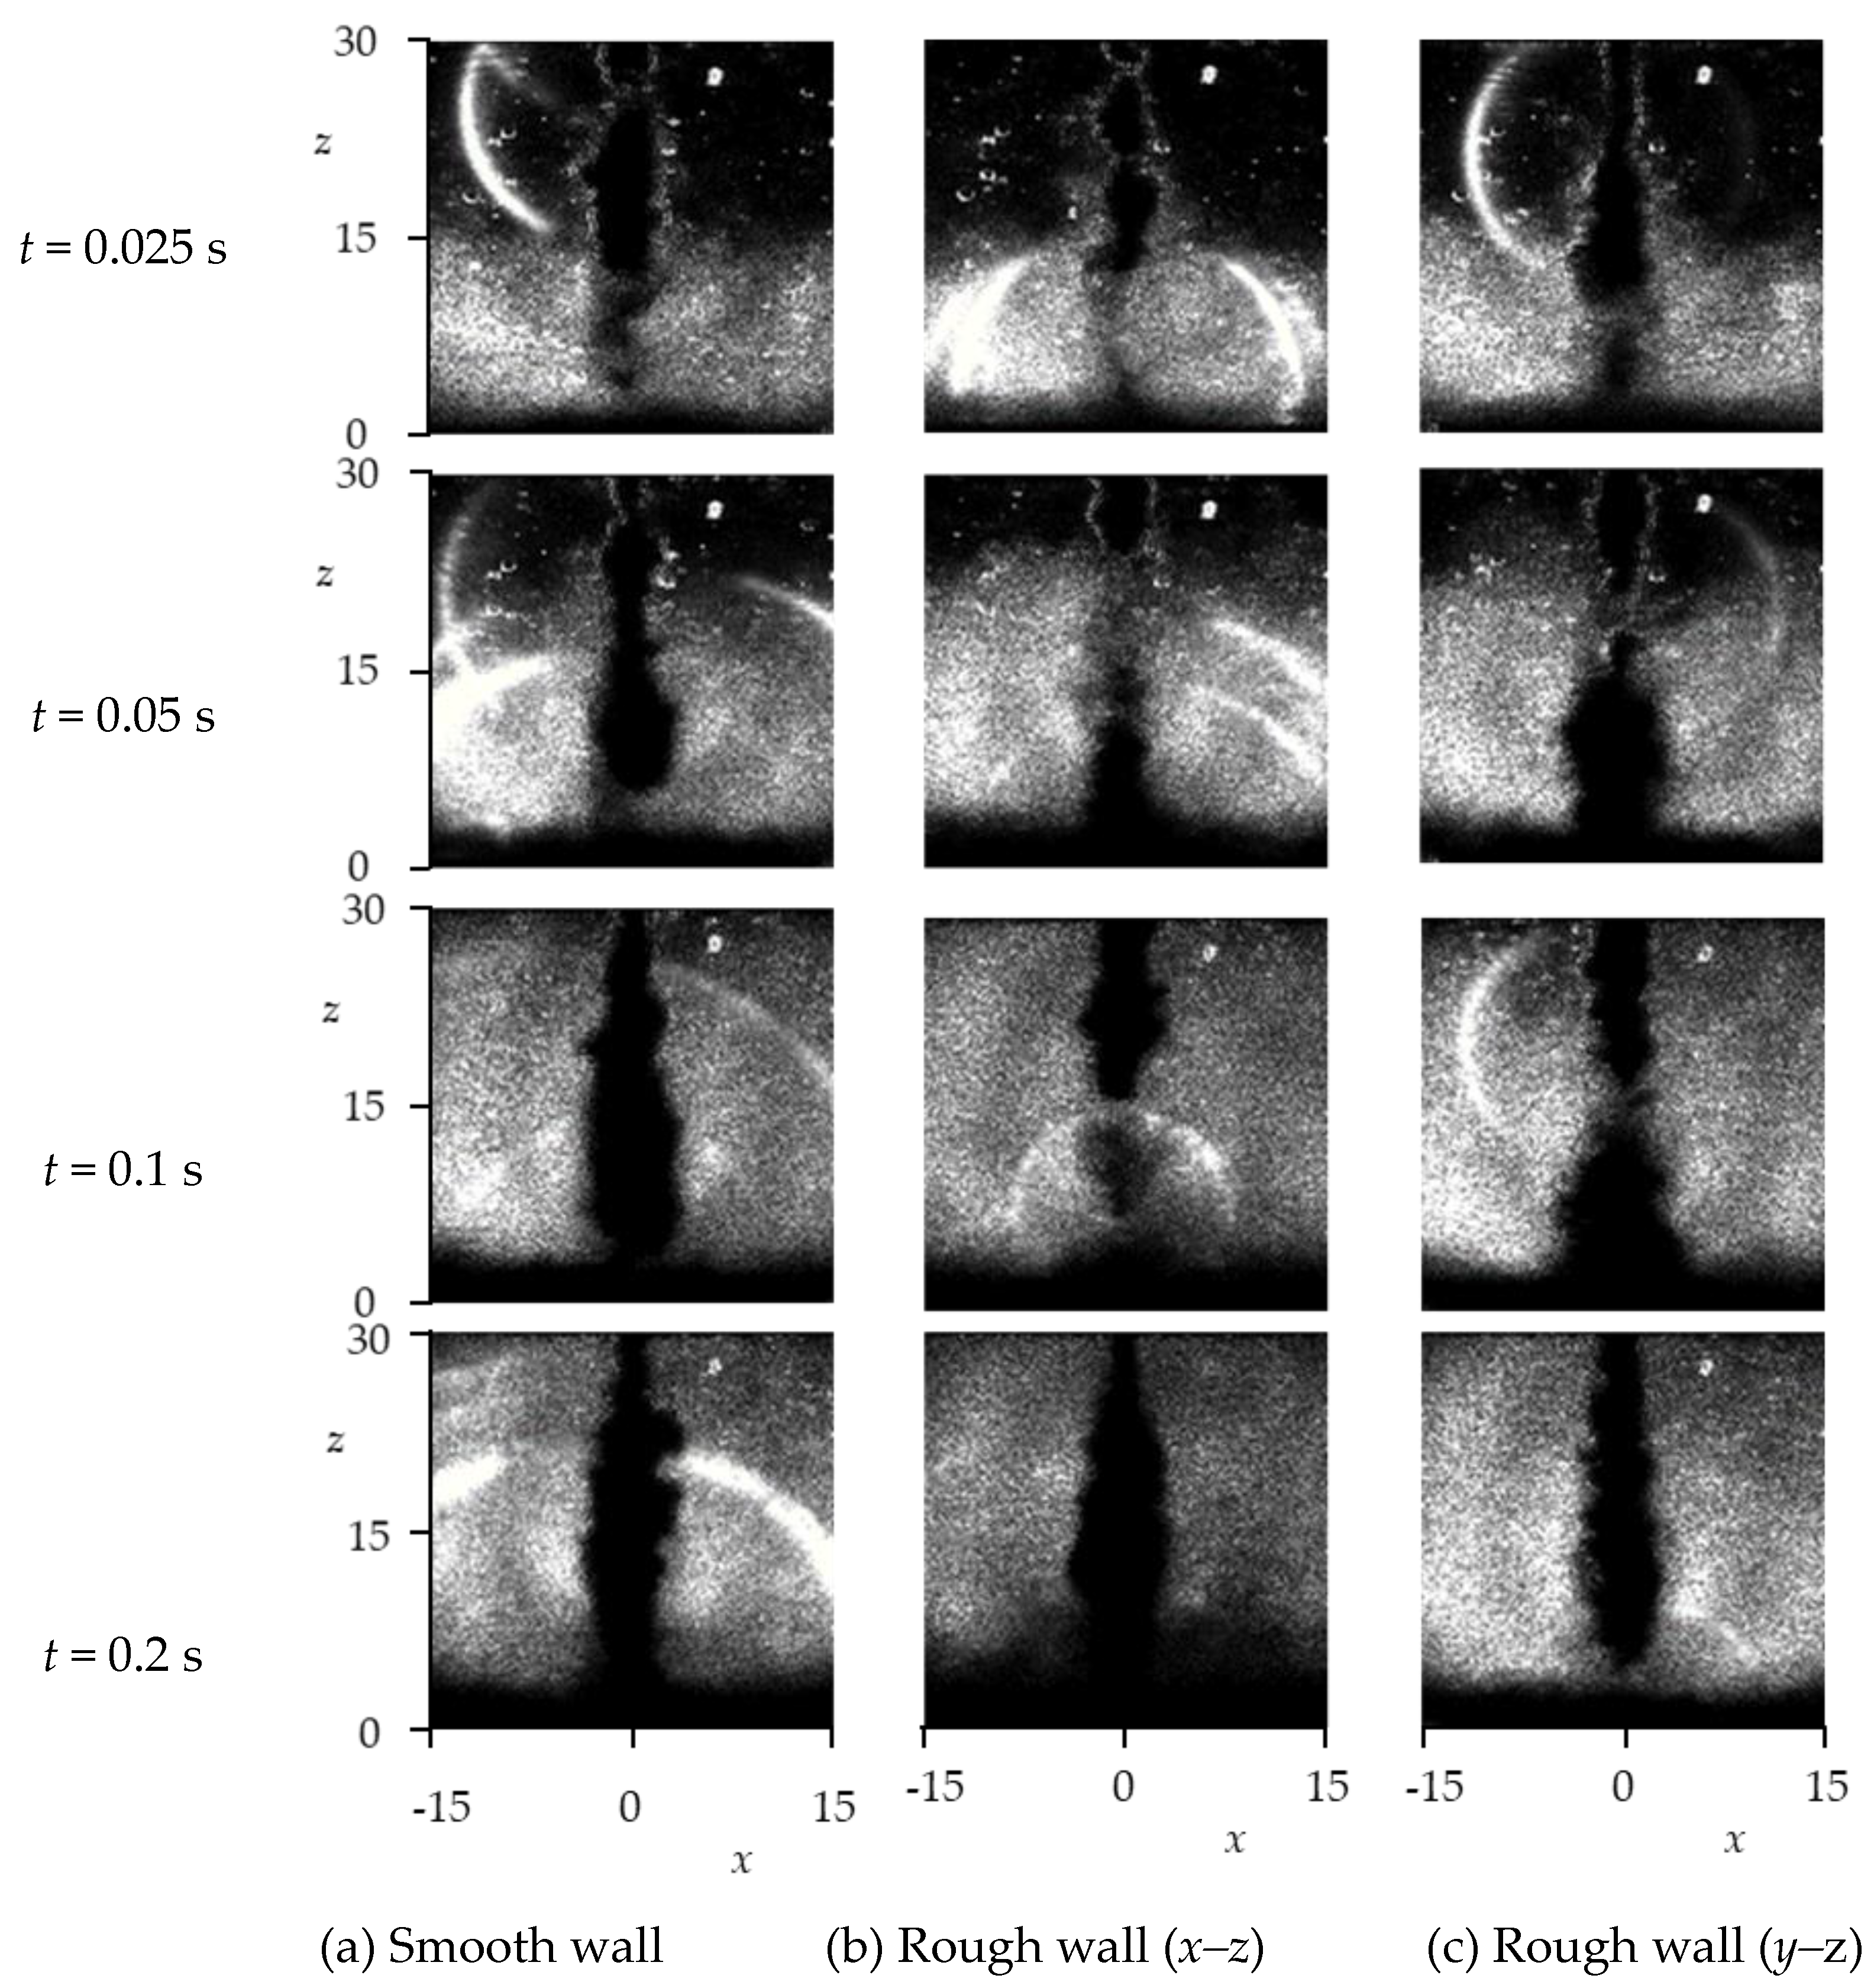
Figure 11.
Time-variations of schlieren image intensities in cavitating jet. (a) Smooth wall; (b) Rough wall (x–z); (c) Rough wall (y–z).
Figure 11.
Time-variations of schlieren image intensities in cavitating jet. (a) Smooth wall; (b) Rough wall (x–z); (c) Rough wall (y–z).
Publisher’s Note: MDPI stays neutral with regard to jurisdictional claims in published maps and institutional affiliations. |
© 2020 by the authors. Licensee MDPI, Basel, Switzerland. This article is an open access article distributed under the terms and conditions of the Creative Commons Attribution (CC BY) license (http://creativecommons.org/licenses/by/4.0/).
Share and Cite
MDPI and ACS Style
Fujisawa, N.; Yamagata, T.; Seki, R.; Ohki, M. Erosion Mechanism of a Cavitating Jet on Groove Roughness. Fluids 2021, 6, 6. https://doi.org/10.3390/fluids6010006
AMA Style
Fujisawa N, Yamagata T, Seki R, Ohki M. Erosion Mechanism of a Cavitating Jet on Groove Roughness. Fluids. 2021; 6(1):6. https://doi.org/10.3390/fluids6010006
Chicago/Turabian StyleFujisawa, Nobuyuki, Takayuki Yamagata, Ryotaro Seki, and Motofumi Ohki. 2021. "Erosion Mechanism of a Cavitating Jet on Groove Roughness" Fluids 6, no. 1: 6. https://doi.org/10.3390/fluids6010006