Influence of Hydrodynamic Conditions on Micromixing in Microreactors with Free Impinging Jets


Department of Optimization of Chemical and Biotechnlogical Equipment, St. Petersburg State Institute of Technology (Technical University), Moscovskiy Prospect, 26, 190013 St. Petersburg, Russia
*
Author to whom correspondence should be addressed.
Fluids 2020, 5(4), 179; https://doi.org/10.3390/fluids5040179
Submission received: 22 September 2020
/
Revised: 7 October 2020
/
Accepted: 10 October 2020
/
Published: 13 October 2020
(This article belongs to the Special Issue Recent Advances in Single and Multiphase Flows in Microchannels)
Abstract
:An experimental study and mathematical modeling of micromixing in a microreactor with free impinging jets (MRFIJ) with a diameter of 1 mm was carried out. In the experimental part, the iodide-iodate technique was used (involving parallel competing Villermaux–Dushman reactions with the formation of I3−). Theoretical assessment revealed that more than 50% of the introduced energy is dissipated in the jets collision region. Through the use of differentiated sampling, an uneven quality distribution of micro mixing in the central and peripheral zones of the reactor was found: at moderate flow rates (700–1000 mL/min, jets velocity of 15–21 m/s) the micromixing in the central part of reactor is up to 12 times better than that in the periphery. Furthermore, the weight fraction of the probes in the central zones of MRFIJ is reduced with increasing jet velocity; this effect is attributed to a more intense formation of ligaments and droplets upon collision of jets and their secondary mixing on the walls of the apparatus. In terms of the weighted average concentration, the best quality of micromixing in the samples is achieved at a flow rate of 300 mL/min. With an increase in the flow rate (and velocity) of the jets, the dependence of the I3− concentration on the flow rate has a nonmonotonic character, which is explained by a change in the nature of the flow in the collision zone of the jets: the transition from the formation of a liquid sheet to the intensive formation of ligaments and drops and secondary mixing of the liquid film formed on the walls of the reactor. The effect of “freshness” of solutions on the concentration of reaction products was studied.
1. Introduction
The development of methods for the intensification of various processes of chemical technologies (Process Intensification) is one of the key directions in the development of modern chemistry, both in large-scale industries (typical examples are oil refining, petrochemistry, and metallurgy), and in “fine” chemistry—this includes fine organic synthesis and production of nanosized materials [1].
Miniaturization of chemical engineering equipment allows for a qualitative leap in the space-time scales of objects in which the transformation of matter takes place [2]. As a result of the extremely high density of the kinetic energy of the flow, dissipated in extremely small volumes of mixed solutions (on the order of microliters or even nanoliters), an unprecedented high quality of micromixing is achieved [3,4]. This leads to the production of particles (crystallite) with a size of 20–50 nm, and in some cases (when several products may be formed) to the production of a pure product in accordance with the stoichiometry employed (for example, formation of a pure bismuth orthoferrite BiFeO3 in a microreactor synthesis without the formation of mullite Bi2Fe4O9 or sillenite Bi25FeO39; the latter two products are formed during the hydrothermal synthesis [3,4]). It should be noted that the level of energy consumption in microreactors does not exceed units or tens of watts.
Thus, oxide materials in microreactors during the processes of synthesis exhibit the following advantages: (1) the ability to concentrate energy in small volumes at an energy level of no more than tens of watts to achieve high energy dissipation rate ε (up to 0.54·108 W/kg, see discussion in Section 3.2; (2) an extremely high level of micromixing ensures a high uniformity of distribution of reactants in contacting solutions (the estimated time scale for micromixing in MRFIJ is from tens to hundreds of microseconds); (3) due to the unprecedented high level of micromixing, the production of pure products is achieved, and due to their short-term contact, the size of the formed particles can be controlled to a certain extent; (4) from a technological point of view, the continuity of the process achieved in flow-through devices is a valuable preference; (5) a significant reduction in the synthesis time of precursors in comparison with existing methods (mainly hydrothermal and their modifications)—from several tens of hours to several seconds and milliseconds.
One of the attractive options for the use of microreactor technologies for the synthesis of nanosized particles is a microreactor with free impinging jets (MRFIJ) [5,6]. MRFIJ w used earlier for the synthesis of CoFe2O4, BiFeO3, GdFeO3, LaPO4, and a number of other compounds [2,3,4,5,6,7,8,9,10] with a particle size of less than 50 nm. In essence, microreactor synthesis is a modification of the sol-gel method carried out with an extremely high degree of micromixing.
An important feature of MRFIJ is the level of energy dissipation rate, (up to 0.54·108 W/kg in the presented study), which is comparable to that obtained in ultrasound devices. In this case, the input energy in ultrasonic devices rapidly decays along the normal path to the emitter; in addition, in the volume of a sounding fluid, energy is dissipated mainly in the antinodes of standing waves.
The results obtained in previous works need to be explained from the point of view of the hydrodynamic conditions effect on the size of particles obtained immediately after the “wet” phase of the synthesis. In particular, it was necessary to find an explanation for factors such as the influence of the jets flow rate and the temperature of solutions on the size of the formed particles [8].
The relevant complex task global research (which goes beyond the subject of the paper) that should be carried out together with specialists in physical chemistry of nanostructured materials is to determine conditions that are favorable to obtain nanosized particles of a given composition and structure using the following steps: (1) the microreactor mixing of reagents; (2) separation of the formed product from the liquid phase; (3) product washing; (4) heat treatment of the product. The characteristics of the final product are obviously influenced by each stage of the process; for this reason, it is necessary to investigate the role of each of the stages. The complexity and variety of factors affecting the formation of nanoparticles, ranging from the fine hydrodynamics during micromixing of solutions, nucleation conditions, particle aggregation and crystallite growth including the effect of the concentration of reagents, pH of solutions, temperature and rate of temperature change, process duration, chemical composition of the solutions, and other conditions of phase formation determine the complex nature of the problem as a whole. For each stage of the synthesis process, it is necessary to identify the most significant factors and study their influence on the characteristics of intermediate products and, ultimately, on the properties of the target product. This paper concerns only the first step of the process, linked with the micromixing.
In the published literature, the systematic studies of micromixing characteristic in MRFIJ as well as their influence on the properties of the resulting chemicals are scarcely presented.
The aim of this work is to study the influence of hydrodynamic conditions on the characteristics of micromixing in microreactors with impinging jets. Currently, to determine the characteristics of micromixing, the method of model reactions is most often used, which includes at least two parallel or consequently-parallel reactions, one of which is fast and the other is almost instantaneous [11].
As a result of the examination of the literature [11,12,13,14,15,16,17], it was revealed that there are two most suitable methods for the analysis of micromixing in MRFIJ with high values of ε: (1) the catalytic reaction of hydrolysis of 2,2-dimethoxypropane (DMP) [5,17]; (2) iodide-iodate method [11,12,13,14,15,16]. The second one has been selected as being more suitable for extended experimental studies.
The iodide-iodate technique proposed in the 1990s [12] is described in more detail in [13,14,15,16] and is based on parallel competing Villermaux–Dushman reactions—neutralization (1) and redox (2) reactions:
The method is based on measuring the mixing-sensitive iodine yield, which depends on the competition between acid neutralization and its role in the release of iodine in the Dushman reaction. Reaction (R2) is fast and has the same time scale as mixing, but is much slower than reaction (R1).
A mixture of solutions of iodide I− and iodate IO3− in a H2BO3−/H3BO3 buffer solution, as well as a solution of sulfuric acid which is the supplier of H+ protons in reactions (1) and (2), is preliminarily prepared. The acid concentration must be fixed to ensure a stoichiometric deficiency of protons in relation to borate ions.
In the case of ideal mixing, the acid is consumed only by the first reaction (1), which proceeds much faster than the redox reaction (2). In this case, the second reaction cannot proceed due to the stoichiometric lack of sulfuric acid.
In the case of poor mixing, the distribution time of sulfuric acid in the stirred volume may be longer than the characteristic time of the redox reaction. As a result, there is a local oversaturation of some reactor volumes with sulfuric acid, which, after participating in the reaction (1) with borate ions, is capable of reacting with iodide and iodate ions, causing the formation of iodine I2.
Thus, iodine formation is a measure of fluid segregation. In this system, iodine can further react with iodide, forming triiodide ions I3−:
The concentration of triiodide can easily be measured by means of UV/vis-spectrophotometry at a wavelength of 353 nm, and is defined by the law Bouguer–Lambert–Beer law:
where OD is the optical density of rel. units; ε353 is the attenuation coefficient of waves in triiodide at a wavelength of 353 nm (ε353 = 26,047 L/(mol cm) [15]); L is the optical path length of the measuring cell.
The index of segregation XS [15] is used as an indicator of the quality of micromixing, the values of which can vary from XS = 0 (ideal micromixing) to XS = 1 (complete segregation). In general, the segregation index is calculated by using the equation
where Y is the selectivity for the analyte (in this case, iodine), while the “ST” index corresponds to complete segregation.
For the iodide-iodate method, the selectivity values are determined by the following equations:
where Vr is the volume of the reactor un m3; Vinj is the volume of the injected acid solution in m3.
The numerator of Formula (6) is the number of moles which corresponds to the number of moles of acid consumed in the reaction (R2) (taking into account that part of I2 that was transformed into I3− in the reaction (R3)), the denominator is the total number of acid moles injected into the apparatus.
The numerator of Formula (7) is the number of moles corresponding to the number of moles of acid consumed in reaction (R2), the denominator is the total number of moles of acid consumed in reactions (R2) and (R1).
Essentially, the segregation index XS reflects the conversion of the acid injected into the reactor, taking into account its participation in reactions (R2) and (R3), expressed in terms of the concentration of iodine I2 and triiodide I3−.
Another indicator of the micromixing quality is the relative volume of ideal mixing [18]:
where VPM is the perfectly mixing volume in m3; VST is the complete segregation volume in m 3 (VPM + VST = Vr).
Obviously, α→∞ as the ideal micromixing is approached; for complete segregation, α = 0.
This article has the following structure: the theoretical section describes the existing approaches describing the geometry of liquid sheet formed in MRFIJ at the collision of the jets and sheet hydrodynamics; further experimental apparatus and the experimental conditions are described as well (including photographs and characteristics of liquid sheet linked with the results of iodide-iodate technique for a wide range of jet flow rates). Further studies were carried out by using differential sampling in the central zone and on the periphery of the apparatus, followed by the results of the experiments and their analysis. For the entire investigated range of jet flow rates (from 100 to 2000 mL/min for each pump), the values of the Reynolds and Weber numbers, the dissipated power in watts, and the specific rate of energy dissipation in watts per kilogram were calculated.
2. Theoretical Section
2.1. Sheet Hydrodynamics Modes
In [19,20], two main modes of the liquid sheet disintegration were discovered: (1) the formation of a relatively smooth sheet, which is destroyed as a result of the superposition of aerodynamic waves; (2) waves arise in the zone of collision of jets, which are called hydrodynamic shock waves (they arise even in a vacuum, where there can be no aerodynamic waves). It was found in [20] that at large values of the angle between the jets 2θ and high jet velocities, shock waves dominate over the entire liquid sheet. In [21], during the studying of the head-on collision of two vertical jets (2θ = 180°), two modes of the sheet break-up were also revealed.
In [22], based on the results of investigations on jets with a diameter of 0.4 mm, two main modes of formation: growth and subsequent decay of a liquid sheet, which are essentially varieties of aerodynamic waves, were identified. Mode I is capillary instability and is a result of small perturbations at the edges of the sheet, when a chain of small droplets (beads) is formed along the entire perimeter of the sheet. Mode II is the Kelvin–Helmholtz instability, a feature of which is the interaction between the liquid and the surrounding gas, characterized by high shear stresses. Disintegration occurs when the amplitude of the surface oscillations reaches a certain critical value; the liquid sheet is fragmented, then breaks up into ligaments, and they, in turn, become drops. Experiments have shown that in this regime, an increase in the jet velocity leads to a decrease in the size of the sheet.
Li and Ashgritz [22] identified following stages in the growth of the liquid sheet by using the first mechanism:
- (1)
- Sub-mode R-I-A: formation of the liquid pre-sheet.
- (2)
- Sub-mode R-I-B: smooth sheet.
- (3)
- Sub-mode R-I-C: sheet with ripples.
The stages of growth and decay of the liquid sheet by the second mechanism are due to the Kelvin–Helmholtz instability [22]:
- (1)
- Sub-mode R-II-A: sheet with an open rim.
- (2)
- Sub-mode R-II-B: turbulent sheet.
Note that the modes described in [22] were obtained for relatively moderate velocities (approximately from 2 to 8 m/s). This article deals with a much wider range of velocities (from 2 to 42 m/s, see Table 3), resulting in the fact that in the overwhelming majority of cases studied in this paper, the liquid sheet regime is not laminar.
The key hydrodynamic parameters for liquid sheet are the “jet” Reynolds numbers
and “jet” Weber numbers
where σj is the surface tension of the liquid (precursor solution) in the j-th jet. It was shown in [22] that with an increase in the Weber number, both the height and width of the sheet (for a fixed diameter of the jet) linearly increase as long as a closed rim on the sheet remains. The critical value of the Weber number Wecr is 150 for 2θ = 120°, 165 for 2θ = 90°, 200 for 2θ = 60°. Upon reaching Wecr, the collapse of the rim begins and the liquid sheet decreases
2.2. Liquid Sheet Main Characteristics
This section discusses the velocity profile in a liquid sheet. One of the most important parameters is the velocity distribution in the liquid sheet. According to the simplest theory on this topic, the interaction between the liquid and the surrounding gas is not taken into account, therefore the velocity in the liquid sheet is considered to be constant and equal to the velocity of the jets. In [23], by use of laser Doppler anemometry, the non-uniformity of the velocity field in a liquid blanket was measured. It was revealed that the radially averaged velocities in liquid sheet at φ = 0–10° has a maximum value, which is 1.23–1.34 times the jet velocity. The minimum velocity value corresponds to the φ = 180°. This effect is explained by the action of gravity; in the direction of motion from top to bottom, gravity accelerates the liquid sheet, and vice versa.
Lee and Ashgritz [22] estimated the velocity of a liquid by the propagation of waves on the surface of the sheet. Their studies have shown that at Rej in the range of 1250–2500 (for 2θ = 120° and 90°) and in the range 1250–3000 (for 2θ = 60°), the velocity in the liquid sheet exceeds the velocity of the jets by a maximum of 20–30%, while at Rej <1250 and Rej > 2500 (for 2θ = 120° and 90°) the velocity in the liquid sheet becomes smaller than the velocity of the jets.
As for the distribution of the thickness of the liquid sheet, the thickness of the sheet formed during collision of jets, according to [22,24], is determined by using the key values in Figure 1.
On the edge of the sheet:
where R is the radius of the jet (R = d/2); ψ is the angle between the velocity vector w at the liquid sheet edge and the local tangent to the liquid sheet edge contour [22] (see Figure 1b).
At the boundary between the zone of collision of jets and the formed sheet, the thickness of the sheet was determined in [22,24,25] as a function of the azimuthal angle φ:
where θ is the half-angle between the jets.
Based on the mass conservation law, the product of the thickness of the sheet on the radial coordinate hr, is a constant value, since the velocity in the sheet to be constant: u = const, and the flow rate through the sheet is defined as
Q = hru = const.
This implies that for any azimuth angle φ, equality holds at hr = hi·ri = he·re = const, where the index i corresponds to the collision zone of the jets, while the index e corresponds to the outer contour of the sheet. Thus, as the radius increases, the thickness of sheet becomes smaller.
2.3. On Impact Energy Dissipation Rate for the Duration of Micromixing
The energy dissipation rate, as confirmed in recent works [13,14], almost unambiguously determines the micromixing time.
A comparison of 12 different types of micromixers has been performed in [13]. It was shown that irrespective of the geometry of the micromixer, the micromixing time tm (s) is determined by the Reynolds number, and ultimately by the rate of energy dissipation ε (W/kg). At the same time, it was proposed to determine the micromixing time by using the formula
The deviation of the experimental values of tm from the calculated ones in most cases (more than 80% of all values) did not exceed ±30%.
In the same work, it was shown that the micromixing time tm, determined by diffusion and shear tdiff + shear, is practically inversely proportional (more precisely, with the exponent of −0.85) to the micromixing efficiency η, and is described by
where d is the diameter of the microchannel in m; U is the mean velocity in the microchannel in m/s; Pe is the Peclet number; η is the energy efficiency of the mixing devices, which characterizes the fraction of the energy transferred directly to mixing related to the energy introduced into the apparatus.
In the work [13], it was indicated that the value η for all tested devices was about the same and was about 3% (within error ±30%); it was noted that, for example, in extruders η ≈ 1% [13]. Another important aspect is that the geometry of micromixers barely affects the value of η; even in a multilamellar micromixer, which provides a decrease in the diffusion path in the transverse direction, additional energy was required to obtain these liquid lamellas.
In our opinion, the development of micromixers with an optimal configuration and/or optimal operating modes may well allow one to overcome this barrier in terms of η. The solution to this issue is beyond the scope of this article.
High values ε for micromixers (101 to 104 W/kg) studied in [13] correspond to the micromixing time scale from 0.1 s to 0.003 s, i.e., for the most intense conditions, the time scale is about several milliseconds.
Thus, the main parameter determining the quality of micromixing is the energy dissipation rate ε. Therefore, the correct calculation of the consumed energy P and the volume Vdis, in which energy dissipation takes place, is extremely important.
2.4. The Expended Energy, Collision Area Volume and Volume of the Whole Liquid Sheet
The liquid was fed to the jets collision zone (see Figure 1) through tubes and nozzles, the hydraulic losses in which determine the total energy consumption for the liquid movement Pfeed, but these pressure drops occur along the length of the tubes and inside the nozzles; therefore, they are not taken into account when calculating ε. The power supplied to the zone of collision of the jets (to the liquid sheet) is the sum of the kinetic energy fluxes [22]:
where m1 and m2 are mass flows rates in 1st and 2nd jets in kg/s; wj1 and wj2 are the jet velocities in m/s. Taking into account the relations
and also considering that in order to achieve the symmetry of the liquid sheet, the flow rates and densities of liquid flows usually coincide, i.e., m1 = m2 ≡ m, and the cross-sectional areas of the jets S1 = S2 ≡ S, therefore wj1 = wj2 ≡ wj, meaning it is easy to obtain:
The power Pdiss dissipated in the liquid sheet equals the difference between the supplied Pin and removed Pout kinetic energy fluxes:
It should be noted that, in reality, the residual amount of kinetic energy in a liquid sheet apparently depends on the flow regime, meaning whether the liquid sheet is preserved as a whole or it is disintegrated into ligaments and drops. Here a quantitative assessment of Pout can be performed.
In a general case, the removed kinetic energy flux is
where wr is the radial velocity at the edges of the sheet (if its integrity is preserved) or the velocity of ligaments and droplets formed during decay of the sheet in m/s.
In experimental studies with the use of stroboscopic recording (double pulse of light) [26] it was shown that at the velocity of the impinging jets wj = 6.76 m/s and the angle between the jets 2θ = 120°, the mean speed of ligaments is Vr = mean (wr) = 4 m/s. At these velocities, the calculation by Formula (19) gives the value of Pdiss, corresponding to the velocity of impinging jets of 5.45 m/s (0.80 of wj). A similar situation was found for drops: at the velocity of impinging jets wj = 3.35 m/s and an angle between the jets 2θ = 120°, the mean droplet velocity is Vr = 2 m/s; the value of Pdiss corresponds to the velocity of the impinging jets of 2.68 m/s (0.80 from wj). In this manner, the experiments, carried out in [26], indicate that in both cases in the liquid sheet, about 65% of the input energy is dissipated:
Pdiss/Pin = (Pin − Pout)/Pin = 1 − (Vr/wj)2 ≈ 0.65.
It was revealed that with a decrease in the angle between the jets 2θ, the mean velocity of ligaments and drops increases [26]. In this case, ligaments and droplets moving downward have a significantly higher speed than those moving upward. This effect is easily explained from the standpoint of classical mechanics: the gravity vector is directed downward, and most importantly, the smaller the angle 2θ, the greater the sum of the vertical components of the initial momentum of the jets 2mVy. Thus, when wj = 6.76 m/s and 2θ = 100° a maximum ligaments velocity is max(wr) = 5.2 m/s (see Table 1), and the ratio Pdiss/Pin = 0.506. A similar situation takes place with the formation of drops (bottom lines in Table 1). However, as can be seen from the data presented in Table 1, even at 2θ = 80°, the ratio of dissipated power to the input power is Pdiss/Pin > 0.45. Thus, for 2θ > 90°, it can be guaranteed that Pdiss/Pin > 0.50, i.e., more than 50% of the introduced energy is dissipated in the collision region (and at relatively low flow rates, in a liquid sheet).
Assuming as a first approximation that the kinetic energy at the edges of the sheet is significantly lower than the kinetic energy of the jets, one can conclude
As expected, the dissipated power Pdiss is proportional to the third power of the jet velocity wj. In the investigated range of flow rates, the jet velocity varied in the range of 100–2000 mL/min, i.e., by 20 times. Not surprisingly, the power expended at the edges of the studied speed range differs by 8000 times.
In further research, the research on Pout should be given closer attention. In addition, the energy necessary to form new surfaces of droplets and ligaments should be taken into account.
The energy Pdiss introduced into the liquid sheet is dissipated, apparently, mainly near the jet collision zone, the volume of which Vi (item 6 in Figure 1) can be obtained by integrating the thickness of the sheet h over the azimuthal angle φ and radius r. The value of h is determined by the Formula (22) [24]
where R is the radius of the jet in m.
The elementary volume of the collision zone dVi = h(φ,r) rdφdr, then the volume Vi is:
Using the volume Vi gives an upper limit for the energy dissipation rate εi:
If the entire volume of liquid sheet Ve (pos.7 in Figure 1) is taken as the volume in which the total energy of jets is dissipated, then we obtain a lower limit of energy dissipation rate εe, defined by the Formula (27).
The integral in Equation (26) can be calculated numerically; the volume Ve can also be found by using the approximate formula obtained from Equation (7) without taking into account the change in the angle ψ:
Our calculations have shown that the deviation between Equations (26) and (28) (the latter one denoted as Ve1 in Table 3) does not exceed 13.5%. The results of calculations of the values Vi, Ve, εi, and εe are shown in Table 3.
3. Experimental Section
3.1. Experimental Setup
At the department of optimization of chemical and biotechnological equipment St. Petersburg State Institute of Technology for the study of processes occurring during jets collision, an experimental rig was developed which consisted of a micro-reactor with free impinging jets (MRFIJ) [6] and auxiliary devises. Various micro-reactors with free impinging jets that had several modifications were used: (1) a microreactor with a glass case (Figure 1) for the synthesis of oxide materials [3,4,7] and micromixing parameters measurements; (2) an open-frame MRFIJ for the analysis of the geometry and conditions of formation and decay of liquid sheet, wherein the nozzles were fixed with a predetermined angle 2θ on the frame of PVC and installed inside a rectangular glass container (Figure 2 and Figure 3). Some of the experiments to determine the parameters of micromixing using the iodide-iodate technique were carried out using differential sampling of reaction products both directly under the jet collision zone and at the periphery (Figure 3).
The solutions were supplied by two TOPSFLO Micro Pump Technology gear pumps (model MG213XKDC24WI), with a nominal capacity of up to 3500 mL/min and an operating pressure of up to 10 bar. Material inside of the housing—AISI 316L stainless steel, gears, and seals—are made from PEEK and PTFE, respectively.
To determine volumetric flow rates of the solution, two turbine flow meters VISION® 1005 2F66 (inner diameter of 5 mm), with the range of flow measurements of 100–2500 mL/min and a relative measurement error ±3%, equipped by digital indicating blocks ILR750T 56,704 were used.
The principle of operation of the MRFIJ (see Figure 1) is as follows: the solutions to be mixed are supplied in the form of rather thin jets 5 (as a rule, 1 mm or less), flowing from the nozzles 2. In our studies, we used nozzles with a diameter dj = 1 mm with an angle between them 2θ = 107°, the distance between the exit from the nozzle and the point of collision L = 17 mm, and the distance between the nozzles B = 25 mm. The nozzles are located in a vertical plane with an angle between them being 2θ. The speed of the jets must be high enough to ensure a good quality of micromixing, determined by the specific energy dissipation rate.
As the velocity of the jets increases, the area of the sheet first increases, and then (for the case under study dj = 1.0 mm starting from 400 mL/min) the sheet disintegrates (see discussion in Section 4.2).
When the jets collide, a zone 6 of active mixing of solutions is formed, which, upon expansion, forms a liquid sheet 7.
At the first stage, the concentration of triiodide I3− in the product obtained at the output of the microreactor was measured, both distilled and deionized water was used (Figure 4). At the second stage, differential sampling was used (with deionized water), the results of which are discussed in Section 4.3.
In Figure 4, the results of micromixing study in MRFIJ using the iodide-iodate technique are shown. The abscissa shows the flow rate of each of the pumps supplied by the reagent solutions.
3.2. Iodide-Iodate Method for Determining the Quality of Micromixing. Selection of Optimal Concentrations
For carrying out studies on determining the micromixing quality, the iodide-iodate technique was used according to recommendations given in [14]. In [14], several sets of concentrations are given (Table 2), corresponding to the optimal optical density, which can be measured on a UV-vis spectrophotometer.
As a result of our preliminary studies, the optimal set of concentrations (combination 2 in Table 2) was selected, which was used in all further experiments.
The differential sampling scheme is shown in Figure 3. A part of the resulting product was collected in a glass cylinder (beaker) 7 with an inner diameter of 22 mm (central product collection zone), the rest of the product was collected in a peripheral annular zone 8 formed between a glass housing of the reactor with an 82 mm inner diameter and a beaker of 7 mm. The mass of the obtained samples was weighed with an accuracy of 0.1 g. The optical density of the samples was measured with an SF-2000 spectrophotometer (OKB ‘Spectrum’, Russia) at a wavelength of 353 nm for five samples, poured into five 10 mm thick quartz cuvettes. The measurement results (mean values) are shown in Figure 7.
4. Results and Discussion
4.1. Dependences of the Triiodide Concentration in the Mixture on the Flow Jets
The dependence of the triiodide concentration of (I3−) in the solution obtained at the outlet of the MRFIJ (weighted average concentration) in a wide range of flow rates, recalculated in segregation coefficient is shown in Figure 4. Line 1 corresponds to distilled water, while line 2 corresponds to deionized water used to prepare solutions. The values of the Reynolds and Weber numbers corresponding to the indicated flow rates are given in Table 3.
4.2. Analysis of the Influence of the Reynolds Number on the Behavior of the Liquid Sheet and Concentration in the Mixture
To analyze the obtained data, it is convenient to distinguish five characteristic zones (I-V) on lines 1 and 2 (Figure 4), which are quite close one to the other, in terms of flow rates. Table 3 shows the results of calculating some parameters of the flow in the liquid sheet (the calculation formulas are given in Section 2).
Despite the fact that the absolute values of the concentrations have some differences, in general, the nature of the dependences is qualitatively the same.
In zone I (at flow rates Q1 = Q2 = 100–300 mL/min), the triiodide concentration is rather low (about 5·10−6 for distilled water, 5·10−5 for deionized water), which indicates good micromixing. As could be seen in Figure 4, region I corresponds to flow rates Q1 = Q2 = 100–300 mL/min and the values of the numbers Rej = 2122–6366. According to the data of [22] (obtained on water in nozzles with a diameter of 0.4 mm), at Rej < 3000–3500, the flow regime in a liquid sheet passes through the stages of “pre-sheet”, laminar flow in the sheet, the formation of waves in it, and at Rej = 3000–3500 turns into turbulent.
In zone II (at Q1 = Q2 = 400–500 mL/min), there is an increase of iodine concentrations (in distilled water, there is more substantial growth) and in zone III (Q1 = Q2 = 600 mL/min and 900 mL/min for the distilled and deionized water, respectively), there is a new decrease of iodine concentrations to a level approximately corresponding to the zone I.
In zone IV (Q1 = Q2 = 1100 mL/min and 1200 mL/min for distilled and deionized water, respectively), an increase in iodine concentration is observed—the quality of micromixing deteriorates. Finally, in zone V (Q1 = Q2 = 1700 mL/min and 1800 mL/min for distilled and deionized water, respectively), the iodine concentration again significantly decreases.
The reason for this influence of the flow rates of the supplied solutions on the quality of micromixing, in our opinion, may be a change in the hydrodynamic situation in the MRFIJ with an increase in the flow rates Q1 and Q2.
At low flow rates—from 100 mL/min to 300 mL/min (zone I)—liquid sheet retains its integrity (photographs 1–3 in Figure 5), and the entire mixing process occurs in the sheet, and this leads to a good micromixing. As follows from the Table 3, in the zone of impingement the energy dissipation level is sufficiently high (εi = 1.35·10 − 3.65·105 W/kg), which is higher than in the best types of micro-reactors studied in [13]. According to [13,14], the highest values for ε ≈ 103 − 105 W/kg were obtained in the following devices: Starlam IMM microreactors (ε ≈ 9·102 − 6·103 W/kg) [27] and Caterpillar micromixer IMM (ε ≈ 7·102 − 9·104 W/kg) [28]. In this case, the maximum values ε were obtained in the micro-reactor with quite thin layers, of which the internal structure of the device has been formed with as little as 50 microns.
In zone II, splashes appear (photo 4–5 in Figure 5), which fly off from the collision area to the reactor wall, forming a liquid film on it (thin film, with breaks along the surface), where some part of the solutions are mixed (the second part is mixed directly in the volume of jets collision). This mixing is rather poor, which leads to a deterioration in the general mixing rates.
With a further increase in the Reynolds number (zone III), the velocity of the splashes becomes so high that the mixing process in the film formed on the walls of the micro-reactor is intensified.
The subsequent increase in the consumption of solutions and the Reynolds number (zone IV) is accompanied by an increase in the thickness of the film on the walls of the reactor, and mixing in it slows down.
Finally, an increase in the speed of the jets to 35–38 m/s (see Table 3), which corresponds to zone V, contributes to the intensified bombardment of the thick film by secondary jets (splashes, ligaments) and decreases the kinetic energy, which is high enough to ensure intensive mixing even in a thick film. Note that, according to the Bernoulli equation, the velocity in the liquid sheet is equal to the velocity of the jets (it was experimentally proven [22] that the velocity variations in the liquid sheet at φ = 0°, i.e., vertically downward, do not exceed 30% of the velocity of the jets, and at φ = 90°, i.e., in the horizontal direction they are about 10% more than the speed of the jets). Thus, it can be expected that the velocity of the generated splashes slightly higher than the velocity in the liquid sheet is of the order of the velocity of the jets with an accuracy of a coefficient exceeding unity, i.e., can be estimated as wspl ≈ 2 wj.
4.3. Analysis of the Influence of the Solution Preparation Time and the Sampling Zone on the Quality of Micromixing
For micromixing studies by use of the iodide-iodate technique, the key issue is the “freshness” of the initial solutions. In the literature, this issue has not been separately considered, although for the resulting product (I3−), the limit value is considered 30 min from the moment the acid is introduced into the solution [15].
In addition, to determine the influence of the sampling zone on the quality of micromixing, differential sampling was carried out from the central and peripheral zones, as shown in Figure 3.
The studies were carried out at the flow rates of each of the jets Qj = 100, 300, 700, 1000, 1500, and 2000 mL/min. The temperature of the solutions was 21 °C, the angle between the jets was 97.5°. In each experiment, the sample to be taken was poured into five 10 mm thick quartz cuvettes, the concentration of triiodide [I3−] was measured by the use of SF-2000 spectrophotometer at a wavelength of 353 nm.
The research results are shown in Figure 6.
First of all, it should be noted that in almost all cases, the concentration of triiodide, with the exception of Ic_100 and Ip_300, i.e., at Qj ≥ 700 mL/min, weakly depends on the time from the moment of preparation of the solution. The reasons for the scatter in concentrations at Qj < 700 mL/min are discussed below. Thus, the experiments carried out showed that when the initial solutions were kept for up to 60 min, the triiodide concentration in the mixture remained practically unchanged.
As shown in Figure 6 lines, at all flow rates, the concentration of triiodide in the center is 6–12 times less than in the peripheral zone. This result indicates that the liquid collected in the central zone is much better mixed at the microscale level than the liquid collected from the periphery of the apparatus.
Figure 7a illustrates the weight distribution of liquid between the center and the periphery. The mass fraction of liquid sample collected in the center related to the total mass of the sample is designated as φ:
φ = (sample mass in the center)/(total sample mass)
Figure 7b,c show the dependencies of segregation coefficient Xs and the relative volume of ideal mixing α on the jets flow rates Qj, respectively.
At Qj ≤ 300 mL/min, the value of φ decreases from 0.86 (at 100 mL/min) and 0.42 (at 300 mL/min), and at Qj ≥ 700 mL/min, the mass fraction of liquid collected in the center practically stabilizes at the level of 17.5–23.5% from the total mass of the product.
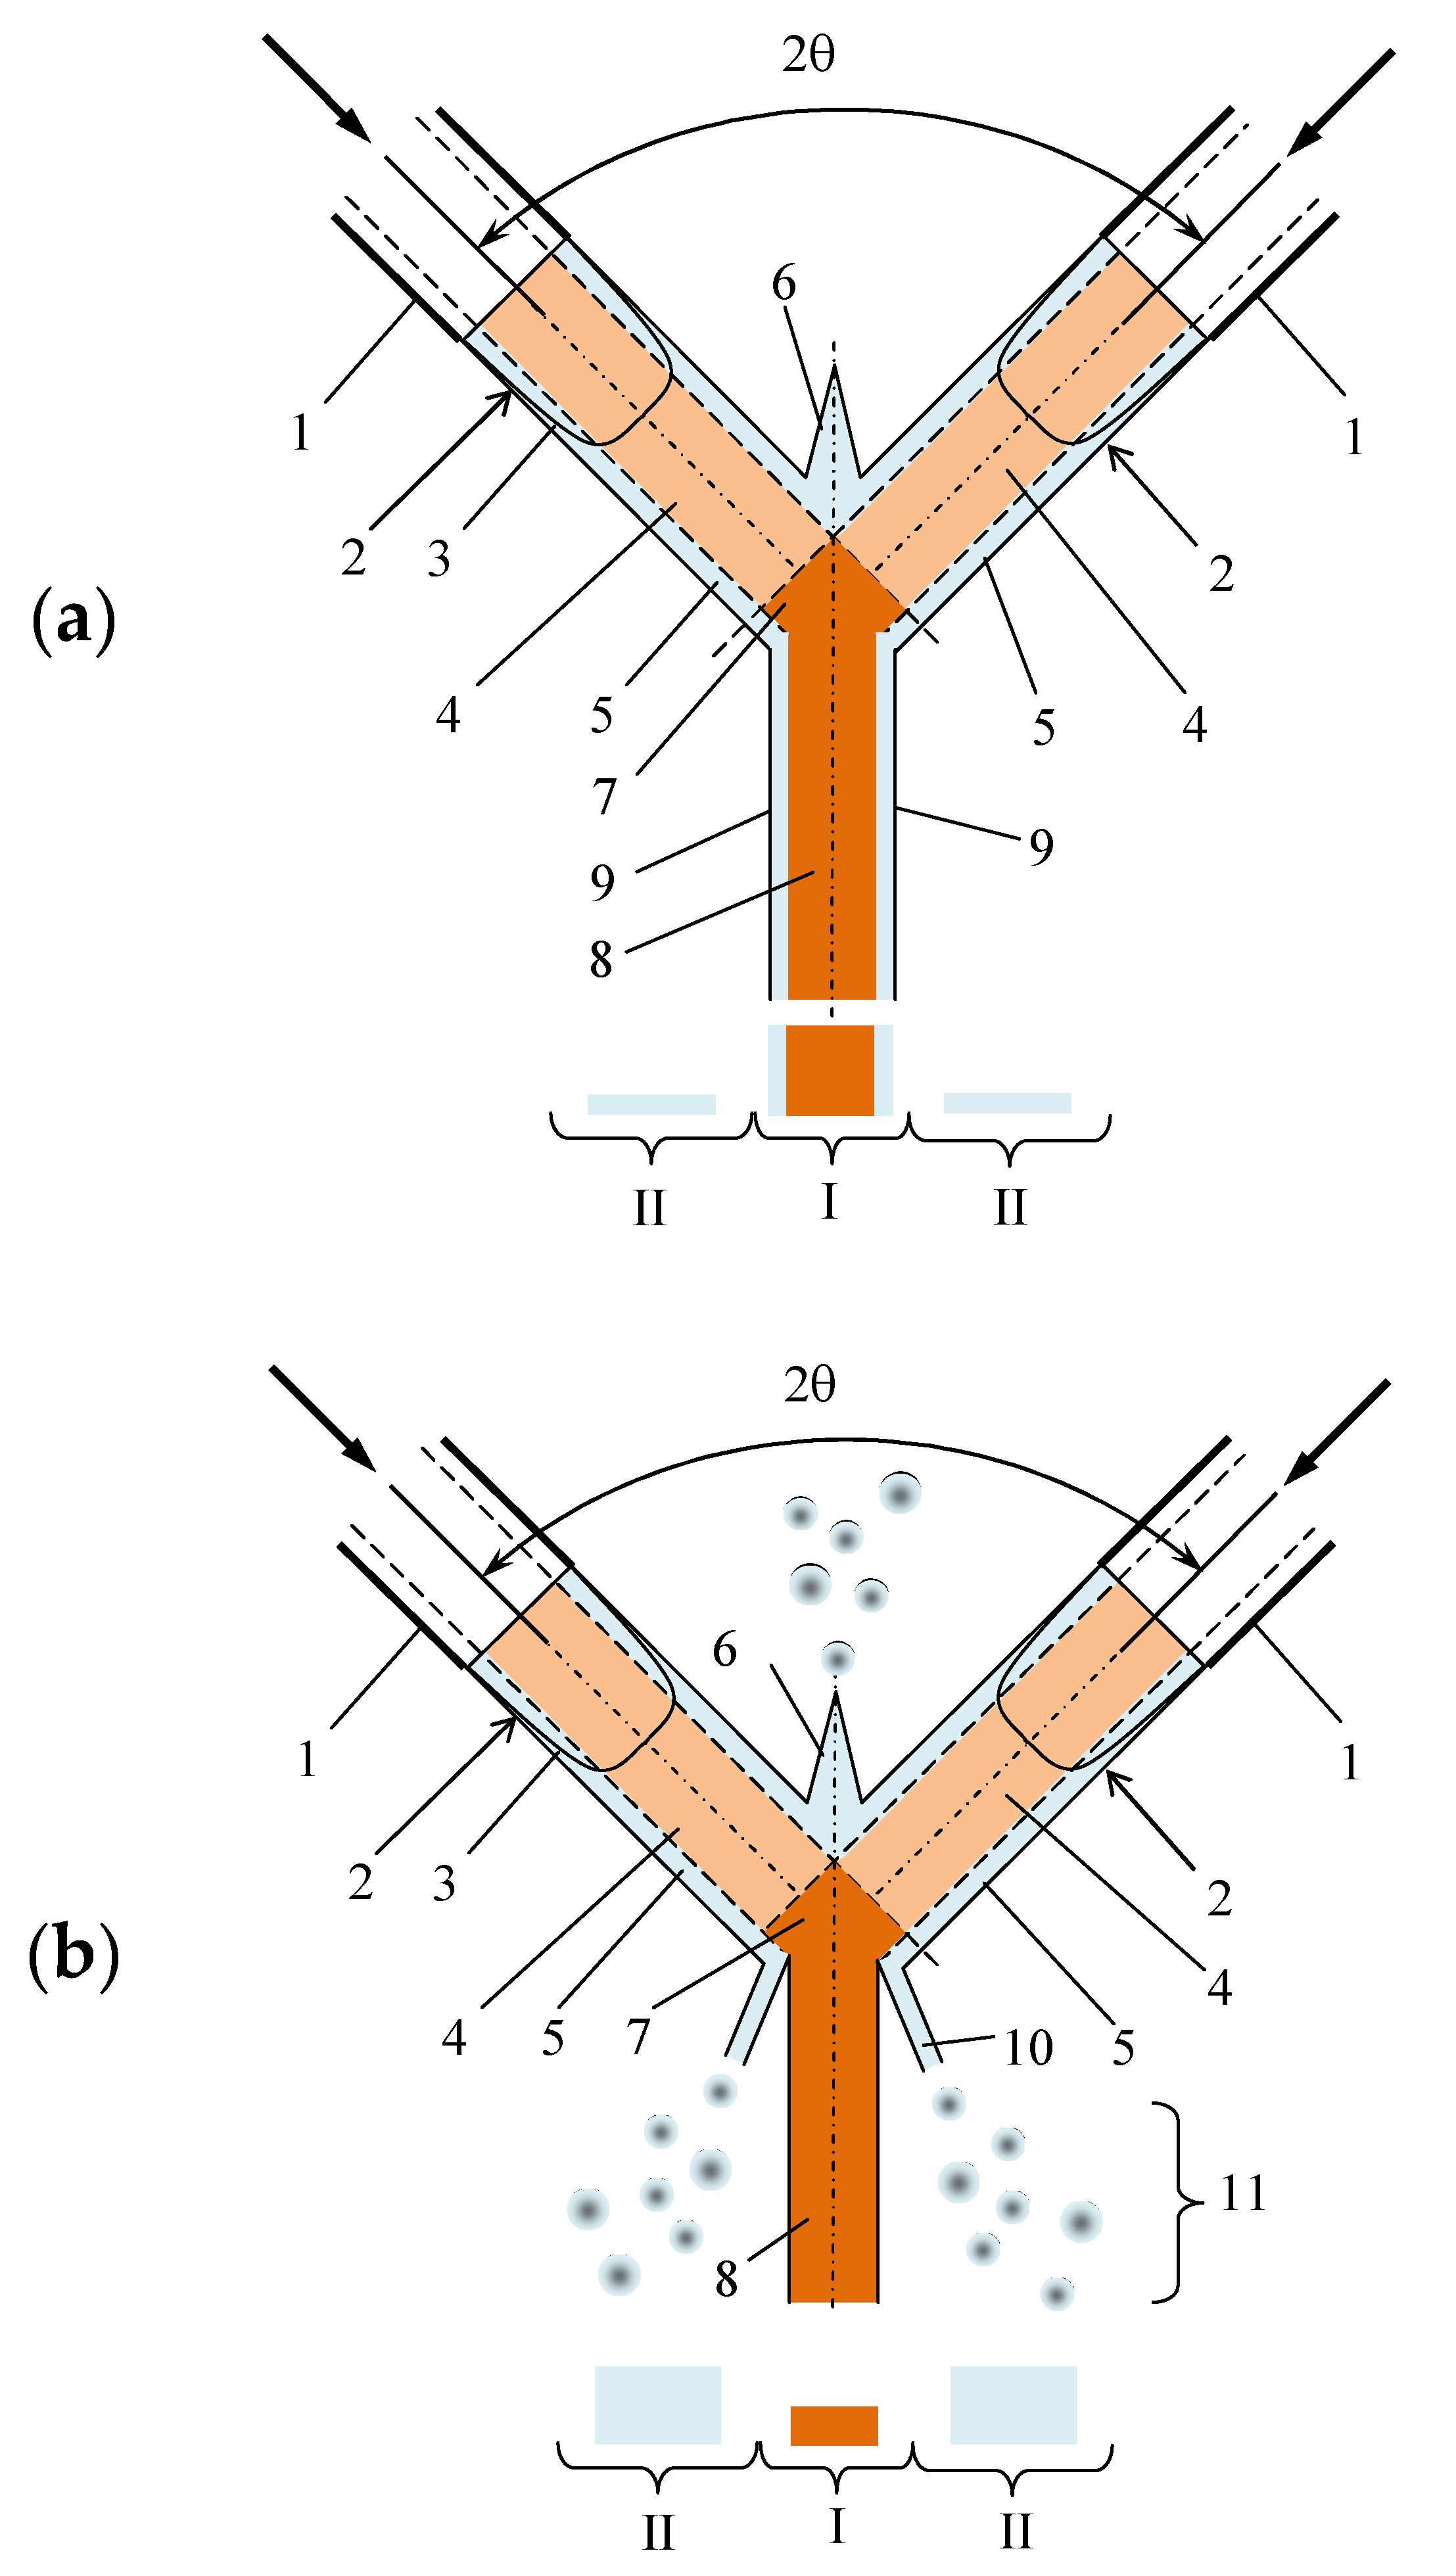
In our opinion, the mechanism for dividing the mixture into two parts with high quality of micromixing (sample in the central zone for Qj ≥ 700 mL/min) and with low quality of micromixing (sample in the peripheral zone for Qj ≥ 700 mL/min) is as follows. Figure 8 shows the scheme of the collision of the jets and the velocity profile. Upon exiting the jets from the nozzles, the velocity profile has a significant nonuniformity: near the walls there is thin laminar layer 5 with a local velocity on the wall ww = 0, whereas in the central part of the jet, a flow core stream 4 with a maximum of speed on the jet axis is formed. As the jets leave the nozzles, the velocity profile begins to rebuild, but because of the short distance between the nozzles (the distance from the nozzle exit to the collision plane was L = 17 mm), this evolution of the velocity profile does not have time to finalize.
As a result, before the collision of the jets in the cross section of the jets, a central zone with a high velocity (a zone of intense micromixing) can be selected, and around it an annular zone can be selected with a velocity which is close to zero (a zone of poor micromixing). During the jets impingement in the zone 7 the flow cores collide one with the other (in case of a sufficiently accurate coincidence of the centers of the jets which could be easily checked by the position of the liquid sheet plane related to the plane of the jets; they should be normal from one to the other), the best micromixing occurs, because local velocities are maximal here; in the annular zone of the jets, micromixing is much worse, because the velocities in this zone are close to zero.
If velocity of jets is sufficiently small (Figure 8a, Qj < 700 mL/min to our experiments), the peripheral portion of the impinging jets is transformed into the outer layers 9 of the bottom half of the liquid sheet, moving together with the core 8 of the liquid sheet bottom part. Thus, at low flow rates, most of the peripheral portion of the jet falls into the central zones I of sampling. The fraction of liquid (1 − φ) entering zone II is quite small (14% at Qj = 100 mL/min and 58% at Qj = 300 mL/min).
If, on the contrary, the speed of the jets is high enough (Figure 8b, Qj ≥ 700 mL/min) during the collision of jets, the ligaments 10 and drops 11, formed during the collision of jets, mainly fall into the peripheral zone II of sampling. In this case apparently the central zone I of sampling is filled in predominantly by a mixture formed by mixing of the jets’ cores, and zone II preferably filled in by the liquid from the annular (laminar) layers of jets. This assumption is confirmed by the data presented in Figure 7.
Thus, at high flow rates, the liquid from the annular layers of the jets, which is not well mixed enough, practically does not enter the central zone I of samples collection, but instead scatters in the form of ligaments and drops and falls mainly into the peripheral zone II of samples collection.
According to the mechanism described above, at low flow rates, the predominance of the collected liquid mass in the central sample I at Qj = 100 mL/min (86%) and its significant amount at Qj = 300 mL/min (42%) directly influences the measured quality of micromixing, inasmuch as a large amount of liquid falls into the central sample I, which contains a part of the mixture that did not took part in the intensive micromixing (shown as a blue color in the sample I) in addition to the well-mixed solutions (denoted as an orange color in sample I).
At higher flow rates (Qj ≥ 700 mL/min), the mixture in the form of drops and ligaments, which has not undergone intensive micromixing, flies to the periphery (Figure 8b), and therefore is practically only a product with a high micromixing quality, is collected in the central zone (orange color of sample I).
According to Figure 7, the optimum flow rate for the central sampling area is about 700 mL/min (bottom line in Figure 7b, upper line in Figure 7c). The weighted average concentration of the sample [I3−]m has a local minimum at Qj = 300 mL/min, but at higher flow rates monotonically grows up to the flow rate of 1500 mL/min, and then decreases slightly. This behavior of the curve [I3−]m indicates that the optimal conditions for micromixing, on average over the sample, are achieved at a flow rate of Qj = 300 mL/min.
Interestingly, that relative volume of ideal mixing α for the central zone of sampling is up to 10.5 times than that for the weighted average (αc/αm = 10.5) at Qj = 700 mL/min. Along with low value of Xs (1.45·10−3), this fact demonstrates almost perfect mixing at 700 mL/min flow rate in the central zone.
Comparison of curves [I3−]c and [I3−]p in Figure 7b shows that from the point of view of achieving the highest quality, it is advisable to take the product from the central zone I, where the level of micromixing is at its maximum. At the same time, from a practical point of view, such a process will lead to a significant decrease in the overall capacity of the apparatus and a decrease in the yield. Confrontation of the curves in Figure 7 and Figure 4 shows that the flow rate of 300 mL/min has a lower segregation coefficient (i.e., lower triiodide concentration [I3−] values) compared to the flow rates of 100 mL/min and 700–1500 mL/min, i.e., there is a good correlation between curve 2 in Figure 4 and curve Xs_m in Figure 7.
5. Conclusions
An experimental study of micromixing in a microreactor with free impinging jets (MRFIJ) of 1 mm diameter at an angle between the jets 107° and 97.5° was performed. In the experimental part, the iodide-iodate technique was used.
The effect of “freshness” of solutions on the concentration of reaction products was studied. It was revealed that no significant change in properties occurs within 60 min from the moment of preparation of the solutions.
The differentiated sampling revealed nonuniform micromixing quality in the central and peripheral zones of the reactor: at moderate flow rates (700–1000 mL/min, the velocity of jets 15–21 m/s) samples collected in the central area have demonstrated a micromixing level that is 11–13 times better than those in the periphery.
It was revealed that as the jet velocity wj increases, the mass fraction of samples in the central zone φ decreases monotonically (from 86% at a flow rate of 100 mL/min), and then stabilizes at a level of 20–25% at a flow rate of ≥ 700 mL/min. This effect is associated with a more intense formation of ligaments and droplets upon collision of jets, their secondary mixing on the walls of the apparatus.
The data on the concentration [I3−] in the samples and the segregation coefficient values were compared with the photographs reflecting the hydrodynamic situation in the apparatus (see Figure 5), elucidating the effect hydrodynamics on the micromixing.
On the basis of mathematical modeling of the liquid sheet geometry, its volume, as well as the volume of the collision zone, the values of the specific rate of energy dissipation in these two volumes, εe and εi, were calculated. The calculated values of εi varied from 6.75·103 to 5.41·107 W/kg [at flow rates from 100 mL/min (wj = 2.12 m/s) to 2000 mL/min (wj = 42.4 m/s)].
In terms of the weighted average concentration, the best quality of micromixing is achieved at a flow rate of 300 mL/min, which corresponds to the conditions for the formation of an intensively mixed, but not disintegrated liquid sheet. As the flow rate of the jets increases to 700–1000 mL/min (and the velocity grows correspondingly, see Table 3), the energy dissipation rate in the zone of jets collision εi increases, and the intensity of micromixing in this local zone improves, which is confirmed by the minimum on the segregation coefficient curve (lower line in Figure 7b).
With a further increase in the jets velocity (flow rates over 1000 mL/min), the formation of splashes increases, and the mixing of solutions occurs not only in the zone of collision of the jets, but also on the walls of the reactor, where the mixing intensity is quite poor. This leads, apparently, to an increase in the average concentration [I3−] (and segregation coefficient growth) in the samples, as observed in Figure 4 and Figure 7b, as the flow rate increases.
Thus, from a practical point of view the most favorable for the studied conditions (2θ = 107° and 97.5°, dj = 1.0 mm, L = 17 mm) is a flow rate of 300 mL/min, when the best micromixing quality is ensured by the weighted average concentration. If it is possible to take samples from the central zone, the highest quality of micromixing is achieved at a jet flow rate of 700–1000 mL/min; however, 75–80% of the mixture enters the peripheral zone, i.e., it becomes a “waste” of production; This approach can be used, for example, in scientific research when it is necessary to obtain a product with a particularly high quality of micromixing.
Author Contributions
A.A.S. has performed an experimental work, including the calculations of the experimental data for the plots (Figure 4, Figure 6 and Figure 7), making photographs (Figure 2 and Figure 5) and post treatment; R.S.A. has formulated the general tasks and subtasks, described the introduction and the theoretical part, calculated theoretical values (Table 3) and drawn Figure 1, Figure 3 and Figure 8, analysed the experimental results from theoretical point of view (results and discussion section). All authors have read and agreed to the published version of the manuscript.
Funding
This research was funded by Russian Foundation for Basic Research, grant number 19-33-90299 “Postgraduates”.
Conflicts of Interest
The authors declare no conflict of interest.
References
- Stankiewicz, A.I.; Moulijn, J.A. Process intensification: Transforming chemical engineering. Chem. Eng. Prog. 2000, 96, 22–33. [Google Scholar]
- Abiev, R.S. Micromixers and microreactors with impinging jets: Current status and perspectives of use in Chemical Engineering of nanomaterials (a review). Theor. Found. Chem. Eng. 2020, 6. in press. [Google Scholar]
- Proskurina, O.; Abiev, R.; Danilovich, D.; Panchuk, V.; Semenov, V.; Nevedomsky, V.; Gusarov, V. Formation of nanocrystalline BiFeO3 during heat treatment of hydroxides co-precipitated in an impinging-jets microreactor. Chem. Eng. Process. Process. Intensif. 2019, 143, 107598. [Google Scholar] [CrossRef]
- Proskurina, O.; Nogovitsin, I.V.; Il’Ina, T.S.; Danilovich, D.P.; Abiev, R.S.; Gusarov, V.V. Formation of BiFeO3 Nanoparticles Using Impinging Jets Microreactor. Russ. J. Gen. Chem. 2018, 88, 2139–2143. [Google Scholar] [CrossRef]
- Johnson, B.K.; Prud’Homme, R.K. Chemical processing and micromixing in confined impinging jets. AIChE J. 2003, 49, 2264–2282. [Google Scholar] [CrossRef]
- A Method for Producing Cobalt Ferrite Nanopowders and a Microreactor for Its Implementation. Russian Federation Patent No. 2,625,981, 20 July 2017.
- Proskurina, O.; Sivtsov, E.; Enikeeva, M.; Sirotkin, A.; Abiev, R.; Gusarov, V. Formation of rhabdophane-structured lanthanum orthophosphate nanoparticles in an impinging-jets microreactor and rheological properties of sols based on them. Nanosyst. Phys. Chem. Math. 2019, 10, 206–214. [Google Scholar] [CrossRef] [Green Version]
- Albadi, Y.; Sirotkin, A.A.; Semenov, V.G.; Abiev, R.S.; Popkov, V.I. Synthesis of superparamagnetic GdFeO3 nanoparticles using a free impinging-jets microreactor. Russ. Chem. Bull. 2020, 69, 1290–1295. [Google Scholar] [CrossRef]
- Kumar, D.V.R.; Prasad, B.L.V.; Kulkarni, A.A. Impinging Jet Micromixer for Flow Synthesis of Nanocrystalline MgO: Role of Mixing/Impingement Zone. Ind. Eng. Chem. Res. 2013, 52, 17376–17382. [Google Scholar] [CrossRef]
- Park, J.I.; Saffari, A.; Kumar, S.; Günther, A.; Kumacheva, E. Microfluidic Synthesis of Polymer and Inorganic Particulate Materials. Annu. Rev. Mater. Res. 2010, 40, 415–443. [Google Scholar] [CrossRef]
- Jasinska, M. Test Reactions to Study Efficiency of Mixing. Chem. Process. Eng. 2015, 36, 171–208. [Google Scholar] [CrossRef] [Green Version]
- Fournier, M.-C.; Falk, L.; Villermaux, J. A new parallel competing reaction system for assessing micromixing efficiency—Experimental approach. Chem. Eng. Sci. 1996, 51, 5053–5064. [Google Scholar] [CrossRef]
- Falk, L.; Commenge, J.-M. Performance comparison of micromixers. Chem. Eng. Sci. 2010, 65, 405–411. [Google Scholar] [CrossRef]
- Commenge, J.-M.; Falk, L. Villermaux–Dushman protocol for experimental characterization of micromixers. Chem. Eng. Process. Process. Intensif. 2011, 50, 979–990. [Google Scholar] [CrossRef]
- Guichardon, P.; Falk, L. Characterisation of micromixing efficiency by the iodide–iodate reaction system. Part I: Experimental procedure. Chem. Eng. Sci. 2000, 55, 4233–4243. [Google Scholar] [CrossRef]
- Guichardon, P.; Falk, L.; Villermaux, J. Characterisation of micromixing efficiency by the iodide–iodate reaction system. Part II: Kinetic study. Chem. Eng. Sci. 2000, 55, 4245–4253. [Google Scholar] [CrossRef]
- Baldyga, J.; Bourne, J.R.; Walker, B. Non-isothermal micromixing in turbulent liquids: Theory and experiment. Can. J. Chem. Eng. 1998, 76, 641–649. [Google Scholar] [CrossRef]
- Villermaux, J. Micromixing Phenomena in Stirred Reactors. In Encyclopedia of Fluid Mechanics; Gulf Publishing Company: Houston, TX, USA, 1986. [Google Scholar]
- Heidmann, M.F.; Priem, R.J.; Humphrey, J.C. NACA Technical Note No. 3835. In A Study of Sprays Formed by Two Impinging Jets; National Advisory Committee for Aeronautics: Moffett Field, CA, USA, 1957. [Google Scholar]
- Dombrowski, N.D.; Hooper, P.C. A study of the sprays formed by impinging jets in laminar and turbulent flow. J. Fluid Mech. 1964, 18, 392. [Google Scholar] [CrossRef]
- Huang, J.C.P. The break-up of axisymmetric liquid sheets. J. Fluid Mech. 1970, 43, 305. [Google Scholar] [CrossRef]
- Li, R.; Ashgriz, N. Characteristics of liquid sheets formed by two impinging jets. Phys. Fluids 2006, 18, 87104. [Google Scholar] [CrossRef] [Green Version]
- Choo, Y.-J.; Kang, B.-S. The velocity distribution of the liquid sheet formed by two low-speed impinging jets. Phys. Fluids 2002, 14, 622–627. [Google Scholar] [CrossRef]
- Ibrahim, E.A.; Przekwas, A.J. Impinging jets atomization. Phys. Fluids A Fluid Dyn. 1991, 3, 298. [Google Scholar] [CrossRef]
- Ashgriz, N. (Ed.) Handbook of Atomization and Sprays; Springer Science + Business Media, LLC: Toronto, ON, Canada, 2011; Volume 30, p. 685. [Google Scholar] [CrossRef]
- Choo, Y.J.; Kang, B.-S. A study on the velocity characteristics of the liquid elements produced by two impinging jets. Exp. Fluids 2003, 34, 655–661. [Google Scholar] [CrossRef]
- Men, Y.; Hessel, V.; Löb, P.; Lowe, H.; Werner, B.; Baier, T. Determination of the Segregation Index to Sense the Mixing Quality of Pilot- and Production-Scale Microstructured Mixers. Chem. Eng. Res. Des. 2007, 85, 605–611. [Google Scholar] [CrossRef]
- Panić, S.; Löbbecke, S.; Tuercke, T.; Antes, J.; Boskovic, D. Experimental approaches to a better understanding of mixing performance of microfluidic devices. Chem. Eng. J. 2004, 101, 409–419. [Google Scholar] [CrossRef]
Figure 1.
Laboratory setup diagram for micromixing research in an impinging jet micro-reactor with housing (a) and geometry of the liquid sheet (b): 1-housing of a microreactor with free impinging jets (MRFIJ); 2-nozzles; 3-TOPSFLO gear pumps for supplying solutions of initial components; 4-VISION® 1005 2F66 flow meters with ILR750T 56,704 measuring block; 5-jets of solutions 1 and 2, 6-zone of active mixing of solutions 1 and 2 (volume Vi); 7-liquid sheet (volume Ve); 8, 9–feeding flasks solutions; 10-tank for collecting reaction products. 2θ = 107°.
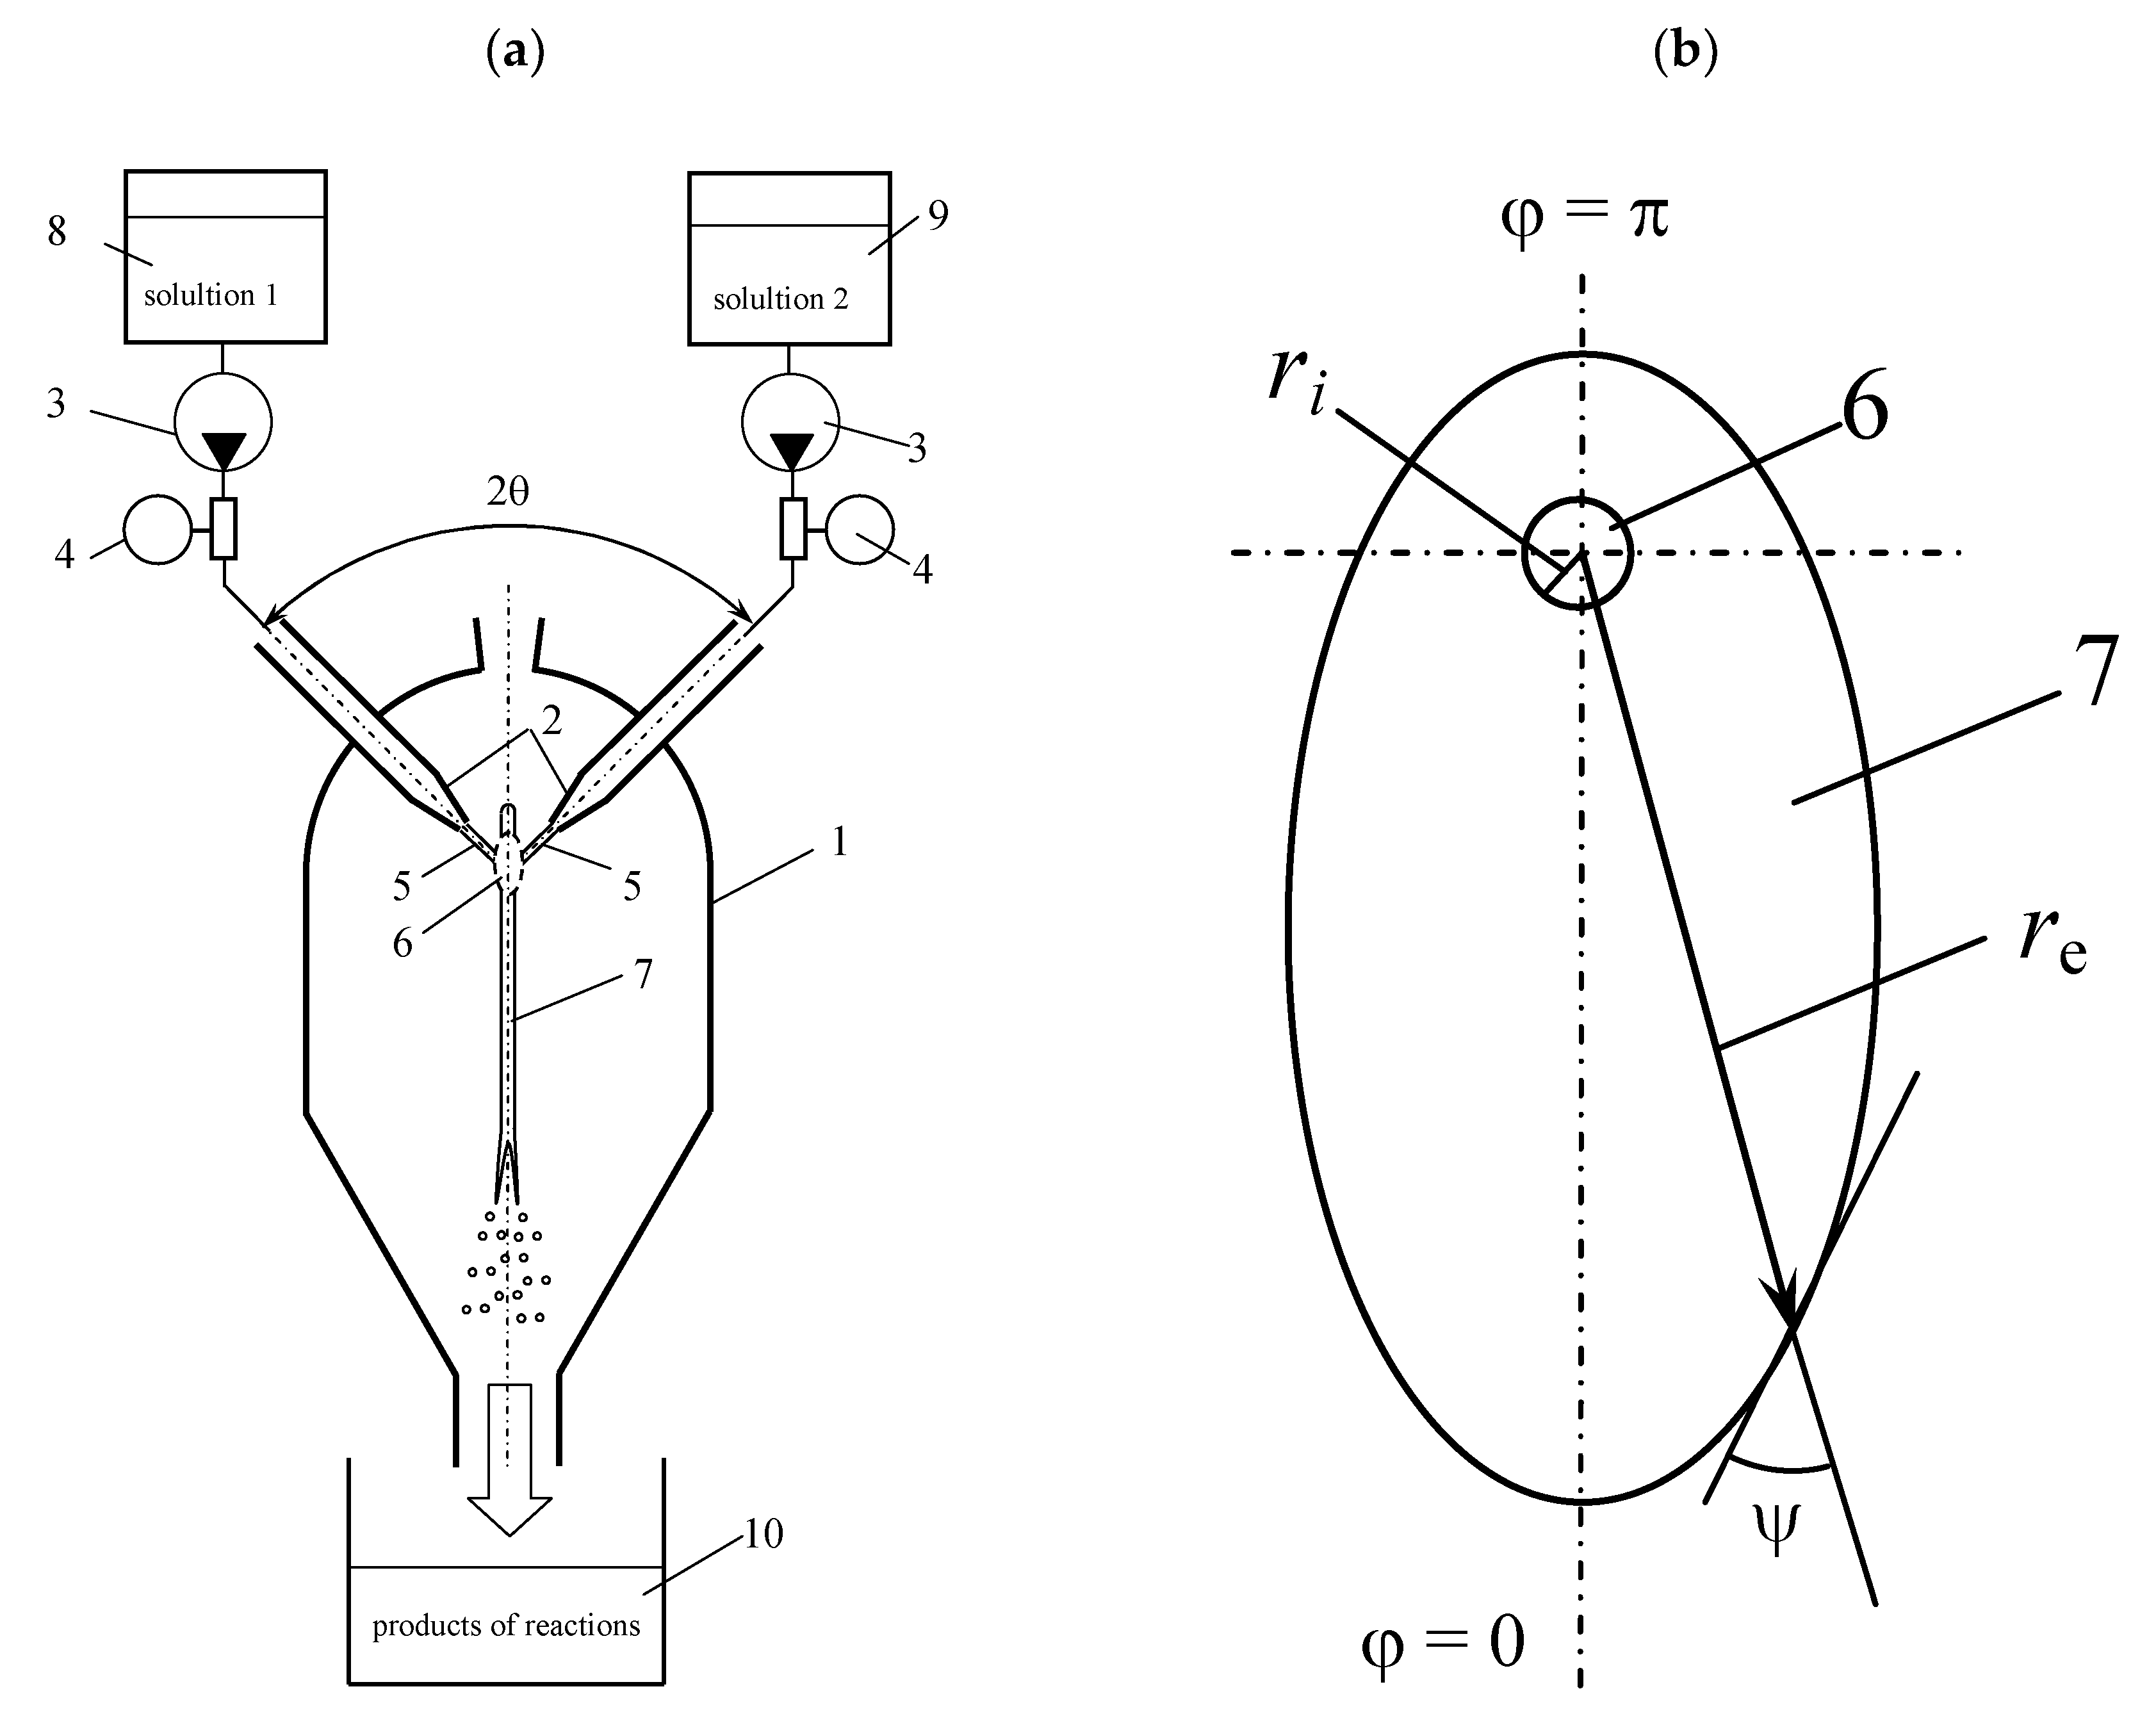
Figure 2.
Photograph of the laboratory setup for studying the geometry and conditions for the formation and decomposition of the liquid sheet from open-frame MRFIJ. 2θ = 97.5°, dj = 1.0 mm. The distance between the nozzles is B = 25 mm. Distance from the exit from the nozzle to the point of collision L = 17 mm.
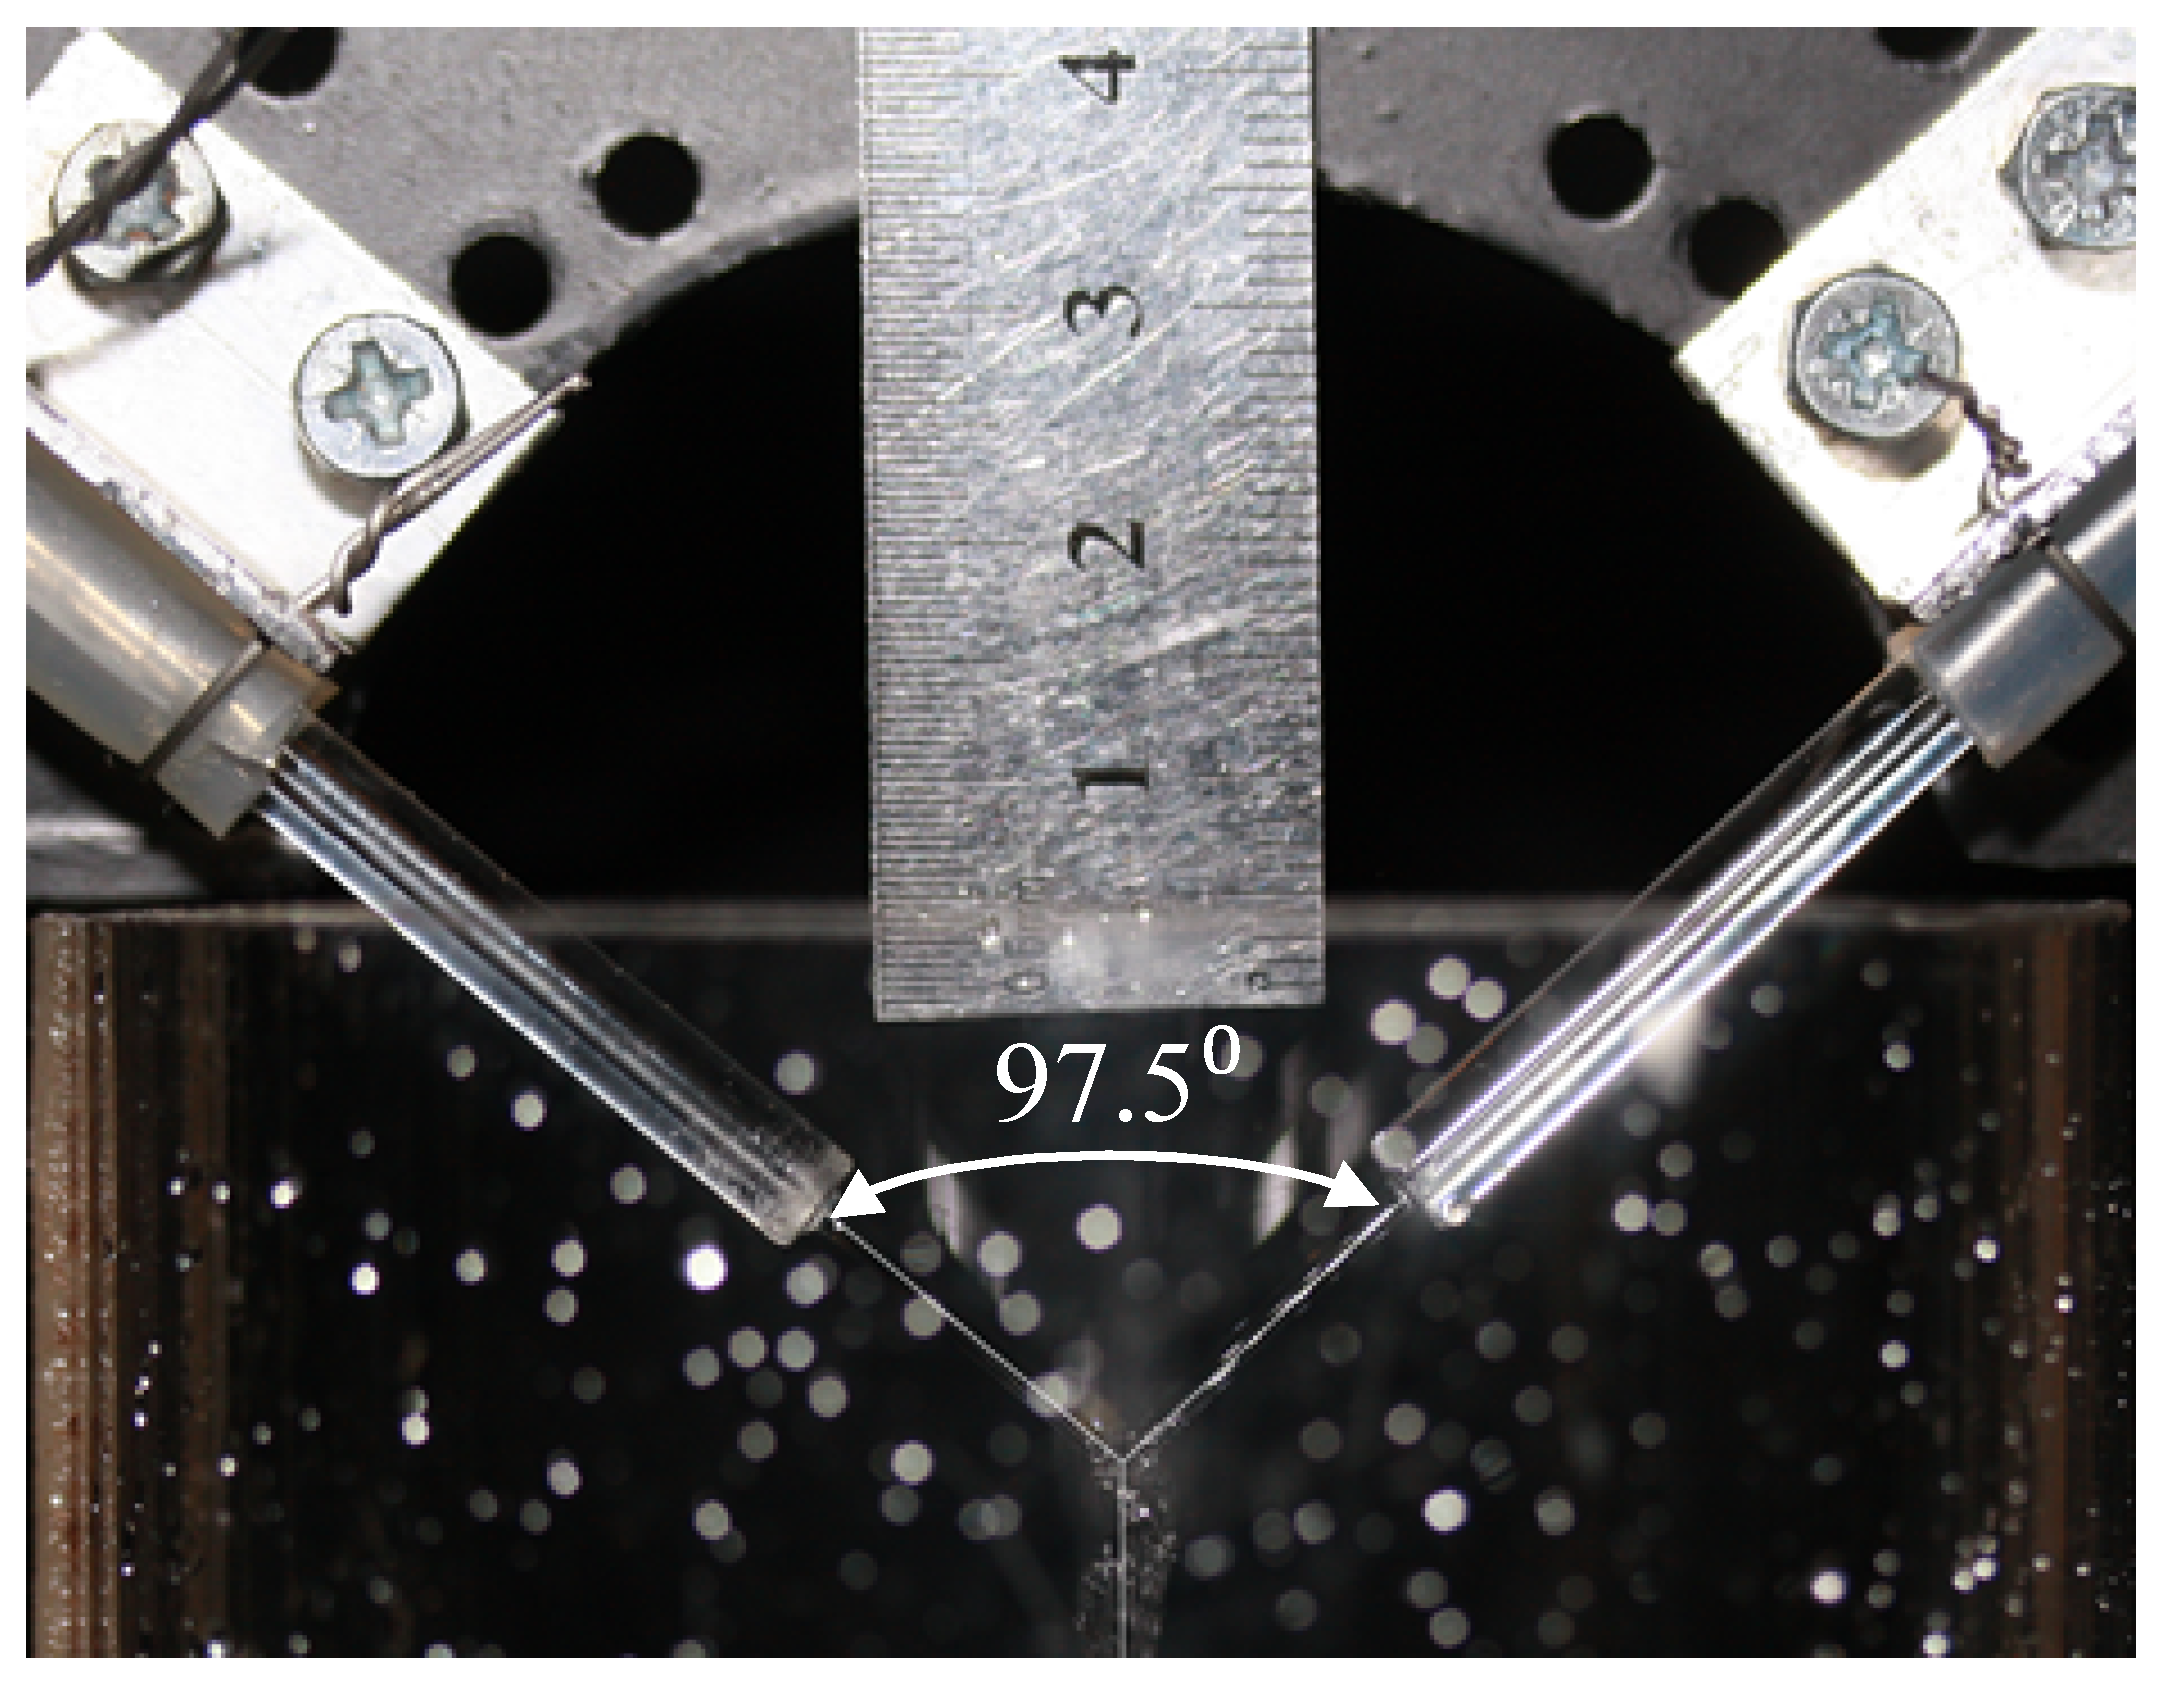
Figure 3.
Open-frame laboratory setup for the study of micromixing with differential sampling of reaction products directly under the jet collision zone and at the periphery: 1—MRFIJ glass case; 2—nozzles (glass tubes with 1 mm inner diameter); 3—TOPSFLO gear pumps; 4—flowmeters VISION® 1005 2F66 with indicator ILR750T 56704; 5—zone of jets collision; 6—zone of dispersion of splashes to the walls of the reactor; 7—glass cylinder for collecting liquid from the zone of collision of jets; 8—annular zone for collecting liquid from splashes; 9, 10—branch pipes for reaction products removal; 11—holder of the nozzles. 2θ = 97.5°.
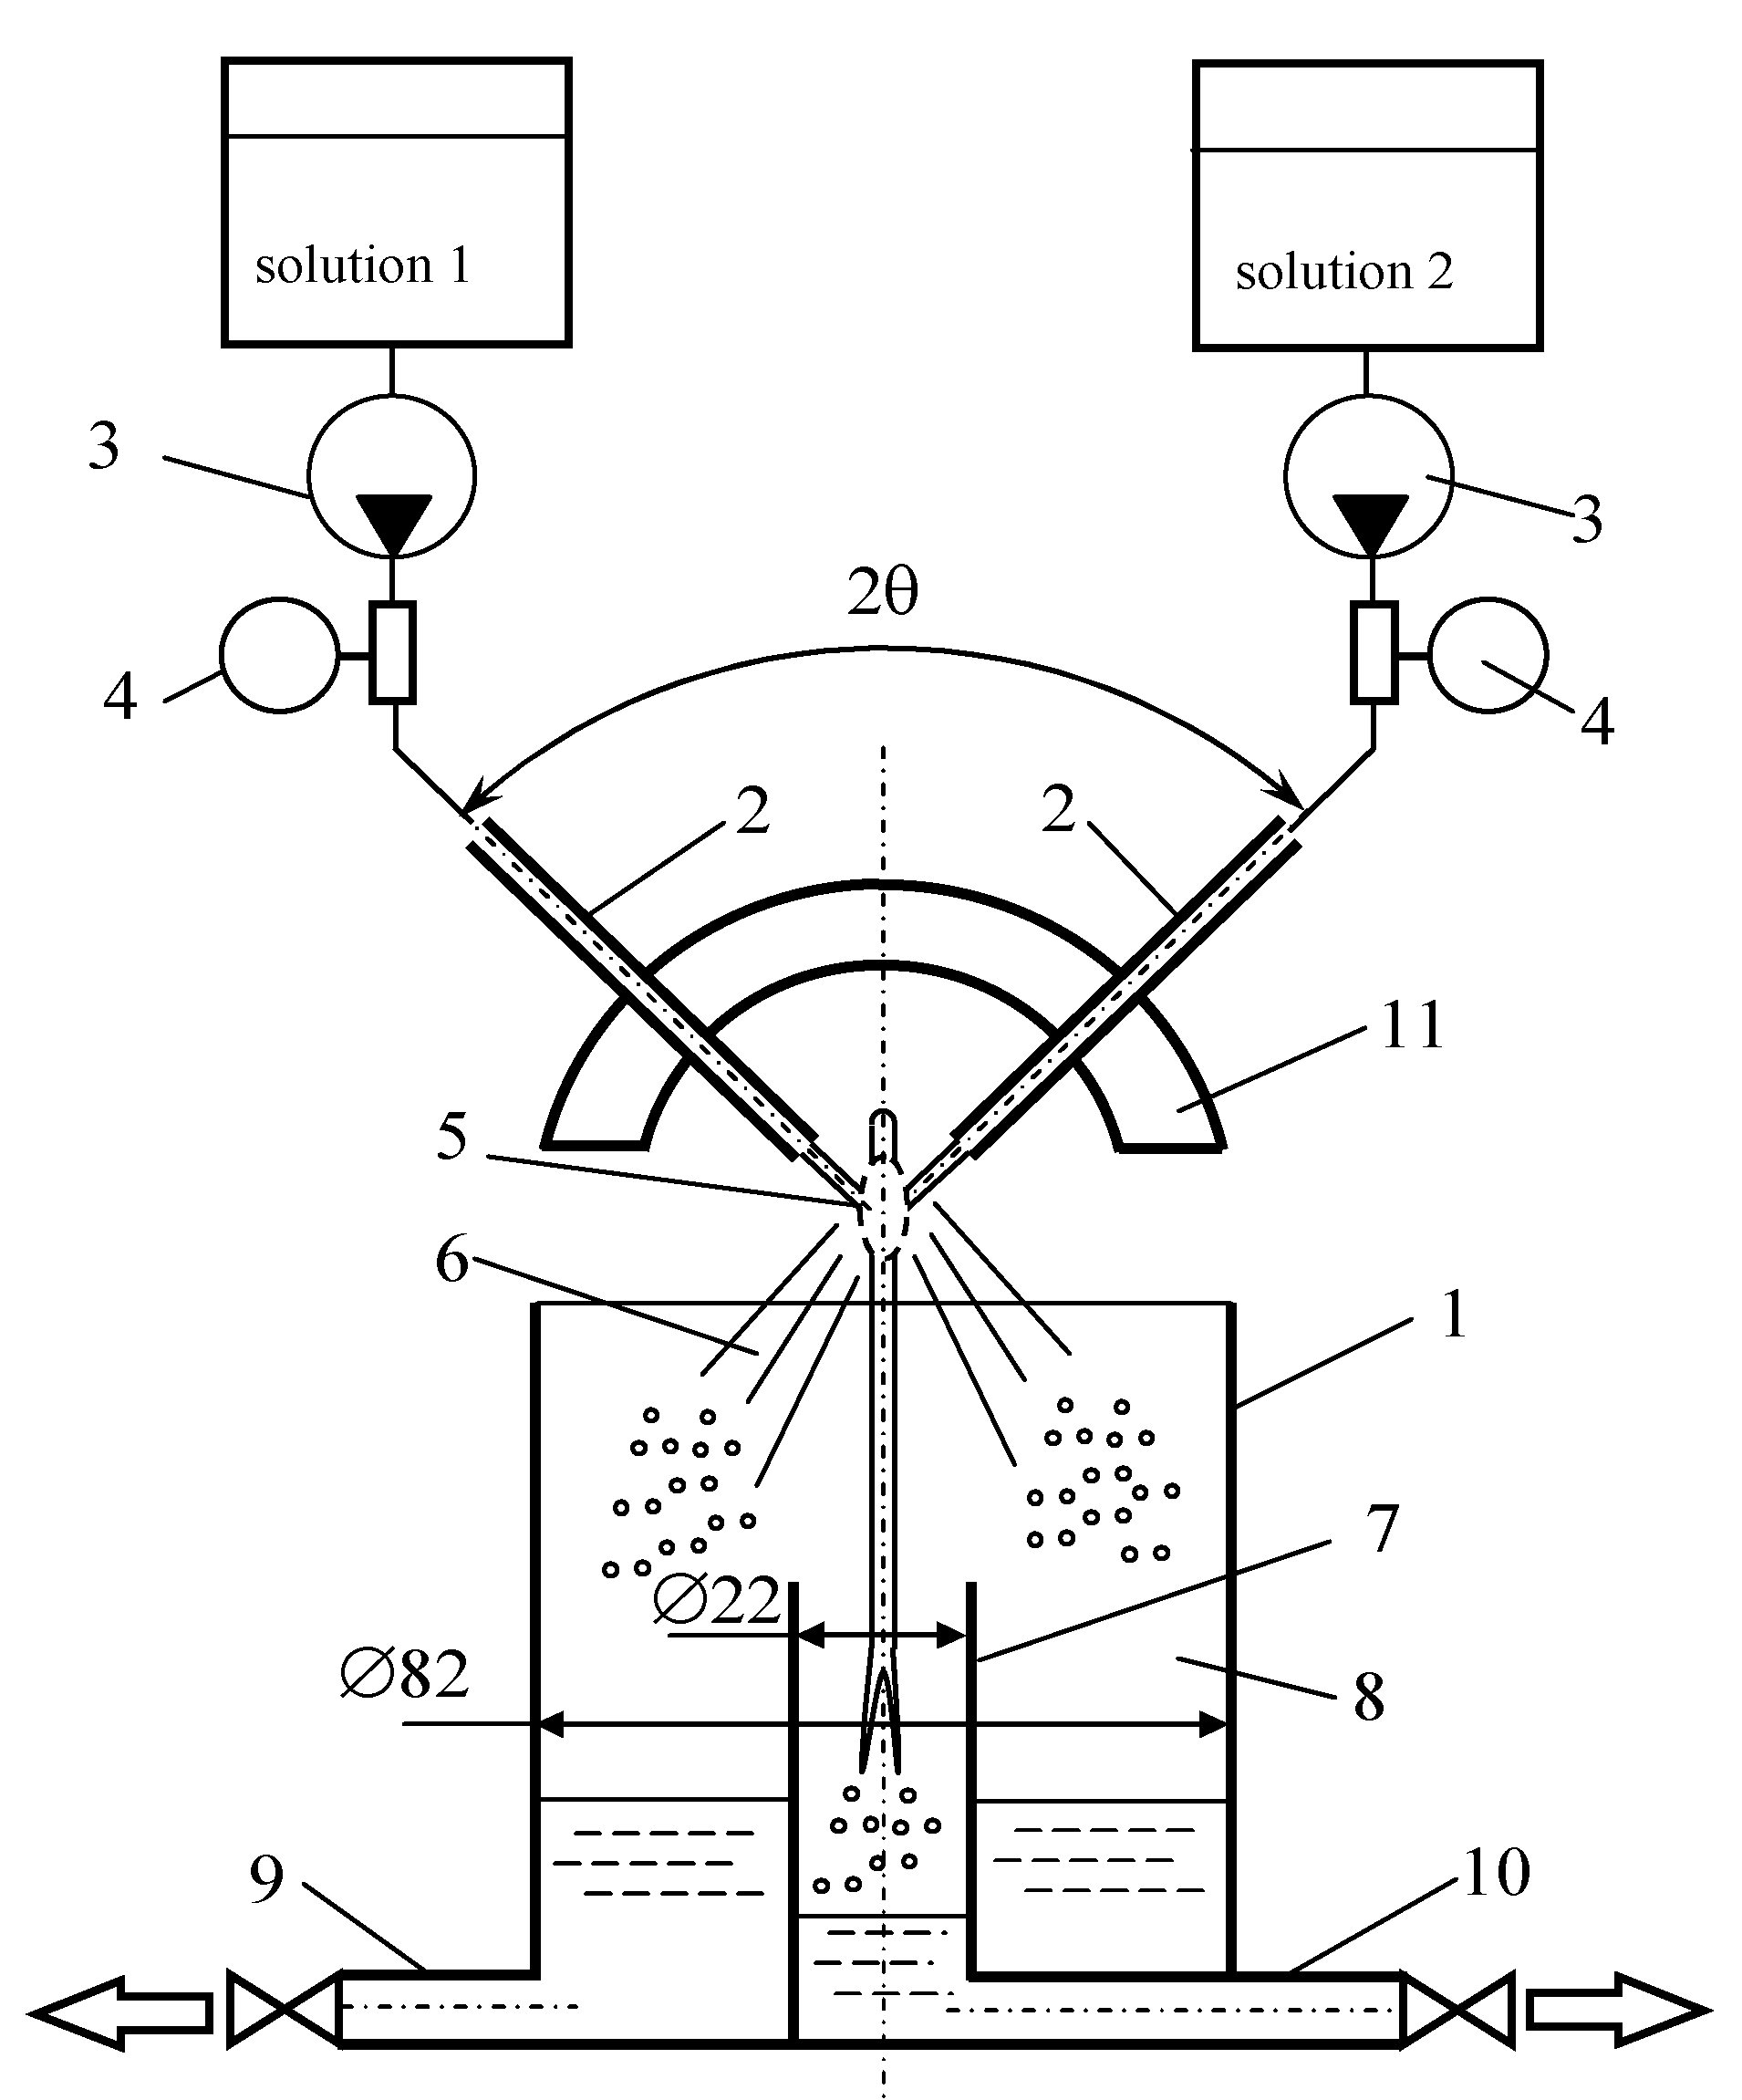
Figure 4.
The results of an iodide-iodate technique—the dependence of the segregation coefficient Xs in the solution at the outlet of MRFIJ (2θ = 107°, dj = 1.0 mm, T = 21 °C) on the pump flow rate Q1 = Q2. 1-distilled water; 2-deionized water. I-V–characteristic zones of triiodide concentration variations.
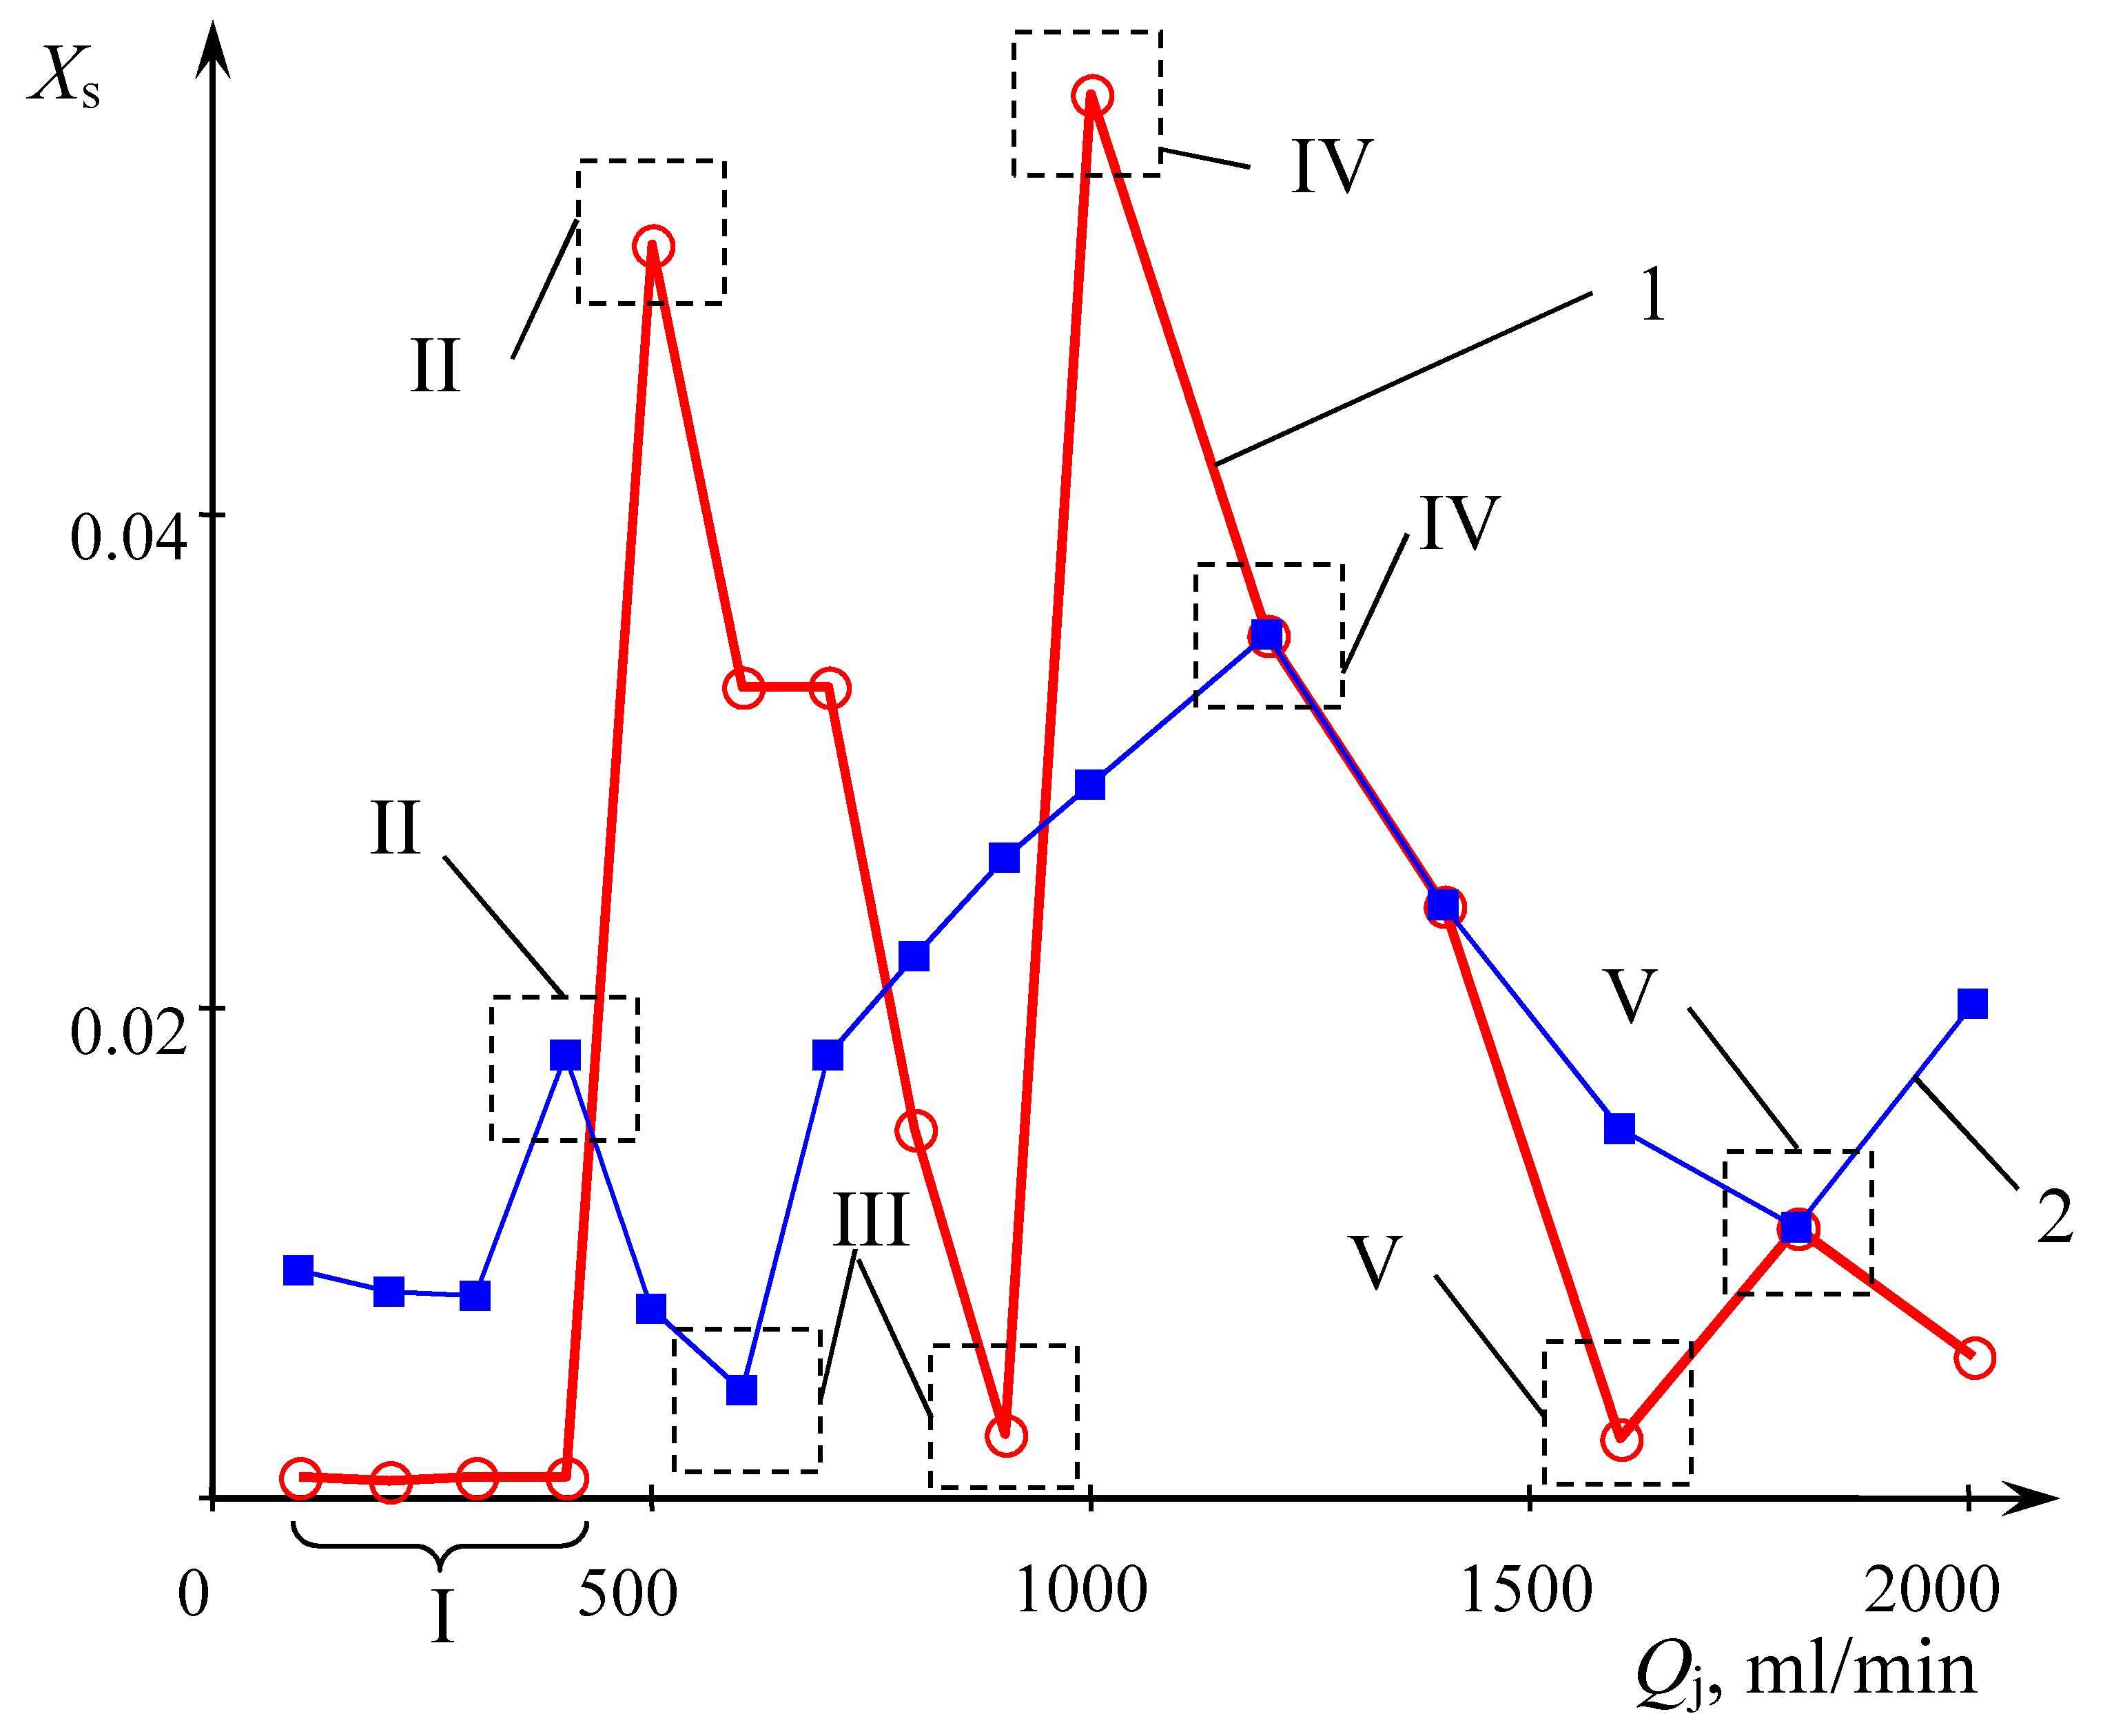
Figure 5.
Photo of liquid sheet in the open-frame MRFIJ at 2θ = 97.5°, dj = 1.0 mm, T = 21 °C. Flow rate of water from each nozzle, mL/min: (1)—100, (2)—200, (3)—300, (4)—400, (5)—500, (6)—600, (7)—800, (8)—1000, (9)—1200, (10)—1400, (11)—1600, (12)—1800, (13)—2000.
Figure 5.
Photo of liquid sheet in the open-frame MRFIJ at 2θ = 97.5°, dj = 1.0 mm, T = 21 °C. Flow rate of water from each nozzle, mL/min: (1)—100, (2)—200, (3)—300, (4)—400, (5)—500, (6)—600, (7)—800, (8)—1000, (9)—1200, (10)—1400, (11)—1600, (12)—1800, (13)—2000.
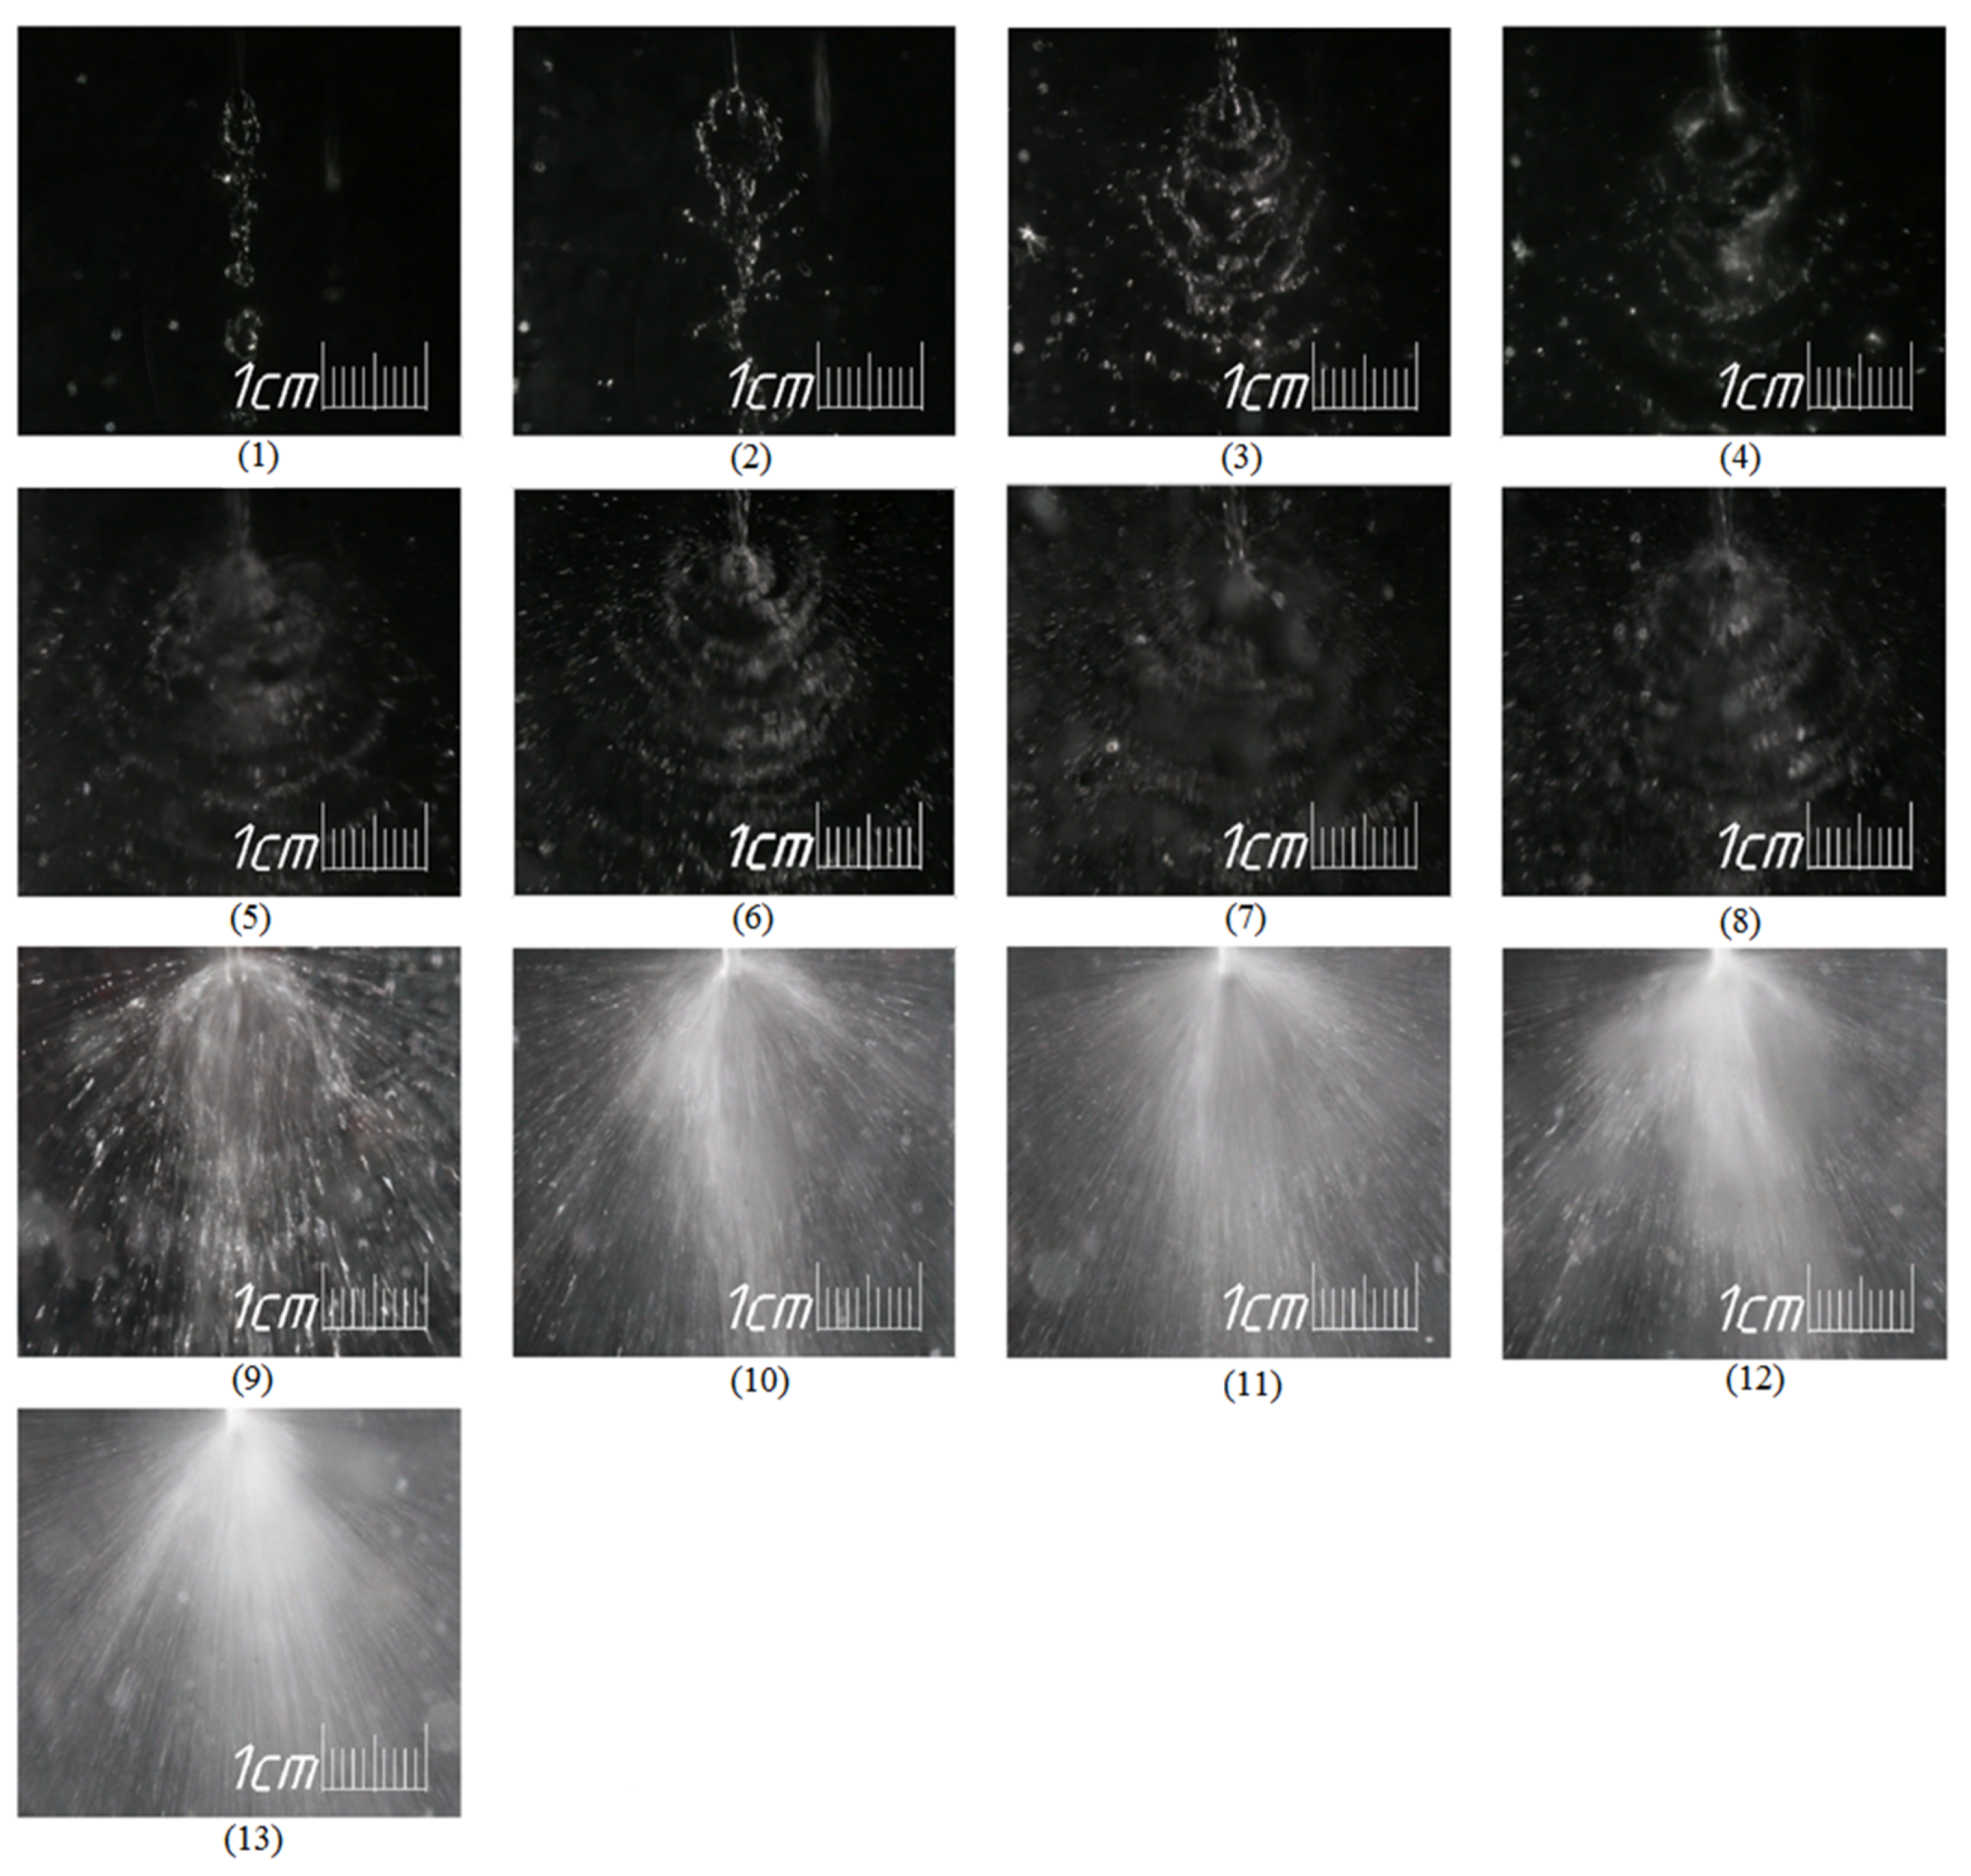
Figure 6.
Dependence of the triiodide concentration [I3−] (mmol/l) in samples taken in the center and at the periphery of the MRFIJ on the time since the preparation of the initial solutions (Ic is the concentration in the center and Ip is the concentration at the periphery; the numbers (100–2000) correspond to the jets flow rate Qj, mL/min). 2θ = 97.5°.
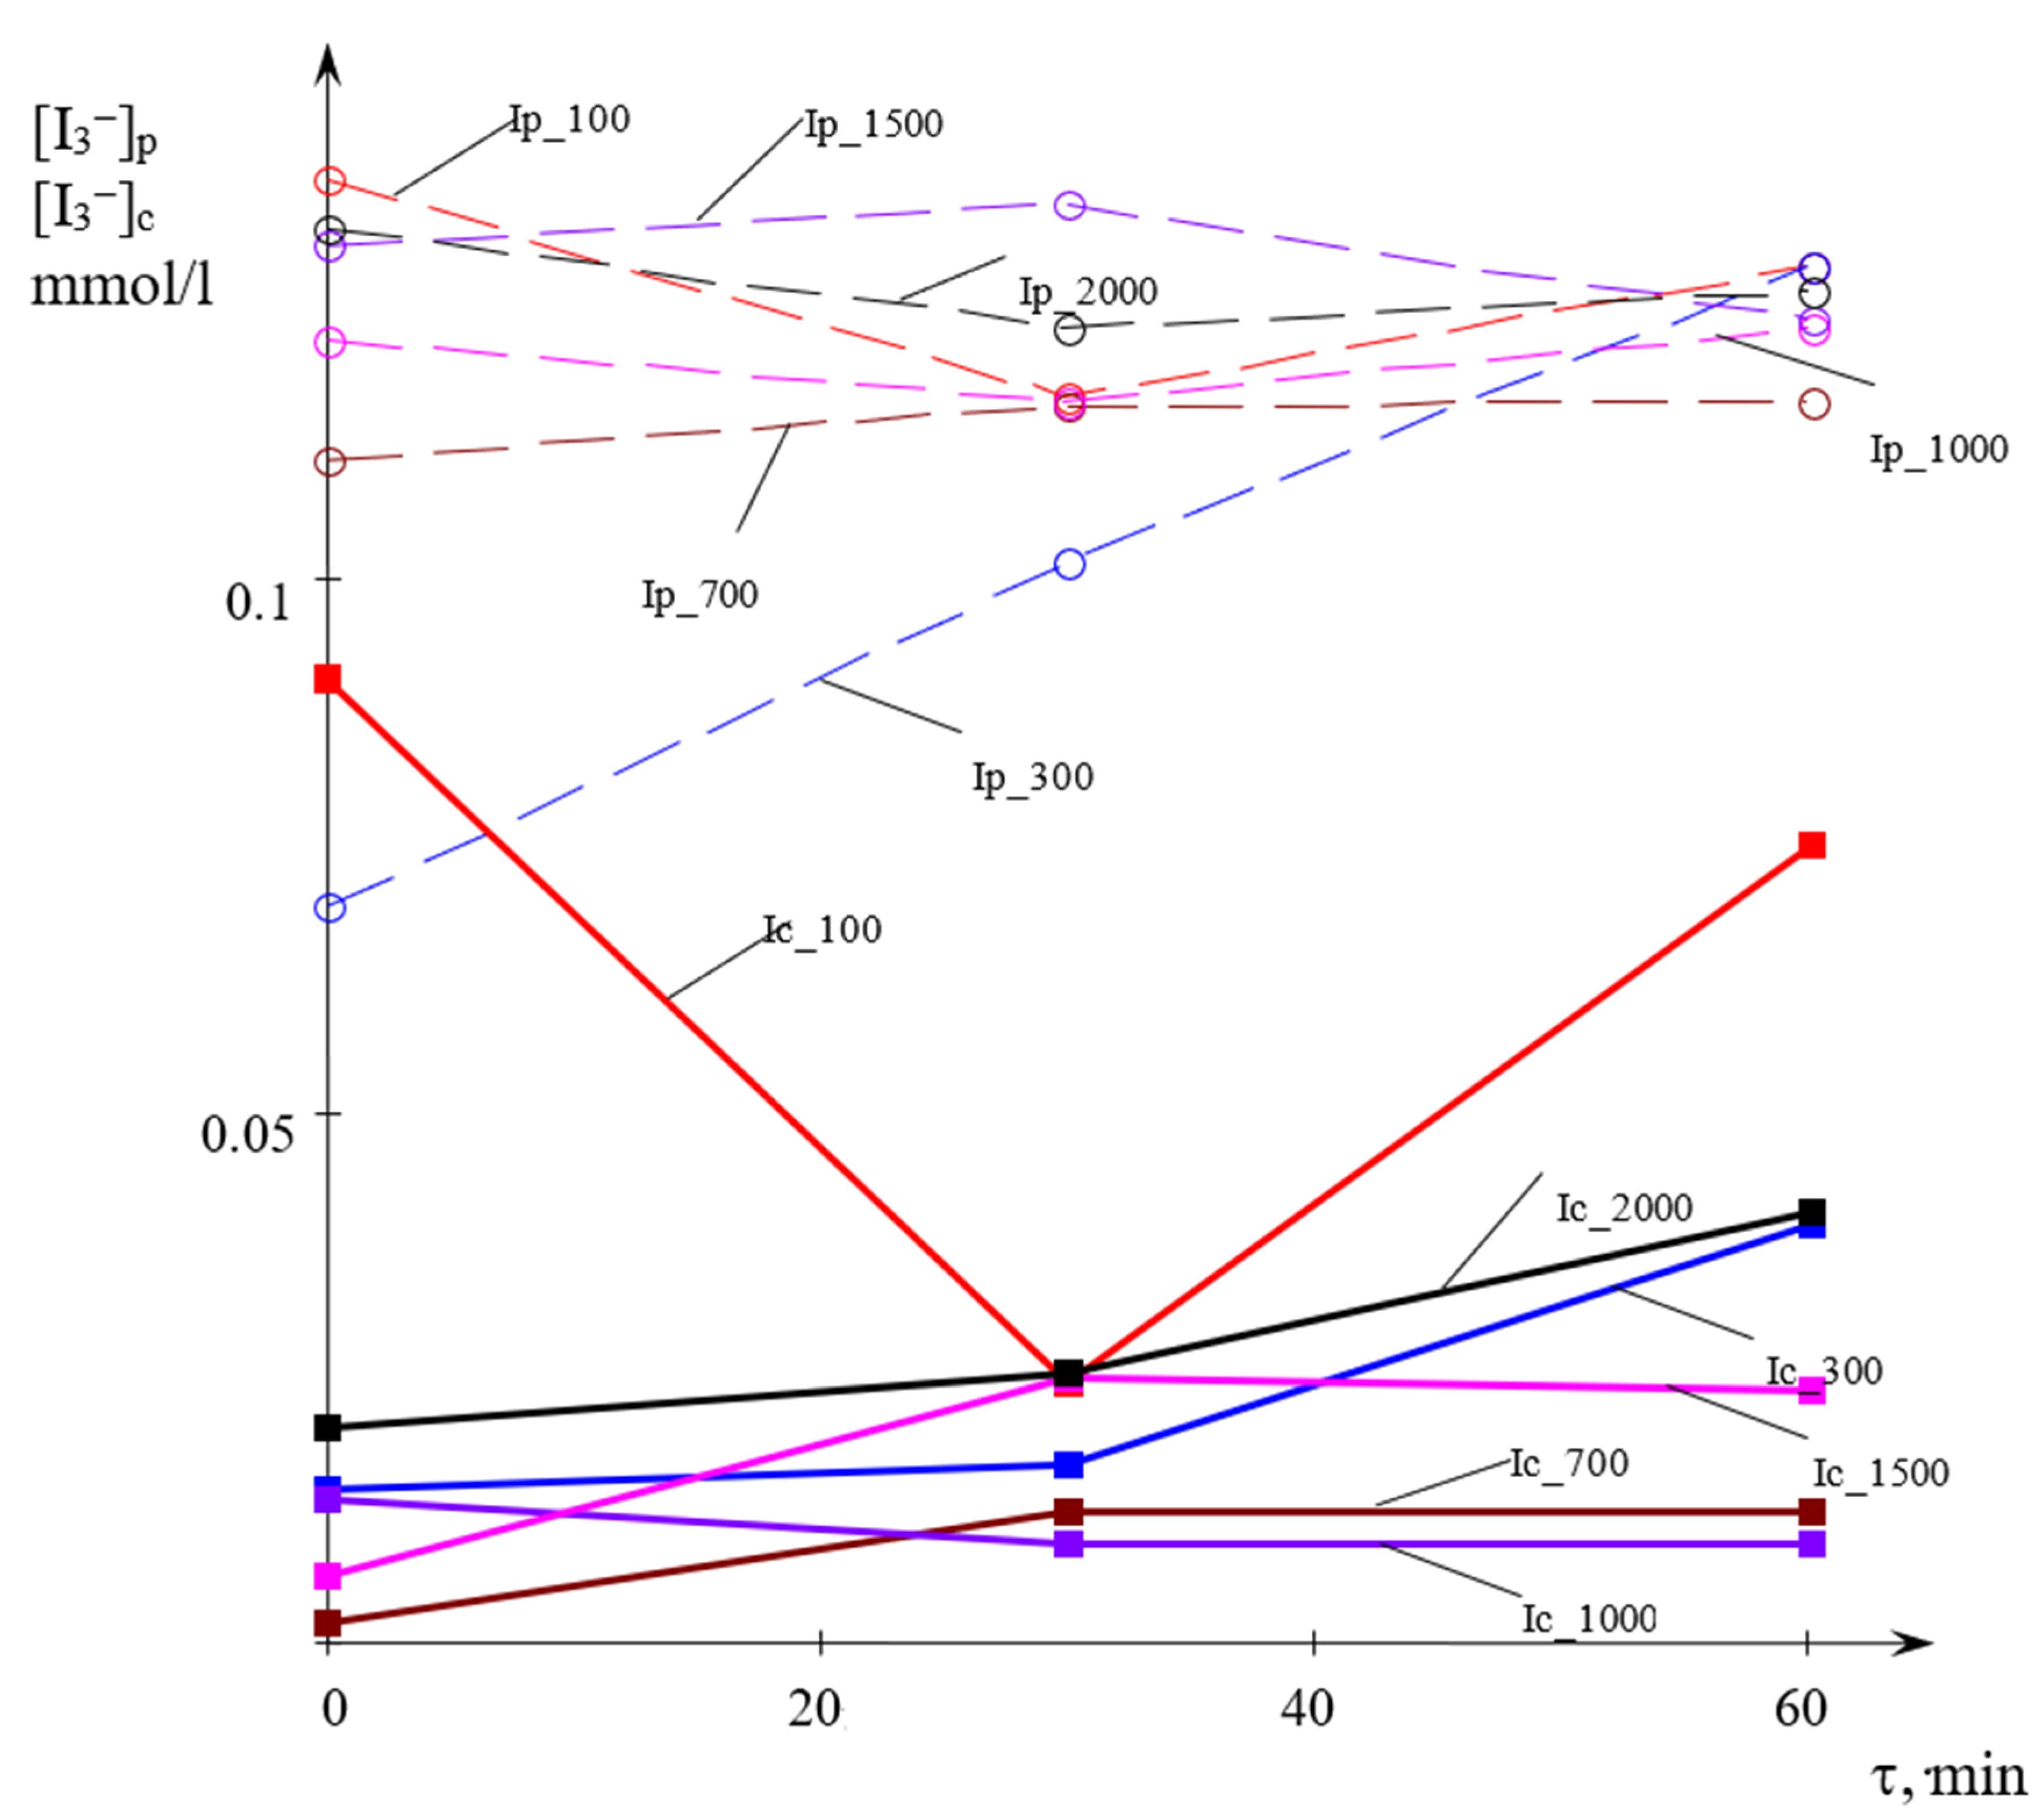
Figure 7.
The dependence of the mass fraction of liquid samples collected in the center φ (a), the segregation coefficient Xs (b), and the relative volume of ideal mixing α (c) on the jets flow rates Qj (mL/min) in MRFIJ (Figure 3, 2θ = 97.5°, dj = 1.0 mm, T = 21 °C) in samples: Xs_c, αc–in the center; Xs_per, αper–at the periphery; Xs_m, αm–weighted average.
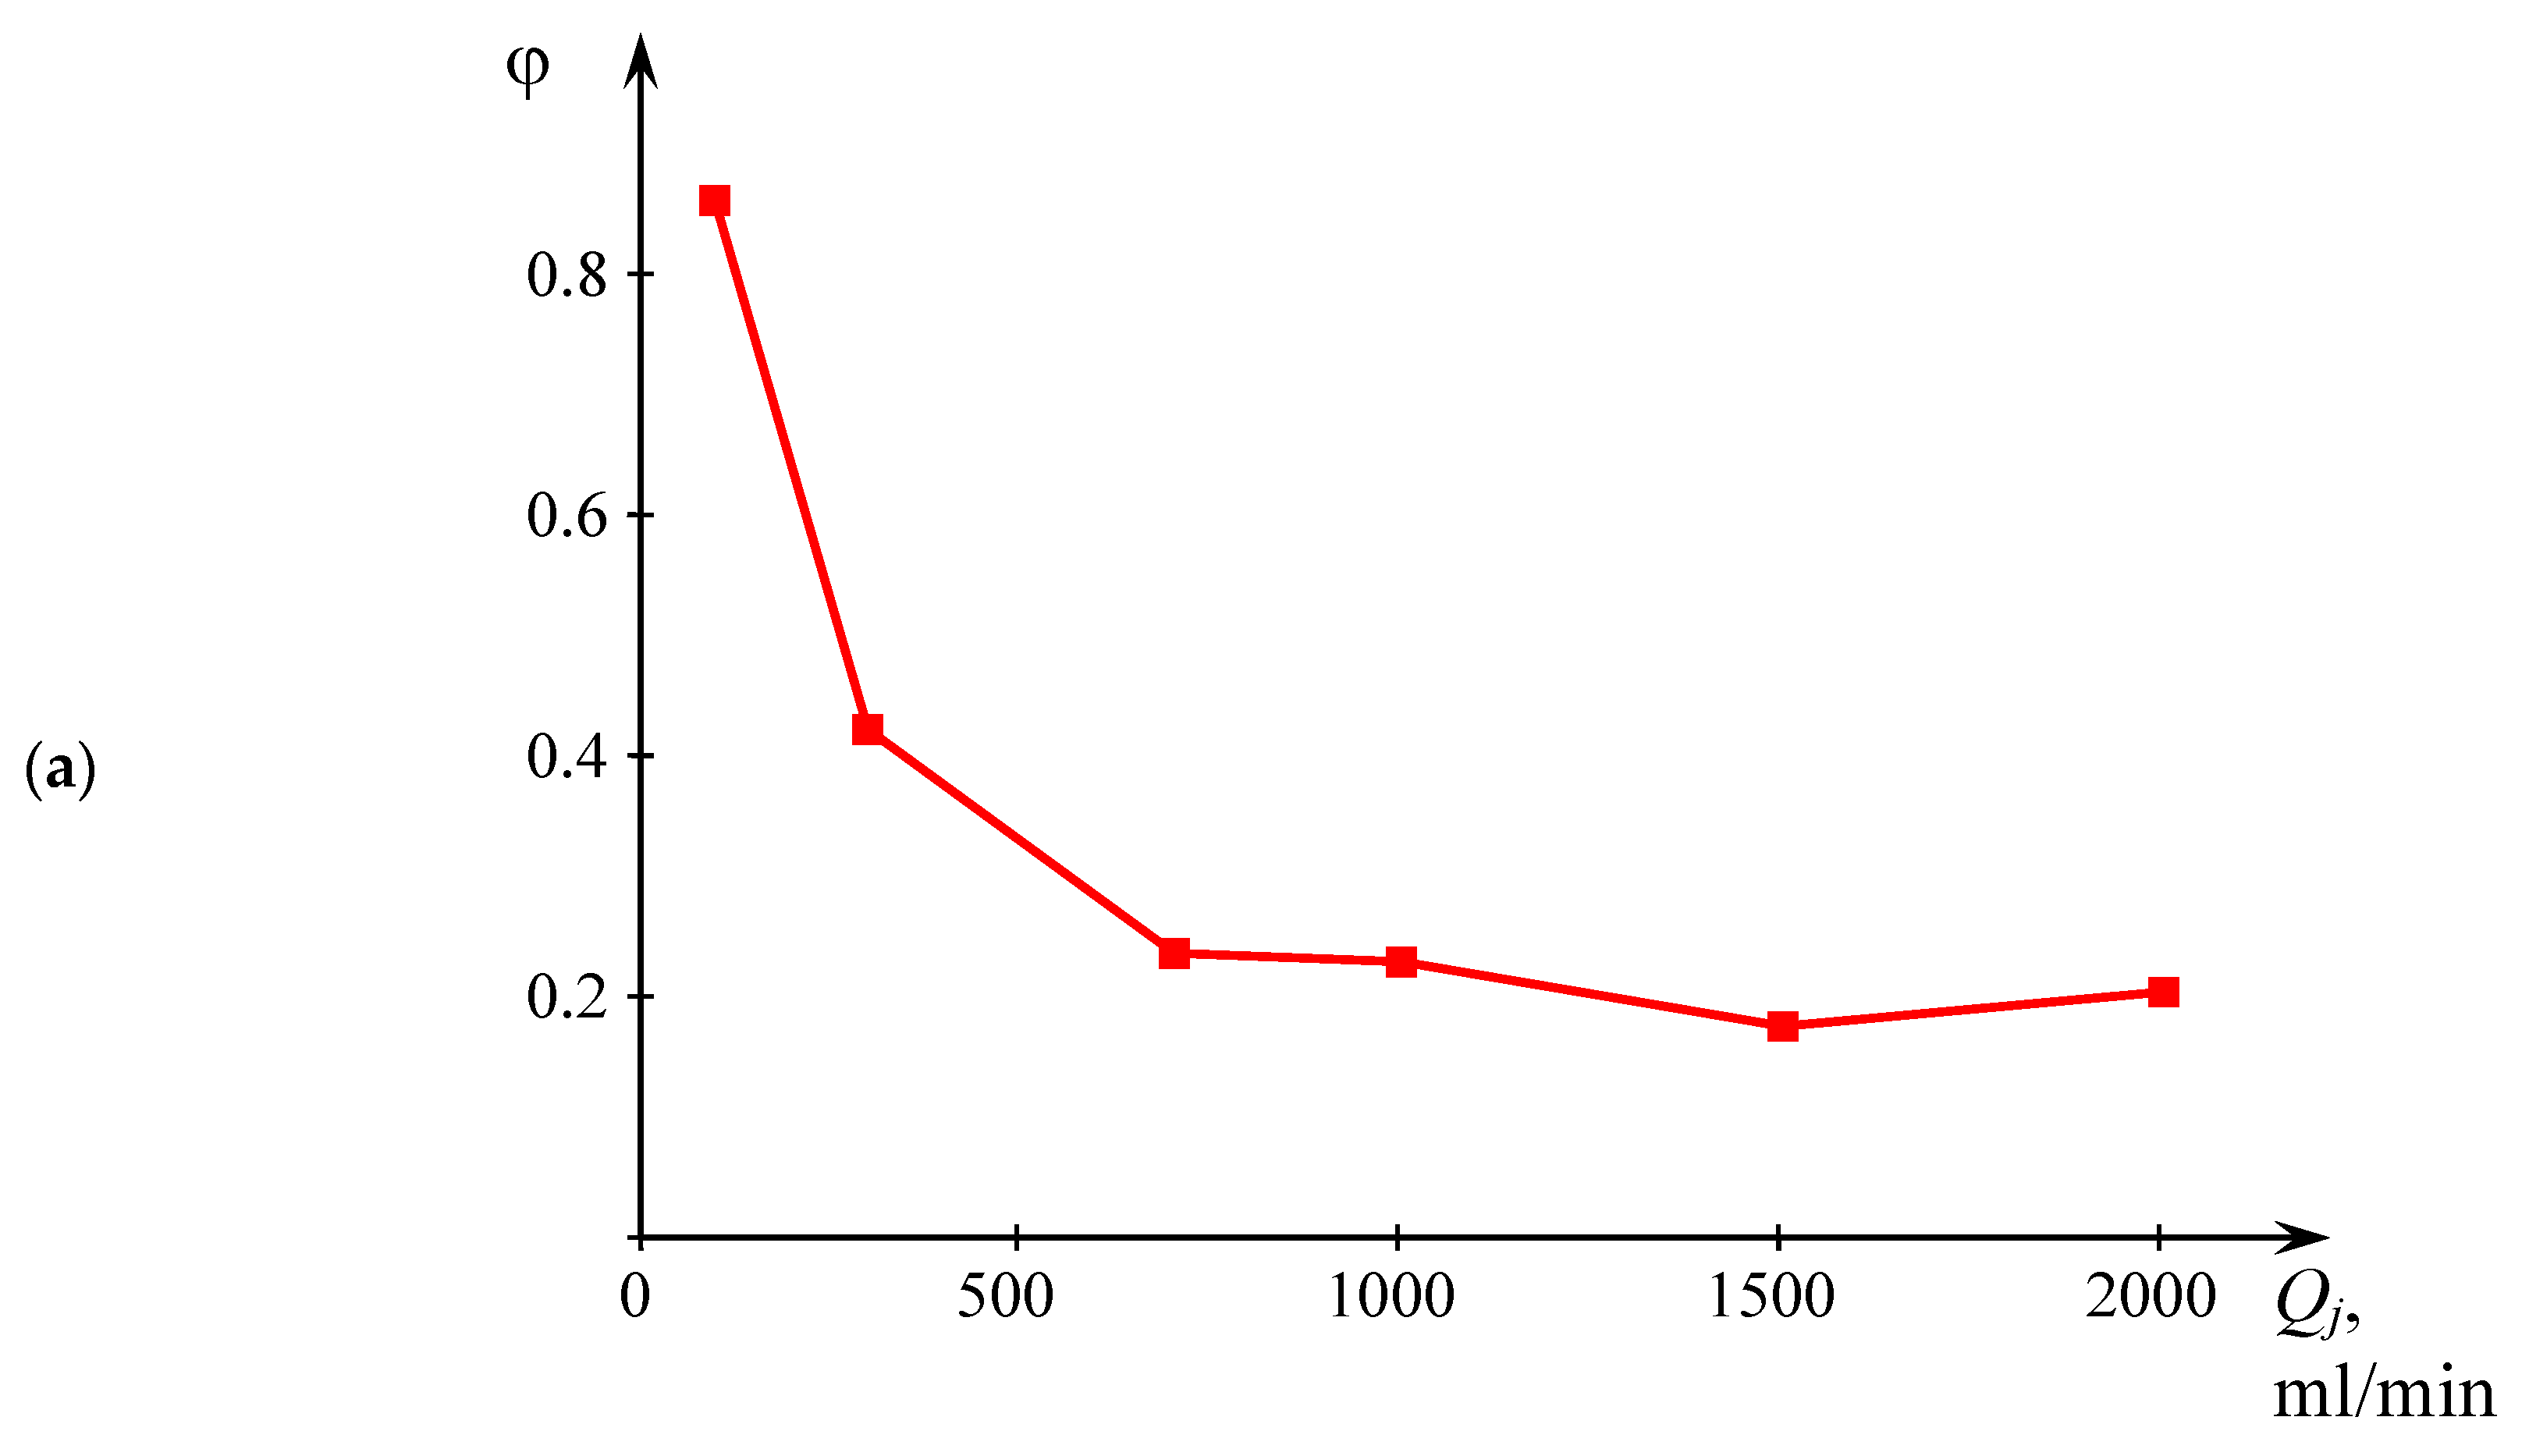
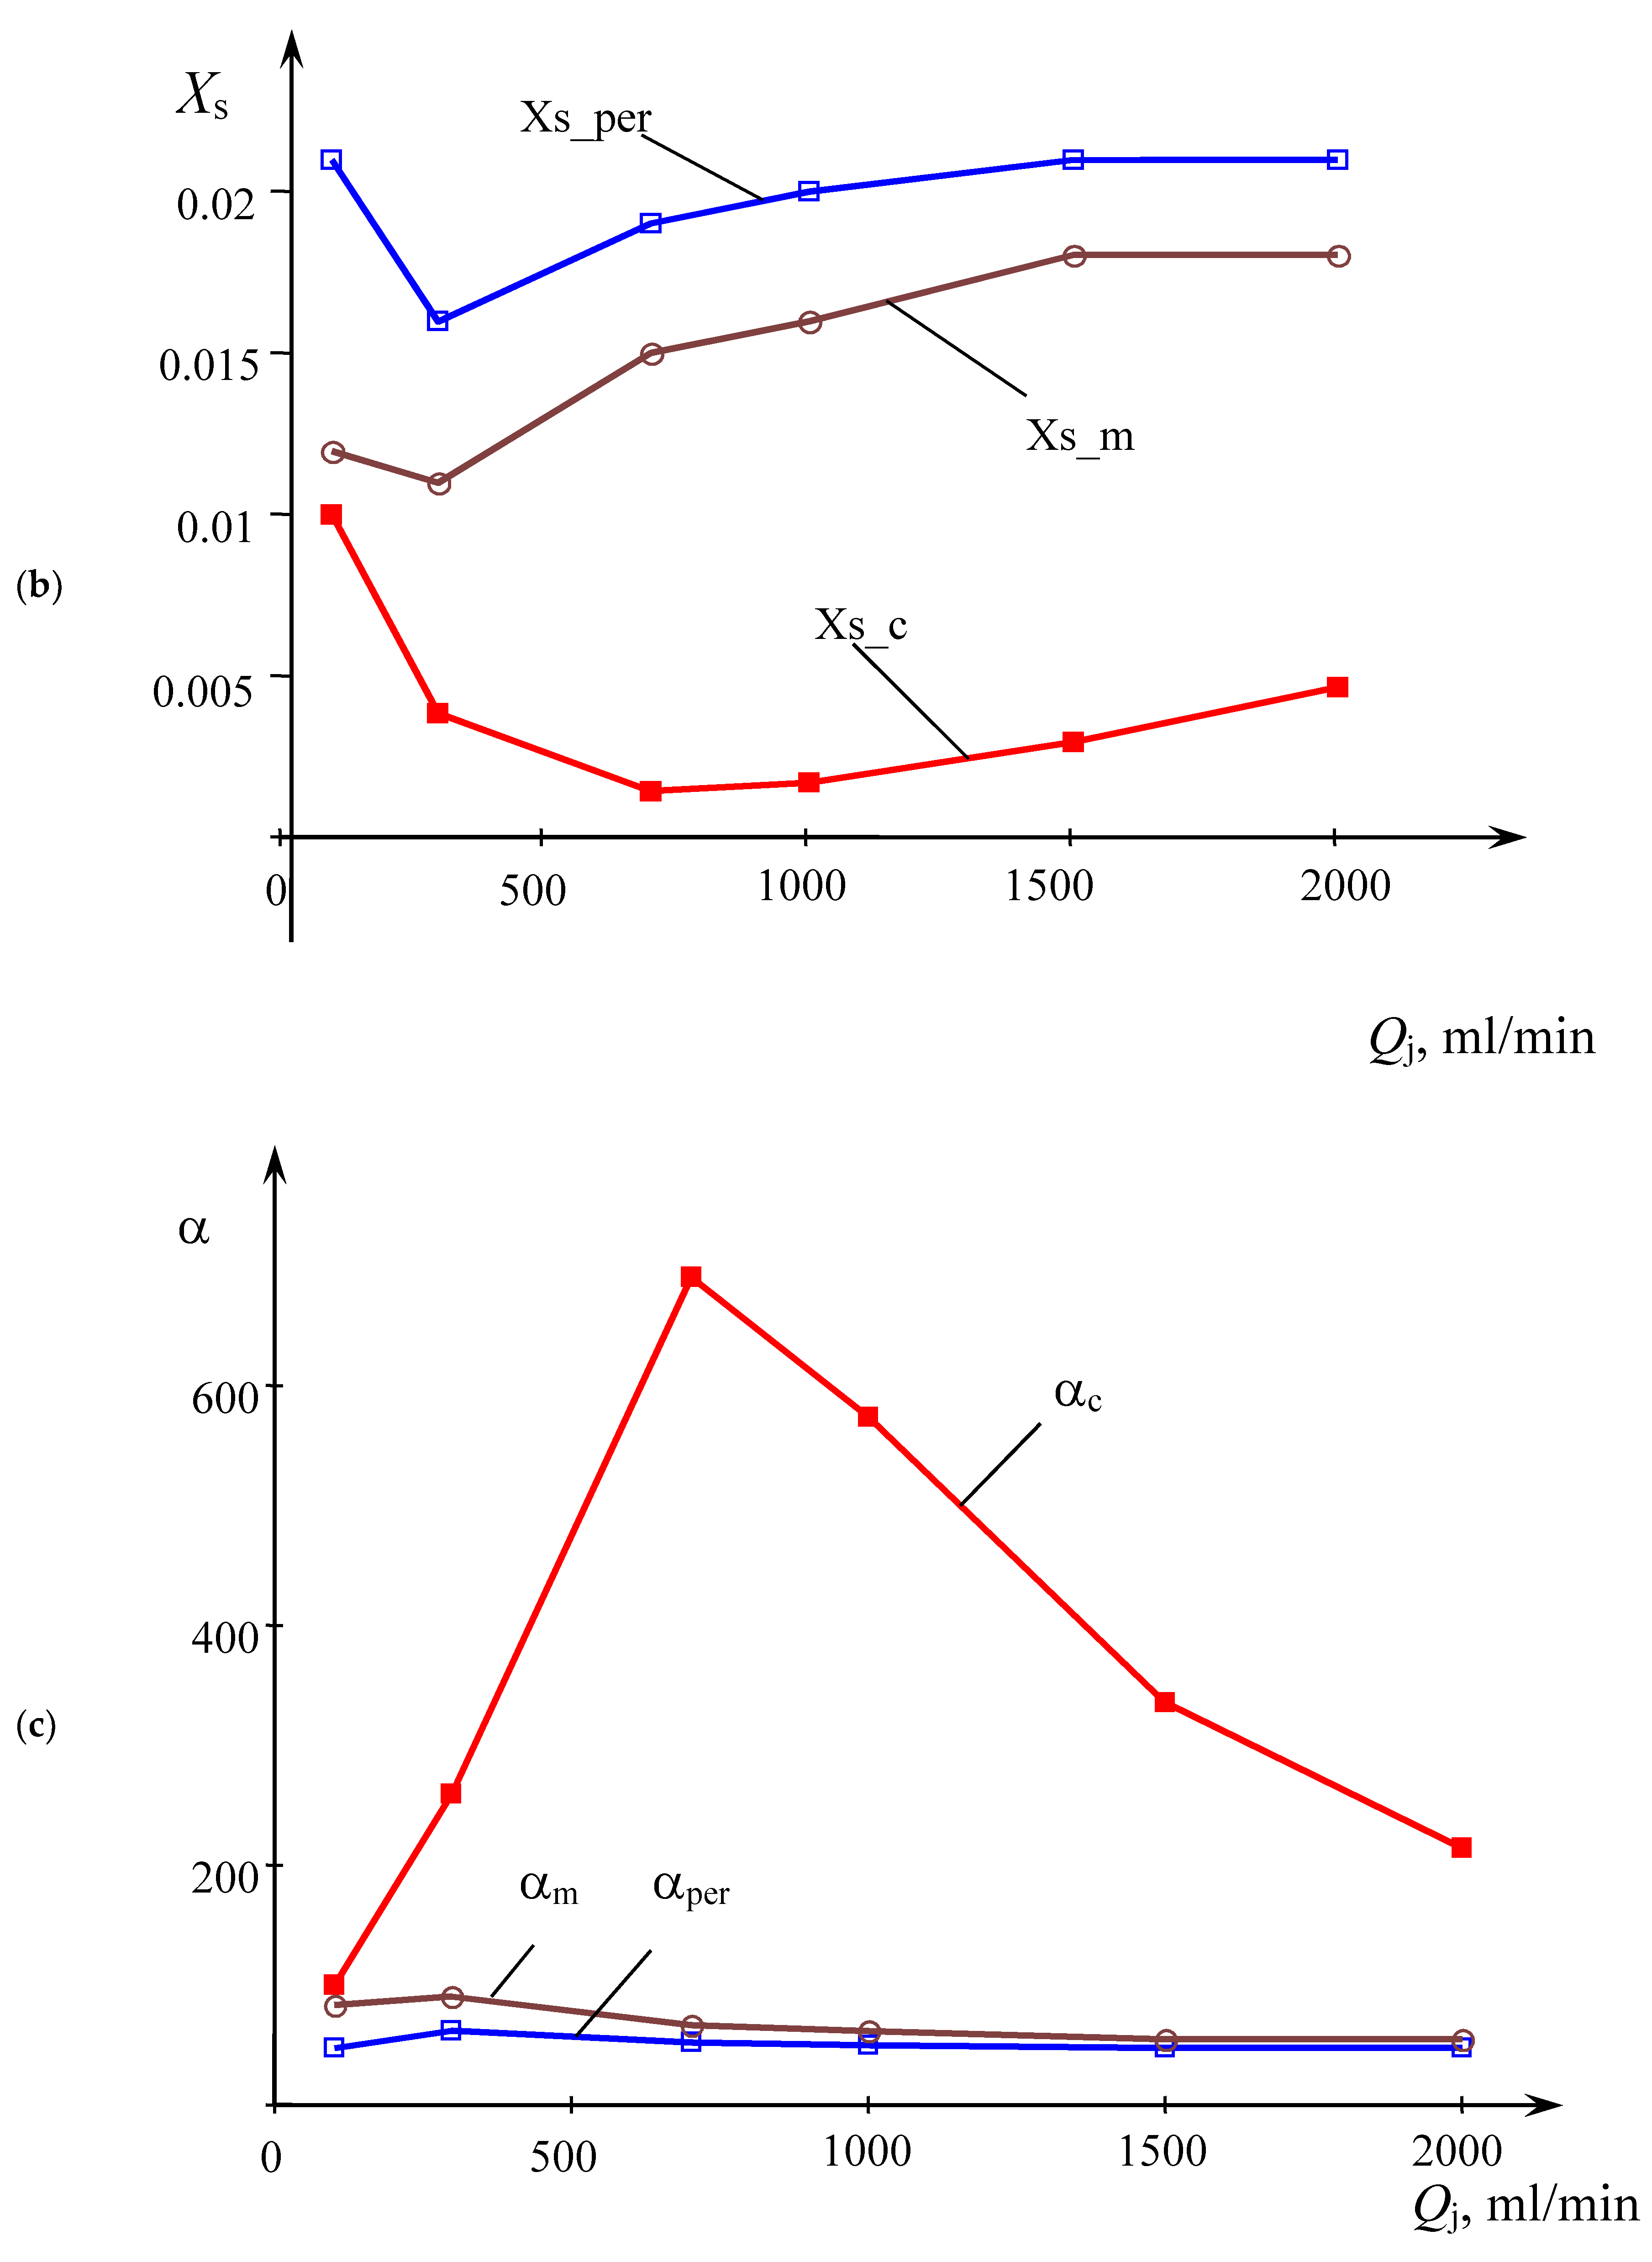
Figure 8.
Schematic view illustrating a mechanism for separating the mixture into zones of intense and poor micromixing: 1—nozzle; 2—jets; 3—velocity profile at the nozzle outlet; 4—stream core (central zone of jets); 5—wall laminar layer (annular zone of jets); 6—the upper part of the liquid sheet; 7—zone of collision of flow cores; 8—core of the lower part of the liquid sheet; 9—outer layers of the lower part of the liquid sheath; 10—side ligaments; 11—drops. Flow rates: (a)—Qj < 700 mL/min; (b)—Qj ≥ 700 mL/min. I-central sampling area; II—peripheral sampling area. Orange—the sample with good micromixing, blue—the sample with poor mixing.

Table 1.
Influence of the angle between the jets 2θ on the maximum (max(wr)) and average (mean(wr)) velocity of the ligaments (data determined from the graphs in [26]) as well as the fraction of dissipated energy Pdiss/Pin (dj = 1 mm).
Table 1.
Influence of the angle between the jets 2θ on the maximum (max(wr)) and average (mean(wr)) velocity of the ligaments (data determined from the graphs in [26]) as well as the fraction of dissipated energy Pdiss/Pin (dj = 1 mm).
| 2θ | 120° | 100° | 80° |
|---|---|---|---|
| Ligaments, wj = 6.76 m/s | |||
| max(wr) | 4.5 | 5.2 | 5.75 |
| mean(wr) | 4.0 | 4.75 | 5.0 |
| Pdiss/Pin | 0.65 0 | 0.506 | 0.453 |
| Drops, wj = 3.35 m/s | |||
| max(wr) | 2.8 | 3.2 | 3.6 |
| mean(wr) | 2.0 | 2.2 | 2.4 |
| Pdiss/Pin | 0.644 | 0.569 | 0.487 |
Table 2.
Possible combinations of reagent concentrations for use in the experimental determination of the quality of micro-mixing in microreactors [14].
Table 2.
Possible combinations of reagent concentrations for use in the experimental determination of the quality of micro-mixing in microreactors [14].
| Number of Combinations of Concentrations of Reactants | ||||||
|---|---|---|---|---|---|---|
| Concentration, mol/L | 1 | 1b | 1c | 2 | 2b | 2c |
| [H−] | 0.03 | 0.06 | 0.04 | 0.015 | 0.03 | 0.02 |
| [KI] | 0.032 | 0.032 | 0.032 | 0.016 | 0.016 | 0.016 |
| [KIO3] | 0.006 | 0.006 | 0.006 | 0.003 | 0.003 | 0.003 |
| [NaOH] | 0.09 | 0.09 | 0.09 | 0.045 | 0.045 | 0.045 |
| [H3BO3] | 0.09 | 0.09 | 0.09 | 0.045 | 0.045 | 0.045 |
Table 3.
Volume of the jets collision zone Vi, sheet volume Ve, energy dissipation rate ε, and other hydrodynamic characteristics for the following parameters of the jets: 2θ = 90°, dj = 1.0 mm, and L = 17 mm at different flow rates in the jets at T = 20 °C (results of calculations).
Table 3.
Volume of the jets collision zone Vi, sheet volume Ve, energy dissipation rate ε, and other hydrodynamic characteristics for the following parameters of the jets: 2θ = 90°, dj = 1.0 mm, and L = 17 mm at different flow rates in the jets at T = 20 °C (results of calculations).
| Q1 = Q2, mL/min | wj, m/s | Rej | Wej | Vi, μL | Ve, mL | Ve1, mL | P, W | εi, W/kg | εe, W/kg |
|---|---|---|---|---|---|---|---|---|---|
| 100 | 2.122 | 2122 | 61.7 | 1.111 | 0.0257 | 0.0292 | 7.5·10−3 | 6.750·103 | 257 |
| 200 | 4.244 | 4244 | 247 | 1.111 | 0.1029 | 0.1169 | 60·10−3 | 5.400·104 | 583 |
| 300 | 6.366 | 6366 | 555 | 1.111 | 0.2316 | 0.2630 | 0.203 | 1.825·105 | 875 |
| 400 | 8.488 | 8488 | 987 | 1.111 | 0.4117 | 0.4675 | 0.480 | 4.325·105 | 1167 |
| 500 | 10.61 | 10,610 | 1542 | 1.111 | 0.6433 | 0.7304 | 0.938 | 8.445·105 | 1458 |
| 600 | 12.73 | 12,730 | 2221 | 1.111 | 0.9264 | 1.0518 | 1.621 | 1.460·105 | 1750 |
| 700 | 14.85 | 14,850 | 3023 | 1.111 | 1.2609 | 1.4316 | 2.574 | 2.318·106 | 2042 |
| 800 | 16.98 | 16,980 | 3948 | 1.111 | 1.647 | 1.8699 | 3.843 | 3.460·106 | 2333 |
| 1000 | 21.22 | 21,220 | 6169 | 1.111 | 2.5734 | 2.9217 | 7.505 | 6.755·106 | 2917 |
| 1200 | 25.47 | 25,465 | 8883 | 1.111 | 3.7056 | 4.2072 | 12.97 | 1.168·107 | 3500 |
| 1400 | 29.71 | 29,710 | 12,090 | 1.111 | 5.0438 | 5.7265 | 20.59 | 1.854·107 | 4083 |
| 1600 | 33.95 | 33,950 | 15,792 | 1.111 | 6.5878 | 7.4795 | 30.74 | 2.768·107 | 4666 |
| 1800 | 38.20 | 38,200 | 19,987 | 1.111 | 8.3377 | 9.4663 | 43.771 | 3.941·107 | 5250 |
| 2000 | 42.44 | 42,440 | 24,675 | 1.111 | 10.294 | 11.687 | 60.042 | 5.405·107 | 5833 |
Note: Ve—the calculated volume of the sheet, taking into account the change in the angle ψ; Ve1—the calculated volume of the sheet, without taking into account the change in the angle ψ (for the considered conditions Ve1/Ve = 1.135); P—total power dissipated during the jets collision.
© 2020 by the authors. Licensee MDPI, Basel, Switzerland. This article is an open access article distributed under the terms and conditions of the Creative Commons Attribution (CC BY) license (http://creativecommons.org/licenses/by/4.0/).
Share and Cite
MDPI and ACS Style
Abiev, R.S.; Sirotkin, A.A. Influence of Hydrodynamic Conditions on Micromixing in Microreactors with Free Impinging Jets. Fluids 2020, 5, 179. https://doi.org/10.3390/fluids5040179
AMA Style
Abiev RS, Sirotkin AA. Influence of Hydrodynamic Conditions on Micromixing in Microreactors with Free Impinging Jets. Fluids. 2020; 5(4):179. https://doi.org/10.3390/fluids5040179
Chicago/Turabian StyleAbiev, Rufat Sh, and Alexey A Sirotkin. 2020. "Influence of Hydrodynamic Conditions on Micromixing in Microreactors with Free Impinging Jets" Fluids 5, no. 4: 179. https://doi.org/10.3390/fluids5040179