Cardiac Triangle Mapping: A New Systems Approach for Noninvasive Evaluation of Left Ventricular End Diastolic Pressure

1
Department of Aerospace & Mechanical Engineering, Viterbi School of Engineering, University of Southern California, Los Angeles, CA 90007, USA
2
Department of Medicine, Division of Cardiovascular Medicine, Keck School of Medicine, University of Southern California, Los Angeles, CA 90007, USA
*
Author to whom correspondence should be addressed.
Fluids 2019, 4(1), 16; https://doi.org/10.3390/fluids4010016
Submission received: 20 November 2018
/
Revised: 5 January 2019
/
Accepted: 19 January 2019
/
Published: 22 January 2019
(This article belongs to the Special Issue Cardiovascular Flows)
Abstract
:Noninvasive and practical assessment of hemodynamics is a critical unmet need in the treatment of both chronic and acute cardiovascular diseases. Particularly, the ability to monitor left ventricular end-diastolic pressure (LVEDP) noninvasively offers enormous benefit for managing patients with chronic congestive heart failure. Recently, we provided proof of concept that a new cardiac metric, intrinsic frequency (IF), derived from mathematical analysis of non-invasively captured arterial waveforms, can be used to accurately compute cardiovascular hemodynamic measures, such as left ventricle ejection fraction (LVEF), by using a smartphone. In this manuscript, we propose a new systems-based method called cardiac triangle mapping (CTM) for hemodynamics evaluation of the left ventricle. This method is based on intrinsic frequency (IF) and systolic time interval (STI) methods that allows computation of LVEDP from noninvasive measurements. Since the CTM method only requires arterial waveform and electrocardiogram (ECG), it can eventually be adopted as a simple smartphone-based device, an inexpensive hand-held device, or perhaps (with future design modifications) a wearable sensor. Such devices, combined with this method, would allow for remote monitoring of heart failure patients.
1. Introduction
Cardiovascular diseases (CVDs) are the underlying cause of approximately one in three deaths in the United States annually. Thirty-four percent of American adults suffer from CVD. The total direct medical costs of these illnesses are projected to rise to $818 billion by 2030 [1]. Certainly, these statistics indicate a critical need to develop new methods and innovative devices for diagnosing and monitoring CVDs. Ideally, these methods must increase patient comfort, be easy to use by clinicians and patients in their home environment, and finally be noninvasive to reduce complications and cost. Among CVDs, heart failure (HF) is a distressingly common problem [1] that is expected to become more prevalent as the population ages [2]. Hospital systems have consequently expended major efforts to monitor HF status in outpatients, with a focus on reducing re-admission for decompensated heart failure. An implantable pulmonary artery pressure sensor was developed that allowed home transcutaneous monitoring downloaded to an internet-based recording that could be reviewed on line by physicians. This device was compared in a randomized clinical trial and found to be superior to usual care in reducing hospitalizations for heart failure patients [3]. This proof-of-concept work showed that home hemodynamic monitoring can make a clinical impact even when the monitored value is pulmonary artery diastolic pressure, a reasonable, but flawed estimate of cardiac filling pressure.
Pressure inside the left ventricle (LV) at the end of the diastolic phase of the cardiac cycle, LV end diastolic pressure (LVEDP), is an important measure of LV function [4]. Elevated LVEDP is generally indicative of poor LV function in both heart failure with preserved ejection fraction (HFpEF) and of heart failure with reduced ejection fraction (HFrEF). HF requiring hospitalization follows a process that usually spans over several months [5]. It is generally accepted that HF rehospitalization can be reduced by early detection of elevated LVEDP [5]. Furthermore, in hospital HF management depends on clinical assessments, so congestion may not be addressed sufficiently during hospitalization [6]. Therefore, a noninvasive evaluation of LVEDP can significantly impact the diagnosis and management of HF. Such a method could reduce the discharge of inadequately treated patients and help maintain them in a compensated state after discharge.
Conventional methods for LVEDP evaluation, either directly through left heart catheterization or indirectly using pulmonary capillary wedge pressure (PCWP), are invasive. Therefore, their usage is limited to unstable patients or those with serious symptoms for whom cardiac catheterization is justifiable. In this paper, we introduce a systems fluid dynamic approach that allows for noninvasive evaluation of left ventricle end diastolic pressure (LVEDP) to improve upon HF diagnostics and monitoring.
Recently, we introduced the intrinsic frequency (IF) concept that reveals clinically relevant information about the dynamics of the left ventricle (LV), arterial system, and their interactions [7,8,9,10]. IF frequencies are operating frequencies based on the Sparse Time-Frequency Representation (STFR) [11], treating the LV combined with the aorta and the remaining peripheral arteries as a coupled dynamical system (heart + aortic tree), which is decoupled upon closure of the aortic valve [8,9,12]. Utilizing the IF method, one can extract two IF frequencies, ω1 and ω2 (along with other independent variables [9]), from a single arterial blood pressure waveform. One important advantage of the IF method is that the absolute magnitude of the arterial pressure wave is not required to extract the IF parameters, only the waveform morphology [8,9]. As such, the IFs can be easily acquired noninvasively, instantaneously, and inexpensively using a smartphone [7,8,13] or arterial applanation tonometry. The first IF, ω1, describes the dynamics of the systolic phase of the cardiac cycle where the LV and aorta (vasculature) are a coupled dynamic system [7,8,9]. The second IF, ω2, is dominated by the dynamics of the vasculature [9,10,12].
Previous studies have indicated that ω1 is mainly determined by the LV contractility while ω2 is mostly determined by vascular function (e.g., arterial stiffness, arterial wave dynamics, and afterload) [9,10,12,14]. In a blind clinical study [8], it was shown LV ejection fraction (LVEF, a surrogate of LV contractility) derived using IF applied to carotid waveforms extracted using an iPhone [8] were similar to those measured from cardiac magnetic resonance imaging (CMRI) (r = 0.74, p < 0.00001). Importantly, a very strong correlation between LVEF measured by CMRI and LVEF computed by IF (LVEF-IF) was observed (r = 0.94, p < 0.0001) among HF patients [7,8]. Recently, in a blind cross-sectional study of 191 childhood cancer survivors who are at risk for anthracycline-related cardiac dysfunction, LVEF-IF was compared with LVEF from 2D-echocardiography and CMRI [13]. Using the CMRI as the gold standard, the results showed that the detection of cardiac systolic dysfunction (as measured by LVEF) via the noninvasive LVEF-IF method was more accurate and sensitive than 2D echocardiography [13]. Using Framingham Heart Study data, we have recently demonstrated that central arterial stiffness (carotid-femoral pulse wave velocity (PWV)) can be computed using IF of a single noninvasively measured carotid pressure waveform (without any need for ECG measurement and/or femoral tonometry) [12]. The result showed that estimated PWV by IF method is equivalent to PWV measurements obtained by direct methods in predicting the risk for CVD [12]. These studies point to the importance of the IF method as a powerful tool for noninvasive ventricular performance (contractility) and vascular function (afterload) evaluation [8,9,12,13].
In this paper, we propose a new systems-based approach, called Cardiac Triangle Mapping (CTM), for hemodynamic evaluation of the LV. This method uses the pre-ejection period (PEP) and IF mathematics to compute LVEDP. In this study, we tested the proposed CTM method using retrospective previously published data.
2. Theory and Methods
2.1. Intrinsic Frequency Method
The intrinsic frequency (IF) method models a dynamic system as an object rotating around an origin. The angular velocity of the rotation is the intrinsic frequency. In the coupled LV-aorta system, the average angular velocity of rotation (instantaneous frequency) during systole when the LV and aorta are coupled together is ω1. The average angular velocity during diastole when the aorta gets decoupled from LV (after the closure of the aortic valve) is ω2. Simply put, the IF method assumes that the instantaneous frequency of a coupled dynamical system is piecewise constant in time with the step that occurs at the time of decoupling. In the LV-aorta system, the decoupling time is the time of the closure of the aortic valve. It is obvious from the definition that IF frequencies are fundamentally different than Fourier harmonics or any other resonance-type frequencies [9,15]. The mathematical formulation of the IF method is as follows:
This L2 minimization is subject to the continuity at T0 (time of the decoupling = time of the dicrotic notch) and periodicity of the waveform. Here, χ(a,b) is the indicator function (χ(a,b) = 1 if a ≤ t ≤ b and χ(a,b) = 0 otherwise) and p(t) is the arterial waveform. a1, a2, c, b1, b2, ω1, and ω2 are the unknowns that can be found by solving this nonconvex minimization problem. Details regarding mathematical formulation of the IF method [9], its computational procedure [9], and its convergence/accuracy [15] were provided in previous publications [9,15,16]. Figure 1 illustrates how the IF-reconstructed waveform from ω1, and ω2 represents the original waveform.
The IF method uses the information stored in an arterial waveform (e.g., carotid waveform) and creates a multidimensional IF space. These dimensions include the ω1 and ω2, duration of the cycle, and the coordinates of the decoupling point. The decoupling coordinates are represented as the relative height of decoupling at the dicrotic notch (RHDN) and the time of decoupling at the dicrotic notch (T0). Previous studies [8,17] have indicated that LVEF (surrogate of LV contractility), LV-arterial coupling optimality, and central pulse wave velocity (a major determinant of arterial impedance and pulsatile afterload) can be evaluated as a function of IF parameters [9,10,12,14] (Figure 2). Previous results indicate that LV contractility and afterload can be approximated as a function of IFs (ω1, ω2, …). Therefore, without a loss of generality, we can represent LV contractility and afterload as functions of ω1 and ω2. In mathematical language:
Here, Ctr is the LV contractility and AL is the afterload.
2.2. Pre-Ejection Period
The systolic time interval (STI) method was first introduced in the 1960s by Weissler et al. [18]. Clinical studies have shown that LV function performances, such as contractility and preload, can be approximated under certain conditions using STI methods [19]. Two major components of the STI method are the LV ejection time (LVET) and pre-ejection period (PEP). LVET is the time interval from the opening of the aortic valve to the closure of the aortic valve marked by the dicrotic notch (note that LVET is the same as T0 in the IF method). PEP is the time interval from the beginning of the QRS complex to the opening of the aortic valve. The QRS complex is a combination of the Q wave, R wave, and S wave from ECG where the Q wave is any downward deflection immediately after the P wave, the R wave is an upward deflection after the Q wave, and the S wave is a rapid downward deflection after the R wave. Previous studies have shown that LV preload is inversely proportional to PEP at a given LV contractility and afterload (Talley et al. [20]). Figure 3 shows how PEP is measured from simultaneous pressure waveforms and electrocardiogram (ECG).
2.3. Cardiac Triangle Mapping Hypothesis
Cardiac Triangle Mapping (CTM) is based on the fact that ventricular function is modulated by three factors: (i) The contractile state of the myocardium or contractility, (ii) the afterload that is related to vascular function and LV-arterial coupling, and (iii) the preload, which can be quantified by LVEDP.
IF parameters, such as ω1 and ω2, are extracted from the arterial waveforms. These waveforms are the result of interactions between LV contractility and vascular function (resistance, compliance, LV-aorta coupling); therefore, they carry little or no information about the state of the LV preload. This means that PEP provides information that cannot be retrieved from IFs (ω1 and ω2). It has been shown that at a fixed LV contractility and afterload, PEP changes (inversely) as preload changes [20]. Since PEP is related to LV preload while ω1 and ω2 are not, PEP should be orthogonal (or at the very least not parallel) to ω1 and ω2 (and other IF dimensions). As a result, a combination of IFs (ω1 and ω2) and PEP creates a complete set that can map LV dynamics, and subsequently provide information about the hemodynamics of LV. The CTM hypothesis states that ω1 and ω2, PEP map the global ventricular function. In mathematical form:
The corollary of is that all LV-related mechanical biomarkers, such as LVEDP, can be computed as a function of IFs (e.g., ω1, ω2) and PEP. In mathematical language:
Here, λ is a constant that assures the physical units on both sides are the same (e.g., pressure as mmHg).
The state of LV performance is defined by Ctr, AL, and preload; therefore, it can geometrically be represented as a triangle ( in Figure 4). For the purposes of this manuscript, we will refer to it as a cardiac triangle. Inspired by the shape of the pressure and ECG waveforms in a cardiac cycle (Figure 4), and without a loss of generality, we assume the cardiac triangle is a right triangle where PEP is one leg (AC), afterload minus LVEDP is the other leg (BC), and the slope of the AB line is Ctr (in other words, the tangent inverse of Ctr is the angle, ). This choice of Ctr is in agreement with past studies that showed LV dp/dtmax is a measure of contractility [21]) (Figure 4). In our assumption, the nonlinear curves from point A to point B and A to C are approximated as straight lines. The error associated with assuming AB and AC as straight lines can be reduced by appropriate usage of nonlinear parameters, such as ω1. According to the triangle of Figure 4, the below relationship can be written:
Physiological or physical parameters, such as LV contractility, arterial diastolic pressure, LVEDP, etc., are the edges, angles, or vertices of the cardiac triangle (Figure 5). As described in the previous paragraph, the edges are not necessarily straight. The edges can be curvilinear as shown in Figure 5a. According to Equation (4), a triangle formed by ω1, ω2, and PEP (we call this triangle the IF-triangle) can also define the full state of LV performance, hence allowing for computation of LVEDP. This is based on a simple law of geometry: By knowing three components (e.g., three sides or two sides + one angle), the whole triangle can be solved. Without a loss of generality, the IF-triangle can be considered as a triangle with straight sides (Figure 5b) since IF parameters (e.g., ω1 and ω2) carry non-linearities associated with the LV-aorta system.
To derive an expression for the LVEDP form Ctr, AL, and PEP, we simply need to solve Equation (6) for LVEDP:
Combining Equation (7) with Equations (2) and (3):
Equation (8) is an explicit version of Equation (5) that uses IFs and PEP to compute LVEDP.
2.4. Compatibility of CTM with Hemodynamical Changes
An important step in verifying the validity of the CTM method is to show that the cardiac triangle of CTM (Figure 5) remains intact as the LV-arterial system undergoes functional changes. We used the results of Talley et al. [20] to test the validity of our proposed CTM theory. They performed a series of (dog) experiments to evaluate the effect of LV contractility, LVEDP (surrogate for preload), and AoDP (surrogate for afterload) on PEP. Talley et al. [20] used various levels of inotropic stimuli to force changes in LV contractility while keeping LVEDP and the afterload constant to impose LVEDP changes at fixed contractility and afterload, and to manipulate afterload at a constant LV contractility and LVEDP.
2.5. Testing CTM Using Clinical Retrospective Data
Computations of ω1 and ω2 (and, subsequently, f1 and f2) were not possible since arterial waveforms were unavailable within the retrospective dataset. Consequentially, we used a simplified version of Equation (7) (or Equation (8)) where hemodynamical surrogates for AL (or f2) and Ctr (or f1) were considered. Recent results have shown that ω1 is highly correlated with various indexes of LV contractility [17]. Furthermore, the Pahlevan et al. [8] study indicated that ω1 corrected with the LV ejection time (, where T0 is the LVET) is strongly correlated with LVEF. Therefore, by introducing a minor error, we can replace f1 (or Ctr) in Equation (8) with . Aortic diastolic pressure (AoDP) was also considered as a surrogate for AL). Hence, Equation (8) is simplified to:
Here, c1 is a unitless constant and c2 is a constant with a unit of . We then used linear multiple regression to compute the best value for c1 and c2. To determine c1 and c2, the least squares method was used [22]. The advantage of this method is that it allows the residuals to be treated as continuous differentiable measures. The disadvantage is that outliers may have disproportional impacts on the computed values.
A retrospective dataset from Gerrard et al. [23] was used to test the validity of the CTM method and approximate the error of Equation (9). This dataset includes all physiological data required for Equation (9), such as LVEF, PEP, T0, AoDP, and LVEDP.
3. Results
3.1. Compatibility of CTM with Hemodynamical Changes
3.1.1. Elevation of LVEDP at Constant Contractility and AoDP
3.1.2. Changing Contractility at Constant LVEDP and AoDP
3.1.3. Elevation of AoDP at Constant Contractility and LVEDP
3.2. Clinical Results
Table 1 shows the physiological and hemodynamical values of the study population. The dataset includes 62 subjects (36 men and 26 women), aged 19 to 65 years (mean = 46; SD = 20). The raw data of the results presented in this table, Figure 9 and Figure 10 are provided as supplementary data. It includes patients with various cardiovascular diseases, such as ischemic heart diseases, cardiomyopathy, atrial fibrillation, Mitral valve diseases, and aortic valve diseases (see Gerrard et al. [23] for more details).
4. Discussion
The results of this study provide the proof-of-concept that left ventricular end diastolic pressure (LVEDP) can be estimated noninvasively using the systems-based cardiac triangle mapping (CTM) method. The ability to monitor LVEDP noninvasively can revolutionize the diagnosis, monitoring, and treatment of HF patients. Moreover, this method provides a means to continually monitor HF patients at home, and maintain a compensated state by keeping patients’ LVEDP below a targeted value. It could also reduce rehospitalization for HF by preventing premature discharge.
Left heart catheterization is the gold standard clinical method for evaluating LVEDP. The alternative clinical practice for indirect assessment of filling pressure (LVEDP) is measuring pulmonary capillary wedge pressure (PCWP) in right-heart catheterization settings. PCWP measurement is also highly invasive, but does not require a Cathlab setting, and can be performed in intensive care units (ICUs). Recent clinical studies have indicated that PCWP is poorly calibrated to LVEDP (Bland-Altman limits of agreement (LoA) of −15.2 to 9.5 mmHg according to Halpern et al. [24] and −17.2 to 11.4 mmHg according to Bitar et al. [25]). A recent study [25] has shown a moderate correlation between PCWP and LVEDP, r = 0.57. Methods based on the Valsalva maneuver (forced expiration against a closed glottis) have been recently proposed for the indirect approximation of LV filling pressure [26,27]. These methods are based on multiple studies, which demonstrated that the Valsalva maneuver can help diagnose HF since changes in the strain phase of arterial waveforms due to the Valsalva maneuver are related to the LV filling pressure [28,29,30]. Major limitations of Valsalva-based methods include the need to maintain uniform strain during the maneuver and risk of developing ectopy during the maneuver [26]. It is noteworthy that recent studies based on these methods [31,32] have only indicated a moderate correlation with filling pressure measures, such as PCWP [32] (r = 0.58) and LVEDP [31] (r = 0.56). Some studies have proposed echocardiography-based approaches for the assessment of LV filling pressure [33,34]. Recently, Anderson et al. [35] presented an echocardiographic-based algorithm that provides an accurate estimation of LV filling pressure. However, this study did not include patients without cardiac diseases, and echo requires expert interpretation. Use of a wireless implantable system for monitoring pulmonary artery pressures in outpatients was shown to significantly reduce hospitalizations in heart failure patients [3]. However, implementation of this device requires an invasive procedure, is relatively expensive, and long-term outcomes remain to be answered. While these implantable devices are proving to be useful in more advanced heart failure patients, there is nothing available to frequently monitor the much larger group of patients with less severe disease. Additionally, there are significant patient groups where pulmonary diastolic pressure is not an accurate estimation of LVEDP. Diseased states, such as pulmonary hypertension and chronic lung disease, can lead to significant overestimation of LVEDP using pulmonary artery diastolic pressure. The proposed CTM method is a systems approach based on intrinsic frequency (IF) that provides a noninvasive, instantaneous, and practical way of measuring LVEDP in any setting, including at home.
Our first step in verifying the validity of the CTM method was to show that the triangle in CTM (Figure 4 and Figure 5) remains intact as the LV-arterial system goes through functional changes. Talley et al. [20] have performed a series of animal experiments to study LV contractility and PEP using dog models. They demonstrated that increases in LVEDP at fixed contractility (as measured by dp/dtmax) and afterload (as quantified by AoDP) result in PEP reduction. The CTM method predicts the same pattern as illustrated in Figure 6. Furthermore, the results in Talley et al. [20] also demonstrate that PEP increases as LV contractility decreases when LVEDP and AoDP are kept constant. As shown in Figure 7, CTM theory predicts the same conclusion. Additionally, the study reports that increases in AoDP at constant contractility and constant LVEDP lead to an increase of PEP [20]. Again, CTM predicts the same results (Figure 8). These observations point to the physiological validity of the proposed CTM method.
Our LVEDP results for the CTM method are based on retrospective published data [23]. Since LV and arterial pressure waveforms were not available in the dataset, the direct computations of ω1 and ω2 were not possible. Therefore, Equation (8) was modified to Equation (9) and instead of IFs, their functional equivalents, such as LV contractility surrogate (LVEF) and afterload surrogate (AoDP), were used. As shown in Figure 9a,b, there is a good agreement between the direct invasive measurement of LVEDP and LVEDP from the CTM method (r = 0.76, LoA = ±11.4, and RMSE = 5.9 mmHg). The clinical significance and value of this method is highlighted when these r = 0.76 and LoA = ±11.4 values are compared to recently reported r (0.56–0.58) and LoA (−15.2 to 9.5 and −17.2 to 11.4) of PCWP and other noninvasive LVEDP surrogates [31,32,33,34]. More importantly, since IFs (of ω1 and ω2) carry the nonlinearity of the system, the accuracy of LVEDP computation from the CTM method (using Equation (8)) might be even higher than the reported results in this manuscript. Whether the accuracy is indeed higher is yet to be determined in future prospective clinical studies when LVEDP, PEP, ω1, and ω2 will be measured simultaneously.
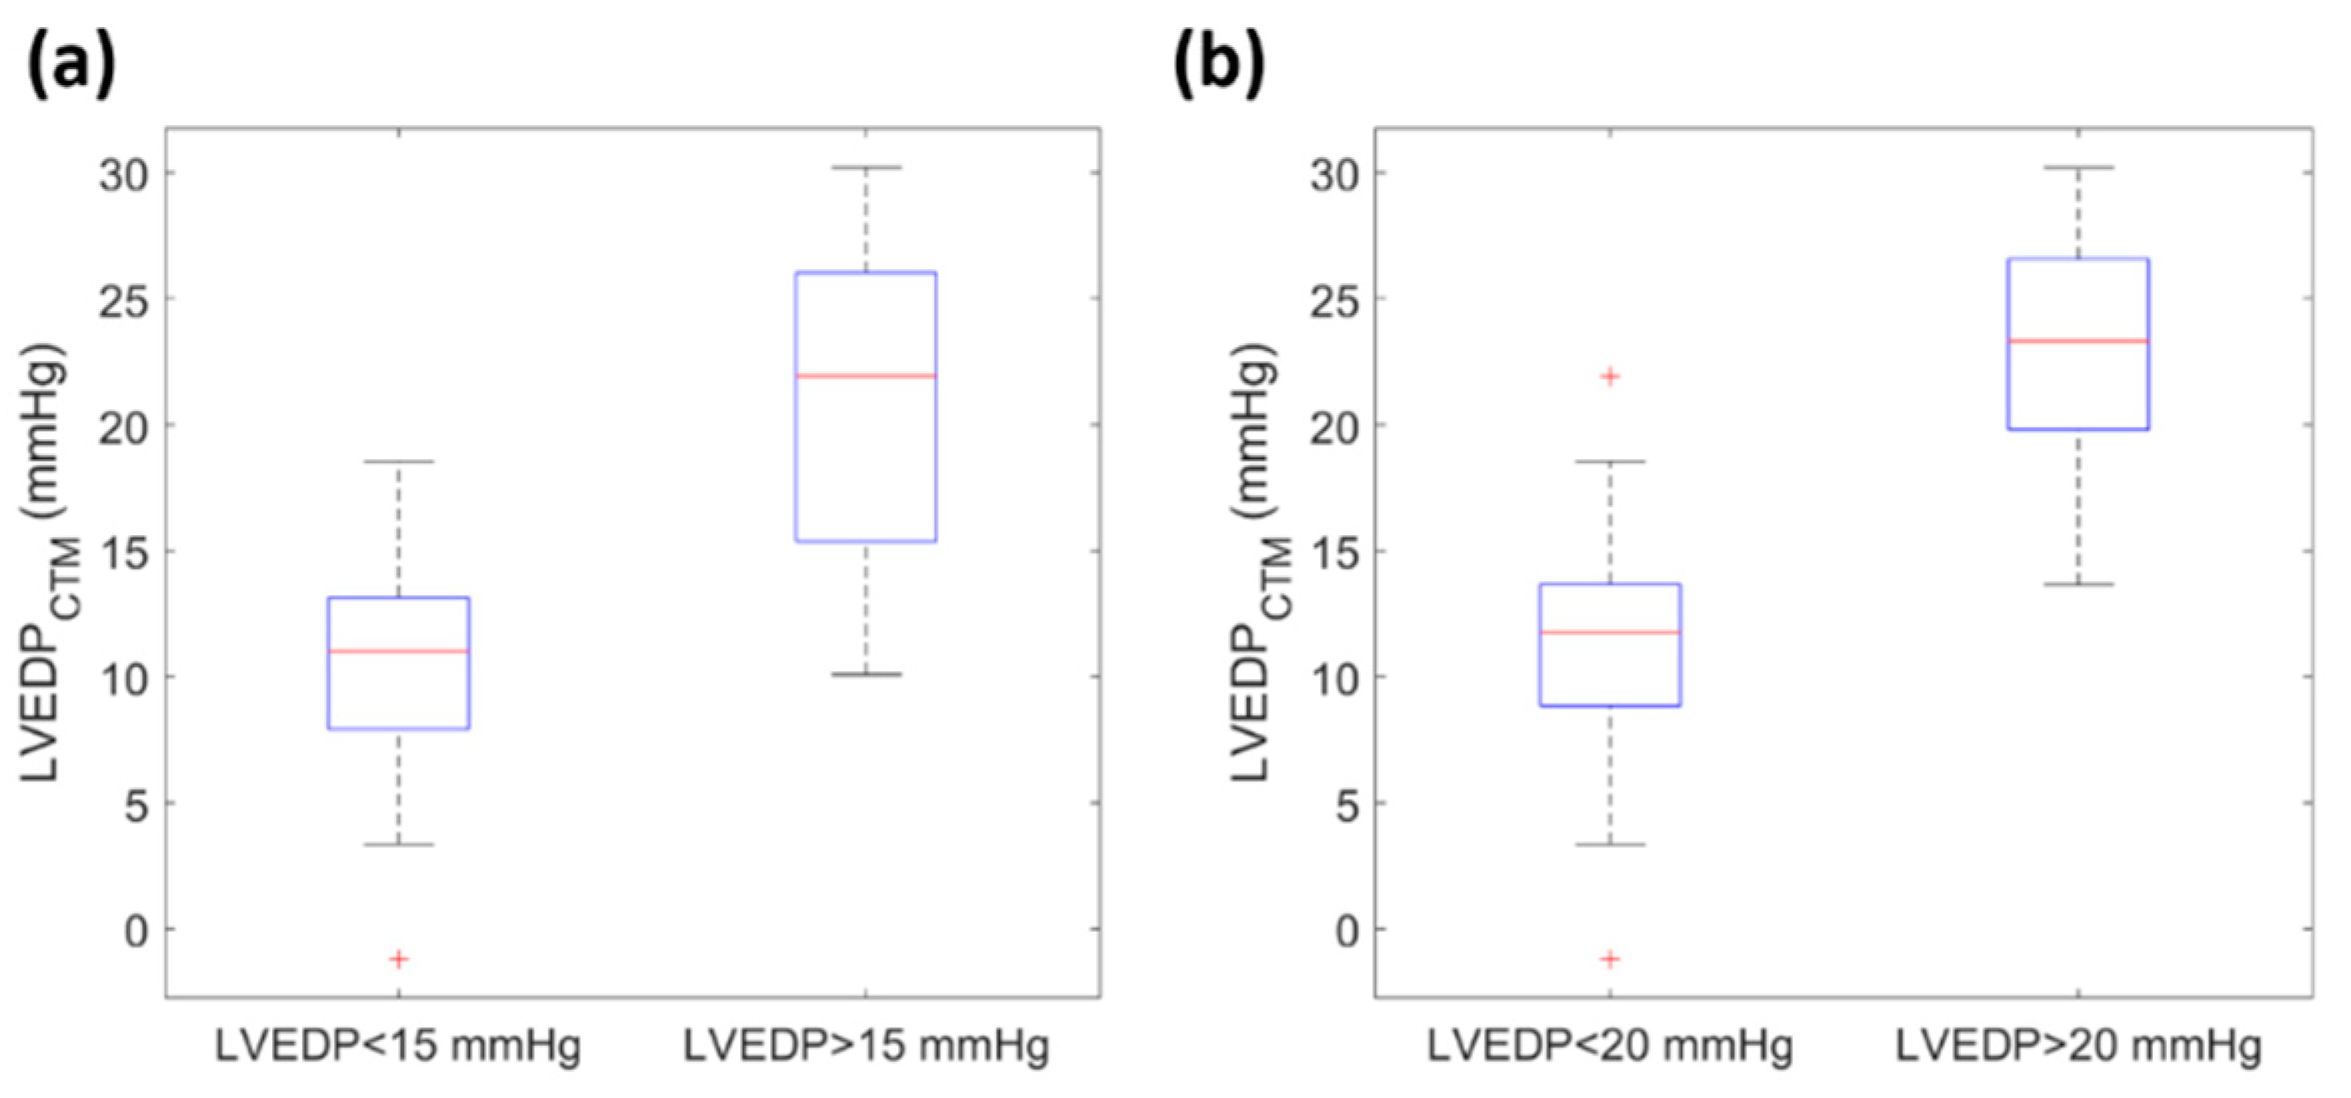
As exemplified in Figure 10a, the CTM method demonstrates a clear separation between subjects with elevated LVEDP (15 mmHg) and subjects with normal LVEDP (<15 mmHg). This divergence points to the usefulness of CTM in the diagnosis of decompensated HF patients. As demonstrated in Figure 10b, the CTM method can also distinguish reasonably well between subjects with LVEDP greater than 20 mmHg (a possible cutoff for immediate therapeutic intervention), and those with LVEDP less than 20 mmHg.
The major limitation of this study is using Equation (9), which employs LVEF, instead of Equation (8), which requires IFs. This limitation was unavoidable due to the retrospective dataset we used, where carotid waveforms were not available. However, recent studies [7,8,13] indicate that LVEF can be computed from IFs of the pressure waveforms. Our goal in this paper was to propose the CTM theory and link it to IFs. Our plan is to assess the accuracy of Equation (8) using IFs in a prospective heterogeneous cohort. An accurate PEP calculation is essential in the computation of LVEDP from the CTM method. The accuracy of the PEP calculation depends primarily on the following criteria: First, the quality of ECG measurement; second, the quality of the arterial pressure waveform measurement; third, accurate identification of the beginning of the Q-wave from the QRS complex; and lastly, accurate identification of the opening of the aortic valve from the pressure waveform. Due to the retrospective nature of the data we were not able to assess the accuracy of PEP calculations.
5. Conclusions
The results of this paper suggest that LVEDP can be approximated from IFs’ surrogates and PEP using the CTM method. Since both PEP and IFs can be measured noninvasively, the result of this study will enable care providers and patients to measure LVEDP noninvasively. Although the mathematics of IF for measuring noninvasive LVEDP is complex, the computation of all variables required for LVEDP, including ω1 and ω2, can be completed automatically in a fraction of a second from the carotid waveform and ECG signal input. Furthermore, since the CTM method only requires arterial waveform and ECG, and both of these can be measured by a smartphone [8,36], the CTM method can eventually be adopted as a simple smartphone-based device, an inexpensive hand-held device (similar to Armenian et al. [13]), or perhaps in future design modifications a wearable sensor. Such devices combined with this method would allow for remote monitoring of patients, maintenance of a compensated state by keeping patients’ LVEDP below a targeted value from the comfort of their own home, and immediate access to their patient data remotely by health care providers.
Supplementary Materials
The following are available online at https://www.mdpi.com/2311-5521/4/1/16/s1, Table S1: supplementary materials. This file includes the raw data of the results presented in Table 1, Figure 9 and Figure 10.
Author Contributions
Conceptualization, N.M.P.; methodology, N.M.P.; validation, N.M.P. and R.V.M.; formal analysis, N.M.P. and R.V.M.; investigation N.M.P.; writing—original draft preparation, N.M.P.; writing—review and editing, N.M.P. and R.V.M.
Acknowledgments
The authors would like to thank Robert Kloner for his scientific input. Niema M. Pahlevan began developing the concept described in this manuscript during the course of his research at California Institute of Technology.
Conflicts of Interest
Niema M. Pahlevan hold equity in Avicena LLC and has consulting agreement with Avicena LLC. Ray V. Matthews does not have any conflicts of interest.
References
- Benjamin, E.J.; Blaha, M.J.; Chiuve, S.E.; Cushman, M.; Das, S.R.; Deo, R.; de Ferranti, S.D.; Floyd, J.; Fornage, M.; Gillespie, C. Heart disease and stroke statistics—2017 update: A report from the American Heart Association. Circulation 2017, 135, e146–e603. [Google Scholar] [CrossRef] [PubMed]
- Lloyd-Jones, D.M.; Larson, M.G.; Leip, E.P.; Beiser, A.; D’Agostino, R.B.; Kannel, W.B.; Murabito, J.M.; Vasan, R.S.; Benjamin, E.J.; Levy, D. Lifetime Risk for Developing Congestive Heart Failure: The Framingham Heart Study. Circulation 2002, 106, 3068–3072. [Google Scholar] [CrossRef] [PubMed]
- Abraham, W.T.; Adamson, P.B.; Bourge, R.C.; Aaron, M.F.; Costanzo, M.R.; Stevenson, L.W.; Strickland, W.; Neelagaru, S.; Raval, N.; Krueger, S.; et al. Wireless pulmonary artery haemodynamic monitoring in chronic heart failure: A randomised controlled trial. Lancet 2011, 377, 658–666. [Google Scholar] [CrossRef]
- Iskandrian, A.; Segal, B.; Hamid HAKKI, A. Left ventricular end-diastolic pressure in evaluating left ventricular function. Clin. Cardiol. 1981, 4, 28–33. [Google Scholar] [CrossRef] [PubMed]
- Gheorghiade, M.; Filippatos, G.; De Luca, L.; Burnett, J. Congestion in Acute Heart Failure Syndromes: An Essential Target of Evaluation and Treatment. Am. J. Med. 2006, 119, S3–S10. [Google Scholar] [CrossRef]
- Sharma, G.; Woods, P.A.; Lindsey, N.; O’Connell, C.; Connolly, L.; Joseph, J.; McIntyre, K.M. Noninvasive monitoring of left ventricular end-diastolic pressure reduces rehospitalization rates in patients hospitalized for heart failure: A randomized controlled trial. J. Card. Fail. 2011, 17, 718–725. [Google Scholar] [CrossRef]
- Pahlevan, N.M.; Rinderknecht, D.; Tavallali, P.; Razavi, M.; Tran, T.T.; Fong, M.; Kloner, R.A.; Csete, M.; Gharib, M. A New Noninvasive iPhone Application to Monitor Left Ventricle Ejection Fraction in Heart Failure Patients. Circulation 2016, 134, A17227. [Google Scholar]
- Pahlevan, N.M.; Rinderknecht, D.G.; Tavallali, P.; Razavi, M.; Tran, T.T.; Fong, M.W.; Kloner, R.A.; Csete, M.; Gharib, M. Noninvasive iPhone Measurement of Left Ventricular Ejection Fraction Using Intrinsic Frequency Methodology. Crit. Care Med. 2017, 45, 1115–1120. [Google Scholar]
- Pahlevan, N.M.; Tavallali, P.; Rinderknecht, D.G.; Petrasek, D.; Matthews, R.V.; Hou, T.Y.; Gharib, M. Intrinsic frequency for a systems approach to haemodynamic waveform analysis with clinical applications. J. R. Soc. Interface 2014, 11. [Google Scholar] [CrossRef]
- Petrasek, D.; Pahlevan, N.M.; Tavallali, P.; Rinderknecht, D.G.; Gharib, M. Intrinsic Frequency and the Single Wave Biopsy: Implications for Insulin Resistance. J. Diabetes Sci. Technol. 2015, 9, 1246–1252. [Google Scholar] [CrossRef]
- Hou, T.Y.; Shi, Z. Adaptive data analysis via sparse time-frequency representation. Adv. Adapt. Data Anal. 2011, 3, 1–28. [Google Scholar] [CrossRef]
- Tavallali, P.; Razavi, M.; Pahlevan, N.M. Artificial Intelligence Estimation of Carotid-Femoral Pulse Wave Velocity using Carotid Waveform. Sci. Rep. 2018, 8, 1014. [Google Scholar] [CrossRef] [PubMed] [Green Version]
- Armenian, S.H.; Rinderknecht, D.; Au, K.; Lindenfeld, L.; Mills, G.; Siyahian, A.; Herrera, C.; Wilson, K.; Venkataraman, K.; Mascarenhas, K. Accuracy of a novel handheld wireless platform for detection of cardiac dysfunction in anthracycline-exposed survivors of childhood cancer. Clin. Cancer Res. 2018, 24, 3119–3125. [Google Scholar] [CrossRef] [PubMed]
- Pahlevan, N.M.; Petrasek, D.; Rinderknecht, D.G.; Tavallali, P.; Gharib, M. Calculating Pulse Wave Velocity from a Single Pressure Waveform Using the Intrinsic Frequency Method. Hypertension 2014, 64, A355. [Google Scholar]
- Tavallali, P.; Hou, T.Y.; Rinderknecht, D.G.; Pahlevan, N.M. On the convergence and accuracy of the cardiovascular intrinsic frequency method. R. Soc. Open Sci. 2015, 2. [Google Scholar] [CrossRef]
- Pahlevan, N.M. A Systems Approach to Cardiovascular Health and Disease with a Focus on Aortic Wave Dynamics. Ph.D. Thesis, California Institute of Technology, Pasadena, CA, USA, 2013. [Google Scholar]
- Pahlevan, N. MRI-based Measures of Left Ventricle Contractility and Intrinsic Frequency. In Proceedings of the IEEE-Engineering in Medicine and Biology Society (EMBC), Honolulu, HI, USA, 17–21 July 2018. [Google Scholar]
- Weissler, A.M.; Harris, W.S.; Schoenfeld, C.D. Systolic time intervals in heart failure in man. Circulation 1968, 37, 149–159. [Google Scholar] [CrossRef] [PubMed]
- Barden, J.; List, W.F.; Gravenstein, J.S.; Spodick, D.H. Systolic Time Intervals: International Symposium, Graz, Austria September 1–2, 1978; Springer: Berlin/Heidelberg, Germany, 1980. [Google Scholar]
- Talley, R.C.; Meyer, J.F.; McNay, J.L. Evaluation of the pre-ejection period as an estimate of myocardial contractility in dogs. Am. J. Cardiol. 1971, 27, 384–391. [Google Scholar] [CrossRef]
- Hosenpud, J.D.; Greenberg, B.H. Congestive Heart Failure; Lippincott Williams & Wilkins: Philadelphia, PA, USA, 2007. [Google Scholar]
- York, D. Least-squares fitting of a straight line. Can. J. Phys. 1966, 44, 1079–1086. [Google Scholar] [CrossRef]
- Garrard, C.L.; Weissler, A.M.; Dodge, H.T. The Relationship of Alterations in Systolic Time Intervals to Ejection Fraction in Patients with Cardiac Disease. Circulation 1970, 42, 455–462. [Google Scholar] [CrossRef] [Green Version]
- Halpern, S.D.; Taichman, D.B. Misclassification of pulmonary hypertension due to reliance on pulmonary capillary wedge pressure rather than left ventricular end-diastolic pressure. Chest 2009, 136, 37–43. [Google Scholar] [CrossRef]
- Bitar, A.; Selej, M.; Bolad, I.; Lahm, T. Poor agreement between pulmonary capillary wedge pressure and left ventricular end-diastolic pressure in a veteran population. PLoS ONE 2014, 9, e87304. [Google Scholar] [CrossRef] [PubMed]
- Sharma, G.; Woods, P.A.; Lambrew, C.T.; Berg, C.M.; Pietro, D.A.; Rocco, T.P.; Welt, F.W.; Sacchetti, P.; McIntyre, K.M. Evaluation of a noninvasive system for determining left ventricular filling pressure. Arch. Intern. Med. 2002, 162, 2084–2088. [Google Scholar] [CrossRef]
- Silber, H.A.; Trost, J.C.; Johnston, P.V.; Maughan, W.L.; Wang, N.-Y.; Kasper, E.K.; Aversano, T.R.; Bush, D.E. Finger photoplethysmography during the Valsalva maneuver reflects left ventricular filling pressure. Am. J. Physiol. Heart Circ. Physiol. 2012, 302, H2043–H2047. [Google Scholar] [CrossRef] [PubMed]
- Knowles, J.H.; Gorlin, R.; Storey, C.F. Clinical test for pulmonary congestion with use of the Valsalva maneuver. J. Am. Med. Assoc. 1956, 160, 44–48. [Google Scholar] [CrossRef] [PubMed]
- McIntyre, K.M.; Vita, J.A.; Lambrew, C.T.; Freeman, J.; Loscalzo, J. A Noninvasive Method of Predicting Pulmonary-Capillary Wedge Pressure. N. Engl. J. Med. 1992, 327, 1715–1720. [Google Scholar] [CrossRef] [PubMed]
- Sharpey-Schafer, E. Effects of Valsalva’s manoeuvre on the normal and failing circulation. Br. Med. J. 1955, 1, 693. [Google Scholar] [CrossRef] [PubMed]
- Galiatsatos, P.; Win, T.T.; Monti, J.; Johnston, P.V.; Herzog, W.; Trost, J.C.; Hwang, C.-W.; Fridman, G.Y.; Wang, N.-Y.; Silber, H.A. Usefulness of a Noninvasive Device to Identify Elevated Left Ventricular Filling Pressure Using Finger Photoplethysmography During a Valsalva Maneuver. Am. J. Cardiol. 2017, 119, 1053–1060. [Google Scholar] [CrossRef]
- Gilotra, N.A.; Tedford, R.J.; Wittstein, I.S.; Yenokyan, G.; Sharma, K.; Russell, S.D.; Silber, H.A. Usefulness of Pulse Amplitude Changes During the Valsalva Maneuver Measured Using Finger Photoplethysmography to Identify Elevated Pulmonary Capillary Wedge Pressure in Patients with Heart Failure. Am. J. Cardiol. 2017, 120, 966–972. [Google Scholar] [CrossRef]
- Abudiab, M.M.; Chebrolu, L.H.; Schutt, R.C.; Nagueh, S.F.; Zoghbi, W.A. Doppler Echocardiography for the Estimation of LV Filling Pressure in Patients with Mitral Annular Calcification. JACC Cardiovasc. Imaging 2017. [Google Scholar] [CrossRef]
- Dokainish, H.; Zoghbi, W.A.; Lakkis, N.M.; Al-Bakshy, F.; Dhir, M.; Quinones, M.A.; Nagueh, S.F. Optimal noninvasive assessment of left ventricular filling pressures. Circulation 2004, 109, 2432–2439. [Google Scholar] [CrossRef]
- Andersen, O.S.; Smiseth, O.A.; Dokainish, H.; Abudiab, M.M.; Schutt, R.C.; Kumar, A.; Sato, K.; Harb, S.; Gude, E.; Remme, E.W. Estimating left ventricular filling pressure by echocardiography. J. Am. Coll. Cardiol. 2017, 69, 1937–1948. [Google Scholar] [CrossRef] [PubMed]
- Haberman, Z.C.; Jahn, R.T.; Bose, R.; Tun, H.; Shinbane, J.S.; Doshi, R.N.; Chang, P.M.; Saxon, L.A. Wireless smartphone ECG enables large-scale screening in diverse populations. J. Cardiovasc. Electrophysiol. 2015, 26, 520–526. [Google Scholar] [CrossRef] [PubMed]
Figure 1.
Samples of aortic pressure waveforms (blue) with corresponding reconstructed waveforms from ω1, and ω2 (red).
Figure 1.
Samples of aortic pressure waveforms (blue) with corresponding reconstructed waveforms from ω1, and ω2 (red).
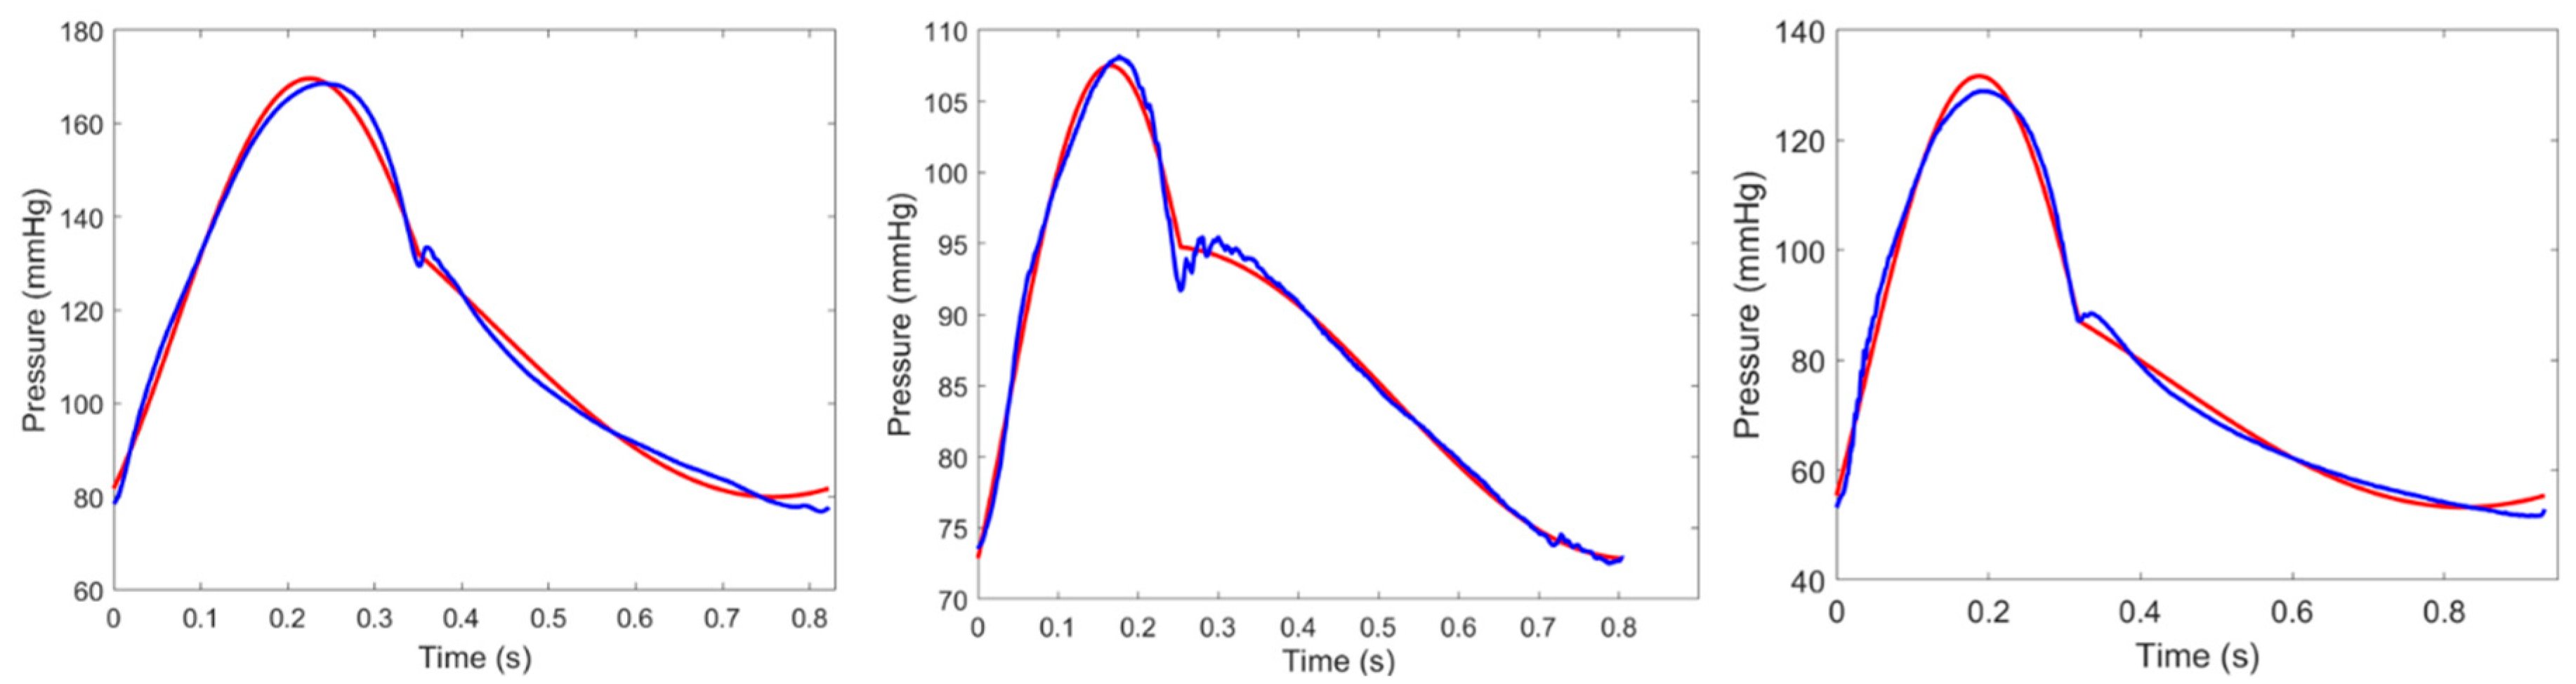
Figure 2.
Intrinsic Frequency (IF) creates a 5-dimensional IF space from a pressure waveform, with ω1, ω2, T0, relative height of decoupling at the dicrotic notch (RHDN) (green arrow divided by the total range), and T as the dimensions. The representative value in the IF space can then be mapped to physiological space where LV ejection Fraction (LVEF) (a surrogate for Ctr) [8,17] and central pulse wave velocity (PWV) [12] can be computed.
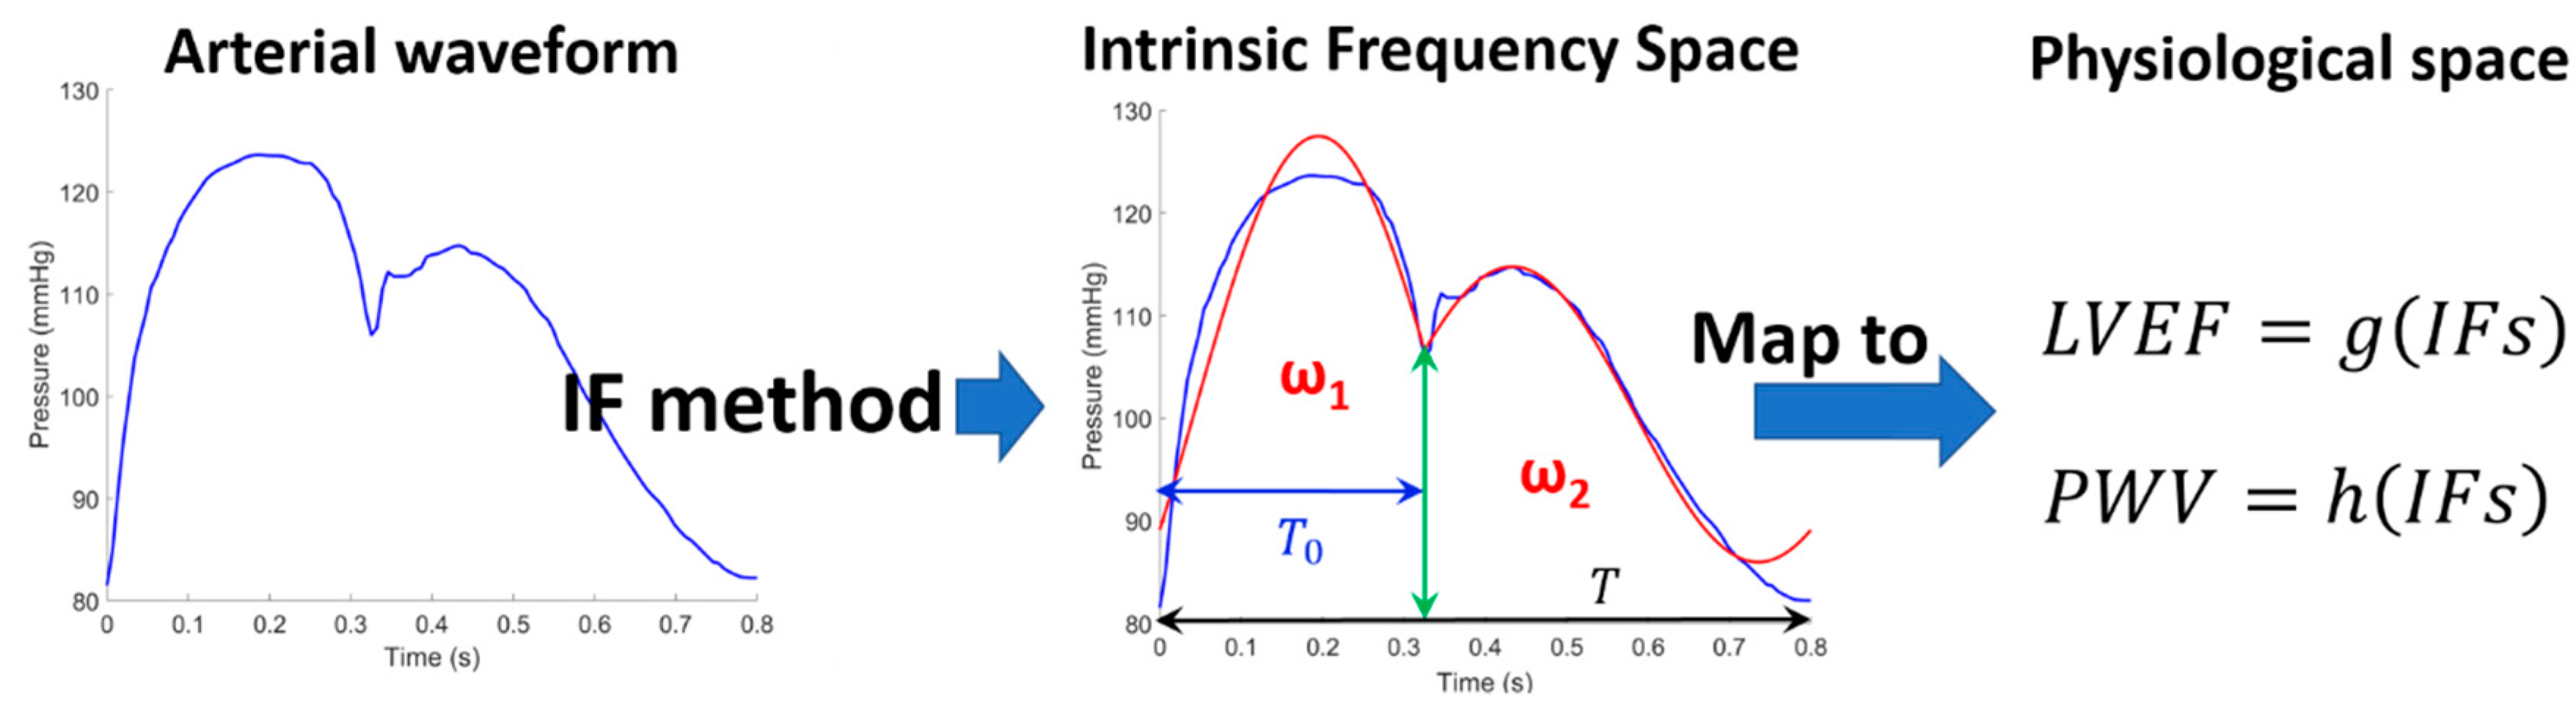
Figure 3.
Two major systolic time interval components, pre-ejection period (PEP), and LV ejection time (LVET). PEP is the time interval from the beginning of the QRS complex to the opening of the aortic valve. LVET is the time interval from the opening of the aortic valve to the closure of the aortic valve marked by the dicrotic notch. Red is the aortic pressure waveform (AoP) and blue is the electrocardiogram (ECG) waveform.

Figure 4.
Cardiac tringle shape inspired by the shape of LV pressure, aortic pressure, and ECG waveform. The red curve in the graph is the LV pressure, the blue curve in the graph is the aortic pressure, and the black curve in the graph is ECG. ECG was scaled and adjusted for better visualization.
Figure 4.
Cardiac tringle shape inspired by the shape of LV pressure, aortic pressure, and ECG waveform. The red curve in the graph is the LV pressure, the blue curve in the graph is the aortic pressure, and the black curve in the graph is ECG. ECG was scaled and adjusted for better visualization.

Figure 5.
(a) Schematic of a generalized cardiac triangle mapping (CTM) (b) simplified IF-based CTM with straight edges. Ctr is the LV contractility and tan−1 is the tangent inverse.
Figure 5.
(a) Schematic of a generalized cardiac triangle mapping (CTM) (b) simplified IF-based CTM with straight edges. Ctr is the LV contractility and tan−1 is the tangent inverse.
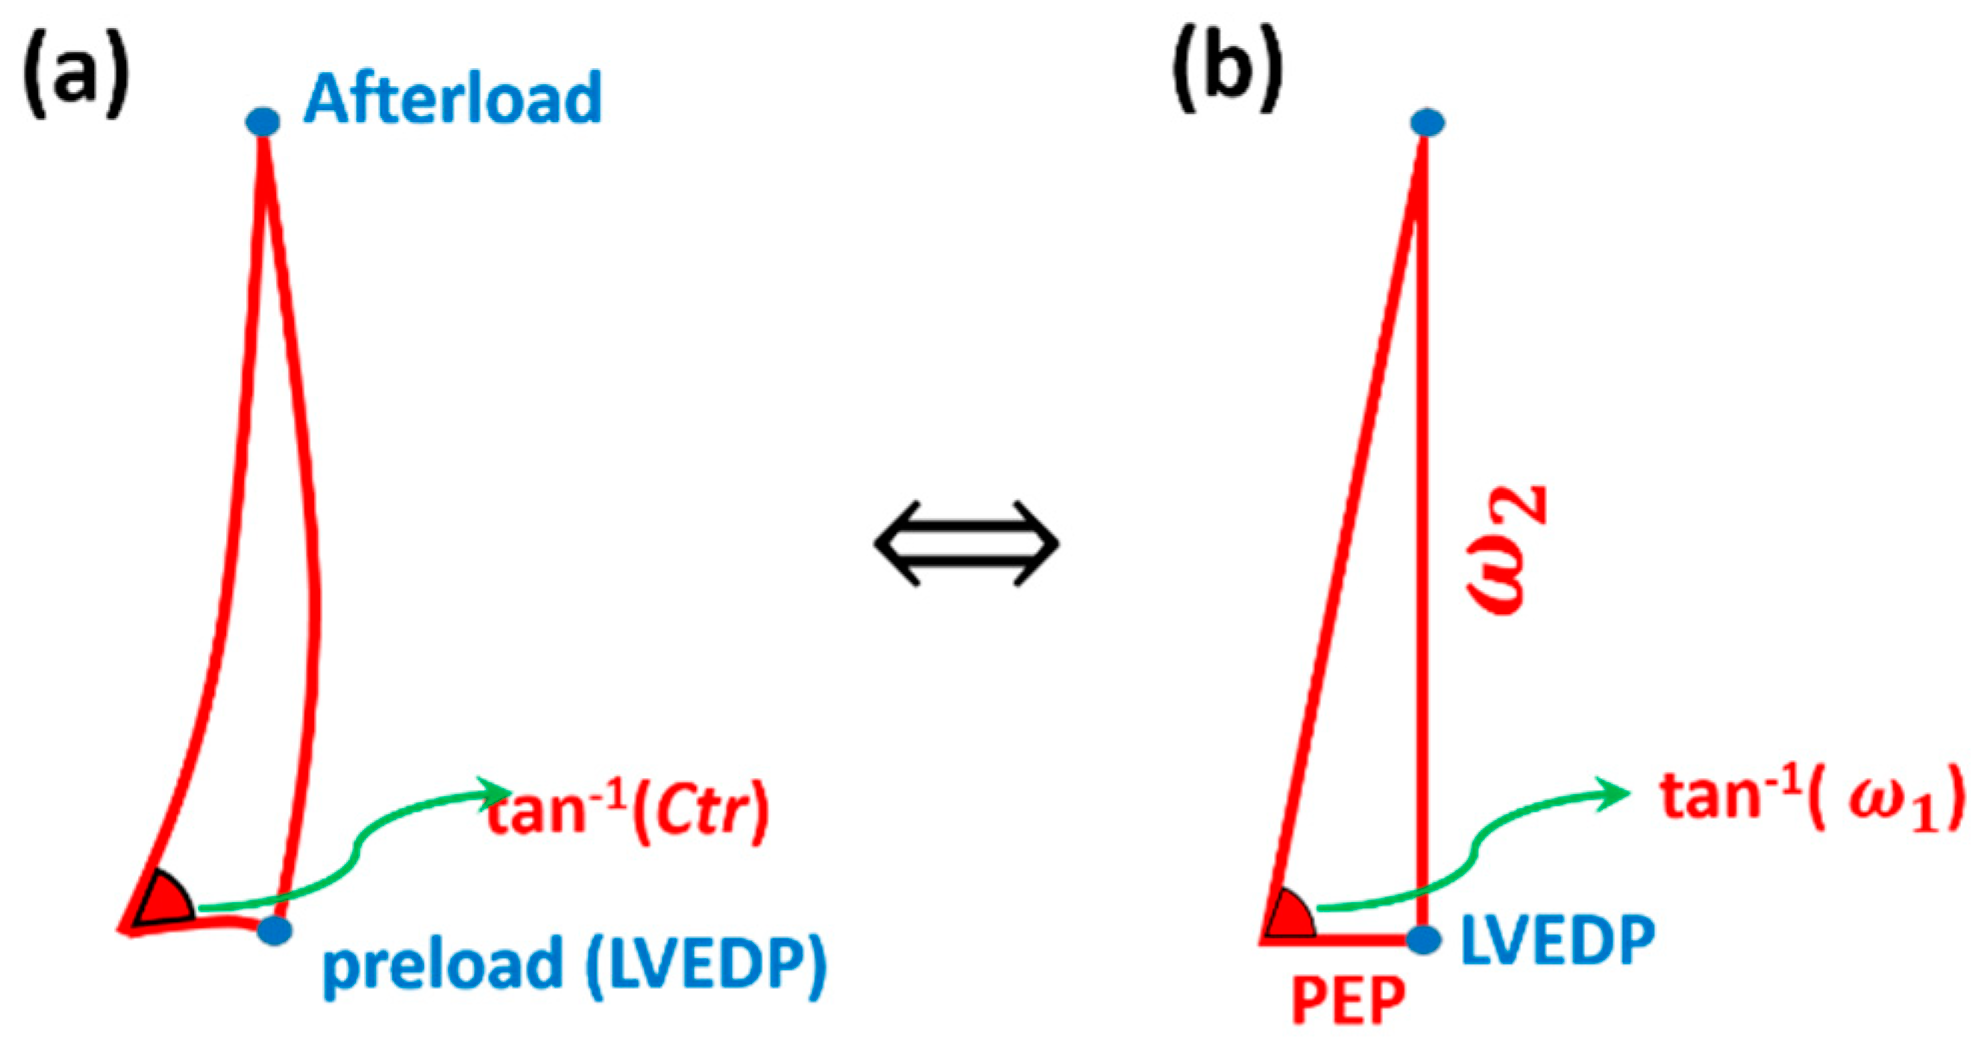
Figure 6.
Cardiac Triangle Mapping (CTM) predicts that LVEDP elevation results in reduction of PEP at fixed LV contractility (the angle) and AoDP, in agreement with Talley et al. [20]. Ctr is LV contractility, PEP is pre-ejection period, LVEDP is LV end diastolic pressure, AoDP is aortic diastolic pressure, and tan−1 is tangent inverse function.
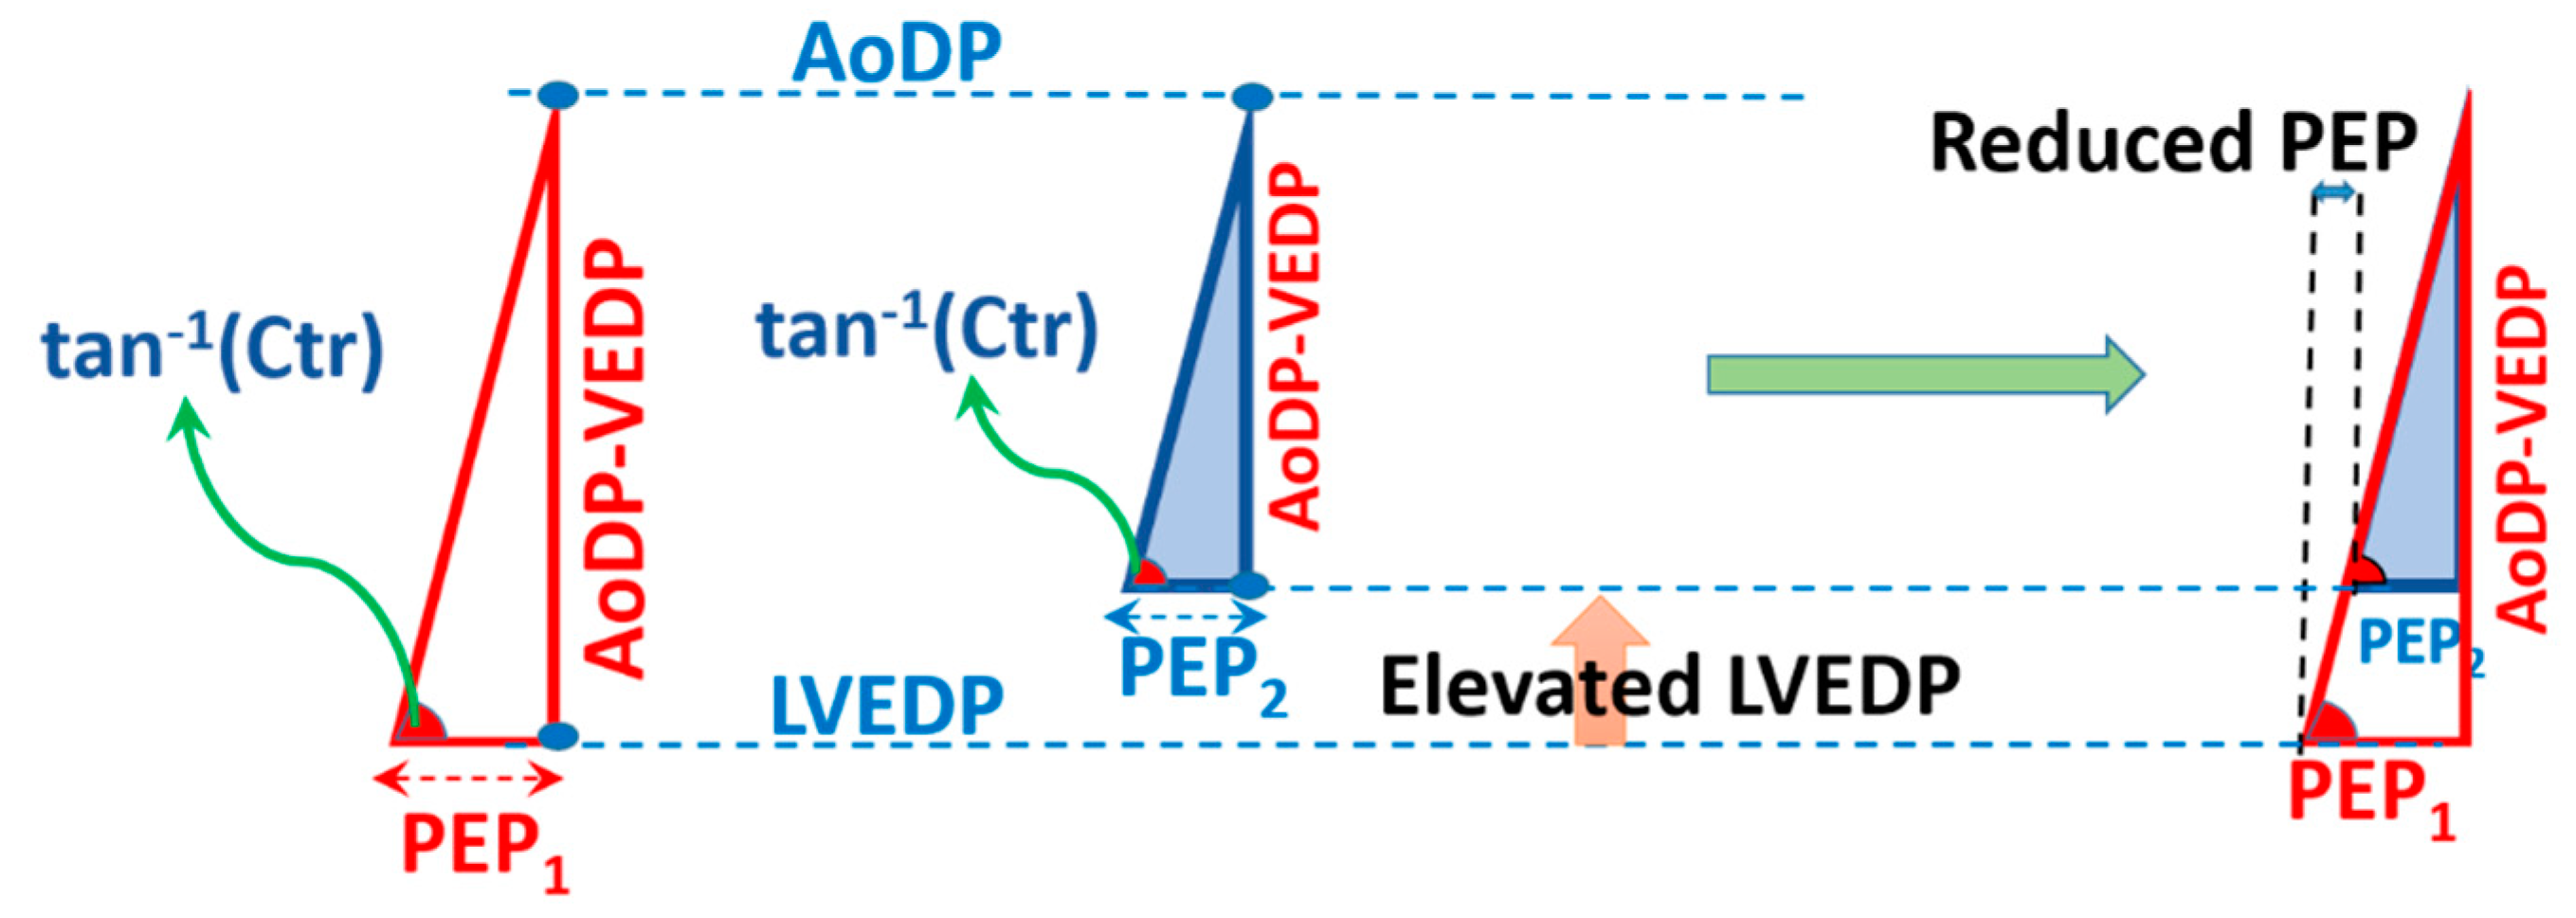
Figure 7.
CTM suggests that PEP increases as LV contractility (the angle) decreases at fixed LVEDP and AoDP, consistent with Talley et al. [20]. Ctr is LV contractility, PEP is pre-ejection period, LVEDP is LV end diastolic pressure, AoDP is aortic diastolic pressure, and tan−1 is tangent inverse function.
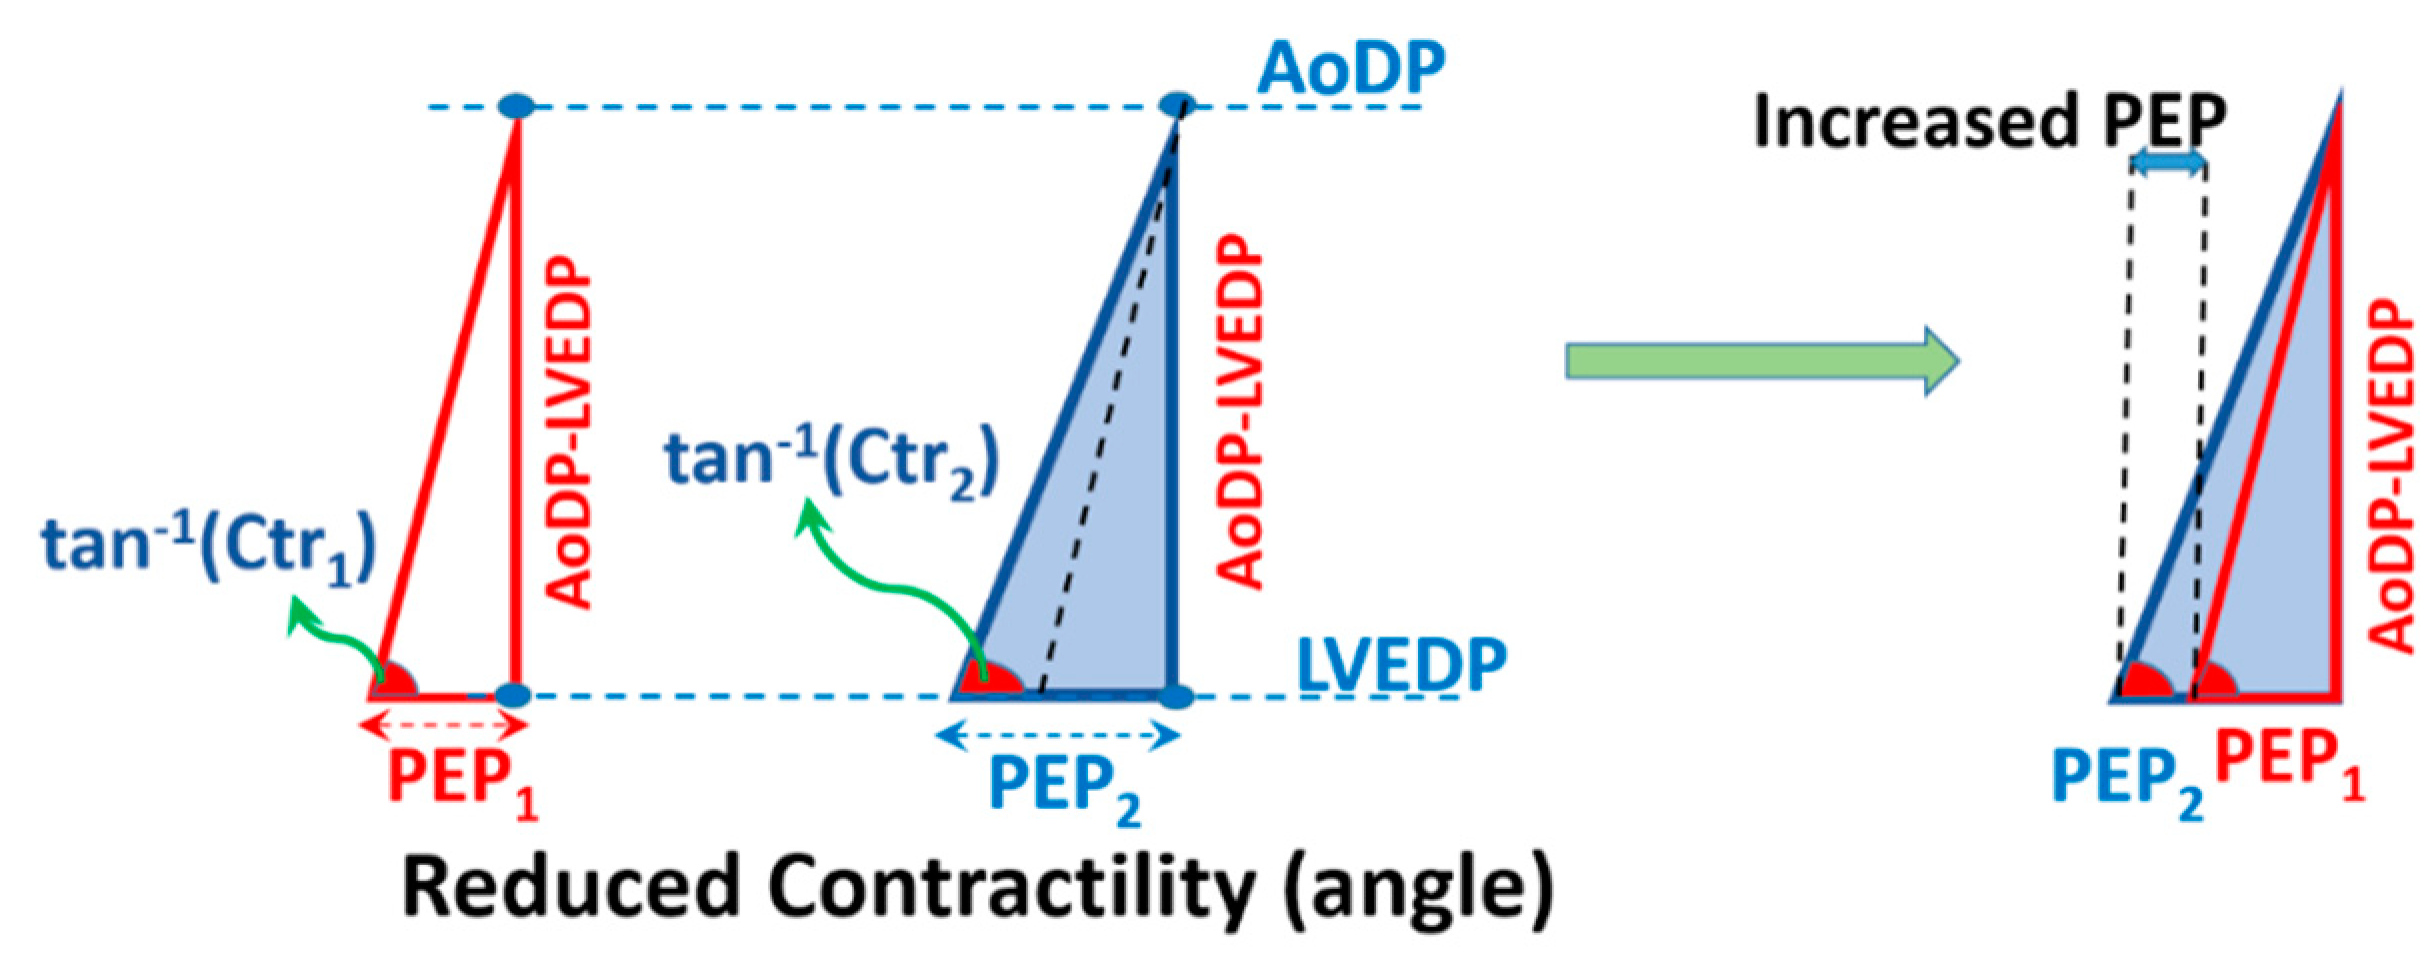
Figure 8.
Per the CTM method, an increase in AoDP results in elongation of PEP at fixed LV contractility (the angle) and LVEDP, similar to Talley et al. [20]. Ctr is LV contractility, PEP is pre-ejection period, LVEDP is LV end diastolic pressure, AoDP is aortic diastolic pressure, and tan−1 is tangent inverse function.
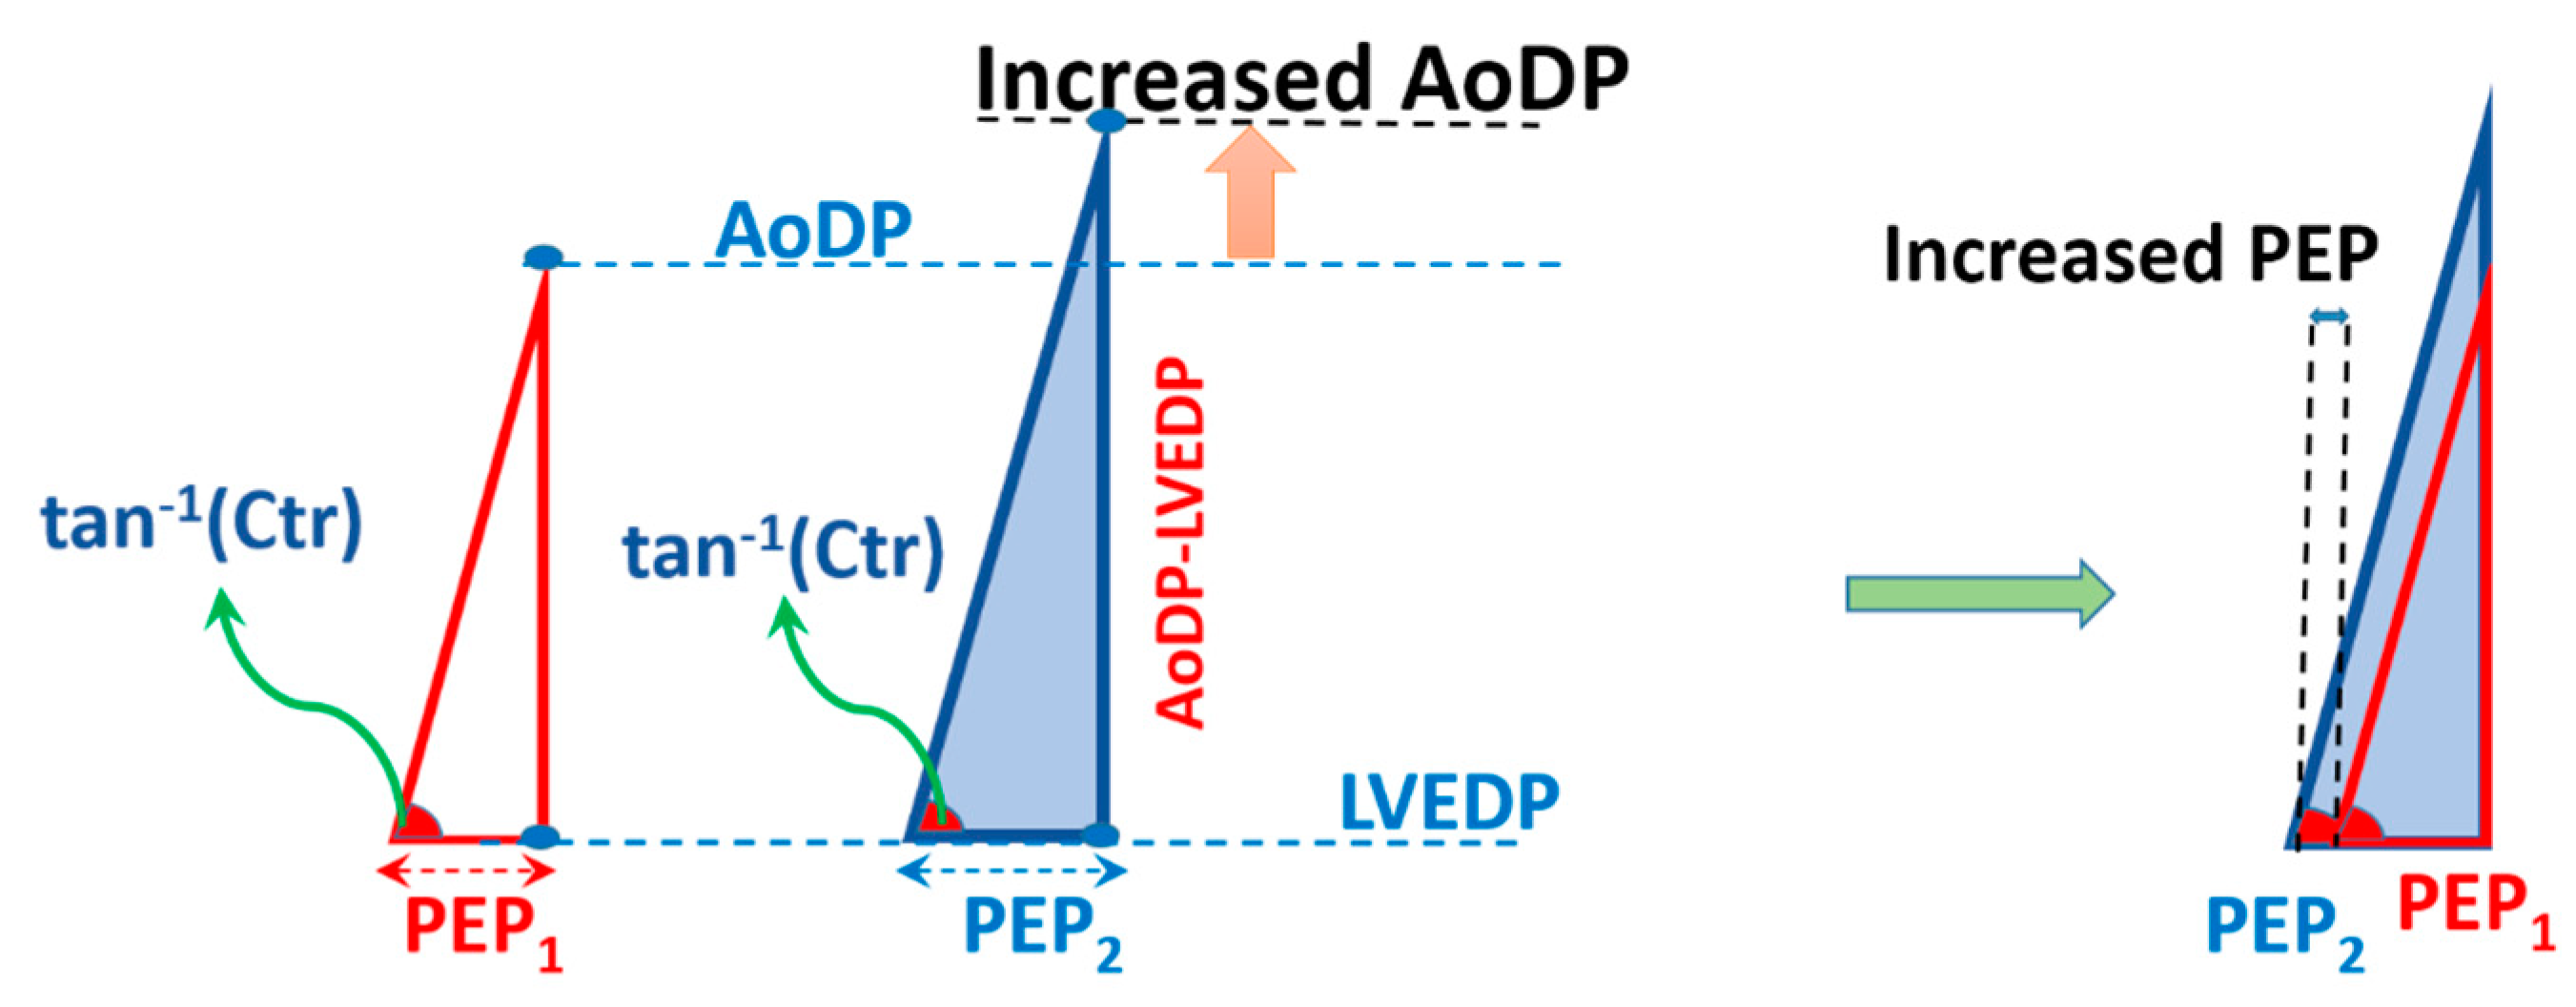
Figure 9.
(a) LVEDP computed from the CTM method using retrospective data from Equation (9) versus LVEDP measured invasively (r = 0.76). (b) Bland-Altman graph comparing LVEDPCTM to LVEDPinvasive. The limit of agreement lines are at ±11.4 mmHg.
Figure 9.
(a) LVEDP computed from the CTM method using retrospective data from Equation (9) versus LVEDP measured invasively (r = 0.76). (b) Bland-Altman graph comparing LVEDPCTM to LVEDPinvasive. The limit of agreement lines are at ±11.4 mmHg.
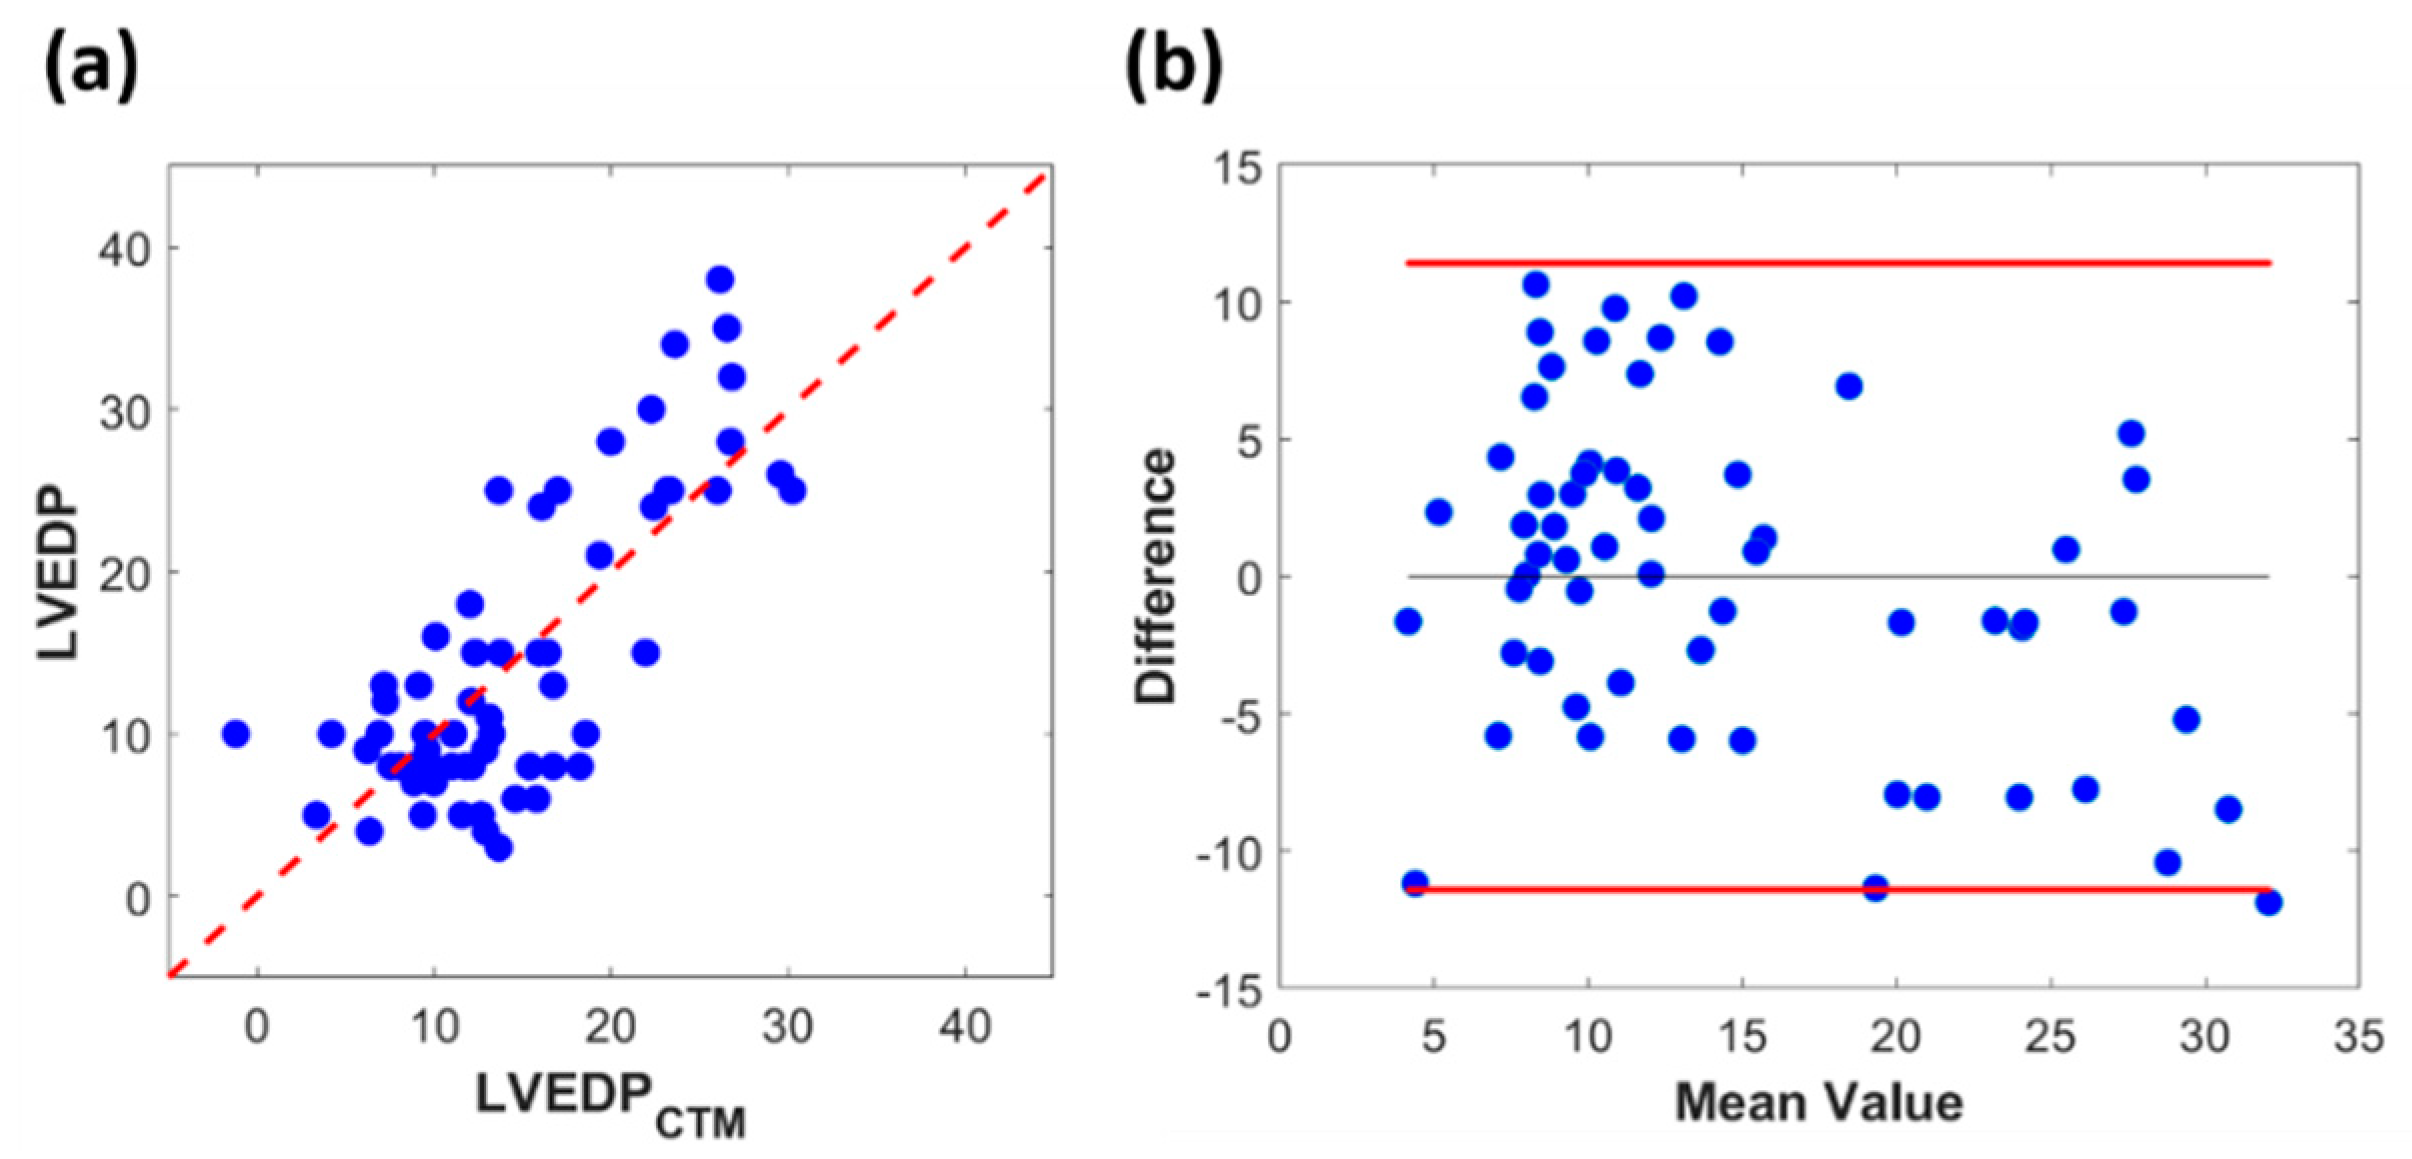
Figure 10.
(a) Boxplot of LVEDPCTM with 15 mmHg threshold. (b) Boxplot of LVEDPCTM with 20 mmHg threshold.
Figure 10.
(a) Boxplot of LVEDPCTM with 15 mmHg threshold. (b) Boxplot of LVEDPCTM with 20 mmHg threshold.

Table 1.
Hemodynamics and physiological values of the study population.
| Number or Mean Value (Range) | Standard Deviation | |
|---|---|---|
| Age (years) | 46 (19–65) | 12 |
| HR (bpm) | 80 (55–114) | 15 |
| PEP (ms) | 127 (82–171) | 21.6 |
| LVEF (%) | 44 (8–84) | 18 |
| Gender (M/F) | 36/26 | NA |
| AoDP (mmHg) | 72 (50–100) | 10.6 |
| T0 (ms) | 241 (172–340) | 38 |
| LVEDP (mmHg) | 15 (3–38) | 9 |
HR is heart rate, PEP is pre-ejection period, LVEF is LV ejection fraction, AoDP is aortic diastolic pressure, T0 is LV systolic ejection time, and LVEDP is LV end diastolic pressure.
© 2019 by the authors. Licensee MDPI, Basel, Switzerland. This article is an open access article distributed under the terms and conditions of the Creative Commons Attribution (CC BY) license (http://creativecommons.org/licenses/by/4.0/).
Share and Cite
MDPI and ACS Style
Pahlevan, N.M.; Matthews, R.V. Cardiac Triangle Mapping: A New Systems Approach for Noninvasive Evaluation of Left Ventricular End Diastolic Pressure. Fluids 2019, 4, 16. https://doi.org/10.3390/fluids4010016
AMA Style
Pahlevan NM, Matthews RV. Cardiac Triangle Mapping: A New Systems Approach for Noninvasive Evaluation of Left Ventricular End Diastolic Pressure. Fluids. 2019; 4(1):16. https://doi.org/10.3390/fluids4010016
Chicago/Turabian StylePahlevan, Niema M., and Ray V. Matthews. 2019. "Cardiac Triangle Mapping: A New Systems Approach for Noninvasive Evaluation of Left Ventricular End Diastolic Pressure" Fluids 4, no. 1: 16. https://doi.org/10.3390/fluids4010016