

Feasibility of Enzymatic Protein Extraction from a Dehydrated Fish Biomass Obtained from Unsorted Canned Yellowfin Tuna Side Streams: Part I
 , ,
, , 
Abstract
:1. Introduction
2. Results and Discussion
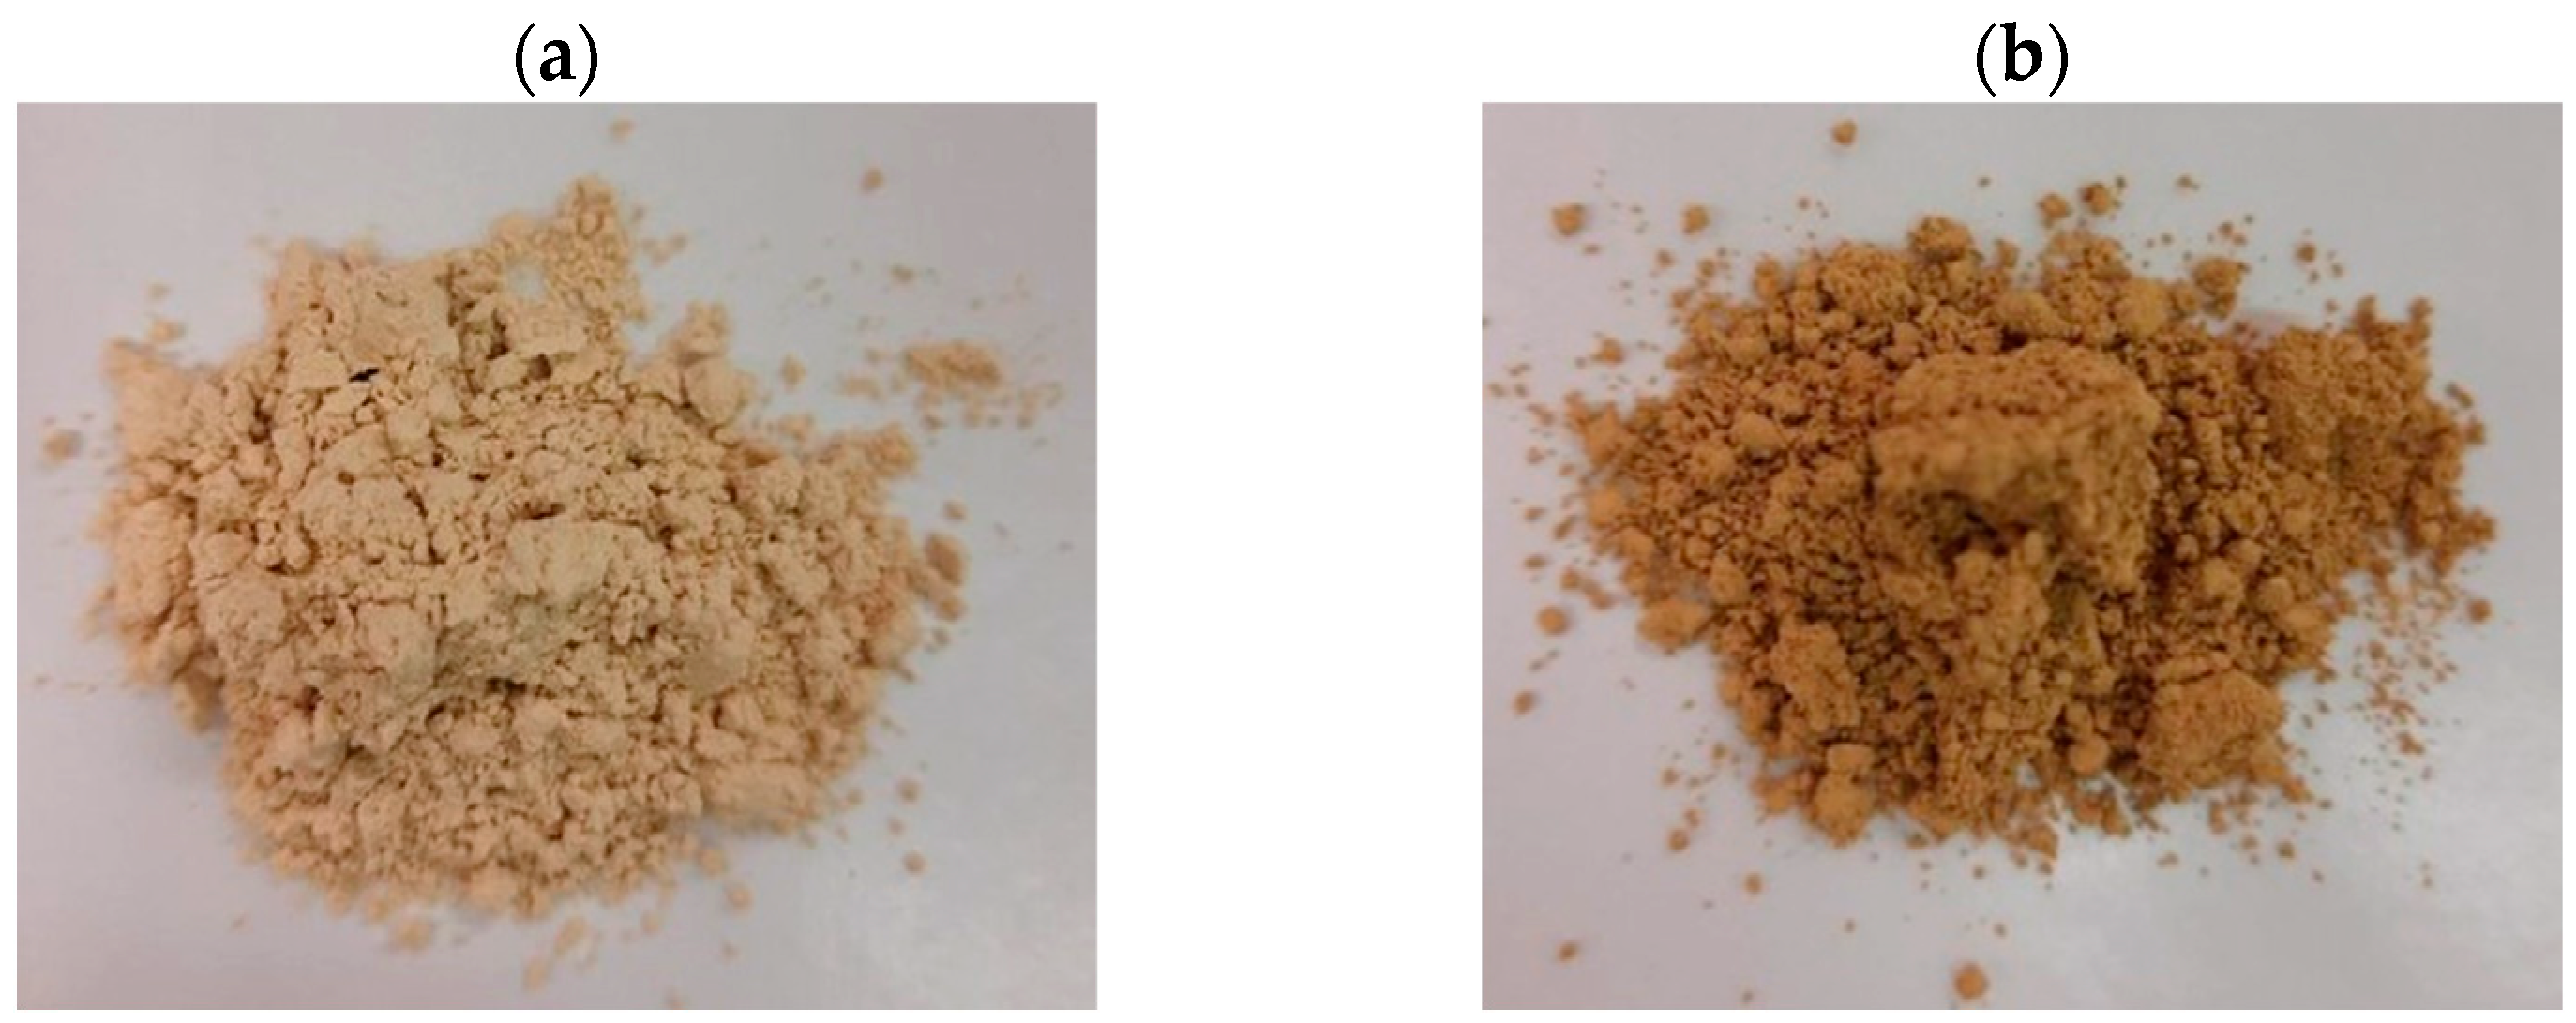
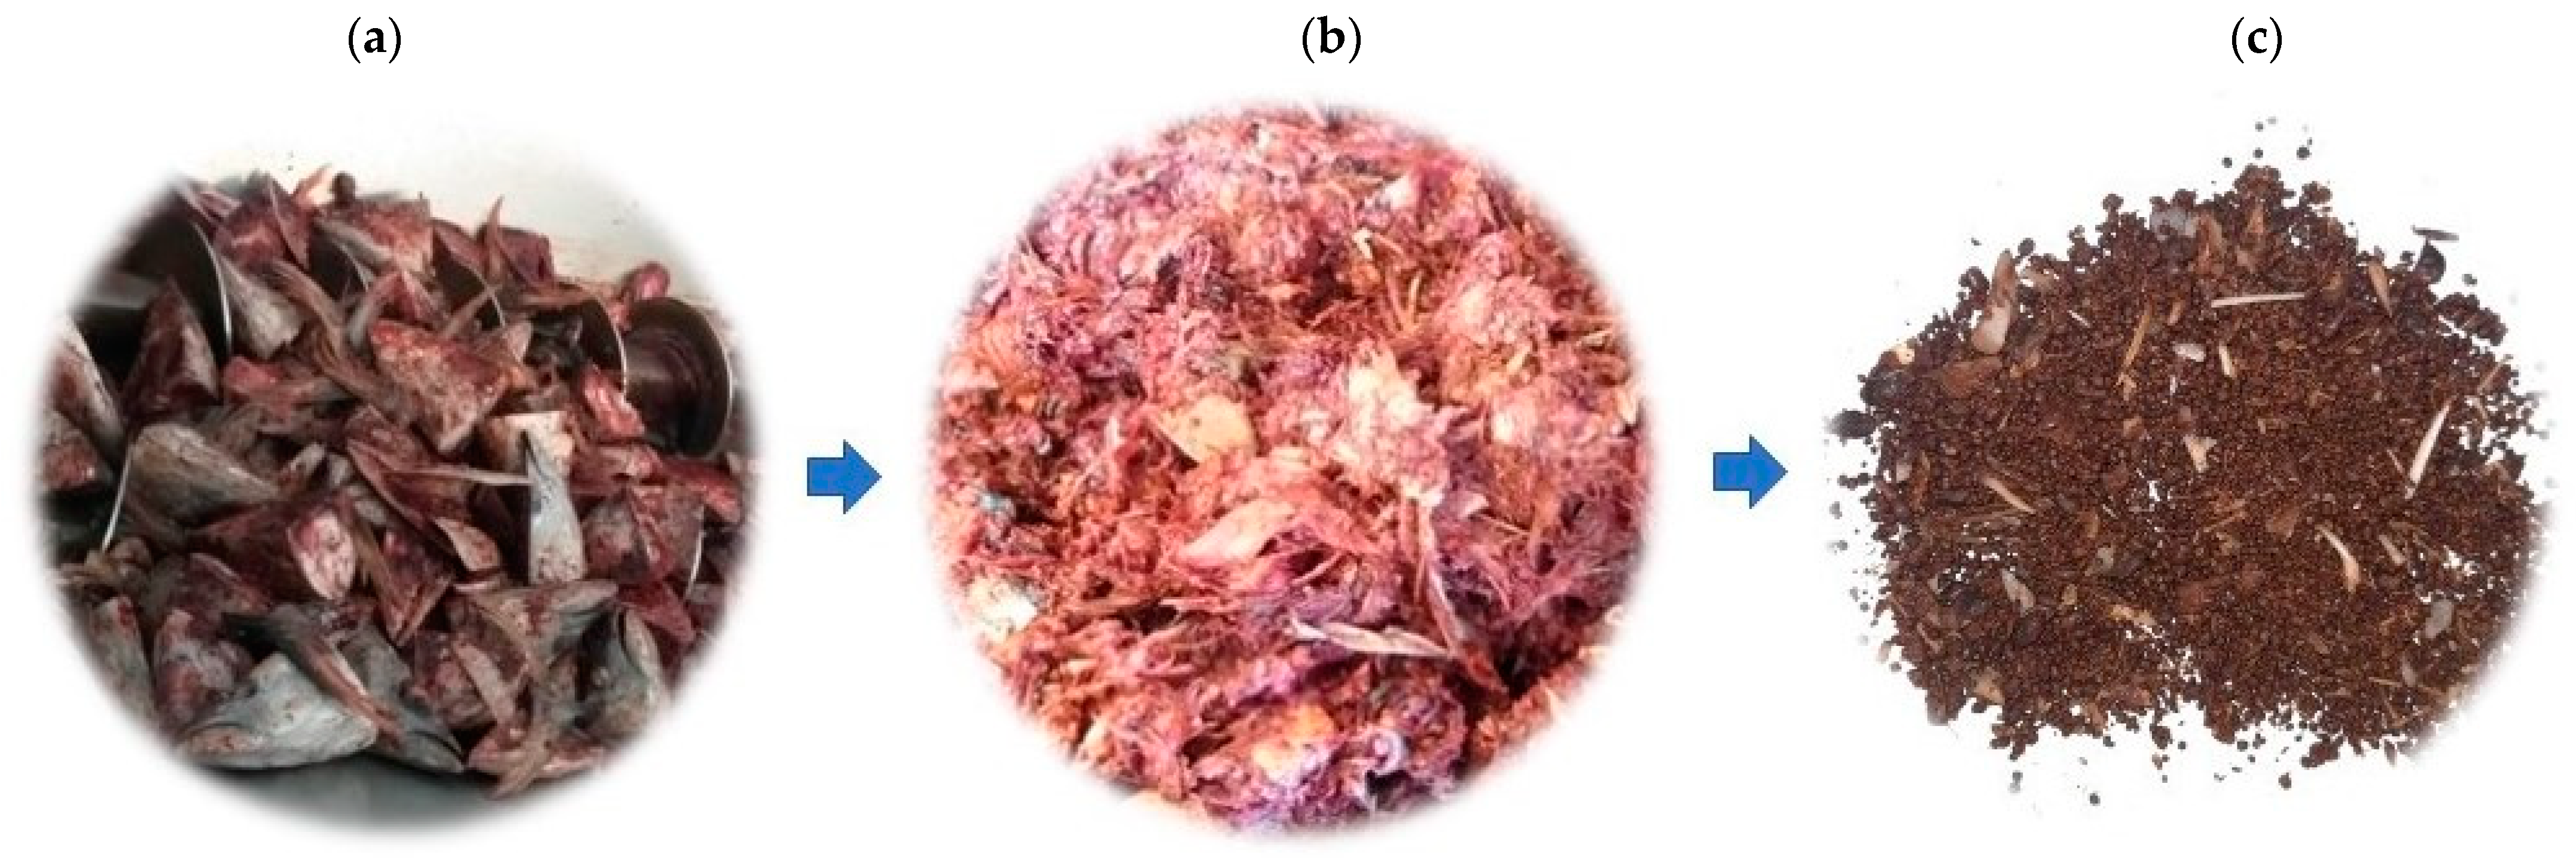
2.1. Proximate Composition and Monitoring of Lipid Oxidation of Samples Pre (NDFB) and Post (YDFB) Industrial Dehydration
2.2. Characterization of Enzymatic Protein Extracts
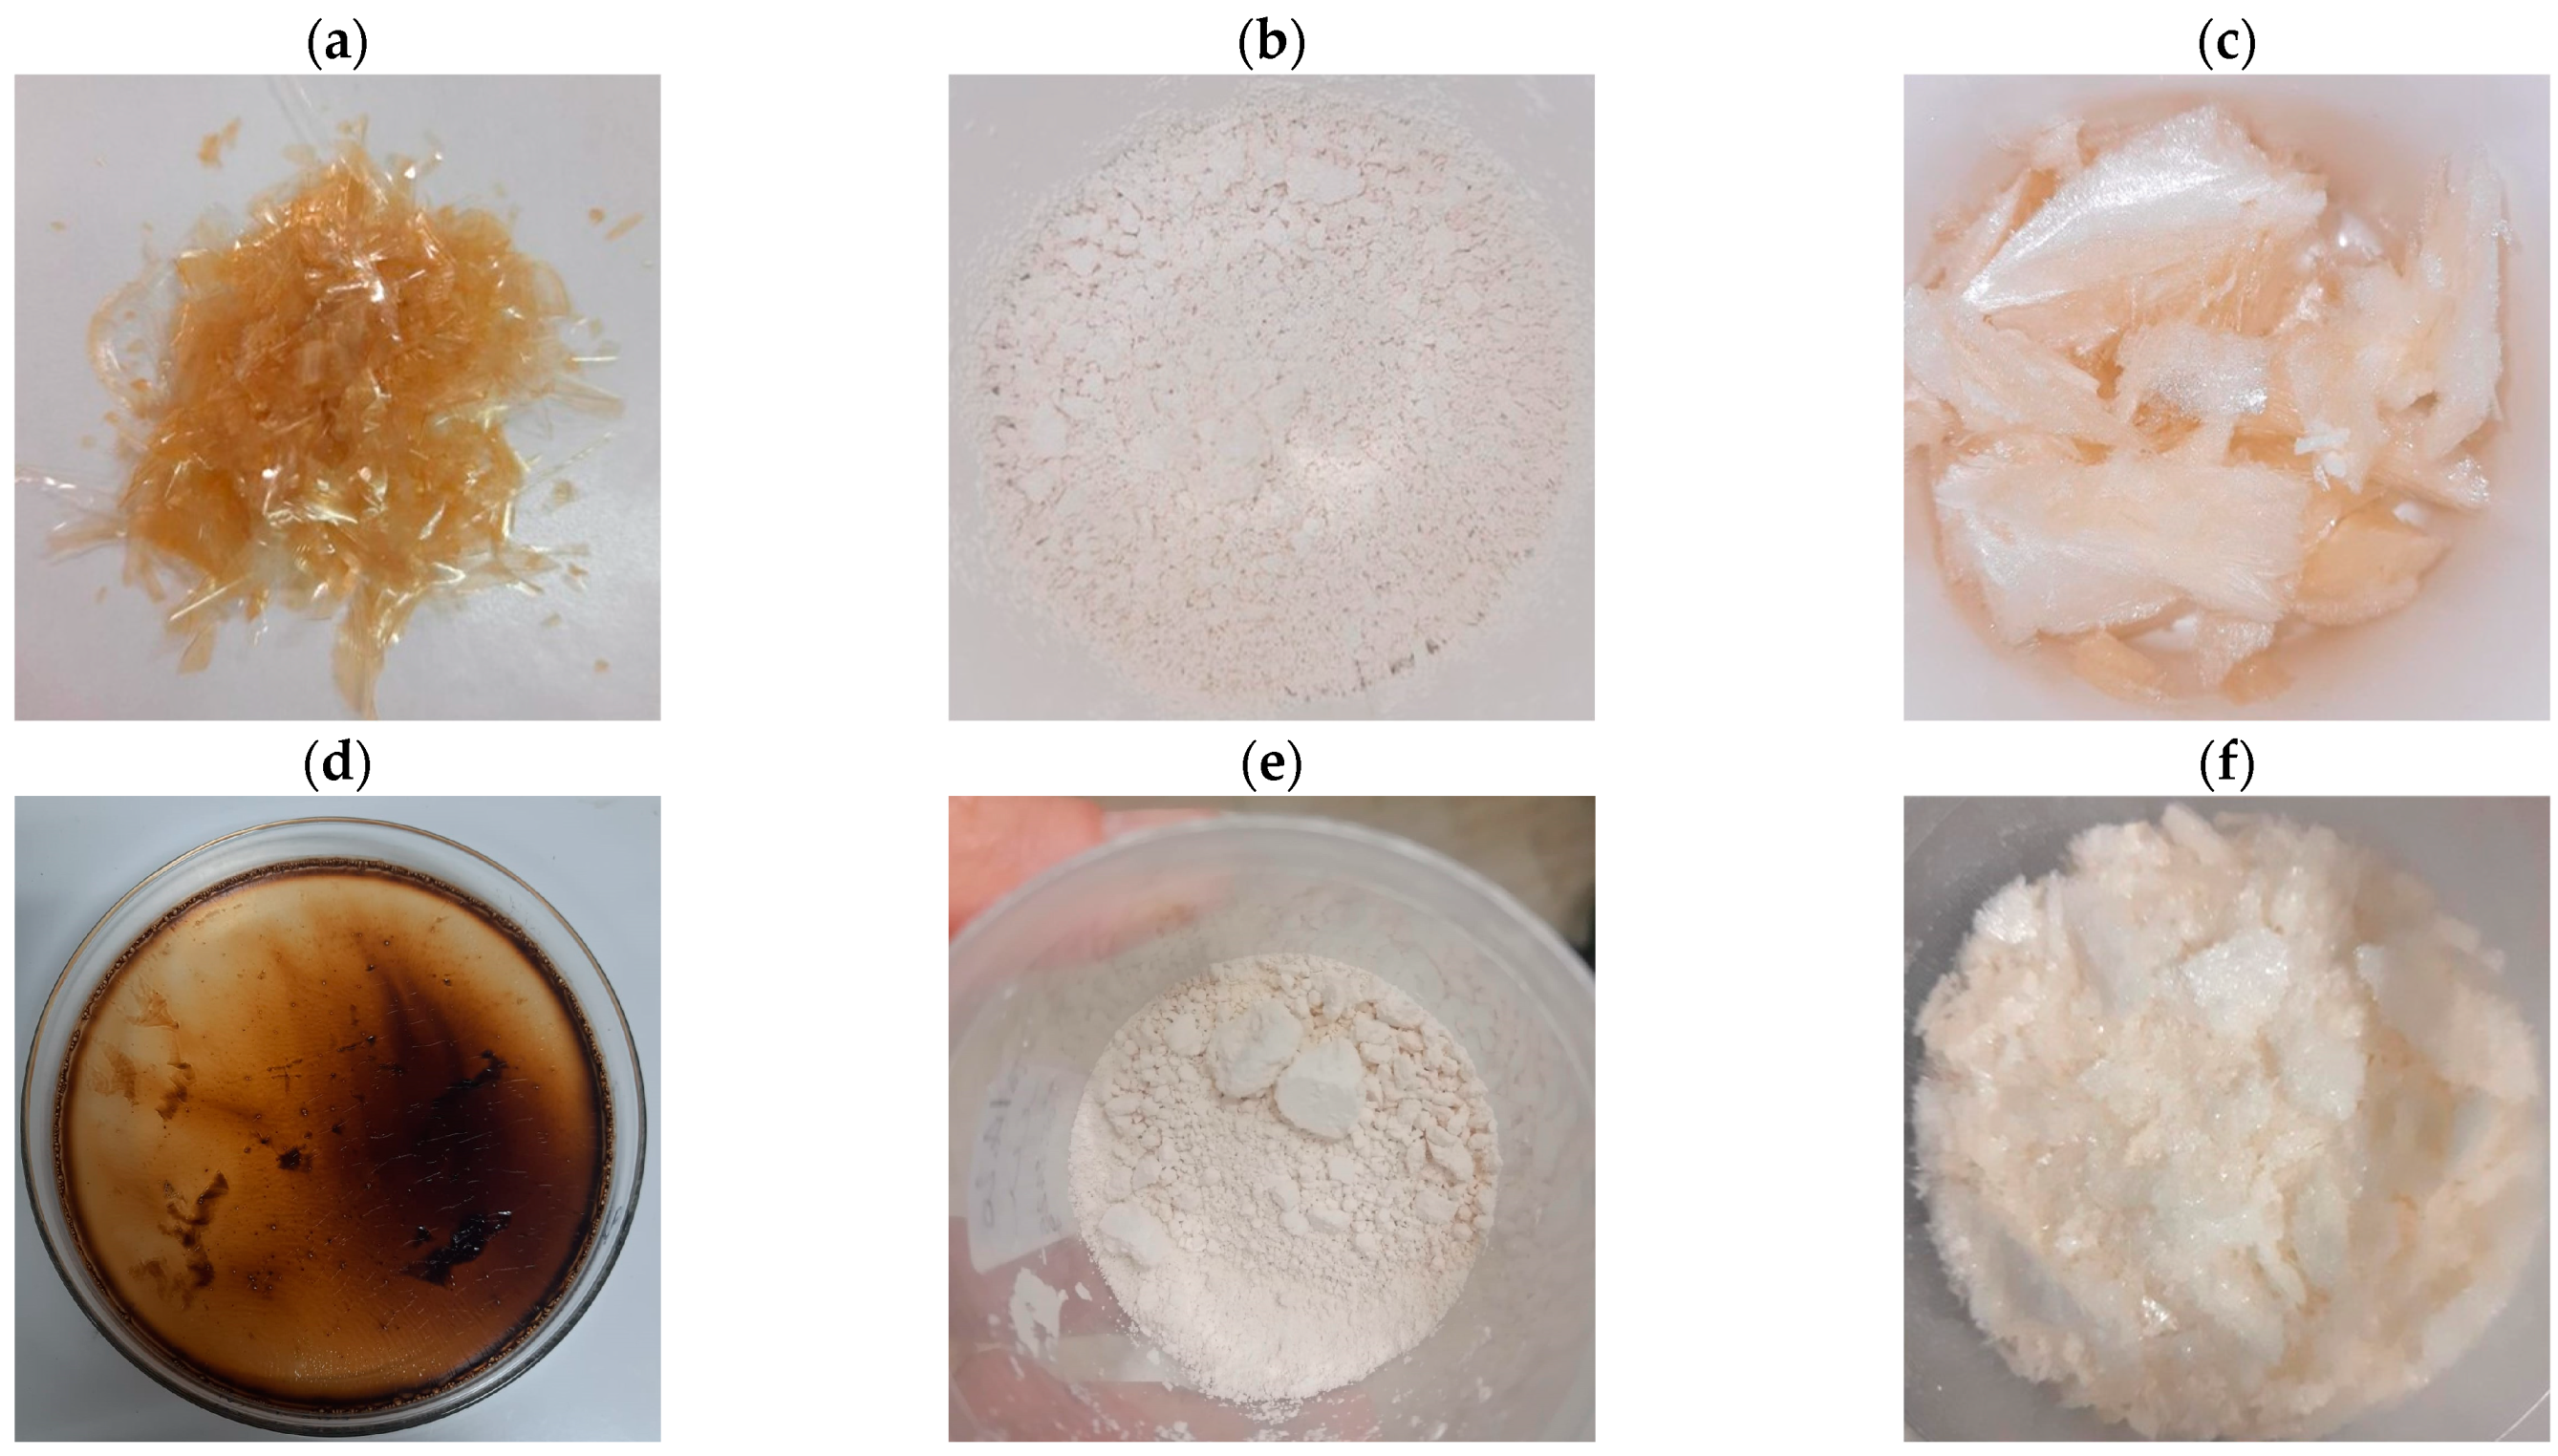
2.2.1. Extraction, Yields, and Proximate Analysis
2.2.2. Amino Acid Analysis
2.2.3. FT-IR (Fourier-Transform Infrared) Spectroscopy Analysis
2.2.4. Color Analysis
2.3. Additional Analyses on Extracted Gelatin
2.3.1. pH
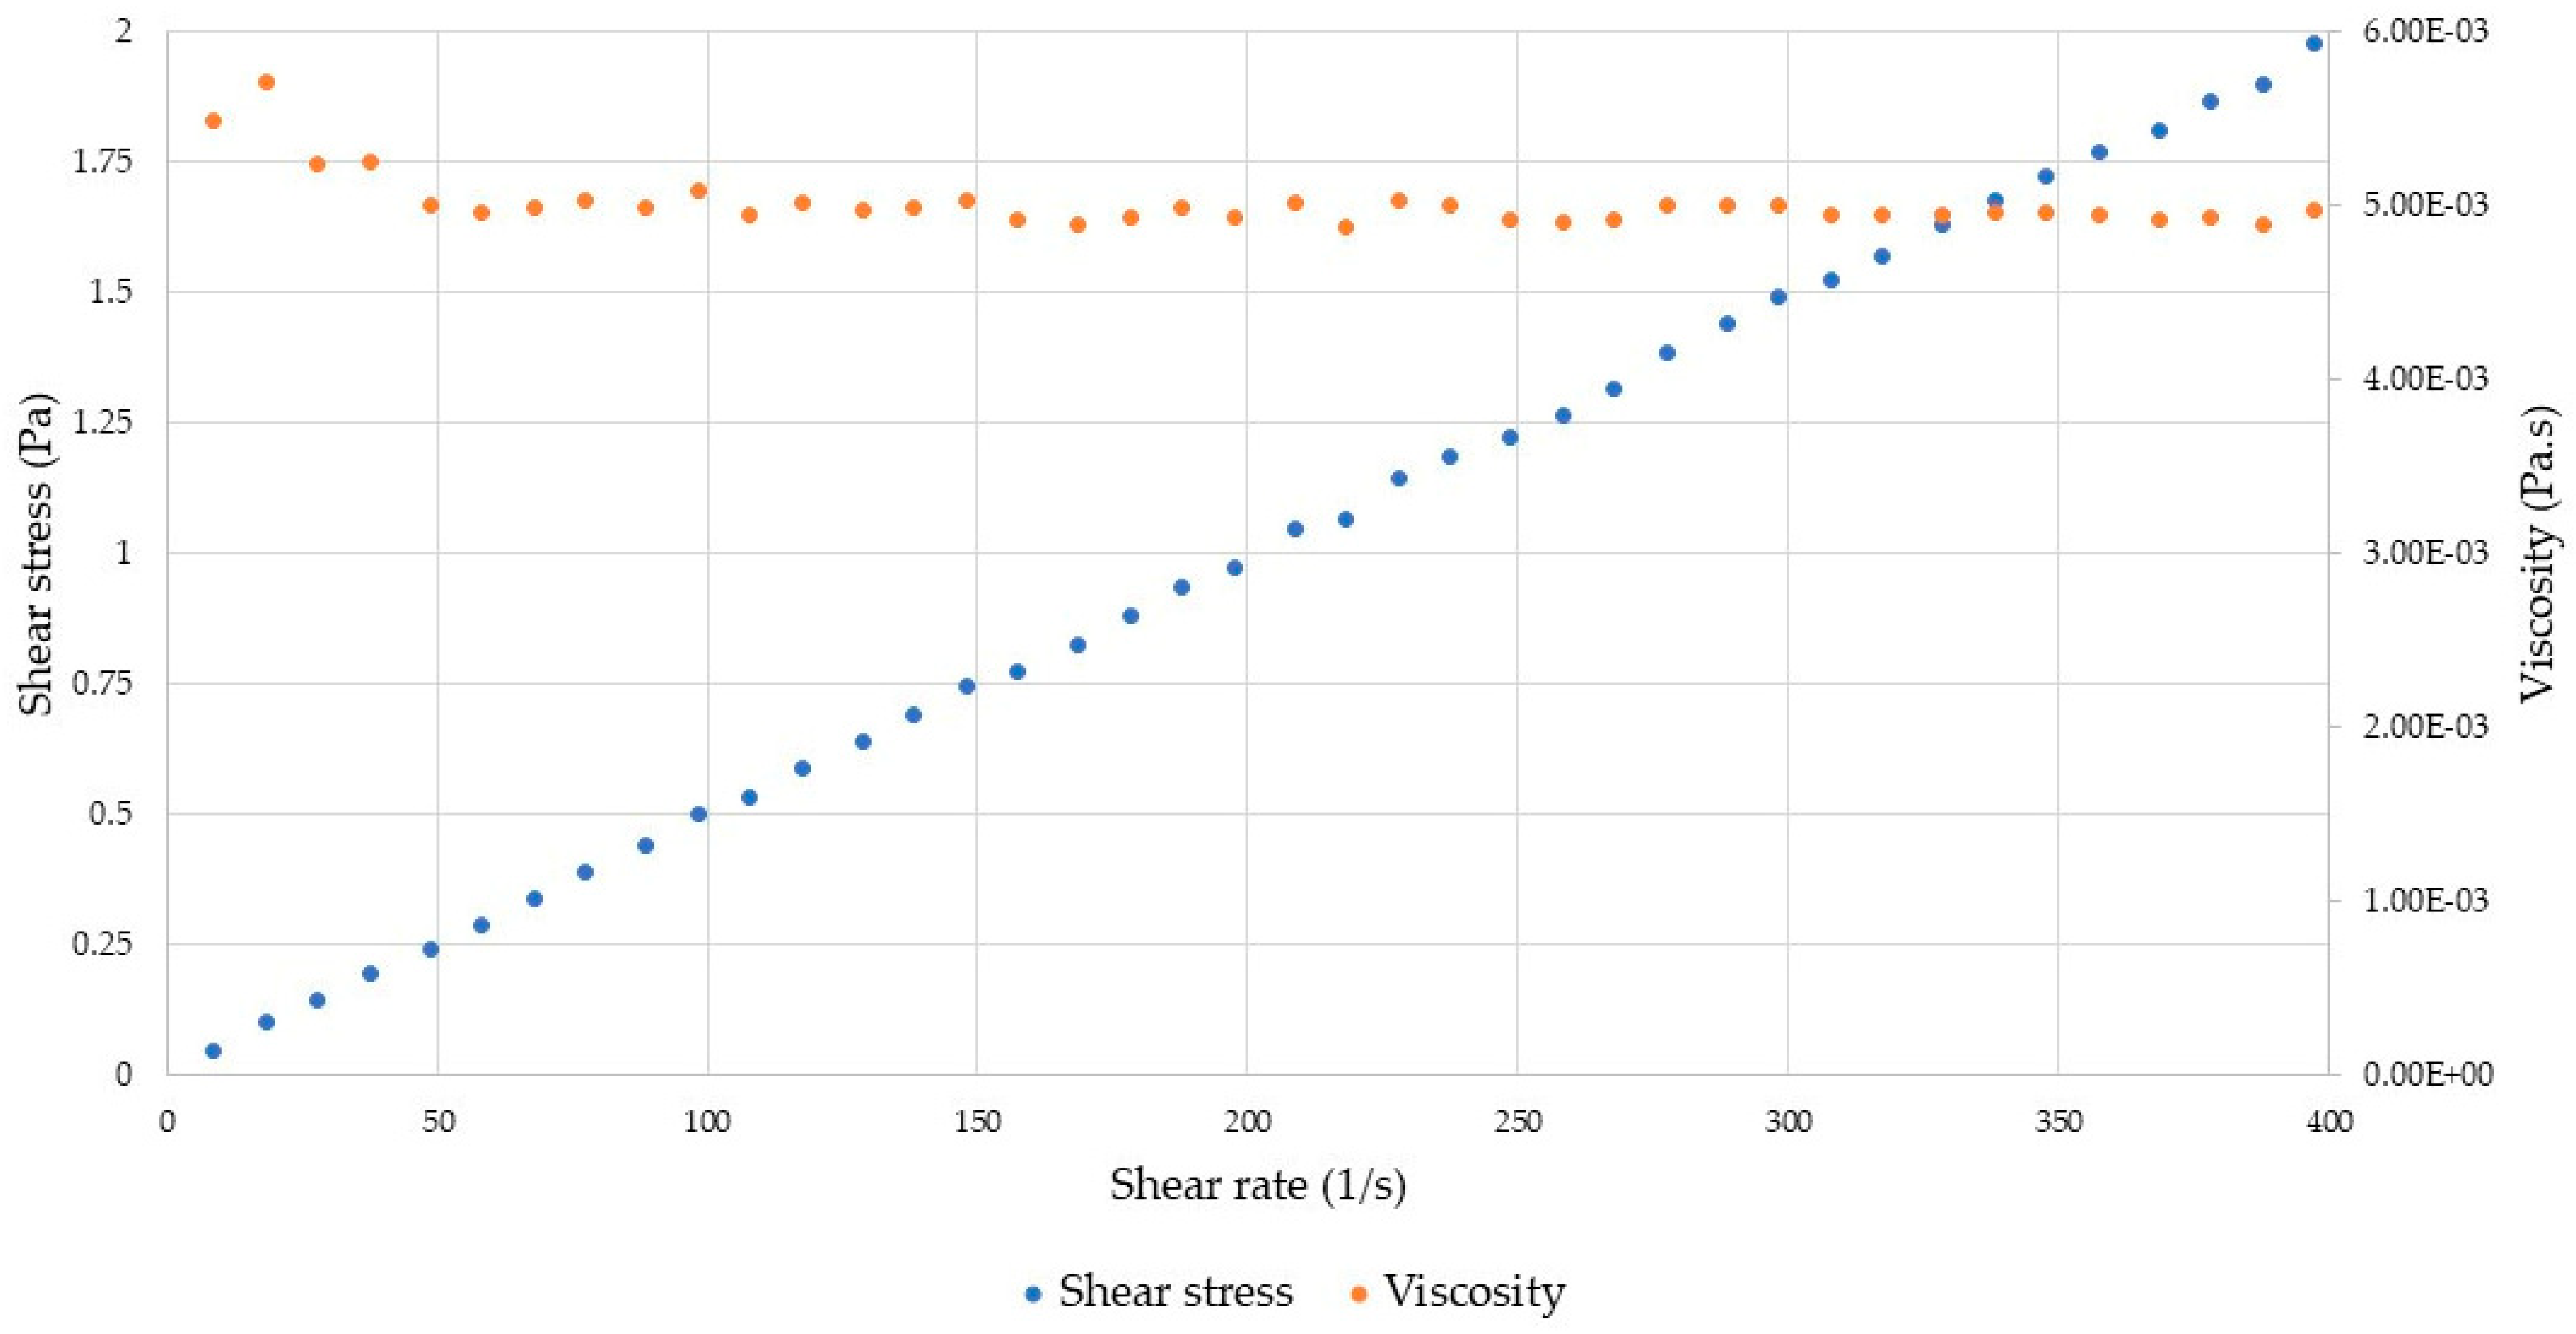
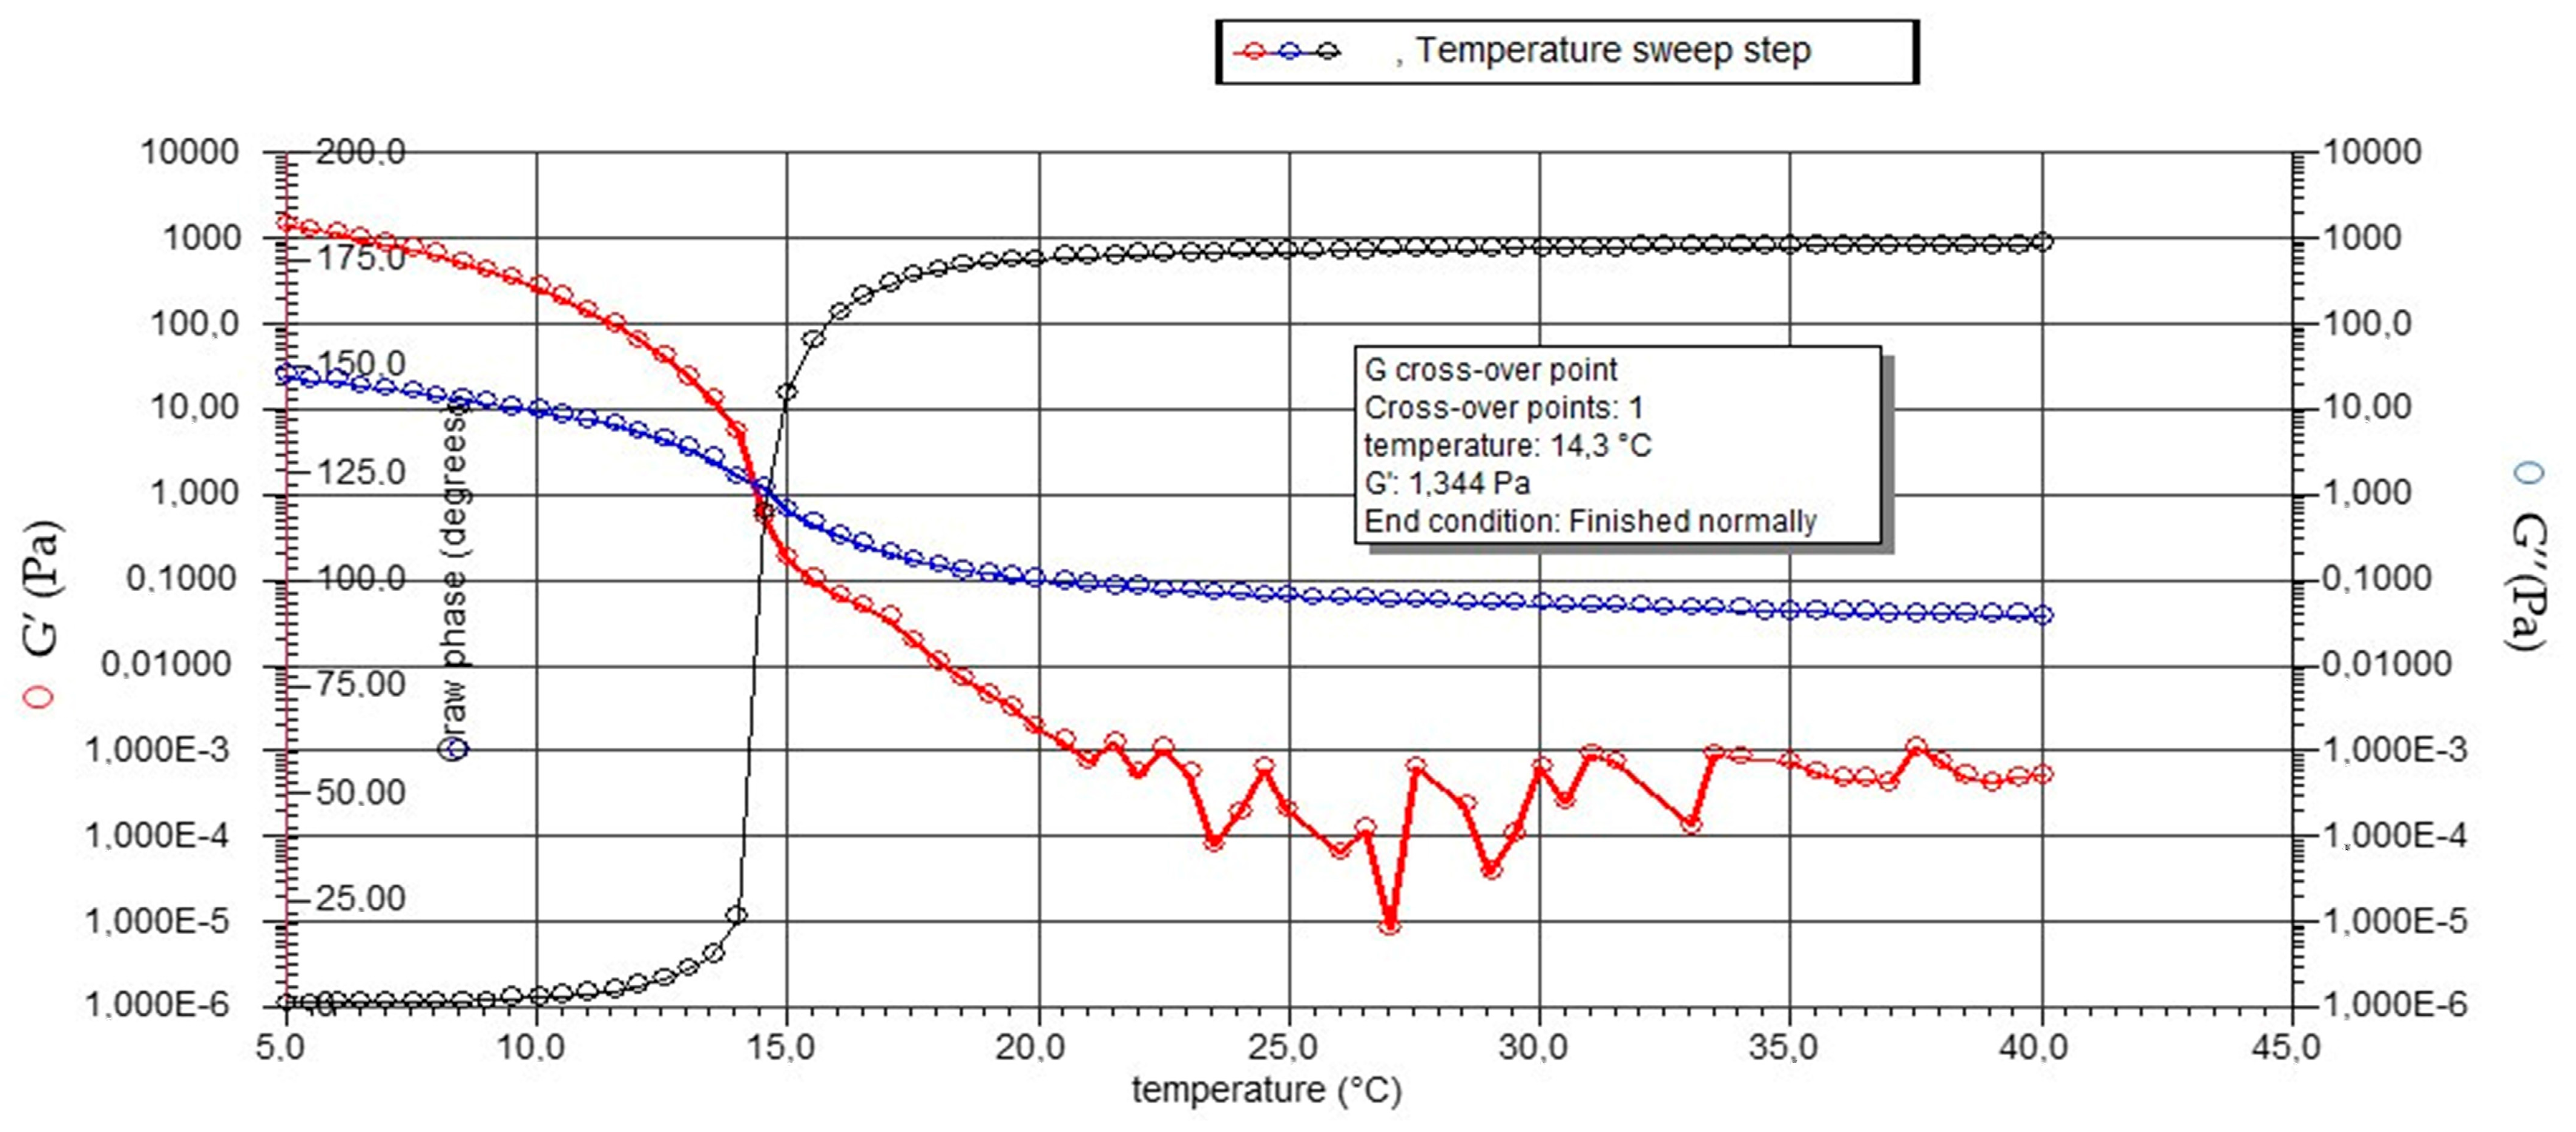
2.3.2. Rheological Analyses
3. Conclusions
4. Materials and Methods
4.1. Samples and Chemicals
4.2. Preliminary Analyses
4.2.1. Proximate Composition and Monitoring of Lipid Oxidation of Samples Pre (NDFB) and Post (YDFB) Industrial Dehydration
4.2.2. Microbiological Analyses
4.3. Enzymatic Extraction of Proteins
4.3.1. Pre-Treatment
4.3.2. Gelatin and Hydrolyzed Gelatin Peptides (HGPs) Extraction
4.4. Yields
4.5. Characterization of Protein Extracts
4.5.1. Proximate Analysis
4.5.2. Amino Acids Analysis
4.5.3. ATR-FTIR Analysis
4.5.4. Color Analysis
4.6. Additional Analyses on Extracted Gelatin
4.6.1. pH
4.6.2. Rheological Analyses
4.7. Statistical Analysis
Supplementary Materials
Author Contributions
Funding
Institutional Review Board Statement
Informed Consent Statement
Data Availability Statement
Acknowledgments
Conflicts of Interest
References
- Rana, S.; Singh, A.; Surasani, V.K.R.; Kapoor, S.; Desai, A.; Kumar, S. Fish Processing Waste: A Novel Source of Non-Conventional Functional Proteins. Int. J. Food Sci. Technol. 2023, 58, 2637–2644. [Google Scholar] [CrossRef]
- The State of World Fisheries and Aquaculture (SOFIA); FAO: Rome, Italy, 2022; Available online: https://www.fao.org/3/cc0461en/cc0461en.pdf (accessed on 19 May 2023).
- Coppola, D.; Lauritano, C.; Palma Esposito, F.; Riccio, G.; Rizzo, C.; De Pascale, D. Fish Waste: From Problem to Valuable Resource. Mar. Drugs 2021, 19, 116. [Google Scholar] [CrossRef]
- Demonstrable and Replicable Cluster Implementing Systemic Solutions through Multilevel Circular Value Chains for Eco-Efficient Valorization of Fishing and Fish Industries Side-Streams (EcoeFISHent) (EU-CORDIS, 2021). Available online: https://ecoefishent.eu/ (accessed on 1 September 2023).
- Jaziri, A.A.; Wardani, D.W.; Noordin, W.N.; Huda, N. Fish Side-Stream as a Potential Peptone Production: Towards Zero Waste Fish Processing. In Proceedings of the 1st International Conference on Fisheries and Marine Research (ICoFMR 2020), Malang, Indonesia, 4 November 2020. [Google Scholar]
- Nawaz, A.; Li, E.; Irshad, S.; Xiong, Z.; Xiong, H.; Shahbaz, H.M.; Siddique, F. Valorization of Fisheries By-Products: Challenges and Technical Concerns to Food Industry. Trends Food Sci. Technol. 2020, 99, 34–43. [Google Scholar] [CrossRef]
- Ghaly, A.E.; Ramakrishnan, V.V.; Brooks, M.S.; Budge, S.M.; Dave, D. Fish Processing Wastes as a Potential Source of Proteins, Amino Acids and Oils: A Critical Review. J. Microb. Biochem. Technol. 2013, 5, 107–129. [Google Scholar] [CrossRef]
- Qiu, Y.-T.; Wang, Y.-M.; Yang, X.-R.; Zhao, Y.-Q.; Chi, C.-F.; Wang, B. Gelatin and Antioxidant Peptides from Gelatin Hydrolysate of Skipjack Tuna (Katsuwonus pelamis) Scales: Preparation, Identification and Activity Evaluation. Mar. Drugs 2019, 17, 565. [Google Scholar] [CrossRef]
- Chalamaiah, M.; Dinesh Kumar, B.; Hemalatha, R.; Jyothirmayi, T. Fish Protein Hydrolysates: Proximate Composition, Amino Acid Composition, Antioxidant Activities and Applications: A Review. Food Chem. 2012, 135, 3020–3038. [Google Scholar] [CrossRef]
- SpecTUNA: Better Quality and a More Competitive Tuna Industry Thanks to EU Funding. Available online: https://ec.europa.eu/newsroom/mare/items/700734 (accessed on 28 April 2023).
- Nurilmala, M.; Pertiwi, R.M.; Nurhayati, T.; Fauzi, S.; Batubara, I.; Ochiai, Y. Characterization of Collagen and Its Hydrolysate from Yellowfin Tuna Thunnus albacares Skin and Their Potencies as Antioxidant and Antiglycation Agents. Fish. Sci. 2019, 85, 591–599. [Google Scholar] [CrossRef]
- Herpandi, N.H.; Rosma, A.; Wan Nadiah, W.A. The Tuna Fishing Industry: A New Outlook on Fish Protein Hydrolysates. Compr. Rev. Food Sci. Food Saf. 2011, 10, 195–207. [Google Scholar] [CrossRef]
- Guerard, F.; Guimas, L.; Binet, A. Production of Tuna Waste Hydrolysates by a Commercial Neutral Protease Preparation. J. Mol. Catal. B Enzym. 2002, 19–20, 489–498. [Google Scholar] [CrossRef]
- Zilhadia; Yahdiana, H.; Irwandi, J.; Effionora, A. Characterization and Functional Properties of Gelatin Extracted from Goatskin. Int. Food Res. J. 2018, 25, 275–281. [Google Scholar]
- EFSA Panel on Biological Hazards (BIOHAZ); Koutsoumanis, K.; Allende, A.; Bolton, D.J.; Bover-Cid, S.; Chemaly, M.; Davies, R.; De Cesare, A.; Herman, L.M.; Hilbert, F.; et al. Potential BSE Risk Posed by the Use of Ruminant Collagen and Gelatine in Feed for Non-ruminant Farmed Animals. EFSA J. 2020, 18, e06267. [Google Scholar] [CrossRef]
- Coppola, D.; Oliviero, M.; Vitale, G.A.; Lauritano, C.; D’Ambra, I.; Iannace, S.; De Pascale, D. Marine Collagen from Alternative and Sustainable Sources: Extraction, Processing and Applications. Mar. Drugs 2020, 18, 214. [Google Scholar] [CrossRef]
- Muhammad, K.M.L.; Ariffin, F.; Abd Razak, H.K.B.; Sulaiman, P.D.S. Review of Fish Gelatin Extraction, Properties and Packaging Applications. Food Sci. Nutr. 2016, 56, 47–59. [Google Scholar]
- Shyni, K.; Hema, G.S.; Ninan, G.; Mathew, S.; Joshy, C.G.; Lakshmanan, P.T. Isolation and Characterization of Gelatin from the Skins of Skipjack Tuna (Katsuwonus pelamis), Dog Shark (Scoliodon sorrakowah), and Rohu (Labeo rohita). Food Hydrocoll. 2014, 39, 68–76. [Google Scholar] [CrossRef]
- Kołodziejska, I.; Skierka, E.; Sadowska, M.; Kołodziejski, W.; Niecikowska, C. Effect of Extracting Time and Temperature on Yield of Gelatin from Different Fish Offal. Food Chem. 2008, 107, 700–706. [Google Scholar] [CrossRef]
- Cebi, N.; Durak, M.Z.; Toker, O.S.; Sagdic, O.; Arici, M. An Evaluation of Fourier Transforms Infrared Spectroscopy Method for the Classification and Discrimination of Bovine, Porcine and Fish Gelatins. Food Chem. 2016, 190, 1109–1115. [Google Scholar] [CrossRef]
- Tekle, S.; Bozkurt, F.; Akman, P.K.; Sagdic, O. Bioactive and Functional Properties of Gelatin Peptide Fractions Obtained from Sea Bass (Dicentrarchus labrax) Skin. Food Sci. Technol. 2022, 42, e60221. [Google Scholar] [CrossRef]
- Usman, M.; Sahar, A.; Inam-Ur-Raheem, M.; Rahman, U.U.; Sameen, A.; Aadil, R.M. Gelatin Extraction from Fish Waste and Potential Applications in Food Sector. Int. J. Food Sci. Technol. 2022, 57, 154–163. [Google Scholar] [CrossRef]
- Noor, N.Q.I.M.; Razali, R.S.; Ismail, N.K.; Ramli, R.A.; Razali, U.H.M.; Bahauddin, A.R.; Zaharudin, N.; Rozzamri, A.; Bakar, J.; Shaarani, S.M. Application of Green Technology in Gelatin Extraction: A Review. Processes 2021, 9, 2227. [Google Scholar] [CrossRef]
- Rather, J.A.; Akhter, N.; Ashraf, Q.S.; Mir, S.A.; Makroo, H.A.; Majid, D.; Barba, F.J.; Khaneghah, A.M.; Dar, B.N. A Comprehensive Review on Gelatin: Understanding Impact of the Sources, Extraction Methods, and Modifications on Potential Packaging Applications. Food Packag. Shelf Life 2022, 34, 100945. [Google Scholar] [CrossRef]
- Lu, W.-C.; Chiu, C.-S.; Chan, Y.-J.; Mulio, A.T.; Li, P.-H. Characterization and Biological Properties of Marine By-Product Collagen through Ultrasound-Assisted Extraction. Aquac. Rep. 2023, 29, 101514. [Google Scholar] [CrossRef]
- Tiwari, M.; Barooah, M.S.; Sharma, P.; Bordoloi, P.L.; Hussain, I.A.; Ahmed, A.M. Physico–Chemical Characteristics of Fish Flour Prepared from Locally Available Small Indigenous Fish Species of Assam. J. Food Process. Preserv. 2021, 45, e15704. [Google Scholar] [CrossRef]
- Nagai, T.; Izumi, M.; Ishii, M. Fish Scale Collagen. Preparation and Partial Characterization. Int. J. Food Sci. Technol. 2004, 39, 239–244. [Google Scholar] [CrossRef]
- Rahman, M.S.; Al-Saidi, G.S.; Guizani, N. Thermal Characterisation of Gelatin Extracted from Yellowfin Tuna Skin and Commercial Mammalian Gelatin. Food Chem. 2008, 108, 472–481. [Google Scholar] [CrossRef]
- Yang, X.-R.; Zhao, Y.-Q.; Qiu, Y.-T.; Chi, C.-F.; Wang, B. Preparation and Characterization of Gelatin and Antioxidant Peptides from Gelatin Hydrolysate of Skipjack Tuna (Katsuwonus pelamis) Bone Stimulated by in Vitro Gastrointestinal Digestion. Mar. Drugs 2019, 17, 78. [Google Scholar] [CrossRef]
- Haddar, A.; Bougatef, A.; Balti, R.; Souissi, N.; Koched; Nasri, M. Physicochemical and Functional Properties of Gelatin from Tuna (Thunnus thynnus) Headbones. J. Food Nutr. Res. 2001, 50, 150–159. [Google Scholar]
- Liu, H.Y.; Han, J.; Guo, S.D. Characteristics of the Gelatin Extracted from Channel Catfish (Ictalurus punctatus) Head Bones. LWT—Food Sci. Technol. 2009, 42, 540–544. [Google Scholar] [CrossRef]
- Baziwane, D.; He, Q. Gelatin: The Paramount Food Additive. Food Rev. Int. 2003, 19, 423–435. [Google Scholar] [CrossRef]
- Gelatin Handbook. Gelatin Manufacturers Institute of America. Available online: http://www.gelatin-gmia.com/uploads/1/1/8/4/118450438/gmia_gelatin_manual_2019.pdf (accessed on 30 June 2023).
- Muyonga, J.H.; Cole, C.G.B.; Duodu, K.G. Extraction and Physico-Chemical Characterisation of Nile Perch (Lates niloticus) Skin and Bone Gelatin. Food Hydrocoll. 2004, 18, 581–592. [Google Scholar] [CrossRef]
- Petricorena, Z.C. Chemical Composition of Fish and Fishery Products. In Handbook of Food Chemistry; Cheung, P.C.K., Ed.; Springer: Berlin/Heidelberg, Germany, 2014; pp. 1–28. [Google Scholar] [CrossRef]
- Oliveira, V.D.M.; Assis, C.R.D.; Costa, B.D.A.M.; Neri, R.C.D.A.; Monte, F.T.D.; Freitas, H.M.S.D.C.V.; França, R.C.P.; Santos, J.F.; Bezerra, R.D.S.; Porto, A.L.F. Physical, Biochemical, Densitometric and Spectroscopic Techniques for Characterization Collagen from Alternative Sources: A Review Based on the Sustainable Valorization of Aquatic by-Products. J. Mol. Struct. 2021, 1224, 129023. [Google Scholar] [CrossRef]
- Alfaro, A.D.T.; Balbinot, E.; Weber, C.I.; Tonial, I.B.; Machado-Lunkes, A. Fish Gelatin: Characteristics, Functional Properties, Applications and Future Potentials. Food Eng. Rev. 2015, 7, 33–44. [Google Scholar] [CrossRef]
- Silva, J.C.; Barros, A.A.; Aroso, I.M.; Fassini, D.; Silva, T.H.; Reis, R.L.; Duarte, A.R.C. Extraction of Collagen/Gelatin from the Marine Demosponge Chondrosia reniformis (Nardo, 1847) Using Water Acidified with Carbon Dioxide—Process Optimization. Ind. Eng. Chem. Res. 2016, 55, 6922–6930. [Google Scholar] [CrossRef]
- Ahmad, T.; Ismail, A.; Ahmad, S.A.; Khalil, K.A.; Kee, L.T.; Awad, E.A.; Sazili, A.Q. Extraction, Characterization and Molecular Structure of Bovine Skin Gelatin Extracted with Plant Enzymes Bromelain and Zingibain. J. Food Sci. Technol. 2020, 57, 3772–3781. [Google Scholar] [CrossRef] [PubMed]
- Giménez, B.; Turnay, J.; Lizarbe, M.A.; Montero, P.; Gómez-Guillén, M.C. Use of Lactic Acid for Extraction of Fish Skin Gelatin. Food Hydrocoll. 2005, 19, 941–950. [Google Scholar] [CrossRef]
- Benjakul, S.; Oungbho, K.; Visessanguan, W.; Thiansilakul, Y.; Roytrakul, S. Characteristics of Gelatin from the Skins of Bigeye Snapper, Priacanthus Tayenus and Priacanthus Macracanthus. Food Chem. 2009, 116, 445–451. [Google Scholar] [CrossRef]
- Nurilmala, M.; Hizbullah, H.H.; Karnia, E.; Kusumaningtyas, E.; Ochiai, Y. Characterization and Antioxidant Activity of Collagen, Gelatin, and the Derived Peptides from Yellowfin Tuna (Thunnus albacares) Skin. Mar. Drugs 2020, 18, 98. [Google Scholar] [CrossRef]
- Kumar, D.P.; Chandra, M.V.; Elavarasan, K.; Shamasundar, B.A. Structural Properties of Gelatin Extracted from Croaker Fish (Johnius Sp) Skin Waste. Int. J. Food Prop. 2017, 20, S2612–S2625. [Google Scholar] [CrossRef]
- Böcker, U.; Wubshet, S.G.; Lindberg, D.; Afseth, N.K. Fourier-Transform Infrared Spectroscopy for Characterization of Protein Chain Reductions in Enzymatic Reactions. Analyst 2017, 142, 2812–2818. [Google Scholar] [CrossRef]
- Muyonga, J.H.; Cole, C.G.B.; Duodu, K.G. Fourier Transform Infrared (FTIR) Spectroscopic Study of Acid Soluble Collagen and Gelatin from Skins and Bones of Young and Adult Nile Perch (Lates niloticus). Food Chem. 2004, 86, 325–332. [Google Scholar] [CrossRef]
- Arunkumar, R.; Drummond, C.J.; Greaves, T.L. FTIR Spectroscopic Study of the Secondary Structure of Globular Proteins in Aqueous Protic Ionic Liquids. Front. Chem. 2019, 7, 74. [Google Scholar] [CrossRef]
- Hassan, N.; Ahmad, T.; Zain, N.M.; Awang, S.R. Identification of Bovine, Porcine and Fish Gelatin Signatures Using Chemometrics Fuzzy Graph Method. Sci. Rep. 2021, 11, 9793. [Google Scholar] [CrossRef]
- Cole, C.G.B.; Roberts, J.J. Gelatine Colour Measurement. Meat Sci. 1997, 45, 23–31. [Google Scholar] [CrossRef]
- Jongjareonrak, A.; Rawdkuen, S.; Chaijan, M.; Benjakul, S.; Osako, K.; Tanaka, M. Chemical Compositions and Characterisation of Skin Gelatin from Farmed Giant Catfish (Pangasianodon gigas). LWT—Food Sci. Technol. 2010, 43, 161–165. [Google Scholar] [CrossRef]
- Said, N.S.; Sarbon, N.M. Physical and Mechanical Characteristics of Gelatin-Based Films as a Potential Food Packaging Material: A Review. Membranes 2022, 12, 442. [Google Scholar] [CrossRef]
- Pranoto, Y.; Marseno, D.W.; Rahmawati, H. Characteristics of Gelatins Extracted from Fresh and Sun-Dried Seawater Fish Skins in Indonesia. Int. Food Res. J. 2011, 18, 1335–1341. [Google Scholar]
- Biluca, F.C.; Marquetti, C.; Alfaro, A.D.T. Produção de Gelatina de Pele e Ossos de Bagre (Clarias gariepinus). Rev. Bras. Tecnol. Agroind. 2011, 5, 418–426. [Google Scholar] [CrossRef]
- Mafazah, E.M.; Pranoto, Y.; Rohman, A. Extracting of Yellowfin Tuna (Thunnus albacares) Fish Skin Gelatin as Influenced by Alkaline Concentration and Extraction Times. IOP Conf. Ser. Earth Environ. Sci. 2018, 139, 012047. [Google Scholar] [CrossRef]
- Jeya Shakila, R.; Jeevithan, E.; Varatharajakumar, A.; Jeyasekaran, G.; Sukumar, D. Functional Characterization of Gelatin Extracted from Bones of Red Snapper and Grouper in Comparison with Mammalian Gelatin. LWT—Food Sci. Technol. 2012, 48, 30–36. [Google Scholar] [CrossRef]
- Cho, S.M.; Gu, Y.S.; Kim, S.B. Extracting Optimization and Physical Properties of Yellowfin Tuna (Thunnus albacares) Skin Gelatin Compared to Mammalian Gelatins. Food Hydrocoll. 2005, 19, 221–229. [Google Scholar] [CrossRef]
- Giménez, B.; Gómez-Guillén, M.C.; Montero, P. The Role of Salt Washing of Fish Skins in Chemical and Rheological Properties of Gelatin Extracted. Food Hydrocoll. 2005, 19, 951–957. [Google Scholar] [CrossRef]
- Gomez-guillœn, M.C.; Montero, P. Extraction of Gelatin from Megrim (Lepidorhombus boscii) Skins with Several Organic Acids. J. Food Sci. 2001, 66, 213–216. [Google Scholar] [CrossRef]
- Koli, J.M.; Basu, S.; Venkteshwarlu, G.; Choukasy, M.K.; Nayak, B.B. Optimization of fish gelatin extraction from skins and bones: A comparative study. Ecol. Environ. Conserv. 2013, 19, 47–56. [Google Scholar]
- Vázquez, J.A.; Hermida-Merino, C.; Hermida-Merino, D.; Piñeiro, M.M.; Johansen, J.; Sotelo, C.G.; Pérez-Martín, R.I.; Valcarcel, J. Characterization of Gelatin and Hydrolysates from Valorization of Farmed Salmon Skin By-Products. Polymers 2021, 13, 2828. [Google Scholar] [CrossRef] [PubMed]
- Method for Transforming Waste and System for Performing Said Method. Available online: https://patentscope.wipo.int/search/en/detail.jsf?docId=WO2015181769 (accessed on 1 September 2023).
- Official Methods of Analysis of AOAC International, 19th ed.; Association of Official Analytical Chemists: Gaithersburg, MD, USA, 2012.
- Hara, A.; Radin, N.S. Lipid Extraction of Tissues with a Low-Toxicity Solvent. Anal. Biochem. 1978, 90, 420–426. [Google Scholar] [CrossRef]
- Hu, Z.; Zhong, Q. Determination of Thiobarbituric Acid Reactive Substances in Microencapsulated Products. Food Chem. 2010, 123, 794–799. [Google Scholar] [CrossRef]
- Ranasinghe, R.A.S.N.; Wijesekara, W.L.I.; Perera, P.R.D.; Senanayake, S.A.; Pathmalal, M.M.; Marapana, R.A.U.J. Functional and Bioactive Properties of Gelatin Extracted from Aquatic Bioresources—A Review. Food Rev. Int. 2022, 38, 812–855. [Google Scholar] [CrossRef]
- Lorenzo, J.M.; Purriños, L.; Temperán, S.; Bermúdez, R.; Tallón, S.; Franco, D. Physicochemical and Nutritional Composition of Dry-Cured Duck Breast. Poult. Sci. 2011, 90, 931–940. [Google Scholar] [CrossRef]
- Domínguez, R.; Borrajo, P.; Lorenzo, J.M. The Effect of Cooking Methods on Nutritional Value of Foal Meat. J. Food Compos. Anal. 2015, 43, 61–67. [Google Scholar] [CrossRef]
- Gómez-Guillén, M.C.; Turnay, J.; Fernández-Díaz, M.D.; Ulmo, N.; Lizarbe, M.A.; Montero, P. Structural and Physical Properties of Gelatin Extracted from Different Marine Species: A Comparative Study. Food Hydrocoll. 2002, 16, 25–34. [Google Scholar] [CrossRef]


| Analyses | Pre Dehydration (NDFB): Results 1 (g/100 g) | Post Dehydration (YDFB): Results 1 (g/100 g) |
|---|---|---|
| Residual moisture | 62.2 ± 0.1 | 4.7 ± 0.1 |
| Crude proteins | 19.5 ± 0.4 | 45.9 ± 1.7 |
| Lipids | 5.1 ± 0.1 | 13.0 ± 0.5 |
| Ashes | 13.2 ± 0.1 | 32.5 ± 0.8 |
| NDFB (Not Dehydrated Fish Biomass) | YDFB (Yes Dehydrated Fish Biomass) | |
|---|---|---|
| Sulfite-reducing clostridia and spores (CFU/g) | <10 | <10 |
| Total viable count (CFU/g) | 2300 | 3300 |
| Coliforms (CFU/g) | <10 | <10 |
| Escherichia coli β-gluc. + (CFU/g) | <10 | <10 |
| Enterobacteriaceae (CFU/g) | <10 | <10 |
| Staphylococci c. + at 37 °C (CFU/g) | <10 | <10 |
| Salmonella spp. (CFU/g) | Absent | Absent |
| Listeria monocytogenes (CFU/g) | Absent | Absent |
| Histamine (mg/kg) | <5 | <5 |
| Acid–Base Volatile Total Nitrogen (mg/100 g) | - | 14.9 |
| Analyses | NCs Results 1 (g/100 g) | ALKs Results 1 (g/100 g) |
|---|---|---|
| Yield | 14.6 | 18.3 |
| Residual moisture | 5.3 ± 0.2 | 5.9 ± 0.1 |
| Crude proteins | 67.0 ± 5.0 | 33.0 ± 2.0 |
| Lipids | 0.2 ± 1.8 | 27.5 ± 1.6 |
| Ashes | 24.0 ± 2.0 | 16.8 ± 1.5 |
| Analyses | Results 1 (g/100 g) |
|---|---|
| Residual moisture | 2.0 ± 0.2 |
| Crude proteins | 88.0 ± 2.9 |
| Lipids | 0.2 ± 0.0 |
| Ashes | 5.1 ± 0.4 |
| YDFB | NCs | ALKs | GELATIN | ||||||||
|---|---|---|---|---|---|---|---|---|---|---|---|
| AA | Results 1 (g/100 g of YDFB) | Results 1 % AA | AA | Results 1 (g/100 g of NCs) | Results 1 % AA | AA | Results 1 (g/100 g of ALKs) | Results 1 % AA | AA | Results 1 (g/100g of GELATIN) | Results 1 % AA |
| Gly | 7.51 + 0.80 | 13.80 | Gly | 10.28 + 0.47 | 14.59 | Glu | 2.42 + 0.01 | 10.34 | Gly | 21.23 + 2.26 | 24.57 |
| Glu | 6.49 + 0.49 | 11.92 | Glu | 8.58 + 0.29 | 12.18 | Asp | 2.26 + 0.02 | 9.66 | Arg | 8.30 + 0.95 | 9.61 |
| Asp | 4.60 + 0.39 | 8.45 | Asp | 5.64 + 0.15 | 8.00 | Leu | 2.12 + 0.03 | 9.05 | Glu | 8.27 + 0.85 | 9.57 |
| Ala | 4.21 + 0.43 | 7.73 | Ala | 5.55 + 0.22 | 7.87 | Gly | 1.79 + 0.01 | 7.67 | Pro | 8.22 + 0.84 | 9.51 |
| Lys | 3.73 + 0.42 | 6.86 | Arg | 5.11 + 0.33 | 7.25 | Ala | 1.65 + 0.03 | 7.07 | OH-Pro | 8.07 + 0.77 | 9.34 |
| Arg | 3.67 + 0.65 | 6.75 | Pro | 4.81+ 0.20 | 6.82 | Val | 1.53 + 0.01 | 6.56 | Ala | 7.96 + 0.77 | 9.22 |
| Pro | 3.62 + 0.30 | 6.65 | Lys | 4.32 + 0.08 | 6.14 | Phe | 1.39 + 0.02 | 5.95 | Asp | 4.42 + 0.40 | 5.12 |
| Leu | 3.47 + 0.31 | 6.37 | Leu | 4.05 + 0.21 | 5.74 | Pro | 1.35 + 0.01 | 5.79 | Lys | 3.43 + 0.37 | 3.97 |
| Val | 2.49 + 0.22 | 4.58 | Ser | 3.18 + 0.19 | 4.52 | Ile | 1.33 + 0.01 | 5.71 | Ser | 3.27 + 0.36 | 3.78 |
| Ser | 2.46 + 0.20 | 4.52 | OH-Pro | 3.05 + 0.19 | 4.32 | Arg | 1.33 + 0.04 | 5.70 | Thr | 2.67 + 0.23 | 3.09 |
| OH-Pro | 2.13 + 0.12 | 3.92 | Val | 2.94 + 0.15 | 4.17 | Ser | 1.09 + 0.06 | 4.65 | Leu | 2.28 + 0.25 | 2.64 |
| Ile | 1.96 + 0.18 | 3.61 | Thr | 2.92 + 0.17 | 4.14 | Lys | 1.08 + 0.08 | 4.62 | Val | 2.02 + 0.22 | 2.34 |
| Phe | 1.82 + 0.09 | 3.34 | Ile | 2.18 + 0.12 | 3.10 | Thr | 1.03 + 0.01 | 4.43 | Phe | 1.81 + 0.20 | 2.10 |
| Hys | 1.47 + 0.09 | 2.69 | Phe | 1.90 + 0.10 | 2.69 | Tyr | 1.01 + 0.04 | 4.32 | Met | 1.49 + 0.14 | 1.73 |
| Met | 1.40 + 0.09 | 2.57 | Met | 1.79 + 0.12 | 2.53 | Hys | 0.69 + 0.04 | 2.95 | Hys | 1.32 + 0.18 | 1.53 |
| Thr | 1.29 + 0.06 | 2.38 | Hys | 1.74 + 0.11 | 2.47 | Met | 0.67 + 0.04 | 2.87 | Ile | 1.06 + 0.12 | 1.23 |
| Tyr | 1.13 + 0.05 | 2.07 | Tau | 1.08 + 0.07 | 1.53 | OH-Pro | 0.41 + 0.02 | 1.77 | Tyr | 0.42 + 0.05 | 0.49 |
| Tau | 0.51 + 0.02 | 0.93 | Tyr | 1.01 + 0.07 | 1.43 | Tau | 0.11 + 0.01 | 0.48 | Cys | 0.14 + 0.05 | 0.16 |
| Cys | 0.47 + 0.04 | 0.86 | Cys | 0.35 + 0.03 | 0.49 | Cys | 0.10 + 0.01 | 0.44 | Tau | 0.00 + 0.00 | 0.00 |
| NCs | ALKs | Gelatin | |
|---|---|---|---|
| CIELab | L* = 297.97 ± 0.03 | L* = 357.05 ± 0.02 | L* = 314.95 ± 0.03 |
| a* = −3.38 ± 0.001 | a* = 8.02 ± 0.01 | a* = 1.32 ± 0.001 | |
| b* = 16.77 ± 0.01 | b* = 70.75 ± 0.02 | b* = 40.02 ± 0.00 |
Disclaimer/Publisher’s Note: The statements, opinions and data contained in all publications are solely those of the individual author(s) and contributor(s) and not of MDPI and/or the editor(s). MDPI and/or the editor(s) disclaim responsibility for any injury to people or property resulting from any ideas, methods, instructions or products referred to in the content. |
© 2023 by the authors. Licensee MDPI, Basel, Switzerland. This article is an open access article distributed under the terms and conditions of the Creative Commons Attribution (CC BY) license (https://creativecommons.org/licenses/by/4.0/).
Share and Cite
Grasso, F.; Méndez-Paz, D.; Vázquez Sobrado, R.; Orlandi, V.; Turrini, F.; De Negri Atanasio, G.; Grasselli, E.; Tiso, M.; Boggia, R. Feasibility of Enzymatic Protein Extraction from a Dehydrated Fish Biomass Obtained from Unsorted Canned Yellowfin Tuna Side Streams: Part I. Gels 2023, 9, 760. https://doi.org/10.3390/gels9090760
Grasso F, Méndez-Paz D, Vázquez Sobrado R, Orlandi V, Turrini F, De Negri Atanasio G, Grasselli E, Tiso M, Boggia R. Feasibility of Enzymatic Protein Extraction from a Dehydrated Fish Biomass Obtained from Unsorted Canned Yellowfin Tuna Side Streams: Part I. Gels. 2023; 9(9):760. https://doi.org/10.3390/gels9090760
Chicago/Turabian StyleGrasso, Federica, Diego Méndez-Paz, Rebeca Vázquez Sobrado, Valentina Orlandi, Federica Turrini, Giulia De Negri Atanasio, Elena Grasselli, Micaela Tiso, and Raffaella Boggia. 2023. "Feasibility of Enzymatic Protein Extraction from a Dehydrated Fish Biomass Obtained from Unsorted Canned Yellowfin Tuna Side Streams: Part I" Gels 9, no. 9: 760. https://doi.org/10.3390/gels9090760