
Development of Tofacitinib Loaded pH-Responsive Chitosan/Mucin Based Hydrogel Microparticles: In-Vitro Characterization and Toxicological Screening
 , , , , ,
Abstract
:
1. Introduction
2. Results and Discussion
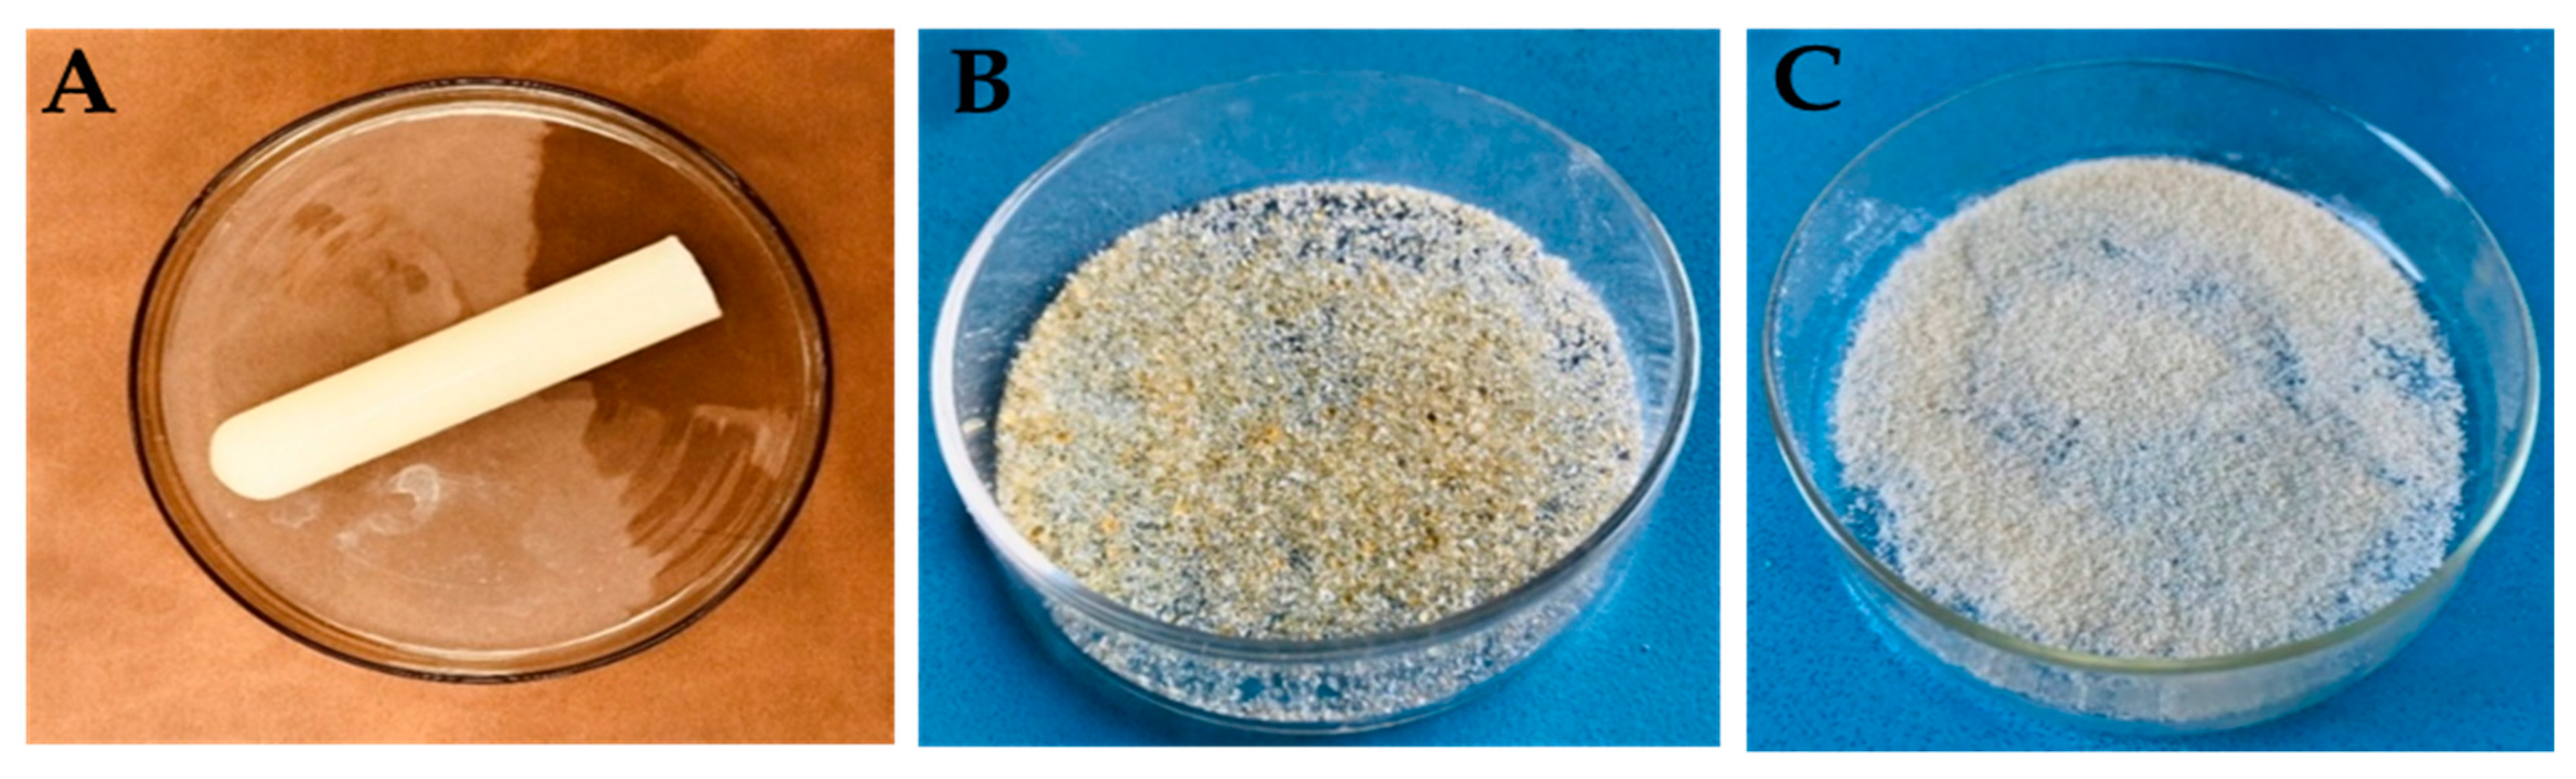
2.1. Physical Appearance
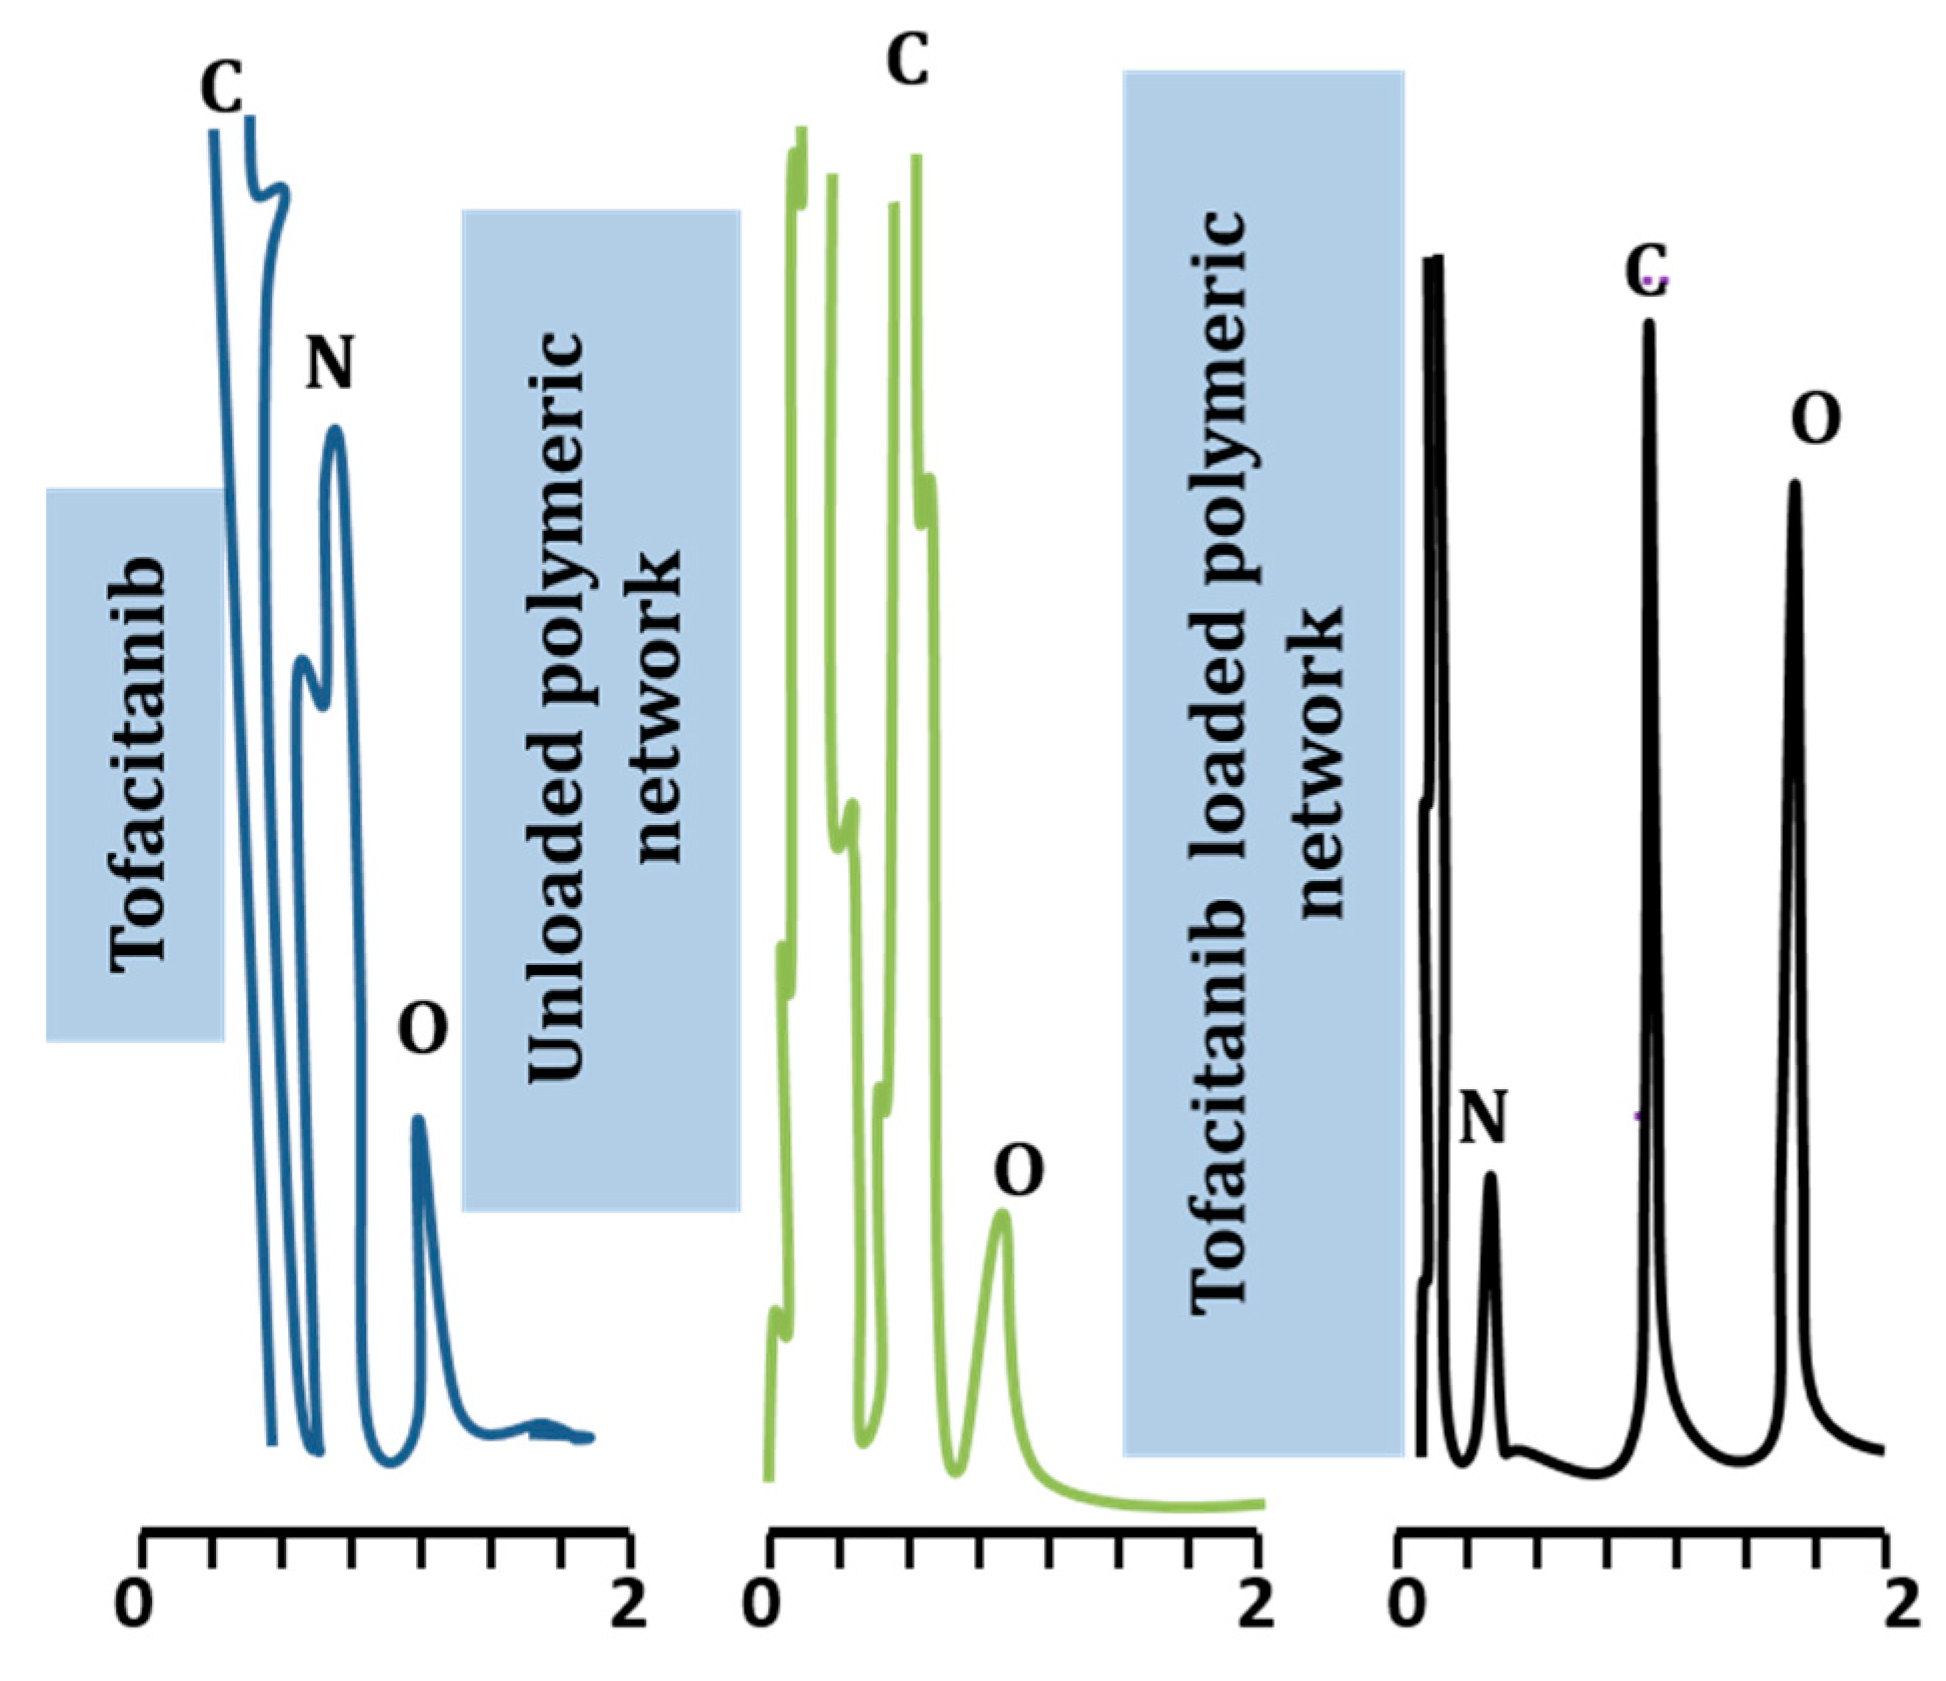
2.2. Elemental Analysis
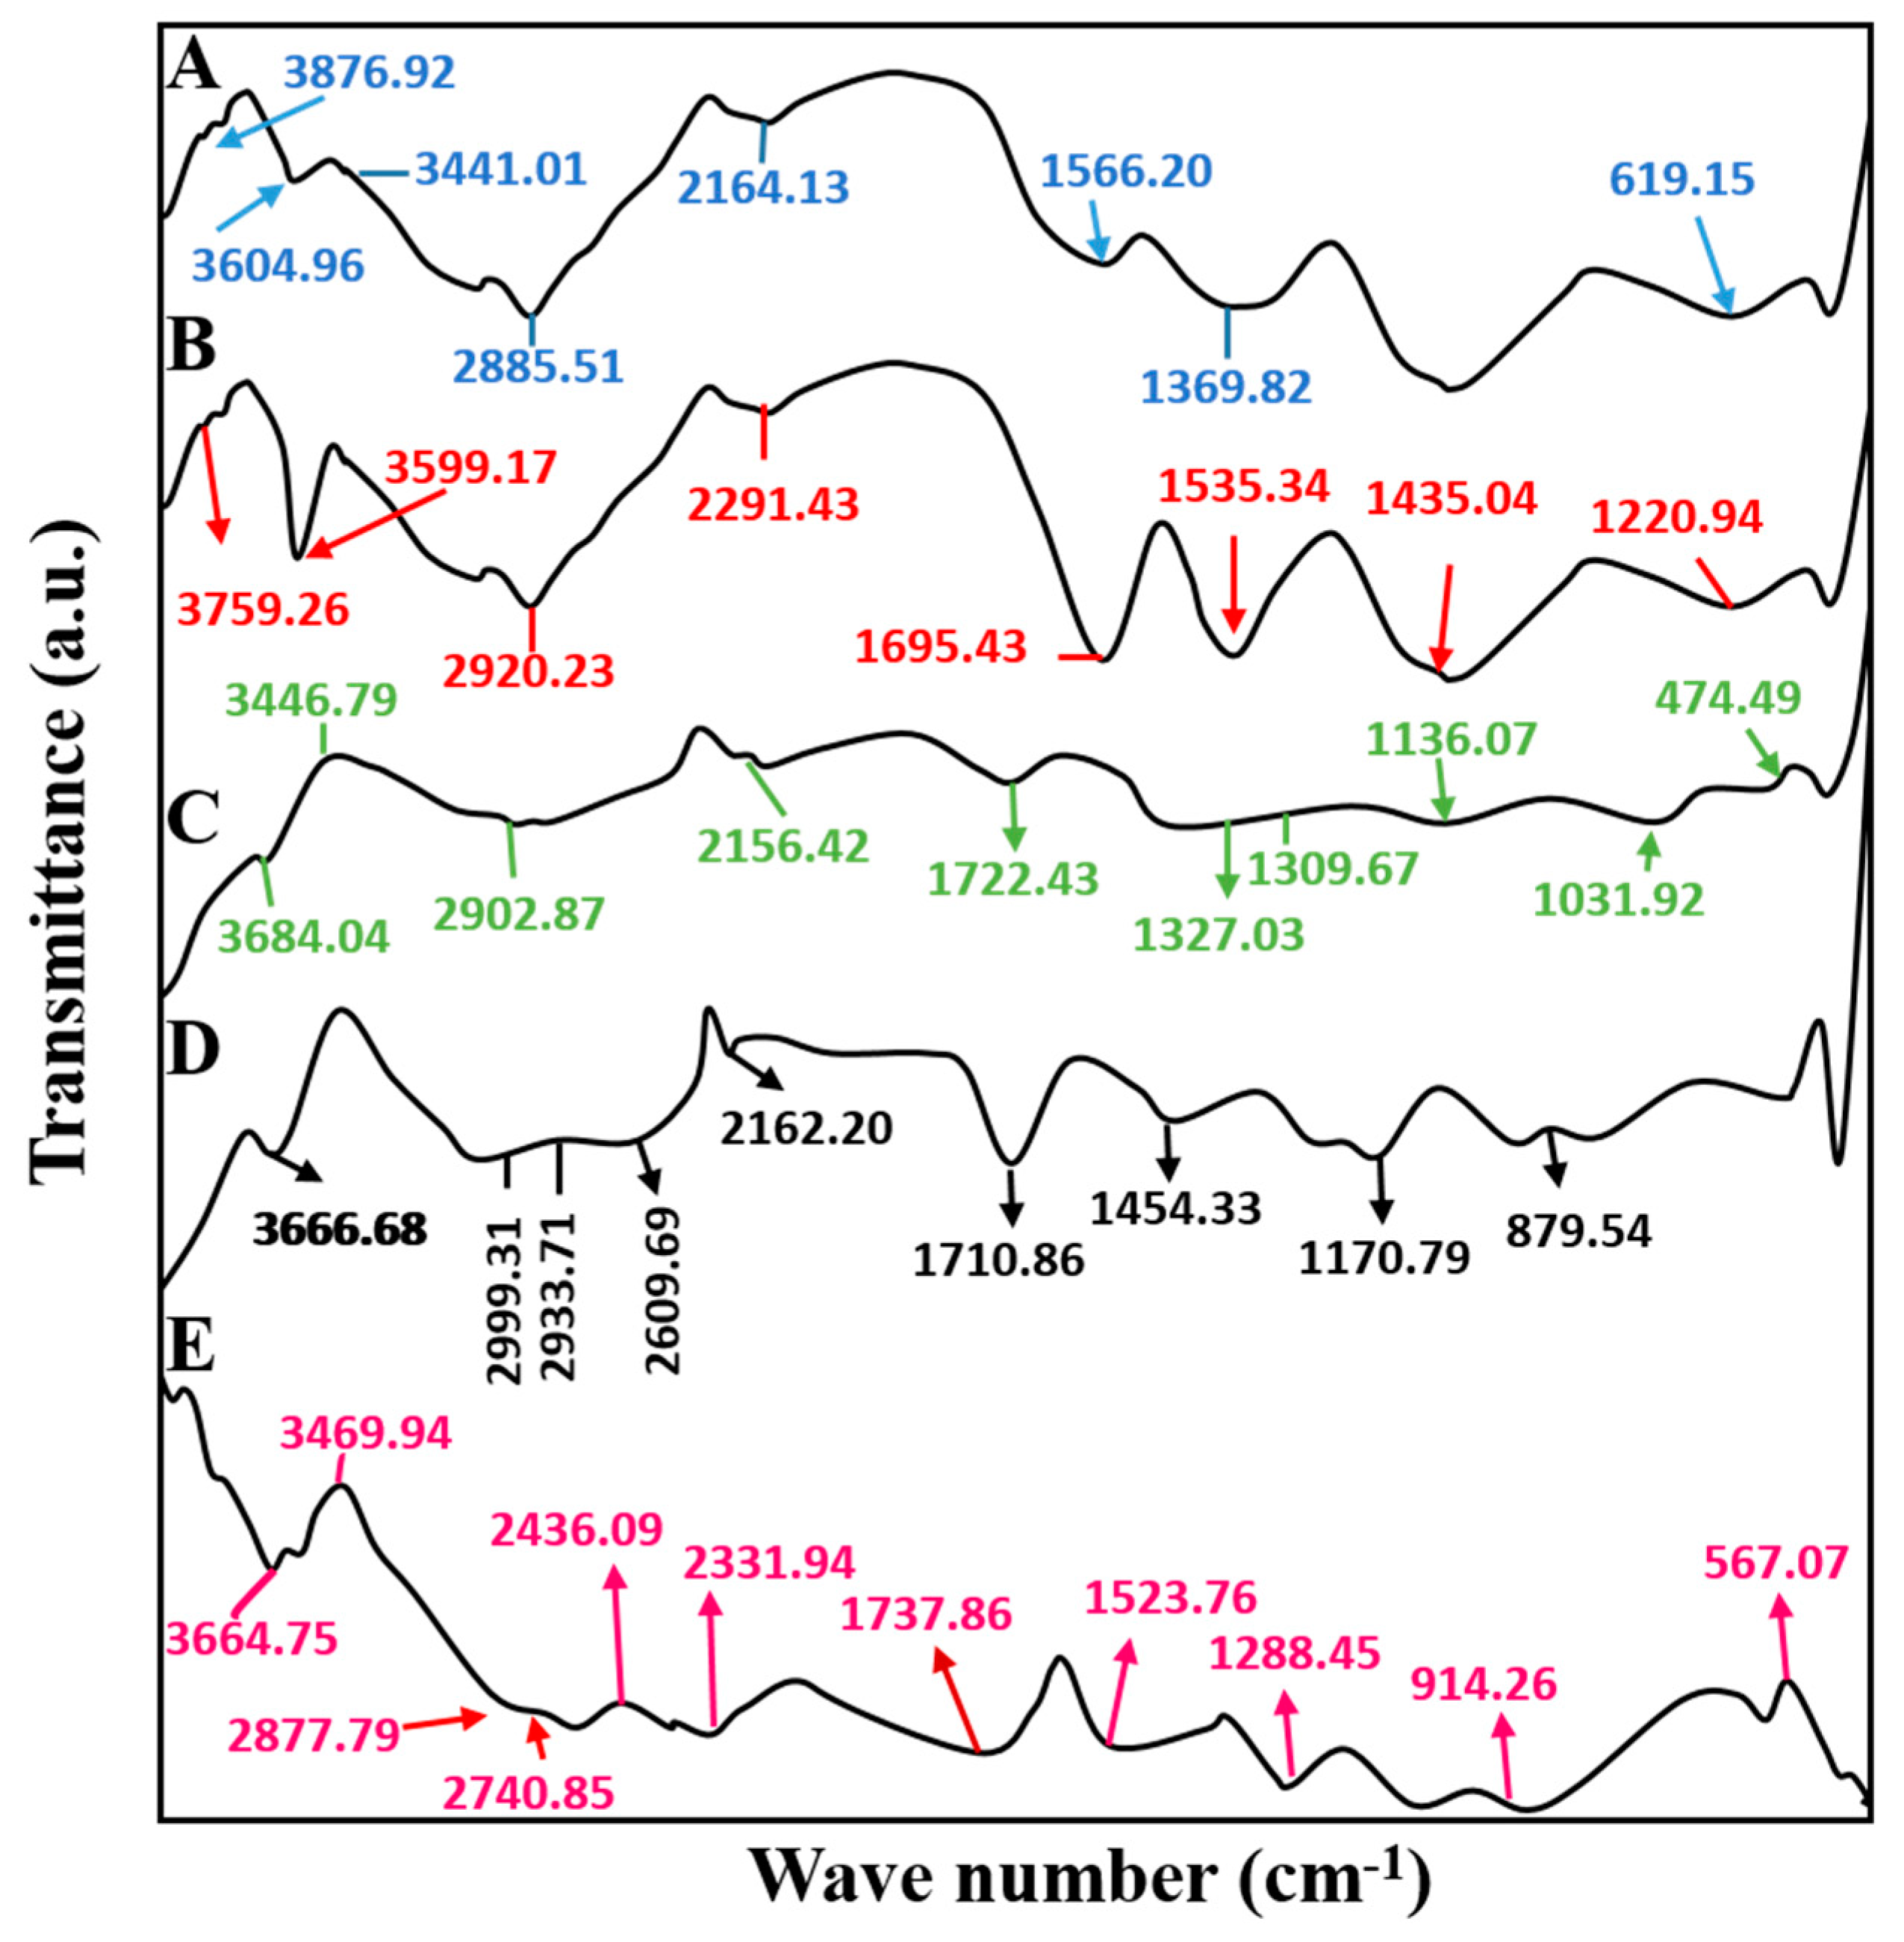
2.3. Fourier Transforms Infrared Spectroscopy
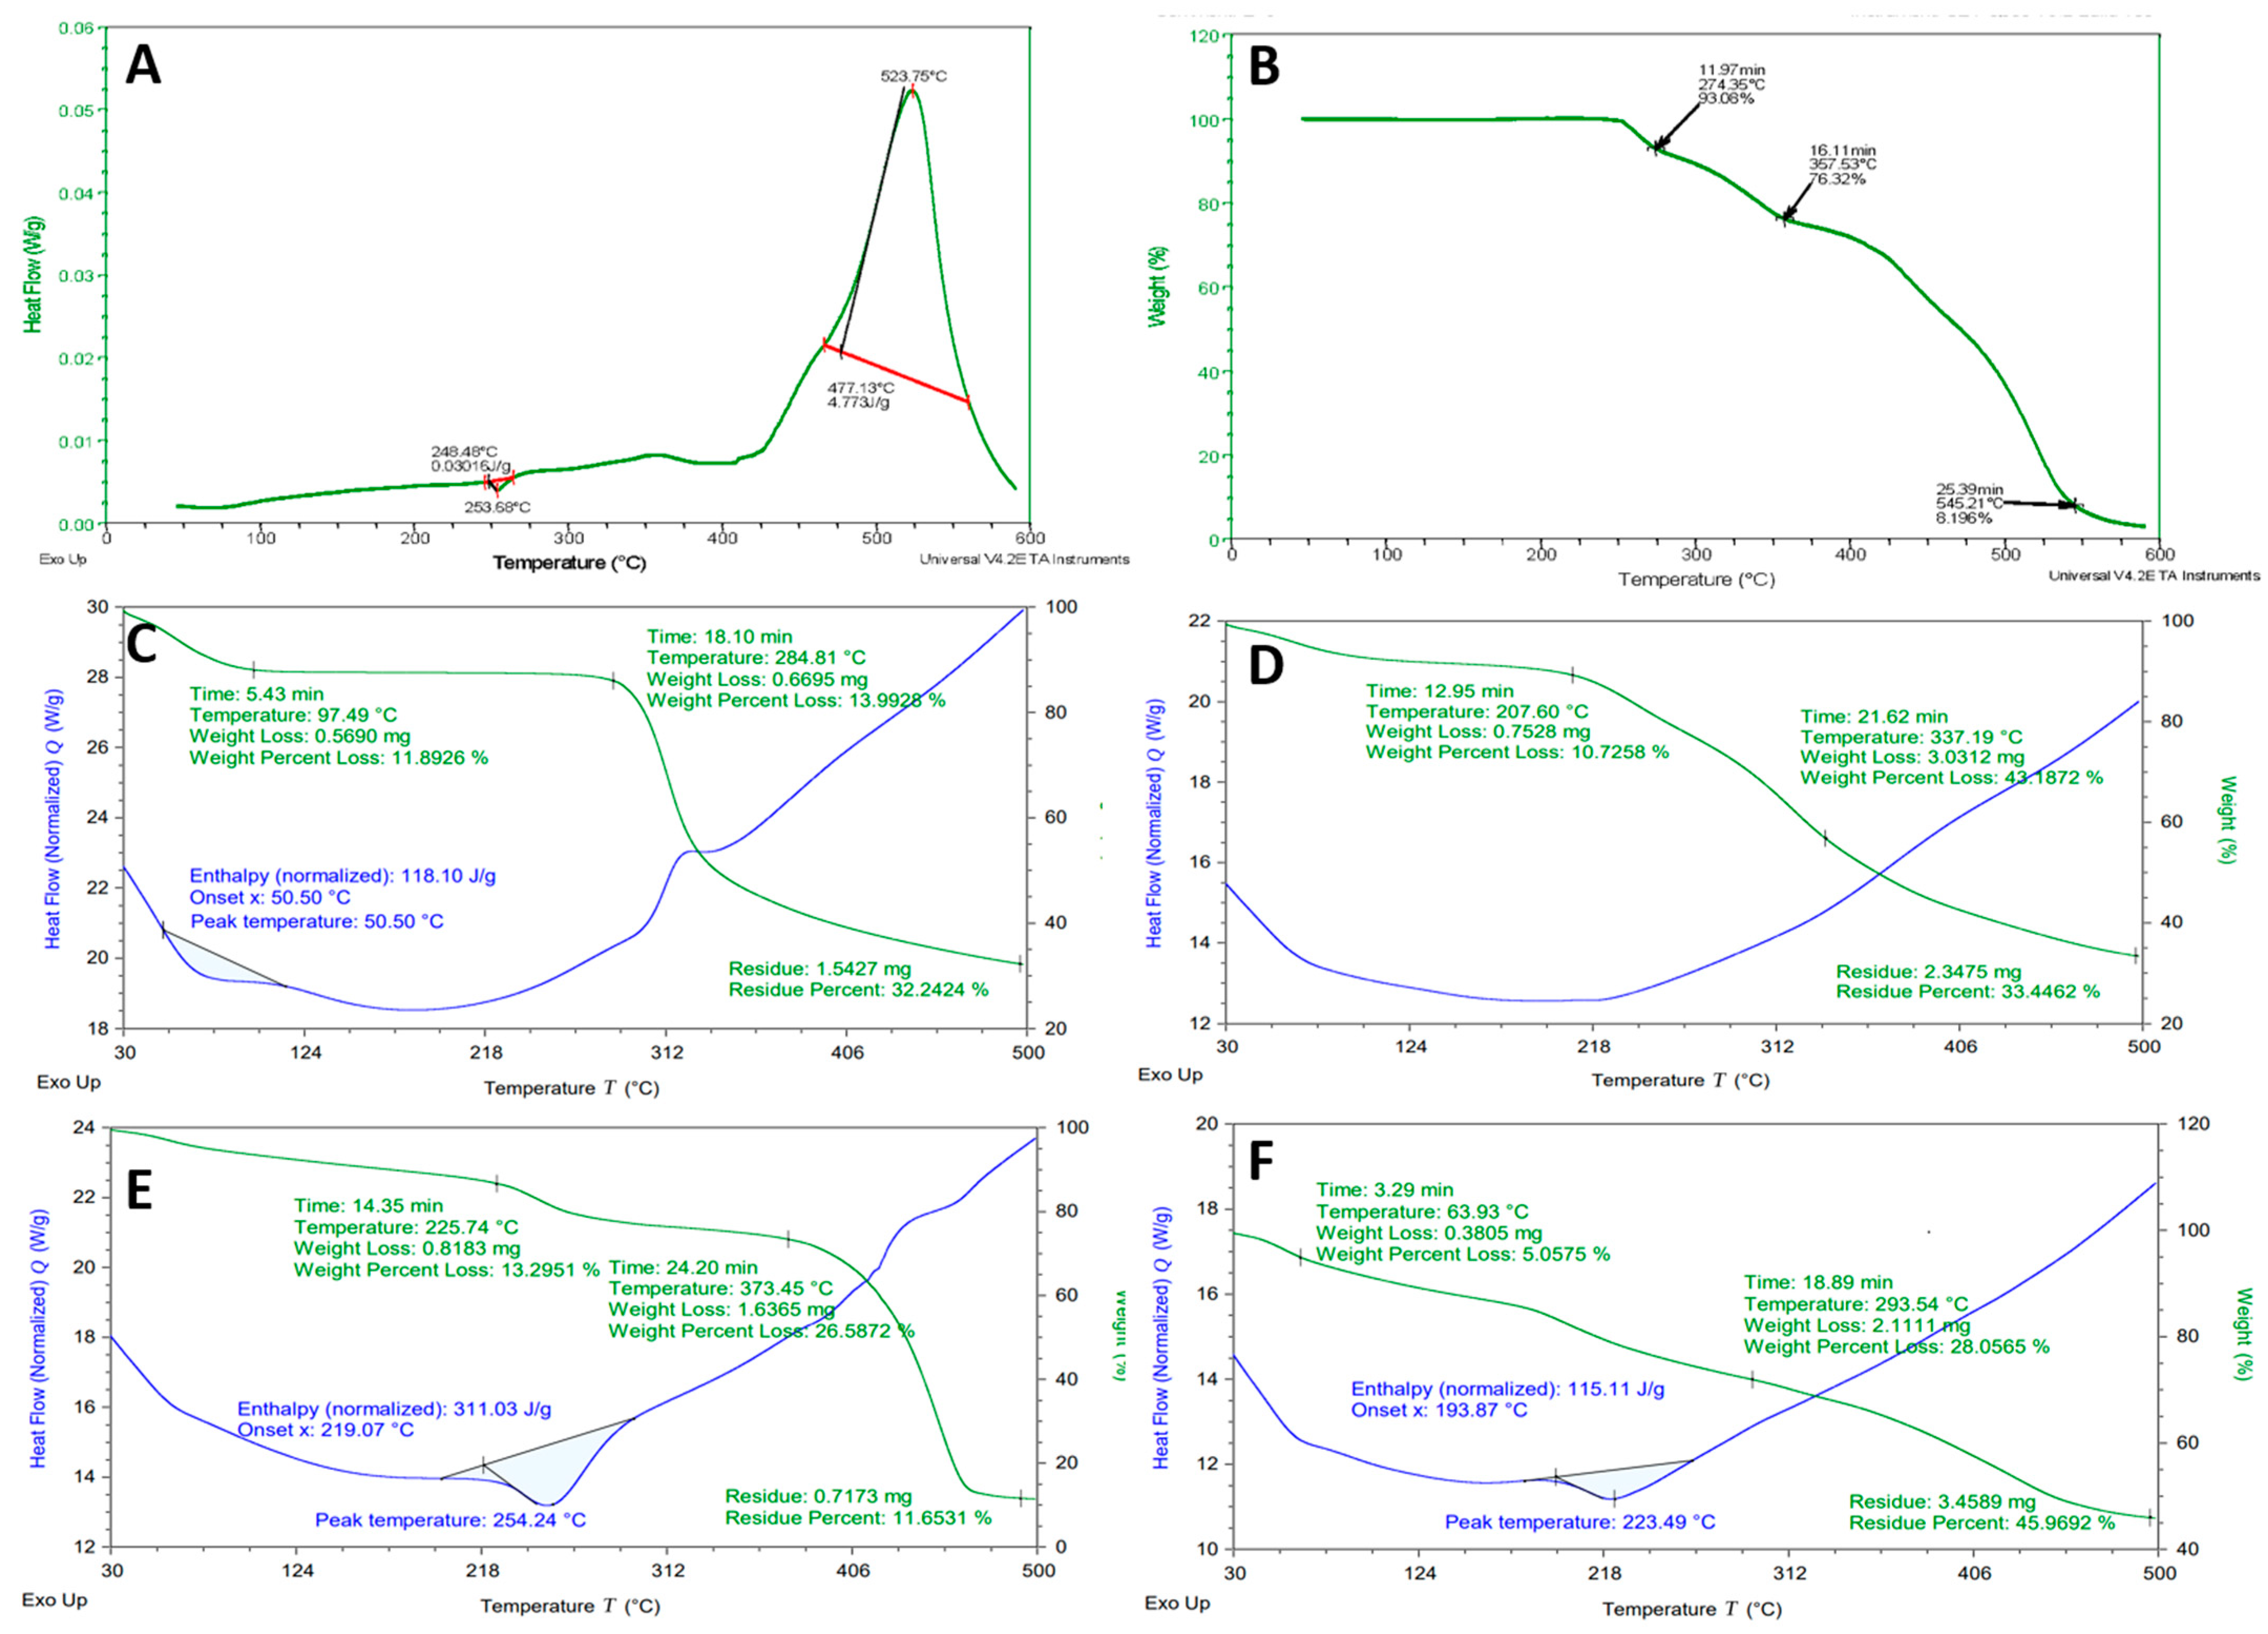
2.4. Differential Scanning Calorimeter and Thermogravimetric Analysis
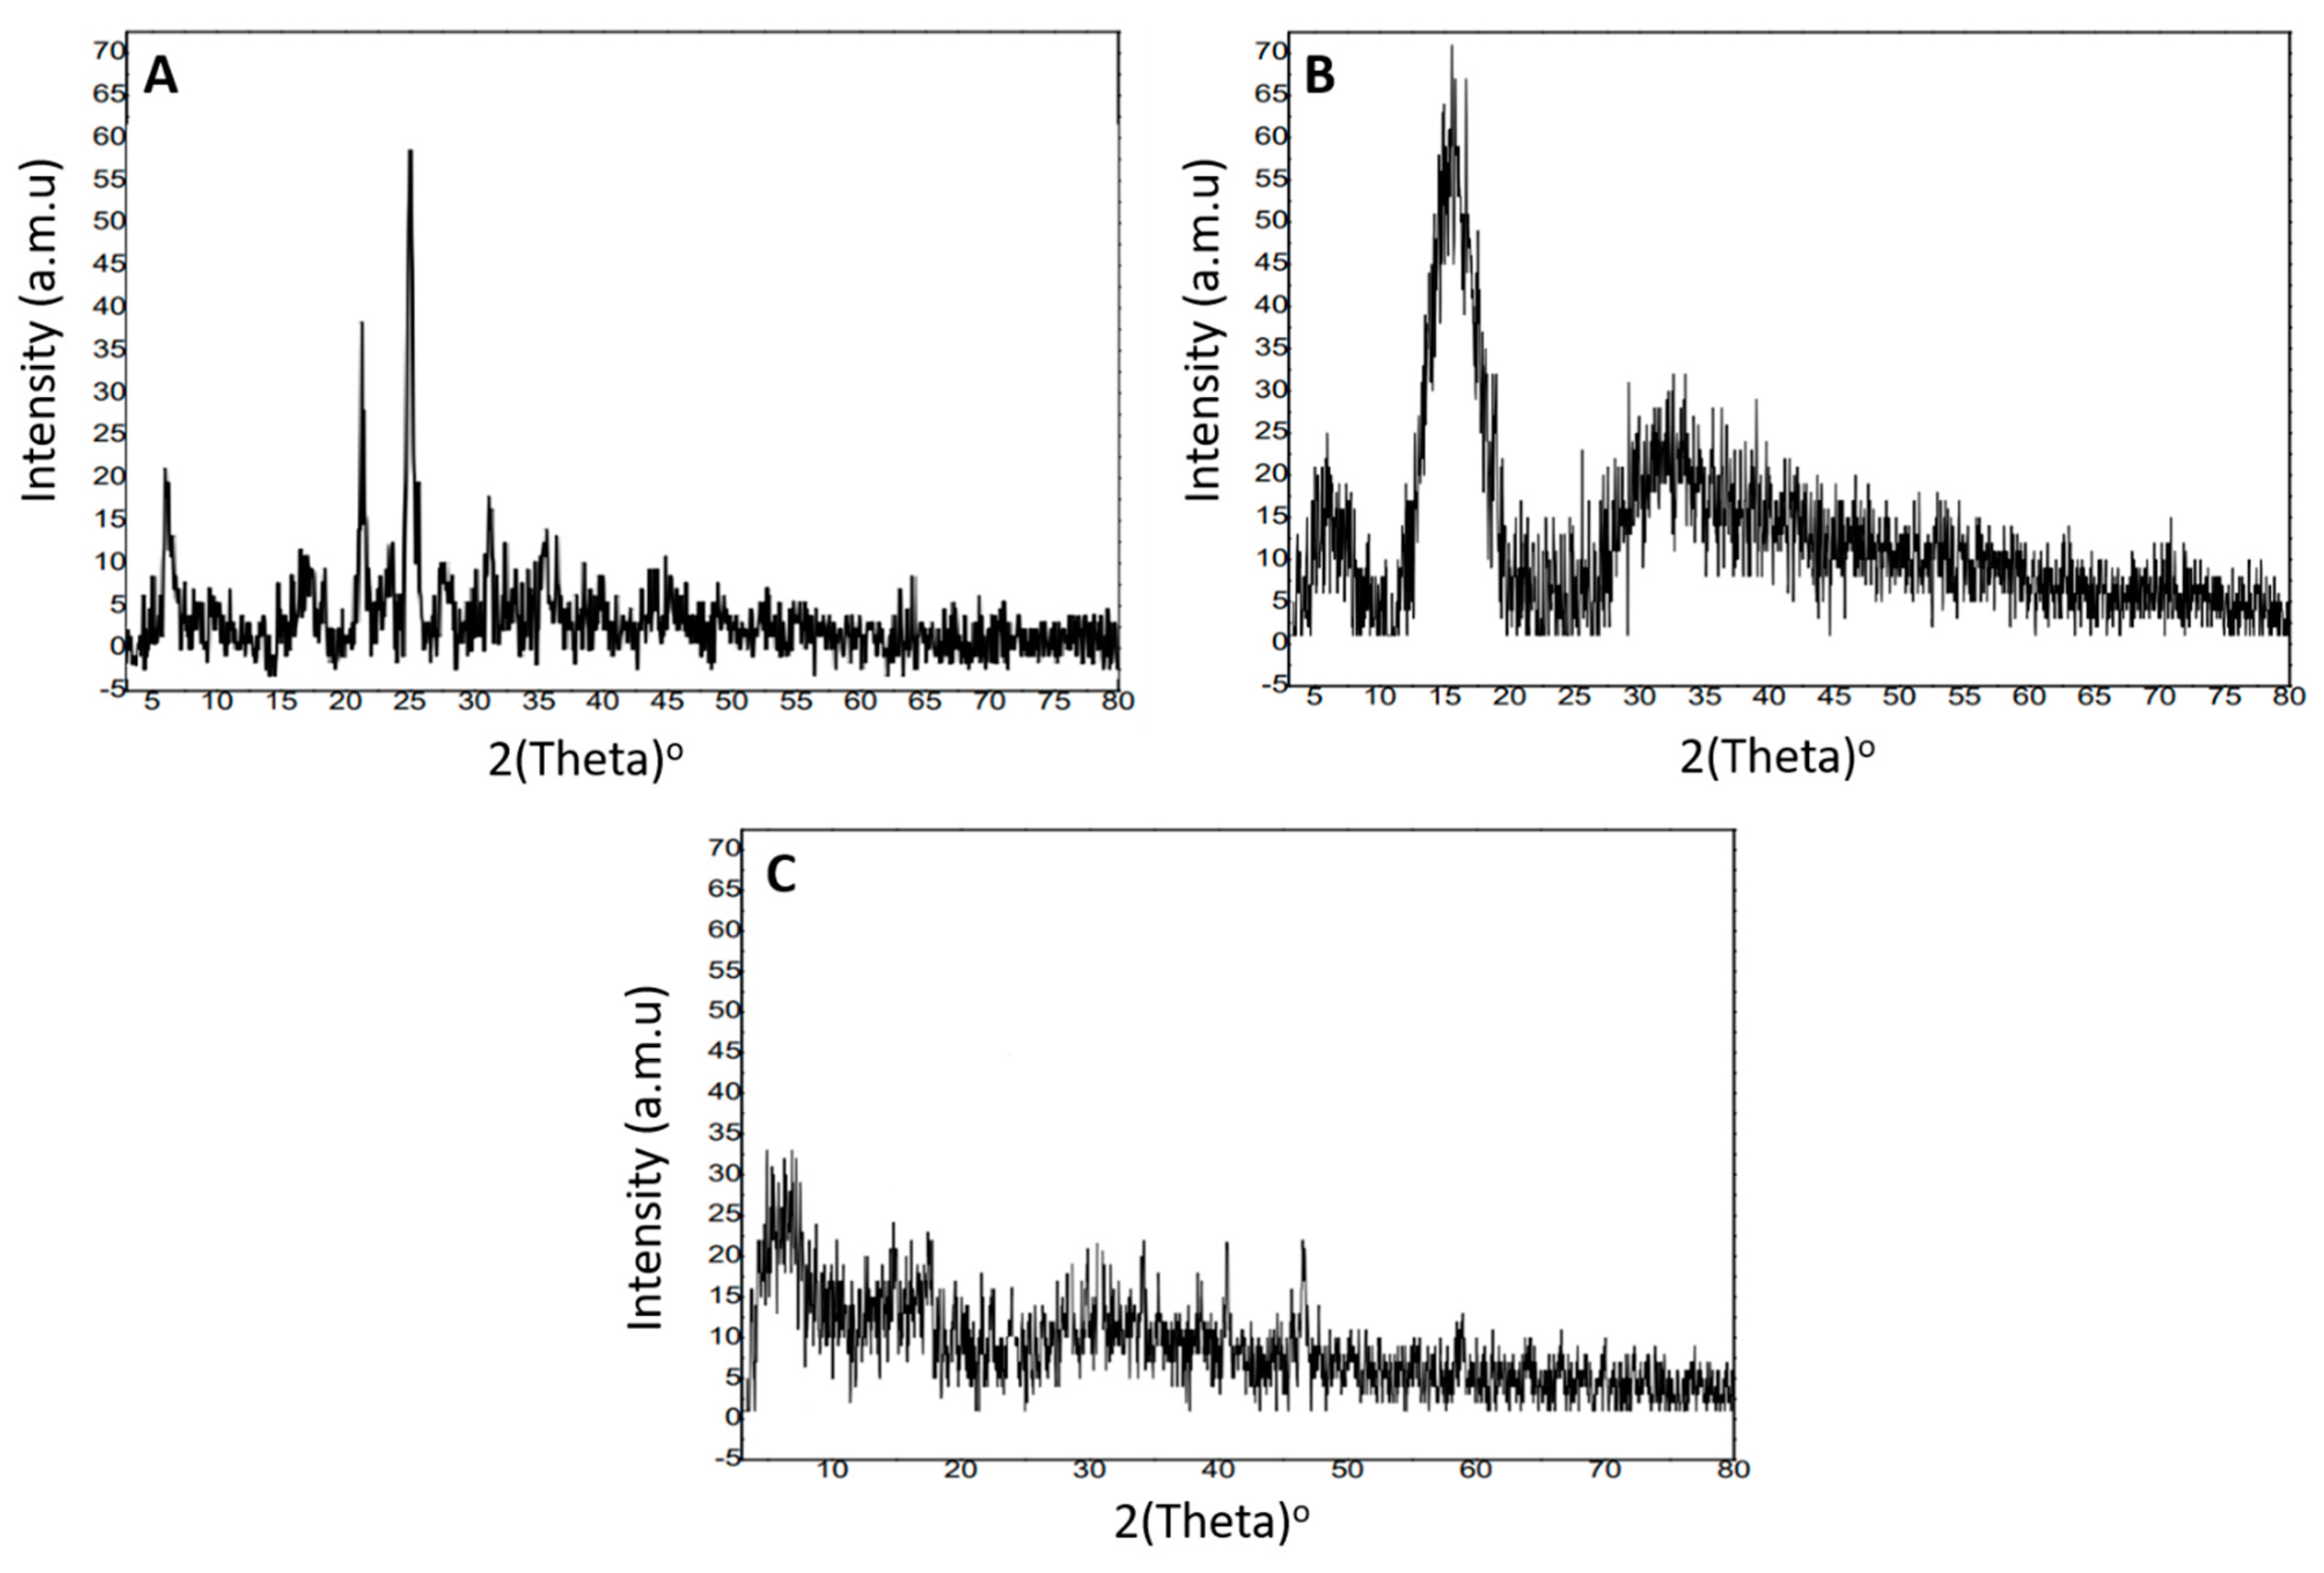
2.5. X-ray Diffraction Analysis
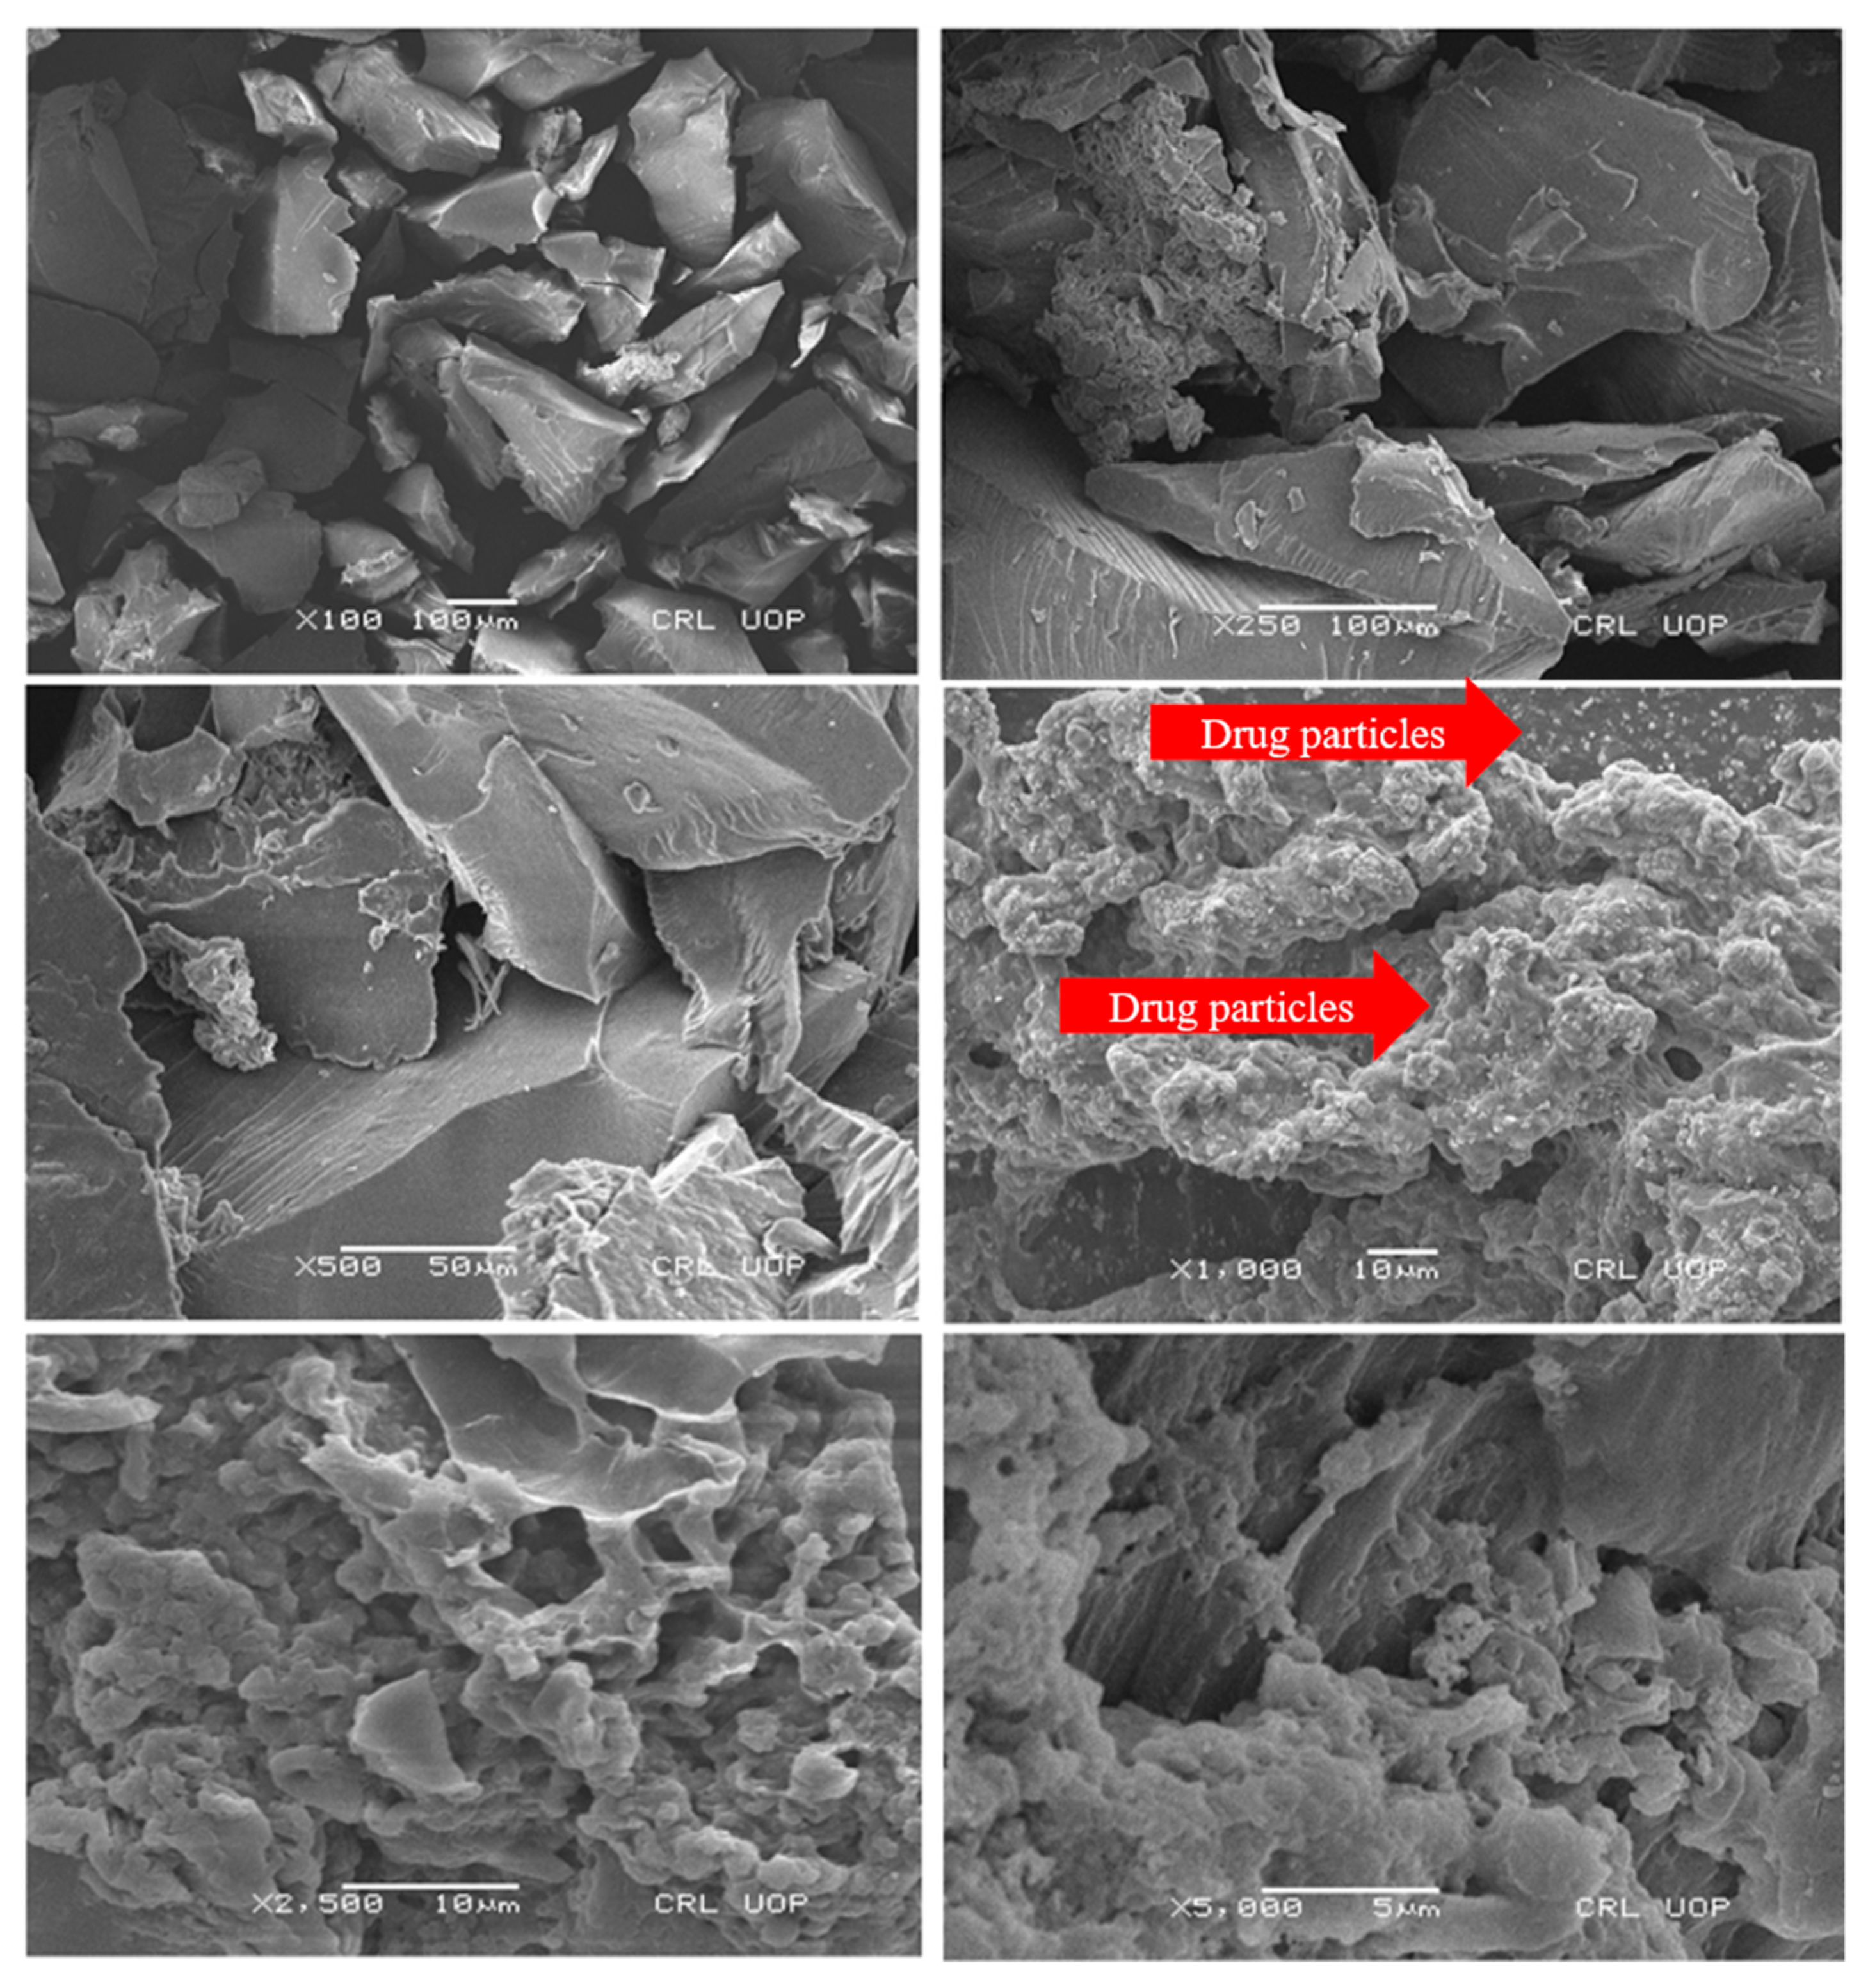
2.6. Scanning Electron Microscopy
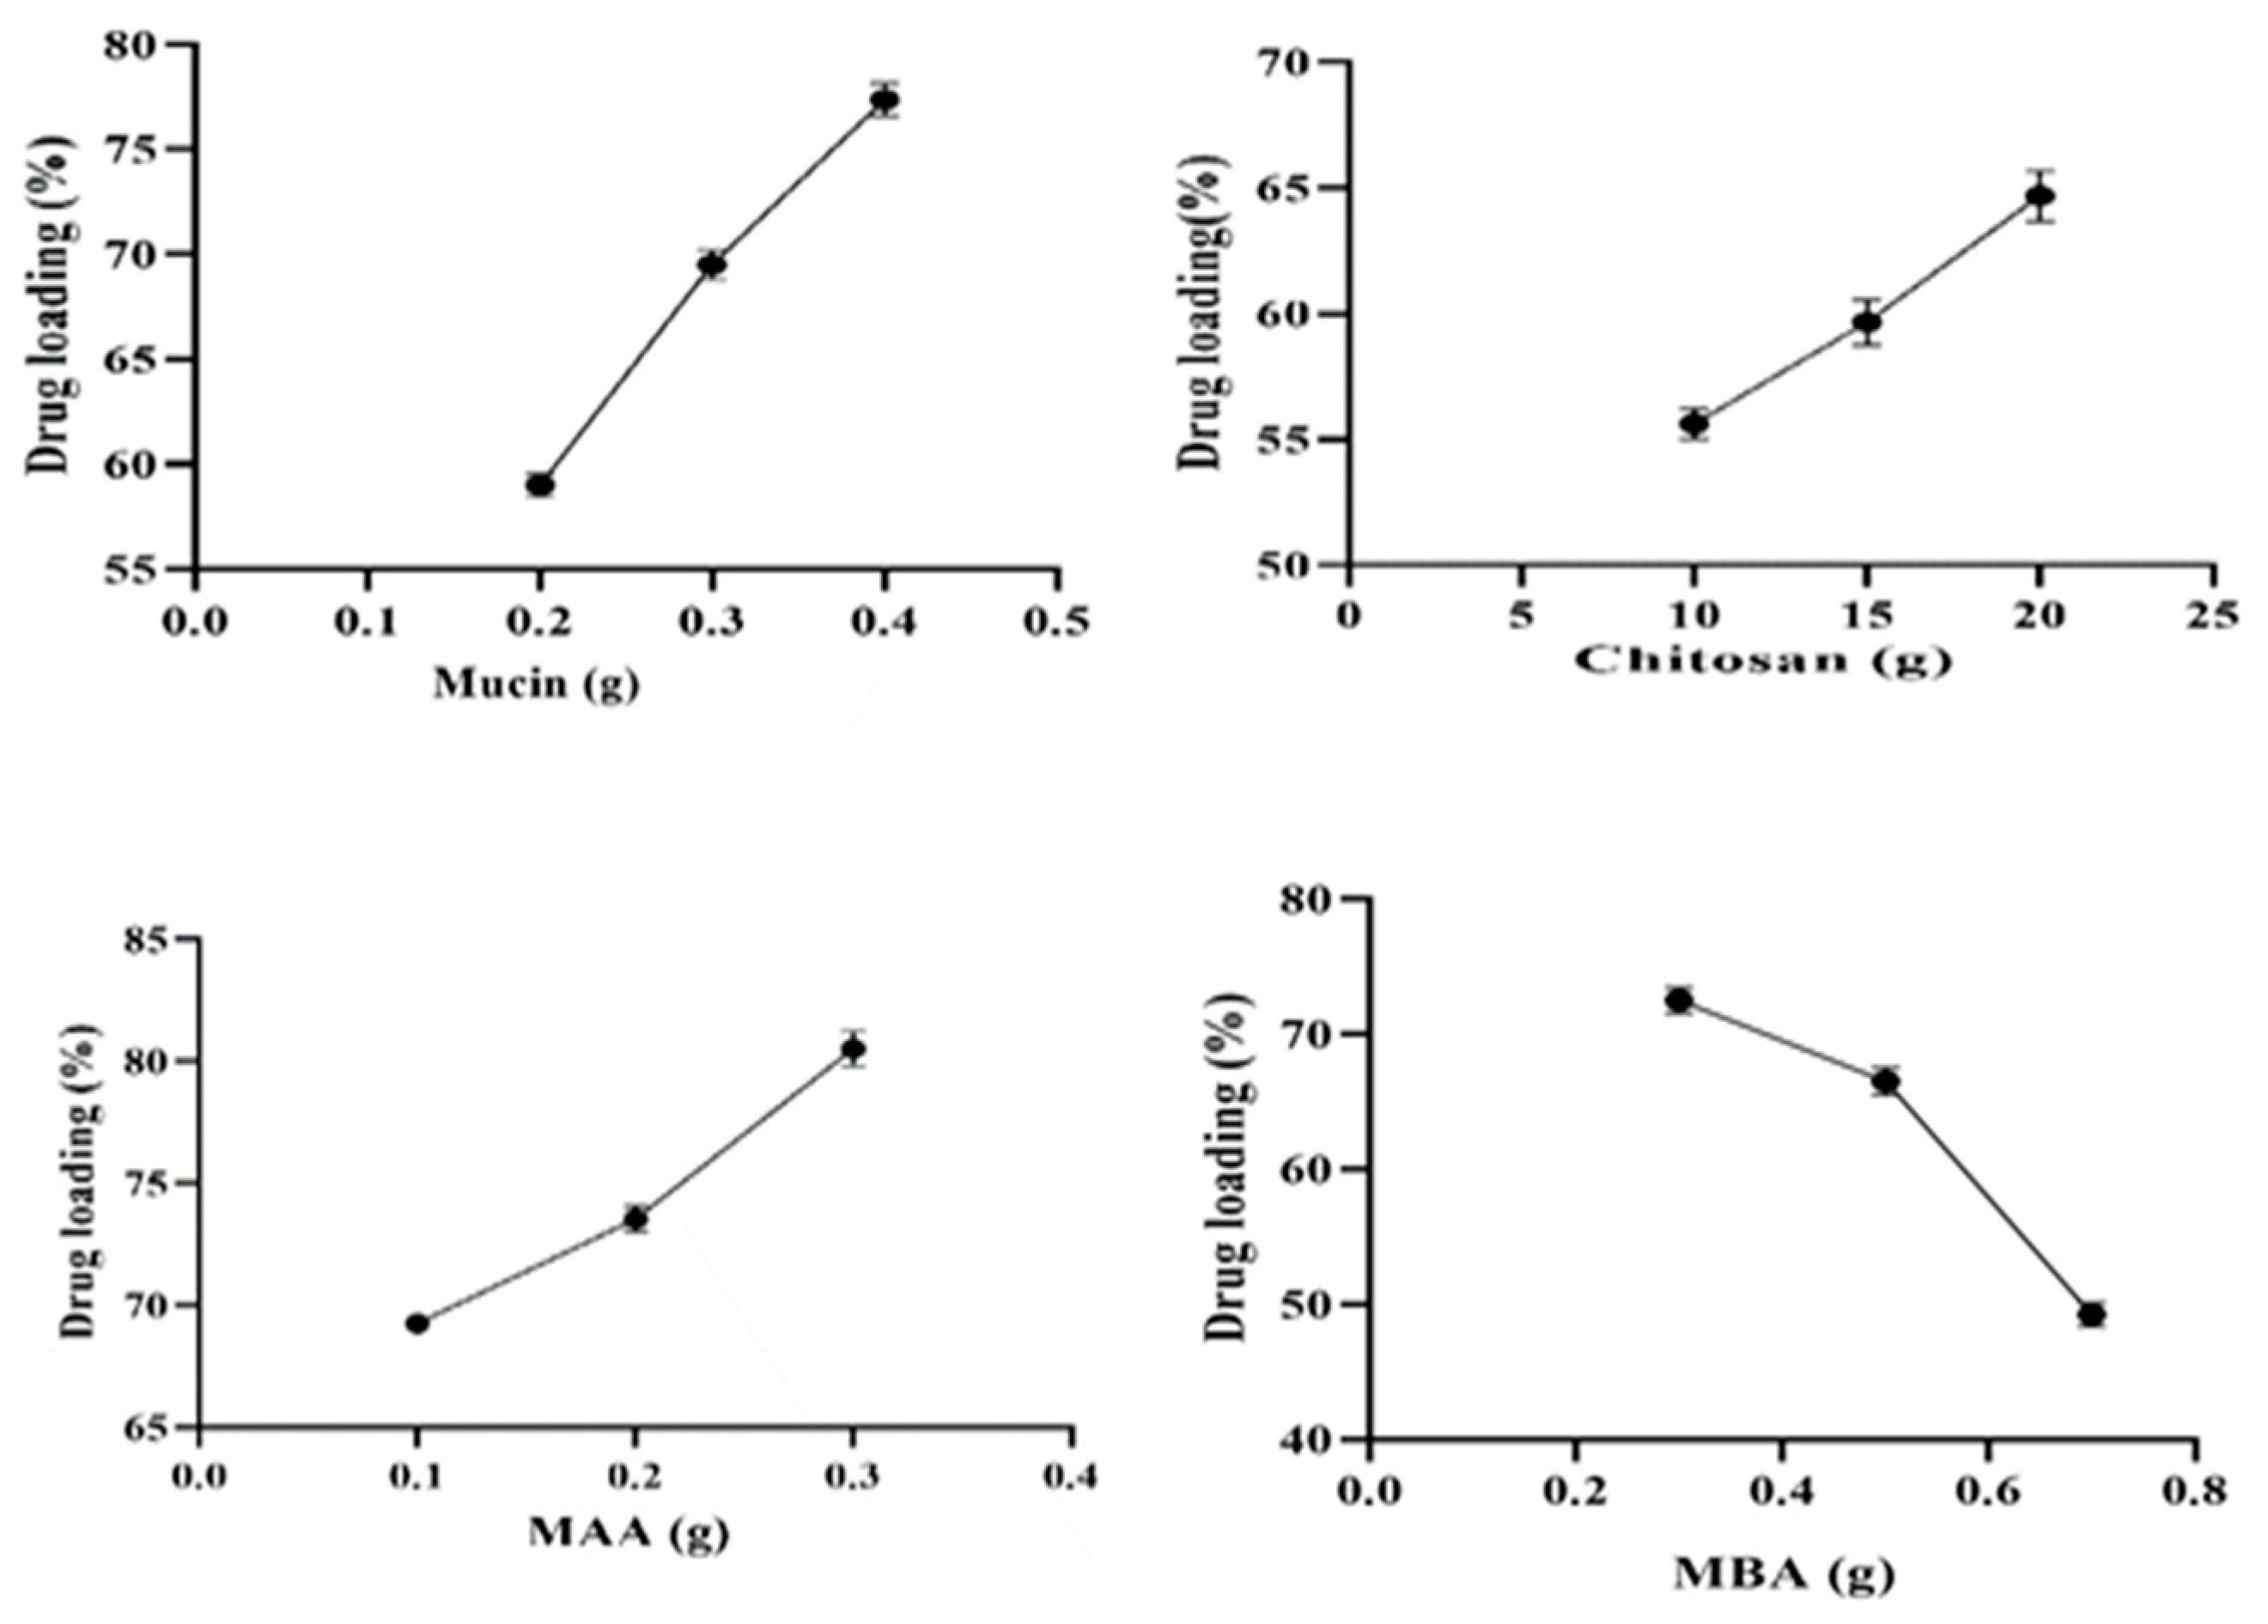
2.7. Drug Loading (%)
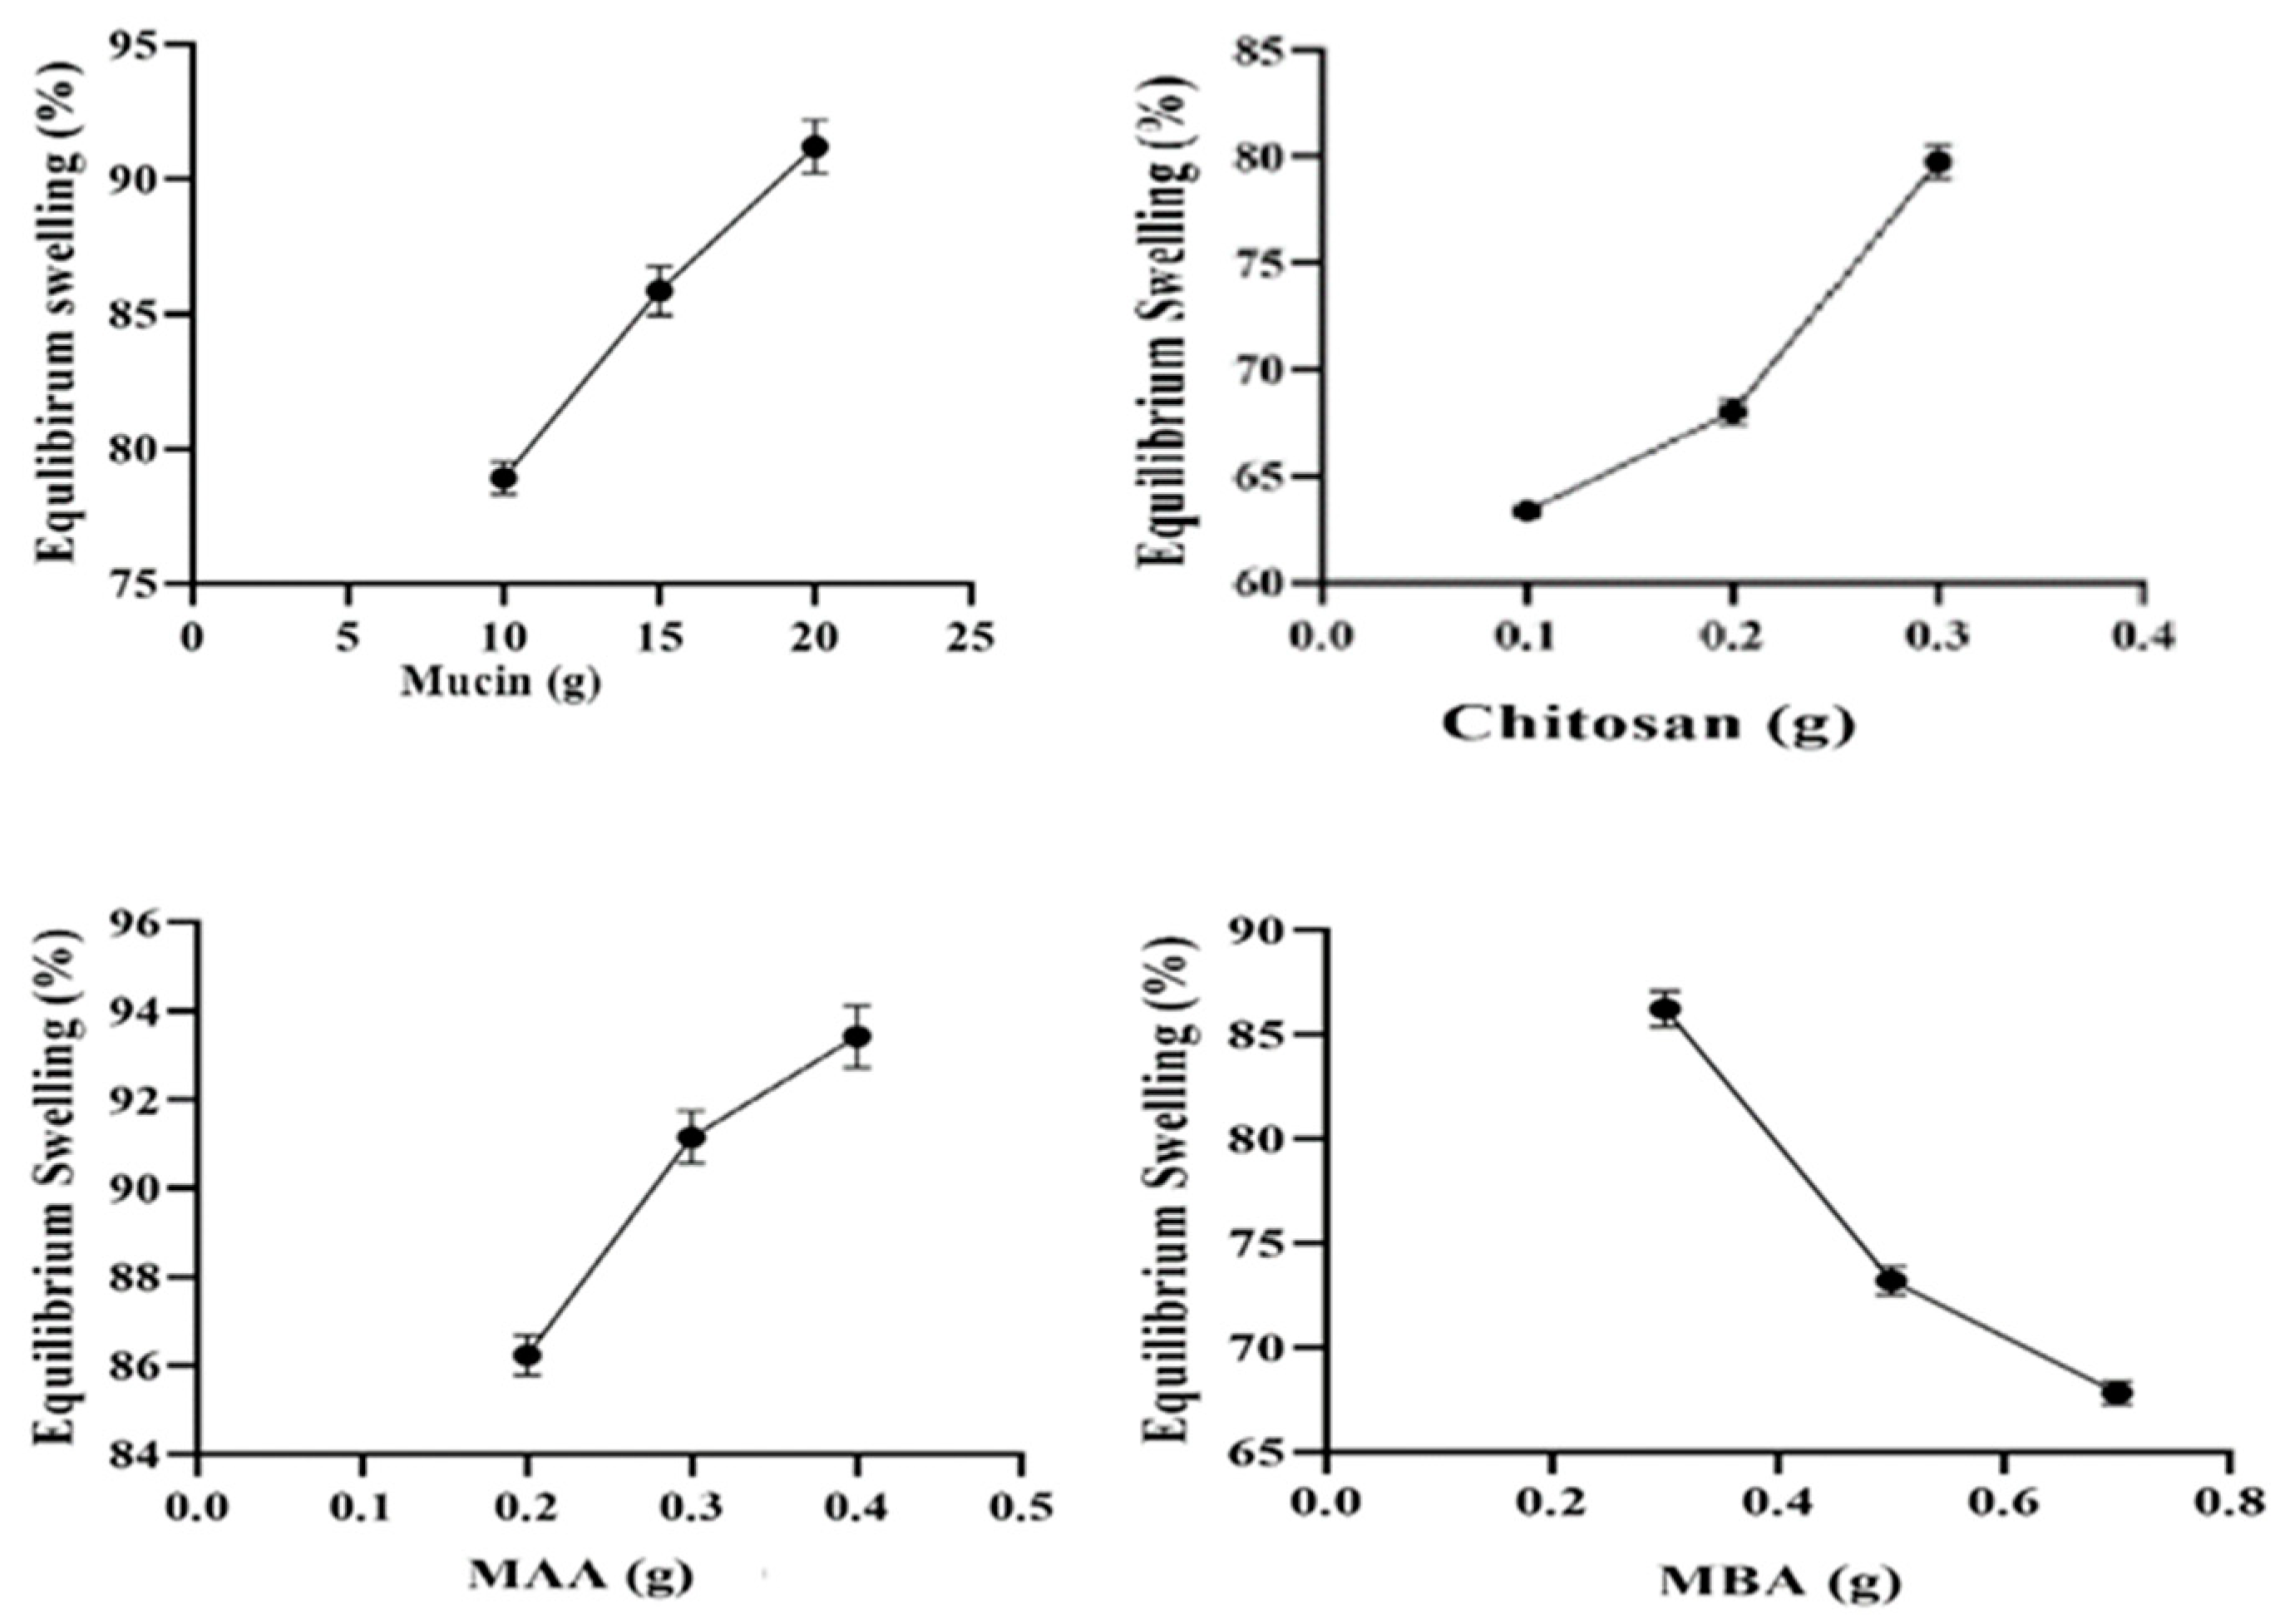
2.8. Equilibrium Swelling Studies (%)
2.9. In Vitro Dissolution Studies and Release Kinetics
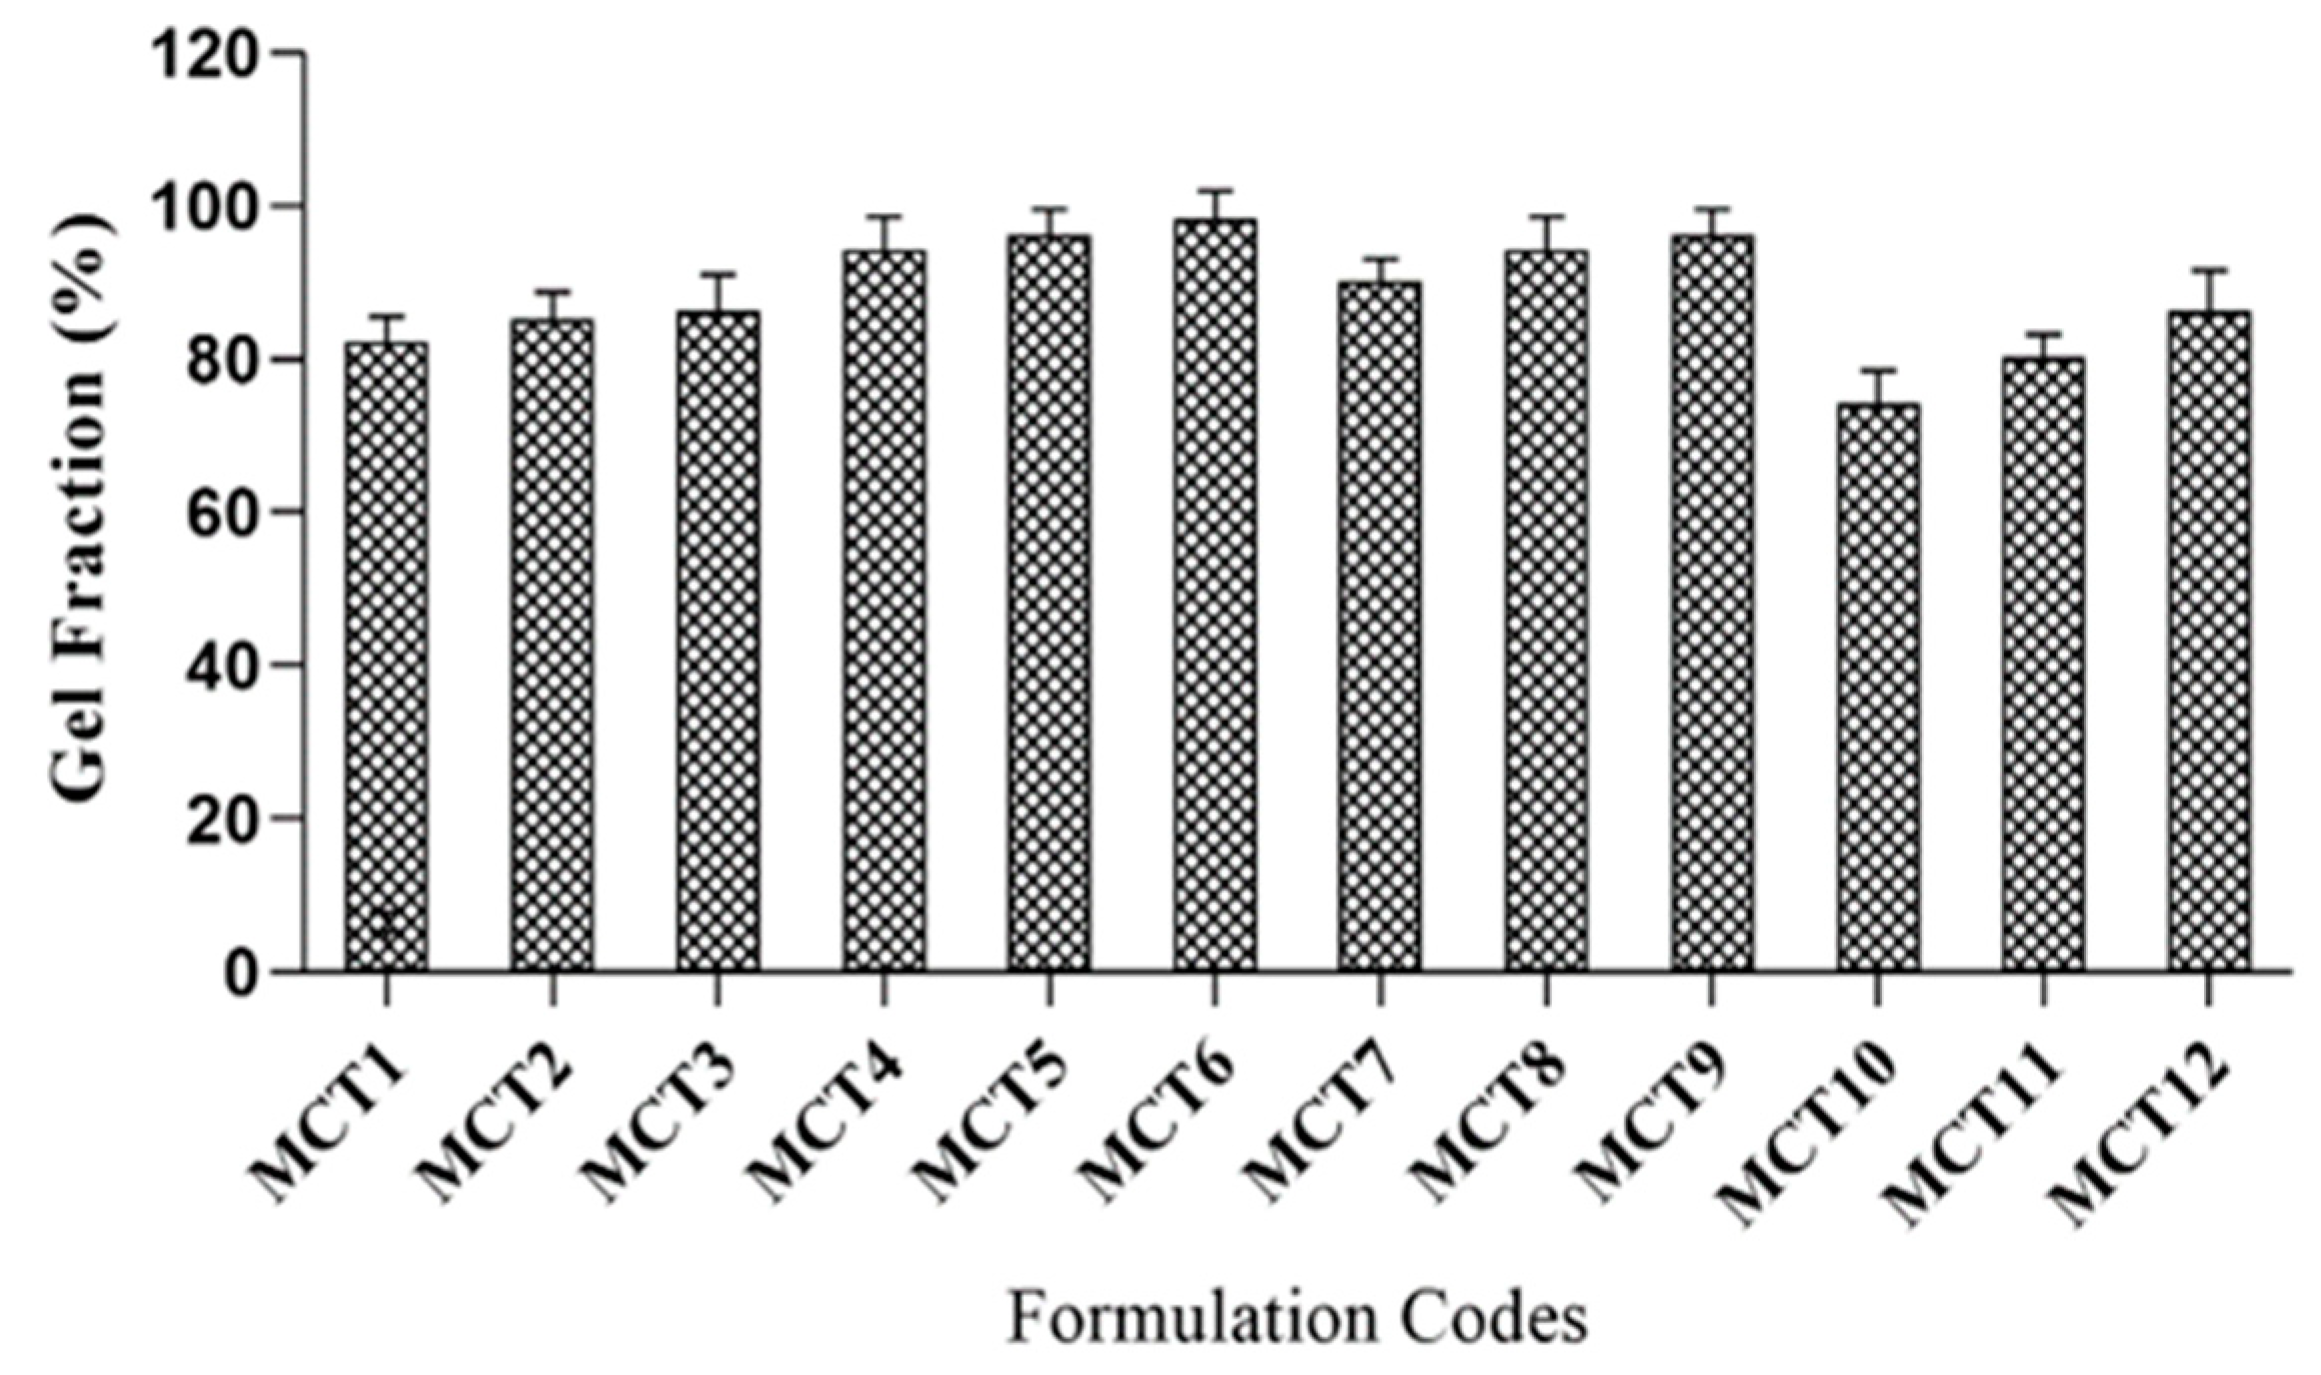
2.10. Sol–Gel Fraction
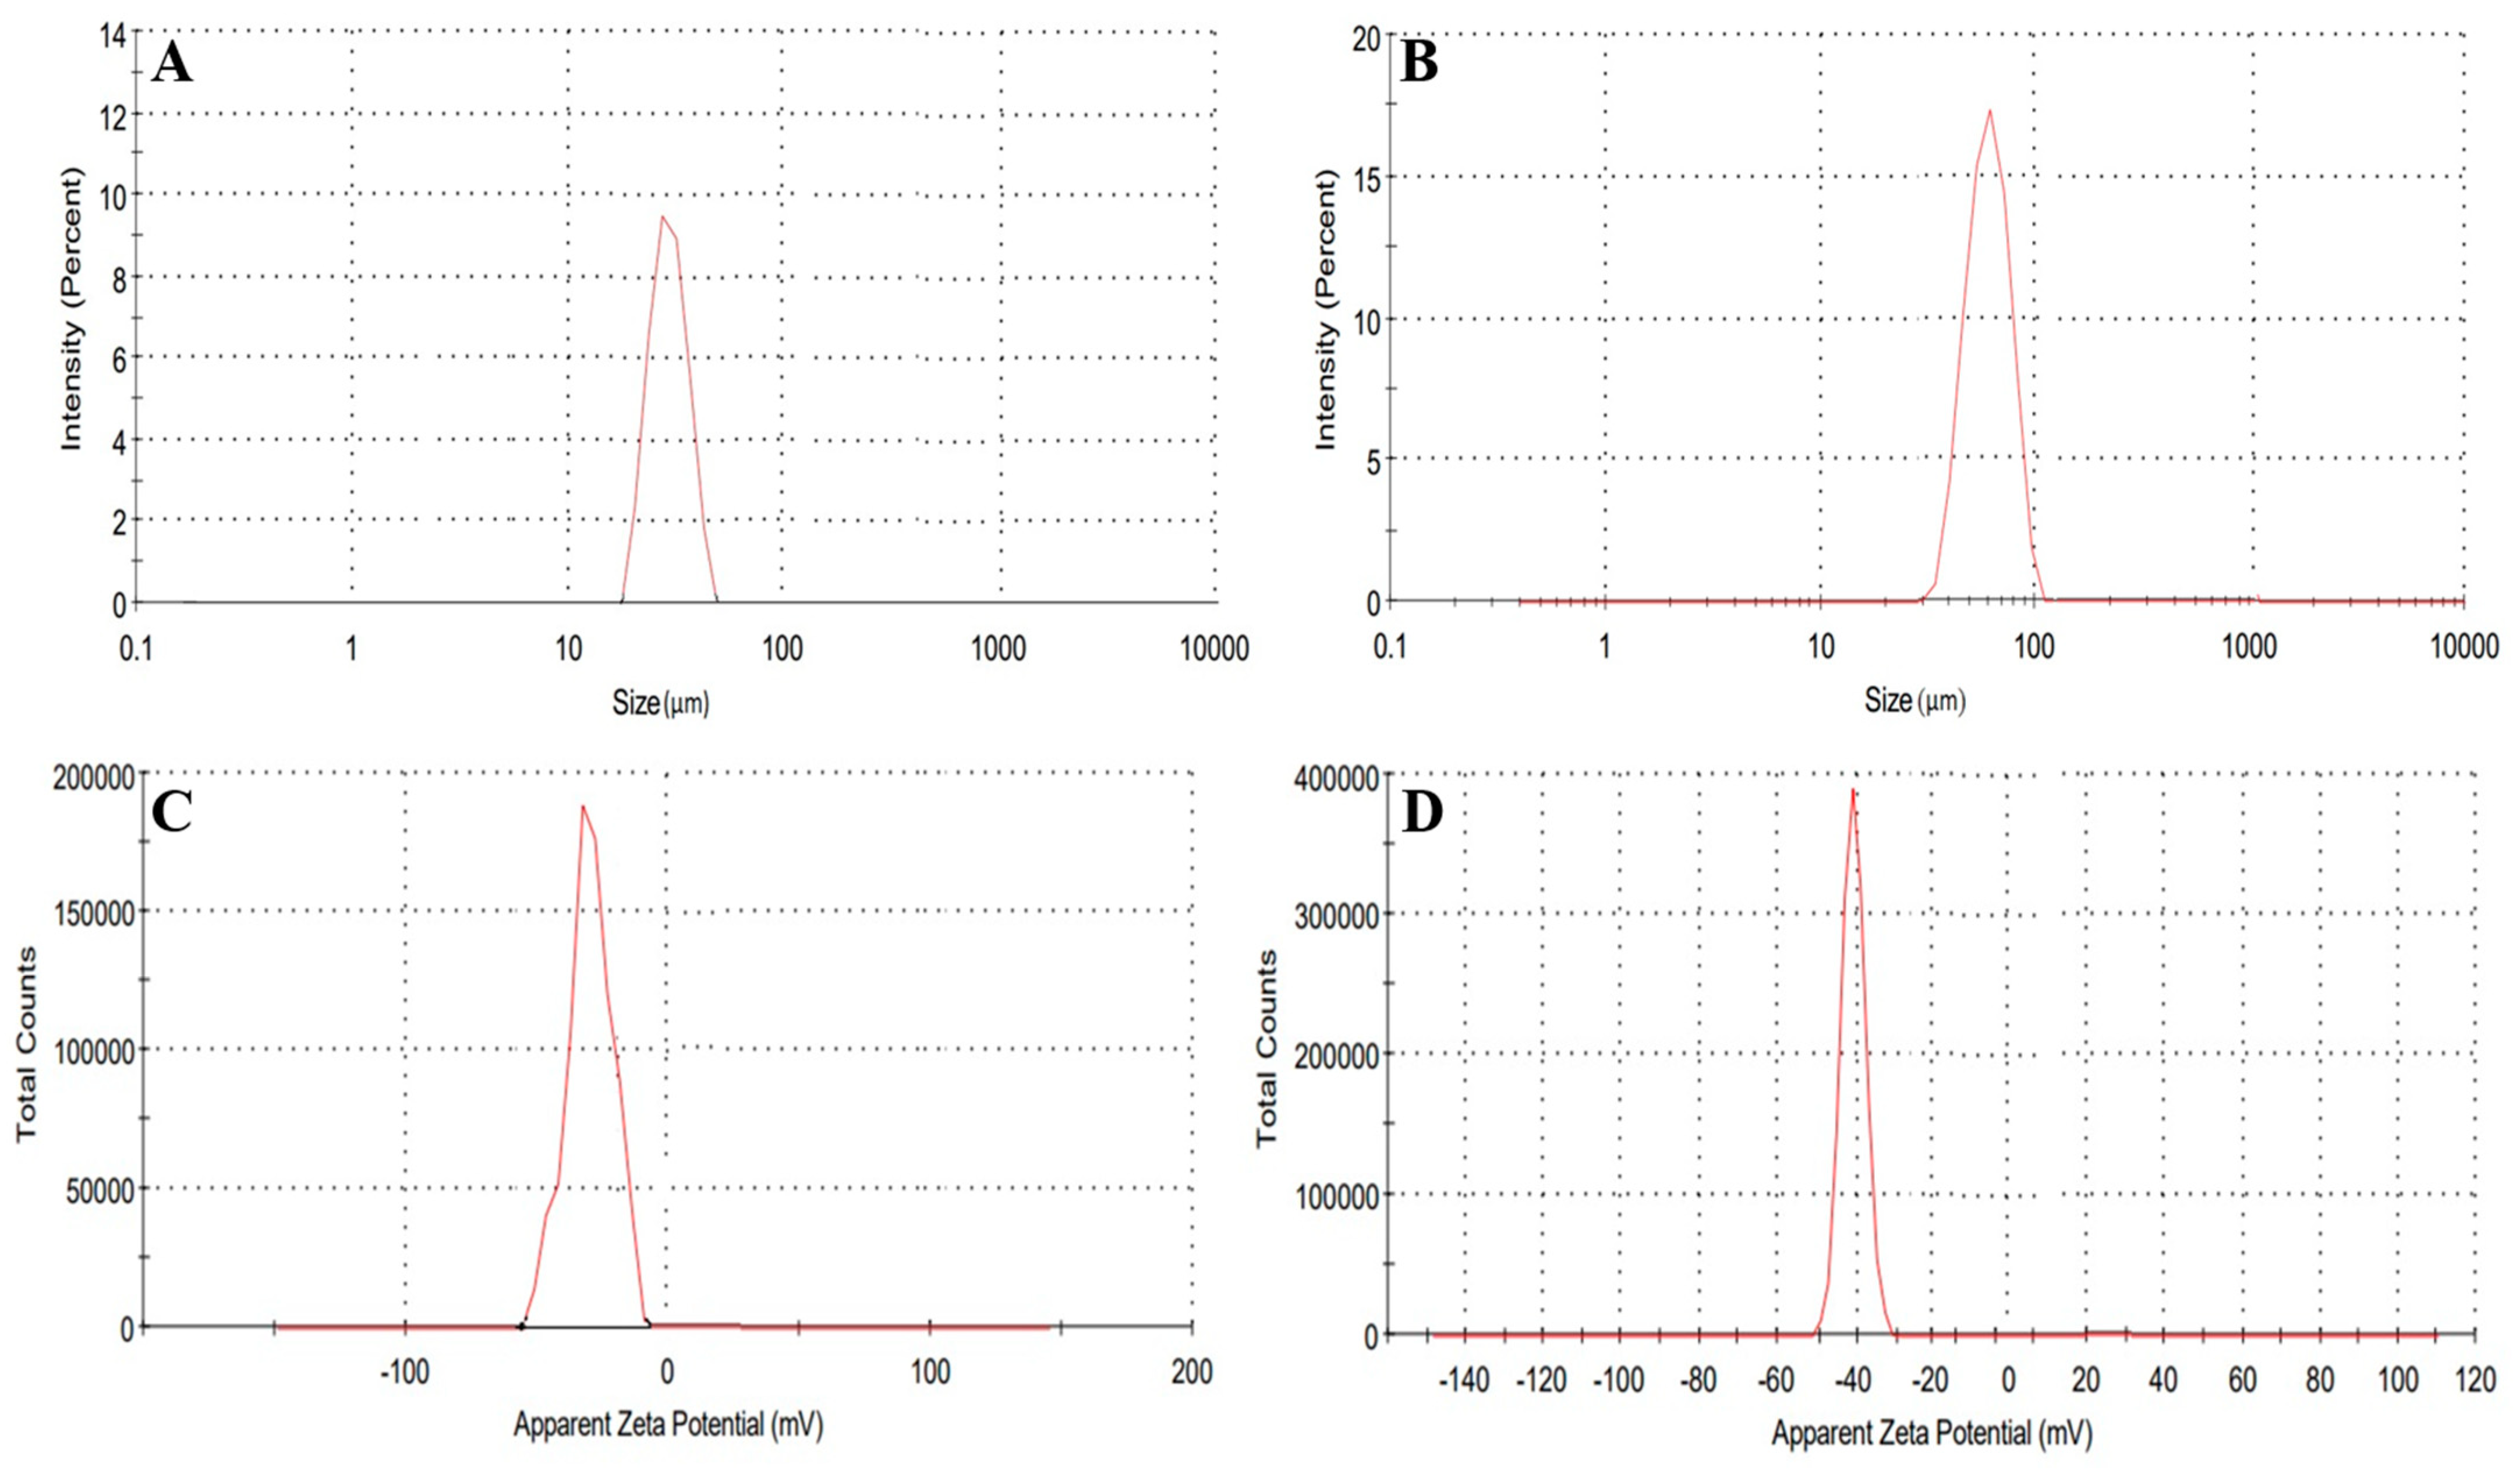
2.11. Hydrogel Microparticles Size and Zeta Potential Determination
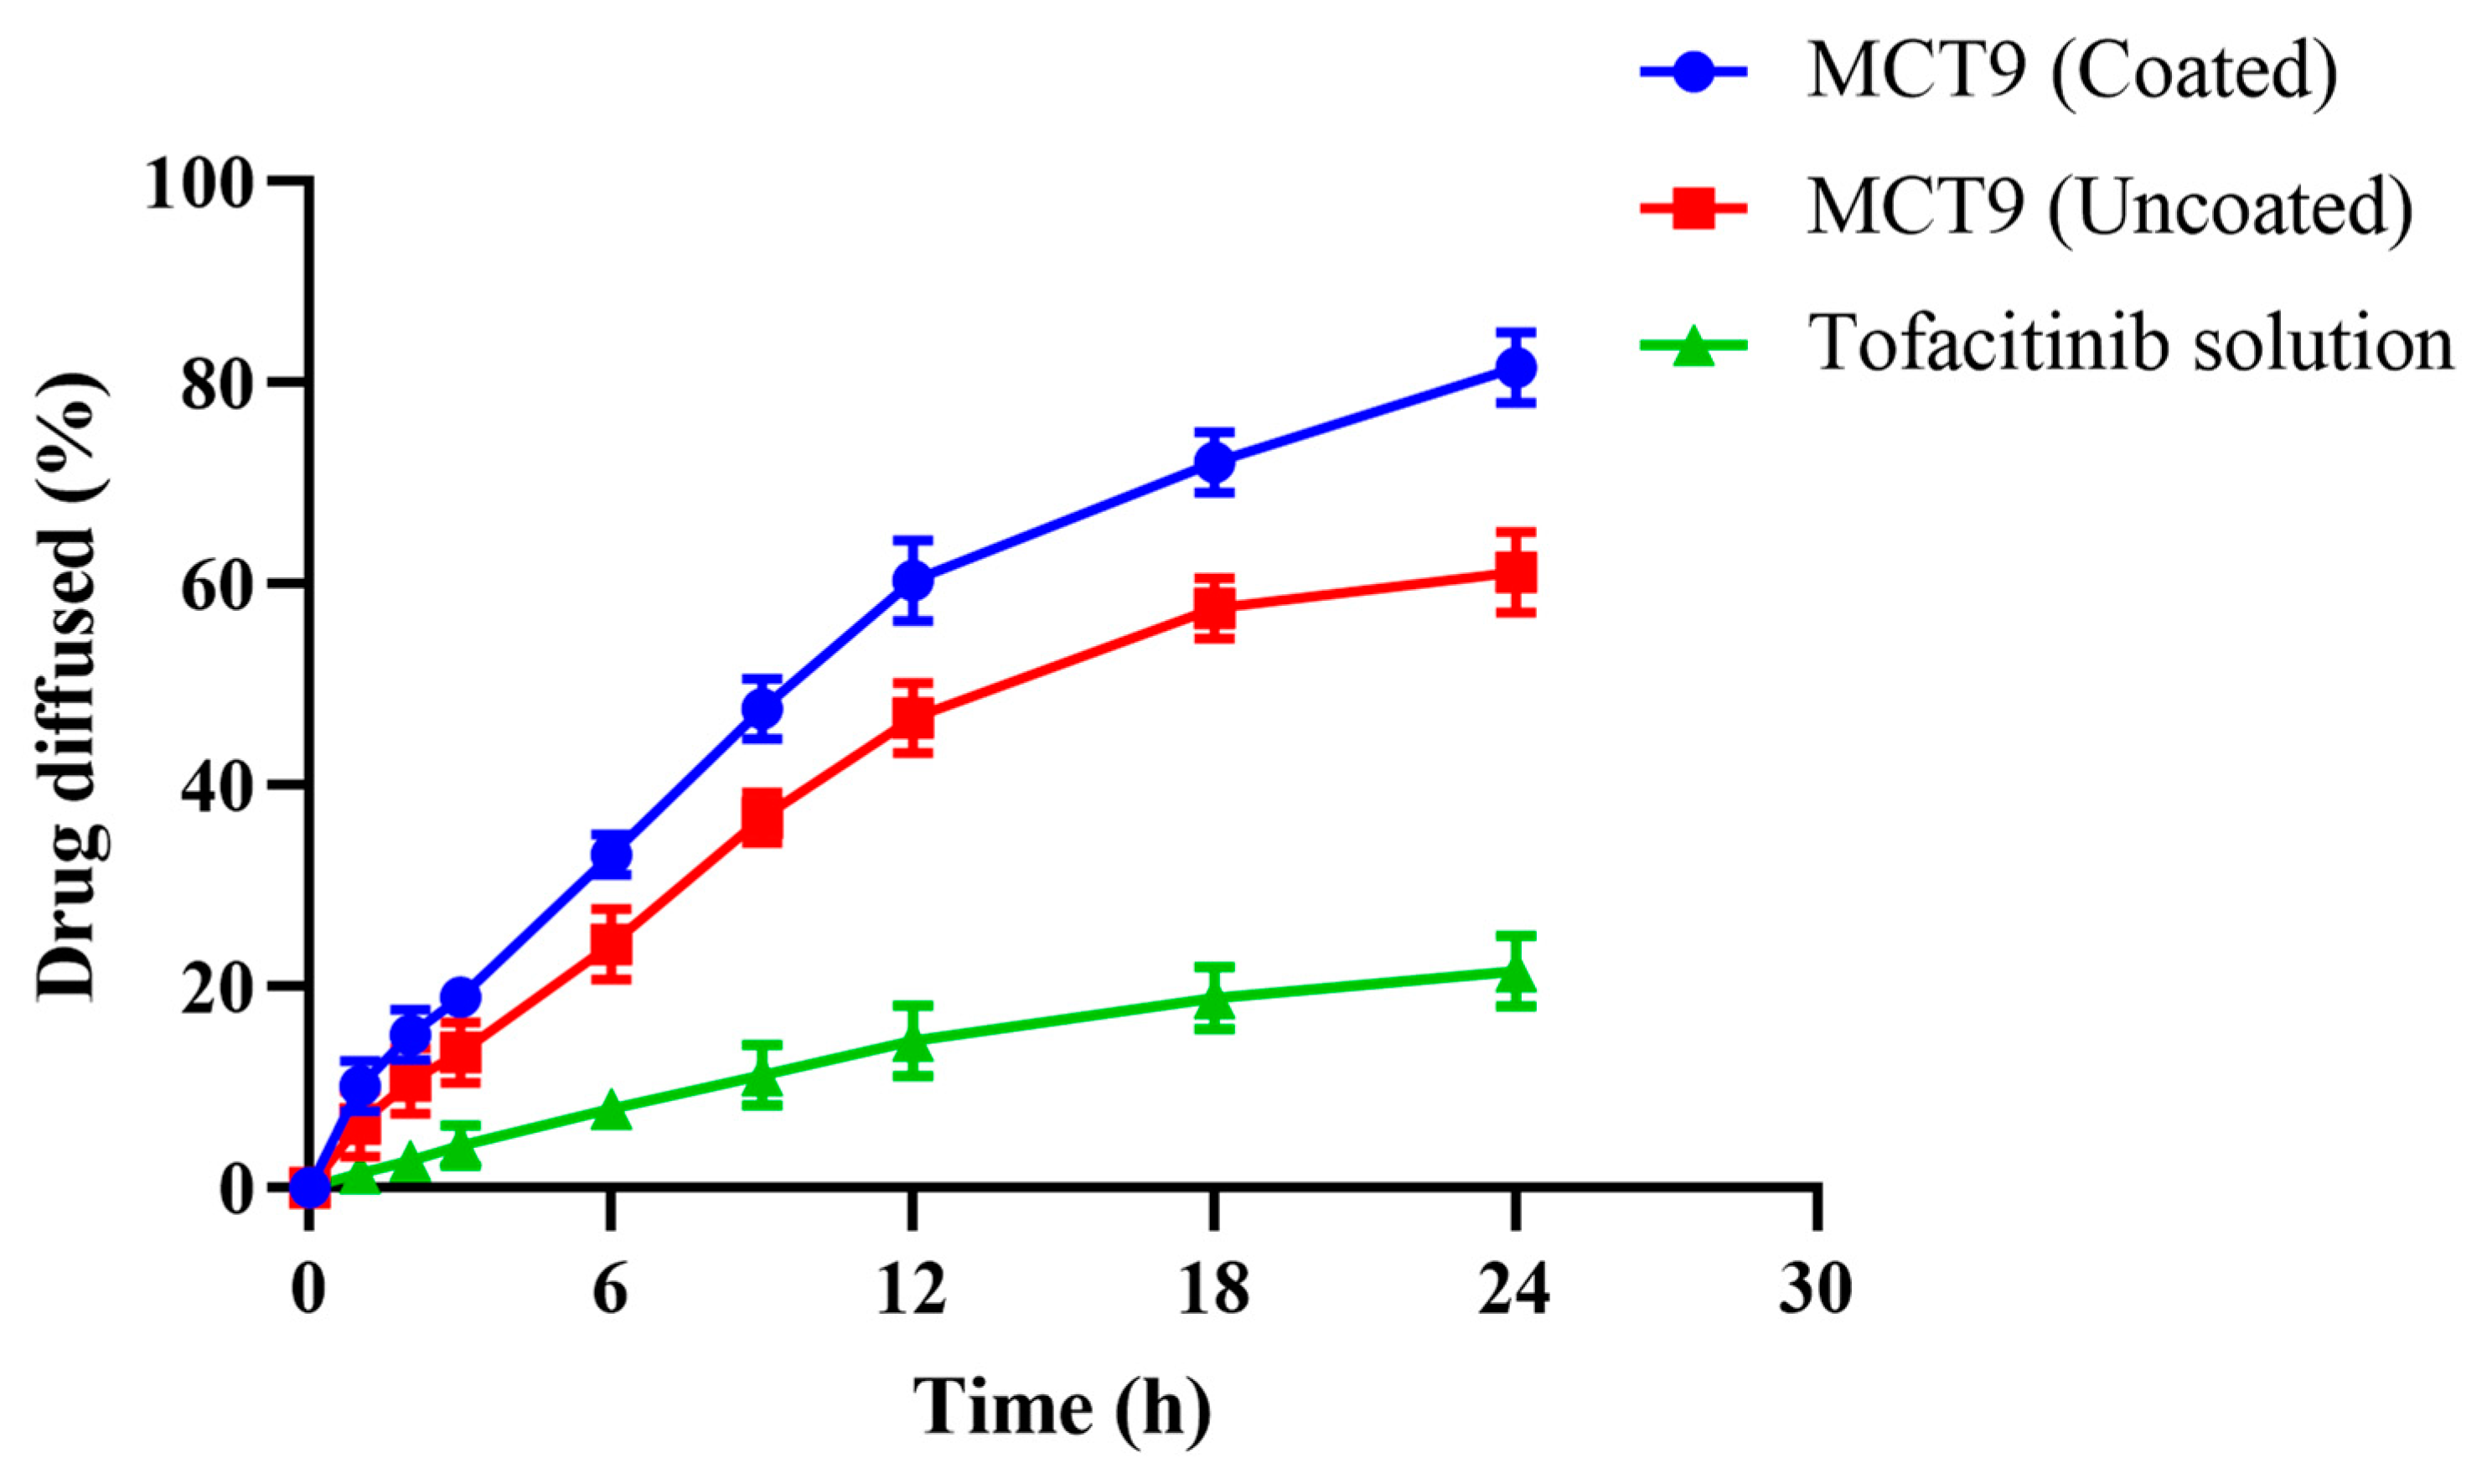
2.12. Permeation Studies
2.13. Anti-Inflammatory Studies
2.14. Oral Toxicity Studies
2.14.1. Clinical Manifestations
2.14.2. Blood Analysis
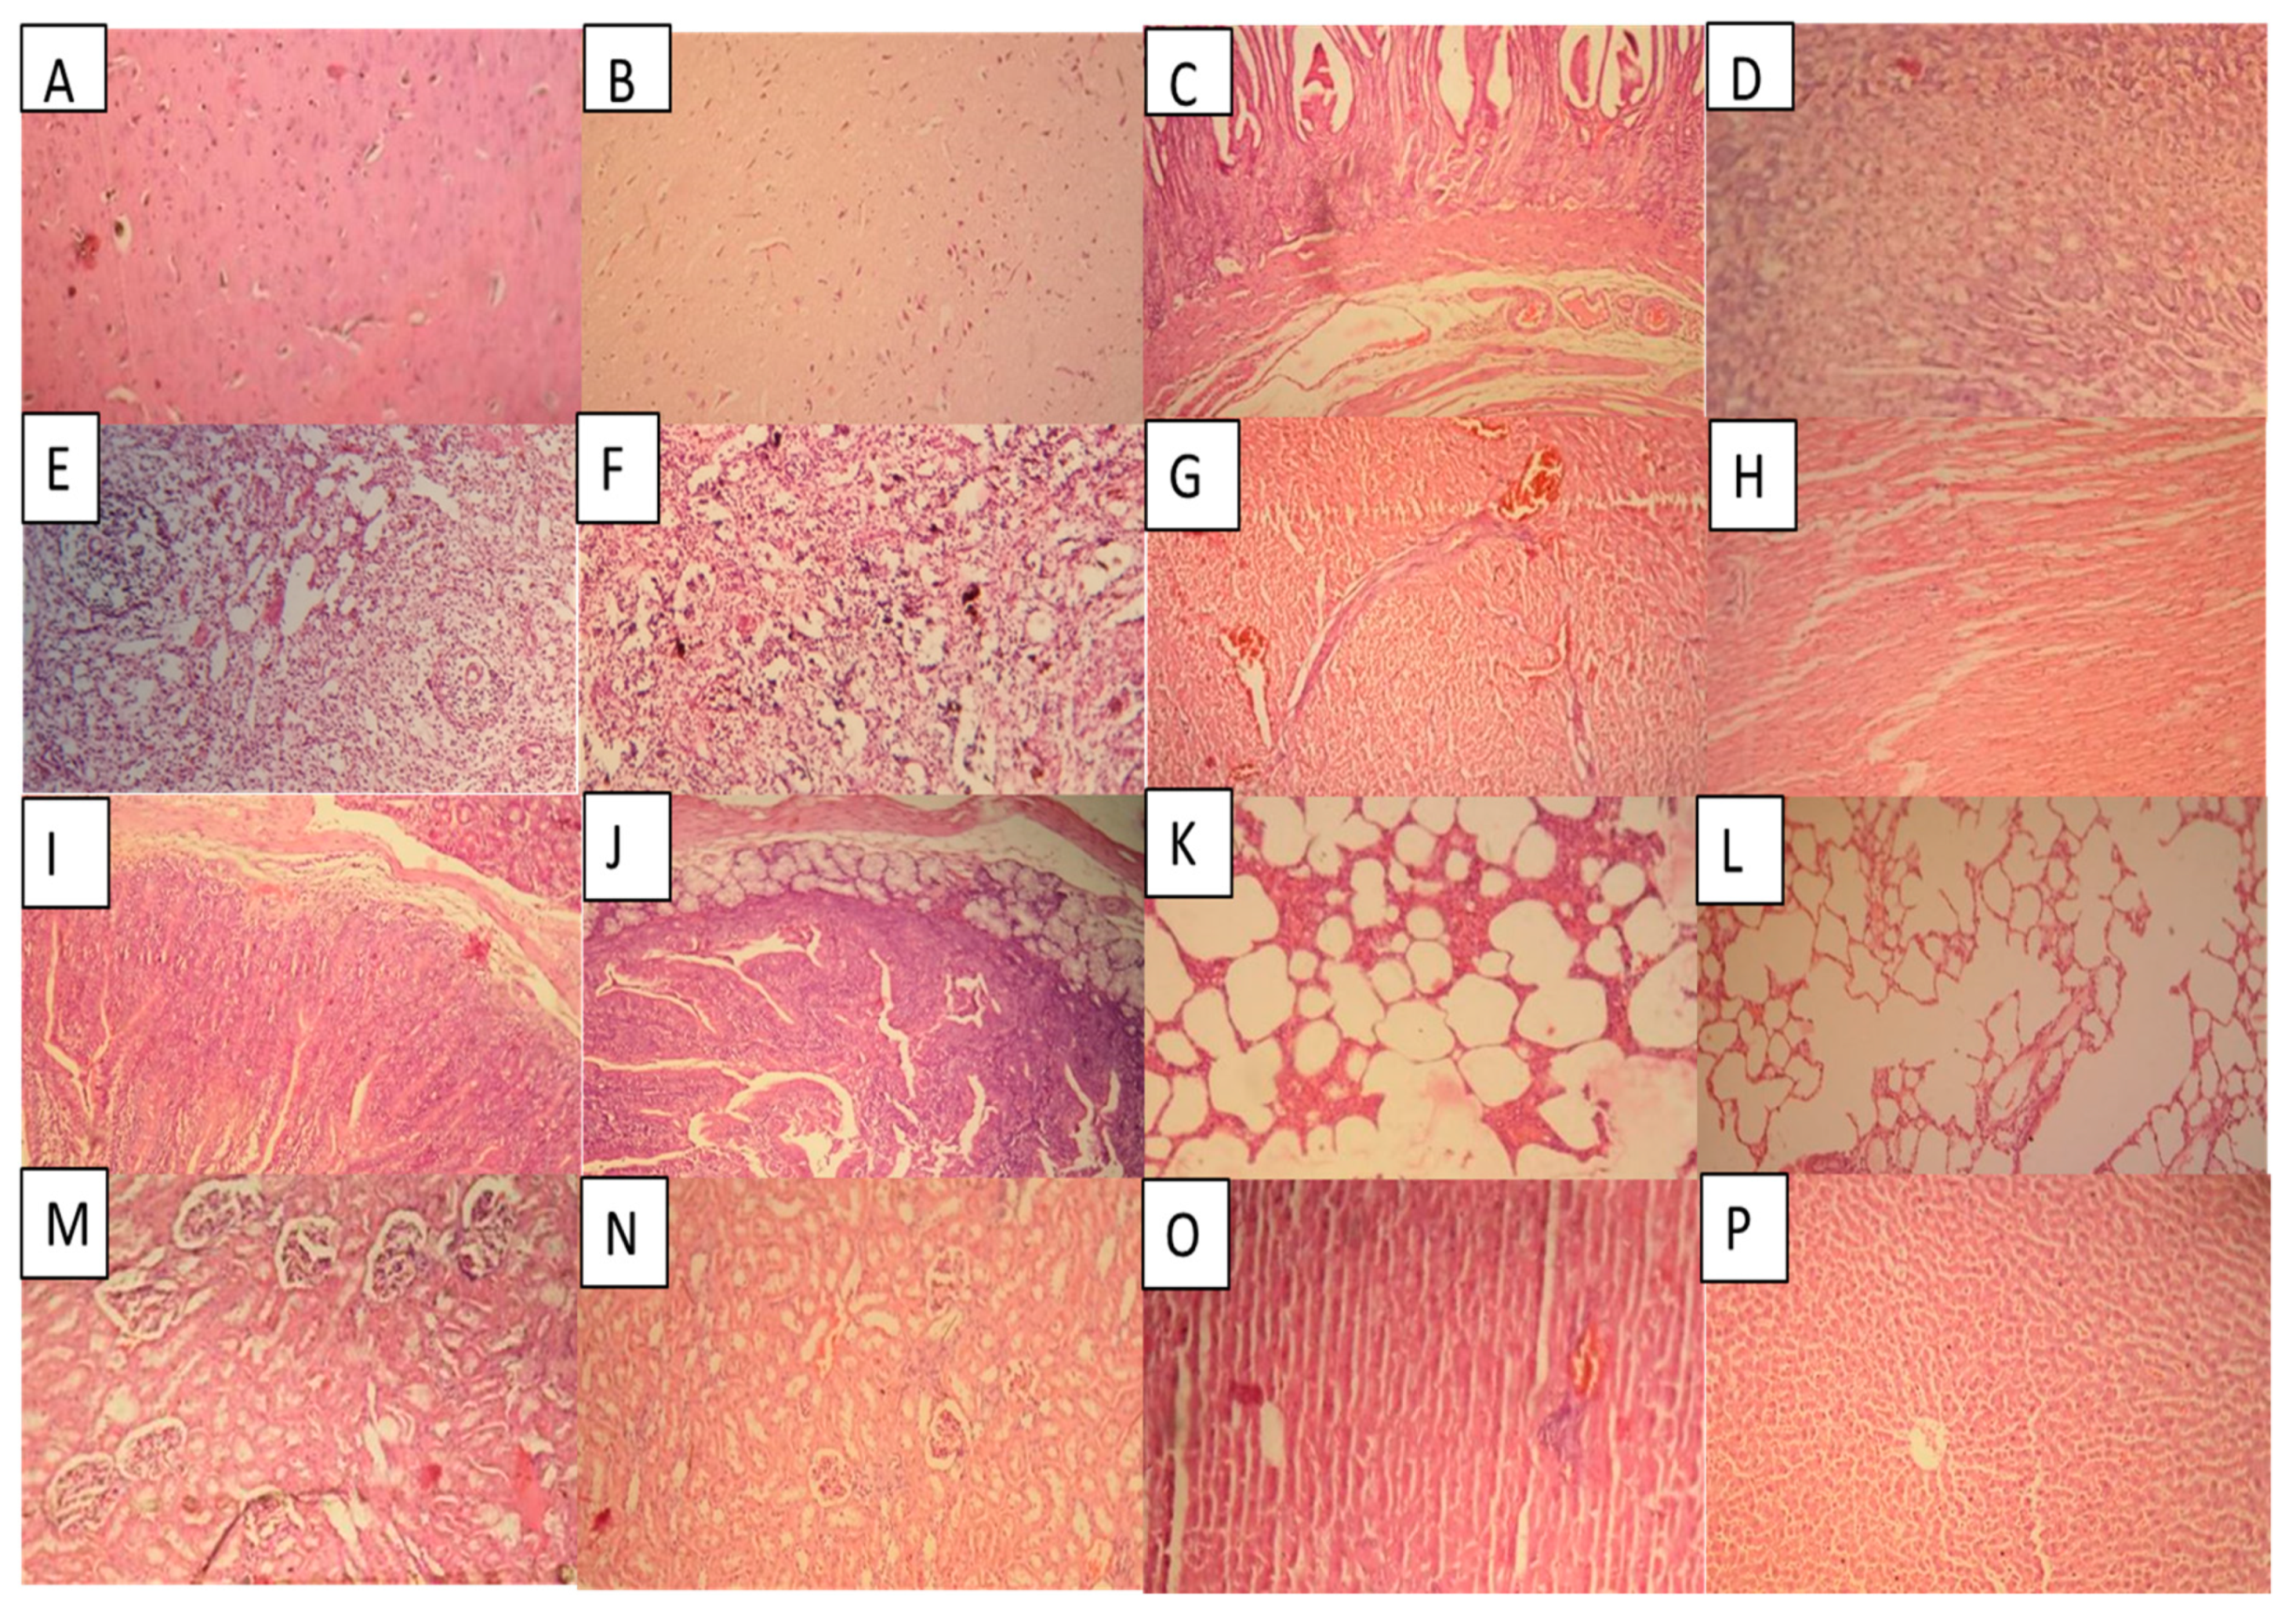
2.14.3. Histopathological Examination
3. Conclusions
4. Materials
4.1. Methods
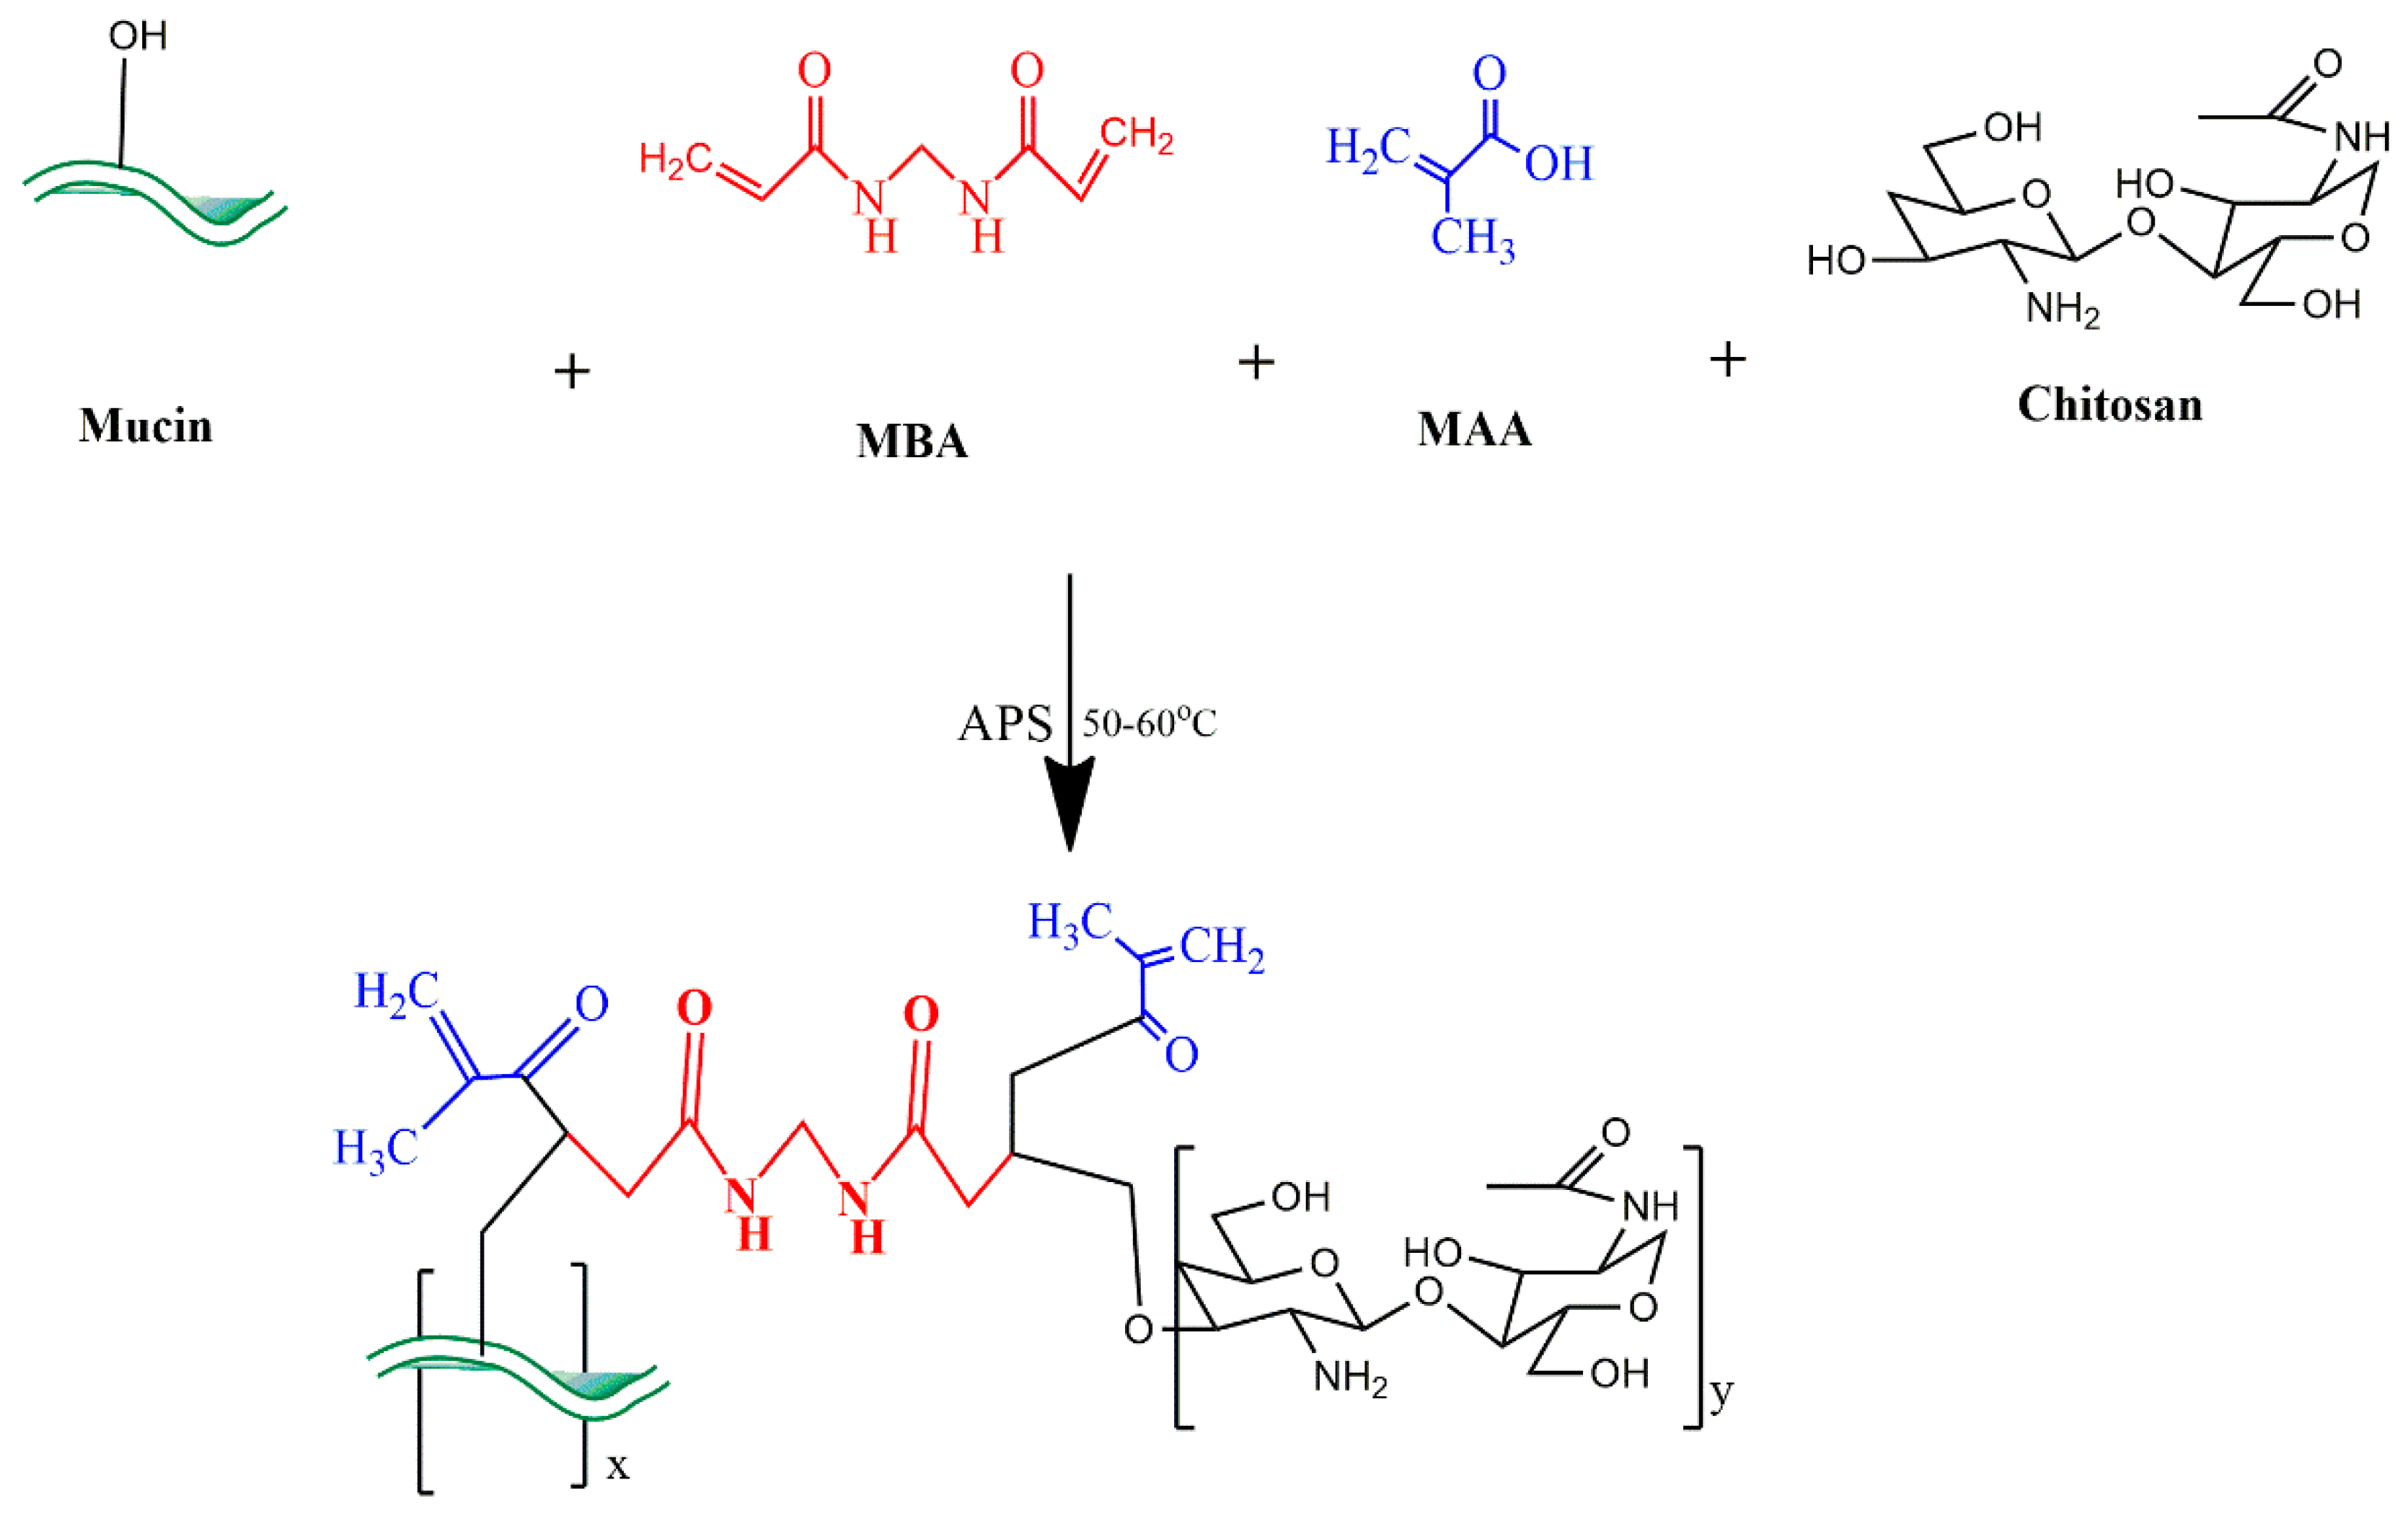
4.1.1. Development of MU-CHI-Co-Poly (MAA) Hydrogel Microparticles
4.1.2. Coating of Hydrogel Microparticles
4.2. Characterization
4.2.1. Elemental Analysis
4.2.2. Fourier Transform Infrared Spectroscopy
4.2.3. Differential Scanning Calorimetry
4.2.4. Thermogravimetric Analysis
4.2.5. X-ray Diffraction Analysis
4.2.6. Scanning Electron Microscopy
4.2.7. Drug Loading (%)
4.2.8. Equilibrium Swelling Studies
4.2.9. In Vitro Drug Release and Kinetic Modeling
4.2.10. Sol–Gel Fraction
4.2.11. Hydrogel Microparticles Size and Zeta Potential Determination
4.2.12. Permeation Studies in Chicken Intestine
4.2.13. Anti-Inflammatory Activity
4.3. Acute Oral Studies
4.3.1. Animals
4.3.2. Oral Toxicity Studies
Supplementary Materials
Author Contributions
Funding
Institutional Review Board Statement
Informed Consent Statement
Data Availability Statement
Acknowledgments
Conflicts of Interest
References
- Li, Y.; Sun, Y.; Wei, S.; Zhang, L.; Zong, S. Development and evaluation of tofacitinib transdermal system for the treatment of rheumatoid arthritis in rats. Drug Dev. Ind. Pharm. 2021, 47, 878–886. [Google Scholar] [CrossRef]
- Bashir, S.; Aamir, M.; Sarfaraz, R.M.; Hussain, Z.; Sarwer, M.U.; Mahmood, A.; Akram, M.R.; Qaisar, M.N. Fabrication, characterization and in vitro release kinetics of tofacitinib-encapsulated polymeric nanoparticles: A promising im-plication in the treatment of rheumatoid arthritis. Int. J. Polym. Mater. 2021, 70, 449–458. [Google Scholar] [CrossRef]
- Weisshof, R.; Aharoni, G.M.; Sossenheimer, P.H.; El Jurdi, K.; Ollech, J.E.; Pekow, J.; Cohen, R.D.; Sakuraba, A.; Dalal, S.; Rubin, D.T. Real-world experience with tofacitinib in IBD at a tertiary center. Dig. Dis. Sci. 2019, 64, 945–1951. [Google Scholar] [CrossRef] [PubMed]
- Lundquist, L.M.; Cole, S.W.; Sikes, M.L. Efficacy and safety of tofacitinib for treatment of rheumatoid arthritis. World J. Orthop. 2014, 5, 504. [Google Scholar] [CrossRef] [PubMed]
- Kushner, I.J.; Lamba, M.; Stock, T.; Wang, R.; Nemeth, M.A.; Alvey, C.; Chen, R.; DeMatteo, V.; Blanchard, A. Development and validation of a level A in-vitro in-vivo correlation for tofacitinib modified-release tablets using extrudable core system osmotic delivery technology. Eur. J. Pharm. Sci. 2020, 147, 05200. [Google Scholar] [CrossRef] [PubMed]
- Tanaka, Y.; Suzuki, M.; Nakamura, H.; Toyoizumi, S.; Zwillich, S.H.; Investigators, T.S. Phase II study of tofacitinib (CP-690,550) combined with methotrexate in patients with rheumatoid arthritis and an inadequate response to methotrexate. Arthritis Care Res. 2011, 63, 1150–1158. [Google Scholar] [CrossRef]
- Morrissey, H.; Ball, P.A.; Askari, A.; Nouri, A.K. Janus kinase enzyme (JAK) inhibitors and rheumatoid arthritis: A re-view of the literature. Int. J. Curr. Pharm. Res. 2019, 11, 11–14. [Google Scholar]
- Nygaard, G.; Firestein, G.S. Restoring synovial homeostasis in rheumatoid arthritis by targeting fibroblast-like synovio-cytes. Nat. Rev. Rheumatol. 2020, 16, 316–333. [Google Scholar] [CrossRef]
- Rocha, S.d.B.; Baldo, D.C.; Andrade, L.E.C. Clinical and pathophysiologic relevance of autoantibodies in rheumatoid arthritis. Adv. Rheumatol. 2019, 59, 2. [Google Scholar] [CrossRef]
- Derksen, V.; Huizinga, T.; Woude, V.D.D. The role of autoantibodies in the pathophysiology of rheumatoid arthritis. Semin Immunopathol. 2017, 39, 437–446. [Google Scholar] [CrossRef] [Green Version]
- Yang, M.; Feng, X.; Ding, J.; Chang, F.; Chen, X. Nanotherapeutics relieve rheumatoid arthritis. J. Control. Release 2017, 252, 108–124. [Google Scholar] [CrossRef]
- Zampeli, E.; Vlachoyiannopoulos, P.G.; Tzioufas, A.G. Treatment of rheumatoid arthritis: Unraveling the conundrum. J. Autoimmun. 2015, 65, 1–18. [Google Scholar] [CrossRef]
- Authimoolam, S.P.; Dziubla, T.D. Biopolymeric mucin and synthetic polymer analogs: Their structure, function and role in biomedical applications. Polymers 2016, 8, 71. [Google Scholar] [CrossRef] [Green Version]
- Kufe, D.W. Mucins in cancer: Function, prognosis and therapy. Nat. Rev. Cancer 2009, 9, 874–885. [Google Scholar] [CrossRef] [Green Version]
- Eraga, S.O.; Ofeogbu, P.U.; Ovu, E.O.; IArhewoh, M. An investigation of the properties of mucin obtained from three sources. Pharma. Innov. 2016, 5, 8. [Google Scholar]
- Kenechukwu, F.C.; Ibezim, E.C.; Attama, A.A.; Momoh, M.A.; Ogbonna, J.D.N.; Nnamani, P.O.; Chime, S.A.; Umeyor, C.E.; Uronnachi, E.M. Preliminary spectroscopic characterization of PEGylated mucin, a novel polymeric drug delivery system. Afr. J. Biotechnol. 2013, 12, 6661–6671. [Google Scholar]
- Arhewoh, M.I.; Eraga, S.O.; Builders, P.F.; Ibobiri, M.A. Effect of mucin extraction method on some properties of metro-nidazole mucoadhesive loaded patches. J. Pharm. Bioresour. 2015, 12, 1–7. [Google Scholar] [CrossRef]
- Yan, H.; Hjorth, M.; Winkeljann, B.; Dobryden, I.; Lieleg, O.; Crouzier, T. Glyco-modification of mucin hydrogels to investigate their immune activity. ACS Appl. Mater. Interfaces 2020, 12, 19324–19336. [Google Scholar] [CrossRef]
- Duffy, C.V.; David, L.; Crouzier, T. Covalently-crosslinked mucin biopolymer hydrogels for sustained drug delivery. Acta Biomater. 2015, 20, 51–59. [Google Scholar] [CrossRef] [Green Version]
- Hussain, H.R.; Bashir, S.; Mahmood, A.; Sarfraz, R.M.; Kanwal, M.; Ahmad, N.; Shah, H.S.; Nazir, I. Fenugreek seed mucilage grafted poly methacrylate pH-responsive hydrogel: A promising tool to enhance the oral bioavailability of methotrexate. Int. J. Biol. Macromol. 2022, 202, 332–344. [Google Scholar] [CrossRef]
- Cheung, R.C.F.; Ng, T.B.; Wong, J.H.; Chan, W.Y. Chitosan: An update on potential biomedical and pharmaceutical applications. Mar. Drugs 2015, 13, 5156–5186. [Google Scholar] [CrossRef] [PubMed]
- Alam, M.I.; Paget, T.; Elkordy, A.A. Characterization of furazolidone-chitosan based spray dried microparticles regarding their drug release and mucin adsorptive properties. Powder Technol. 2016, 295, 175–179. [Google Scholar] [CrossRef] [Green Version]
- Pakdel, P.M.; Peighambardoust, S.J. Review on recent progress in chitosan based hydrogels for wastewater treatment ap-plication. Carbohydr. Polym. 2018, 201, 264–279. [Google Scholar] [CrossRef] [PubMed]
- Pellá, M.C.; Lima-Tenório, M.K.; Tenório-Neto, E.T.; Guilherme, M.R.; Muniz, E.C.; Rubira, A.F. Chitosan-based hydrogels: From preparation to biomedical applications. Carbohydr. Polym. 2018, 196, 233–245. [Google Scholar] [CrossRef] [PubMed]
- Sohail, M.; Ahmad, M.; Minhas, M.U.; Ali, L.; Khalid, I.; Rashid, H. Controlled delivery of valsartan by cross-linked polymeric matrices: Synthesis, in vitro and in vivo evaluation. Int. J. Pharm. 2015, 487, 110–119. [Google Scholar] [CrossRef]
- Hanif, S.; Sarfraz, R.M.; Syed, M.A.; Mahmood, A.; Hussain, Z. Smart mucoadhesive buccal chitosan/HPMC scaffold for sore throat: In vitro, ex vivo and pharmacokinetic profiling in humans. J. Drug Deliv. Sci. Tech. 2022, 71, 103271. [Google Scholar] [CrossRef]
- Sadeghi, M.; Hanifpour, F.; Taheri, R.; Javadian, H.; Ghasemi, M. Comparison of using formaldehyde and carboxy methyl chitosan in preparation of Fe3O4 superparamagnetic nanoparticles-chitosan hydrogel network: Sorption behavior toward bovine serum albumin. Process Saf. 2016, 102, 119–128. [Google Scholar] [CrossRef]
- Jóźwiak, T.; Filipkowska, U.; Szymczyk, P.; Rodziewicz, J.; Mielcarek, A. Effect of ionic and covalent crosslinking agents on properties of chitosan beads and sorption effectiveness of Reactive Black 5 dye. React. Funct. Polym. 2017, 114, 58–74. [Google Scholar] [CrossRef]
- Giri, T.K.; Thakur, A.; Alexander, A.; Badwaik, H.; Tripathi, D.K. Modified chitosan hydrogels as drug delivery and tis-sue engineering systems: Present status and applications. Acta Pharm. Sin. 2012, 2, 439–449. [Google Scholar] [CrossRef] [Green Version]
- Zhu, L.; Qiu, J.; Sakai, E.; Ito, K. Rapid recovery double cross-linking hydrogel with stable mechanical properties and high resilience triggered by visible light. ACS Appl. Mater. 2017, 9, 13593–13601. [Google Scholar] [CrossRef]
- Clara, I.; Lavanya, R.; Natchimuthu, N. pH and temperature responsive hydrogels of poly (2-acrylamido-2-methyl-1-propanesulfonic acid-co-methacrylic acid): Synthesis and swelling characteristics. J. Macro-Mol. 2016, 53, 492–499. [Google Scholar] [CrossRef]
- Barkat, K.; Ahmad, M.; Minhas, M.U.; Khalid, I.; Nasir, B. Development and characterization of pH-responsive polyethylene glycol-co-poly (methacrylic acid) polymeric network system for colon target delivery of oxaliplatin: Its acute oral toxicity study. Adv. Polym. 2018, 37, 1806–1822. [Google Scholar] [CrossRef]
- Aslam, A.; Ashraf, M.U.; Barkat, K.; Mahmood, A.; Hussain, M.A.; Farid-ul-Haq, M.; Lashkar, M.O.; Gad, H.A. Fabrication of Stimuli-Responsive Quince/Mucin Co-Poly (Methacrylate) Hydrogel Matrices for the Controlled Delivery of Acyclovir Sodium: Design, Characterization and Toxicity Evaluation. Pharmaceutics 2023, 15, 650. [Google Scholar] [CrossRef]
- Mahmood, A.; Ahmad, M.; Sarfraz, R.M.; Minhas, M.U. β-CD based hydrogel microparticulate system to improve the solubility of acyclovir: Optimization through in-vitro, in-vivo and toxicological evaluation. J. Drug Deliv. Sci. Technol. 2016, 36, 75–88. [Google Scholar] [CrossRef]
- Brand, J.S.; Forster, L.; Bock, T.; Stahlhut, P.; Teßmar, J.; Groll, J.; Albrecht, K. Covalently Crosslinked Pig Gastric Mucin Hydrogels Prepared by Radical-based Chain-Growth and Thiol-ene Mechanisms. Macromol. Biosci. 2021, 22, 2100274. [Google Scholar] [CrossRef] [PubMed]
- Khakpour, H.; Abdollahi, M. Synthesis, characterization and rheological properties of acrylamide/acidic mono-mer/N-(4-ethylphenyl) acrylamide Terpolymers as pH-responsive hydrogels and nanogels. Polym. Plast. Technol. Mat. 2020, 59, 441–455. [Google Scholar]
- Quintanilla, S.J.C.; Abundis, C.V.; Herrera, F.S.D.; Alvarez, A.J. PH-sensitive starch-based hydro-gels: Synthesis and effect of molecular components on drug release behavior. Polymers 2020, 12, 1974. [Google Scholar] [CrossRef]
- Khalid, I.; Ahmad, M.; Minhas, M.U.; Barkat, K. Synthesis and evaluation of chondroitin sulfate based hydrogels of loxoprofen with adjustable properties as controlled release carriers. Carbohydr. Polym. 2018, 181, 1169–1179. [Google Scholar] [CrossRef]
- Reddy, G.V.; Reddy, N.S.; Nagaraja, K.; Rao, K.K. Synthesis of pH responsive hydrogel matrices from guar gum and poly (acrylamide-co-acrylamidoglycolicacid) for anti-cancer drug delivery. J. Appl. Pharm. Sci. 1930, 8, 084–091. [Google Scholar]
- Ma, Z.; Ma, R.; Wang, X.; Gao, J.; Zheng, Y.; Sun, Z. Enzyme and PH responsive 5-flurouracil (5-FU) loaded hydrogels based on olsalazine derivatives for colon-specific drug delivery. Eur. Polym. 2019, 118, 64–70. [Google Scholar] [CrossRef]
- Nesrinne, S.; Djamel, A. Synthesis, characterization and rheological behavior of pH sensitive poly (acryla-mide-co-acrylic acid) hydrogels. Arab. J. Chem. 2017, 10, 539–547. [Google Scholar] [CrossRef] [Green Version]
- Bashir, S.; Teo, Y.Y.; Ramesh, S.; Ramesh, K. Synthesis and characterization of karaya gum-g-poly (acrylic acid) hydro-gels and in vitro release of hydrophobic quercetin. Polymers 2018, 147, 108–120. [Google Scholar] [CrossRef]
- Ismail, H.; Irani, M.; Ahmad, Z. Starch-based hydrogels: Present status and applications. Int. J. Polym. Mater. 2013, 62, 411–420. [Google Scholar] [CrossRef]
- Zahra, Q.; Minhas, M.U.; Khan, S.; Wu, P.C.; Suhail, M.; Iqbal, R.; Bashir, M. Fabrication of polyethylene glycol hydrogels with enhanced swelling; loading capacity and release kinetics. Polym. Bull. 2022, 79, 5389–5415. [Google Scholar] [CrossRef]
- Khan, S.; Minhas, M.U.; Aqeel, M.T.; Shah, I.; Khan, S.; Kazi, M.; Warnken, Z.N. 2 Poly (N-Vinylcaprolactam-Grafted-Sodium Alginate) Based Injectable pH/Thermo Responsive In Situ Forming Depot Hydrogels for Prolonged Controlled Anticancer Drug Delivery; In Vitro, In Vivo Characterization and Toxicity Evaluation. Pharmaceutics 2022, 14, 1050. [Google Scholar] [CrossRef]
- Momoh, M.A.; Akpa, P.A.; Ugwu, K.C.; Kenechukwu, F.C.; Kenneth, O.C. Pharmacodynamics and pharmacokinetics behaviour of insulin from PEGylated-mucin microparticles coated with pH sensitive polymer: Preparation and character-ization. Mater. Today Commun. 2020, 25, 101539. [Google Scholar] [CrossRef]
- Bai, X.; Bao, Z.; Bi, S.; Li, Y.; Yu, X.; Hu, S.; Tian, M.; Zhang, X.; Cheng, X.; Chen, X. Chitosan-based thermo/pH double sensitive hydrogel for controlled drug delivery. Macromol. Biosci. 2018, 18, 700305. [Google Scholar] [CrossRef]
- Mahmood, A.; Sharif, A.; Muhammad, F.; Sarfraz, R.M.; Abrar, M.A.; Qaisar, M.N.; Anwer, N.; Amjad, M.W.; Zaman, M. Development and in vitro evaluation of (β cyclodextrin-g-methacrylic acid)/Na+-montmorillonite nanocomposite hydro-gels for controlled delivery of lovastatin. Int. J. Nanomed. 2019, 14, 5397. [Google Scholar] [CrossRef] [Green Version]
- Malik, N.S.; Ahmad, M.; Minhas, M.U.; Tulain, R.; Barkat, K.; Khalid, I.; Khalid, Q. Chitosan/xanthan gum based hydrogels as potential carrier for an antiviral drug: Fabrication, characterization, and safety evaluation. Front. Chem. 2020, 8, 50. [Google Scholar] [CrossRef] [Green Version]
- Surya, R.; Mullassery, M.D.; Fernandez, N.B.; Thomas, D.; Jayaram, P.S. Synthesis and characterization of a pH re-sponsive and mucoadhesive drug delivery system for the controlled release application of anti-cancerous drug. Arab. J. Chem. 2020, 13, 5262–5276. [Google Scholar] [CrossRef]
- Bashir, S.; Zafar, N.; Lebaz, N.; Mahmood, A.; Elaissari, A. Hydroxypropyl methylcellulose-based hydrogel copolymer-ic for controlled delivery of galantamine hydrobromide in Dementia. Processes 2020, 8, 1350. [Google Scholar] [CrossRef]
- Bashir, S.; Teo, Y.Y.; Ramesh, S.; Ramesh, K. Synthesis, characterization, properties of N-succinyl chitosan-g-poly (meth-acrylic acid) hydrogels and in vitro release of theophylline. Polymers 2016, 92, 36–49. [Google Scholar] [CrossRef]
- Abbasi, M.; Sohail, M.; Minhas, M.U.; Khan, S.; Hussain, Z.; Mahmood, A.; Shah, S.A.; Kousar, M. Novel biodegradable pH-sensitive hydrogels: An efficient controlled release system to manage ulcerative colitis. Int. J. Biol. Macromol. 2019, 136, 83–96. [Google Scholar] [CrossRef] [PubMed]
- Gangadharappa, H.; Prasad, S.M.C.; Singh, R.P. Formulation, in vitro and in vivo evaluation of celecoxib nano sponge hydrogels for topical application. J. Drug Deliv. 2017, 41, 488–501. [Google Scholar]
- Rehman, U.; Sarfraz, R.M.; Mahmood, A.; Zafar, N.; Ashraf, M.U. Chitosan/Agarose-g-poly (methacrylate) pH respon-sive polymeric blend: A dais for controlled delivery of Capecitabine. Polym. Adv. Technol. 2021, 32, 3782–3794. [Google Scholar] [CrossRef]
- Batool, N.; Mahmood, A.; Sarfraz, R.M.; Ijaz, H.; Zafar, N.; Hussain, Z. Formulation and evaluation of interpenetrating polymeric network for controlled drug delivery. Drug Dev. Ind. Pharm. 2021, 47, 931–946. [Google Scholar] [CrossRef]
- Suhail, M.; Khan, A.; Rosenholm, J.M.; Minhas, M.U.; Wu, P.C. Fabrication and characterization of diclofenac sodium loaded hydrogels of sodium alginate as sustained release carrier. Gels 2021, 7, 10. [Google Scholar] [CrossRef]
- Bozoğlan, B.K.; Duman, O.; Tunç, S. Preparation and characterization of thermosensitive chi-tosan/carboxymethylcellulose/scleroglucan nanocomposite hydrogels. Int. J. Biol. Macromol. 2020, 162, 781–797. [Google Scholar] [CrossRef]
- Tayyab, A.; Mahmood, A.; Ijaz, H.; Sarfraz, R.M.; Zafar, N.; Danish, Z. Formulation and optimization of captopril-loaded microspheres based compressed tablets: In vitro evaluation. Int. J. Polym. Mater. Polym. BiomMat. 2022, 71, 233–245. [Google Scholar] [CrossRef]
- Topuz, F.; Nadernezhad, A.; Caliskan, O.S.; Menceloglu, Y.Z.; Koc, B. Nanosilicate embedded agarose hydrogels with improved bioactivity. Carbohydr. Polym. 2018, 201, 105–112. [Google Scholar] [CrossRef]
- Ahmad, U.; Sohail, M.; Ahmad, M.; Minhas, M.U.; Khan, S.; Hussain, Z.; Kousar, M.; Mohsin, S.; Abbasi, M.; Shah, S.A. Chitosan based thermosensitive injectable hydrogels for controlled delivery of loxoprofen: Development, characterization and in-vivo evaluation. Int. J. Biol. Macromol. 2019, 129, 233–245. [Google Scholar] [CrossRef]
- Li, S.; Qin, T.; Chen, T.; Wang, J.; Zeng, Q. Poly (vinyl alcohol)/poly (hydroxypropyl methacrylate-co-methacrylic acid) as pH-sensitive semi-IPN hydrogels for oral insulin delivery: Preparation and characterization. Iran. Polym. J. 2021, 30, 343–353. [Google Scholar] [CrossRef]
- Hussain, A.; Khalid, S.; Qadir, M.; Massud, A.; Ali, M.; Khan, I.; Saleem, M.; Iqbal, M.; Asghar, S.; Gul, H. Water up-take and drug release behaviour of methyl methacrylate-co-itaconic acid [P (MMA/IA)] hydrogels cross-linked with methylene bisacrylamide. J. Drug Deliv. Sci. Technol. 2011, 21, 249. [Google Scholar] [CrossRef]
- Mahmood, A.; Ahmad, M.; Sarfraz, R.M.; Minhas, M.U. Development of acyclovir loaded β-cyclodextrin-g-poly methacrylic acid hydrogel microparticles: An in vitro characterization. Adv. Polym. 2018, 37, 697–705. [Google Scholar] [CrossRef]
- Minhas, M.U.; Ahmad, M.; Khan, S.; Ali, L.; Sohail, M. Synthesis and characterization of β-cyclodextrin hydrogels: Crosslinked polymeric network for targeted delivery of 5-fluorouracil. Drug Deliv. 2016, 9, 233–242. [Google Scholar]
- Sarfraz, R.M.; Ahmad, M.; Mahmood, A.; Akram, M.R.; Abrar, A. Development of β-cyclodextrin-based hydrogel mi-croparticles for solubility enhancement of rosuvastatin: An in vitro and in vivo evaluation. Drug Des. Dev. Ther. 2017, 11, 3083. [Google Scholar] [CrossRef] [Green Version]
- Qureshi, S.; Zaman, M.; Mahmood, A.; Shah, S.; Amjad, M.W.; Shaheryar, Z.A.; Sarfraz, R.M.; Khan, S.M.; Raja, M.A.G. Development and optimization of flurbiprofen loaded microsponges: An in vitro evaluation. Pak. J. Pharm. Sci. 2019, 32, 1773–1779. [Google Scholar]
- Sarfraz, R.M.; Khan, M.U.; Mahmood, A.; Akram, M.R.; Minhas, M.U.; Qaisar, M.N.; Ali, M.R.; Ahmad, H.; Zaman, M. Synthesis of co-polymeric network of carbopol-g-methacrylic acid nanogels drug carrier system for gastro-protective delivery of ketoprofen and its evaluation. Polym. Plast. Technol. Mater. 2020, 59, 1109–1123. [Google Scholar] [CrossRef]
- Mahmood, A.; Ahmad, M.; Sarfraz, R.M.; Minhas, M.U.; Yaqoob, A. Development and in vitro evaluation of acyclovir rapid dissolving tablets: A solubility and bioavailability enhancement study. Lat. Am. J. Pharm. 2015, 34, 1701–1709. [Google Scholar]
- Akhtar, M.S.; Khan, Z.; Mushtaq, M.N.; Akhtar, M.S. Comparative Evaluation of Analgesic, Anti-inflammatory and Antipyretic Effects of Synthetic Derivatives of Organoantimony Ferocenyl Benzoate with Piroxicam. Bangladesh Pharm. J. 2016, 19, 15–24. [Google Scholar] [CrossRef] [Green Version]
- Maheen, S.; Malik, M.N.H.; Ahmad, T.; Latif, F.; Tabassum, N.; Khan, A.Q.; Ahsan, H.; Khan, W.; Javed, I.; Ali, H. Evaluation of anti-inflammatory, analgesic and antipyretic activities of Thymus serphyllum Linn. in mice. Acta Pol. Pharm. 2015, 72, 113. [Google Scholar]
- Shabir, F.; Mahmood, A.; Zafar, N.; Zaman, M.; Sarfraz, R.M.; Ijaz, H. Novel Black Seed Polysaccharide Extract-g-Poly (Acrylate) pH-Responsive Hydrogel Nanocomposites for Safe Oral Insulin Delivery: Development, In Vitro, In Vivo and Toxicological Evaluation. Pharmaceutics 2023, 15, 62. [Google Scholar] [CrossRef]


| Material Type | Elements | % Weight | % Atomic |
|---|---|---|---|
| Tofacitinib | C N O | 41.25% 33.72% 25.03% | 45.38% 30.23% 24.19% |
| Unloaded formulation | C O | 59.42% 39.15% | 70.72% 28.10% |
| Tofacitinib loaded formulation | O C N | 39.24% 34.63% 12.42% | 41.02% 30.71% 11.62% |
| Kinetic Models | Parameters | MCT1–MCT12 (Mean) |
|---|---|---|
| Zero-order | R2 | 0.998 |
| T25 | 7.729 | |
| T50 | 15.458 | |
| T75 | 23.186 | |
| First-order | R2 | 0.959 |
| T25 | 6.262 | |
| T50 | 15.089 | |
| T75 | 30.178 | |
| Higuchi | R2 | 0.948 |
| T25 | 4.345 | |
| T50 | 17.380 | |
| T75 | 39.105 | |
| Korsemeyer–Peppas | R2 | 0.999 |
| n | 0.993 |
| Group (Treatment/Dose) | Inflammation | |||
|---|---|---|---|---|
| 0 h | 1 h | 2 h | 3 h | |
| Group I (control) | 2.07 ± 0.03 | 2.11 ± 0.05 | 2.16 ± 0.04 | 2.21 ± 0.03 # |
| Group II (5 mg/kg drug solution) | 1.86 ± 0.03 | 1.85 ± 0.04 * | 1.81 ± 0.05 ** | 1.71 ± 0.06 *** |
| Group III (10 mg/kg drug solution) | 2.25 ± 0.03 | 1.81 ± 0.06 ** | 1.70 ± 0.07 ** | 1.49 ± 0.07 *** |
| Group IV (15 mg/kg microparticles) | 1.98 ± 0.04 | 1.95 ± 0.04 * | 1.83 ± 0.03 * | 1.80 ± 0.03 ** |
| Group V (30 mg/kg microparticles) | 1.96 ± 0.06 | 1.84 ± 0.04 * | 1.71 ± 0.06 ** | 1.49 ± 0.06 *** |
| Group VI (17 mg/kg microparticles) | 1.95 ± 0.09 | 1.93 ± 0.05 ns | 1.89 ± 0.07 * | 1.83 ±0.07 * |
| Group VII (34 mg/kg microparticles) | 1.86 ± 0.08 | 1.82 ± 0.07 * | 1.64 ± 0.07 * | 1.48 ± 0.05 ** |
| Group (Treatment/Dose) | Inhibition (%) | ||
|---|---|---|---|
| At 1 h | At 2 h | At 3 h | |
| Group II (5 mg/kg drug solution) | 12 % | 16% | 23% |
| Group III (10 mg/kg drug solution) | 14% | 21% | 33 % |
| Group IV (15 mg/kg microparticles) | 8% | 15% | 19% |
| Group V (30 mg/kg microparticles) | 13% | 21% | 32% |
| Group VI (17 mg/kg microparticles) | 9% | 13% | 17 % |
| Group VII (34 mg/kg microparticles) | 14% | 22% | 33% |
| Observation | Group I (Control) | Group II (Test) | |
|---|---|---|---|
| Sign of Illness | NIL | NIL | |
| Body weight(kg) | Pretreatment | 2.09 ± 2.1 | 2.15 ± 1.7 |
| Day 1 | 2.10 ± 2.0 | 2.17 ± 1.9 | |
| Day 7 | 2.12 ± 2.3 | 2.18 ± 2.2 | |
| Day 14 | 2.14 ± 2.4 | 2.21 ± 2.4 | |
| Water intake (mL) | Pretreatment | 177.35 ± 1.31 | 191.21 ± 0.06 |
| Day 1 | 191.65 ± 2.11 | 192.32 ± 1.51 | |
| Day 7 | 211.15 ± 2.15 | 193.21 ± 1.41 | |
| Day 14 | 216.52 ± 2.19 | 219.45 ± 2.22 | |
| Food intake (g) | Pretreatment | 76.13 ± 1.33 | 77.43 ± 1.15 |
| Day 1 | 77.33 ± 1.11 | 77.33 ± 1.17 | |
| Day 7 | 74.54 ± 1.27 | 76.55 ± 1.24 | |
| Day 14 | 77.33 ± 1.18 | 77.62 ± 1.11 | |
| Dermal toxicity | Nil | Nil | |
| Ocular toxicity | Nil | Nil | |
| Mortality | Nil | Nil | |
| Parameters | Group A (Control) | Group B (Treated) |
|---|---|---|
| Hb (10–15 g/dL) | 11.19 ± 0.33 | 12.14 ± 0.33 |
| pH | 6.33 ± 0.11 | 6.43 ± 0.13 |
| WBCs (×109/L) | 11.19 ± 0.33 | 11.41 ± 0.66 |
| RBCs (×106/mm3) | 5.13 ± 0.144 | 5.17 ± 0.24 |
| Platelets (×109/L) | 259 ± 2.01 | 262 ± 0.16 |
| Monocytes (%) | 3.43 ± 0.055 | 3.42 ± 0.032 |
| Neutrophils (%) | 24.13 ± 2.45 | 25.24 ± 0.22 |
| Lymphocytes (%) | 52.19 ± 1.02 | 57.12 ± 0.55 |
| MCV (%) | 68.55 ± 3.14 | 66.3 ± 0.22 |
| MCH (pg/cell) | 25.13 ± 2.19 | 24.56 ± 0.08 |
| MCHC (Hb/cell) | 29.65 ± 1.88 | 31.23 ± 0.15 |
| Biochemical Analysis | Group A (Control) | Group B (Treated) |
|---|---|---|
| ALT (IU/L) | 64.33 ± 4.62 | 68.50 ± 3.27 |
| AST (IU/L) | 72.42 ± 1.55 | 74.55 ± 1.65 |
| Creatinine (0.8–1.8 mg/dL) | 1.5 ± 0.19 | 1.65 ± 0.31 |
| Urea (mmol/L) | 60.30 ± 1.90 | 61.29 ± 1.21 |
| Uric acid (mg/dL) | 3.12 ± 0.14 | 2.65 ± 0.13 |
| Cholesterol (10–80 mg/dL) | 74 ± 1.33 | 76 ± 1.23 |
| Triglycerides (46–68 mg/dL) | 48 ± 1.55 | 50 ± 1.65 |
| Formulation Codes | Mucin (g) | Chitosan (g) | MAA (g) | MBA (g) | APS (g) |
|---|---|---|---|---|---|
| MCT1 | 0.1 | 0.1 | 5 | 0.2 | 0.1 |
| MCT2 | 0.2 | 0.1 | 5 | 0.2 | 0.1 |
| MCT3 | 0.3 | 0.1 | 5 | 0.2 | 0.1 |
| MCT4 | 0.2 | 0.2 | 5 | 0.2 | 0.1 |
| MCT5 | 0.2 | 0.3 | 5 | 0.2 | 0.1 |
| MCT6 | 0.2 | 0.4 | 5 | 0.2 | 0.1 |
| MCT7 | 0.2 | 0.2 | 8 | 0.2 | 0.1 |
| MCT8 | 0.2 | 0.2 | 11 | 0.2 | 0.1 |
| MCT9 | 0.2 | 0.2 | 14 | 0.2 | 0.1 |
| MCT10 | 0.2 | 0.2 | 10 | 0.3 | 0.1 |
| MCT11 | 0.2 | 0.2 | 10 | 0.5 | 0.1 |
| MCT12 | 0.2 | 0.2 | 10 | 0.7 | 0.1 |
Disclaimer/Publisher’s Note: The statements, opinions and data contained in all publications are solely those of the individual author(s) and contributor(s) and not of MDPI and/or the editor(s). MDPI and/or the editor(s) disclaim responsibility for any injury to people or property resulting from any ideas, methods, instructions or products referred to in the content. |
© 2023 by the authors. Licensee MDPI, Basel, Switzerland. This article is an open access article distributed under the terms and conditions of the Creative Commons Attribution (CC BY) license (https://creativecommons.org/licenses/by/4.0/).
Share and Cite
Malatani, R.T.; Bilal, S.; Mahmood, A.; Sarfraz, R.M.; Zafar, N.; Ijaz, H.; Rehman, U.; Akbar, S.; Alkhalidi, H.M.; Gad, H.A. Development of Tofacitinib Loaded pH-Responsive Chitosan/Mucin Based Hydrogel Microparticles: In-Vitro Characterization and Toxicological Screening. Gels 2023, 9, 187. https://doi.org/10.3390/gels9030187
Malatani RT, Bilal S, Mahmood A, Sarfraz RM, Zafar N, Ijaz H, Rehman U, Akbar S, Alkhalidi HM, Gad HA. Development of Tofacitinib Loaded pH-Responsive Chitosan/Mucin Based Hydrogel Microparticles: In-Vitro Characterization and Toxicological Screening. Gels. 2023; 9(3):187. https://doi.org/10.3390/gels9030187
Chicago/Turabian StyleMalatani, Rania T., Sana Bilal, Asif Mahmood, Rai Muhammad Sarfraz, Nadiah Zafar, Hira Ijaz, Umaira Rehman, Shehla Akbar, Hala M. Alkhalidi, and Heba A. Gad. 2023. "Development of Tofacitinib Loaded pH-Responsive Chitosan/Mucin Based Hydrogel Microparticles: In-Vitro Characterization and Toxicological Screening" Gels 9, no. 3: 187. https://doi.org/10.3390/gels9030187