Arterial Structural and Functional Characteristics at End of Early Childhood and Beginning of Adulthood: Impact of Body Size Gain during Early, Intermediate, Late and Global Growth

 , and
, and
Abstract
:1. Introduction
2. Materials and Methods
2.1. Study Population
2.2. Anthropometric Evaluation
2.3. Clinical Evaluation
2.4. Cardiovascular Evaluation
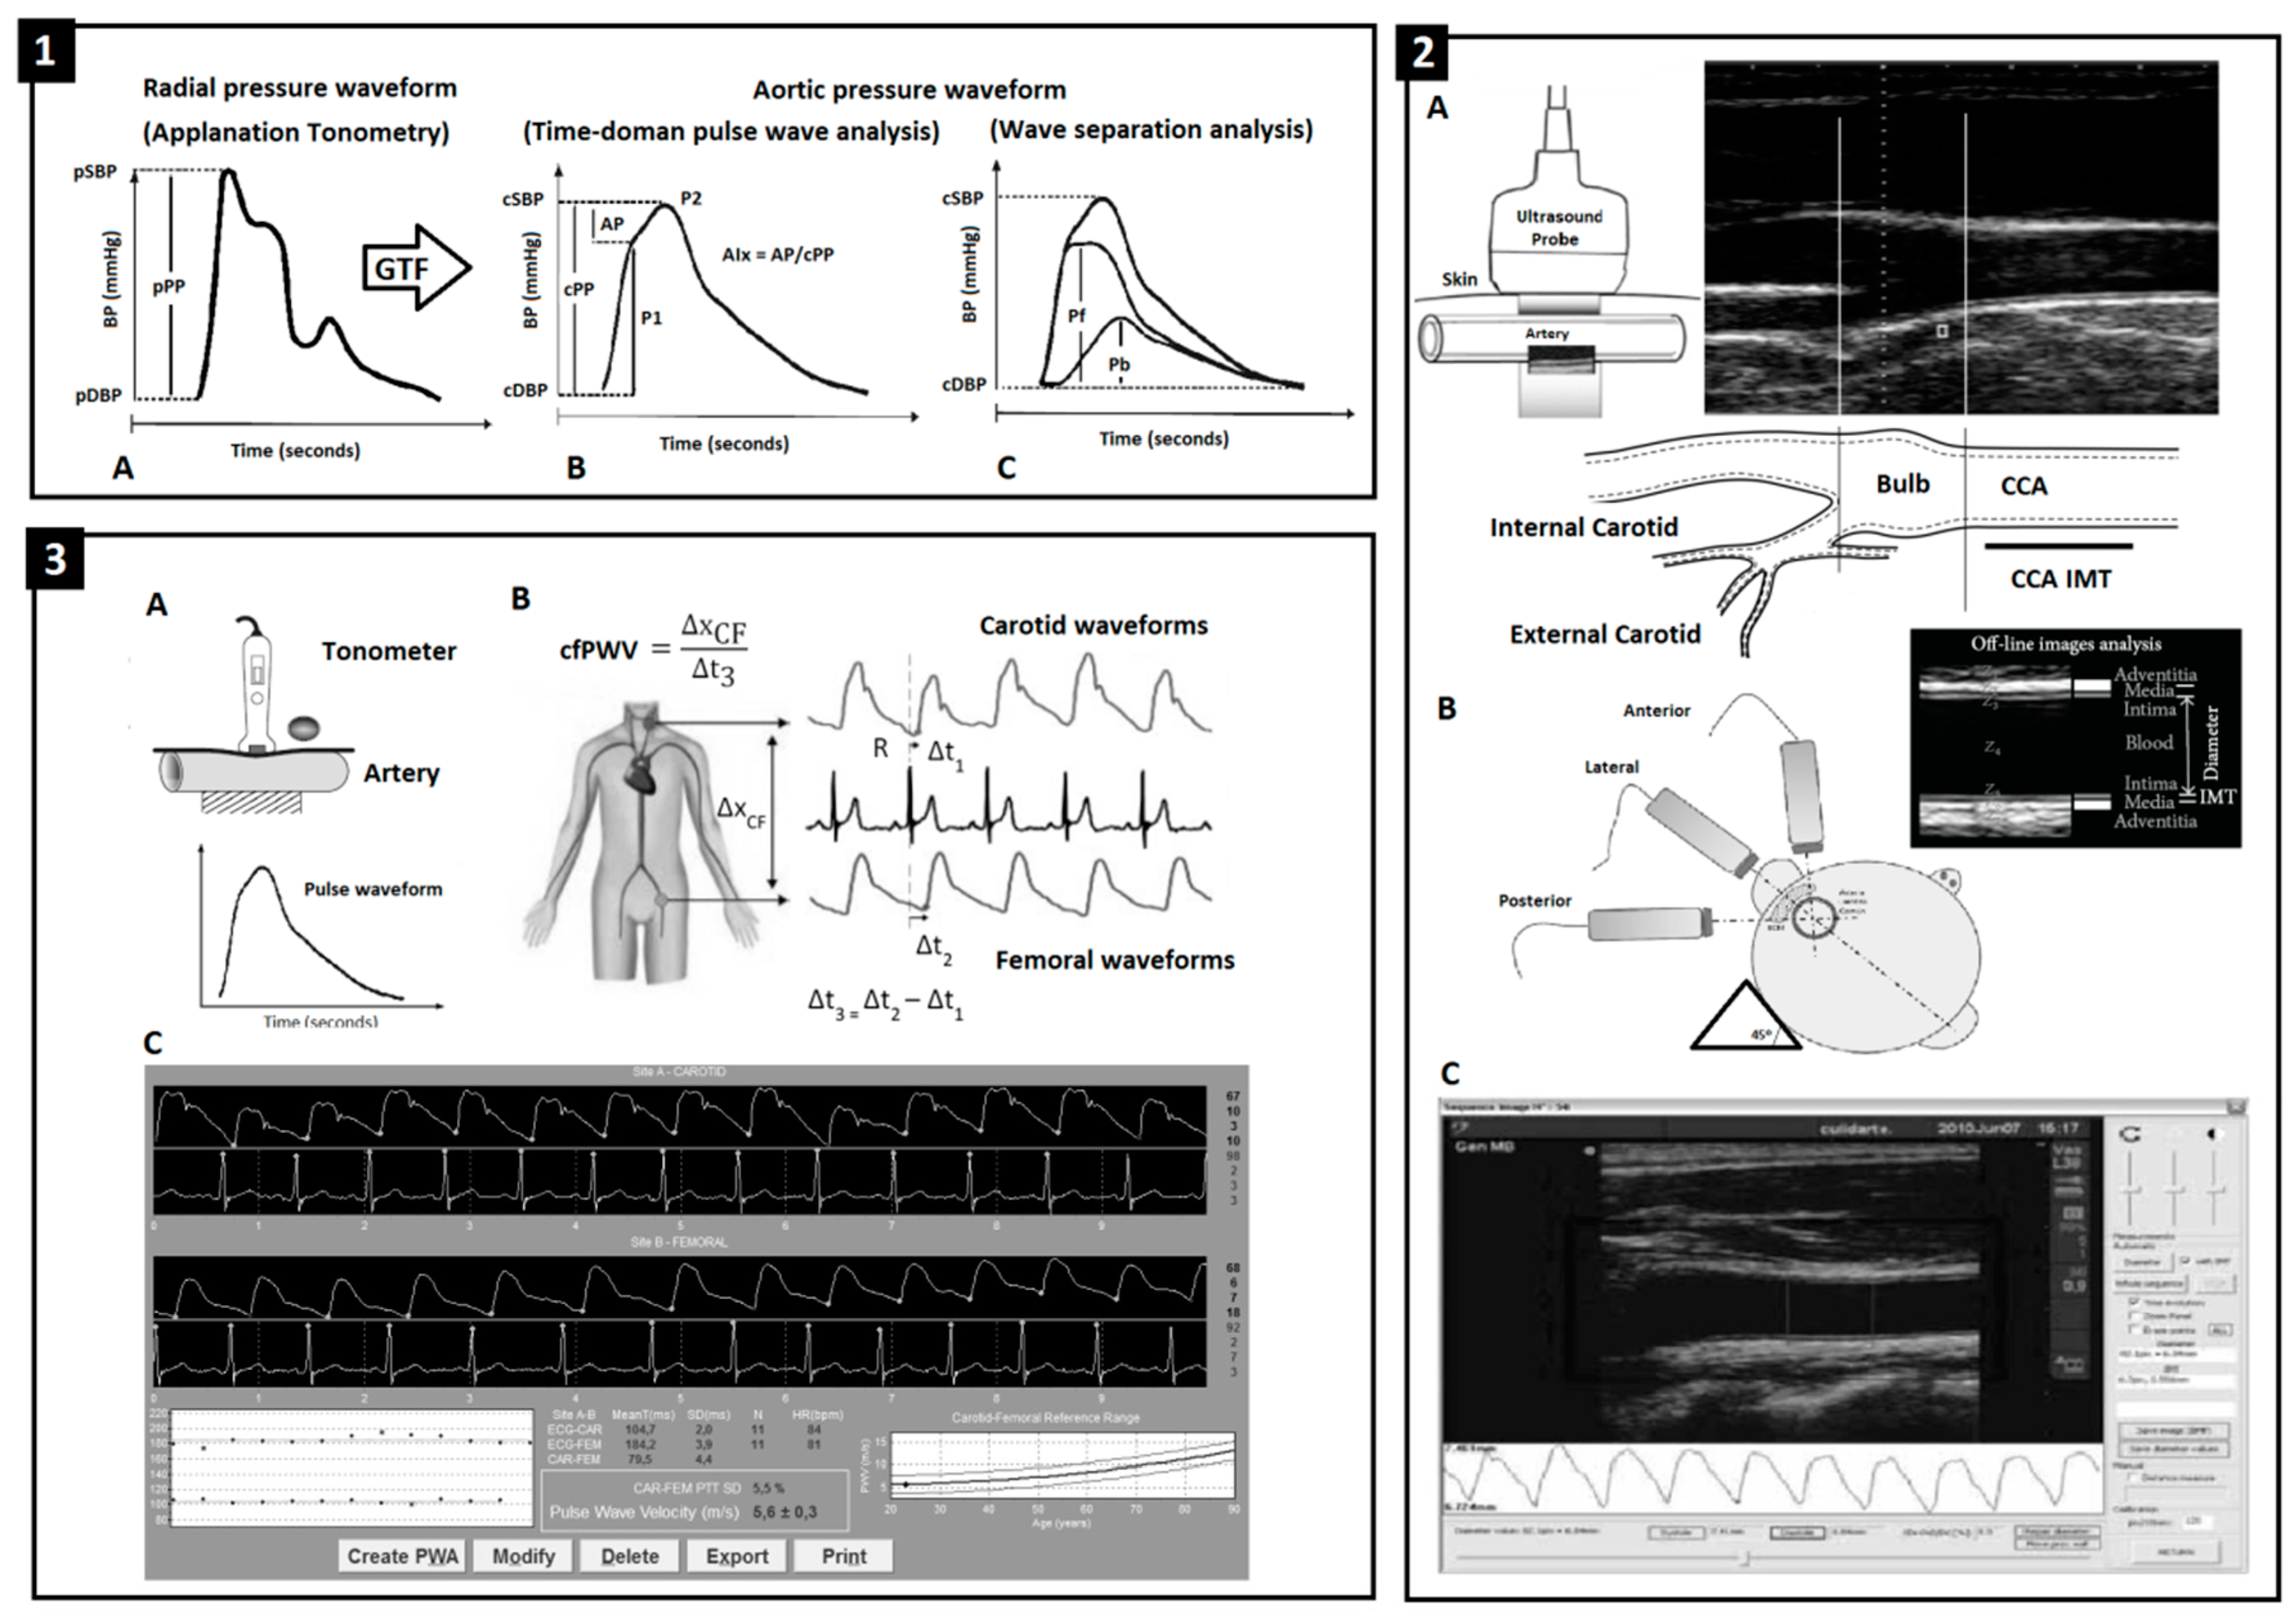
2.5. Peripheral and Central Pressure and Aortic Wave-Derived Parameters
2.6. Arterial Beat-to-Beat Diameter and Intima-Media Thickness (IMT)
2.7. Local and Regional Arterial Stiffness
2.8. Data Analysis and Statistics
3. Results
3.1. Arterial System at 6 and 18 y: Comparative Analysis of the Association between Birth or Current Body Size and Early, Intermediate, Late or Global Growth-Related Body Size Changes
3.2. Arterial Structure and Function at 6 y: Independent Association with ΔBWH z-Score 0–2 y
3.3. Arterial Structure and Function at 6 and 18 y: Independent Association with Δz-BMI(Body Mass Index) 0–6 y
3.4. Arterial Structure and Function at 18 y: Independent Association with Δz-BMI 0–18 y and 6–18 y
3.5. Hemodynamic and Arterial Properties at 6 and 18 y: Hierarchical Impact of Anthropometric Variables
3.6. Arterial Function at 6 and 18 y: Impact of Body Size Changes vs. Anthropometric and Cardiovascular Risk Factors (CRFs)
4. Discussion
- First, growth-related body size changes (0–2 and 0–6 y) were associated with interindividual variations (z-score) in CV properties at 6 y. Conversely, CV z-scores variables at 18 y were not associated with body size changes (0–6, 6–18 or 0–18 y) (Table 2 and Table 3). Thus, as the subject’s age increases, the association between CV properties and prior body size changes (i.e., during childhood) decreases (Table 4).
- Second, the strength of association between growth-related body changes and CV properties at 6 y was: (a) equal or greater than that observed for body size at birth and (b) lower than the obtained for current z-BMI (at 6 y). Most of the associations between ΔBWH z-score 0–2 y or Δz-BMI 0–6 y and the CV properties at 6 y were independent of the BWH z-score at birth (Table 5 and Table 6). Then, in 6 y children the “hierarchical order” among explanatory variables for CV variations would be: current z-BMI > ΔBWH z-score 0–2 y or Δz-BMI 0–6 y> BWH z-score at birth (Table 2). On the contrary, only current z-BMI showed significant association with CV properties at 18 y (Table 3). In summary, while current z-BMI showed the strongest association, body size at birth showed almost no association with CV properties, regardless of subjects’ age at the time of the CV study (Table 2 and Table 3).
- Third, in general terms, current z-BMI was the anthropometric parameter with the greatest explanatory capacity for CV variations observed at 6 y. Though, variations in some CV parameters were mainly explained by growth-related body changes and/or by their interaction with current z-BMI (Tables S4 and S6). Similar results were observed when the associations were analyzed considering the exposure to CRFs (e.g., hypertension, dyslipidemia) (Table 9). In turn, current z-BMI was the anthropometric variable with the greatest explanatory capacity for CV conditions and variations at 18 y.In summary, body size changes during childhood and/or adolescence contributed to explain arterial variations through the interaction with current z-BMI or BWH z-score at birth (Tables S8, S10 and S12). Among factors associated with CV risk, z-BMI and/or z-pSBP were the main explanatory variables for CV z-scores (Table 10).
5. Strengths and Limitations
6. Conclusions
Supplementary Materials
Author Contributions
Funding
Acknowledgments
Conflicts of Interest
Abbreviations
| AIx | central (aortic) augmentation index |
| AIx@75 | AIx adjusted to a 75 beats/min heart rate |
| AP | central (aortic) augmented pressure |
| BH | body height |
| BMI | body mass index |
| BW | body weight |
| BWH | body weight for body height |
| cBP | central (aortic) blood pressure |
| CCA | common carotid artery |
| CFA | common femoral artery |
| cfPWV | carotid-femoral pulse wave velocity |
| CRFs | cardiovascular risk factors |
| CV | cardiovascular |
| CVD | cardiovascular disease |
| DD | diastolic arterial diameter |
| EM | pressure-strain arterial elastic modulus |
| HBP | high blood pressure levels |
| HR | heart rate |
| IMT | intima-media thickness |
| LBW | low birth weight |
| MLR | multiple linear regression models |
| mos. | Months |
| MV | mean value |
| Pb | amplitude of the cBP backward component |
| pBP | peripheral (brachial) blood pressure |
| pDBP | peripheral (brachial) diastolic blood pressure |
| Pf | amplitude of the cBP forward component |
| pMBP | peripheral (brachial) mean blood pressure |
| pPP | peripheral (brachial) pulse pressure |
| pSBP | peripheral (brachial) systolic blood pressure |
| PWA | pulse wave analysis |
| SD | systolic arterial diameter |
| STD | standard deviation |
| VIF | variance inflation factor |
| y | years old |
| z | z-score |
References
- Ayer, J.G.; Harmer, J.A.; Nakhla, S.; Xuan, W.; Ng, M.K.; Raitakari, O.T.; Marks, G.B.; Celermajer, D.S. HDL-cholesterol, blood pressure, and asymmetric dimethylarginine are significantly associated with arterial wall thickness in children. Arterioscler. Thromb. Vasc. Biol. 2009, 29, 943–949. [Google Scholar] [CrossRef] [PubMed]
- Umer, A.; Kelley, G.A.; Cottrell, L.E.; Giacobbi, P., Jr.; Innes, K.E.; Lilly, C.L. Childhood obesity and adult cardiovascular disease risk factors: A systematic review with meta-analysis. BMC Public Health 2017, 17, 683. [Google Scholar] [CrossRef] [PubMed]
- Weihrauch-Blüher, S.; Schwarz, P.; Klusmann, J.H. Childhood obesity: Increased risk for cardiometabolic disease and cancer in adulthood. Metabolism 2019, 92, 147–152. [Google Scholar] [CrossRef] [PubMed]
- Huxley, R.; Neil, A.; Collins, R. Unravelling the fetal origins hypothesis: Is there really an inverse association between birthweight and subsequent blood pressure? Lancet 2002, 360, 659–665. [Google Scholar] [CrossRef]
- Leunissen, R.W.; Kerkhof, G.F.; Stijnen, T.; Hokken-Koelega, A. Timing and tempo of first-year rapid growth in relation to cardiovascular and metabolic risk profile in early adulthood. JAMA 2009, 301, 2234–2242. [Google Scholar] [CrossRef] [PubMed]
- Lule, S.A.; Elliott, A.M.; Smeeth, L.; Webb, E.L. Is birth weight associated with blood pressure among African children and adolescents? A systematic review. J. Dev. Orig. Health Dis. 2018, 9, 270–280. [Google Scholar] [CrossRef] [PubMed] [Green Version]
- da Silva Linhares, R.; Gigante, D.P.; de Barros, F.C.; Horta, B.L. Carotid intima-media thickness at age 30, birth weight, accelerated growth during infancy and breastfeeding: A birth cohort study in Southern Brazil. PLoS ONE 2015, 10, e0115166. [Google Scholar]
- Adair, L.S.; Fall, C.H.D.; Osmond, C.; Stein, A.D.; Martorell, R.; Ramirez-Zea, M.; Sachdev, H.S.; Dahly, D.L.; Bas, I.; Norris, S.A.; et al. Associations of linear growth and relative weight gain during early life with adult health and human capital in countries of low and middle income: Findings from five birth cohort studies. Lancet 2013, 382, 525–534. [Google Scholar] [CrossRef]
- Ong, K.K.; Ahmed, M.L.; Emmett, P.M.; Preece, M.A.; Dunger, D.B. Association between postnatal catch-up growth and obesity in childhood: Prospective cohort study. BMJ 2000, 320, 967–971. [Google Scholar] [CrossRef]
- Jansen, M.A.C.; Uiterwaal, C.S.P.M.; van der Ent, C.K.; Grobbee, D.E.; Dalmeijer, G.W. Excess early postnatal weight gain and blood pressure in healthy young children. J. Dev. Orig. Health Dis. 2019, 30, 1–7. [Google Scholar] [CrossRef]
- Law, C.M.; de Swiet, M.; Osmond, C.; Fayers, P.M.; Barker, D.J.; Cruddas, A.M.; Fall, C.H. Initiation of hypertension in utero and its amplification throughout life. BMJ 1993, 306, 24–27. [Google Scholar] [CrossRef] [PubMed]
- Marinkovic, T.; Toemen, L.; Kruithof, C.J.; Reiss, I.; van Osch-Gevers, L.; Hofman, A.; Franco, O.H.; Jaddoe, V.W.V. Early infant growth velocity patterns and cardiovascular and metabolic outcomes in childhood. J. Pediatr. 2017, 186, 57–63. [Google Scholar] [CrossRef] [PubMed]
- Garcia-Espinosa, V.; Bia, D.; Castro, J.; Zinoveev, A.; Marin, M.; Giachetto, G.; Chiesa, P.; Zócalo, Y. Peripheral and central aortic pressure, wave-derived reflection parameters, local and regional arterial stiffness and structural parameters in children and adolescents: Impact of body mass index variations. High Blood Press. Cardiovasc. Prev. 2018, 25, 267–280. [Google Scholar] [CrossRef] [PubMed]
- Zócalo, Y.; Ungerfeld, R.; Pérez-Clariget, R.; Bia, D. Maternal nutritional restriction during gestation impacts differently on offspring muscular and elastic arteries and is associated with increased carotid resistance and ventricular afterload in maturity. J. Dev. Orig. Health Dis. 2019, 1–11. [Google Scholar] [CrossRef] [PubMed]
- Zócalo, Y.; Curcio, S.; García-Espinosa, V.; Chiesa, P.; Giachetto, G.; Bia, D. Comparative analysis of arterial parameters variations associated with inter-individual variations in peripheral and aortic blood pressure: Cross-sectional study in healthy subjects aged 2-84 years. High Blood Press. Cardiovasc. Prev. 2017, 24, 437–451. [Google Scholar] [CrossRef] [PubMed]
- Zócalo, Y.; Castro, J.M.; Garcia-Espinosa, V.; Curcio, S.; Chiesa, P.; Giachetto, G.; Cabrera-Fischer, E.I.; Bia, D. Forward and backward aortic components and reflection indexes in children and adolescents: Determinants and role in high pressure states. Curr. Hypertens. Rev. 2018, 14, 137–153. [Google Scholar] [CrossRef] [PubMed]
- Amarante, V.; Arim, R.; Severi, C.; Vigorito, A.; Aldabe, I.; de Melo, G.; Rodríguez, A.; Salas, G. El Estadonutricional de los Niños/as y las Políticasalimentarías; Programa Naciones Unidas para e Desarrollo (PNUD)-UNICEF: Montevideo, Uruguay, 2007. [Google Scholar]
- Lurbe, E.; Agabiti-Rosei, E.; Cruickshank, J.K.; Dominiczak, A.; Erdine, S.; Hirth, A.; Invitti, C.; Litwin, M.; Mancia, G.; Pall, D.; et al. 2016 European Society of Hypertension guidelines for the management of high blood pressure in children and adolescents. J. Hypertens. 2016, 34, 1887–1920. [Google Scholar] [CrossRef] [PubMed] [Green Version]
- García-Espinosa, V.; Curcio, S.; Marotta, M.; Castro, J.M.; Arana, M.; Peluso, G.; Chiesa, P.; Giachetto, G.; Bia, D.; Zócalo, Y. Changes in central aortic pressure levels, wave components and determinants associated with high peripheral blood pressure states in childhood: Analysis of hypertensive phenotype. Pediatr. Cardiol. 2016, 37, 1340–1350. [Google Scholar] [CrossRef] [PubMed]
- Diedenhofen, B.; Musch, J. Cocor: A comprehensive solution for the statistical comparison of correlations. PLoS ONE 2015, 10, e0121945. [Google Scholar] [CrossRef] [PubMed]
- Evelein, A.M.; Visseren, F.L.; van der Ent, C.K.; Grobbee, D.E.; Uiterwaal, C.S. Excess early postnatal weight gain leads to thicker and stiffer arteries in young children. J. Clin. Endocrinol. Metab. 2013, 98, 794–801. [Google Scholar] [CrossRef] [PubMed]
- Belfort, M.B.; Rifas-Shiman, S.L.; Rich-Edwards, J.; Kleinman, K.P.; Gillman, M.W. Size at birth, infant growth, and blood pressure at three years of age. J. Pediatr. 2007, 151, 670–674. [Google Scholar] [CrossRef] [PubMed]
- Ben-Shlomo, Y.; McCarthy, A.; Hughes, R.; Tilling, K.; Davies, D.; Smith, G.D. Immediate postnatal growth is associated with blood pressure in young adulthood: The Barry Caerphilly Growth Study. Hypertension 2008, 52, 638–644. [Google Scholar] [CrossRef] [PubMed]
- Adair, L.S.; Martorell, R.; Stein, A.D.; Hallal, P.C.; Sachdev, H.S.; Prabhakaran, D.; Wills, A.K.; Norris, S.A.; Dahly, D.L.; Lee, N.R.; et al. Size at birth, weight gain in infancy and childhood, and adult blood pressure in 5 low- and middle-income-country cohorts: When does weight gain matter? Am. J. Clin. Nutr. 2009, 89, 1383–1392. [Google Scholar] [CrossRef] [PubMed]
- Jones, A.; Charakida, M.; Falaschetti, E.; Hingorani, A.D.; Finer, N.; Masi, S.; Donald, A.E.; Lawlor, D.A.; Smith, G.D.; Deanfield, J.E. Adipose height growth through childhood blood pressure status in a large prospective cohort, s.t.u.d.y. Hypertension 2012, 59, 919–925. [Google Scholar] [CrossRef] [PubMed]
- Tilling, K.; Davies, N.; Windmeijer, F.; Kramer, M.S.; Bogdanovich, N.; Matush, L.; Patel, R.; Smith, G.D.; Ben-Shlomo, Y.; Martin, R.M. Is infant weight associated with childhood blood pressure? Analysis of the promotion of breastfeeding intervention trial (probit) cohort. Int. J. Epidemiol. 2011, 40, 1227–1237. [Google Scholar] [CrossRef] [PubMed]
- Skilton, M.R.; Marks, G.B.; Ayer, J.G.; Garden, F.L.; Garnett, S.P.; Harmer, J.A.; Leeder, S.R.; Toelle, B.G.; Webb, K.; Baur, L.A.; et al. Weight gain in infancy and vascular risk factors in later childhood. Pediatrics 2013, 131, 1821–1828. [Google Scholar] [CrossRef] [PubMed]
- Vianna, C.A.; Horta, B.L.; Gigante, D.P.; de Barros, F.C. Pulse wave velocity at early adulthood: Breastfeeding and nutrition during pregnancy and childhood. PLoS ONE 2016, 11, e0152501. [Google Scholar] [CrossRef] [PubMed]
- Pais, C.; Correia-Costa, L.; Moura, C.; Mota, C.; Severo, M.; Guerra, A.; Areias, J.C.; Schaefer, F.; CaldasAfonso, A.; Barros, H.; et al. Accelerated growth during childhood is associated with increased arterial stiffness in prepubertal children. Int. J. Cardiol. 2016, 204, 83–85. [Google Scholar] [CrossRef]
- Huxley, R.R.; Shiell, A.W.; Law, C.M. The role of size at birth and postnatal catch-up growth in determining systolic blood pressure: A systematic review of the literature. J. Hypertens. 2000, 18, 815–831. [Google Scholar] [CrossRef]
- Law, C.M.; Shiell, A.W. Is blood pressure inversely related to birth weight? The strength of evidence from a systematic review of the literature. J. Hypertens. 1996, 14, 935–941. [Google Scholar] [CrossRef]
- Kelishadi, R.; Haghdoost, A.A.; Jamshidi, F.; Aliramezany, M.; Moosazadeh, M. Low birthweight or rapid catch-up growth: Which is more associated with cardiovascular disease and its risk factors in later life? A systematic review and cryptanalysis. Paediatr. Int. Child Health 2015, 35, 110–123. [Google Scholar] [CrossRef] [PubMed]
- Martyn, C.N.; Greenwald, S.E. Impaired synthesis of elastin in walls of aorta and large conduit arteries during early development as an initiating event in pathogenesis of systemic hypertension. Lancet 1997, 350, 953–955. [Google Scholar] [CrossRef]
- Uiterwaal, C.S.; Anthony, S.; Launer, L.J.; Witteman, J.C.; Trouwborst, A.M.; Hofman, A.; Grobbee, D.E. Birth weight, growth, and blood pressure: An annual follow-up study of children aged 5 through 21 years. Hypertension 1997, 30, 267–271. [Google Scholar] [CrossRef] [PubMed]
- Adair, L.S.; Cole, T.J. Rapid child growth raises blood pressure in adolescent boys who were thin at birth. Hypertension 2003, 41, 451–456. [Google Scholar] [CrossRef] [PubMed]
- Nishina, M.; Kikuchi, T.; Yamazaki, H.; Kameda, K.; Hiura, M.; Uchiyama, M. Relationship among systolic blood pressure, serum insulin and leptin, and visceral fat accumulation in obese children. Hypertens. Res. 2003, 26, 281–288. [Google Scholar] [CrossRef] [PubMed]
- Leunissen, R.W.; Kerkhof, G.F.; Stijnen, T.; Hokken-Koelega, A.C. Effect of birth size and catch-up growth on adult blood pressure and carotid intima-media thickness. Horm. Res. Paediatr. 2012, 77, 394–401. [Google Scholar] [CrossRef] [PubMed]
- Chen, X.; Wang, Y. Tracking of blood pressure from childhood to adulthood: A systematic review and meta-regression analysis. Circulation 2008, 117, 3171–3180. [Google Scholar] [CrossRef] [PubMed]
- Thiering, E.; Bruske, I.; Kratzsch, J.; Hoffmann, B.; Herbarth, O.; von Berg, A.; Schaaf, B.; Wichmann, H.E.; Heinrich, J.; LISAplus Study Group. Peak growth velocity in infancy is positively associated with blood pressure in school-aged children. J. Hypertens. 2012, 30, 1114–1121. [Google Scholar] [CrossRef]
- Hof, M.H.; Vrijkotte, T.G.; de Hoog, M.L.; van Eijsden, M.; Zwinderman, A.H. Association between infancy BMI peak and body composition and blood pressure at age 5–6 years. PLoS ONE 2013, 8, e80517. [Google Scholar] [CrossRef]
- Peluso, G.; García-Espinosa, V.; Curcio, S.; Marota, M.; Castro, J.; Chiesa, P.; Giachetto, G.; Bia, D.; Zócalo, Y. High central aortic rather than brachial blood pressure is associated with carotid wall remodeling and increased arterial stiffness in childhood. High Blood Press. Cardiovasc. Prev. 2017, 24, 49–60. [Google Scholar] [CrossRef]
- Skilton, M.R.; Sullivan, T.R.; Ayer, J.G.; Garden, F.L.; Harmer, J.A.; Leeder, S.R.; Toelle, B.G.; Webb, K.; Marks, G.B.; Celermajer, D.S. Weight gain in infancy is associated with carotid extra-medial thickness in later childhood. Atherosclerosis 2014, 233, 370–374. [Google Scholar] [CrossRef] [PubMed]
- McCloskey, K.; Burgner, D.; Carlin, J.B.; Skilton, M.R.; Cheung, M.; Dwyer, T.; Vuillermin, P.; Ponsonby, A.L.; BIS Investigator Group. Infant adiposity at birth and early postnatal weight gain predict increased aortic intima-media thickness at 6 weeks of age: A population-derived cohort study. Clin. Sci. (Lond.) 2016, 130, 443–450. [Google Scholar] [CrossRef] [PubMed]

| Children Cohort (n = 632) | Adolescent Cohort (n = 340) | |||||||||||
|---|---|---|---|---|---|---|---|---|---|---|---|---|
| MV | STD | Min. | p25th | p75th | Max. | MV | STD | Min. | p25th | p75th | Max. | |
| Demographic, anthropometric and cardiovascular risk factors | ||||||||||||
| Age (years) | 6.02 | 0.3 | 5.07 | 5.80 | 6.26 | 6.66 | 18.2 | 0.50 | 17.0 | 17.8 | 18.5 | 20.7 |
| Subjects (n, %female) | 632 (49.5) | 340 (53.2) | ||||||||||
| Body weight (kg) | 22.31 | 4.67 | 14.00 | 19.20 | 24.35 | 46.50 | 64.4 | 14.2 | 40.2 | 55.0 | 70.0 | 120.0 |
| Body height (m) | 1.14 | 0.05 | 0.99 | 1.10 | 1.17 | 1.33 | 1.66 | 0.09 | 1.32 | 1.60 | 1.73 | 1.94 |
| BMI (Kg/m2) | 17.03 | 2.48 | 12.10 | 15.37 | 18.06 | 27.15 | 23.17 | 4.47 | 15.1 | 20.2 | 24.7 | 48.2 |
| z-BMI (STD) | 0.96 | 1.47 | −2.60 | 0.06 | 1.62 | 7.37 | 0.36 | 1.16 | -3.4 | −0.4 | 1.0 | 4.8 |
| z-BW for age (STD) | 0.45 | 1.30 | −2.39 | −0.45 | 1.18 | 6.15 | - | - | - | - | - | - |
| z-BH for age (STD) | −0.33 | 1.04 | −3.43 | −1.05 | 0.29 | 3.55 | −0.41 | 0.88 | −4.73 | -0.90 | 0.13 | 2.39 |
| Obesity (n, %) | 108 (17.1) | 26 (7.4) | ||||||||||
| Dyslipidemia (n, %) | 1 (0.2) | 18 (5.3) | ||||||||||
| Diabetes (n, %) | 1 (0.2) | 0 (0.0) | ||||||||||
| Hypertension (n, %) | 27 (4.3) | 18 (5.3) | ||||||||||
| CV Family background (n, %) | 0 (0.0) | 13 (3.9) | ||||||||||
| Current Smoke (n, %) | 0 (0.0) | 35 (10.4) | ||||||||||
| Anthropometric z-scores | ||||||||||||
| z-BW for age at birth (STD) | 0.02 | 0.95 | −5.24 | −0.56 | 0.68 | 2.95 | −0.18 | 1.24 | -5.19 | −0.89 | 0.57 | 2.87 |
| z-BH for age at birth (STD) | −0.27 | 1.13 | −4.91 | −1.00 | 0.46 | 4.75 | −0.35 | 1.52 | -5.75 | −1.15 | 0.46 | 4.82 |
| z-BMI for age at birth (STD) | 0.27 | 1.06 | −3.59 | −0.38 | 0.93 | 3.65 | −0.01 | 1.72 | −6.31 | −1.00 | 0.96 | 5.56 |
| z-BW for height 24 m. (STD) | 0.59 | 1.26 | −3.86 | −0.20 | 1.29 | 4.76 | - | - | - | - | - | - |
| z-BW for age 24 m. (STD) | 0.38 | 1.14 | −2.83 | −0.44 | 1.08 | 4.54 | - | - | - | - | - | - |
| z-BH for age 24 m. (STD) | −0.15 | 1.11 | −4.12 | −0.92 | 0.60 | 3.30 | - | - | - | - | - | - |
| z-BMI for age 24 m. (STD) | 0.66 | 1.29 | −4.07 | −0.15 | 1.40 | 5.42 | - | - | - | - | - | - |
| 1st Wave: anthropometry | ||||||||||||
| Age (years) | - | - | - | - | - | - | 6.7 | 0.5 | 5.42 | 6.32 | 6.92 | 8.98 |
| z-BW for age (STD) | - | - | - | - | - | - | 0.39 | 1.01 | −1.93 | −0.27 | 1.06 | 3.56 |
| z-BH for age (STD) | - | - | - | - | - | - | −0.13 | 0.93 | −3.19 | −0.72 | 0.53 | 2.10 |
| z-BMI for age (STD) | - | - | - | - | - | - | 0.65 | 0.99 | −1.81 | −0.08 | 1.27 | 4.63 |
| 2nd Wave: anthropometry | ||||||||||||
| Age (years) | - | - | - | - | - | - | 8.1 | 0.4 | 6.82 | 7.77 | 8.38 | 10.27 |
| z-BW for age (STD) | - | - | - | - | - | - | 0.44 | 1.14 | −2.40 | –0.36 | 1.24 | 4.05 |
| z-BH for age (STD) | - | - | - | - | - | - | −0.10 | 0.98 | −4.53 | –0.69 | 0.51 | 2.07 |
| z-BMI for age (STD) | - | - | - | - | - | - | 0.66 | 1.16 | −3.12 | −0.17 | 1.36 | 4.99 |
| 3rd Wave: anthropometry | ||||||||||||
| Age (years) | - | - | - | - | - | - | 12.2 | 0.5 | 10.74 | 11.83 | 12.46 | 14.80 |
| z-BW for age (STD) | - | - | - | - | - | - | - | - | - | - | - | - |
| z-BH for age (STD) | - | - | - | - | - | - | –0.03 | 1.12 | –3.46 | –0.87 | 0.71 | 2.98 |
| z-BMI for age (STD) | - | - | - | - | - | - | 0.47 | 1.14 | –3.17 | –0.37 | 1.23 | 3.12 |
| Aortic and peripheral blood pressure, hemodynamic and wave reflection parameters | ||||||||||||
| Heart rate (beats/min) | 91 | 11 | 66 | 84 | 99 | 134 | 69 | 12 | 43 | 61 | 76 | 132 |
| pSBP (mmHg) | 100 | 8 | 80 | 94 | 105 | 126 | 120 | 11 | 90 | 113 | 127 | 156 |
| pDBP (mmHg) | 59 | 7 | 50 | 54 | 62 | 86 | 64 | 7 | 48 | 60 | 68 | 100 |
| pPP (mmHg) | 41 | 7 | 24 | 36 | 46 | 77 | 56 | 11 | 21 | 48 | 63 | 90 |
| pMBP (mmHg) | 72 | 7 | 31 | 68 | 77 | 96 | 83 | 7 | 65 | 78 | 87 | 118 |
| cSBP (mmHg) | 83 | 6 | 64 | 78 | 87 | 100 | 102 | 9 | 83 | 96 | 107 | 135 |
| cPP (mmHg) | 22 | 4 | 7 | 19 | 25 | 43 | 37 | 8 | 18 | 31 | 43 | 61 |
| CO (liter/min) | 4.4 | 0.3 | 3.2 | 4.1 | 4.8 | 5.7 | 5.4 | 0.7 | 3.9 | 4.9 | 5.9 | 7.1 |
| C.I. (liter/min/m2) | 4.9 | 0.6 | 3.5 | 4.4 | 5.4 | 5.9 | 3.2 | 0.8 | 1.8 | 2.9 | 3.5 | 16.0 |
| SVR (s.mmHg/mL) | 1.10 | 0.10 | 0.86 | 1.04 | 1.19 | 1.41 | 1.05 | 0.15 | 0.78 | 0.93 | 1.16 | 1.47 |
| AIx (%) | 9.7 | 9.7 | −16 | 3 | 17 | 37 | –0.7 | 9.1 | –28.0 | –6 | 5 | 25 |
| AIx@75 (%) | 17.0 | 9.3 | −10 | 11 | 23 | 43 | –3.3 | 10.0 | –34.0 | –10 | 2 | 27 |
| AP (mmHg) | 2 | 2 | −5 | 1 | 4 | 9 | –1 | 4 | –15 | –2 | 2 | 8 |
| PF (mmHg) | 20 | 5 | 7 | 17 | 23 | 43 | 36 | 10 | 9 | 29 | 42 | 82 |
| PB (mmHg) | 10 | 4 | 3 | 9 | 11 | 78 | 14 | 3 | 4 | 12 | 16 | 26 |
| Structural arterial parameters, local and regional arterial stiffness | ||||||||||||
| R-CCA SD (mm) | 6.04 | 0.50 | 4.83 | 5.70 | 6.39 | 7.41 | 6.82 | 0.51 | 5.20 | 6.48 | 7.11 | 8.82 |
| R-CCA DD (mm) | 5.38 | 0.47 | 4.21 | 5.03 | 5.71 | 6.91 | 6.16 | 0.47 | 4.53 | 5.88 | 6.46 | 7.90 |
| R-CCA IMT (mm) | 0.421 | 0.028 | 0.370 | 0.405 | 0.431 | 0.537 | 0.494 | 0.039 | 0.380 | 0.473 | 0.512 | 0.631 |
| L-CCA SD (mm) | 5.92 | 0.46 | 4.84 | 5.59 | 6.22 | 7.48 | 6.75 | 0.46 | 5.46 | 6.41 | 7.07 | 8.18 |
| L-CCA DD (mm) | 5.25 | 0.43 | 4.25 | 4.96 | 5.53 | 6.99 | 6.11 | 0.44 | 4.90 | 5.76 | 6.40 | 7.56 |
| L-CCA IMT (mm) | 0.420 | 0.027 | 0.316 | 0.405 | 0.431 | 0.567 | 0.492 | 0.042 | 0.343 | 0.472 | 0.508 | 0.722 |
| R-CFA SD (mm) | 4.74 | 0.53 | 3.44 | 4.42 | 5.05 | 6.50 | 7.20 | 0.99 | 5.42 | 6.44 | 7.94 | 9.76 |
| R-CFA DD (mm) | 4.42 | 0.51 | 3.13 | 4.11 | 4.72 | 6.11 | 6.87 | 0.93 | 5.22 | 6.13 | 7.52 | 9.44 |
| R-CFA IMT (mm) | 0.331 | 0.032 | 0.282 | 0.313 | 0.346 | 0.411 | 0.409 | 0.063 | 0.320 | 0.373 | 0.448 | 0.645 |
| L-CFA SD (mm) | 4.72 | 0.50 | 3.51 | 4.36 | 5.01 | 6.37 | 7.30 | 1.02 | 4.69 | 6.48 | 8.08 | 10.26 |
| L-CFA DD (mm) | 4.40 | 0.50 | 3.29 | 4.06 | 4.71 | 5.98 | 6.97 | 0.98 | 4.48 | 6.18 | 7.68 | 9.75 |
| L-CFA IMT (mm) | 0.335 | 0.026 | 0.271 | 0.319 | 0.355 | 0.398 | 0.393 | 0.060 | 0.313 | 0.355 | 0.417 | 0.585 |
| R-CCA EM (mmHg) | 187 | 45 | 71 | 156 | 216 | 304 | 360 | 89 | 181 | 292 | 416 | 643 |
| L-CCA EM (mmHg) | 179 | 46 | 54 | 146 | 205 | 314 | 358 | 88 | 186 | 300 | 397 | 670 |
| R-CFA EM (mmHg) | 618 | 267 | 237 | 417 | 724 | 1555 | 1317 | 530 | 533 | 944 | 1565 | 3411 |
| L-CFA EM (mmHg) | 592 | 219 | 219 | 427 | 711 | 1561 | 1349 | 535 | 529 | 962 | 1639 | 3497 |
| cfPWV (m/s) | 4.81 | 0.76 | 2.88 | 4.28 | 5.25 | 7.72 | 6.10 | 0.75 | 4.02 | 5.61 | 6.57 | 8.20 |
| Zero-OrderCorrelations | William Test (Comparison of Correlations) | ||||||||||||
|---|---|---|---|---|---|---|---|---|---|---|---|---|---|
| Δ z-BWH (0–2y) [1] | Δ z-BMI (0–6y) [2] | z-BWH (at Birth) [3] | z-BMI (at 6 y) [4] | 1–2 | 1–3 | 1–4 | 2–3 | 2–4 | |||||
| R | p | R | p | R | p | R | p | p | p | P | p | p | |
| Aortic and peripheral blood pressure, hemodynamic and wave reflection parameters | |||||||||||||
| z-pSBP | 0.16 | 0.026 | 0.20 | 0.003 | 0.08 | 0.228 | 0.32 | <0.001 | 0.408 | 0.469 | 0.019 | 0.245 | 0.009 |
| z-pDBP | 0.13 | 0.064 | 0.16 | 0.019 | 0.05 | 0.437 | 0.22 | <0.001 | 0.538 | 0.476 | 0.182 | 0.299 | 0.174 |
| z-pPP | 0.05 | 0.474 | 0.06 | 0.389 | 0.03 | 0.613 | 0.13 | 0.034 | 0.839 | 0.883 | 0.236 | 0.805 | 0.110 |
| z-pMBP | 0.16 | 0.027 | 0.19 | 0.005 | 0.07 | 0.304 | 0.28 | <0.001 | 0.514 | 0.425 | 0.062 | 0.243 | 0.038 |
| z-cSBP | 0.18 | 0.008 | 0.20 | 0.003 | 0.05 | 0.391 | 0.29 | <0.001 | 0.663 | 0.253 | 0.079 | 0.138 | 0.042 |
| z-cDBP | 0.14 | 0.040 | 0.16 | 0.017 | 0.04 | 0.501 | 0.23 | <0.001 | 0.665 | 0.355 | 0.150 | 0.237 | 0.091 |
| z-cPP | 0.06 | 0.396 | 0.07 | 0.312 | 0.04 | 0.579 | 0.10 | 0.106 | 0.831 | 0.831 | 0.549 | 0.726 | 0.534 |
| z-AIx | –0.16 | 0.017 | –0.17 | 0.009 | 0.11 | 0.078 | –0.16 | 0.009 | 0.828 | 0.008 | 0.964 | 0.005 | 0.762 |
| z-AIx@75 | –0.16 | 0.020 | –0.16 | 0.014 | 0.03 | 0.648 | –0.23 | <0.001 | 0.949 | 0.073 | 0.291 | 0.063 | 0.106 |
| z-AP | –0.15 | 0.027 | –0.14 | 0.030 | 0.12 | 0.054 | –0.11 | 0.064 | 0.829 | 0.009 | 0.576 | 0.008 | 0.502 |
| z-Pf | 0.11 | 0.092 | 0.13 | 0.053 | –0.02 | 0.791 | 0.17 | 0.006 | 0.667 | 0.208 | 0.427 | 0.143 | 0.395 |
| z-Pb | 0.01 | 0.938 | 0.00 | 0.949 | 0.04 | 0.494 | 0.03 | 0.609 | 0.850 | 0.709 | 0.701 | 0.634 | 0.427 |
| Structural arterial parameters, local and regional arterial stiffness | |||||||||||||
| z-R-CCA SD | 0.08 | 0.455 | 0.24 | 0.016 | 0.03 | 0.785 | 0.29 | 0.001 | 0.026 | 0.758 | 0.036 | 0.168 | 0.430 |
| z-R-CCA DD | 0.07 | 0.506 | 0.22 | 0.024 | 0.03 | 0.744 | 0.29 | 0.002 | 0.002 | 0.820 | 0.033 | 0.225 | 0.311 |
| z-R-CCA IMT | –0.29 | 0.004 | 0.28 | 0.005 | –0.05 | 0.631 | 0.29 | <0.001 | <0.001 | 0.018 | <0.001 | 0.001 | 0.833 |
| z-L-CCA SD | 0.12 | 0.092 | 0.15 | 0.027 | 0.13 | 0.039 | 0.19 | 0.037 | 0.532 | 0.911 | 0.476 | 0.923 | 0.545 |
| z-L-CCA DD | 0.09 | 0.206 | 0.14 | 0.035 | 0.16 | 0.012 | 0.29 | <0.001 | 0.298 | 0.469 | 0.003 | 0.812 | <0.001 |
| z-L-CCA IMT | 0.11 | 0.115 | 0.14 | 0.043 | 0.07 | 0.178 | 0.18 | 0.004 | 0.695 | 0.735 | 0.312 | 0.513 | 0.390 |
| z-R-CFA SD | 0.32 | 0.003 | 0.36 | <0.001 | –0.16 | 0.118 | 0.36 | <0.001 | 0.807 | 0.004 | 0.708 | 0.001 | 0.952 |
| z-R-CFA DD | 0.34 | 0.001 | 0.35 | <0.001 | –0.18 | 0.077 | 0.33 | <0.001 | 0.827 | 0.002 | 0.890 | 0.001 | 0.765 |
| z-R-CFA IMT | –0.23 | 0.338 | –0.25 | 0.296 | 0.14 | 0.552 | –0.40 | 0.065 | 0.674 | 0.335 | 0.470 | 0.294 | 0.323 |
| z-L-CFA SD | 0.11 | 0.123 | 0.14 | 0.034 | 0.09 | 0.194 | 0.29 | <0.001 | 0.767 | 0.838 | 0.086 | 0.610 | <0.001 |
| z-L-CFA DD | 0.09 | 0.198 | 0.12 | 0.071 | 0.08 | 0.208 | 0.26 | <0.001 | 0.690 | 0.948 | 0.014 | 0.730 | 0.002 |
| z-L-CFA IMT | 0.08 | 0.617 | 0.17 | 0.250 | –0.12 | 0.379 | –0.01 | 0.919 | 0.101 | 0.372 | 0.542 | 0.173 | 0.001 |
| z-R-CCA EM | 0.05 | 0.620 | 0.12 | 0.226 | –0.02 | 0.822 | 0.13 | 0.162 | 0.205 | 0.650 | 0.463 | 0.028 | 0.864 |
| z-L-CCA EM | –0.03 | 0.746 | 0.06 | 0.405 | 0.11 | 0.161 | 0.12 | 0.080 | 0.242 | 0.280 | 0.057 | 0.697 | 0.213 |
| z-R-CFA EM | 0.15 | 0.179 | 0.07 | 0.493 | –0.08 | 0.422 | 0.00 | 0.981 | 0.103 | 0.177 | 0.189 | 0.353 | 0.343 |
| z-L-CFA EM | –0.04 | 0.596 | –0.06 | 0.407 | 0.04 | 0.579 | –0.01 | 0.863 | 0.115 | 0.993 | 0.703 | 0.360 | 0.287 |
| z-cfPWV | 0.00 | 0.991 | –0.03 | 0.775 | –0.02 | 0.790 | 0.00 | 1.00 | 0.649 | 0.876 | 0.989 | 0.959 | 0.610 |
| Zero-Ordercorrelations | William Test (Comparison of Correlations) | ||||||||||||||||||
|---|---|---|---|---|---|---|---|---|---|---|---|---|---|---|---|---|---|---|---|
| Δ z-BMI (0–6y) [1] | Δ z-BMI (0–18y) [2] | Δ z-BMI (6–18y) [3] | z-BWH (at Birth) [4] | z-BMI (18y) [5] | 1–2 | 1–3 | 1–4 | 1–5 | 2–3 | 2–4 | 2–5 | 3–4 | 3–5 | ||||||
| R | p | R | p | R | p | R | p | R | p | p | p | p | p | p | p | p | p | p | |
| Aortic and peripheral blood pressure, hemodynamic and reflection parameters | |||||||||||||||||||
| z-pSBP | 0.08 | 0.234 | 0.14 | 0.021 | 0.09 | 0.172 | 0.01 | 0.931 | 0.25 | <0.001 | 0.411 | 0.905 | 0.488 | 0.010 | 0.421 | 0.203 | 0.040 | 0.458 | 0.009 |
| z-pDBP | −0.02 | 0.757 | 0.02 | 0.798 | 0.07 | 0.286 | 0.03 | 0.581 | 0.17 | 0.002 | 0.623 | 0.283 | 0.609 | 0.004 | 0.424 | 0.922 | 0.006 | 0.711 | 0.107 |
| z-pPP | 0.10 | 0.111 | 0.14 | 0.016 | 0.04 | 0.478 | −0.02 | 0.715 | 0.15 | 0.007 | 0.541 | 0.473 | 0.002 | 0.460 | 0.108 | 0.118 | 0.854 | 0.579 | 0.077 |
| z-pMBP | 0.02 | 0.732 | 0.08 | 0.206 | 0.09 | 0.162 | 0.03 | 0.660 | 0.24 | <0.001 | 0.438 | 0.403 | 0.954 | 0.001 | 0.873 | 0.283 | 0.003 | 0.577 | 0.014 |
| z-cSBP | 0.02 | 0.765 | 0.07 | 0.226 | 0.05 | 0.461 | 0.10 | 0.081 | 0.27 | <0.001 | 0.464 | 0.721 | 0.421 | <0.001 | 0.749 | 0.775 | <0.001 | 0.641 | 0.000 |
| z-cDBP | 0.002 | 0.977 | 0.03 | 0.613 | −0.01 | 0.818 | 0.09 | 0.135 | 0.14 | 0.011 | 0.692 | 0.886 | 0.396 | 0.038 | 0.523 | 0.568 | 0.050 | 0.353 | 0.016 |
| z-cPP | 0.02 | 0.773 | 0.05 | 0.394 | 0.06 | 0.301 | 0.04 | 0.504 | 0.18 | 0.001 | 0.663 | 0.634 | 0.844 | 0.017 | 0.873 | 0.924 | 0.020 | 0.853 | 0.053 |
| z-AIx | 0.02 | 0.744 | 0.02 | 0.682 | 0.03 | 0.602 | −0.01 | 0.931 | −0.02 | 0.774 | 0.944 | 0.906 | 0.495 | 0.008 | 0.874 | 0.772 | 0.471 | 0.714 | 0.428 |
| z-AIx@75 | −0.05 | 0.416 | 0.004 | 0.948 | 0.09 | 0.159 | 0.07 | 0.265 | 0.01 | 0.918 | 0.451 | 0.287 | 0.266 | 0.110 | 0.172 | 0.523 | 0.970 | 0.853 | 0.204 |
| z-AP | 0.02 | 0.735 | 0.02 | 0.741 | 0.02 | 0.744 | 0.001 | 0.996 | −0.02 | 0.693 | 1.000 | 0.987 | 0.850 | <0.001 | 0.992 | 0.849 | 0.470 | 0.398 | 0.526 |
| z-PF | 0.06 | 0.397 | 0.06 | 0.308 | 0.02 | 0.707 | −0.02 | 0.755 | 0.11 | 0.047 | 0.967 | 0.643 | 0.459 | 0.432 | 0.535 | 0.449 | 0.376 | 0.719 | 0.161 |
| z-PB | 0.11 | 0.096 | 0.06 | 0.309 | −0.08 | 0.211 | 0.05 | 0.402 | 0.06 | 0.289 | 0.519 | 0.028 | 0.578 | 0.484 | 0.030 | 0.925 | 0.990 | 0.243 | 0.030 |
| Structural arterial parameters, local and regional arterial stiffness | |||||||||||||||||||
| z-R-CCA SD | 0.09 | 0.146 | 0.15 | 0.015 | 0.10 | 0.123 | −0.02 | 0.692 | 0.26 | <0.001 | 0.437 | 0.905 | 0.273 | 0.012 | 0.423 | 0.098 | 0.041 | 0.269 | 0.009 |
| z-R-CCA DD | 0.08 | 0.208 | 0.14 | 0.021 | 0.09 | 0.129 | −0.003 | 0.962 | 0.26 | <0.001 | 0.413 | 0.905 | 0.291 | 0.006 | 0.424 | 0.164 | 0.026 | 0.392 | 0.006 |
| z-R-CCA IMT | 0.04 | 0.501 | 0.03 | 0.604 | 0.12 | 0.060 | 0.002 | 0.967 | 0.12 | 0.032 | 0.900 | 0.341 | 0.716 | 0.238 | 0.153 | 0.787 | 0.104 | 0.277 | 0.949 |
| z-L-CCA SD | 0.11 | 0.077 | 0.13 | 0.034 | 0.10 | 0.100 | −0.01 | 0.883 | 0.25 | <0.001 | 0.811 | 0.905 | 0.248 | 0.034 | 0.632 | 0.174 | 0.026 | 0.312 | 0.015 |
| z-L-CCA DD | 0.10 | 0.121 | 0.12 | 0.054 | 0.09 | 0.136 | 0.03 | 0.597 | 0.28 | <0.001 | 0.822 | 0.905 | 0.513 | 0.007 | 0.632 | 0.382 | 0.003 | 0.581 | 0.002 |
| z-L-CCA IMT | 0.12 | 0.069 | 0.06 | 0.283 | 0.09 | 0.150 | −0.01 | 0.868 | 0.13 | 0.020 | 0.440 | 0.721 | 0.212 | 0.860 | 0.634 | 0.772 | 0.205 | 0.359 | 0.524 |
| z-R-CFA SD | 0.12 | 0.233 | 0.08 | 0.418 | 0.18 | 0.057 | 0.02 | 0.840 | 0.34 | <0.001 | 0.708 | 0.647 | 0.537 | 0.036 | 0.309 | 0.712 | 0.002 | 0.345 | 0.133 |
| z-R-CFA DD | 0.11 | 0.281 | 0.08 | 0.437 | 0.18 | 0.069 | 0.01 | 0.957 | 0.32 | <0.001 | 0.755 | 0.593 | 0.522 | 0.046 | 0.309 | 0.667 | 0.004 | 0.316 | 0.140 |
| z-R-CFA IMT | 0.15 | 0.496 | 0.17 | 0.390 | 0.19 | 0.363 | −0.16 | 0.423 | 0.27 | 0.149 | 0.936 | 0.886 | 0.380 | 0.607 | 0.924 | 0.343 | 0.582 | 0.339 | 0.697 |
| z-L-CFA SD | 0.11 | 0.292 | 0.11 | 0.244 | 0.11 | 0.273 | −0.02 | 0.870 | 0.26 | 0.003 | 0.986 | 0.988 | 0.440 | 0.148 | 0.960 | 0.422 | 0.077 | 0.446 | 0.120 |
| z-L-CFA DD | 0.09 | 0.407 | 0.10 | 0.307 | 0.10 | 0.322 | 0.01 | 0.951 | 0.26 | 0.003 | 0.943 | 0.940 | 0.607 | 0.100 | 0.984 | 0.578 | 0.059 | 0.597 | 0.097 |
| z-L-CFA IMT | 0.01 | 0.967 | −0.15 | 0.445 | −0.26 | 0.190 | 0.27 | 0.162 | 0.33 | 0.068 | 0.160 | 0.328 | 0.437 | 0.151 | 0.589 | 0.215 | 0.005 | 0.136 | 0.002 |
| z-R-CCA EM | −0.05 | 0.485 | 0.02 | 0.788 | 0.06 | 0.317 | 0.12 | 0.043 | 0.21 | <0.001 | 0.360 | 0.196 | 0.102 | <0.001 | 0.528 | 0.327 | 0.003 | 0.581 | 0.016 |
| z-L-CCA EM | 0.02 | 0.787 | 0.06 | 0.296 | 0.06 | 0.345 | 0.13 | 0.029 | 0.31 | <0.001 | 0.551 | 0.639 | 0.288 | <0.001 | 0.954 | 0.498 | 0.003 | 0.520 | <0.001 |
| z-R-CFA EM | −0.03 | 0.793 | 0.02 | 0.821 | −0.10 | 0.308 | −0.09 | 0.364 | −0.07 | 0.443 | 0.648 | 0.601 | 0.725 | 0.721 | 0.230 | 0.503 | 0.306 | 0.953 | 0.764 |
| z-L-CFA EM | −0.14 | 0.175 | −0.05 | 0.630 | −0.09 | 0.351 | 0.12 | 0.223 | 0.09 | 0.309 | 0.408 | 0.706 | 0.118 | 0.032 | 0.689 | 0.298 | 0.109 | 0.222 | 0.070 |
| z-cfPWV | 0.01 | 0.912 | 0.01 | 0.802 | −0.03 | 0.621 | 0.03 | 0.632 | 0.03 | 0.599 | 0.944 | 0.633 | 0.862 | 0.770 | 0.523 | 0.845 | 0.716 | 0.579 | 0.337 |
| Zero-OrderCorrelations | Comparison of Correlations | |||||||||||||||
|---|---|---|---|---|---|---|---|---|---|---|---|---|---|---|---|---|
| ChildrenCohort (n = 632) | AdolescentCohort (n = 340) | |||||||||||||||
| ΔBWH (0–2y) [1] | Δ z-BMI (0–6y) [2] | Δ z-BMI (0–6y) [3] | Δ z-BMI (0–18y) [4] | Δ z-BMI (6–18y) [5] | 1–3 | 1–4 | 1–5 | 2–3 | 2–4 | 2–5 | ||||||
| R | p | R | p | R | p | R | p | R | p | p | P | p | P | p | p | |
| Aortic and peripheral blood pressure, hemodynamic and wave reflection parameters | ||||||||||||||||
| z-pSBP | 0.16 | 0.026 | 0.20 | 0.003 | 0.08 | 0.234 | 0.14 | 0.021 | 0.09 | 0.172 | 0.320 | 0.802 | 0.384 | 0.613 | 0.449 | 0.169 |
| z-pDBP | 0.13 | 0.064 | 0.16 | 0.019 | −0.02 | 0.757 | 0.02 | 0.798 | 0.07 | 0.286 | 0.065 | 0.175 | 0.458 | 0.708 | 0.084 | 0.264 |
| z-pPP | 0.05 | 0.474 | 0.06 | 0.389 | 0.10 | 0.111 | 0.14 | 0.016 | 0.04 | 0.478 | 0.538 | 0.266 | 0.624 | 0.902 | 0.322 | 0.806 |
| z-pMBP | 0.16 | 0.027 | 0.19 | 0.005 | 0.02 | 0.732 | 0.08 | 0.206 | 0.09 | 0.162 | 0.083 | 0.320 | 0.383 | 0.705 | 0.170 | 0.211 |
| z-cSBP | 0.18 | 0.008 | 0.20 | 0.003 | 0.02 | 0.765 | 0.07 | 0.226 | 0.05 | 0.461 | 0.047 | 0.159 | 0.097 | 0.794 | 0.095 | 0.055 |
| z-cDBP | 0.14 | 0.040 | 0.16 | 0.017 | 0.002 | 0.977 | 0.03 | 0.613 | −0.01 | 0.818 | 0.080 | 0.163 | 0.058 | 0.797 | 0.098 | 0.031 |
| z-cPP | 0.06 | 0.396 | 0.07 | 0.312 | 0.02 | 0.773 | 0.05 | 0.394 | 0.06 | 0.301 | 0.614 | 0.900 | 0.930 | 0.899 | 0.801 | 0.899 |
| z-AIx | −0.16 | 0.017 | −0.17 | 0.009 | 0.02 | 0.744 | 0.02 | 0.682 | 0.03 | 0.602 | 0.023 | 0.023 | 0.016 | 0.897 | 0.016 | 0.011 |
| z-AIx@75 | −0.16 | 0.020 | −0.16 | 0.014 | −0.05 | 0.416 | 0.004 | 0.948 | 0.09 | 0.159 | 0.169 | 0.041 | 0.002 | 0.962 | 0.041 | 0.002 |
| z-AP | −0.15 | 0.027 | −0.14 | 0.030 | 0.02 | 0.735 | 0.02 | 0.741 | 0.02 | 0.744 | 0.035 | 0.032 | 0.032 | 0.898 | 0.043 | 0.043 |
| z-Pf | 0.11 | 0.092 | 0.13 | 0.053 | 0.06 | 0.397 | 0.06 | 0.308 | 0.02 | 0.707 | 0.534 | 0.534 | 0.263 | 0.802 | 0.383 | 0.063 |
| z-Pb | 0.01 | 0.938 | −0.004 | 0.949 | 0.11 | 0.096 | 0.06 | 0.309 | −0.08 | 0.211 | 0.215 | 0.537 | 0.266 | 0.883 | 0.429 | 0.347 |
| Structural arterial parameters, local and regional arterial stiffness | ||||||||||||||||
| z-R-CCA SD | 0.08 | 0.455 | 0.24 | 0.016 | 0.09 | 0.146 | 0.15 | 0.015 | 0.10 | 0.123 | 0.924 | 0.503 | 0.248 | 0.121 | 0.377 | 0.173 |
| z-R-CCA DD | 0.07 | 0.506 | 0.22 | 0.024 | 0.08 | 0.208 | 0.14 | 0.021 | 0.09 | 0.129 | 0.924 | 0.404 | 0.849 | 0.148 | 0.435 | 0.208 |
| z-R-CCA IMT | −0.29 | 0.004 | 0.28 | 0.005 | 0.04 | 0.501 | 0.03 | 0.604 | 0.12 | 0.060 | 0.001 | 0.002 | <0.001 | <0.001 | 0.015 | 0.115 |
| z-L-CCA SD | 0.12 | 0.092 | 0.15 | 0.027 | 0.11 | 0.077 | 0.13 | 0.034 | 0.10 | 0.100 | 0.900 | 0.900 | 0.803 | 0.706 | 0.801 | 0.530 |
| z-L-CCA DD | 0.09 | 0.206 | 0.14 | 0.035 | 0.10 | 0.121 | 0.12 | 0.054 | 0.09 | 0.136 | 0.901 | 0.708 | 0.940 | 0.531 | 0.802 | 0.531 |
| z-L-CCA IMT | 0.11 | 0.115 | 0.14 | 0.043 | 0.12 | 0.069 | 0.06 | 0.283 | 0.09 | 0.150 | 0.900 | 0.535 | 0.803 | 0.708 | 0.318 | 0.531 |
| z-R-CFA SD | 0.32 | 0.003 | 0.36 | <0.001 | 0.12 | 0.233 | 0.08 | 0.418 | 0.18 | 0.057 | 0.100 | 0.050 | 0.244 | 0.725 | 0.021 | 0.129 |
| z-R-CFA DD | 0.34 | 0.001 | 0.35 | 0.001 | 0.11 | 0.281 | 0.08 | 0.437 | 0.18 | 0.069 | 0.058 | 0.033 | 0.180 | 0.930 | 0.026 | 0.153 |
| z-R-CFA IMT | −0.23 | 0.338 | −0.25 | 0.296 | 0.15 | 0.496 | 0.17 | 0.390 | 0.19 | 0.363 | 0.173 | 0.151 | 0.131 | 0.942 | 0.131 | 0.113 |
| z-L-CFA SD | 0.11 | 0.123 | 0.14 | 0.034 | 0.11 | 0.292 | 0.11 | 0.244 | 0.11 | 0.273 | 0.992 | 0.977 | 0.992 | 0.773 | 0.773 | 0.773 |
| z-L-CFA DD | 0.09 | 0.198 | 0.12 | 0.071 | 0.09 | 0.407 | 0.10 | 0.307 | 0.10 | 0.322 | 0.970 | 0.924 | 0.924 | 0.774 | 0.848 | 0.848 |
| z-L-CFA IMT | 0.08 | 0.617 | 0.17 | 0.250 | 0.01 | 0.967 | −0.15 | 0.445 | −0.26 | 0.190 | 0.751 | 0.296 | 0.118 | 0.679 | 0.145 | 0.048 |
| z-R-CCA EM | 0.05 | 0.620 | 0.12 | 0.226 | −0.05 | 0.485 | 0.02 | 0.788 | 0.06 | 0.317 | 0.355 | 0.781 | 0.926 | 0.515 | 0.353 | 0.576 |
| z-L-CCA EM | −0.03 | 0.746 | 0.06 | 0.405 | 0.02 | 0.787 | 0.06 | 0.296 | 0.06 | 0.345 | 0.570 | 0.306 | 0.306 | 0.306 | 0.991 | 0.955 |
| z-R-CFA EM | 0.15 | 0.179 | 0.07 | 0.493 | −0.03 | 0.793 | 0.02 | 0.821 | −0.10 | 0.308 | 0.160 | 0.309 | 0.051 | 0.530 | 0.698 | 0.186 |
| z-L-CFA EM | −0.04 | 0.596 | −0.06 | 0.407 | −0.14 | 0.175 | −0.05 | 0.630 | −0.09 | 0.351 | 0.343 | 0.925 | 0.637 | 0.851 | 0.925 | 0.777 |
| z-cfPWV | −0.001 | 0.991 | −0.03 | 0.775 | 0.01 | 0.912 | 0.01 | 0.802 | −0.03 | 0.621 | 0.908 | 0.9082 | 0.761 | 0.761 | 0.753 | 0.95 |
| Δ z-BWH (0–2y) | ||||||
|---|---|---|---|---|---|---|
| Zero-Order | Partial 1 | Partial 2 | ||||
| R | p | R | p | R | p | |
| Aortic and peripheral blood pressure, hemodynamic and wave reflection parameters | ||||||
| z-pSBP | 0.16 | 0.026 | 0.26 | <0.001 | 0.11 | 0.103 |
| z-pDBP | 0.13 | 0.064 | 0.21 | 0.003 | 0.10 | 0.136 |
| z-pPP | 0.05 | 0.474 | 0.09 | 0.197 | 0.02 | 0.756 |
| z-pMBP | 0.16 | 0.027 | 0.25 | <0.001 | 0.12 | 0.082 |
| z-cSBP | 0.18 | 0.008 | 0.27 | <0.001 | 0.14 | 0.041 |
| z-cDBP | 0.14 | 0.040 | 0.21 | 0.002 | 0.10 | 0.136 |
| z-cPP | 0.06 | 0.396 | 0.10 | 0.135 | 0.06 | 0.379 |
| z-AIx | −0.16 | 0.017 | −0.12 | 0.085 | −0.02 | 0.797 |
| z-AIx@75 | −0.16 | 0.020 | −0.18 | 0.009 | −0.06 | 0.419 |
| z-AP | −0.15 | 0.027 | −0.09 | 0.167 | −0.02 | 0.762 |
| z-Pf | 0.11 | 0.092 | 0.13 | 0.052 | 0.04 | 0.528 |
| z-Pb | 0.01 | 0.938 | 0.04 | 0.545 | 0.03 | 0.619 |
| Structural arterial parameters, local and regional arterial stiffness | ||||||
| z-R-CCA SD | 0.08 | 0.455 | 0.12 | 0.250 | −0.06 | 0.595 |
| z-R- CCA DD | 0.07 | 0.506 | 0.11 | 0.277 | −0.06 | 0.569 |
| z-R-CCA IMT | −0.29 | 0.004 | 0.34 | 0.001 | 0.27 | 0.008 |
| z-L-CCA SD | 0.12 | 0.092 | 0.26 | <0.001 | 0.13 | 0.058 |
| z-L-CCA DD | 0.09 | 0.206 | 0.24 | <0.001 | 0.12 | 0.088 |
| z-L-CCA IMT | 0.11 | 0.115 | 0.20 | 0.004 | 0.13 | 0.048 |
| z-R-CFA SD | 0.32 | 0.003 | 0.28 | 0.008 | 0.08 | 0.472 |
| z-R-CFA DD | 0.34 | 0.001 | 0.30 | 0.005 | 0.12 | 0.288 |
| z-R-CFA IMT | −0.23 | 0.338 | −0.19 | 0.451 | 0.07 | 0.777 |
| z-L-CFA SD | 0.11 | 0.123 | 0.21 | 0.003 | 0.07 | 0.353 |
| z-L-CFA DD | 0.09 | 0.198 | 0.18 | 0.009 | 0.05 | 0.453 |
| z-L-CFA IMT | 0.08 | 0.617 | 0.00 | 0.991 | −0.01 | 0.956 |
| z-R-CCA EM | 0.05 | 0.620 | 0.05 | 0.644 | −0.03 | 0.750 |
| z-L-CCA EM | −0.03 | 0.746 | 0.05 | 0.528 | −0.01 | 0.888 |
| z-R-CFA EM | 0.15 | 0.179 | 0.12 | 0.270 | 0.13 | 0.223 |
| z-L-CFA EM | −0.04 | 0.596 | −0.02 | 0.796 | −0.01 | 0.888 |
| z-cfPWV | 0.00 | 0.991 | −0.02 | 0.827 | −0.03 | 0.766 |
| Δ z-BMI (0–6y) | ||||||||||||||
|---|---|---|---|---|---|---|---|---|---|---|---|---|---|---|
| ChildrenCohort (n = 632) | AdolescentCohort (n = 340) | |||||||||||||
| Zero-order | Partial 1 | Partial 2 | Zero-order | Partial 1 | Partial 2 | Partial 3 | ||||||||
| R | p | R | p | R | p | R | p | R | p | R | p | R | p | |
| Aortic and peripheral blood pressure, hemodynamic and wave reflection parameters | ||||||||||||||
| z-pSBP | 0.20 | 0.003 | 0.28 | <0.001 | −0.04 | 0.588 | 0.08 | 0.234 | 0.13 | 0.049 | 0.02 | 0.805 | 0.18 | 0.008 |
| z-pDBP | 0.16 | 0.019 | 0.22 | 0.001 | 0.03 | 0.621 | −0.02 | 0.757 | 0.01 | 0.890 | −0.08 | 0.239 | 0.04 | 0.558 |
| z-pPP | 0.06 | 0.389 | 0.09 | 0.195 | −0.11 | 0.095 | 0.10 | 0.111 | 0.14 | 0.037 | 0.08 | 0.245 | 0.17 | 0.013 |
| z-pMBP | 0.19 | 0.005 | 0.26 | <0.001 | 0.00 | 0.961 | 0.02 | 0.732 | 0.07 | 0.302 | −0.05 | 0.483 | 0.11 | 0.097 |
| z-cSBP | 0.20 | 0.003 | 0.26 | <0.001 | −0.04 | 0.529 | 0.02 | 0.765 | 0.16 | 0.014 | 0.05 | 0.483 | 0.20 | 0.003 |
| z-cDBP | 0.16 | 0.017 | 0.21 | 0.001 | −0.04 | 0.567 | 0.00 | 0.977 | 0.11 | 0.083 | 0.06 | 0.380 | 0.12 | 0.074 |
| z-cPP | 0.07 | 0.312 | 0.10 | 0.135 | 0.03 | 0.624 | 0.02 | 0.773 | 0.08 | 0.228 | 0.00 | 0.977 | 0.11 | 0.088 |
| z-cMBP | 0.18 | 0.005 | 0.24 | <0.001 | −0.02 | 0.718 | −0.04 | 0.556 | −0.03 | 0.636 | −0.09 | 0.158 | 0.06 | 0.406 |
| z-AIx | −0.17 | 0.009 | −0.13 | 0.045 | 0.14 | 0.034 | 0.02 | 0.744 | 0.03 | 0.676 | 0.04 | 0.555 | 0.04 | 0.519 |
| z-AIx@75 | −0.16 | 0.014 | −0.17 | 0.009 | 0.19 | 0.005 | −0.05 | 0.416 | 0.00 | 0.984 | 0.00 | 0.976 | 0.04 | 0.562 |
| z-AP | −0.14 | 0.030 | −0.09 | 0.161 | 0.12 | 0.056 | 0.02 | 0.735 | 0.04 | 0.590 | 0.05 | 0.439 | 0.05 | 0.485 |
| z-Pf | 0.13 | 0.053 | 0.14 | 0.036 | −0.09 | 0.173 | 0.06 | 0.397 | 0.07 | 0.322 | 0.02 | 0.820 | 0.08 | 0.228 |
| z-Pb | 0.00 | 0.949 | 0.02 | 0.747 | 0.00 | 0.956 | 0.11 | 0.096 | 0.24 | <0.001 | 0.24 | <0.001 | 0.23 | 0.001 |
| Structural arterial parameters, local and regional arterial stiffness | ||||||||||||||
| z-R-CCA SD | 0.24 | 0.016 | 0.29 | 0.003 | 0.05 | 0.639 | 0.09 | 0.146 | 0.12 | 0.066 | 0.00 | 0.968 | 0.17 | 0.011 |
| z-R-CCA DD | 0.22 | 0.024 | 0.28 | 0.005 | 0.02 | 0.838 | 0.08 | 0.208 | 0.13 | 0.054 | 0.01 | 0.917 | 0.18 | 0.008 |
| z-R-CCA IMT | 0.28 | 0.005 | 0.29 | 0.003 | 0.33 | 0.001 | 0.04 | 0.501 | 0.07 | 0.268 | 0.02 | 0.763 | 0.13 | 0.054 |
| z-L-CCA SD | 0.15 | 0.027 | 0.25 | <0.001 | −0.02 | 0.779 | 0.11 | 0.077 | 0.17 | 0.009 | 0.06 | 0.321 | 0.23 | 0.001 |
| z-L-CCA DD | 0.14 | 0.035 | 0.26 | <0.001 | 0.03 | 0.623 | 0.10 | 0.121 | 0.20 | 0.002 | 0.09 | 0.189 | 0.26 | <0.001 |
| z-L-CCA IMT | 0.14 | 0.043 | 0.20 | 0.002 | 0.13 | 0.044 | 0.12 | 0.069 | 0.17 | 0.007 | 0.13 | 0.048 | 0.24 | <0.001 |
| z-R-CFA SD | 0.36 | <0.001 | 0.33 | 0.002 | −0.17 | 0.105 | 0.12 | 0.233 | 0.22 | 0.032 | 0.08 | 0.428 | 0.32 | 0.002 |
| z-R-CFA DD | 0.35 | 0.001 | 0.31 | 0.003 | −0.18 | 0.094 | 0.11 | 0.281 | 0.18 | 0.075 | 0.05 | 0.645 | 0.28 | 0.007 |
| z-R-CFA IMT | −0.25 | 0.296 | −0.21 | 0.397 | 0.74 | <0.001 | 0.15 | 0.496 | 0.04 | 0.865 | −0.10 | 0.645 | 0.12 | 0.607 |
| z-L-CFA SD | 0.14 | 0.034 | 0.22 | 0.001 | −0.15 | 0.033 | 0.11 | 0.292 | 0.16 | 0.136 | 0.04 | 0.685 | 0.22 | 0.039 |
| z-L-CFA DD | 0.12 | 0.071 | 0.19 | 0.004 | −0.15 | 0.032 | 0.09 | 0.407 | 0.15 | 0.164 | 0.03 | 0.769 | 0.20 | 0.056 |
| z-L-CFA IMT | 0.17 | 0.250 | 0.12 | 0.413 | 0.36 | 0.013 | 0.01 | 0.967 | 0.36 | 0.073 | 0.26 | 0.218 | 0.30 | 0.149 |
| z-R-CCA EM | 0.12 | 0.226 | 0.13 | 0.203 | 0.00 | 0.977 | −0.05 | 0.485 | 0.08 | 0.229 | −0.01 | 0.850 | 0.12 | 0.080 |
| z-L-CCA EM | 0.06 | 0.405 | 0.14 | 0.073 | 0.12 | 0.130 | 0.02 | 0.787 | 0.19 | 0.003 | 0.07 | 0.320 | 0.24 | <0.001 |
| z-R-CFA EM | 0.07 | 0.493 | 0.04 | 0.741 | 0.06 | 0.581 | −0.03 | 0.793 | −0.15 | 0.144 | −0.14 | 0.184 | −0.21 | 0.042 |
| z-L-CFA EM | −0.06 | 0.407 | −0.04 | 0.524 | −0.09 | 0.214 | −0.14 | 0.175 | −0.08 | 0.436 | −0.14 | 0.205 | −0.12 | 0.241 |
| z-cfPWV | −0.03 | 0.775 | −0.04 | 0.625 | −0.15 | 0.083 | 0.01 | 0.912 | 0.05 | 0.475 | 0.04 | 0.560 | 0.04 | 0.566 |
| Δ z-BMI (0–18y) | ||||||
|---|---|---|---|---|---|---|
| Zero-Order | Partial 1 | Partial 2 | ||||
| R | P | R | p | R | p | |
| Aortic and peripheral blood pressure, hemodynamic and wave reflection parameters | ||||||
| z-pSBP | 0.14 | 0.021 | −0.14 | 0.682 | −0.19 | 0.595 |
| z-pDBP | 0.02 | 0.798 | −0.03 | 0.923 | 0.37 | 0.291 |
| z-pPP | 0.14 | 0.016 | −0.13 | 0.712 | −0.73 | 0.017 |
| z-pMBP | 0.08 | 0.206 | −0.07 | 0.836 | 0.21 | 0.558 |
| z-cSBP | 0.07 | 0.226 | 0.27 | 0.419 | 0.31 | 0.388 |
| z-cDBP | 0.03 | 0.613 | −0.10 | 0.777 | 0.02 | 0.962 |
| z-cPP | 0.05 | 0.394 | 0.61 | 0.045 | 0.57 | 0.084 |
| z-AIx | 0.02 | 0.682 | −0.06 | 0.851 | 0.23 | 0.527 |
| z-AIx@75 | 0.00 | 0.948 | −0.13 | 0.704 | 0.13 | 0.720 |
| z-AP | 0.02 | 0.741 | −0.08 | 0.818 | 0.16 | 0.668 |
| z-Pf | 0.06 | 0.308 | 0.05 | 0.895 | 0.16 | 0.660 |
| z-Pb | 0.06 | 0.309 | 0.15 | 0.658 | 0.15 | 0.679 |
| Structural arterial parameters, local and regional arterial stiffness | ||||||
| z-R-CCA SD | 0.15 | 0.015 | 0.07 | 0.846 | 0.23 | 0.517 |
| z-R-CCA DD | 0.14 | 0.021 | 0.04 | 0.902 | 0.25 | 0.494 |
| z-R-CCA IMT | 0.03 | 0.604 | 0.15 | 0.667 | −0.26 | 0.468 |
| z-L-CCA SD | 0.13 | 0.034 | 0.11 | 0.755 | 0.07 | 0.844 |
| z-L-CCA DD | 0.12 | 0.054 | 0.08 | 0.820 | 0.10 | 0.789 |
| z-L-CCA IMT | 0.06 | 0.283 | −0.05 | 0.895 | 0.06 | 0.878 |
| z-R-CFA SD | 0.08 | 0.418 | 0.01 | 0.967 | 0.20 | 0.575 |
| z-R-CFA DD | 0.08 | 0.437 | −0.08 | 0.806 | 0.18 | 0.615 |
| z-R-CFA IMT | 0.17 | 0.390 | 0.31 | 0.354 | −0.16 | 0.656 |
| z-L-CFA SD | 0.11 | 0.244 | −0.02 | 0.948 | 0.12 | 0.750 |
| z-L-CFA DD | 0.10 | 0.307 | −0.17 | 0.622 | 0.10 | 0.784 |
| z-L-CFA IMT | −0.15 | 0.445 | 0.08 | 0.813 | 0.13 | 0.731 |
| z-R-CCA EM | 0.02 | 0.788 | 0.38 | 0.254 | 0.33 | 0.359 |
| z-L-CCA EM | 0.06 | 0.296 | 0.37 | 0.267 | 0.44 | 0.208 |
| z-R-CFA EM | 0.02 | 0.821 | −0.31 | 0.358 | −0.37 | 0.298 |
| z-L-CFA EM | −0.05 | 0.630 | −0.52 | 0.105 | −0.29 | 0.409 |
| z-cfPWV | 0.01 | 0.802 | −0.29 | 0.387 | 0.32 | 0.367 |
| Δ z-BMI (6–18y) | ||||||
|---|---|---|---|---|---|---|
| Zero-Order | Partial 1 | Partial 2 | ||||
| R | p | R | p | R | p | |
| Aortic and peripheral blood pressure, hemodynamic and wave reflection parameters | ||||||
| z-pSBP | 0.09 | 0.172 | −0.29 | 0.453 | −0.24 | 0.566 |
| z-pDBP | 0.07 | 0.286 | −0.31 | 0.419 | −0.23 | 0.591 |
| z-pPP | 0.04 | 0.478 | 0.04 | 0.918 | 0.01 | 0.980 |
| z-pMBP | 0.09 | 0.162 | −0.35 | 0.357 | −0.27 | 0.521 |
| z-cSBP | 0.05 | 0.461 | −0.22 | 0.565 | −0.65 | 0.079 |
| z-cDBP | −0.01 | 0.818 | −0.42 | 0.260 | −0.42 | 0.305 |
| z-cPP | 0.06 | 0.301 | 0.12 | 0.749 | −0.51 | 0.193 |
| z-AIx | 0.03 | 0.602 | −0.56 | 0.114 | −0.51 | 0.200 |
| z-AIx@75 | 0.09 | 0.159 | −0.53 | 0.142 | −0.45 | 0.264 |
| z-AP | 0.02 | 0.744 | −0.56 | 0.114 | −0.49 | 0.219 |
| z-PF | 0.02 | 0.707 | −0.14 | 0.725 | −0.31 | 0.453 |
| z-PB | −0.08 | 0.211 | −0.20 | 0.598 | −0.37 | 0.364 |
| Structural arterial parameters, local and regional arterial stiffness | ||||||
| z-R-CCA SD | 0.10 | 0.123 | −0.55 | 0.123 | −0.74 | 0.035 |
| z-R-CCA DD | 0.09 | 0.129 | −0.38 | 0.308 | −0.59 | 0.120 |
| z-R-CCA IMT | 0.12 | 0.060 | 0.20 | 0.600 | −0.14 | 0.747 |
| z-L-CCA SD | 0.10 | 0.100 | −0.18 | 0.651 | −0.23 | 0.583 |
| z-L-CCA DD | 0.09 | 0.136 | −0.10 | 0.804 | −0.11 | 0.791 |
| z-L-CCA IMT | 0.09 | 0.150 | −0.01 | 0.975 | −0.33 | 0.418 |
| z-R-CFA SD | 0.18 | 0.057 | 0.14 | 0.722 | 0.13 | 0.754 |
| z-R-CFA DD | 0.18 | 0.069 | 0.10 | 0.795 | 0.30 | 0.475 |
| z-R-CFA IMT | 0.19 | 0.363 | 0.28 | 0.473 | −0.34 | 0.415 |
| z-L-CFA SD | 0.11 | 0.273 | −0.04 | 0.927 | −0.14 | 0.748 |
| z-L-CFA DD | 0.10 | 0.322 | −0.11 | 0.776 | 0.01 | 0.988 |
| z-L-CFA IMT | −0.26 | 0.190 | −0.28 | 0.470 | −0.52 | 0.184 |
| z-R-CCA EM | 0.06 | 0.317 | 0.26 | 0.503 | −0.20 | 0.631 |
| z-L-CCA EM | 0.06 | 0.345 | 0.13 | 0.746 | −0.21 | 0.619 |
| z-R-CFA EM | −0.10 | 0.308 | 0.12 | 0.759 | 0.66 | 0.075 |
| z-L-CFA EM | −0.09 | 0.351 | −0.20 | 0.604 | 0.37 | 0.365 |
| z-cfPWV | −0.03 | 0.621 | −0.63 | 0.068 | −0.35 | 0.390 |
| Dependent | Independent Variables | βu | SE | βs | p | VIF | AdjR2 |
|---|---|---|---|---|---|---|---|
| Aortic and peripheral blood pressure, hemodynamic and wave reflection parameters | |||||||
| z-pSBP | Constant | −0.069 | 0.097 | 0.477 | 0.071 | ||
| Current z-BMI | 0.245 | 0.062 | 0.276 | <0.001 | 1.00 | ||
| z-pDBP | Constant | −0.114 | 0.108 | 0.296 | 0.038 | ||
| Current z-BMI | 0.203 | 0.069 | 0.208 | 0.004 | 1.00 | ||
| z-pPP | - | – | – | – | – | – | – |
| z-pMBP | Constant | −0.112 | 0.107 | 0.295 | 0.065 | ||
| Current z-BMI | 0.247 | 0.068 | 0.255 | <0.001 | 1.00 | ||
| z-cSBP | Constant | 0.001 | 0.054 | 0.985 | 0.500 | ||
| z-pSBP | 0.643 | 0.048 | 0.707 | <0.001 | 1.00 | ||
| z-cDBP | Constant | −0.033 | 0.068 | 0.625 | 0.223 | ||
| z-pSBP | 0.438 | 0.060 | 0.477 | <0.001 | 1.00 | ||
| z-cPP | Constant | 0.045 | 0.071 | 0.527 | 0.104 | ||
| z-pSBP | 0.296 | 0.063 | 0.330 | <0.001 | 1.00 | ||
| z-AIx | Constant | −0.059 | 0.072 | 0.414 | 0.099 | ||
| z-pSBP | −0.293 | 0.064 | −0.323 | <0.001 | 1.00 | ||
| z-AIx@75 | Constant | −0.036 | 0.073 | 0.627 | 0.082 | ||
| z-pSBP | −0.270 | 0.066 | −0.295 | <0.001 | 1.00 | ||
| z-AP | Constant | −0.07 | 0.07 | 0.336 | 0.082 | ||
| z-pSBP | −0.23 | 0.06 | −0.25 | <0.001 | 1.00 | ||
| z-BWH at birth | −0.17 | 0.07 | −0.17 | 0.018 | 1.00 | ||
| z-Pf | Constant | 0.069 | 0.073 | 0.343 | 0.149 | ||
| z-pSBP | 0.361 | 0.065 | 0.386 | <0.001 | 1.00 | ||
| z-Pb | Constant | −0.028 | 0.077 | 0.720 | 0.035 | ||
| z-pSBP | 0.189 | 0.069 | 0.201 | 0.007 | 1.00 | ||
| Structural arterial parameters, local and regional arterial stiffness | |||||||
| z-R-CCA SD | Constant | −0.222 | 0.127 | 0.084 | 0.173 | ||
| Current z-BMI | 0.335 | 0.089 | 0.399 | <0.001 | |||
| z-pSBP | −0.205 | 0.091 | −0.238 | 0.027 | |||
| z-R-CCA DD | Constant | −0.209 | 0.128 | 0.107 | 0.141 | ||
| Current z-BMI | 0.325 | 0.090 | 0.385 | 0.001 | 1.05 | ||
| z-pSBP | −0.200 | 0.092 | −0.231 | 0.033 | 1.05 | ||
| z-R-CCA IMT | Constant | −0.147 | 0.146 | 0.317 | 0.117 | ||
| ΔBWH z-score (0–2y) | 0.404 | 0.115 | 0.513 | 0.001 | 1.93 | ||
| z-BWH at birth | 0.334 | 0.159 | 0.306 | 0.039 | 1.93 | ||
| z-L-CCA SD | Constant | −0.121 | 0.096 | 0.207 | 0.100 | ||
| Current z-BMI | 0.249 | 0.061 | 0.326 | <0.001 | 1.00 | ||
| z-L-CCA DD | Constant | −0.071 | 0.086 | 0.414 | 0.099 | ||
| z-BMI | 0.339 | 0.080 | 0.467 | <0.001 | 1.22 | ||
| Δz-BMI (0–6y) * current z-BMI | −0.050 | 0.023 | −0.239 | 0.032 | 1.22 | ||
| z-L-CCA IMT | Constant | −0.118 | 0.123 | 0.340 | 0.029 | ||
| z-BMI | 0.180 | 0.078 | 0.190 | 0.024 | 1.00 | ||
| z-R-CFA SD | Constant | −0.077 | 0.127 | 0.545 | 0.169 | ||
| Δz-BMI (0–6y) | 0.347 | 0.090 | 0.411 | <0.001 | 1.00 | ||
| z-R-CFA DD | Constant | −0.086 | 0.127 | 0.498 | 0.157 | ||
| Δz-BMI (0–6y) | 0.347 | 0.090 | 0.410 | <0.001 | 1.00 | ||
| z-R-CFA IMT | Constant | 0.378 | 0.242 | 0.144 | 0.259 | ||
| Δz-BMI (0–6y) | −0.751 | 0.319 | −0.562 | 0.036 | 1.00 | ||
| z-L-CFA SD | Constant | −0.161 | 0.113 | 0.157 | 0.034 | ||
| Current z-BMI | 0.176 | 0.073 | 0.202 | 0.018 | 1.00 | ||
| z-L-CFA DD | Constant | −0.138 | 0.112 | 0.219 | 0.027 | ||
| Current z-BMI | 0.159 | 0.073 | 0.185 | 0.030 | 1.00 | ||
| z-L-CFA IMT | Constant | −0.046 | 0.175 | 0.796 | 0.222 | ||
| z-pSBP | −0.448 | 0.147 | −0.499 | 0.005 | 1.00 | ||
| z-R-CCA EM | Constant | 0.028 | 0.108 | 0.794 | 0.07 | ||
| z-pSBP | 0.264 | 0.100 | 0.29 | 0.010 | 1.00 | ||
| z-L-CCA EM | Constant | 0.068 | 0.085 | 0.429 | 0.03 | ||
| z-pSBP | 0.160 | 0.075 | 0.18 | 0.034 | 1.00 | ||
| z-R-CFA EM | - | - | - | - | - | - | - |
| z-L-CFA EM | - | - | - | - | - | - | - |
| z-cfPWV | - | - | - | - | - | - | - |
| Dependent Variable | Independent Variables | βu | SE | βs | p | VIF | Adj R2 |
|---|---|---|---|---|---|---|---|
| Aortic and peripheral blood pressure, hemodynamic and wave reflection parameters | |||||||
| z-pSBP | Constant | 0.259 | 0.08 | 0.001 | 0.049 | ||
| z-BMI | 0.210 | 0.07 | 0.209 | 0.002 | 1.00 | ||
| z-pDBP | - | - | - | - | - | - | - |
| z-pPP | Constant | 0.203 | 0.08 | 0.011 | 0.025 | ||
| z-BMI | 0.164 | 0.07 | 0.160 | 0.017 | 1.00 | ||
| z-pMBP | Constant | 0.201 | 0.08 | 0.010 | 0.027 | ||
| z-BMI | 0.164 | 0.07 | 0.165 | 0.014 | 1.00 | ||
| z-cSBP | Constant | 0.024 | 0.05 | 0.663 | 0.424 | ||
| z-BMI | 0.587 | 0.05 | 0.653 | <0.001 | 1.00 | ||
| z-cDBP | Constant | 0.039 | 0.07 | 0.591 | 0.178 | ||
| z-pSBP | 0.422 | 0.06 | 0.426 | <0.001 | 1.00 | ||
| z-cPP | Constant | −0.036 | 0.06 | 0.136 | |||
| z-pSBP | 0.259 | 0.05 | 0.313 | <0.001 | 1.04 | ||
| z-BMI | 0.120 | 0.05 | 0.141 | 0.030 | 1.04 | ||
| z-Aix | Constant | 0.077 | 0.07 | 0.297 | 0.019 | ||
| z-pSBP | −0.126 | 0.06 | −0.138 | 0.043 | 1.00 | ||
| z-Aix@75 | - | - | - | - | - | - | - |
| z-AP | Constant | 0.071 | 0.07 | 0.324 | 0.019 | ||
| z-pSBP | −0.139 | 0.06 | −0.154 | 0.024 | 1.00 | ||
| z-Pf | Constant | 0.015 | 0.07 | 0.829 | 0.098 | ||
| z-pSBP | 0.270 | 0.06 | 0.313 | <0.001 | 1.00 | ||
| z-Pb | Constant | 0.070 | 0.07 | 0.334 | 0.060 | ||
| z-pSBP | 0.219 | 0.06 | 0.245 | <0.001 | 1.00 | ||
| Structural arterial parameters, local and regional arterial stiffness | |||||||
| z-R-CCA SD | Constant | 0.080 | 0.08 | 0.309 | 0.097 | ||
| z-BMI | 0.327 | 0.07 | 0.311 | <0.001 | 1.00 | ||
| z-R-CCA DD | Constant | −0.111 | 0.11 | 0.313 | 0.118 | ||
| z-BMI | 0.325 | 0.07 | 0.308 | <0.001 | 1.02 | ||
| Sex | 0.335 | 0.15 | 0.143 | 0.029 | 1.02 | ||
| z-R-CCA IMT | Constant | 0.086 | 0.084 | 0.308 | 1.00 | 0.035 | |
| Δz-BMI 0–6y * current z-BMI | 0.134 | 0.045 | 0.200 | 0.003 | |||
| z-L-CCA SD | Constant | 0.052 | 0.08 | 0.493 | 1.02 | 0.069 | |
| z-BMI | 0.255 | 0.06 | 0.263 | <0.001 | 1.02 | ||
| z-L-CCA DD | Constant | −0.113 | 0.10 | 0.267 | 0.101 | ||
| z-BMI | 0.252 | 0.06 | 0.267 | <0.001 | |||
| Sex | 0.298 | 0.14 | 0.139 | 0.036 | 1.00 | ||
| z-L-CCA IMT | Constant | 0.129 | 0.09 | 0.131 | 0.033 | ||
| z-BMI | 0.196 | 0.07 | 0.182 | 0.008 | 1.00 | ||
| z-R-CFA SD | Constant | 0.286 | 0.11 | 0.013 | 0.239 | ||
| z-BMI | 0.343 | 0.10 | 0.331 | 0.001 | 1.03 | ||
| Smoking | −0.609 | 0.22 | −0.275 | 0.006 | 1.02 | ||
| z-pSBP | −0.222 | 0.10 | −0.223 | 0.025 | 1.01 | ||
| z-R-CFA DD | Constant | 0.249 | 0.12 | 0.035 | 0.184 | ||
| z-BMI | 0.294 | 0.10 | 0.281 | 0.006 | 1.03 | ||
| Smoking | −0.669 | 0.22 | −0.299 | 0.004 | 1.02 | ||
| z-pSBP | −0.201 | 0.10 | −0.200 | 0.047 | 1.01 | ||
| z-R-CFA IMT | Constant | 0.643 | 0.23 | 0.011 | 0.444 | ||
| z-BMI | 0.594 | 0.18 | 0.559 | 0.004 | 1.02 | ||
| Sex | –1.067 | 0.39 | −0.453 | 0.014 | 1.02 | ||
| z-L-CFA SD | Constant | 0.140 | 0.12 | 0.229 | 0.066 | ||
| z-BMI | 0.303 | 0.12 | 0.278 | 0.010 | 1.00 | ||
| z-L-CFA DD | Constant | 0.077 | 0.12 | 0.513 | 0.065 | ||
| z-BMI | 0.304 | 0.12 | 0.275 | 0.011 | 1.00 | ||
| z-L-CFA IMT | Constant | 0.175 | 0.231 | 0.456 | |||
| Hypertension | 5.293 | 1.083 | 0.694 | 0.000 | 1.002 | 0.557 | |
| Dyslipemia | 2.836 | 1.083 | 0.372 | 0.016 | 1.002 | ||
| z-R-CCA EM | Constant | −0.061 | 0.07 | 0.377 | 0.099 | ||
| z-BMI | 0.213 | 0.06 | 0.233 | 0.001 | |||
| z-pSBP | 0.149 | 0.06 | 0.168 | 0.012 | |||
| z-L-CCA EM | Constant | −0.267 | 0.12 | 0.030 | 0.147 | ||
| z-pSBP | 0.356 | 0.11 | 0.334 | 0.002 | 1.00 | ||
| z-R-CFA EM | Constant | −0.267 | 0.12 | 0.030 | 0.111 | ||
| z-pSBP | 0.356 | 0.11 | 0.334 | 0.002 | 1.00 | ||
| z-L-CFA EM | Constant | −0.403 | 0.11 | 0.001 | 0.060 | ||
| z-pSBP | 0.251 | 0.10 | 0.267 | 0.015 | 1.00 | ||
| z-cfPWV | Constant | −0.055 | 0.07 | 0.401 | 0.069 | ||
| z-pSBP | 0.224 | 0.06 | 0.263 | <0.001 | 1.00 | ||
© 2019 by the authors. Licensee MDPI, Basel, Switzerland. This article is an open access article distributed under the terms and conditions of the Creative Commons Attribution (CC BY) license (http://creativecommons.org/licenses/by/4.0/).
Share and Cite
Castro, J.M.; García-Espinosa, V.; Zinoveev, A.; Marin, M.; Severi, C.; Chiesa, P.; Bia, D.; Zócalo, Y. Arterial Structural and Functional Characteristics at End of Early Childhood and Beginning of Adulthood: Impact of Body Size Gain during Early, Intermediate, Late and Global Growth. J. Cardiovasc. Dev. Dis. 2019, 6, 33. https://doi.org/10.3390/jcdd6030033
Castro JM, García-Espinosa V, Zinoveev A, Marin M, Severi C, Chiesa P, Bia D, Zócalo Y. Arterial Structural and Functional Characteristics at End of Early Childhood and Beginning of Adulthood: Impact of Body Size Gain during Early, Intermediate, Late and Global Growth. Journal of Cardiovascular Development and Disease. 2019; 6(3):33. https://doi.org/10.3390/jcdd6030033
Chicago/Turabian StyleCastro, Juan M., Victoria García-Espinosa, Agustina Zinoveev, Mariana Marin, Cecilia Severi, Pedro Chiesa, Daniel Bia, and Yanina Zócalo. 2019. "Arterial Structural and Functional Characteristics at End of Early Childhood and Beginning of Adulthood: Impact of Body Size Gain during Early, Intermediate, Late and Global Growth" Journal of Cardiovascular Development and Disease 6, no. 3: 33. https://doi.org/10.3390/jcdd6030033